Cambridge IGCSE Biology (9-1) 0970 — 2023 May/June Paper 5 · Variant 1
0970/51/M/J/23 · 2 questions · 40 marks · ≈45 min
The question paper and its mark scheme, free to read here and free to download. This is Cambridge’s own paper, exactly as it was sat.
Question paper12 pages

Mark scheme7 pages
Answers below. Sit the paper first if you are practising.
Questions as text
Q1 · You are going to investigate the effect of temperature on the rate of respiration in…
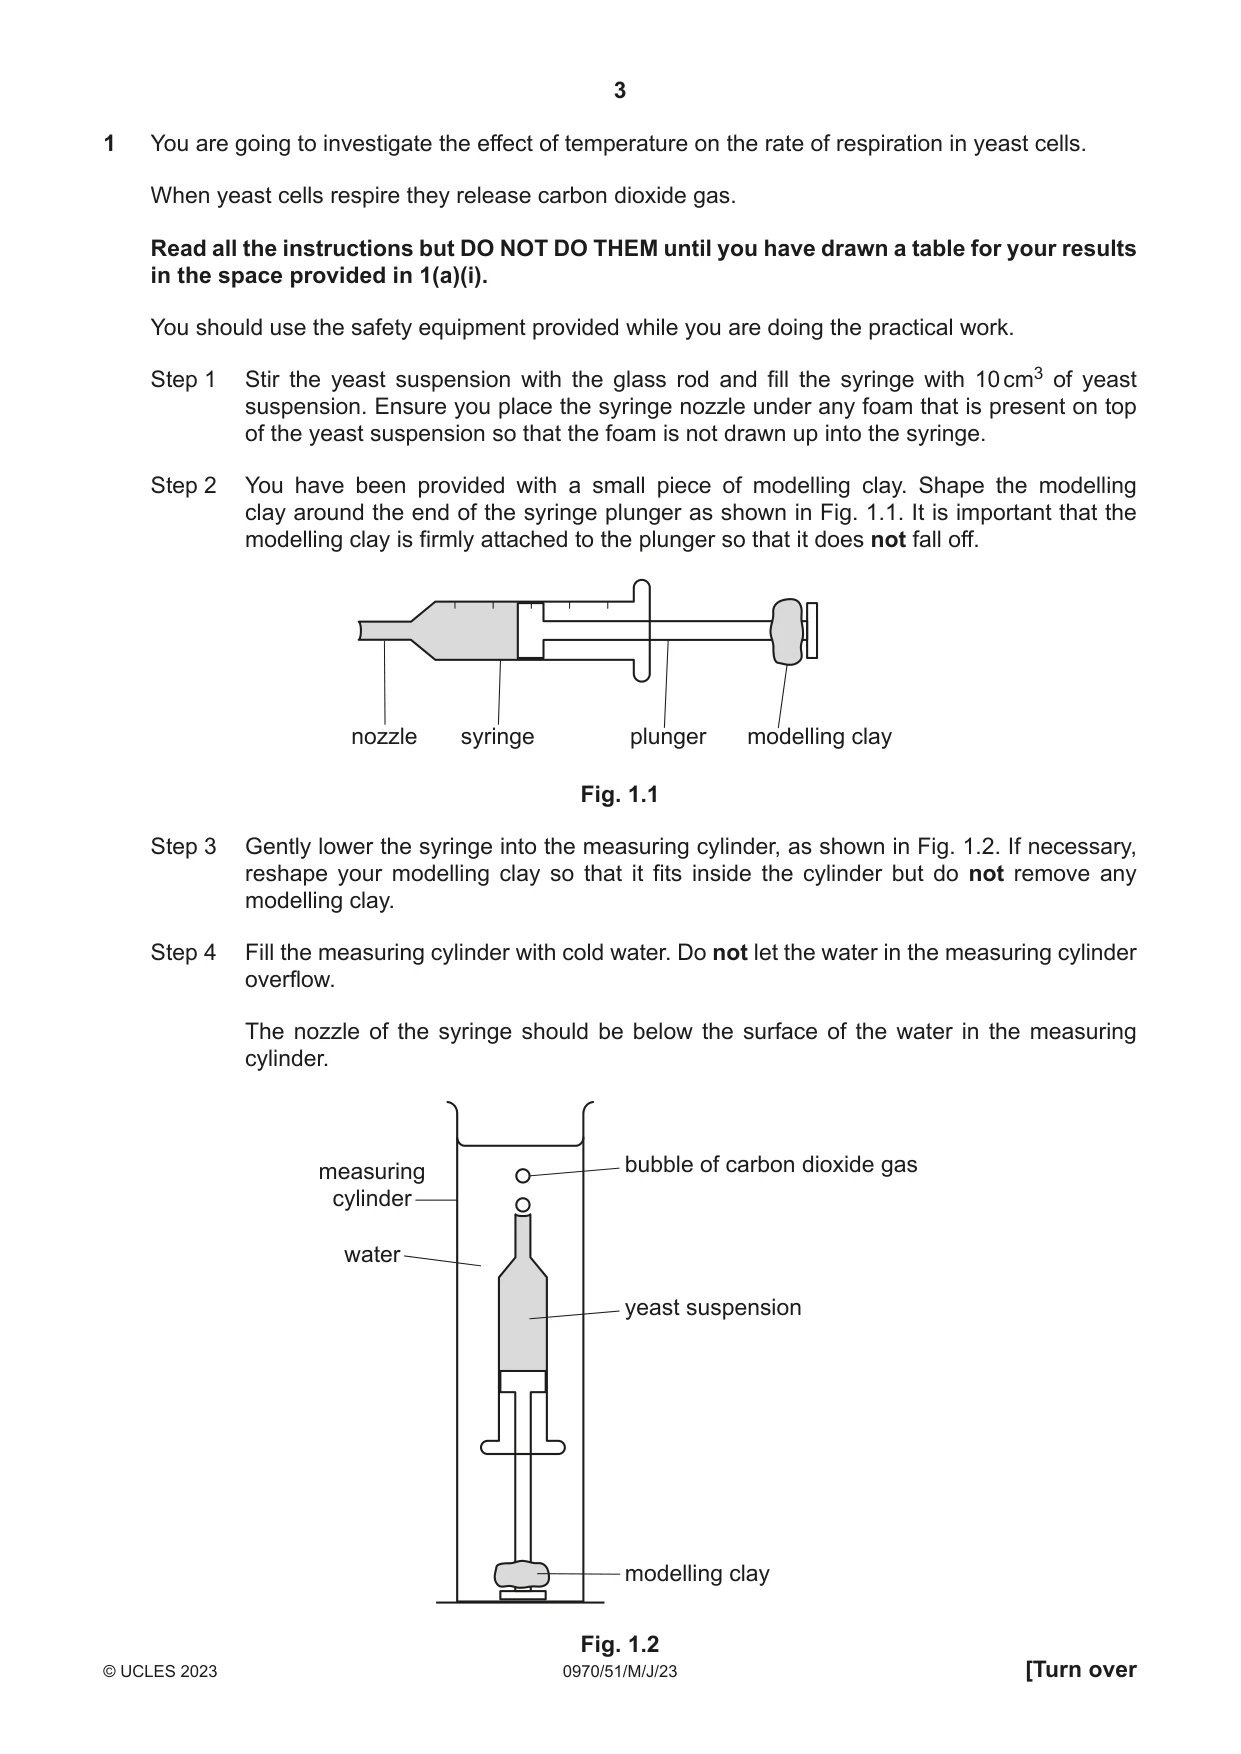
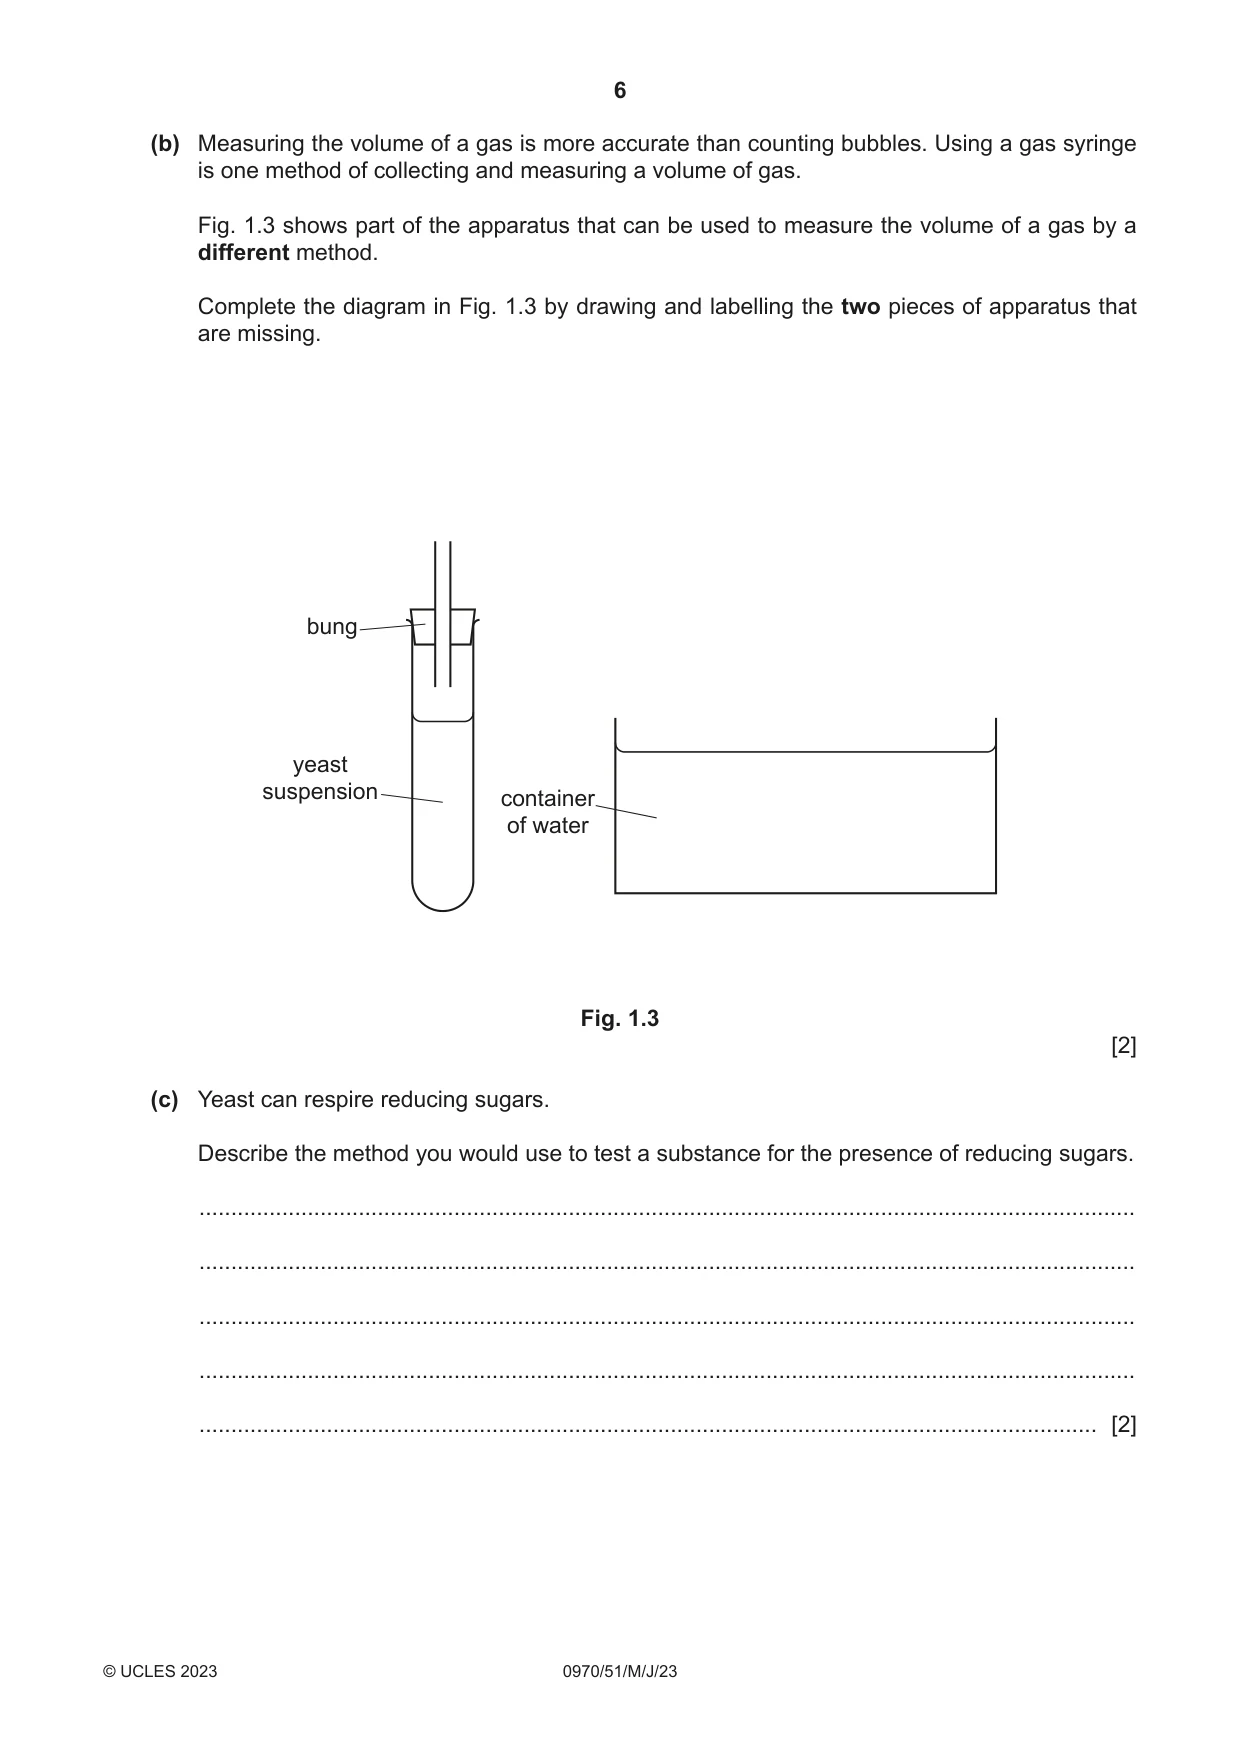
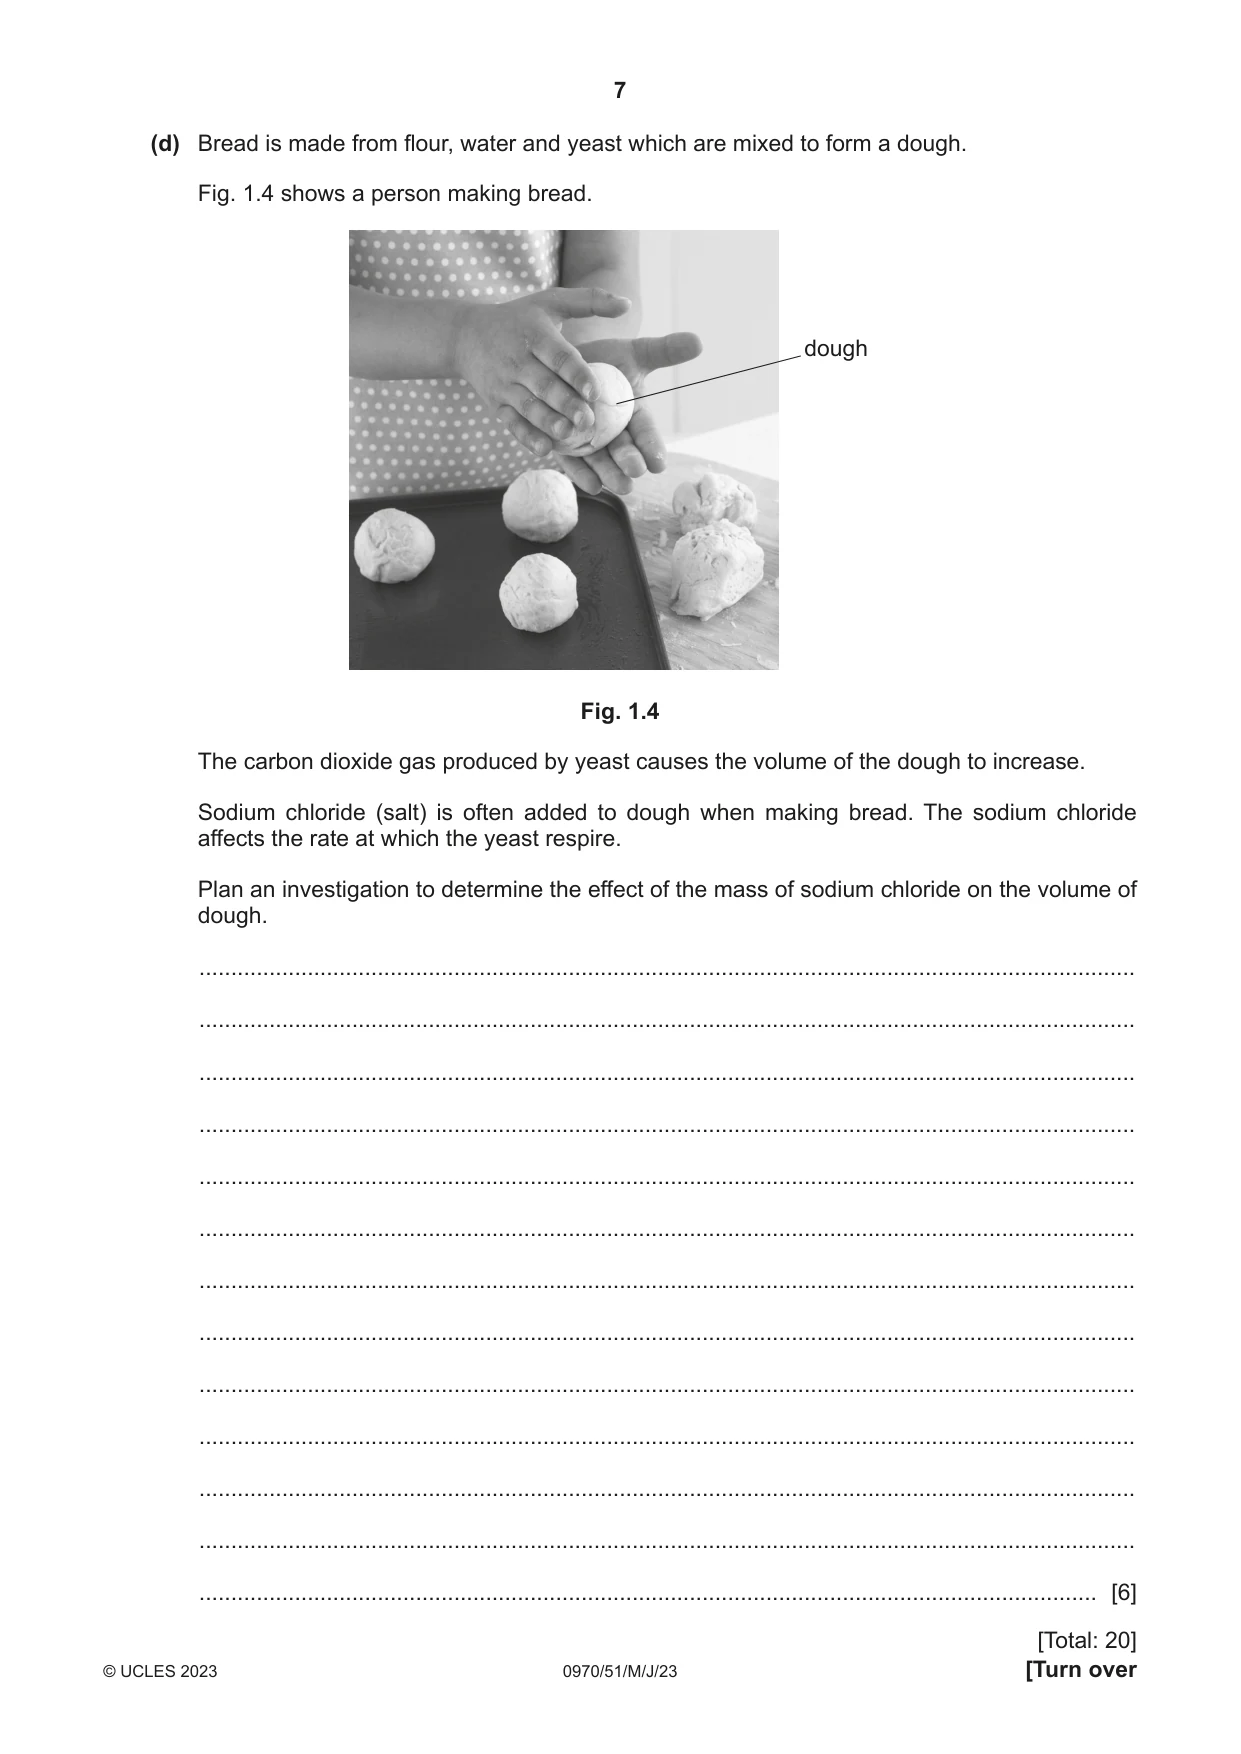
1 You are going to investigate the effect of temperature on the rate of respiration in yeast cells. When yeast cells respire they release carbon dioxide gas. Read all the instructions but DO NOT DO THEM until you have drawn a table for your results in the space provided in 1(a)(i). You should use the safety equipment provided while you are doing the practical work. Step 1 Stir the yeast suspension with the glass rod and fill the syringe with 10 cm3 of yeast suspension. Ensure you place the syringe nozzle under any foam that is present on top of the yeast suspension so that the foam is not drawn up into the syringe. Step 2 You have been provided with a small piece of modelling clay. Shape the modelling clay around the end of the syringe plunger as shown in Fig. 1.1. It is important that the modelling clay is firmly attached to the plunger so that it does not fall off. nozzle syringe plunger modelling clay Fig. 1.1 Step 3 Gently lower the syringe into the measuring cylinder, as shown in Fig. 1.2. If necessary, reshape your modelling clay so that it fits inside the cylinder but do not remove any modelling clay. Step 4 Fill the measuring cylinder with cold water. Do not let the water in the measuring cylinder overflow. The nozzle of the syringe should be below the surface of the water in the measuring cylinder. bubble of carbon dioxide gas measuring cylinder water yeast suspension modelling clay Step 5 Measure the temperature of the water in the measuring cylinder. Record this measurement in your table in 1(a)(i). Step 6 Start the stop-clock and wait for two minutes. Step 7 Reset the stop-clock to zero. Step 8 Start the stop-clock again and count the number of bubbles produced by the yeast in three minutes. Record this number in your table in 1(a)(i). Step 9 Carefully pour the cold water in the measuring cylinder into the waste container. The syringe containing the yeast suspension should remain in the measuring cylinder. Step 10 Raise your hand when you are ready for hot water to be poured into your measuring cylinder. Ensure that the water level is above the nozzle of the syringe but not overflowing. Step 11 Repeat steps 5 to 8. (a) (i) Prepare a table to record your results in the space provided. [4] (ii) State a conclusion for your results. ........................................................................................................................................... ........................................................................................................................................... ..................................................................................................................................... [1] (iii) Using your results, calculate the rate of bubble production for the yeast suspension in cold water and in hot water. rate of bubble production in cold water .............................................. bubbles per minute rate of bubble production in hot water ................................................ bubbles per minute [1] (iv) State the independent variable in this investigation. ........................................................................................................................................... ..................................................................................................................................... [1] (v) State one variable that was kept constant in this investigation. ........................................................................................................................................... ..................................................................................................................................... [1] (vi) Suggest why you were instructed to wait for two minutes in step 6 before starting to count the number of bubbles. ........................................................................................................................................... ........................................................................................................................................... ..................................................................................................................................... [1] (vii) Suggest why counting bubbles is not an accurate method of determining the rate of respiration in yeast. ........................................................................................................................................... ........................................................................................................................................... ..................................................................................................................................... [1] (b) Measuring the volume of a gas is more accurate than counting bubbles. Using a gas syringe is one method of collecting and measuring a volume of gas. Fig. 1.3 shows part of the apparatus that can be used to measure the volume of a gas by a different method. Complete the diagram in Fig. 1.3 by drawing and labelling the two pieces of apparatus that are missing. bung yeast suspension container of water Fig. 1.3 [2] (c) Yeast can respire reducing sugars. Describe the method you would use to test a substance for the presence of reducing sugars. ................................................................................................................................................... ................................................................................................................................................... ................................................................................................................................................... ................................................................................................................................................... ............................................................................................................................................. [2] (d) Bread is made from flour, water and yeast which are mixed to form a dough. Fig. 1.4 shows a person making bread. dough Fig. 1.4 The carbon dioxide gas produced by yeast causes the volume of the dough to increase. Sodium chloride (salt) is often added to dough when making bread. The sodium chloride affects the rate at which the yeast respire. Plan an investigation to determine the effect of the mass of sodium chloride on the volume of dough. ................................................................................................................................................... ................................................................................................................................................... ................................................................................................................................................... ................................................................................................................................................... ................................................................................................................................................... ................................................................................................................................................... ................................................................................................................................................... ................................................................................................................................................... ................................................................................................................................................... ................................................................................................................................................... ................................................................................................................................................... ................................................................................................................................................... ............................................................................................................................................. [6] [Total: 20]
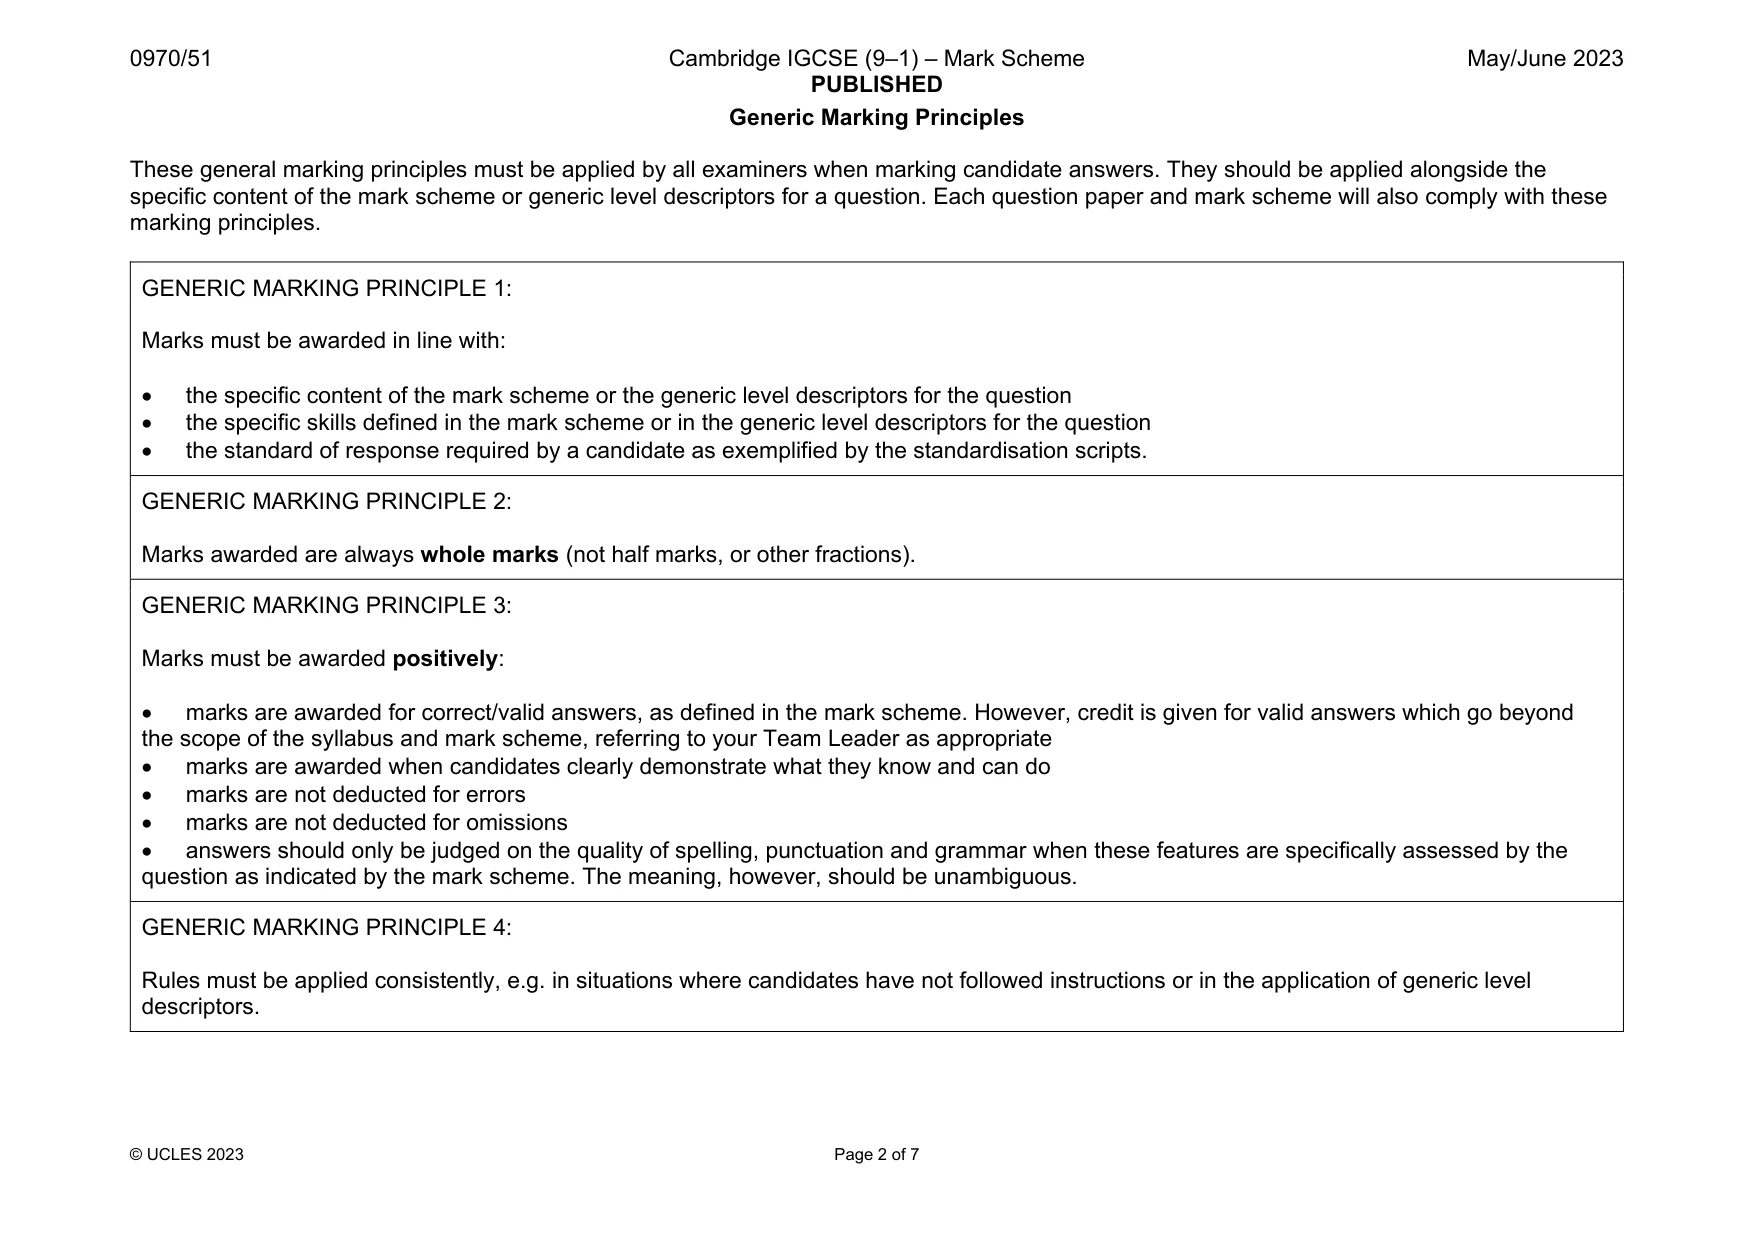
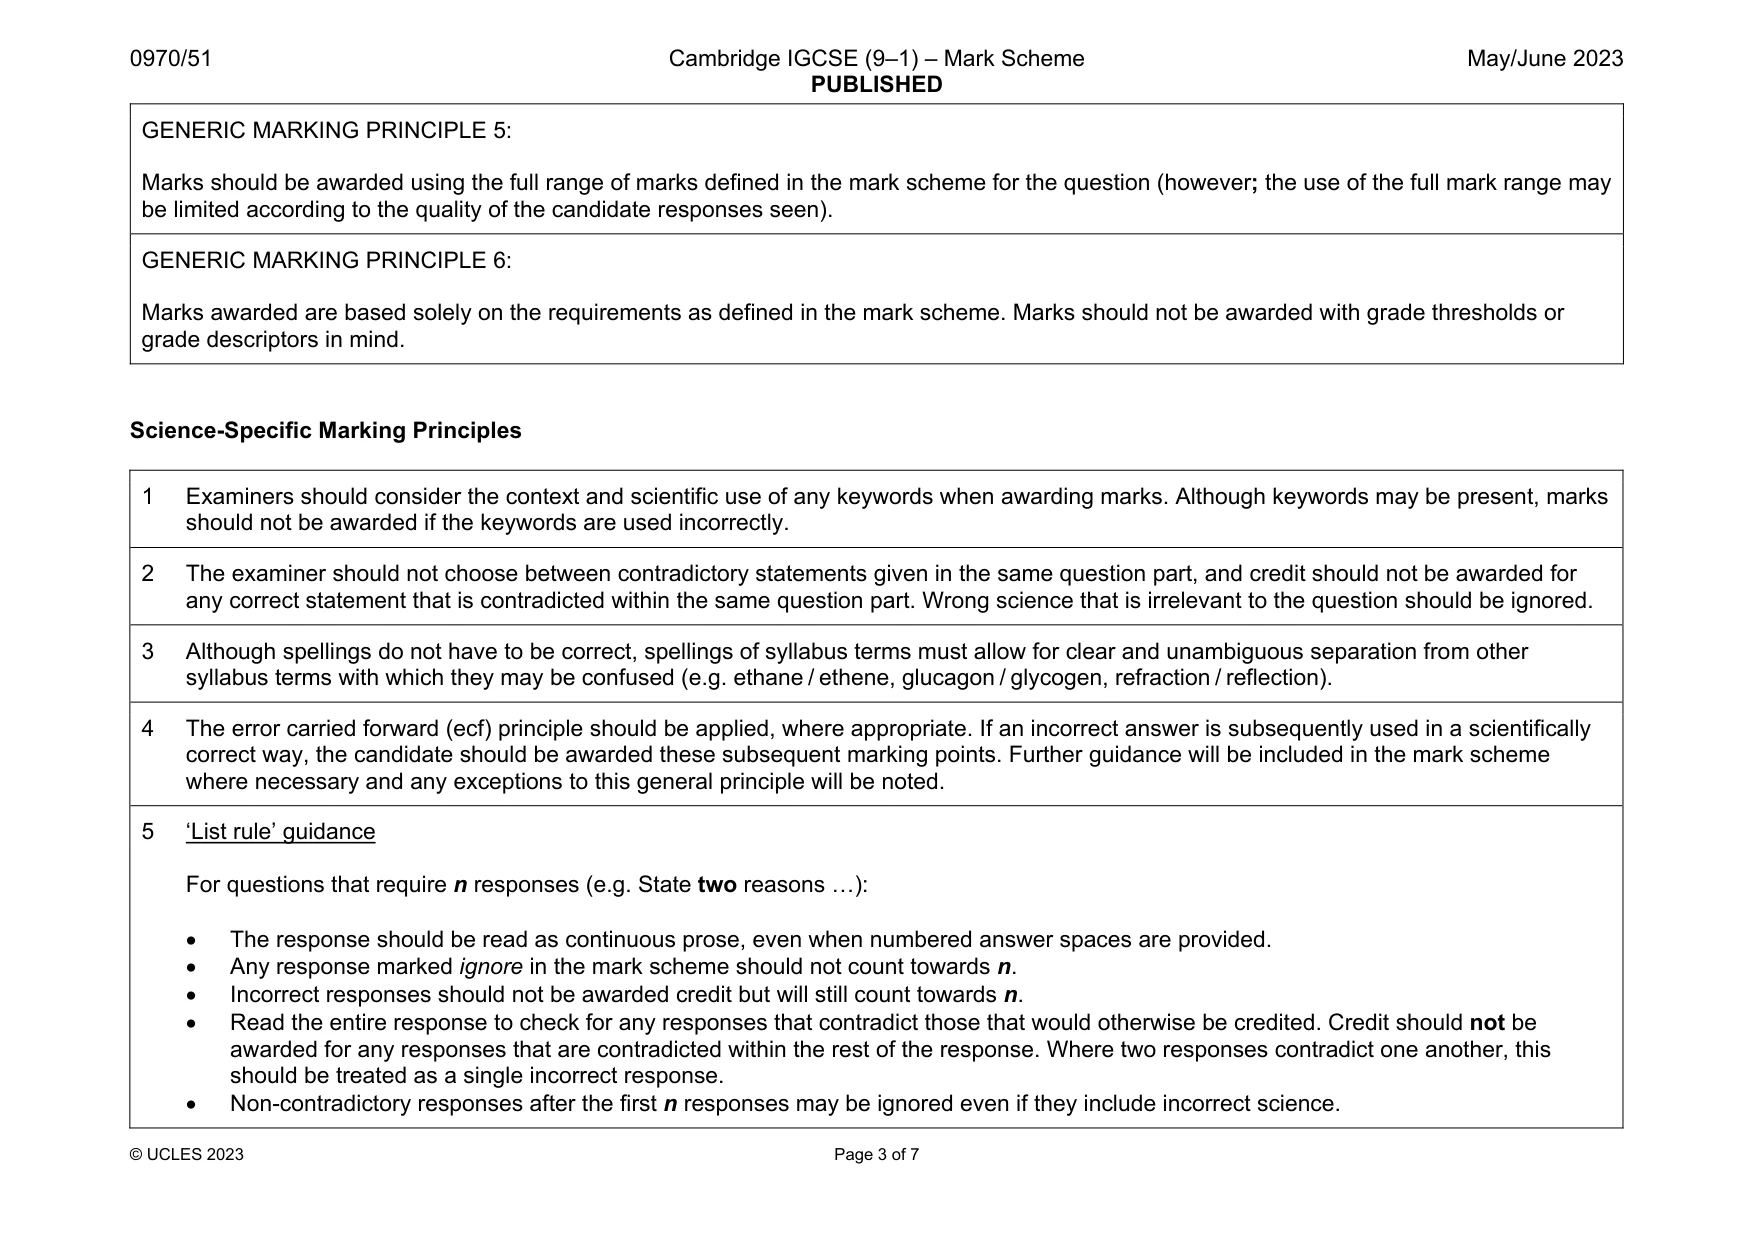
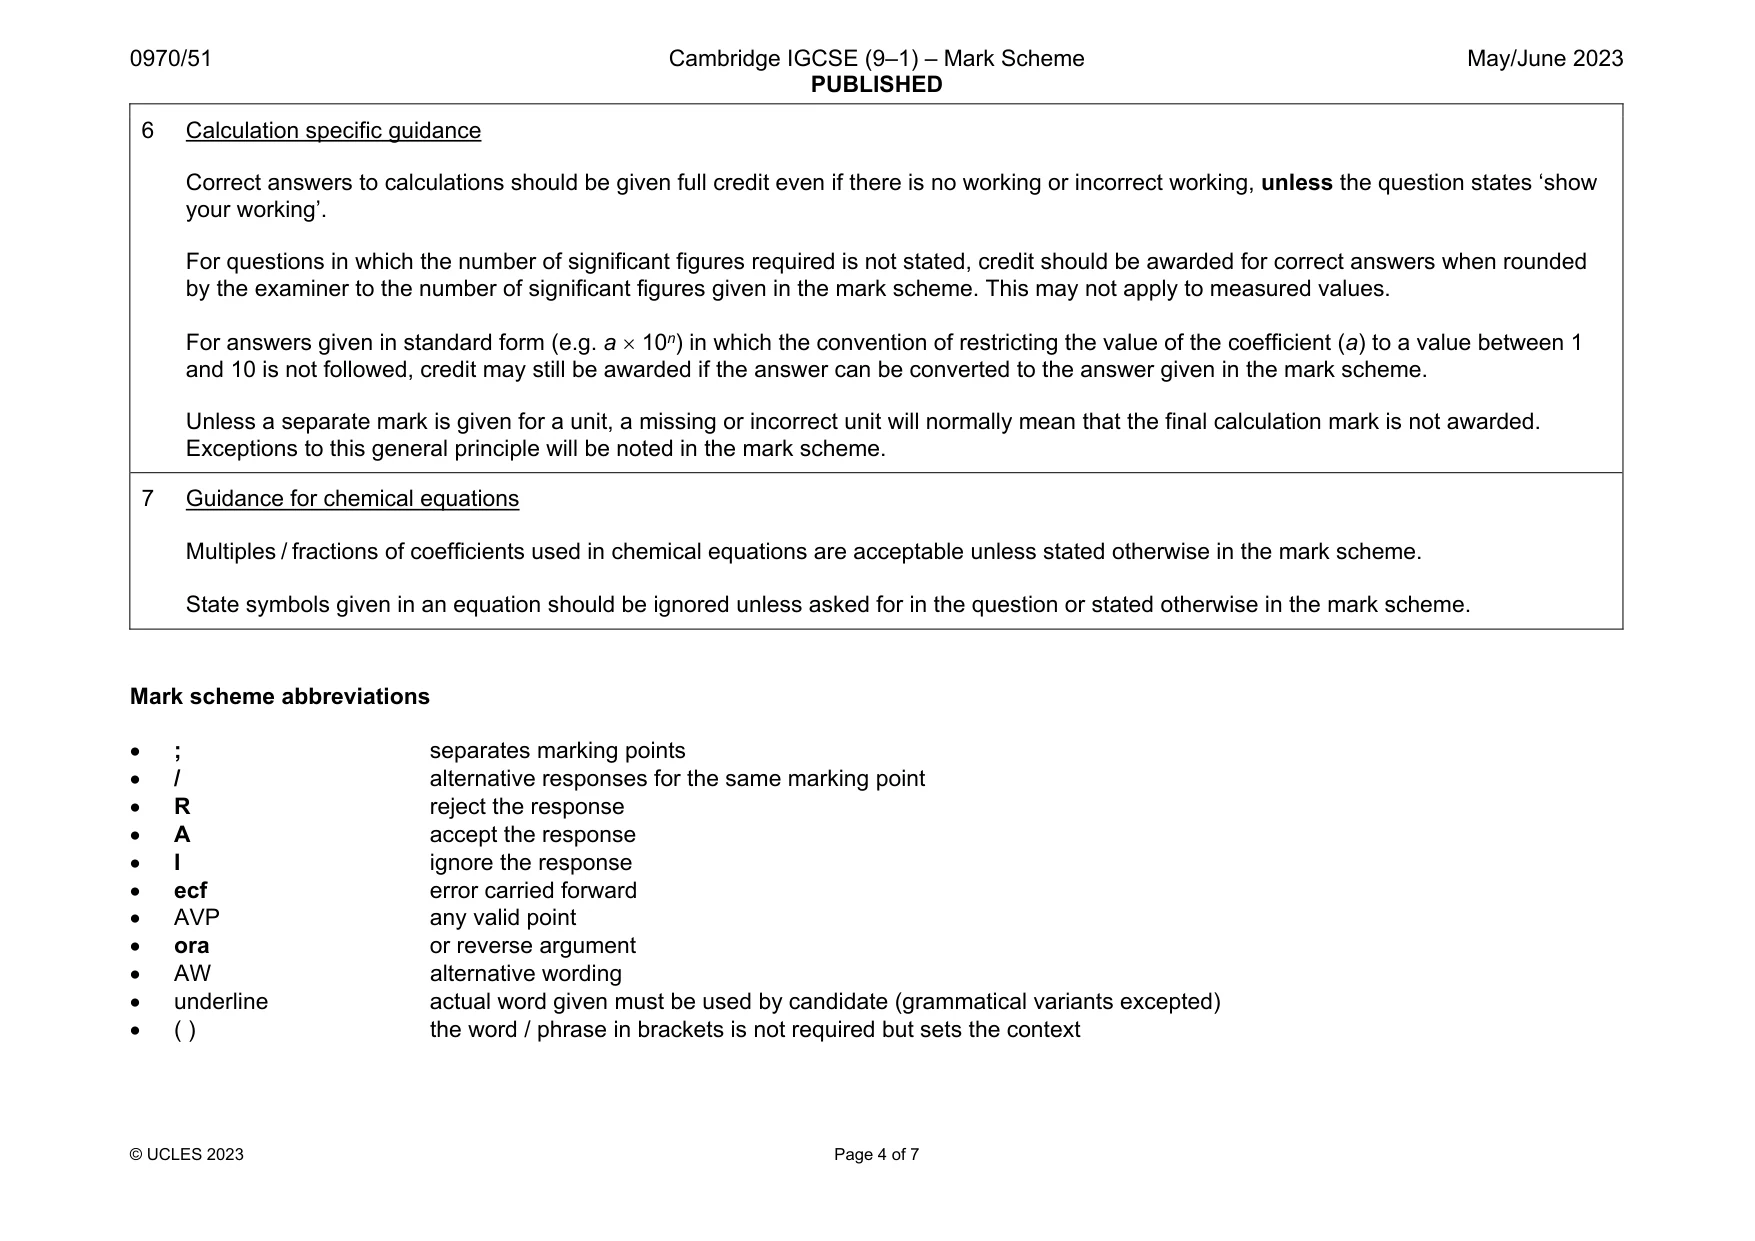
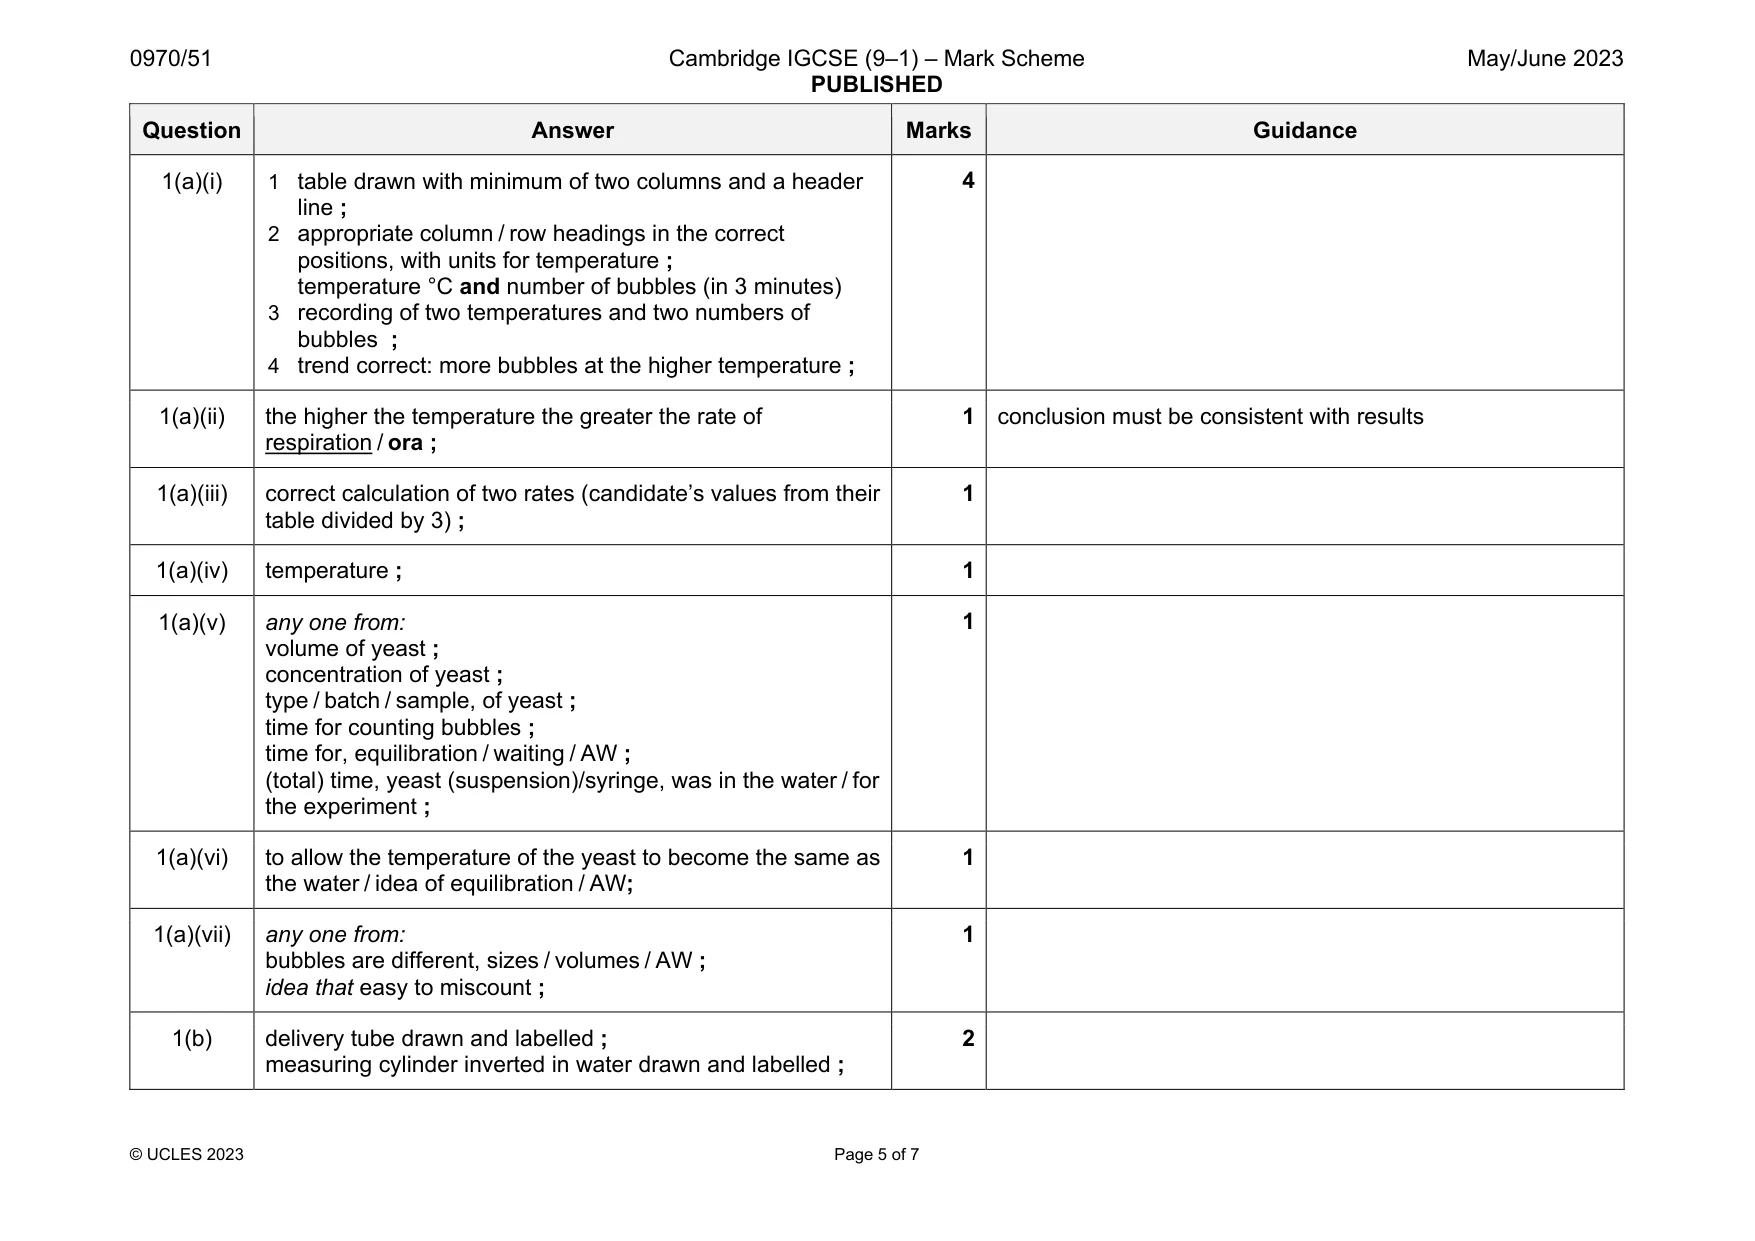
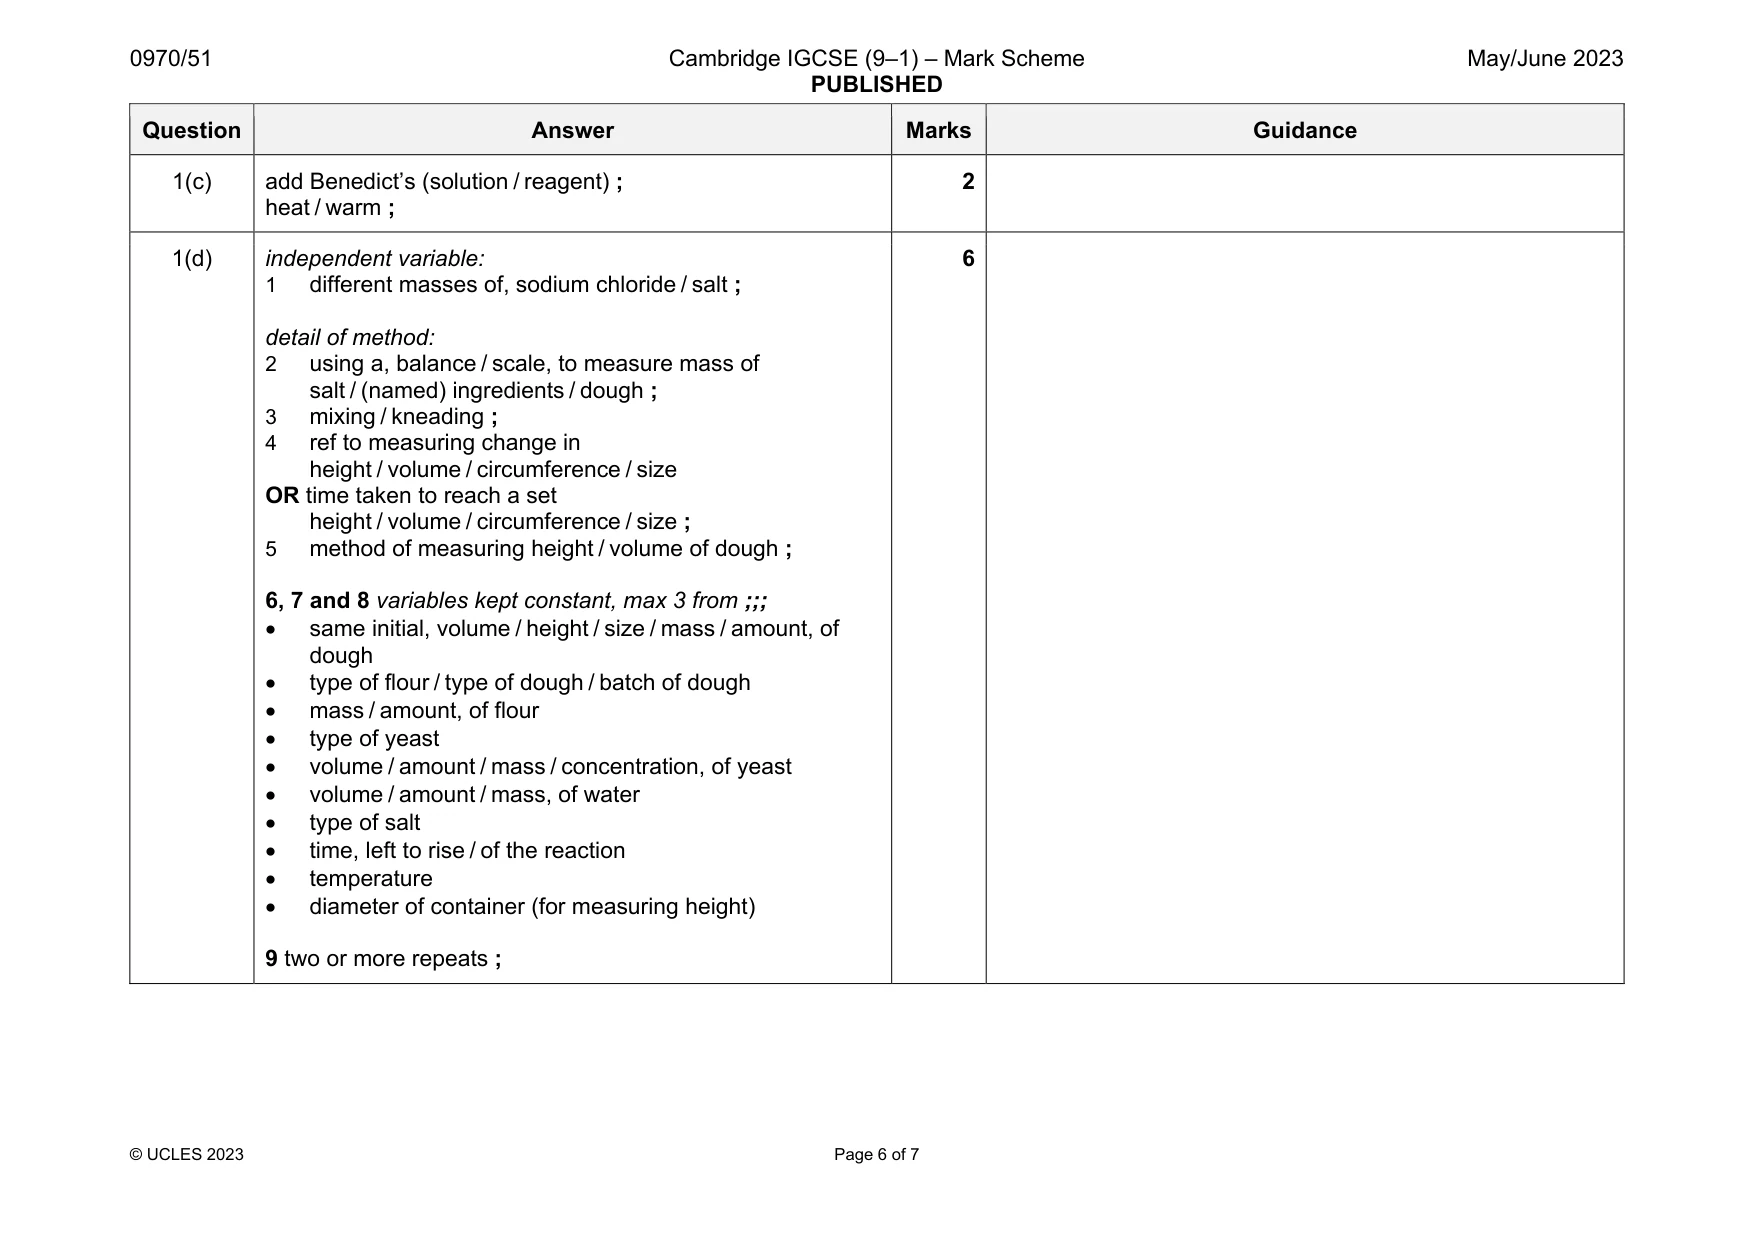
Mark scheme: 1(a)(i) 1 table drawn with minimum of two columns and a header line ; 2 appropriate column / row headings in the correct positions, with units for temperature ; temperature °C and number of bubbles (in 3 minutes) 3 recording of two temperatures and two numbers of bubbles ; 4 trend correct: more bubbles at the higher temperature ; 1(a)(ii) the higher the temperature the greater the rate of respiration / ora ; 1 conclusion must be consistent with results 1(a)(iii) correct calculation of two rates (candidate’s values from their table divided by 3) ; 1 1(a)(iv) temperature ; 1 1(a)(v) any one from: volume of yeast ; concentration of yeast ; type / batch / sample, of yeast ; time for counting bubbles ; time for, equilibration / waiting / AW ; (total) time, yeast (suspension)/syringe, was in the water / for the experiment ; 1 1(a)(vi) to allow the temperature of the yeast to become the same as the water / idea of equilibration / AW; 1 1(a)(vii) any one from: bubbles are different, sizes / volumes / AW ; idea that easy to miscount ; 1 1(b) delivery tube drawn and labelled ; measuring cylinder inverted in water drawn and labelled ; 2 Question Answer Marks Guidance 1(c) add Benedict’s (solution / reagent) ; heat / warm ; 2 1(d) independent variable: 1 different masses of, sodium chloride / salt ; detail of method: 2 using a, balance / scale, to measure mass of salt / (named) ingredients / dough ; 3 mixing / kneading ; 4 ref to measuring change in height / volume / circumference / size OR time taken to reach a set height / volume / circumference / size ; 5 method of measuring height / volume of dough ; 6, 7 and 8 variables kept constant, max 3 from ;;; same initial, volume / height / size / mass / amount, of dough type of flour / type of dough / batch of dough mass / amount, of flour type of yeast volume / amount / mass / concentration, of yeast volume / amount / mass, of water type of salt time, left to rise / of the reaction temperature diameter of container (for measuring height) 9 two or more repeats ; 6
Q2 · A photograph of a cross-section of a root from a carrot plant, Daucus carota
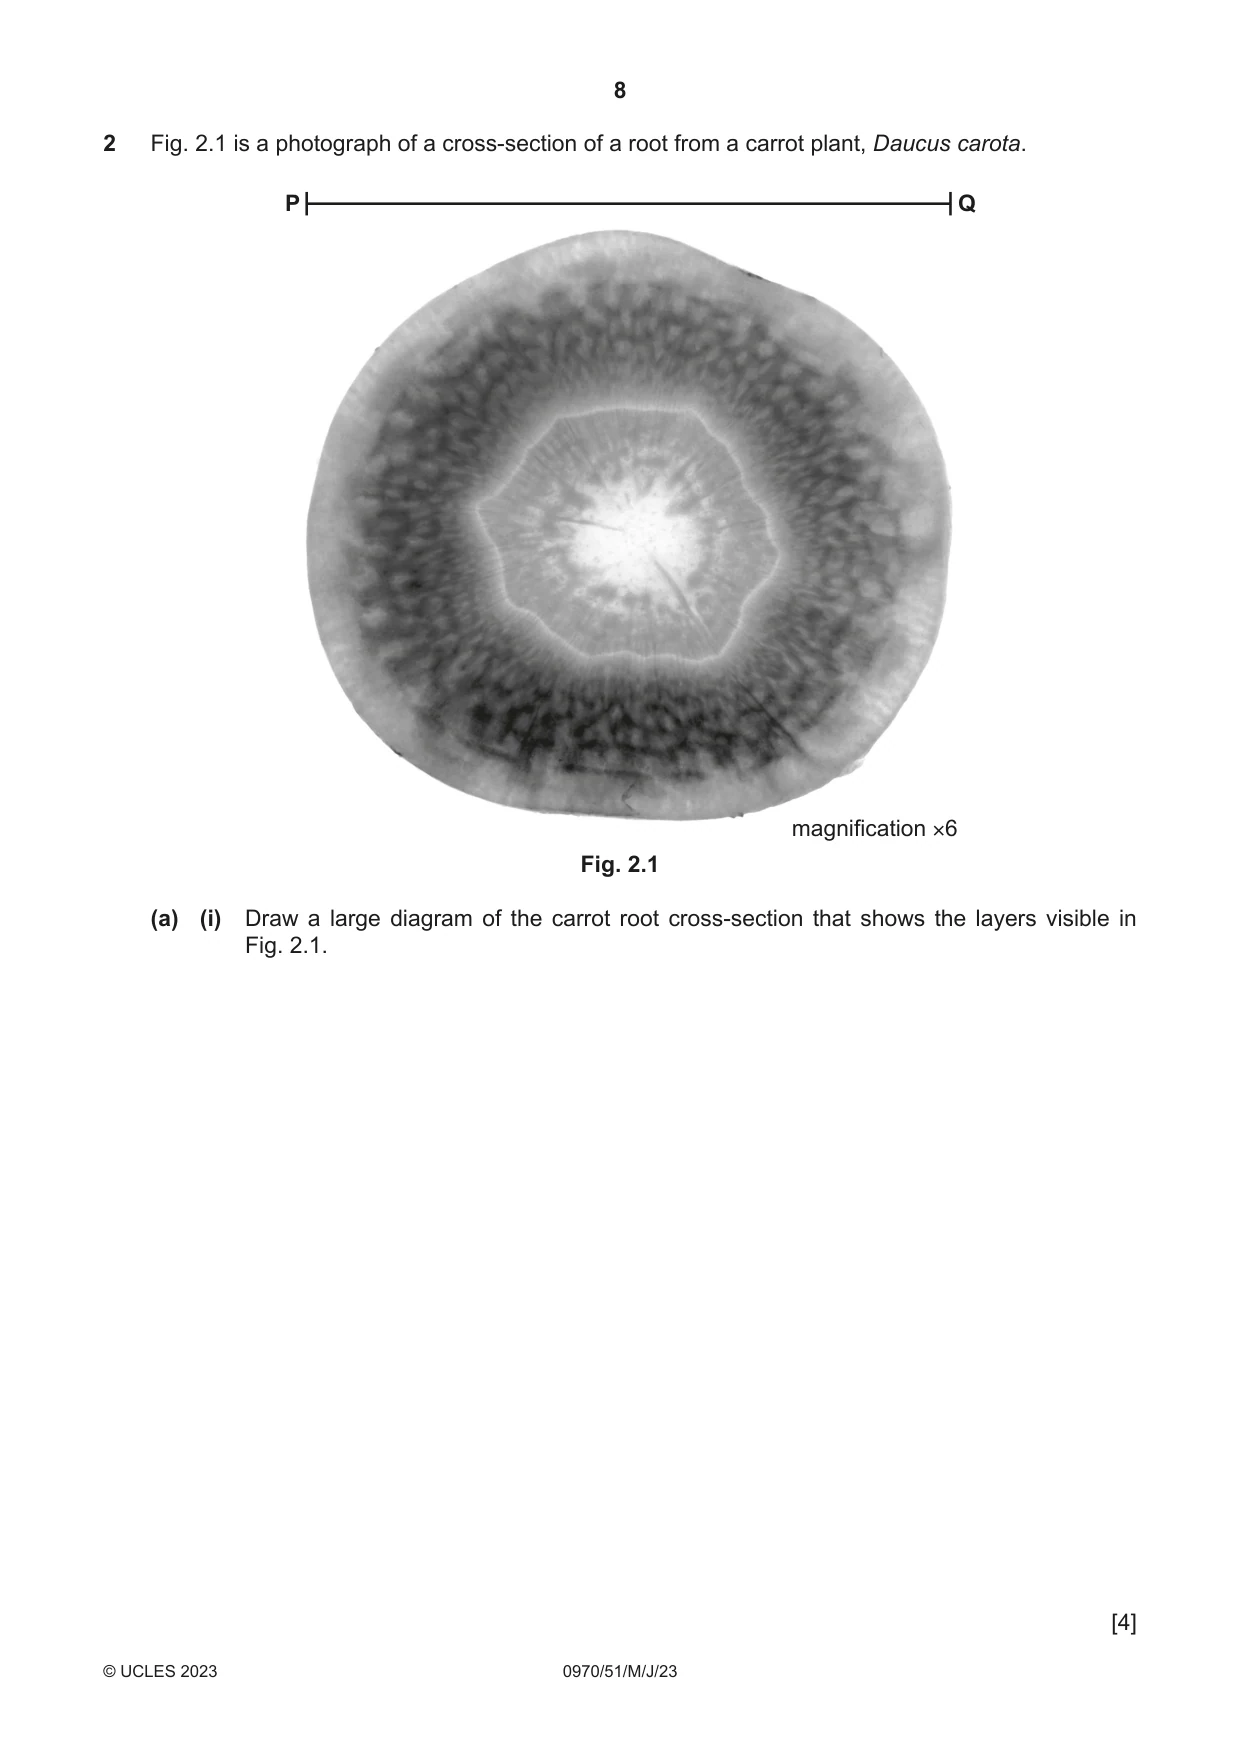
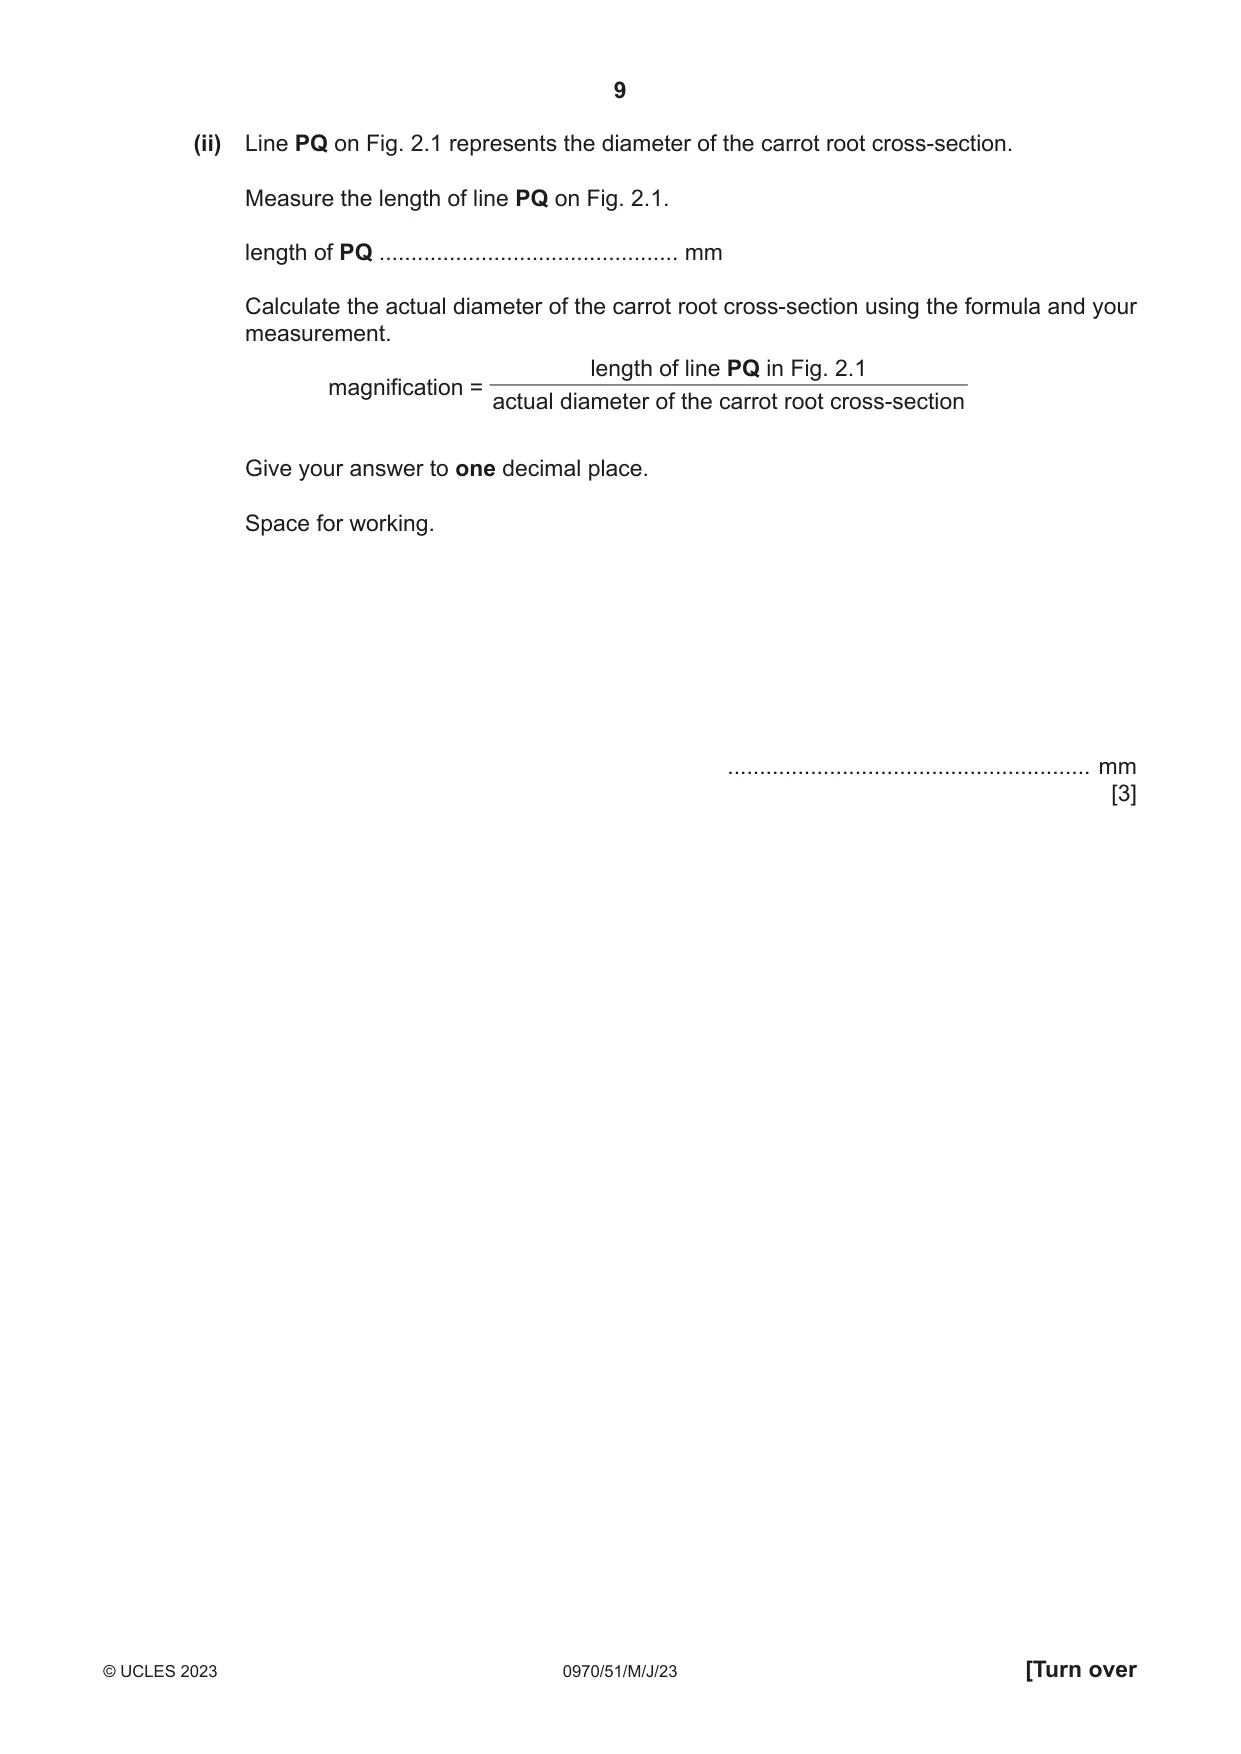
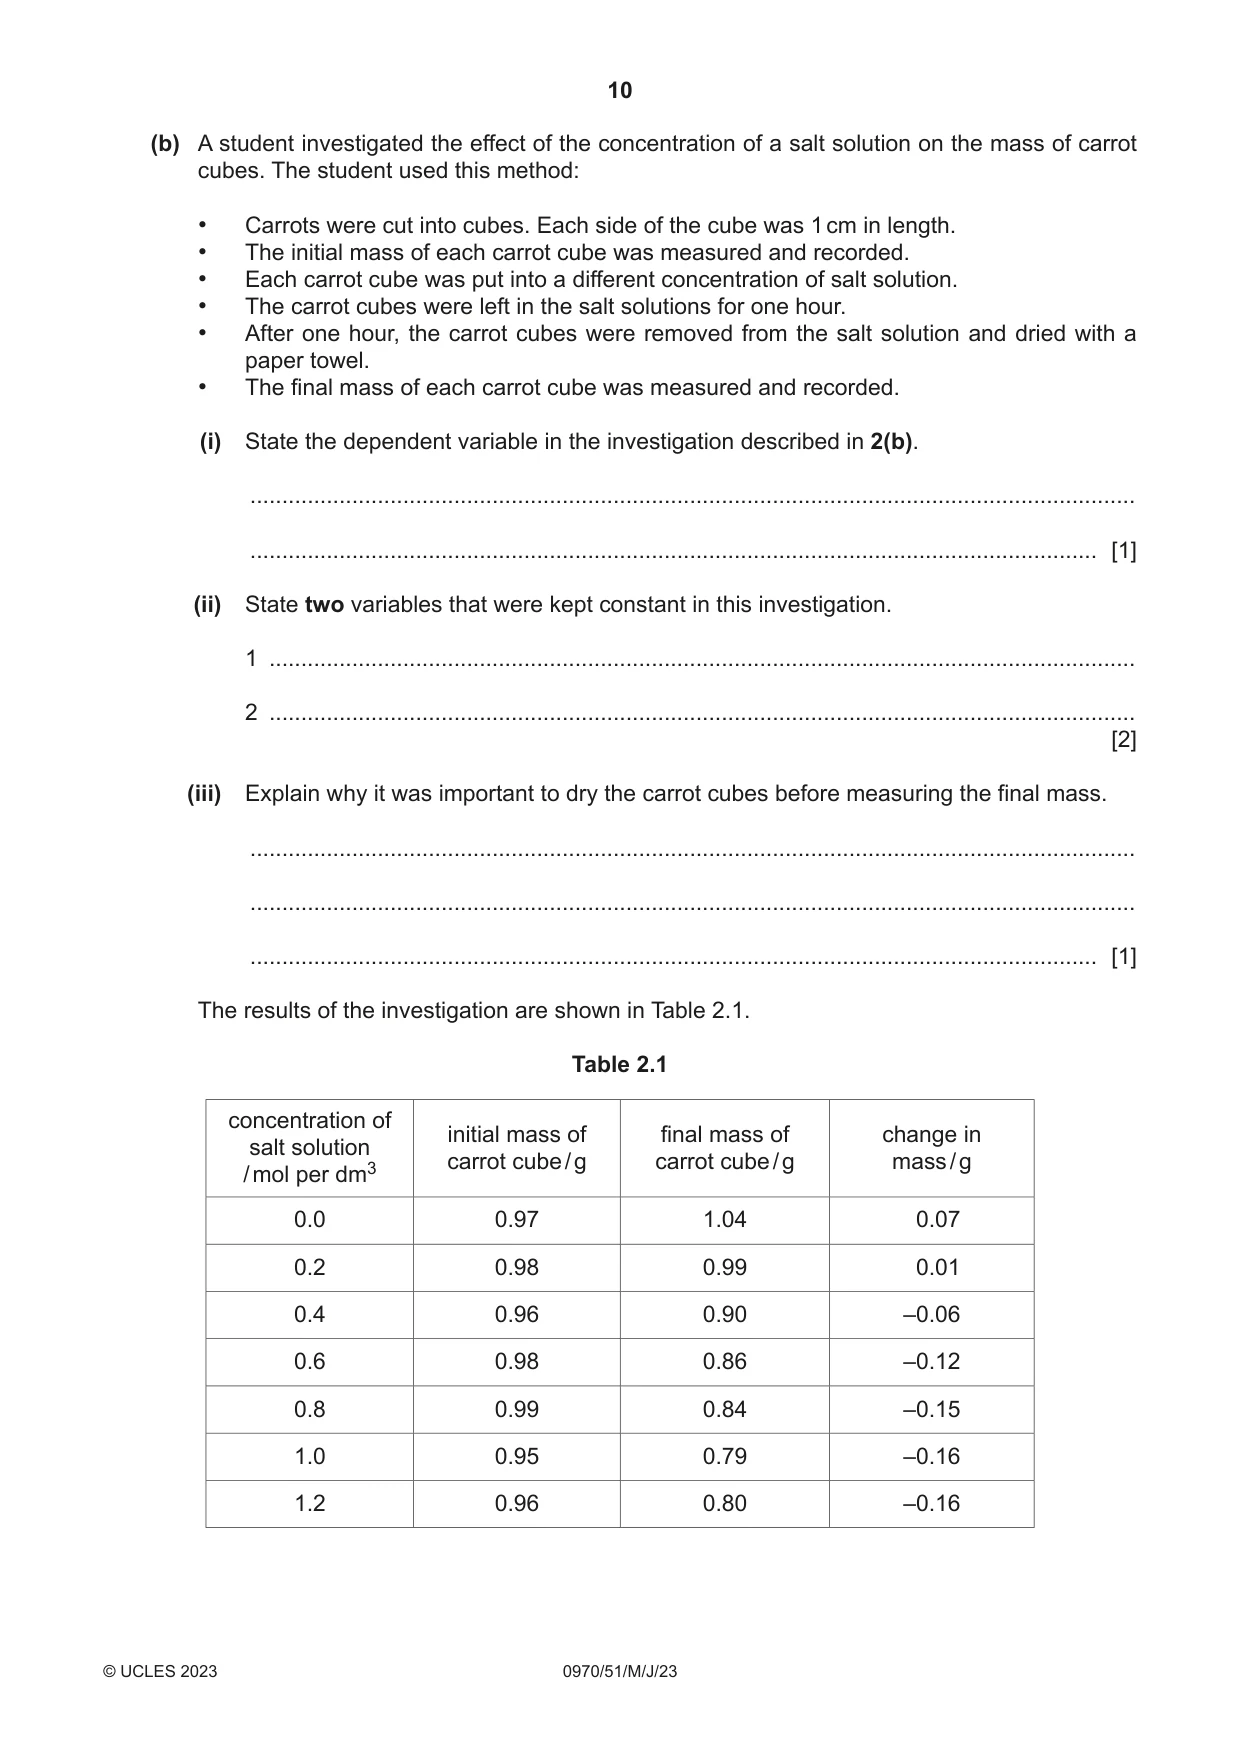
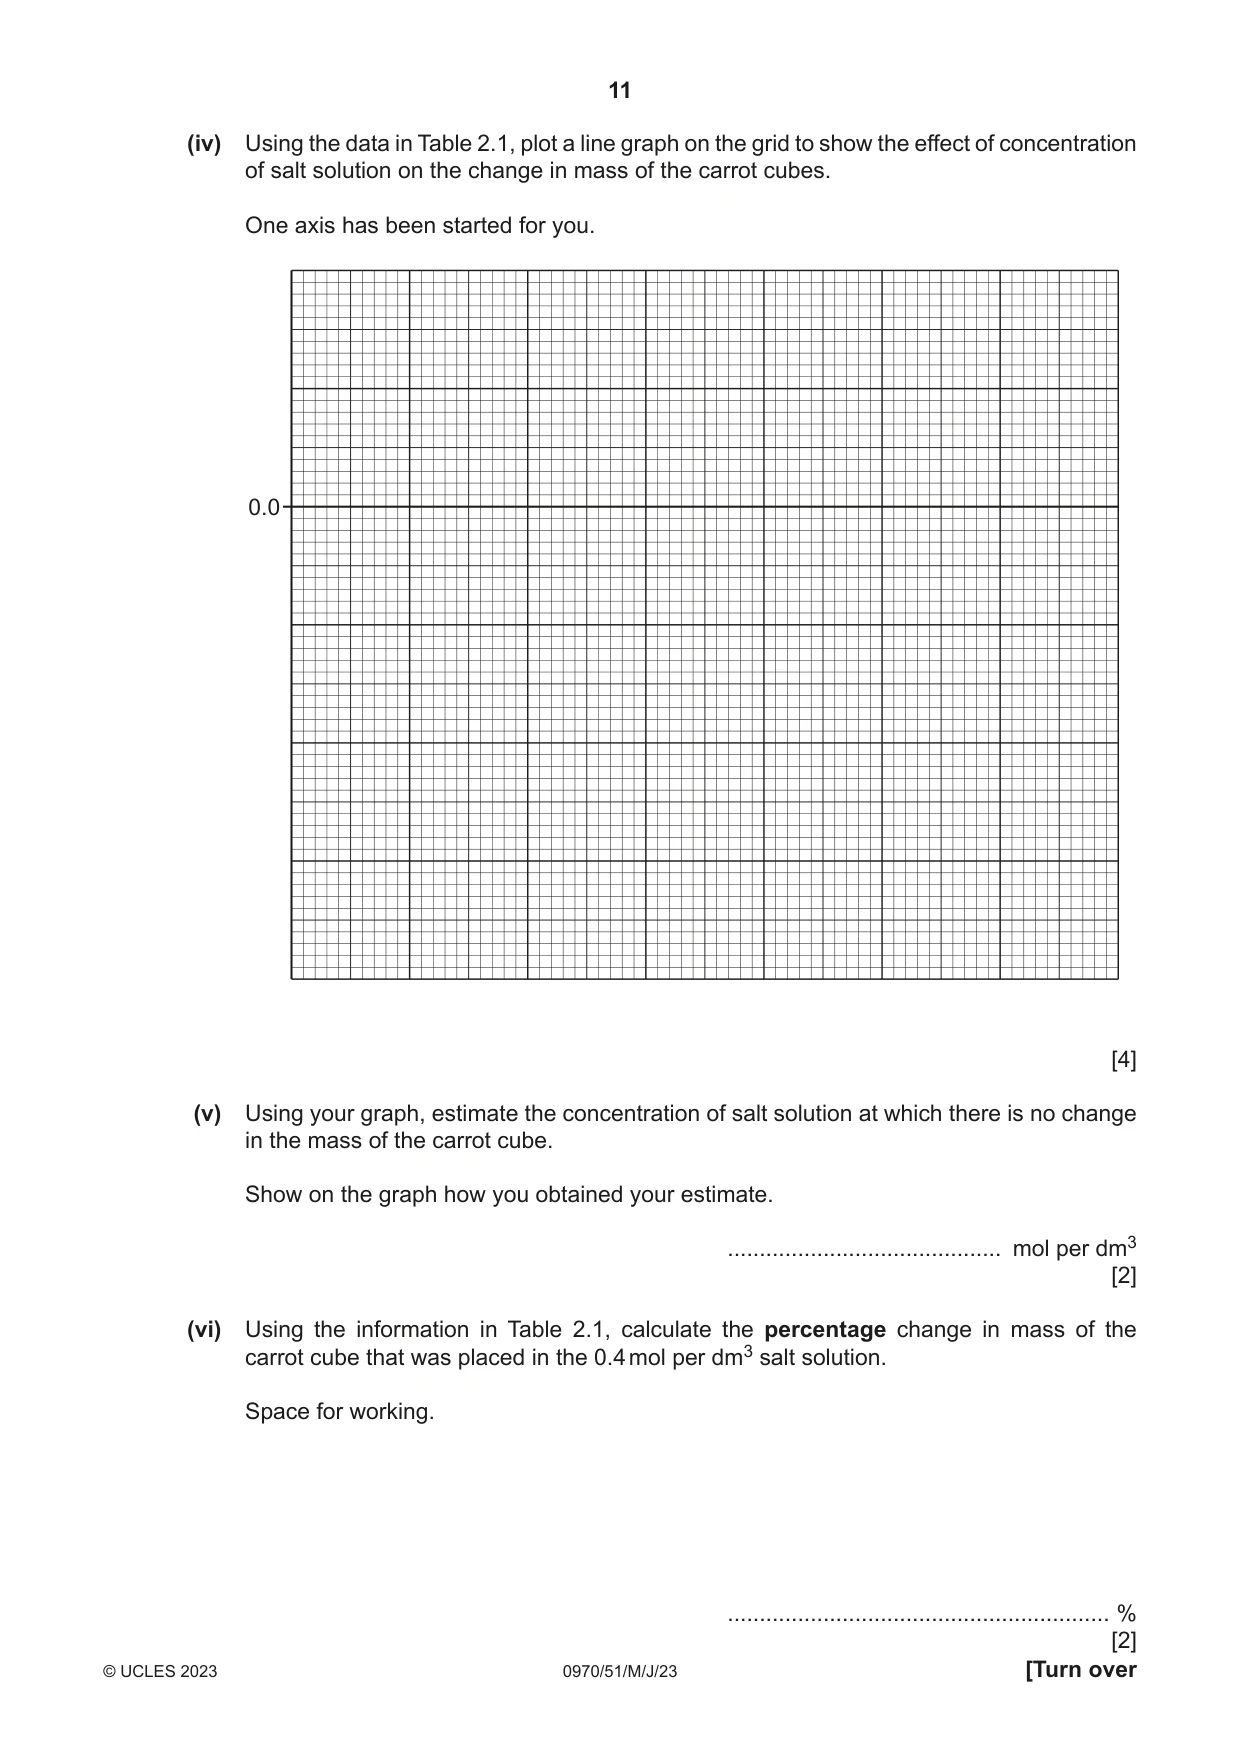
2 Fig. 2.1 is a photograph of a cross-section of a root from a carrot plant, Daucus carota. P Q magnification ×6 Fig. 2.1 (a) (i) Draw a large diagram of the carrot root cross-section that shows the layers visible in Fig. 2.1. [4] (ii) Line PQ on Fig. 2.1 represents the diameter of the carrot root cross-section. Measure the length of line PQ on Fig. 2.1. length of PQ ............................................... mm Calculate the actual diameter of the carrot root cross-section using the formula and your measurement. length of line PQ in Fig. 2.1 magnification = actual diameter of the carrot root cross-section Give your answer to one decimal place. Space for working. ......................................................... mm [3] (b) A student investigated the effect of the concentration of a salt solution on the mass of carrot cubes. The student used this method: • Carrots were cut into cubes. Each side of the cube was 1 cm in length. • The initial mass of each carrot cube was measured and recorded. • Each carrot cube was put into a different concentration of salt solution. • The carrot cubes were left in the salt solutions for one hour. • After one hour, the carrot cubes were removed from the salt solution and dried with a paper towel. • The final mass of each carrot cube was measured and recorded. (i) State the dependent variable in the investigation described in 2(b). ........................................................................................................................................... ..................................................................................................................................... [1] (ii) State two variables that were kept constant in this investigation. 1 ........................................................................................................................................ 2 ........................................................................................................................................ [2] (iii) Explain why it was important to dry the carrot cubes before measuring the final mass. ........................................................................................................................................... ........................................................................................................................................... ..................................................................................................................................... [1] The results of the investigation are shown in Table 2.1. Table 2.1 concentration of initial mass of final mass of change in salt solution carrot cube / g carrot cube / g mass / g / mol per dm3 0.0 0.97 1.04 0.07 0.2 0.98 0.99 0.01 0.4 0.96 0.90 –0.06 0.6 0.98 0.86 –0.12 0.8 0.99 0.84 –0.15 1.0 0.95 0.79 –0.16 1.2 0.96 0.80 –0.16
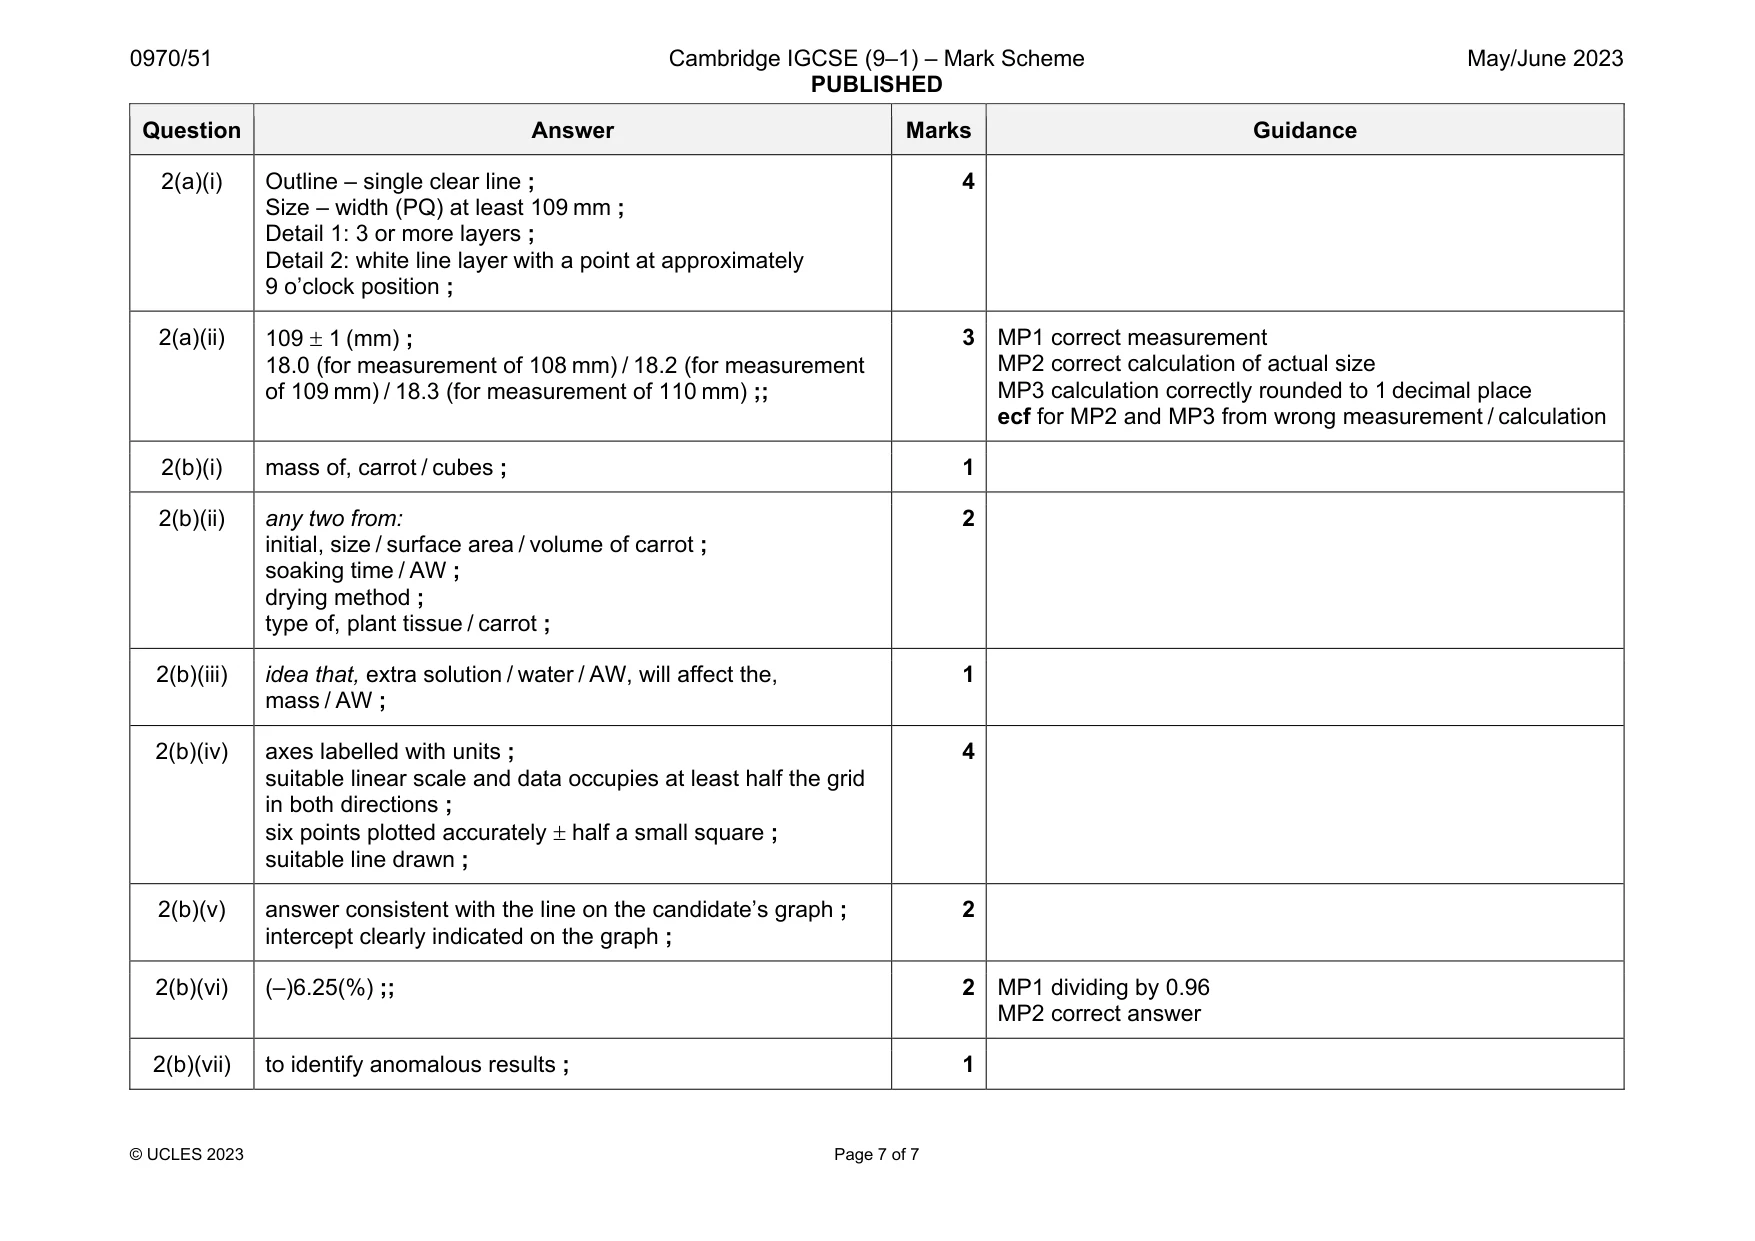
Mark scheme: 2(a)(i) Outline – single clear line ; Size – width (PQ) at least 109 mm ; Detail 1: 3 or more layers ; Detail 2: white line layer with a point at approximately 9 o’clock position ; 4 2(a)(ii) 109 1 (mm) ; 18.0 (for measurement of 108 mm) / 18.2 (for measurement of 109 mm) / 18.3 (for measurement of 110 mm) ;; 3 MP1 correct measurement MP2 correct calculation of actual size MP3 calculation correctly rounded to 1 decimal place ecf for MP2 and MP3 from wrong measurement / calculation 2(b)(i) mass of, carrot / cubes ; 1 2(b)(ii) any two from: initial, size / surface area / volume of carrot ; soaking time / AW ; drying method ; type of, plant tissue / carrot ; 2 2(b)(iii) idea that, extra solution / water / AW, will affect the, mass / AW ; 1 2(b)(iv) axes labelled with units ; suitable linear scale and data occupies at least half the grid in both directions ; six points plotted accurately half a small square ; suitable line drawn ; 4 2(b)(v) answer consistent with the line on the candidate’s graph ; intercept clearly indicated on the graph ; 2 2(b)(vi) (–)6.25(%) ;; 2 MP1 dividing by 0.96 MP2 correct answer 2(b)(vii) to identify anomalous results ; 1
What was in this paper
The subtopics covered by these 2 questions, and how many questions each got. Open one in a new tab to see every Cambridge question on it.
What you needed in this session
Cambridge’s own grade thresholds for 2023 May/June, Paper 5 · Variant 1. A higher threshold means an easier paper — the bar moves with how the cohort did.