Cambridge IGCSE Biology (9-1) 0970 — 2021 May/June Paper 5 · Variant 1
0970/51/M/J/21 · 2 questions · 40 marks · ≈45 min
The question paper and its mark scheme, free to read here and free to download. This is Cambridge’s own paper, exactly as it was sat.
Question paper12 pages


Mark scheme8 pages
Answers below. Sit the paper first if you are practising.
Questions as text
Q1 · You are going to investigate the effect of the concentration of sugar solutions on…
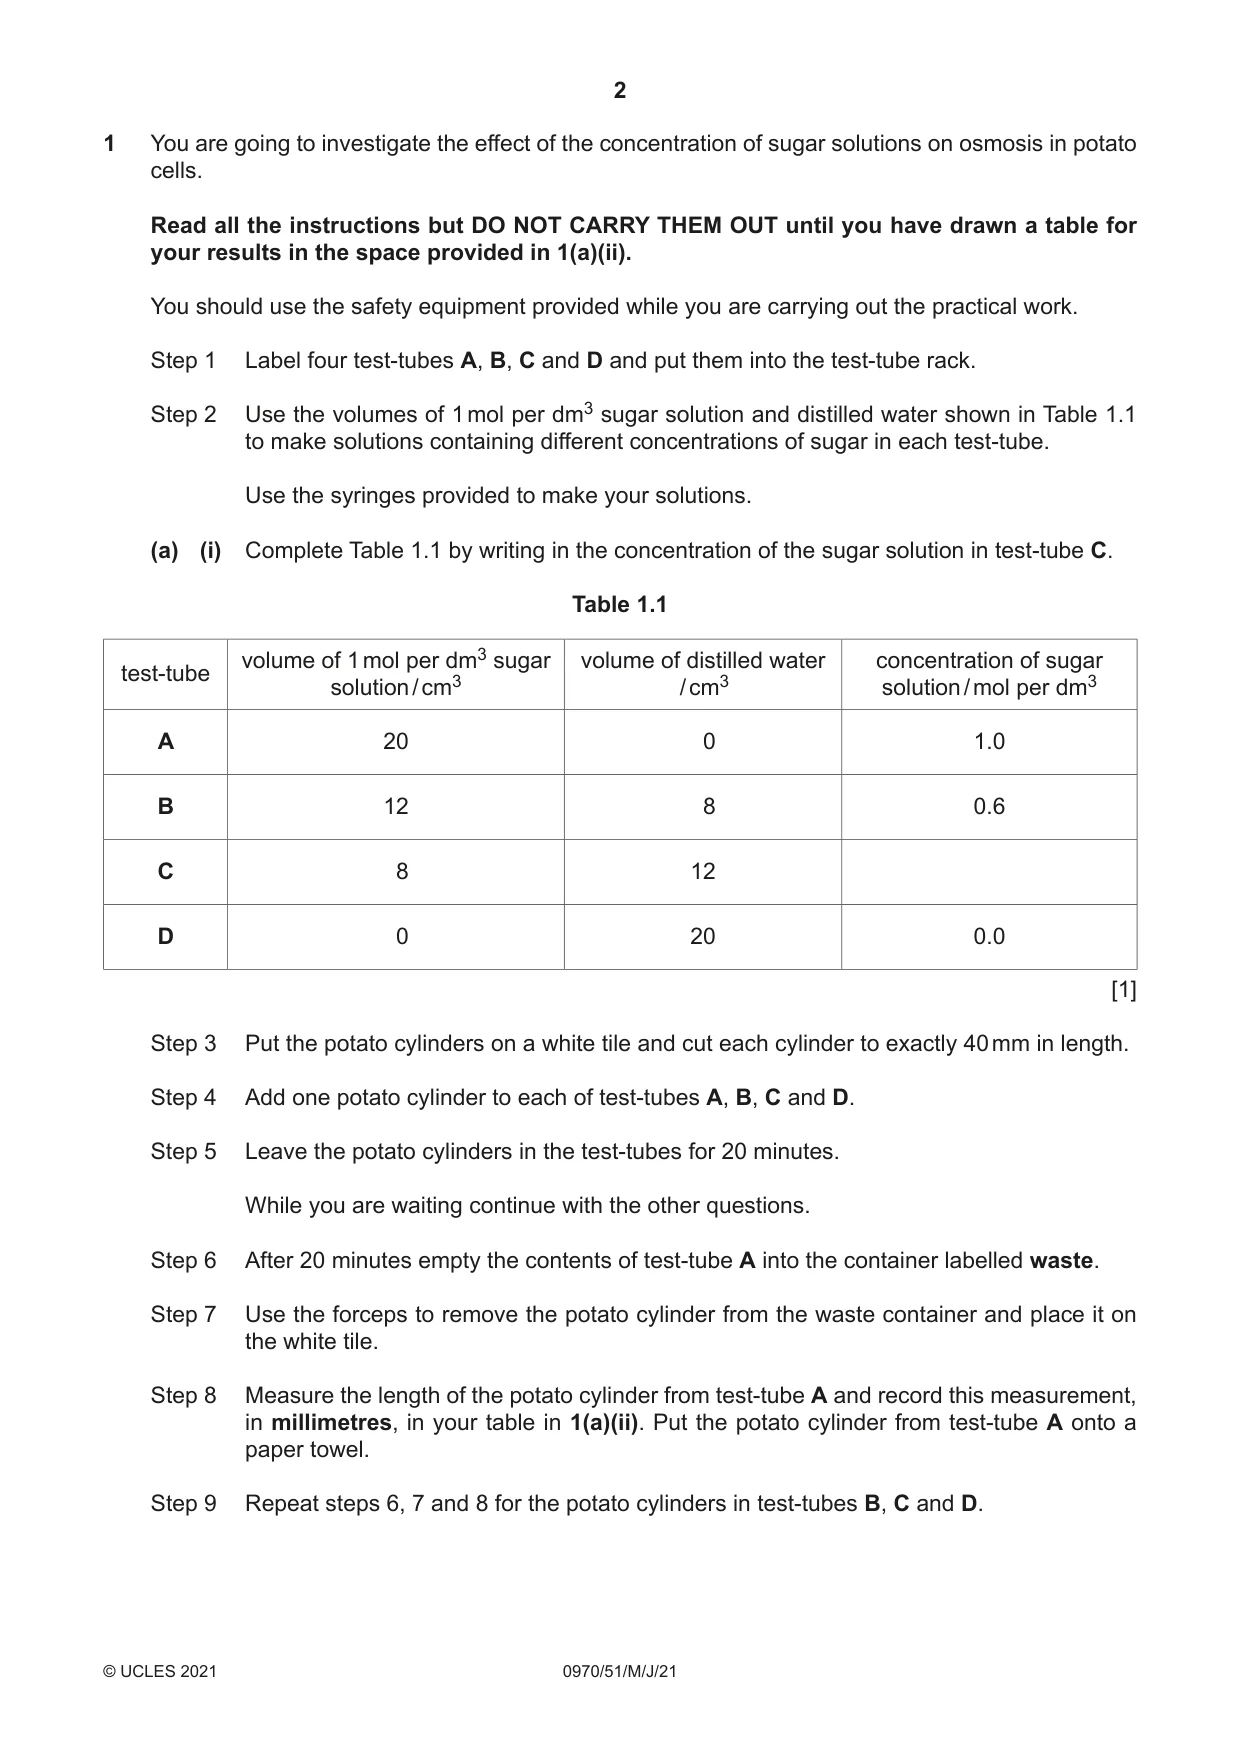
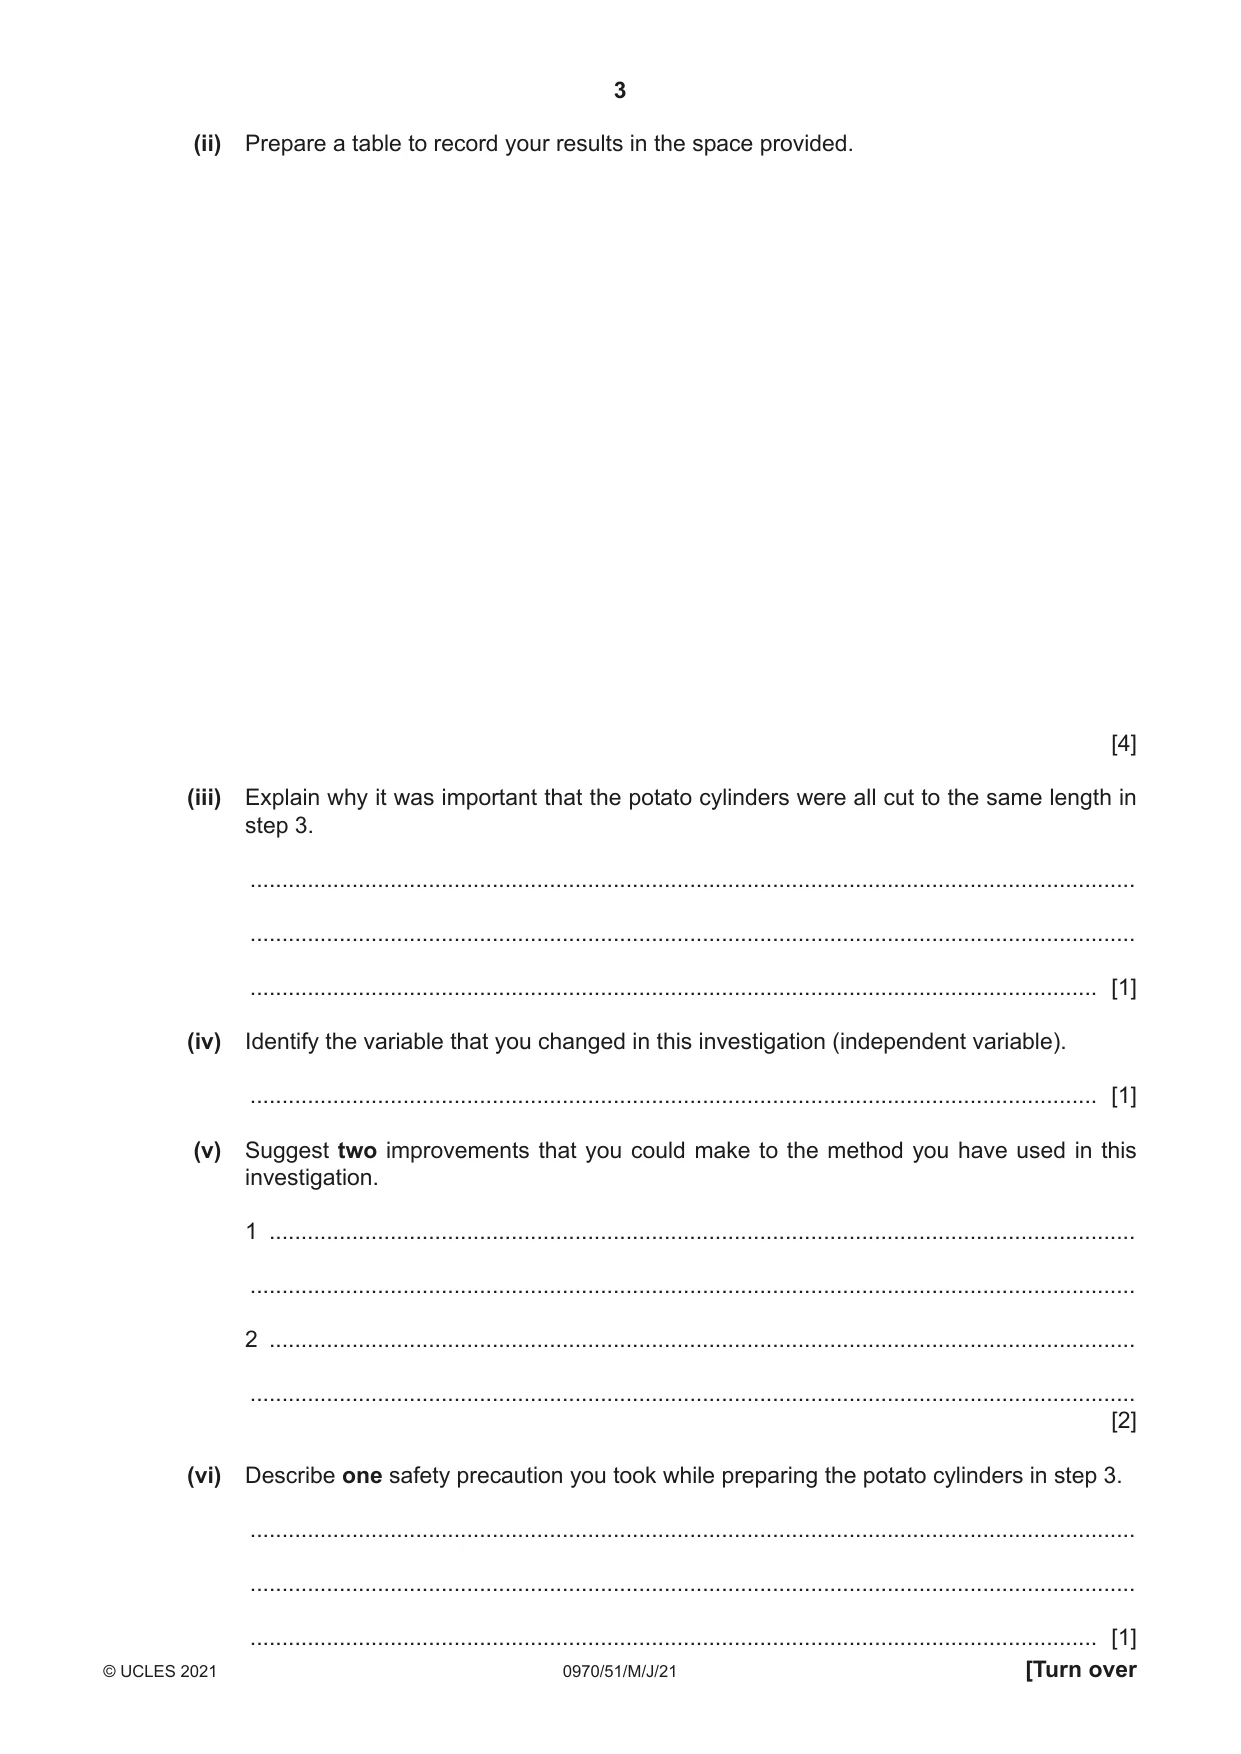
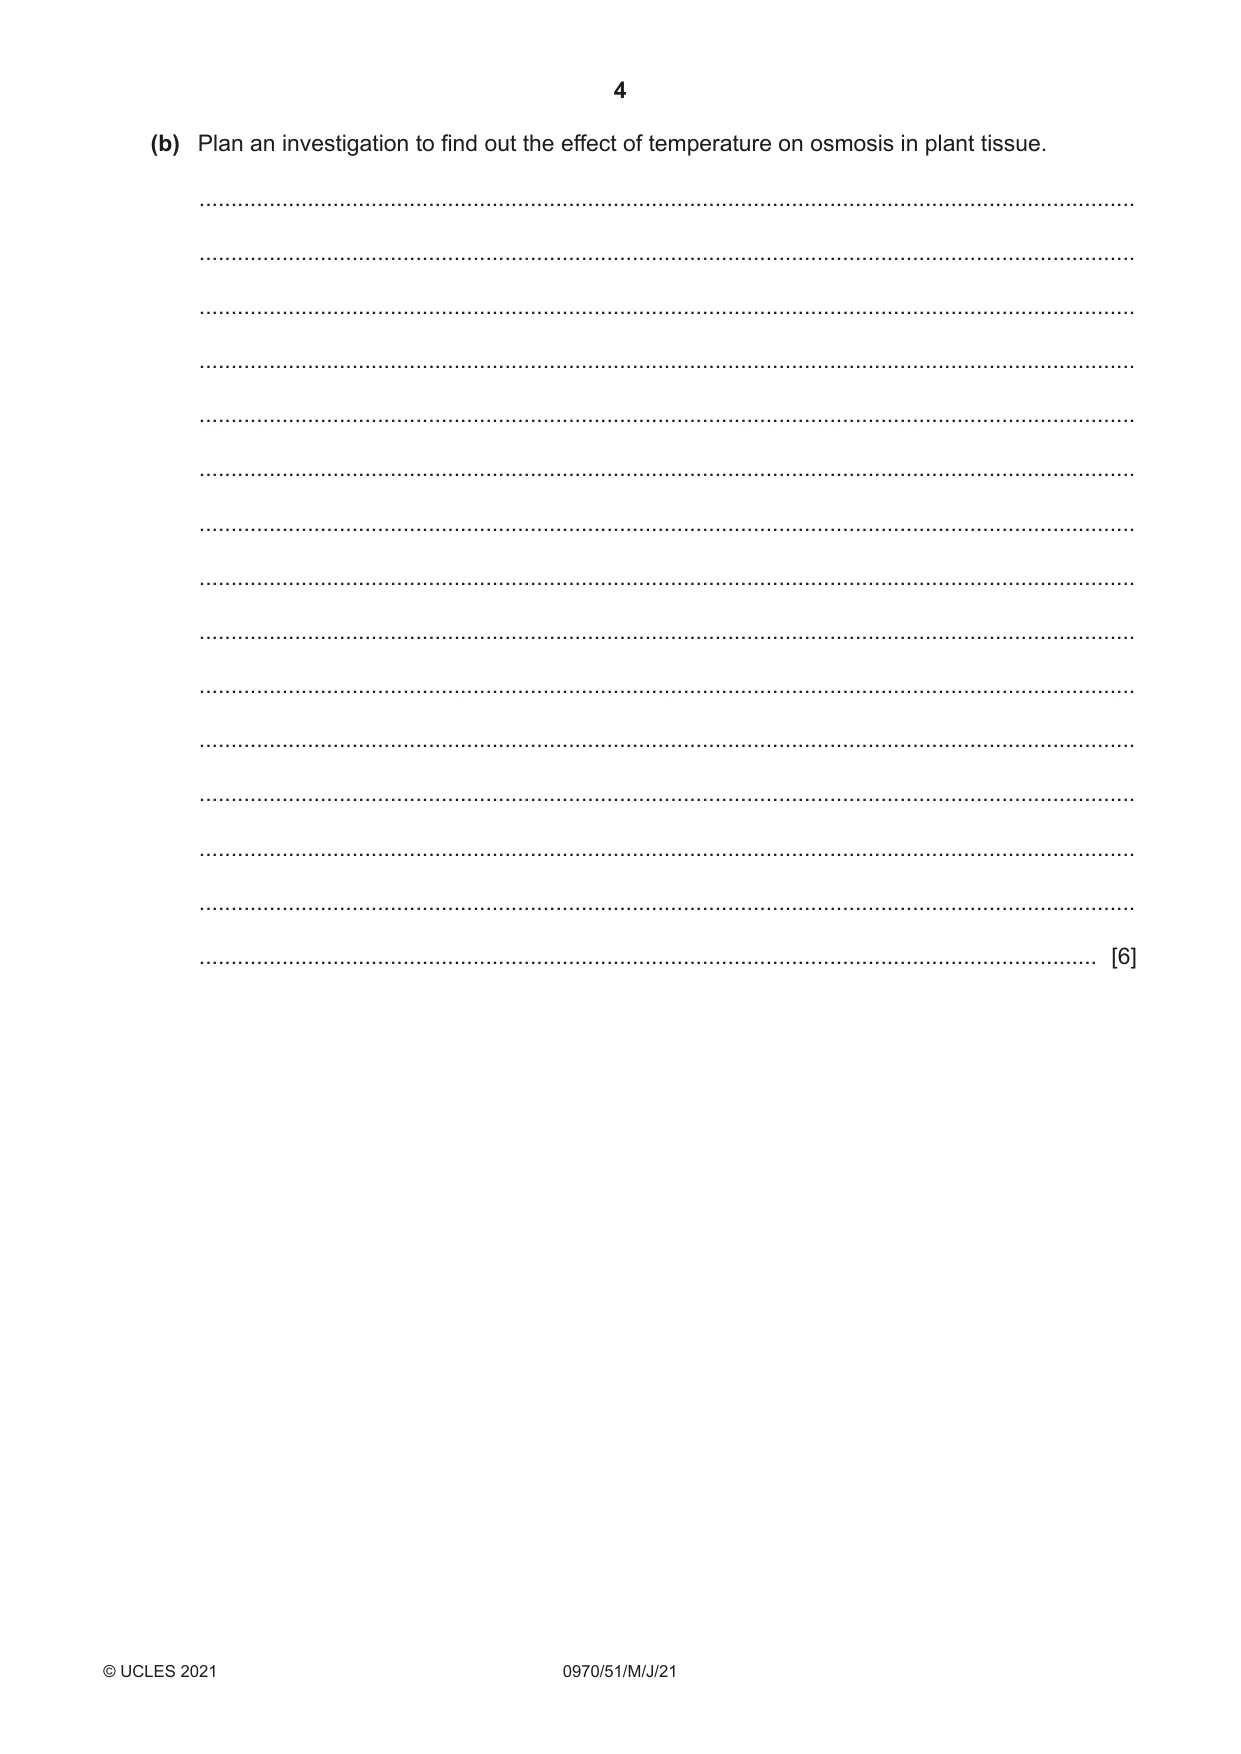
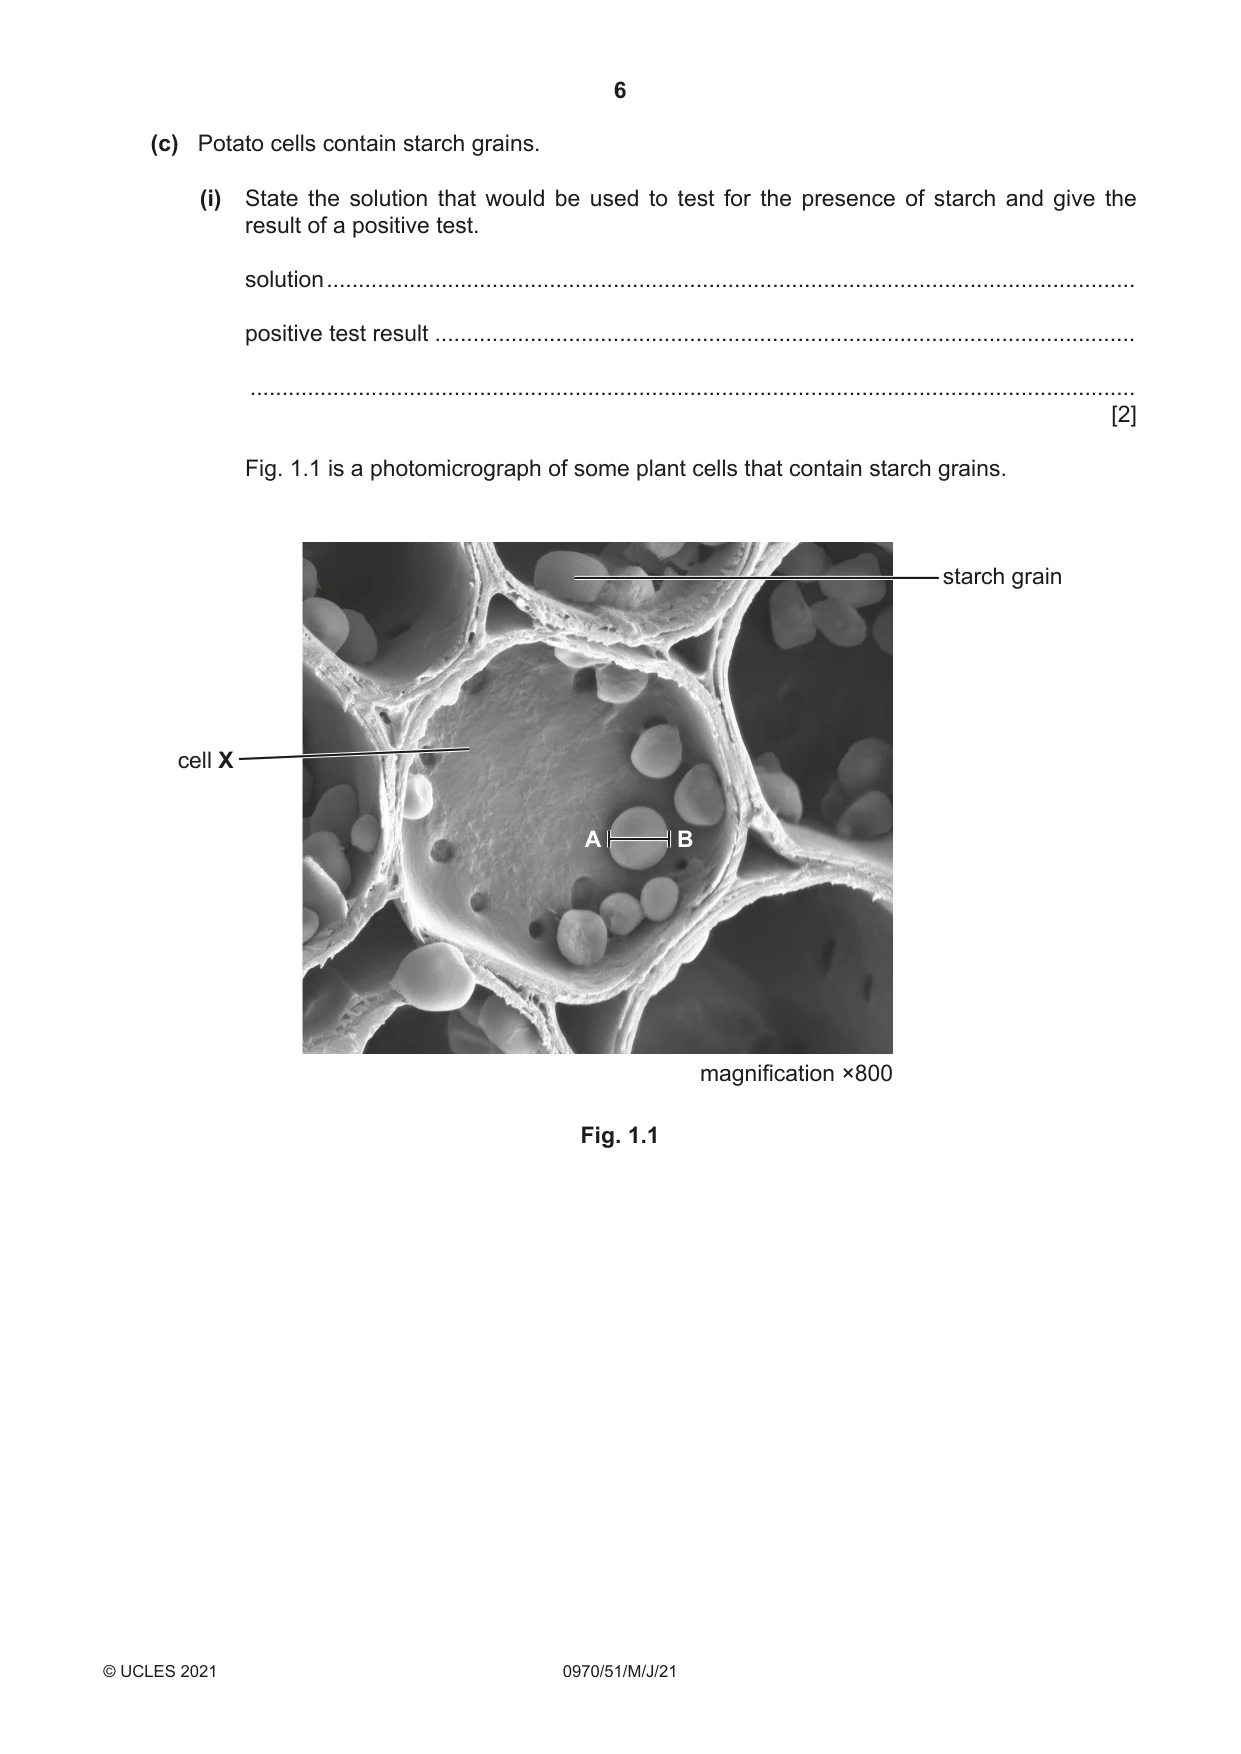
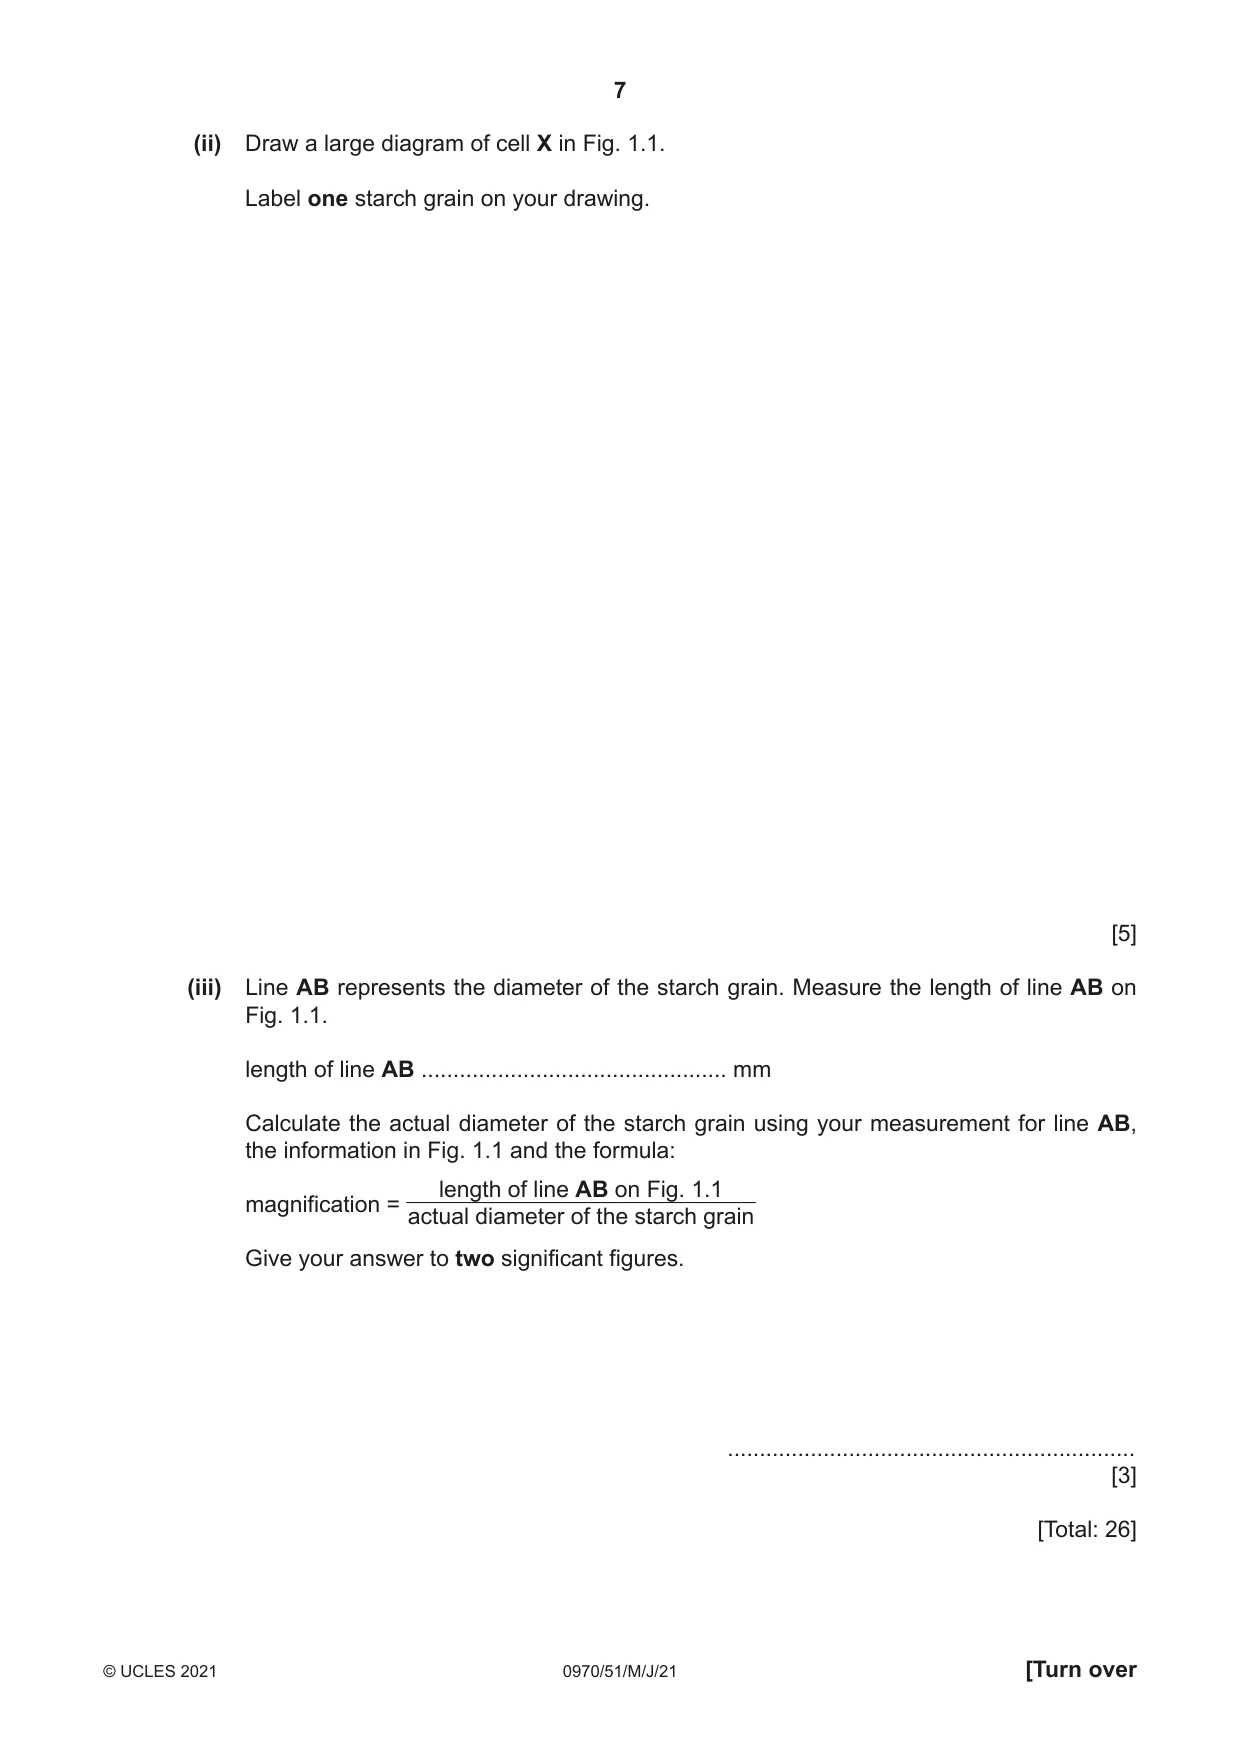
1 You are going to investigate the effect of the concentration of sugar solutions on osmosis in potato cells. Read all the instructions but DO NOT CARRY THEM OUT until you have drawn a table for your results in the space provided in 1(a)(ii). You should use the safety equipment provided while you are carrying out the practical work. Step 1 Label four test-tubes A, B, C and D and put them into the test-tube rack. Step 2 Use the volumes of 1 mol per dm3 sugar solution and distilled water shown in Table 1.1 to make solutions containing different concentrations of sugar in each test-tube. Use the syringes provided to make your solutions. (a) (i) Complete Table 1.1 by writing in the concentration of the sugar solution in test-tube C. Table 1.1 volume of 1 mol per dm3 sugar volume of distilled water concentration of sugar test-tube solution / cm3 / cm3 solution / mol per dm3 A 20 0 1.0 B 12 8 0.6 C 8 12 D 0 20 0.0 [1] Step 3 Put the potato cylinders on a white tile and cut each cylinder to exactly 40 mm in length. Step 4 Add one potato cylinder to each of test-tubes A, B, C and D. Step 5 Leave the potato cylinders in the test-tubes for 20 minutes. While you are waiting continue with the other questions. Step 6 After 20 minutes empty the contents of test-tube A into the container labelled waste. Step 7 Use the forceps to remove the potato cylinder from the waste container and place it on the white tile. Step 8 Measure the length of the potato cylinder from test-tube A and record this measurement, in millimetres, in your table in 1(a)(ii). Put the potato cylinder from test-tube A onto a paper towel. Step 9 Repeat steps 6, 7 and 8 for the potato cylinders in test-tubes B, C and D. (ii) Prepare a table to record your results in the space provided. [4] (iii) Explain why it was important that the potato cylinders were all cut to the same length in step 3. ........................................................................................................................................... ........................................................................................................................................... ..................................................................................................................................... [1] (iv) Identify the variable that you changed in this investigation (independent variable). ..................................................................................................................................... [1] (v) Suggest two improvements that you could make to the method you have used in this investigation. 1 ........................................................................................................................................ ........................................................................................................................................... 2 ........................................................................................................................................ ........................................................................................................................................... [2] (vi) Describe one safety precaution you took while preparing the potato cylinders in step 3. ........................................................................................................................................... ........................................................................................................................................... ..................................................................................................................................... [1] (b) Plan an investigation to find out the effect of temperature on osmosis in plant tissue. ................................................................................................................................................... ................................................................................................................................................... ................................................................................................................................................... ................................................................................................................................................... ................................................................................................................................................... ................................................................................................................................................... ................................................................................................................................................... ................................................................................................................................................... ................................................................................................................................................... ................................................................................................................................................... ................................................................................................................................................... ................................................................................................................................................... ................................................................................................................................................... ................................................................................................................................................... ............................................................................................................................................. [6] (c) Potato cells contain starch grains. (i) State the solution that would be used to test for the presence of starch and give the result of a positive test. solution ............................................................................................................................... positive test result .............................................................................................................. ........................................................................................................................................... [2] Fig. 1.1 is a photomicrograph of some plant cells that contain starch grains. starch grain cell X A B magnification ×800 Fig. 1.1 (ii) Draw a large diagram of cell X in Fig. 1.1. Label one starch grain on your drawing. [5] (iii) Line AB represents the diameter of the starch grain. Measure the length of line AB on Fig. 1.1. length of line AB ................................................ mm Calculate the actual diameter of the starch grain using your measurement for line AB, the information in Fig. 1.1 and the formula: length of line AB on Fig. 1.1 magnification = actual diameter of the starch grain Give your answer to two significant figures. ................................................................ [3] [Total: 26]
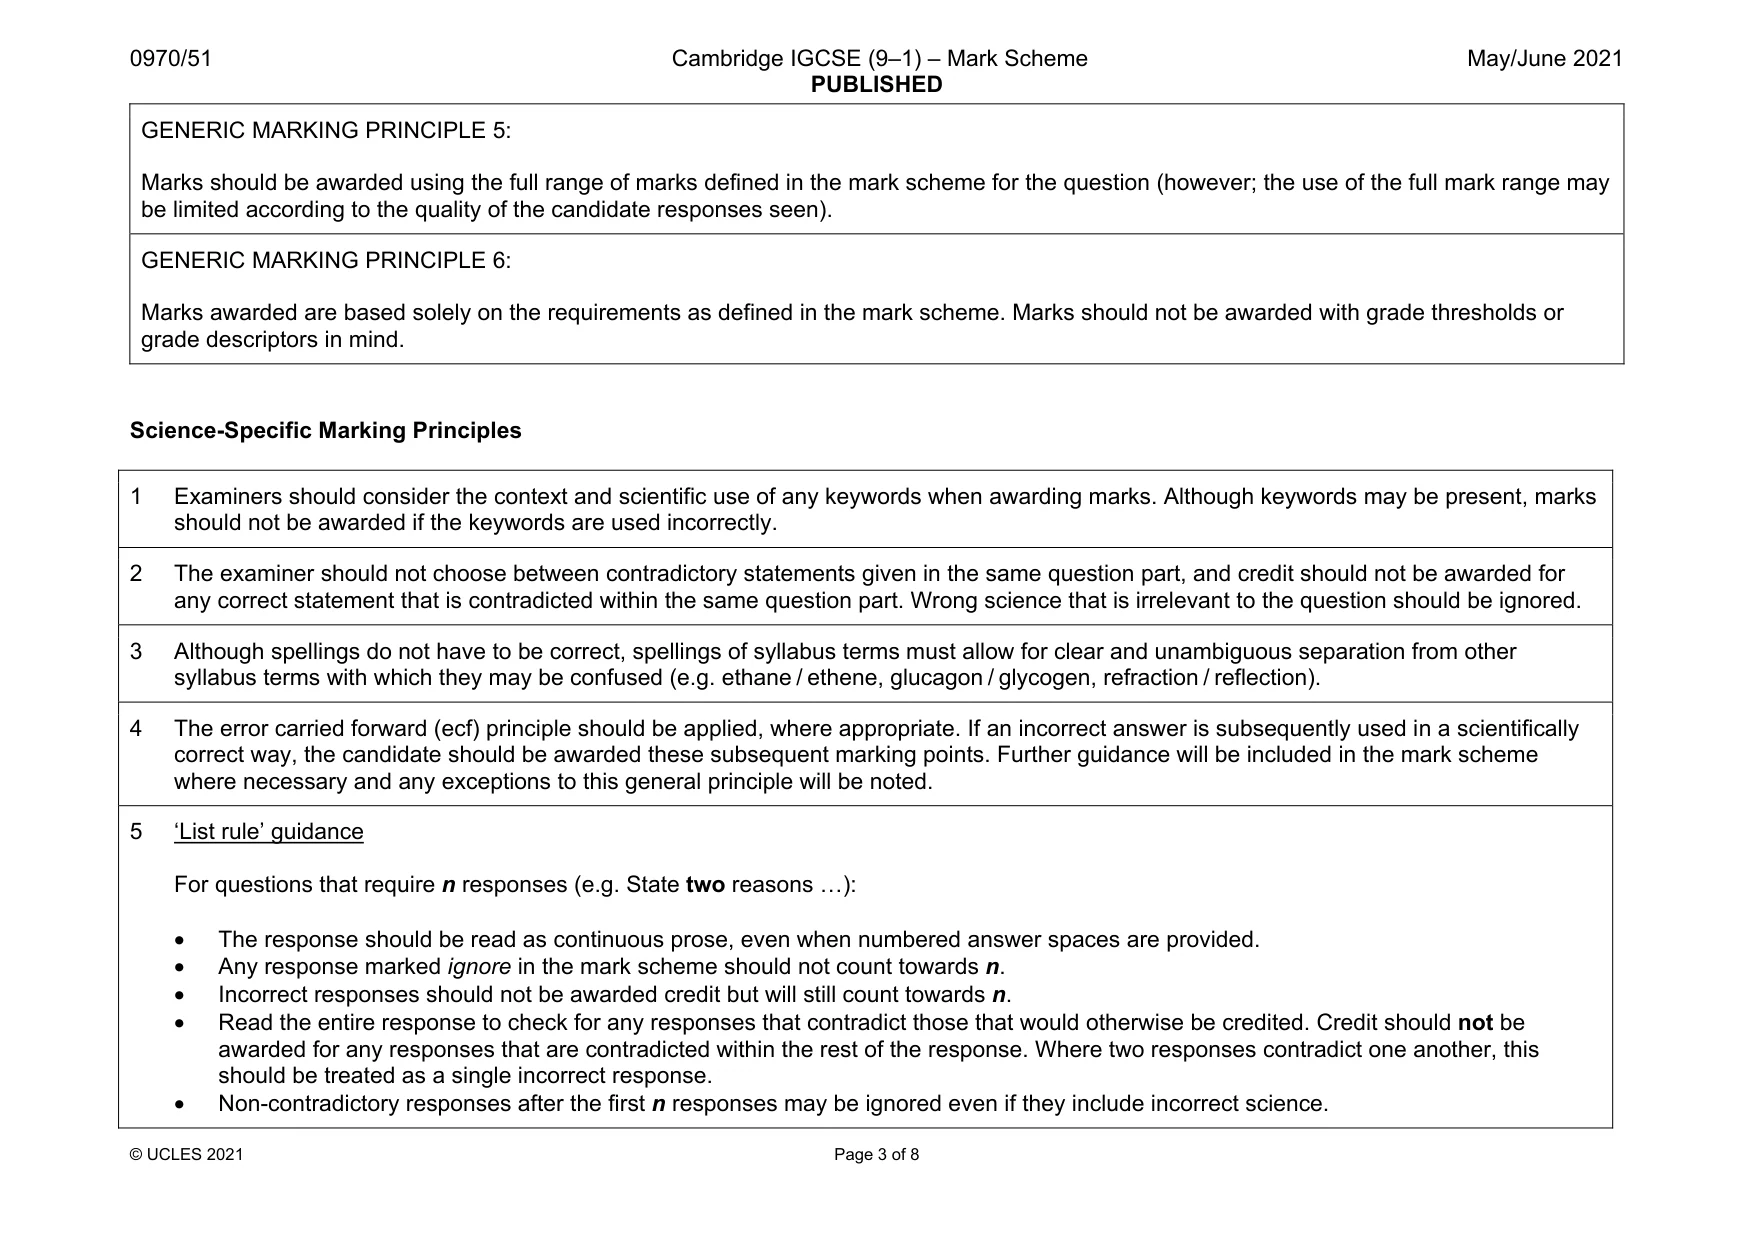
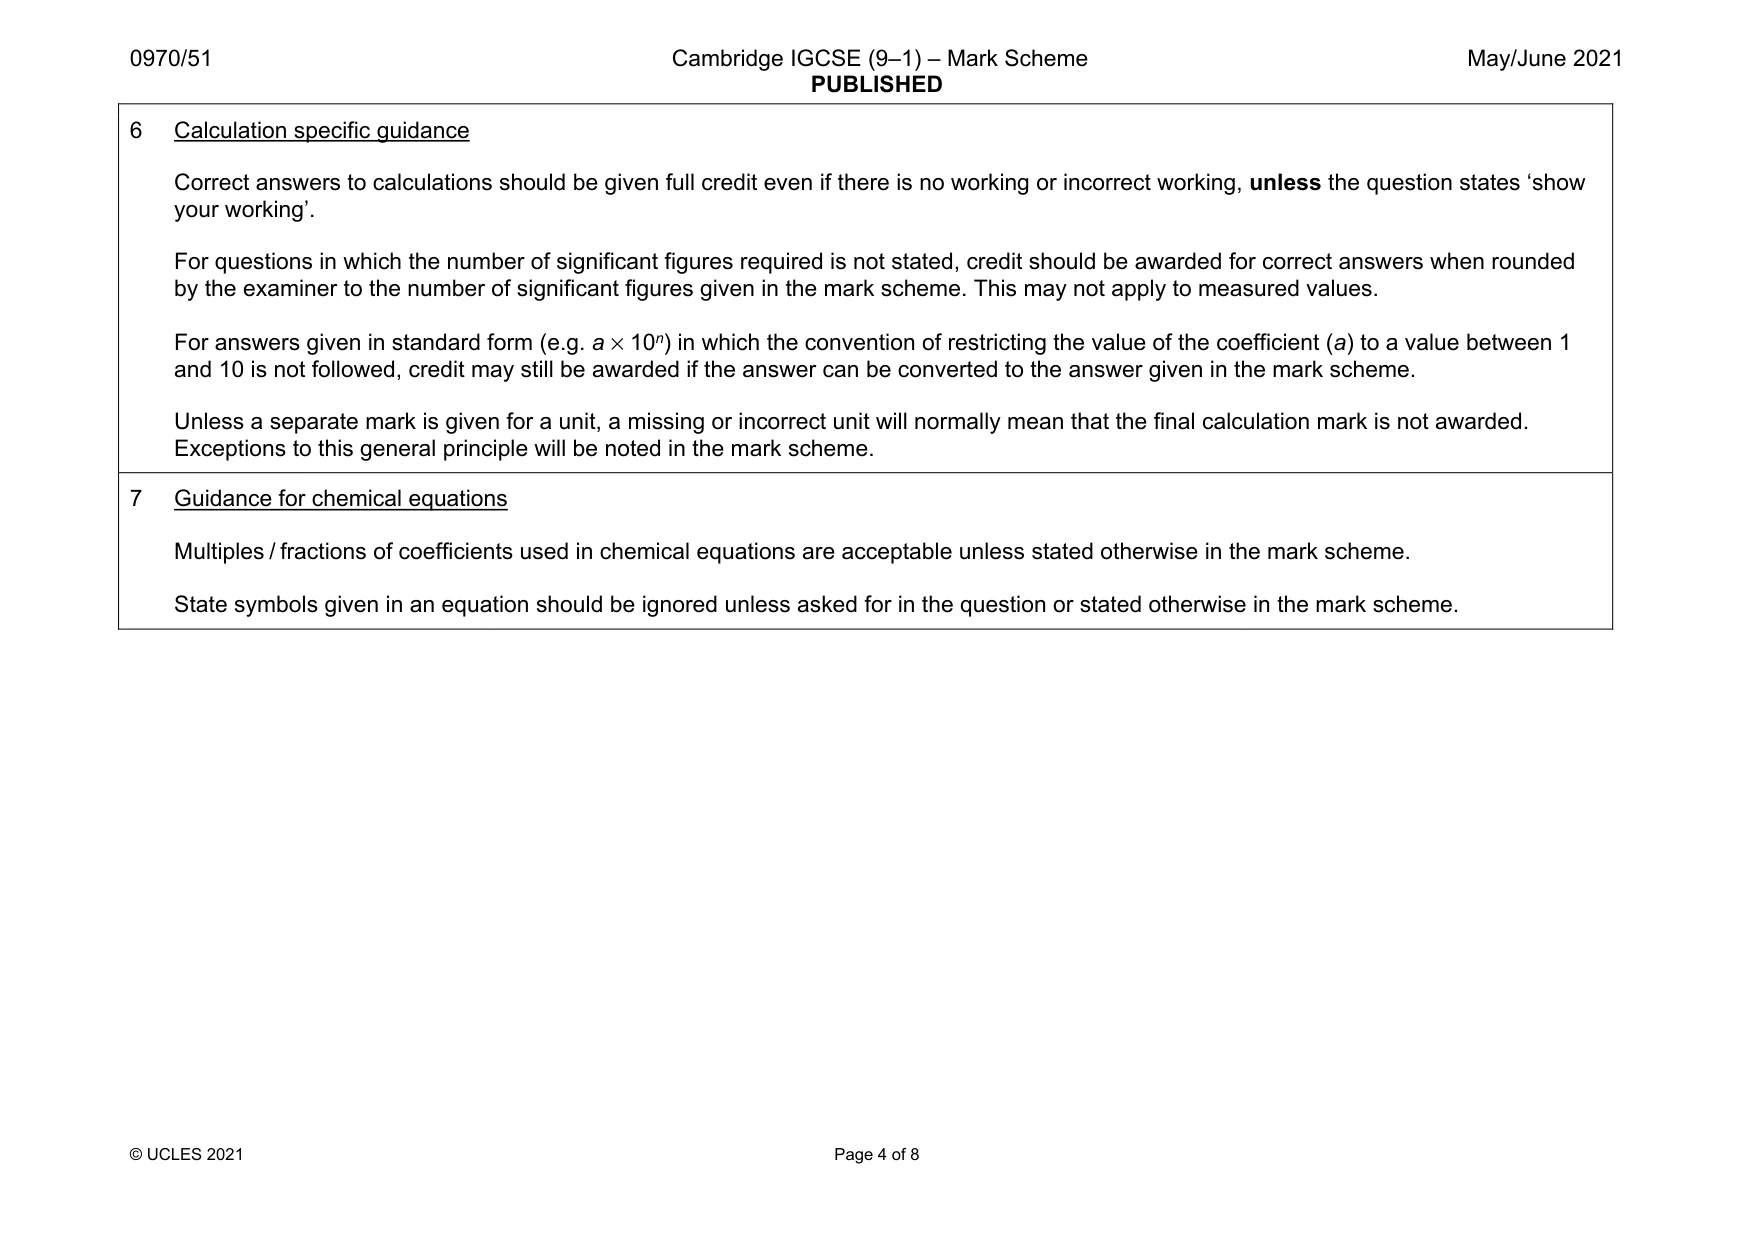
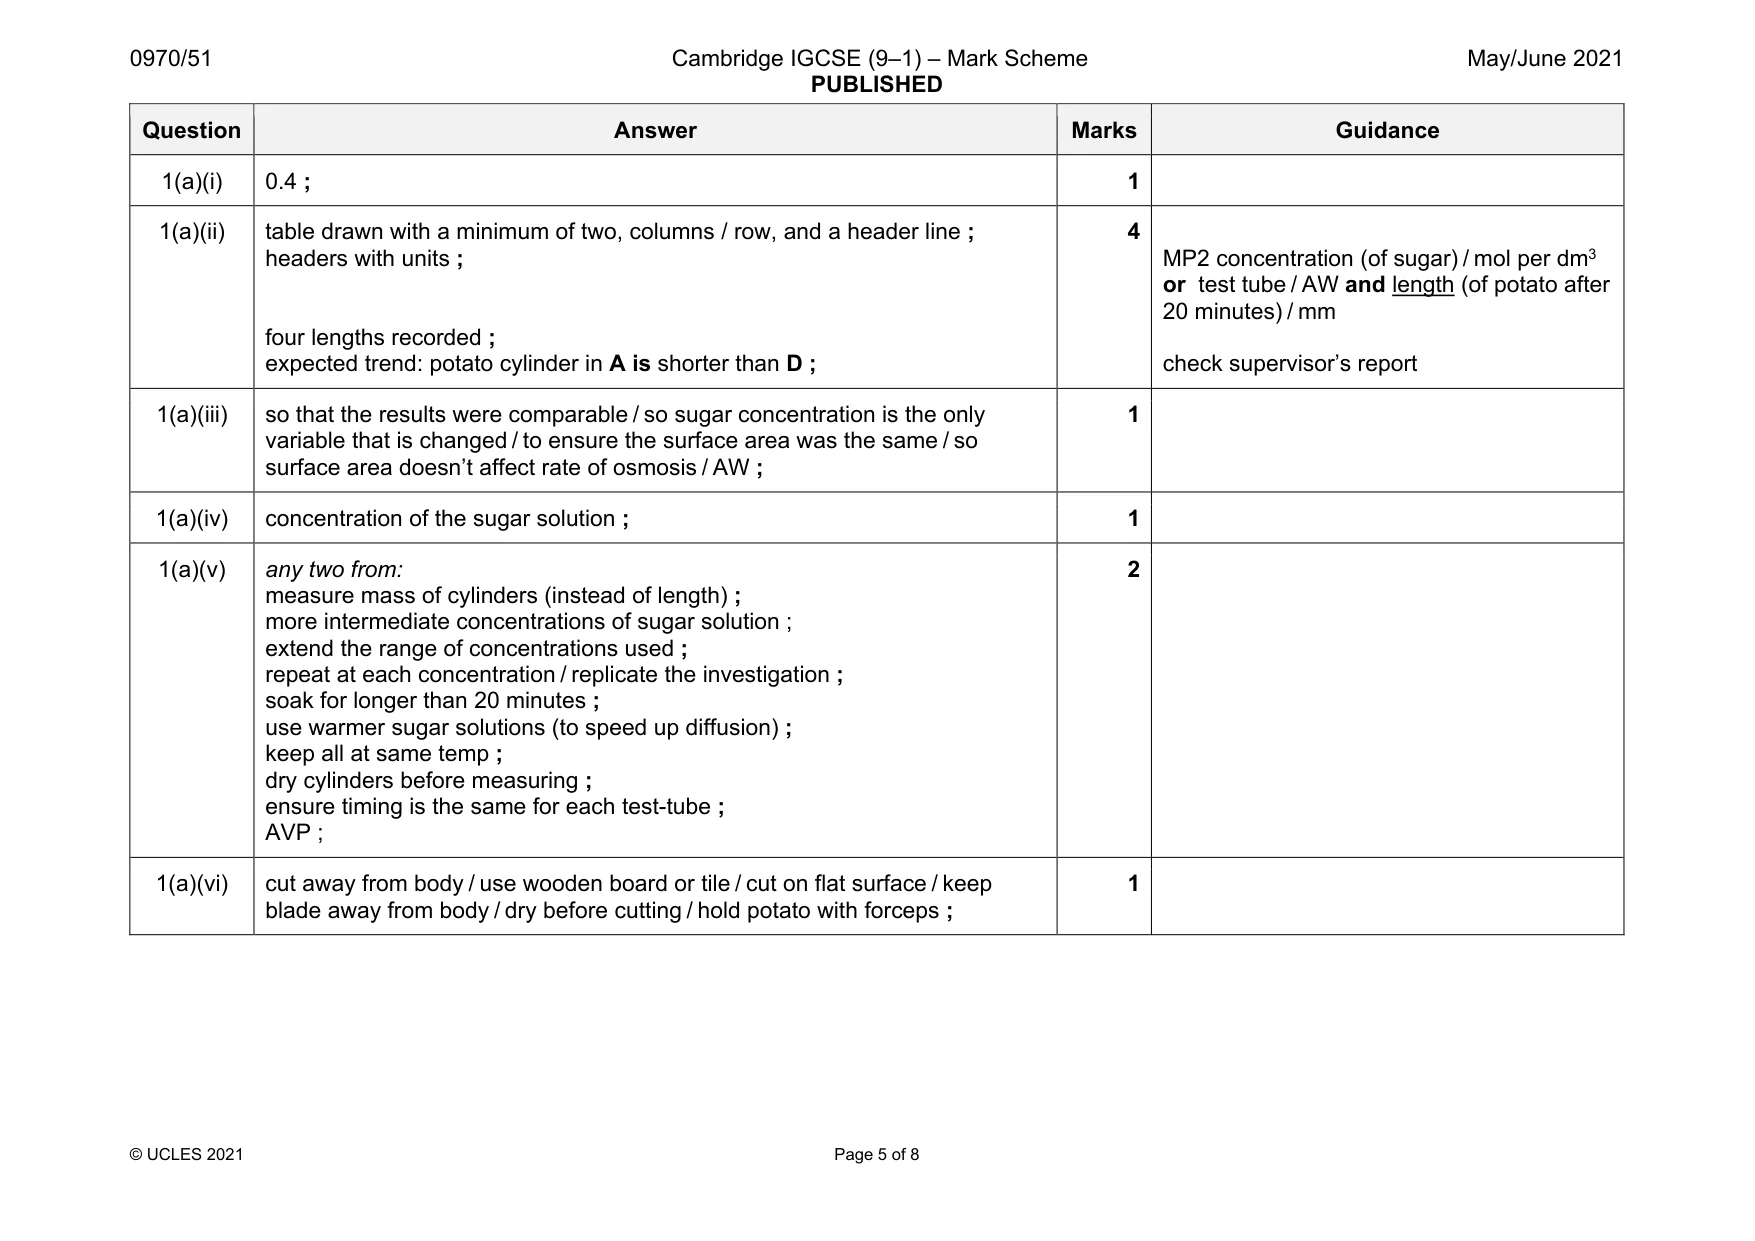
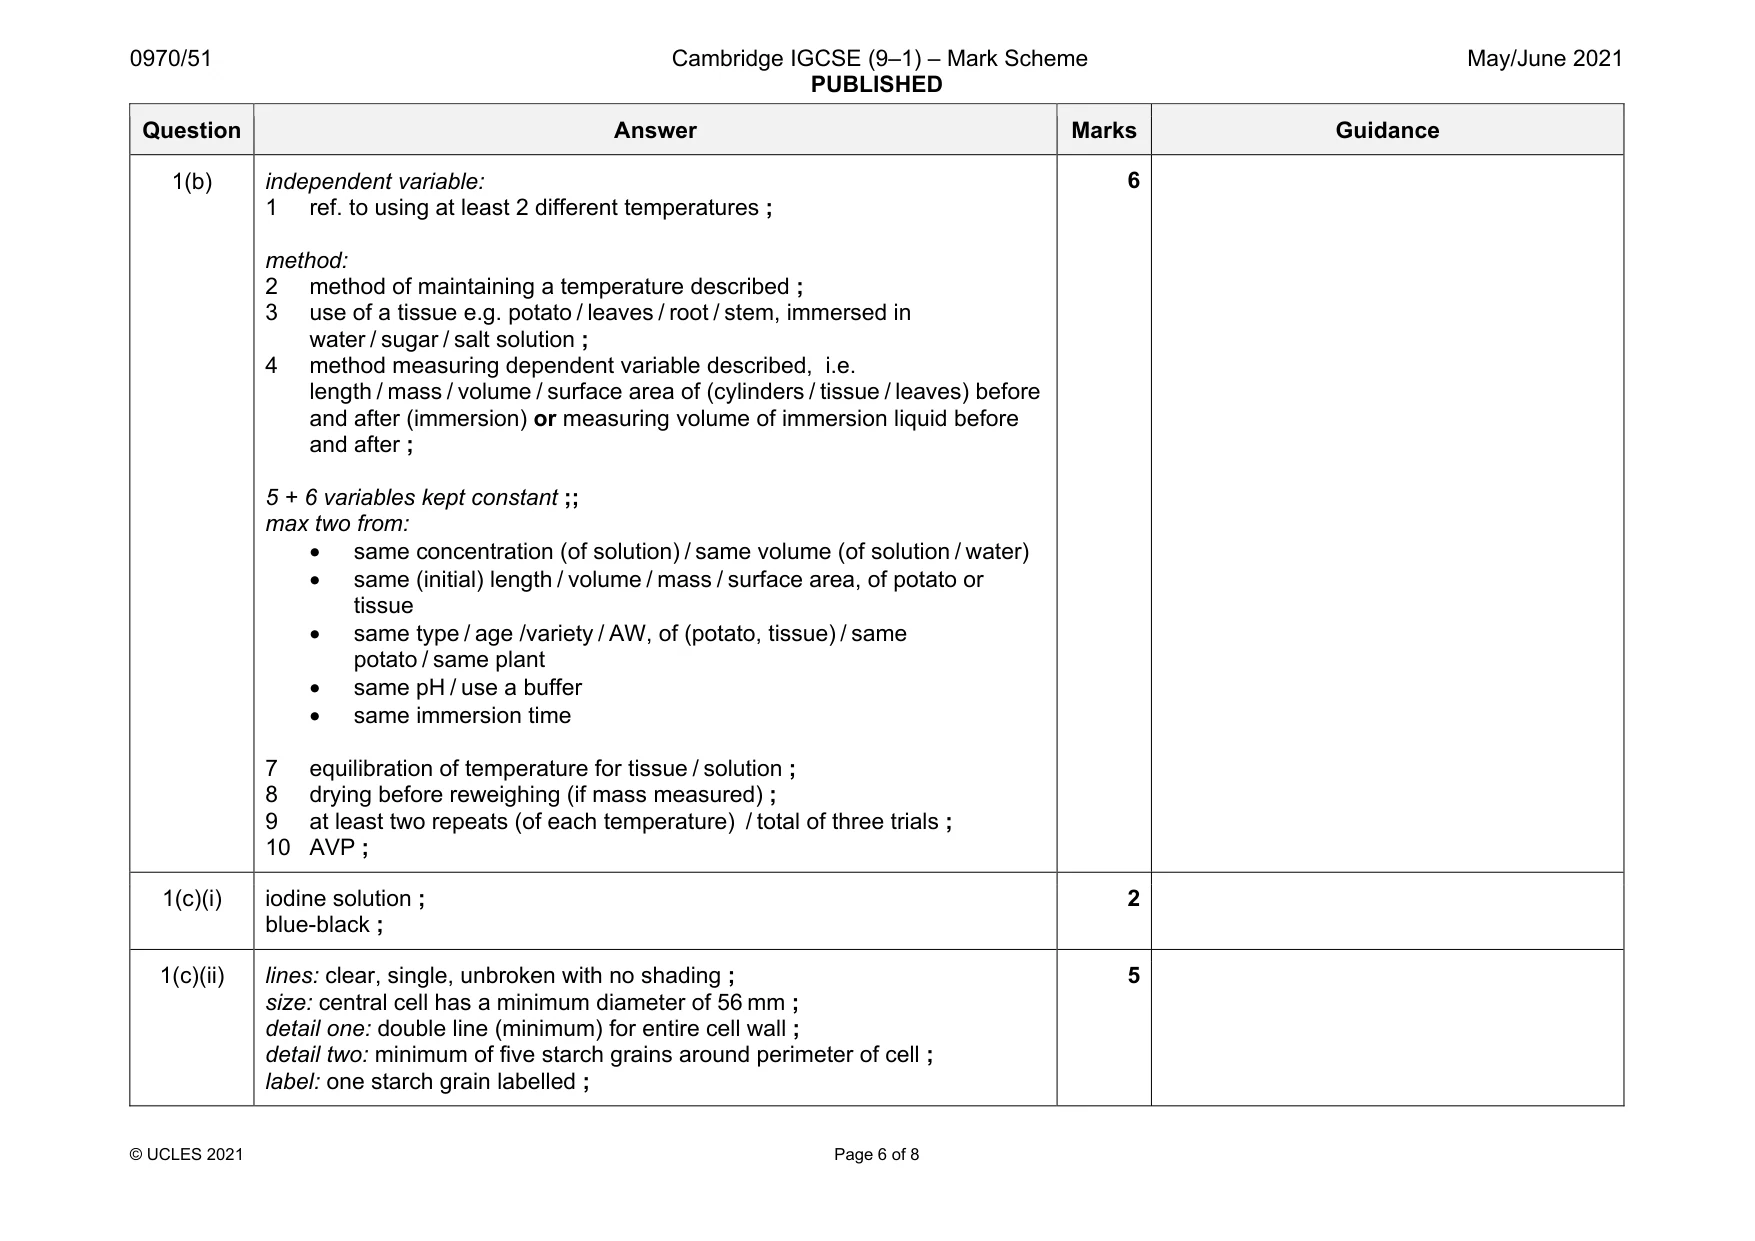
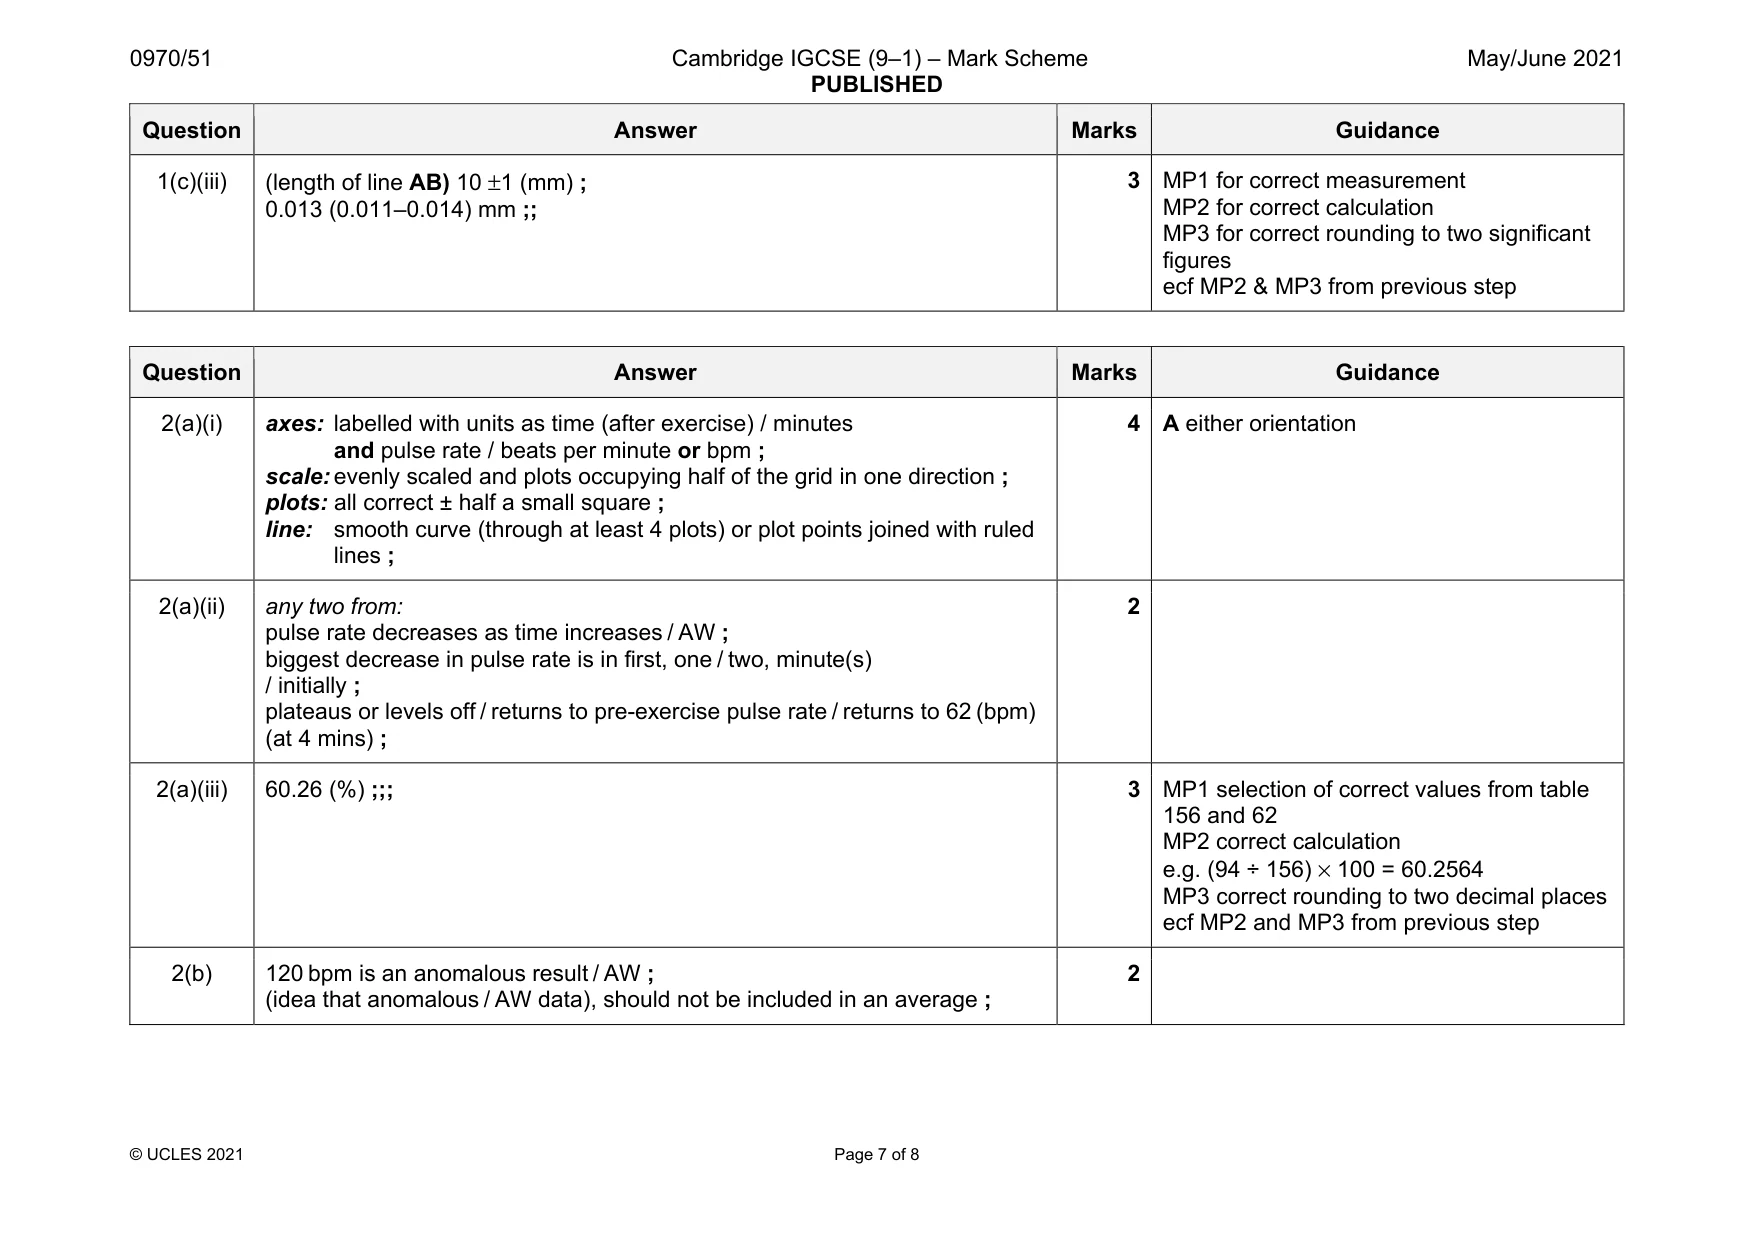
Mark scheme: 1(a)(i) 0.4 ; 1 1(a)(ii) table drawn with a minimum of two, columns / row, and a header line ; headers with units ; four lengths recorded ; expected trend: potato cylinder in A is shorter than D ; 4 MP2 concentration (of sugar) / mol per dm3 or test tube / AW and length (of potato after 20 minutes) / mm check supervisor’s report 1(a)(iii) so that the results were comparable / so sugar concentration is the only variable that is changed / to ensure the surface area was the same / so surface area doesn’t affect rate of osmosis / AW ; 1 1(a)(iv) concentration of the sugar solution ; 1 1(a)(v) any two from: measure mass of cylinders (instead of length) ; more intermediate concentrations of sugar solution ; extend the range of concentrations used ; repeat at each concentration / replicate the investigation ; soak for longer than 20 minutes ; use warmer sugar solutions (to speed up diffusion) ; keep all at same temp ; dry cylinders before measuring ; ensure timing is the same for each test-tube ; AVP ; 2 1(a)(vi) cut away from body / use wooden board or tile / cut on flat surface / keep blade away from body / dry before cutting / hold potato with forceps ; 1 Question Answer Marks Guidance 1(b) independent variable: 1 ref. to using at least 2 different temperatures ; method: 2 method of maintaining a temperature described ; 3 use of a tissue e.g. potato / leaves / root / stem, immersed in water / sugar / salt solution ; 4 method measuring dependent variable described, i.e. length / mass / volume / surface area of (cylinders / tissue / leaves) before and after (immersion) or measuring volume of immersion liquid before and after ; 5 + 6 variables kept constant ;; max two from: • same concentration (of solution) / same volume (of solution / water) • same (initial) length / volume / mass / surface area, of potato or tissue • same type / age /variety / AW, of (potato, tissue) / same potato / same plant • same pH / use a buffer • same immersion time 7 equilibration of temperature for tissue / solution ; 8 drying before reweighing (if mass measured) ; 9 at least two repeats (of each temperature) / total of three trials ; 10 AVP ; 6 1(c)(i) iodine solution ; blue-black ; 2 1(c)(ii) lines: clear, single, unbroken with no shading ; size: central cell has a minimum diameter of 56 mm ; detail one: double line (minimum) for entire cell wall ; detail two: minimum of five starch grains around perimeter of cell ; label: one starch grain labelled ; 5 Question Answer Marks Guidance 1(c)(iii) (length of line AB) 10 ±1 (mm) ; 0.013 (0.011–0.014) mm ;; 3 MP1 for correct measurement MP2 for correct calculation MP3 for correct rounding to two significant figures ecf MP2 & MP3 from previous step
Q2 · A student monitored their pulse rate after exercise
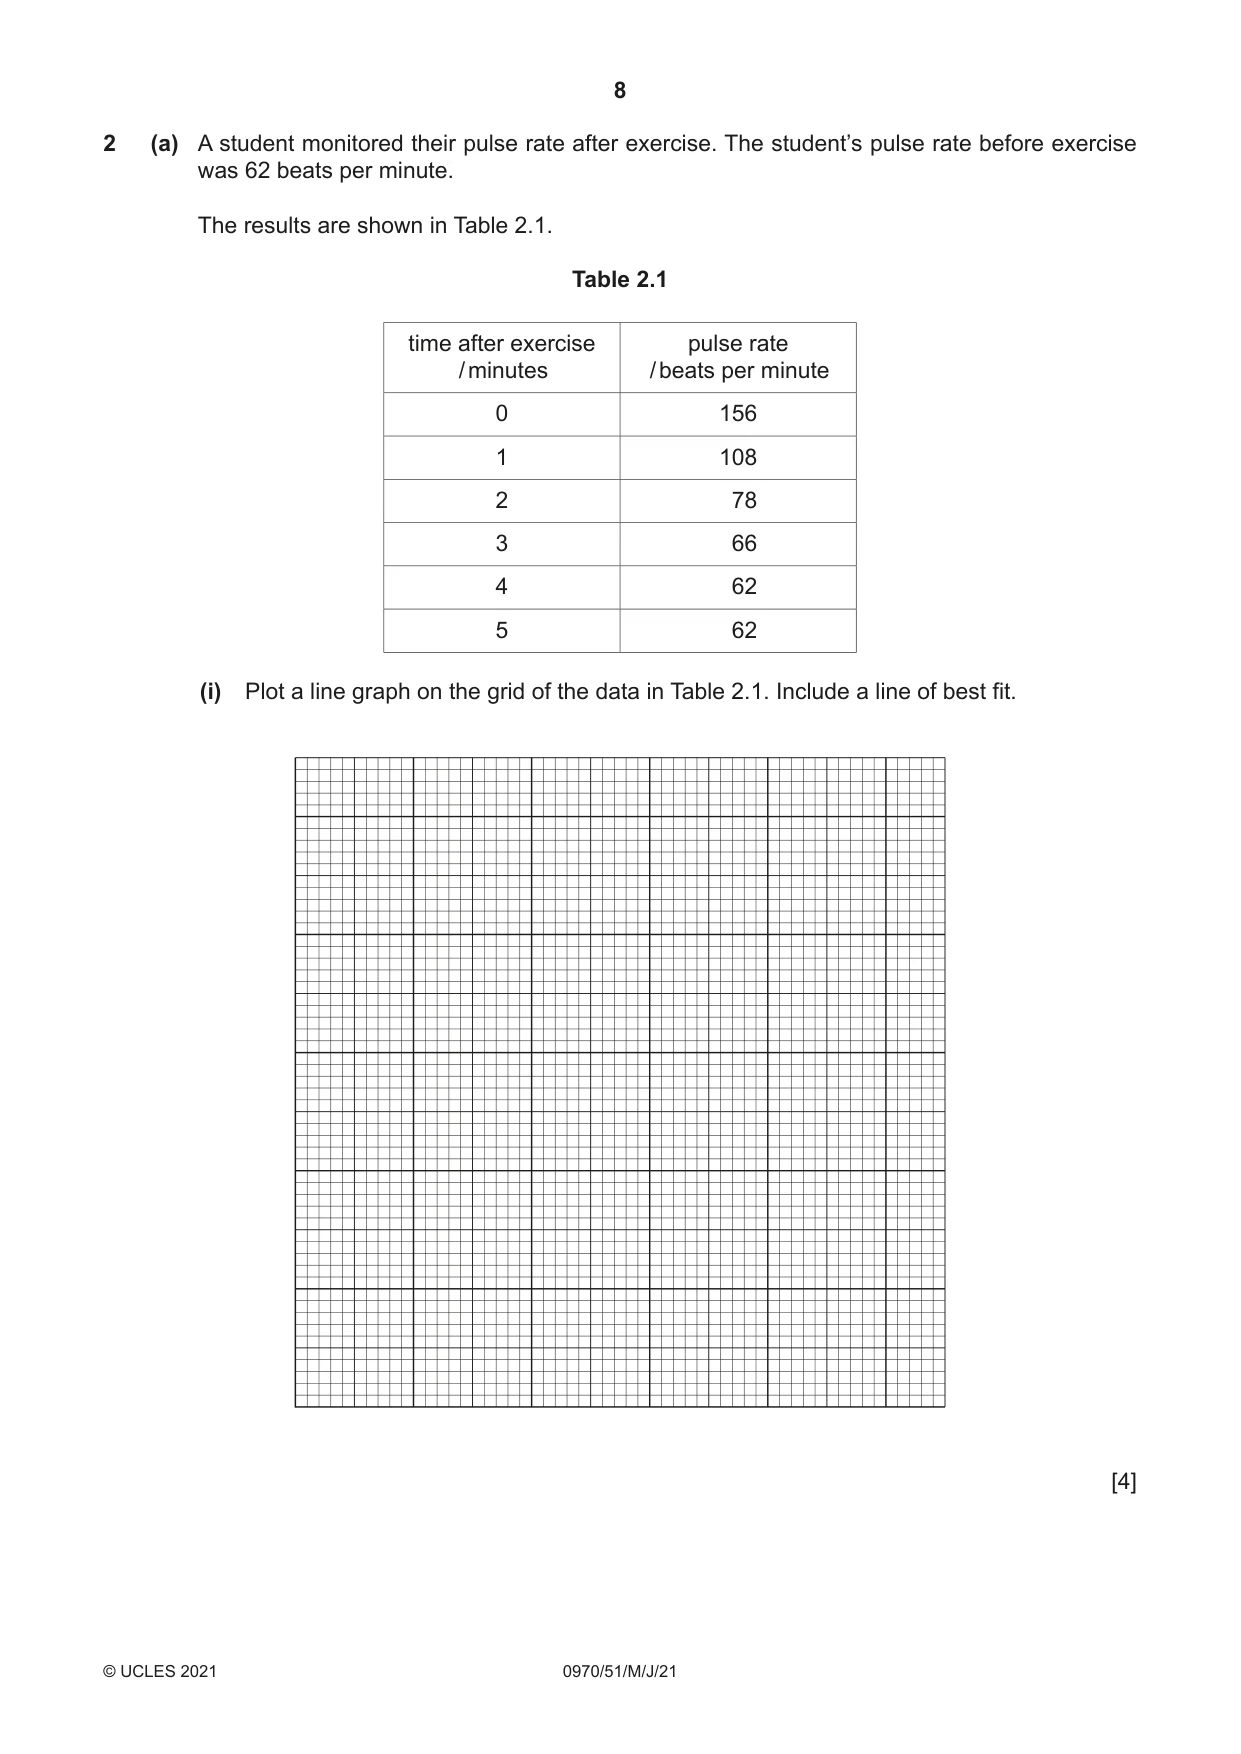
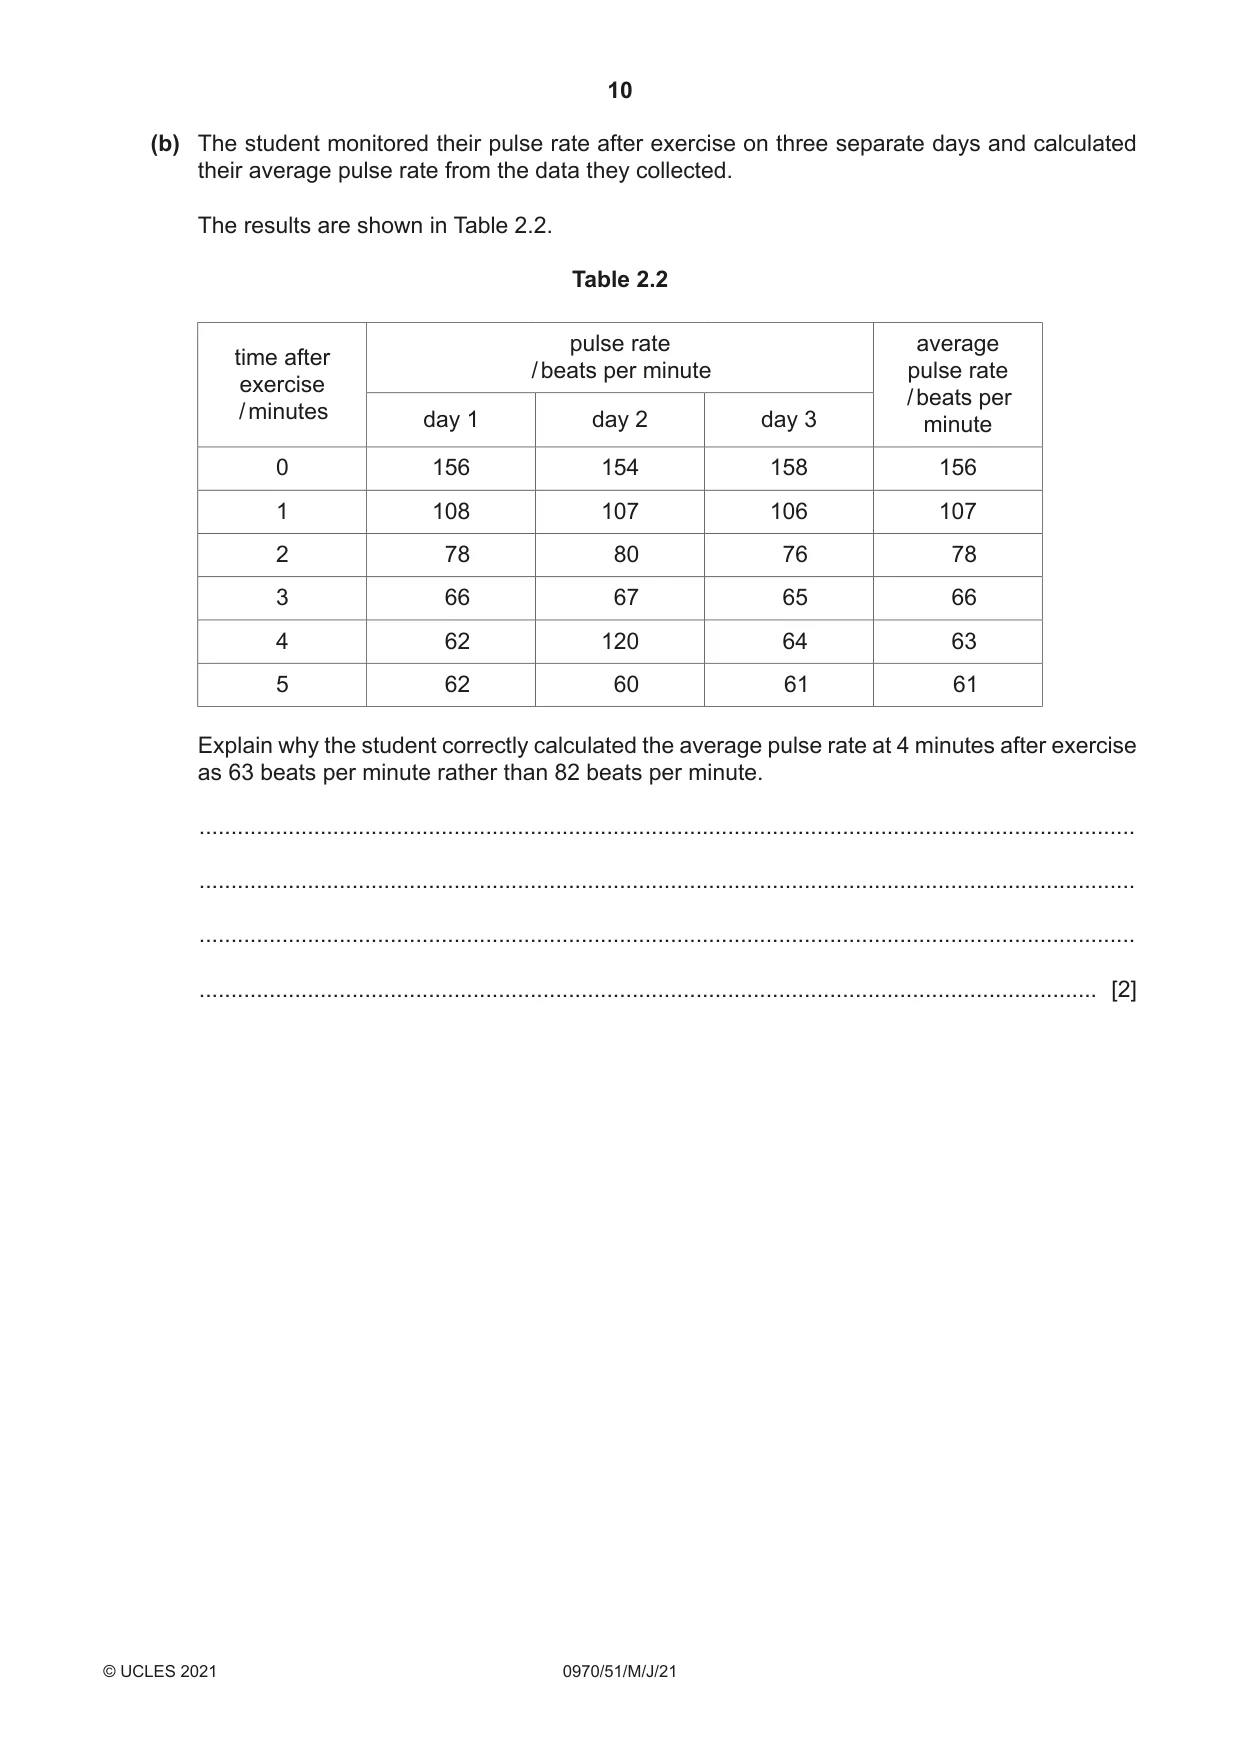
2 (a) A student monitored their pulse rate after exercise. The student’s pulse rate before exercise was 62 beats per minute. The results are shown in Table 2.1. Table 2.1 time after exercise pulse rate / minutes / beats per minute 0 156 1 108 2 78 3 66 4 62 5 62 (i) Plot a line graph on the grid of the data in Table 2.1. Include a line of best fit. [4] (ii) Describe the relationship shown in your graph, between pulse rate and time after exercise. ........................................................................................................................................... ........................................................................................................................................... ........................................................................................................................................... ........................................................................................................................................... ..................................................................................................................................... [2] (iii) Calculate the percentage change in pulse rate from 0 minutes to 5 minutes using the data in Table 2.1. Give your answer to two decimal places. Space for working. .............................................................% [3] (b) The student monitored their pulse rate after exercise on three separate days and calculated their average pulse rate from the data they collected. The results are shown in Table 2.2. Table 2.2 pulse rate average time after / beats per minute pulse rate exercise / beats per / minutes day 1 day 2 day 3 minute 0 156 154 158 156 1 108 107 106 107 2 78 80 76 78 3 66 67 65 66 4 62 120 64 63 5 62 60 61 61 Explain why the student correctly calculated the average pulse rate at 4 minutes after exercise as 63 beats per minute rather than 82 beats per minute. ................................................................................................................................................... ................................................................................................................................................... ................................................................................................................................................... ............................................................................................................................................. [2]
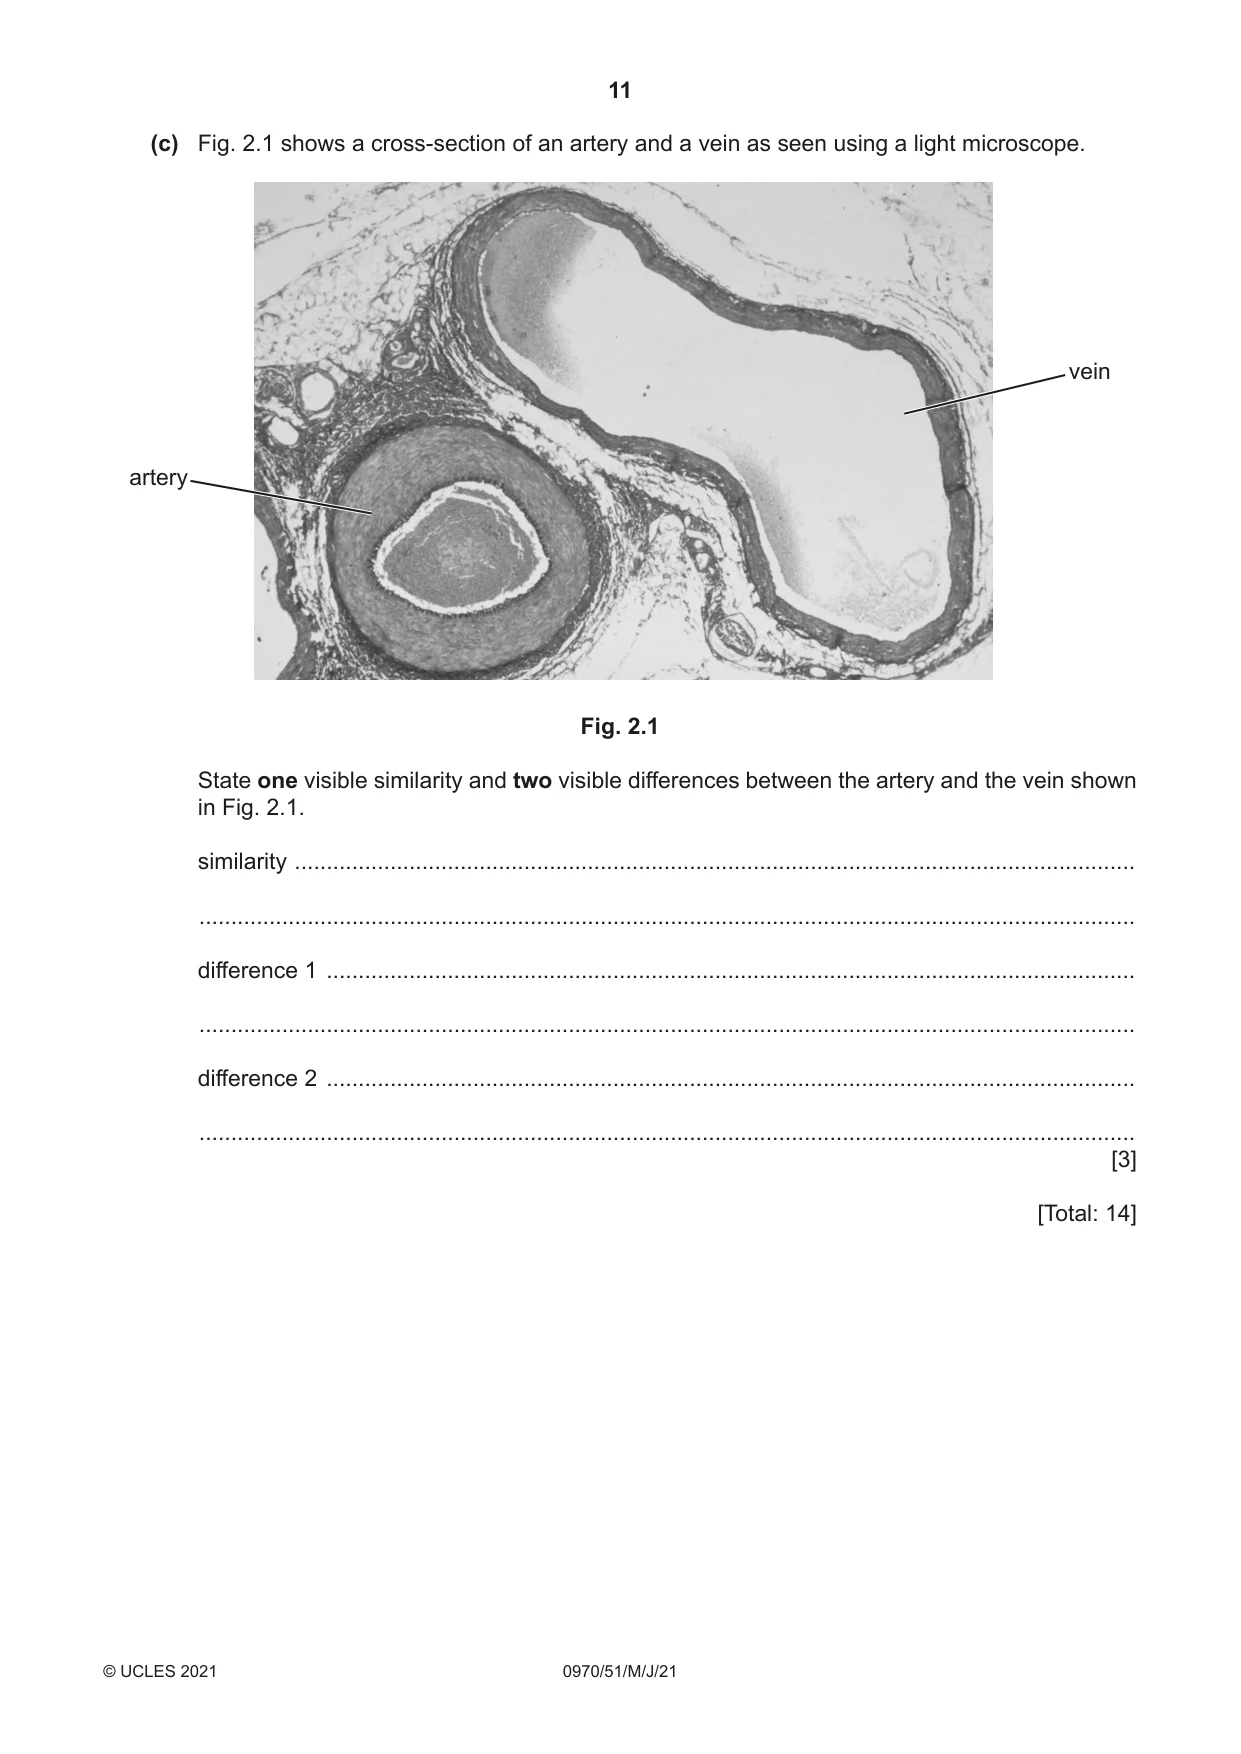
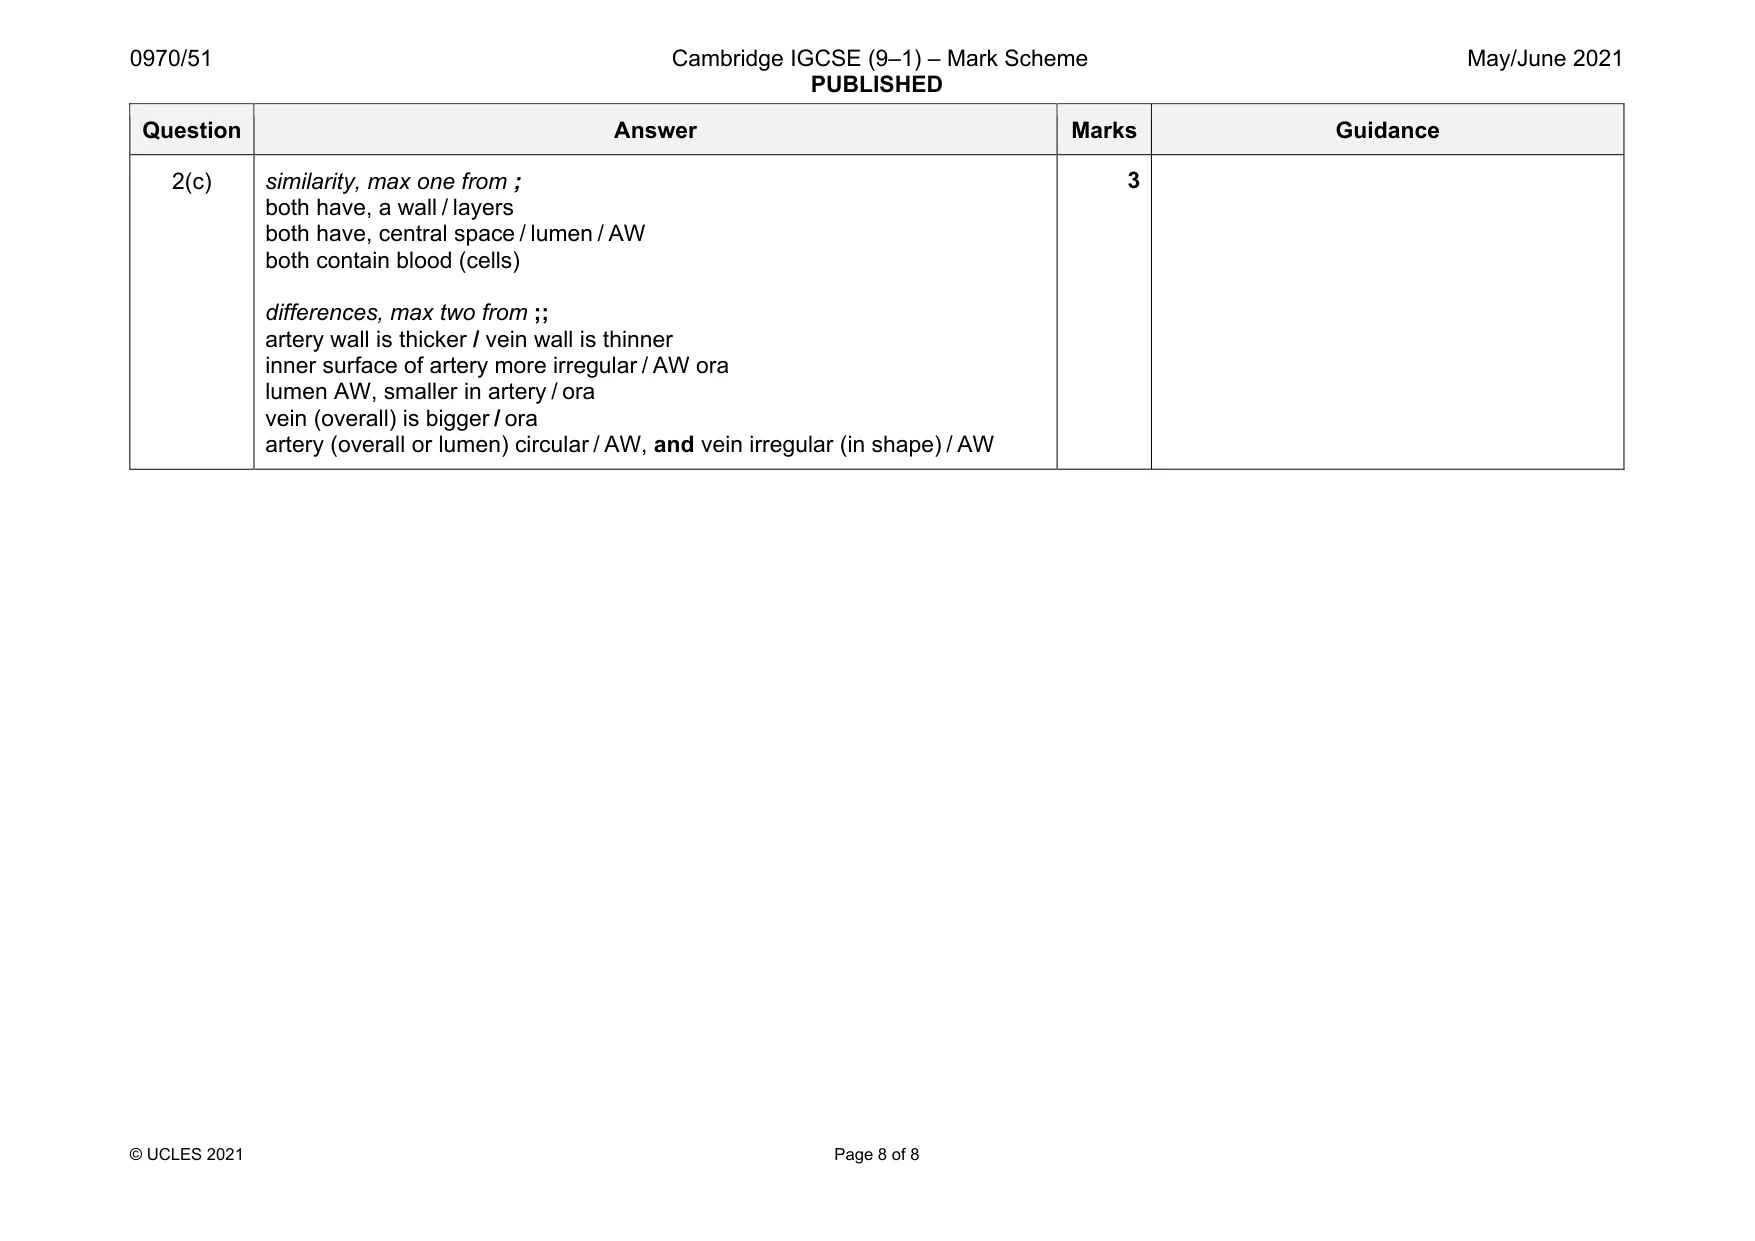
Mark scheme: 2(a)(i) axes: labelled with units as time (after exercise) / minutes and pulse rate / beats per minute or bpm ; scale: evenly scaled and plots occupying half of the grid in one direction ; plots: all correct ± half a small square ; line: smooth curve (through at least 4 plots) or plot points joined with ruled lines ; 2(a)(ii) any two from: pulse rate decreases as time increases / AW ; biggest decrease in pulse rate is in first, one / two, minute(s) / initially ; plateaus or levels off / returns to pre-exercise pulse rate / returns to 62 (bpm) (at 4 mins) ; 2 2(a)(iii) 60.26 (%) ;;; 3 MP1 selection of correct values from table 156 and 62 MP2 correct calculation e.g. (94 ÷ 156) × 100 = 60.2564 MP3 correct rounding to two decimal places ecf MP2 and MP3 from previous step 2(b) 120 bpm is an anomalous result / AW ; (idea that anomalous / AW data), should not be included in an average ; 2 Question Answer Marks Guidance 2(c) similarity, max one from ; both have, a wall / layers both have, central space / lumen / AW both contain blood (cells) differences, max two from ;; artery wall is thicker / vein wall is thinner inner surface of artery more irregular / AW ora lumen AW, smaller in artery / ora vein (overall) is bigger / ora artery (overall or lumen) circular / AW, and vein irregular (in shape) / AW 3
What was in this paper
The subtopics covered by these 2 questions, and how many questions each got. Open one in a new tab to see every Cambridge question on it.
What you needed in this session
Cambridge’s own grade thresholds for 2021 May/June, Paper 5 · Variant 1. A higher threshold means an easier paper — the bar moves with how the cohort did.