Cambridge IGCSE Biology (9-1) 0970 — 2019 May/June Paper 5 · Variant 1
0970/51/M/J/19 · 2 questions · 40 marks · ≈45 min
The question paper and its mark scheme, free to read here and free to download. This is Cambridge’s own paper, exactly as it was sat.
Question paper16 pages



Mark scheme8 pages
Answers below. Sit the paper first if you are practising.
Questions as text
Q1 · You are going to measure the distance moved by different concentrations of citric acid…
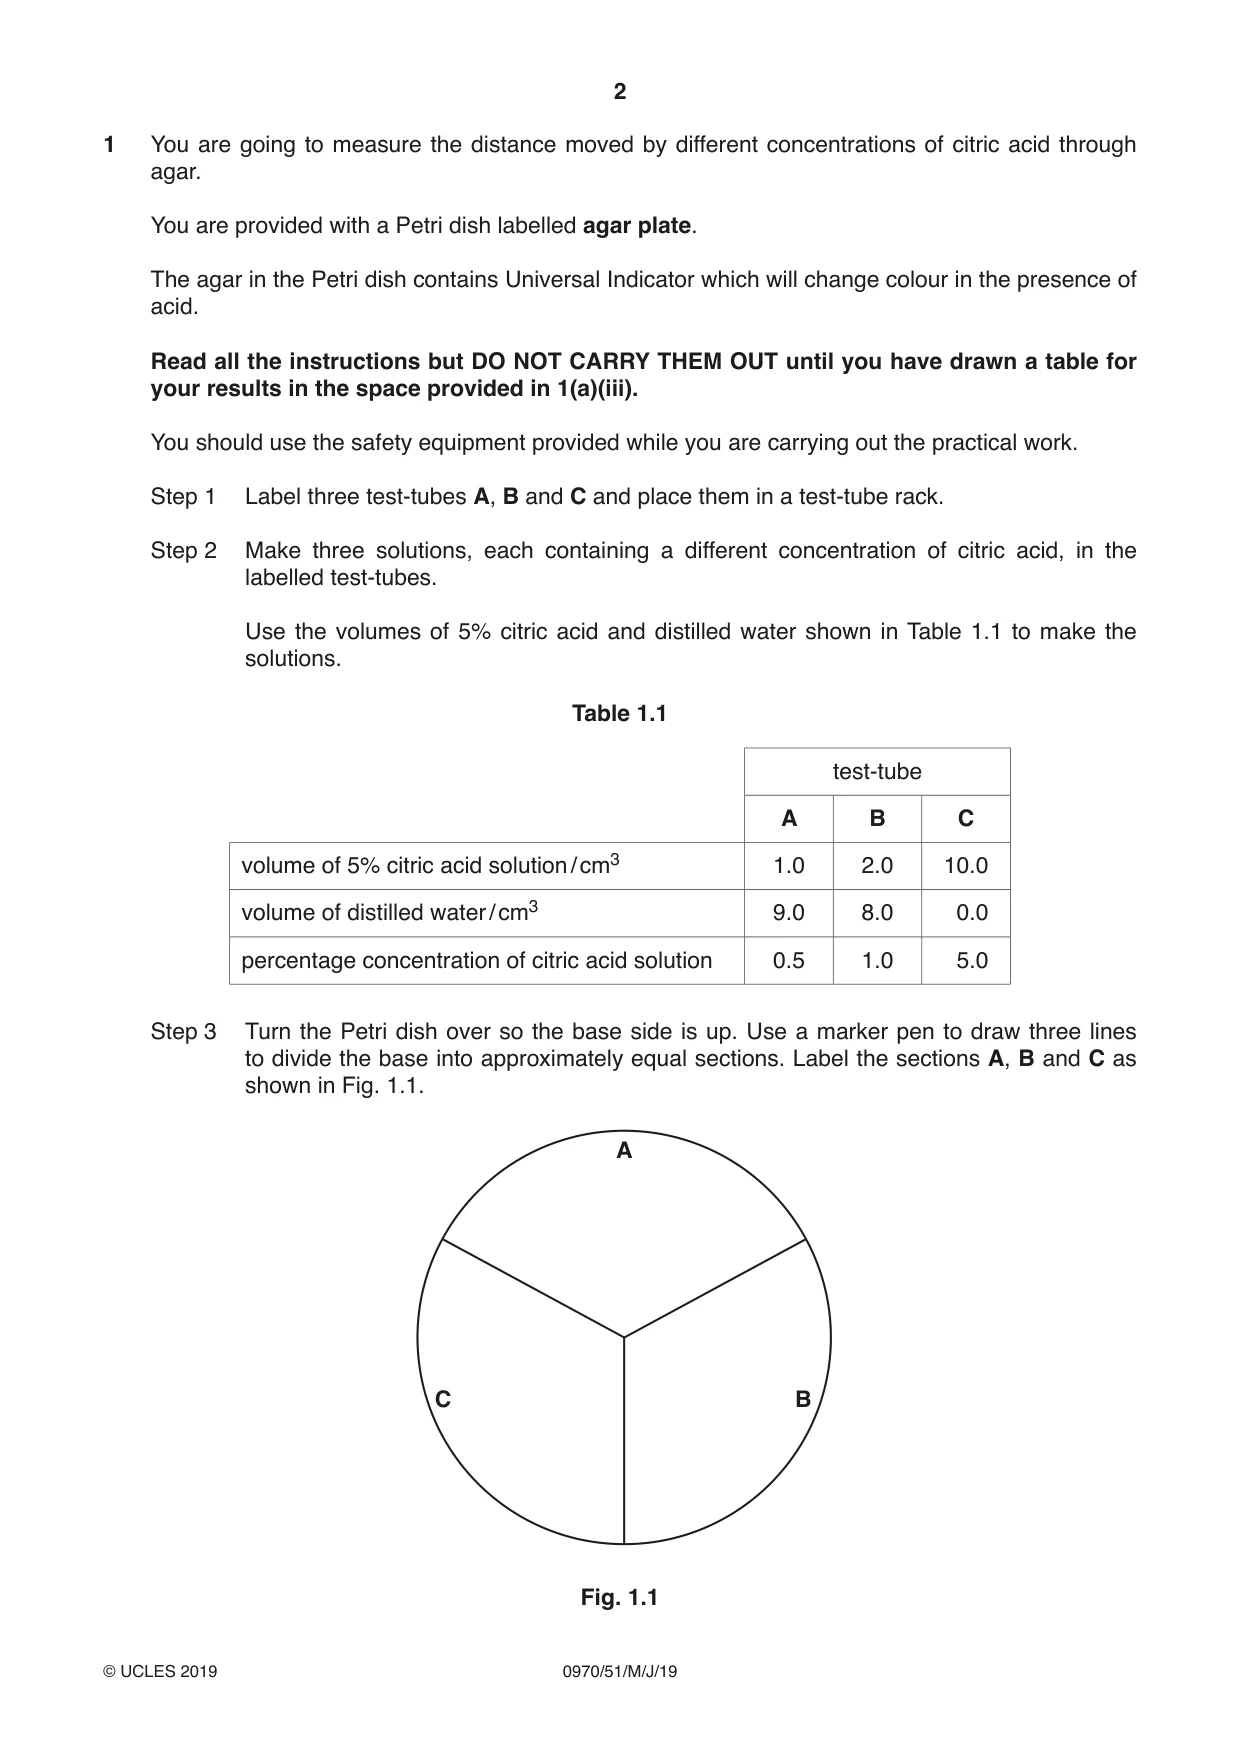
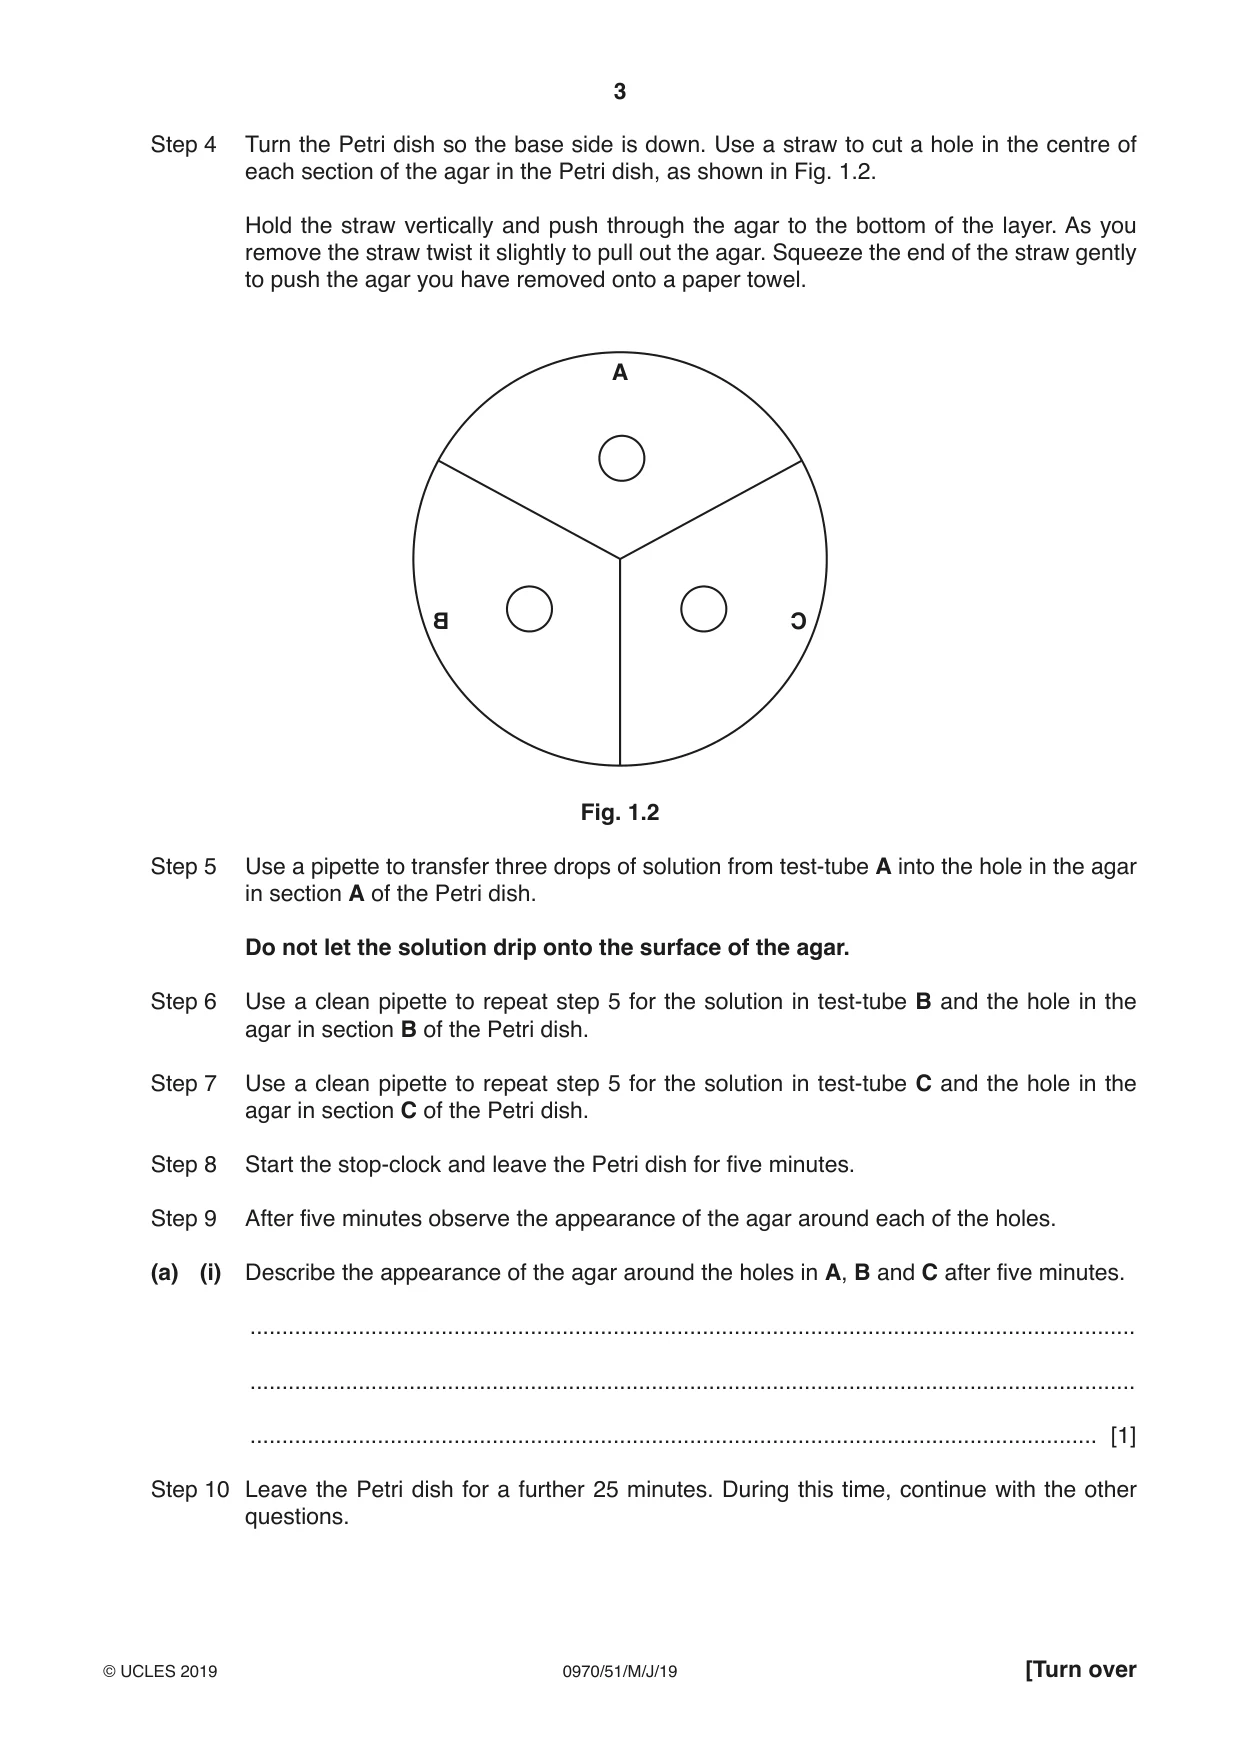
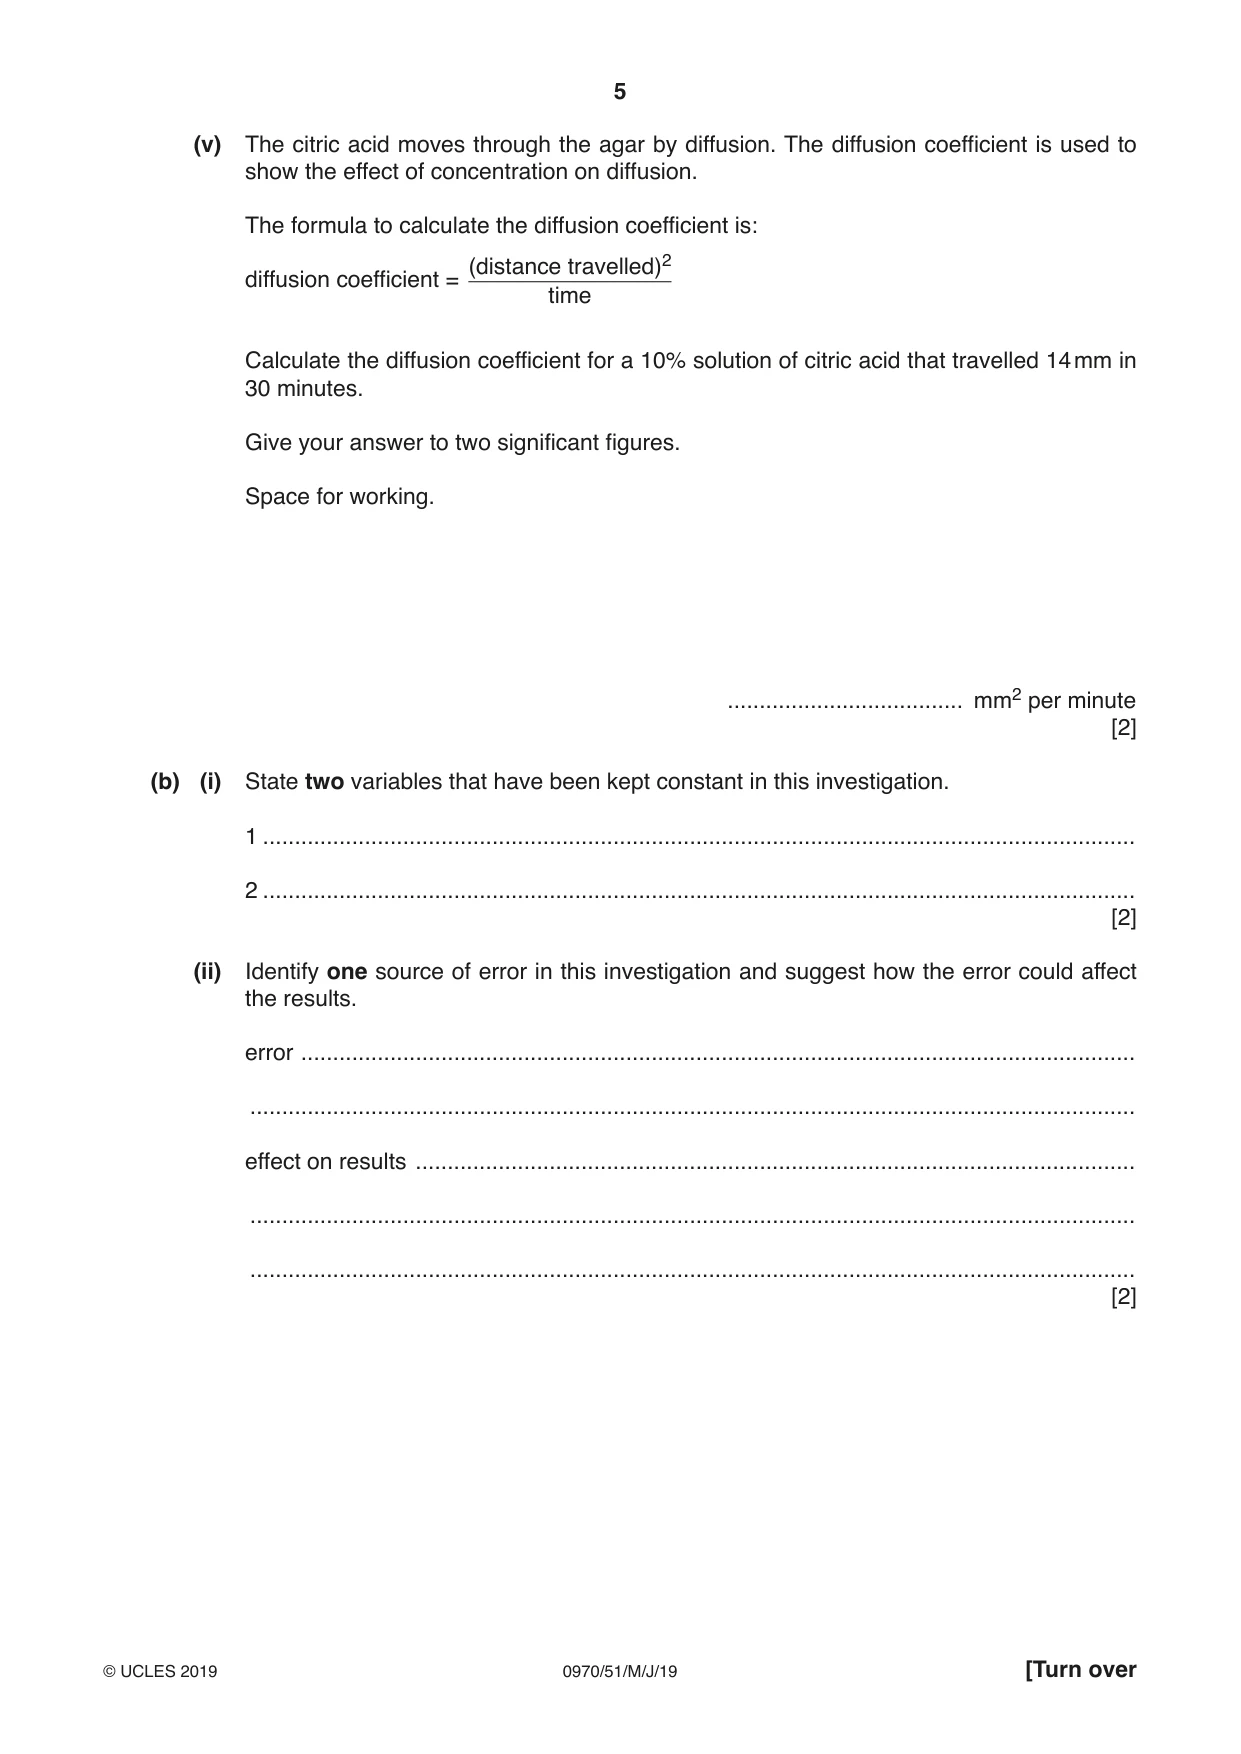
1 You are going to measure the distance moved by different concentrations of citric acid through agar. You are provided with a Petri dish labelled agar plate. The agar in the Petri dish contains Universal Indicator which will change colour in the presence of acid. Read all the instructions but DO NOT CARRY THEM OUT until you have drawn a table for your results in the space provided in 1(a)(iii). You should use the safety equipment provided while you are carrying out the practical work. Step 1 Label three test-tubes A, B and C and place them in a test-tube rack. Step 2 Make three solutions, each containing a different concentration of citric acid, in the labelled test-tubes. Use the volumes of 5% citric acid and distilled water shown in Table 1.1 to make the solutions. Table 1.1 test-tube A B C volume of 5% citric acid solution / cm3 1.0 2.0 10.0 volume of distilled water / cm3 9.0 8.0 0.0 percentage concentration of citric acid solution 0.5 1.0 5.0 Step 3 Turn the Petri dish over so the base side is up. Use a marker pen to draw three lines to divide the base into approximately equal sections. Label the sections A, B and C as shown in Fig. 1.1. A C B Fig. 1.1 Step 4 Turn the Petri dish so the base side is down. Use a straw to cut a hole in the centre of each section of the agar in the Petri dish, as shown in Fig. 1.2. Hold the straw vertically and push through the agar to the bottom of the layer. As you remove the straw twist it slightly to pull out the agar. Squeeze the end of the straw gently to push the agar you have removed onto a paper towel. A B C Fig. 1.2 Step 5 Use a pipette to transfer three drops of solution from test-tube A into the hole in the agar in section A of the Petri dish. Do not let the solution drip onto the surface of the agar.
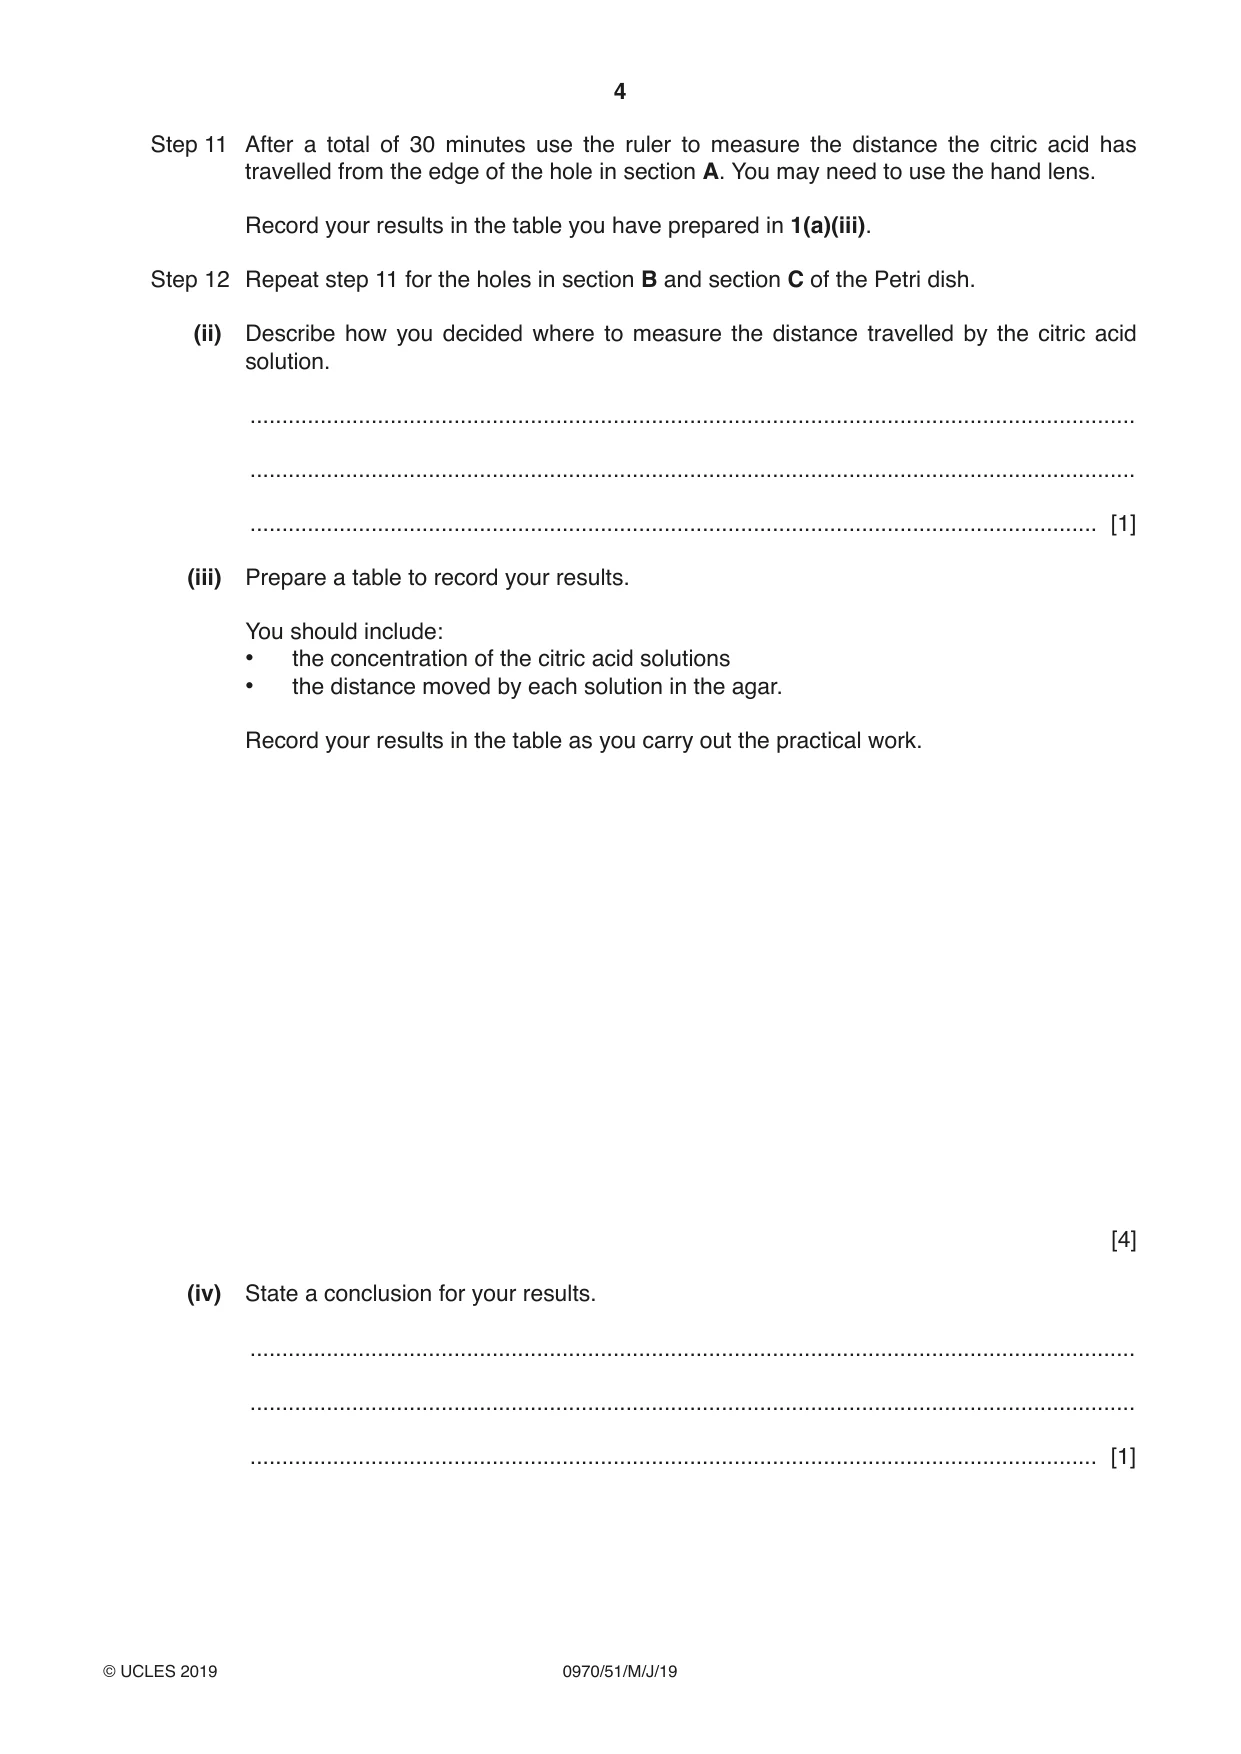
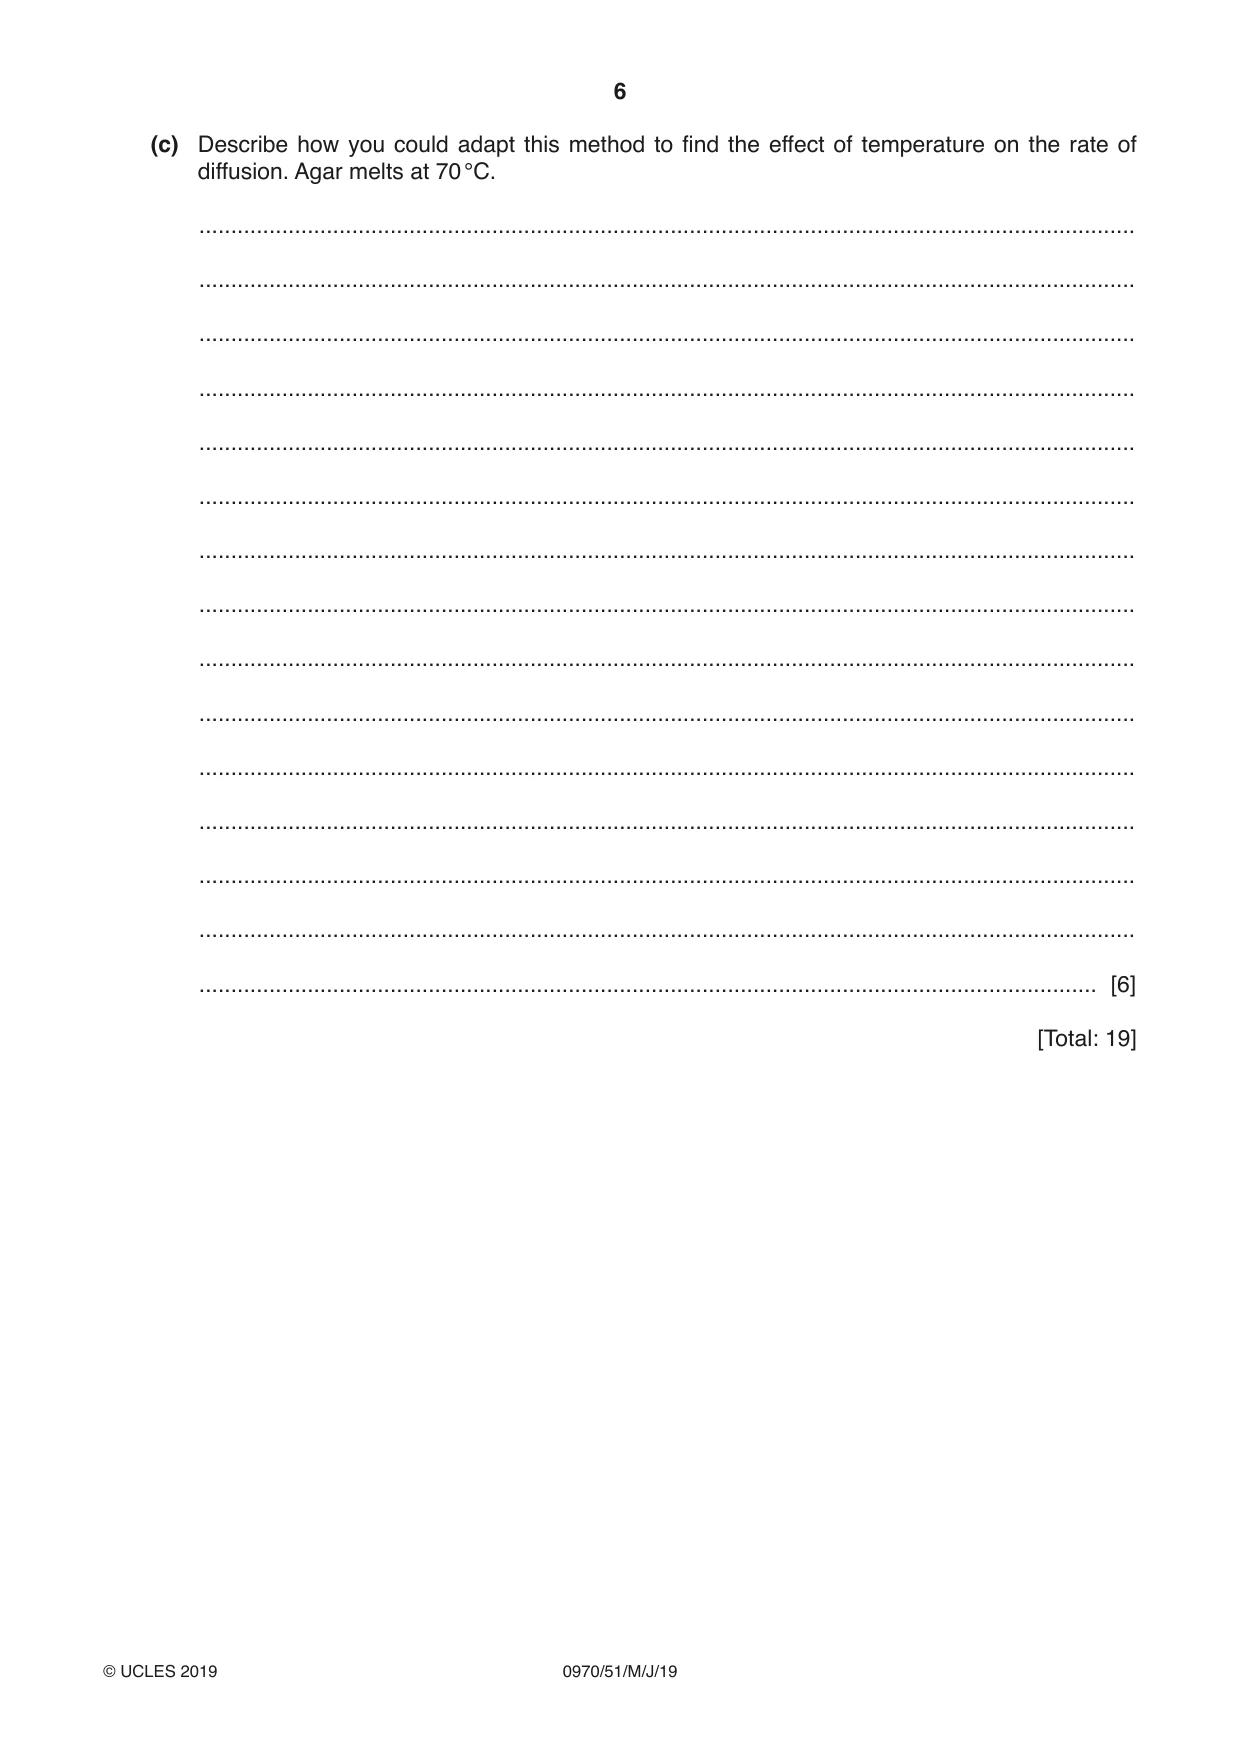
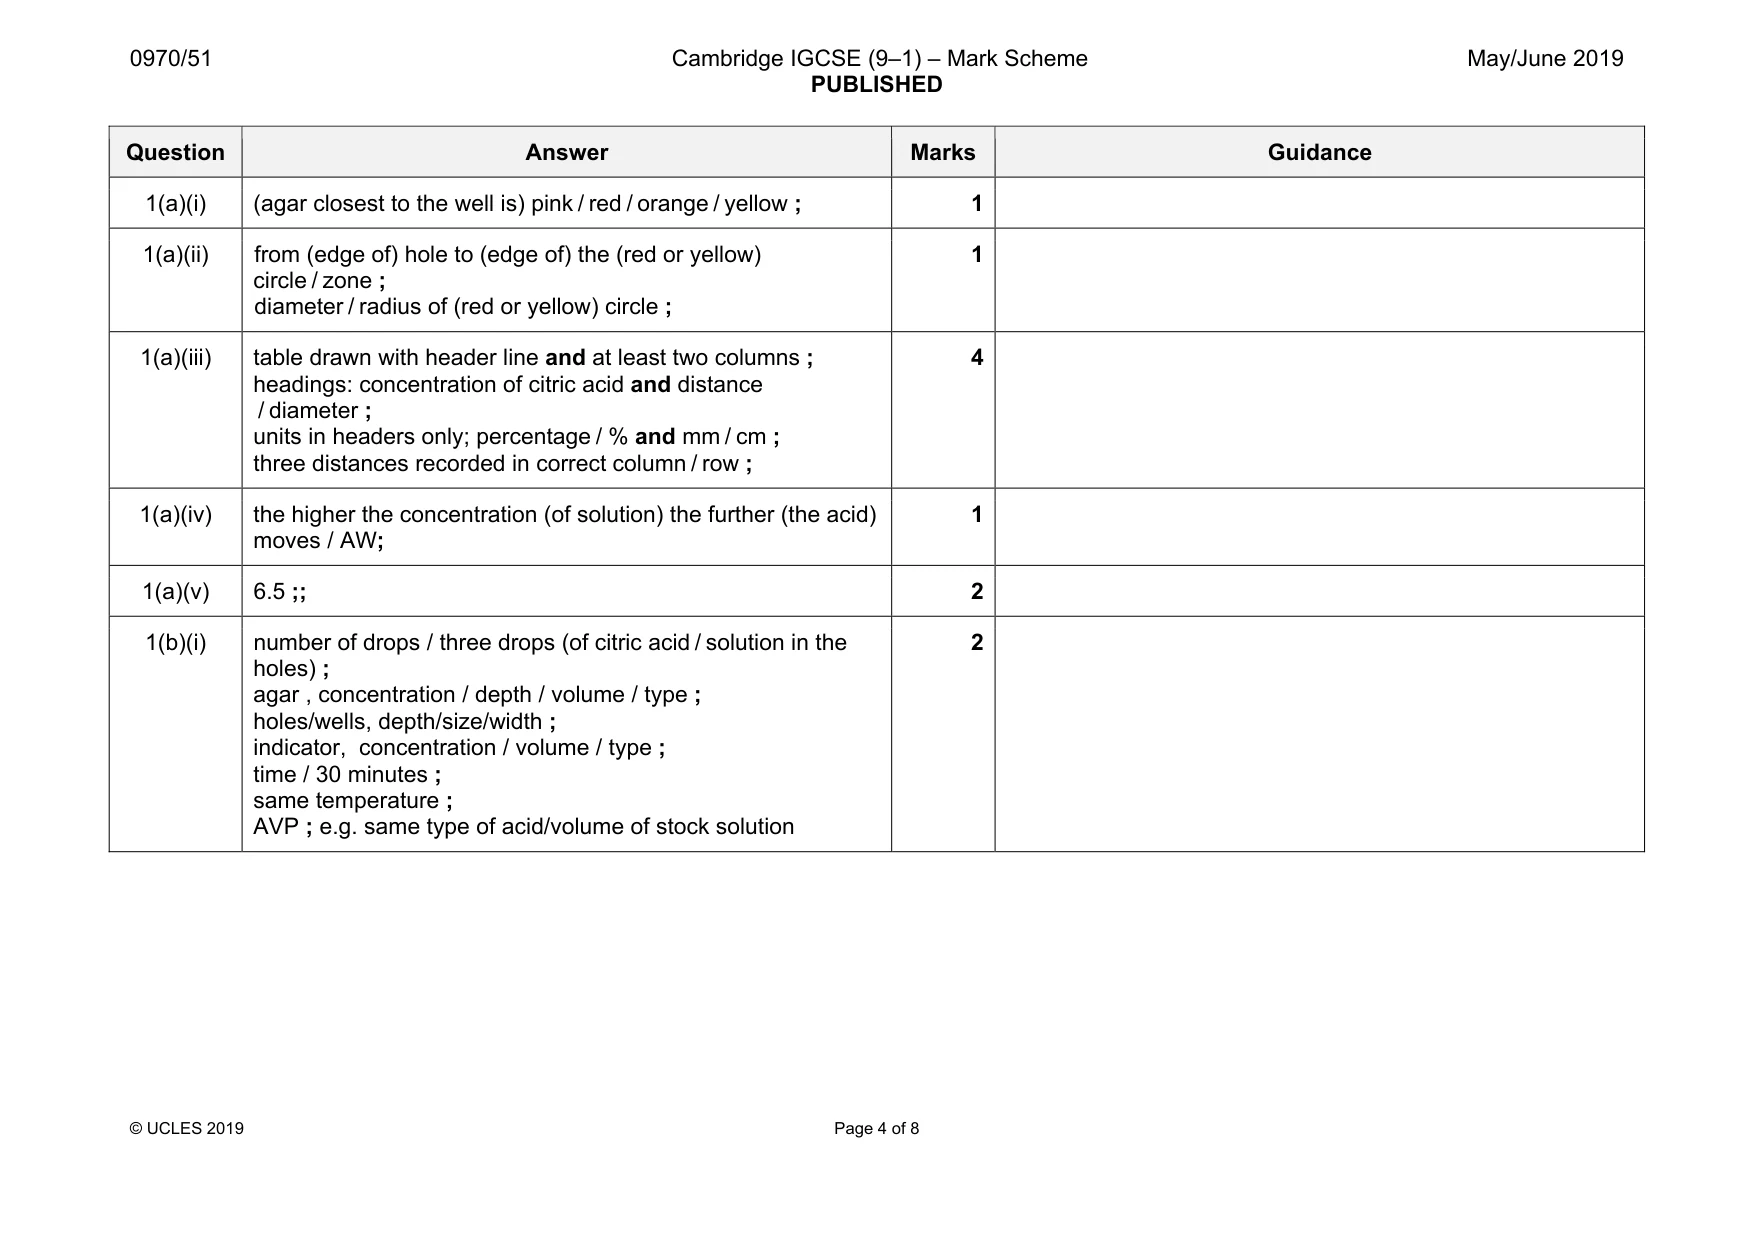
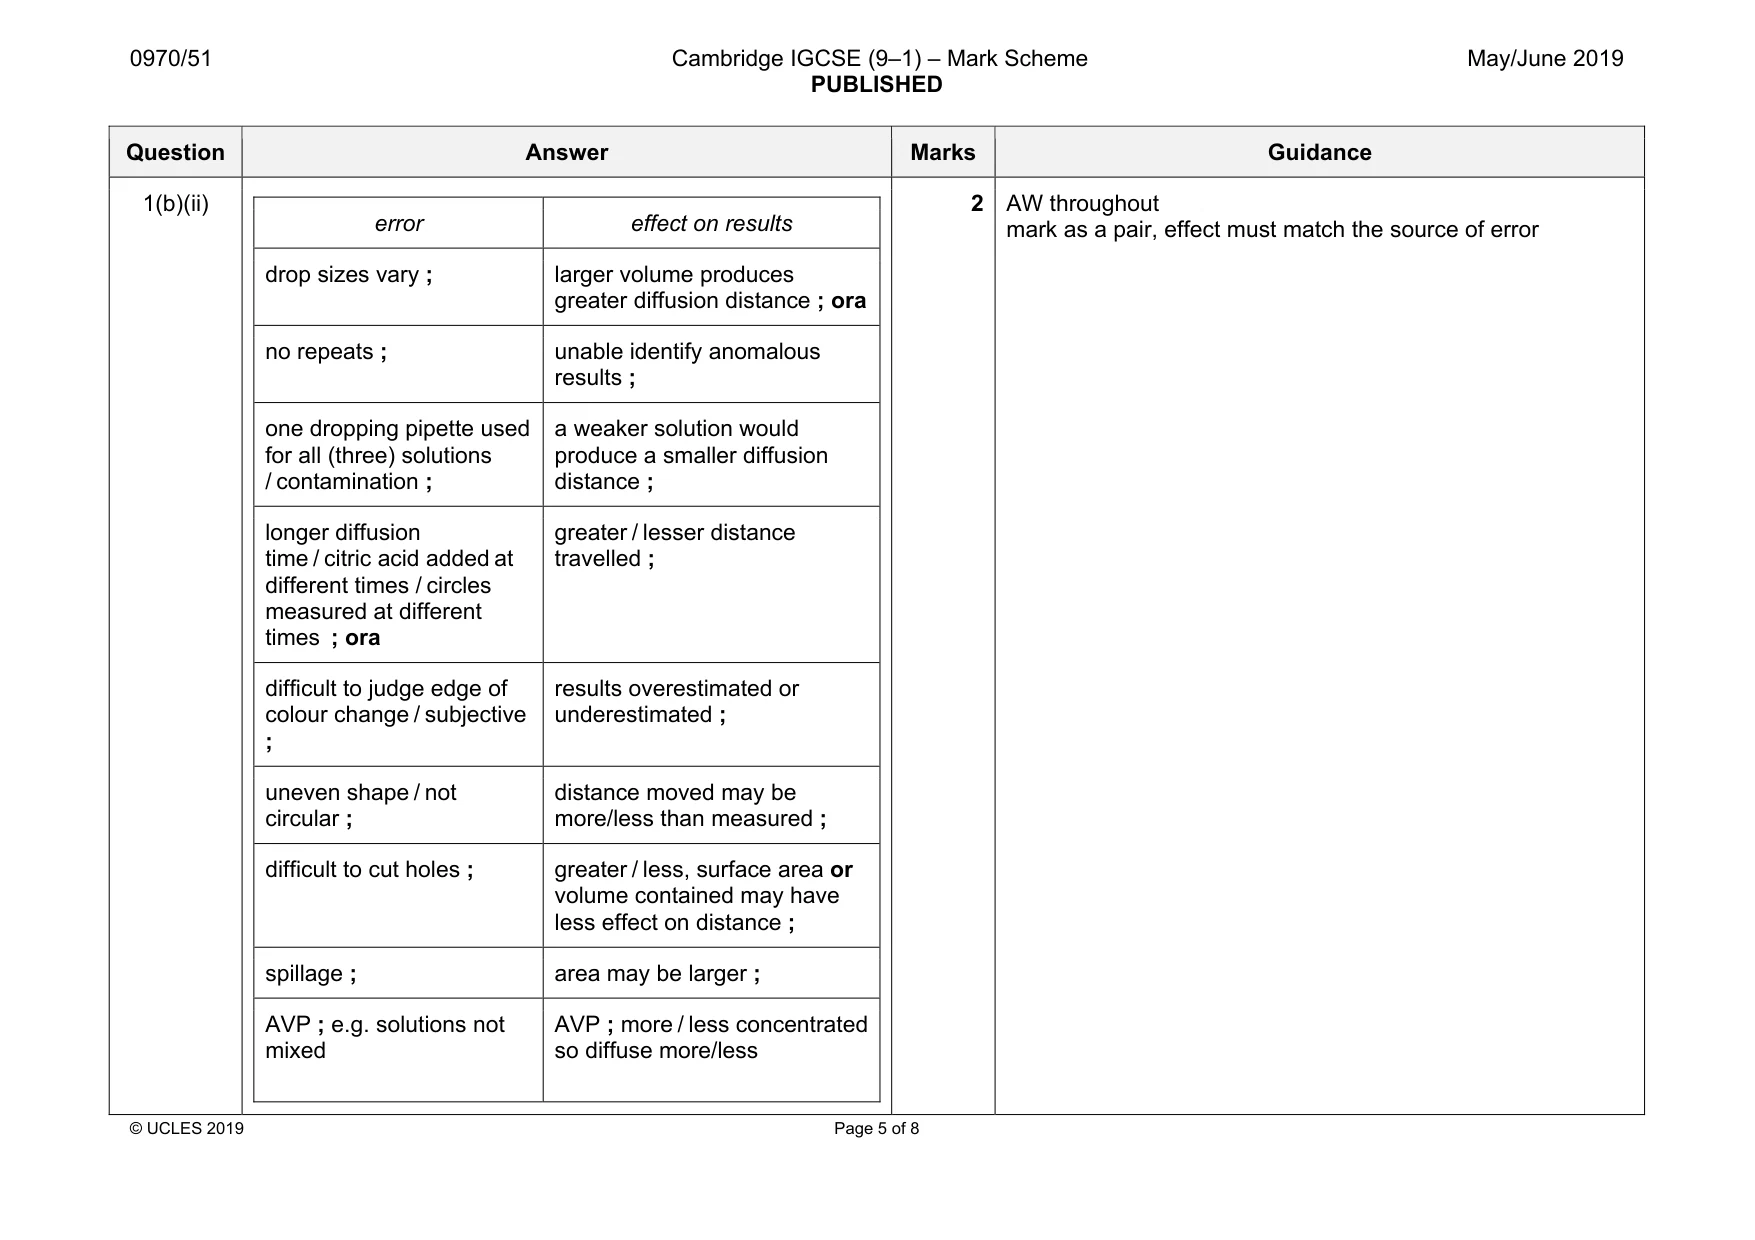
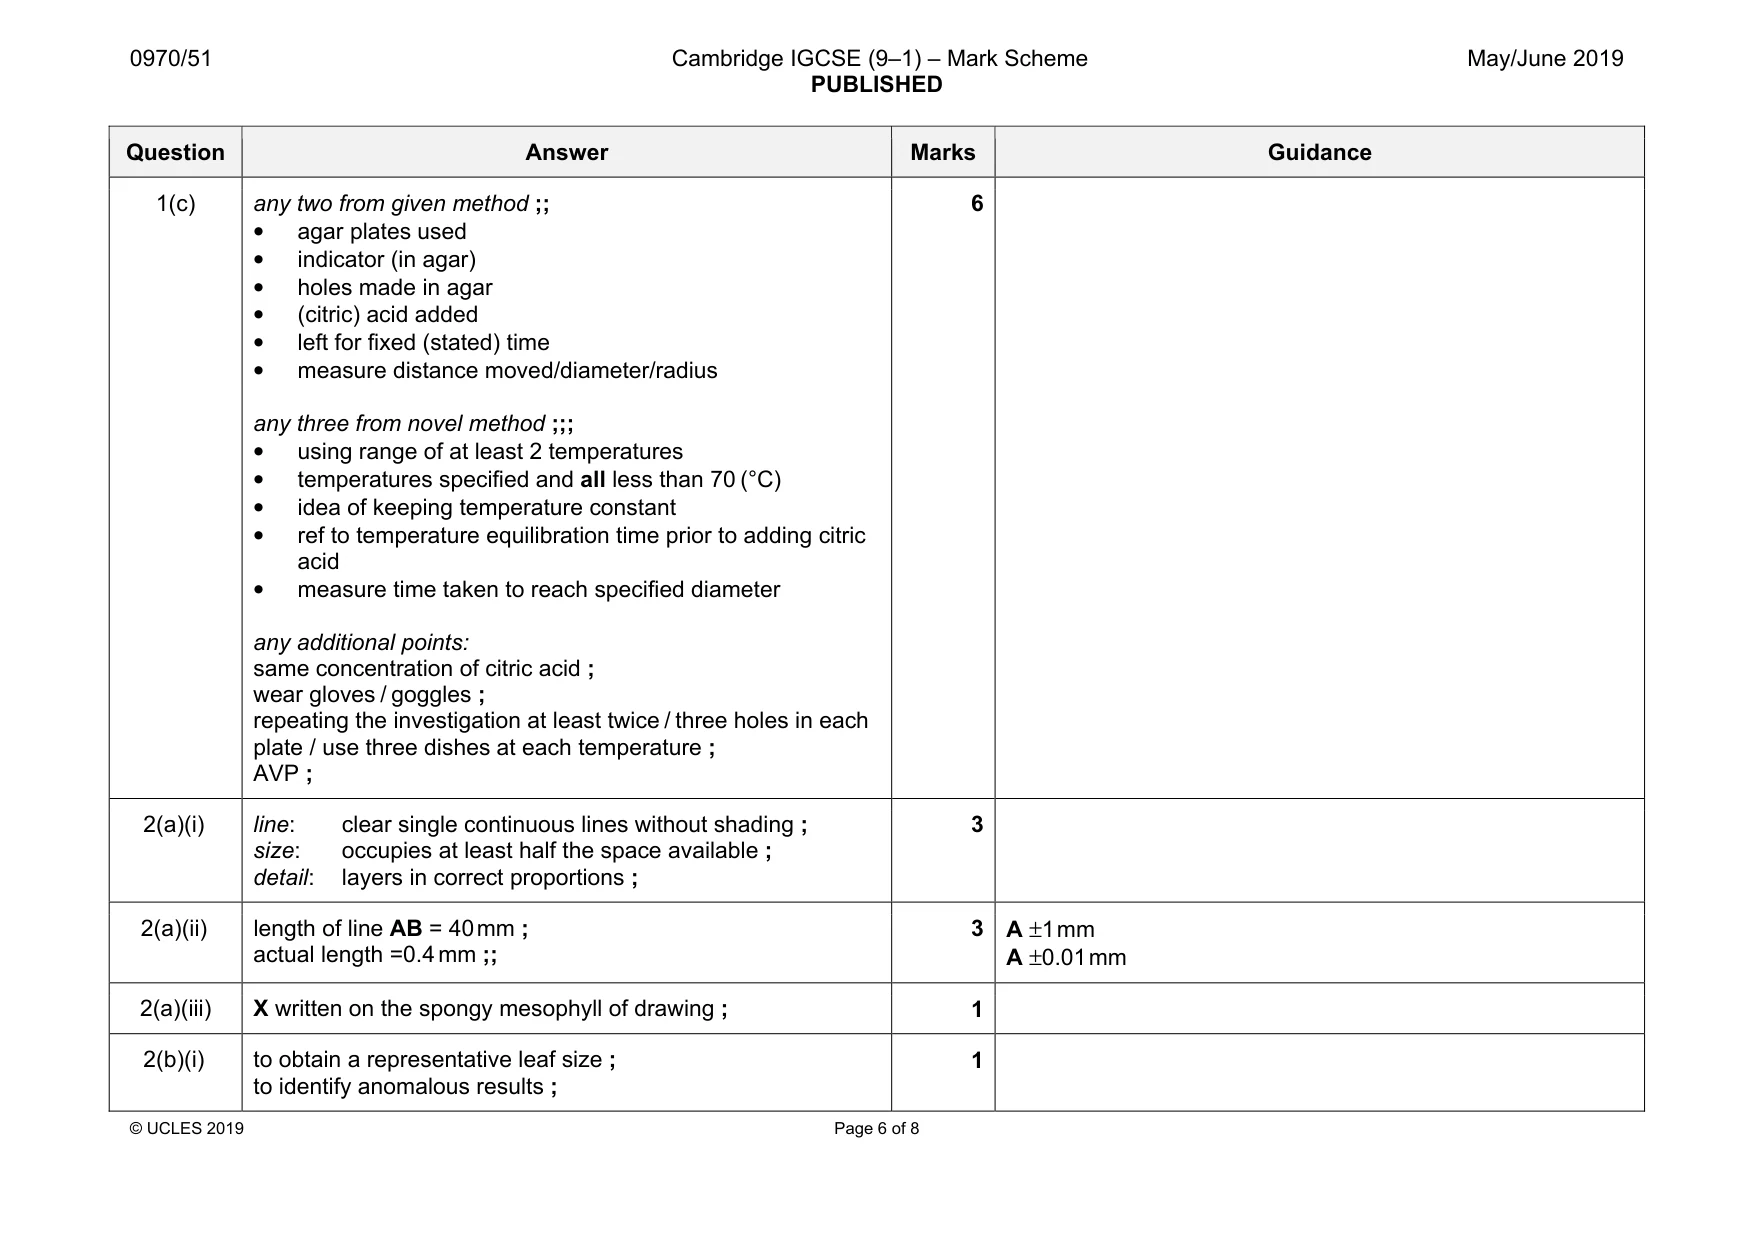
Mark scheme: 1(a)(i) (agar closest to the well is) pink / red / orange / yellow ; 1 1(a)(ii) from (edge of) hole to (edge of) the (red or yellow) circle / zone ; diameter / radius of (red or yellow) circle ; 1 1(a)(iii) table drawn with header line and at least two columns ; headings: concentration of citric acid and distance / diameter ; units in headers only; percentage / % and mm / cm ; three distances recorded in correct column / row ; 4 1(a)(iv) the higher the concentration (of solution) the further (the acid) moves / AW; 1 1(a)(v) 6.5 ;; 2 1(b)(i) number of drops / three drops (of citric acid / solution in the holes) ; agar , concentration / depth / volume / type ; holes/wells, depth/size/width ; indicator, concentration / volume / type ; time / 30 minutes ; same temperature ; AVP ; e.g. same type of acid/volume of stock solution 2 Question Answer Marks Guidance 1(b)(ii) error effect on results drop sizes vary ; larger volume produces greater diffusion distance ; ora no repeats ; unable identify anomalous results ; one dropping pipette used for all (three) solutions / contamination ; a weaker solution would produce a smaller diffusion distance ; longer diffusion time / citric acid added at different times / circles measured at different times ; ora greater / lesser distance travelled ; difficult to judge edge of colour change / subjective ; results overestimated or underestimated ; uneven shape / not circular ; distance moved may be more/less than measured ; difficult to cut holes ; greater / less, surface area or volume contained may have less effect on distance ; spillage ; area may be larger ; AVP ; e.g. solutions not mixed AVP ; more / less concentrated so diffuse more/less 2 AW throughout mark as a pair, effect must match the source of error Question Answer Marks Guidance 1(c) any two from given method ;; • agar plates used • indicator (in agar) • holes made in agar • (citric) acid added • left for fixed (stated) time • measure distance moved/diameter/radius any three from novel method ;;; • using range of at least 2 temperatures • temperatures specified and all less than 70 (°C) • idea of keeping temperature constant • ref to temperature equilibration time prior to adding citric acid • measure time taken to reach specified diameter any additional points: same concentration of citric acid ; wear gloves / goggles ; repeating the investigation at least twice / three holes in each plate / use three dishes at each temperature ; AVP ; 6
Q2 · A photomicrograph of a cross-section of part of a leaf
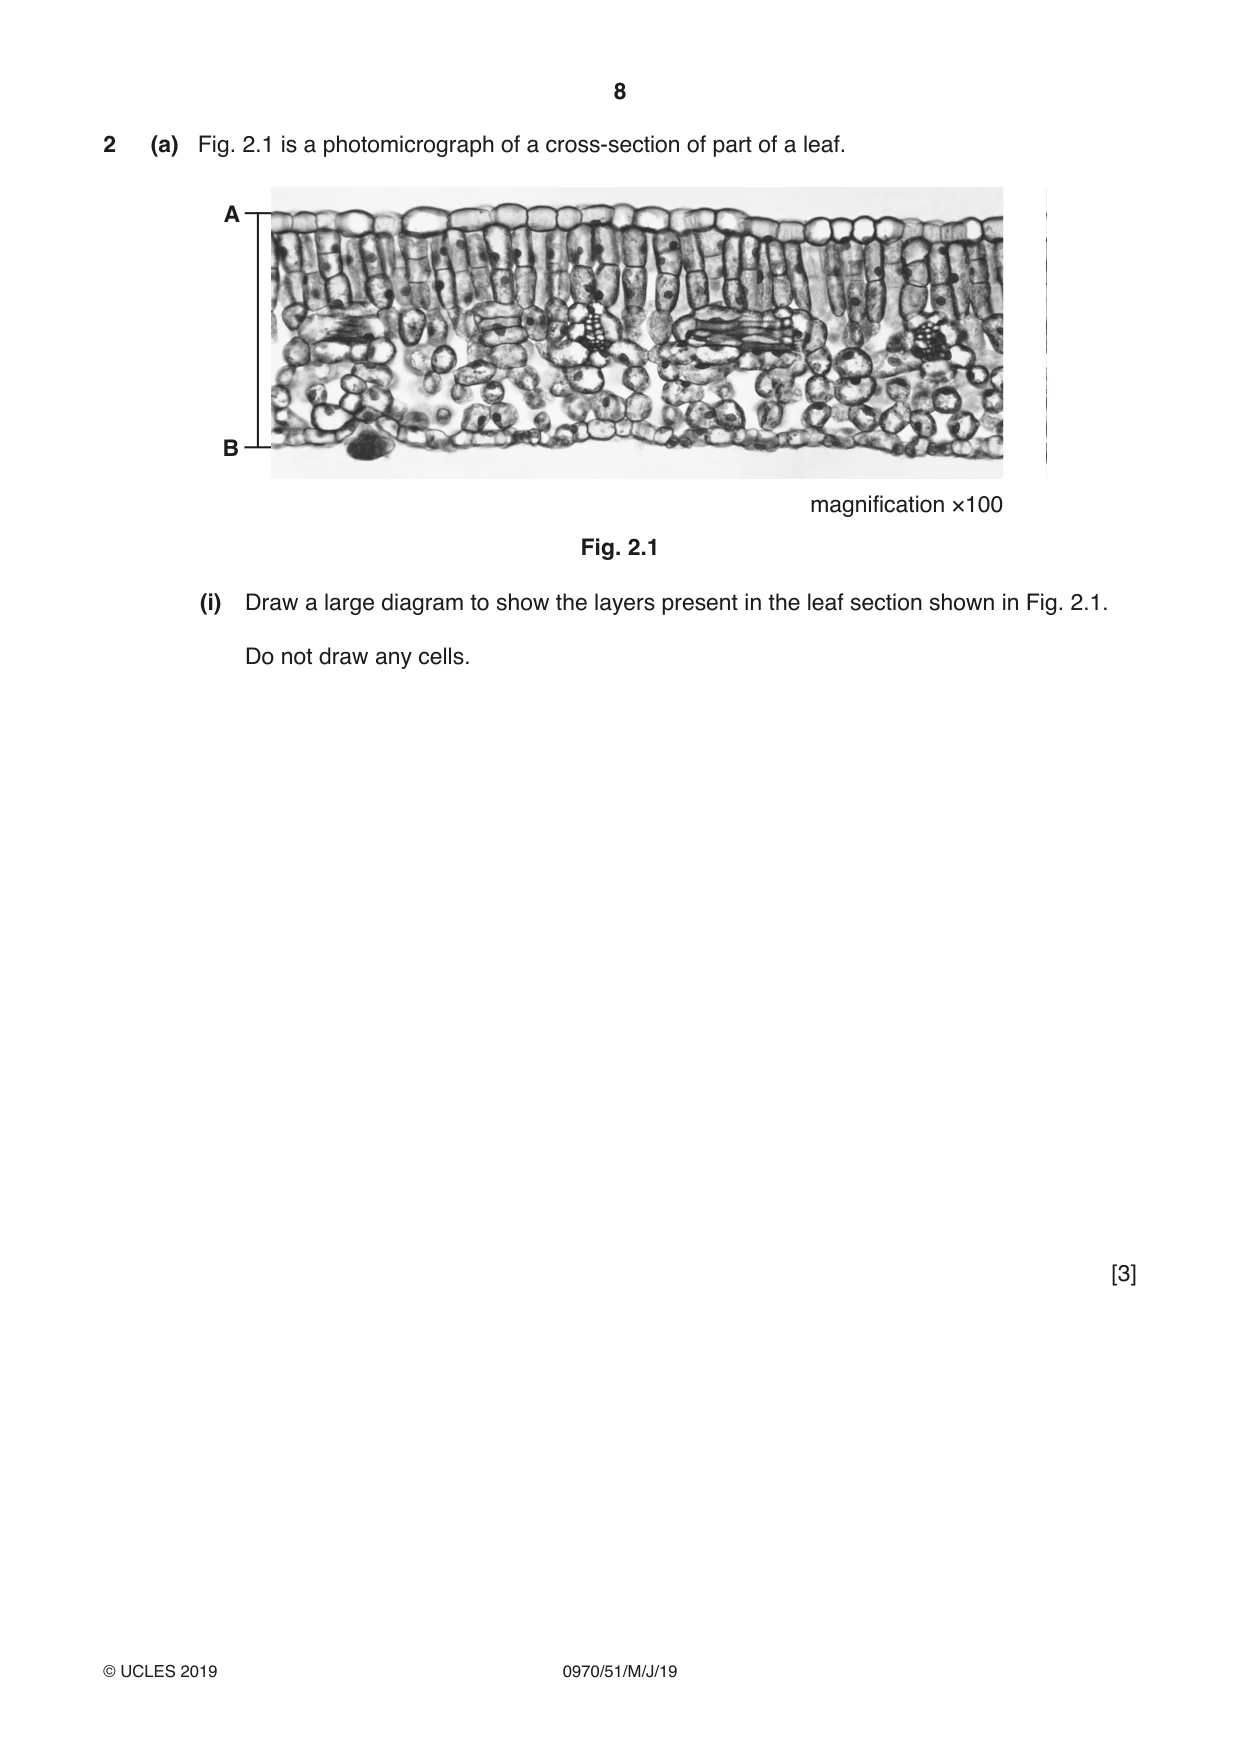
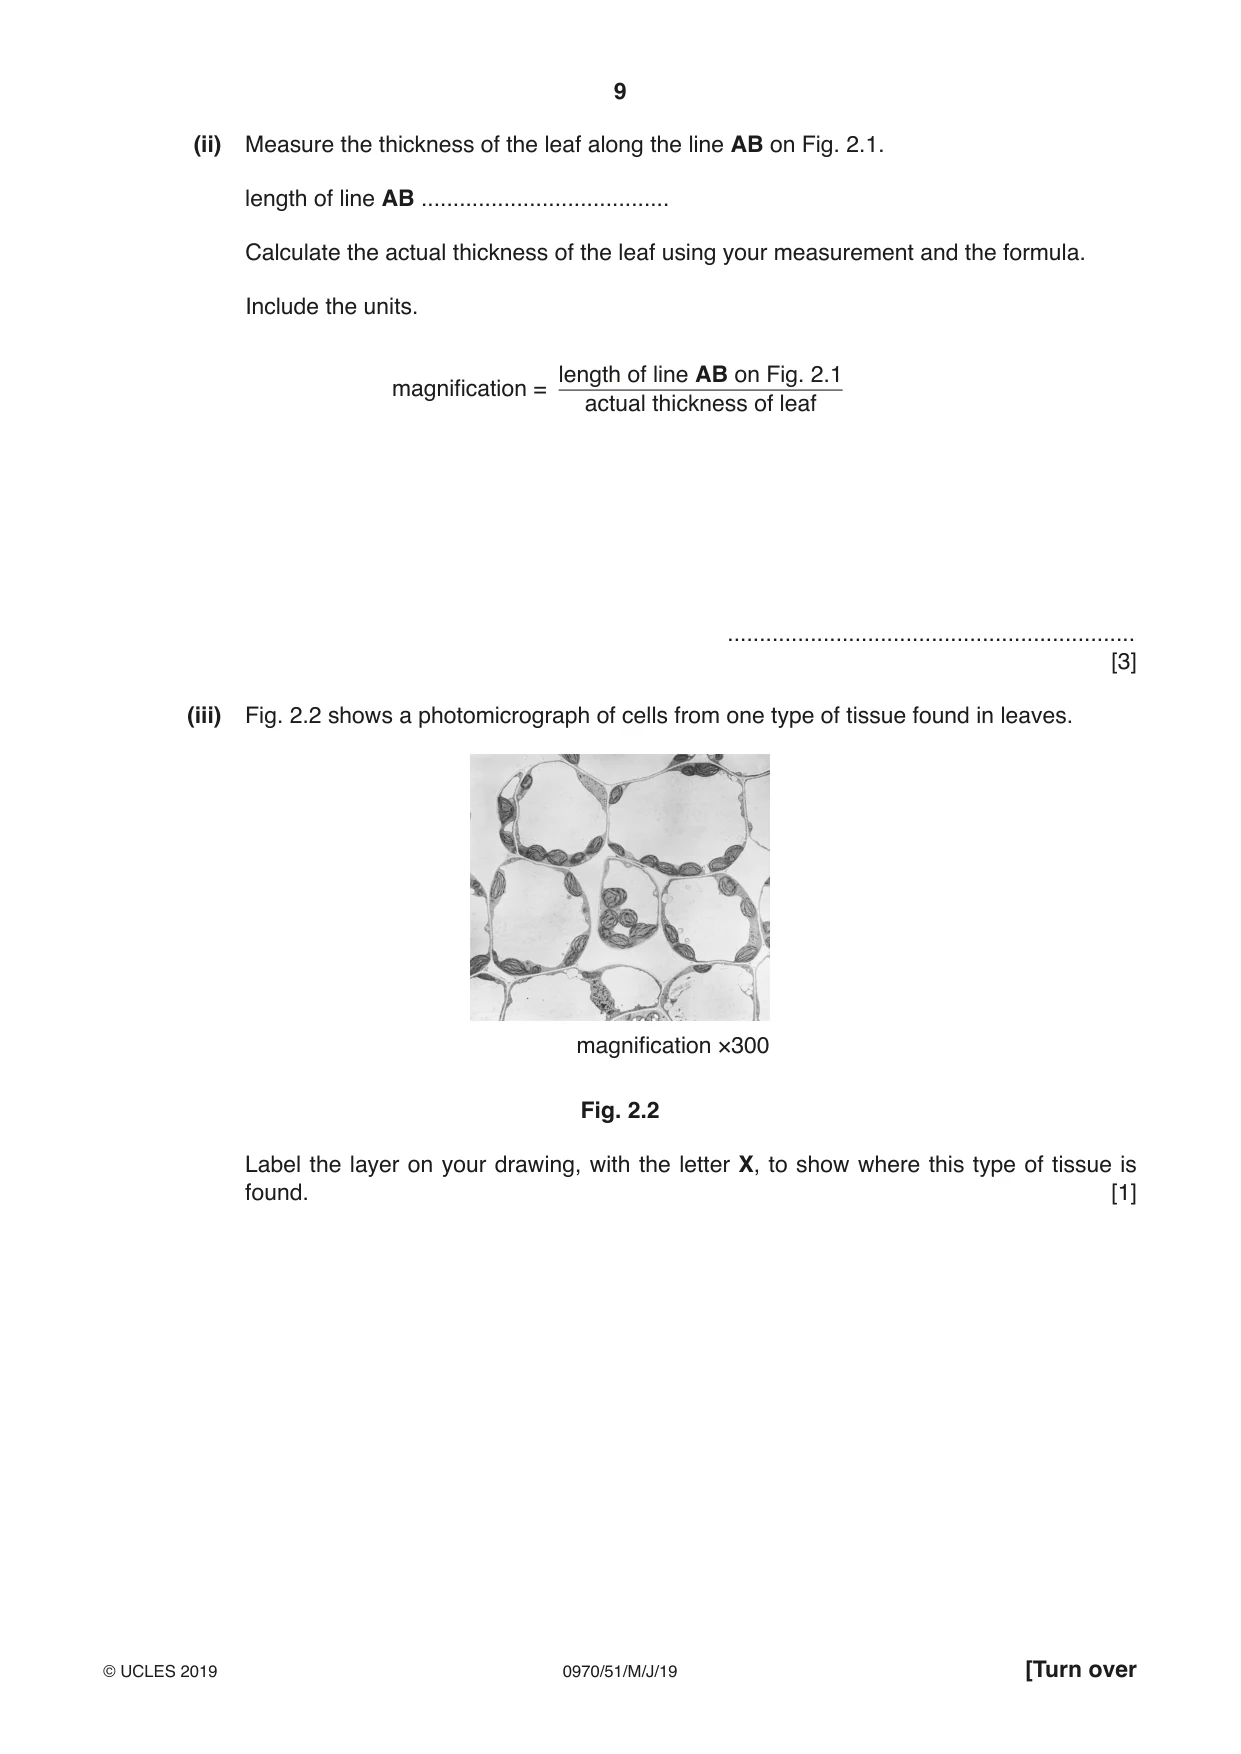
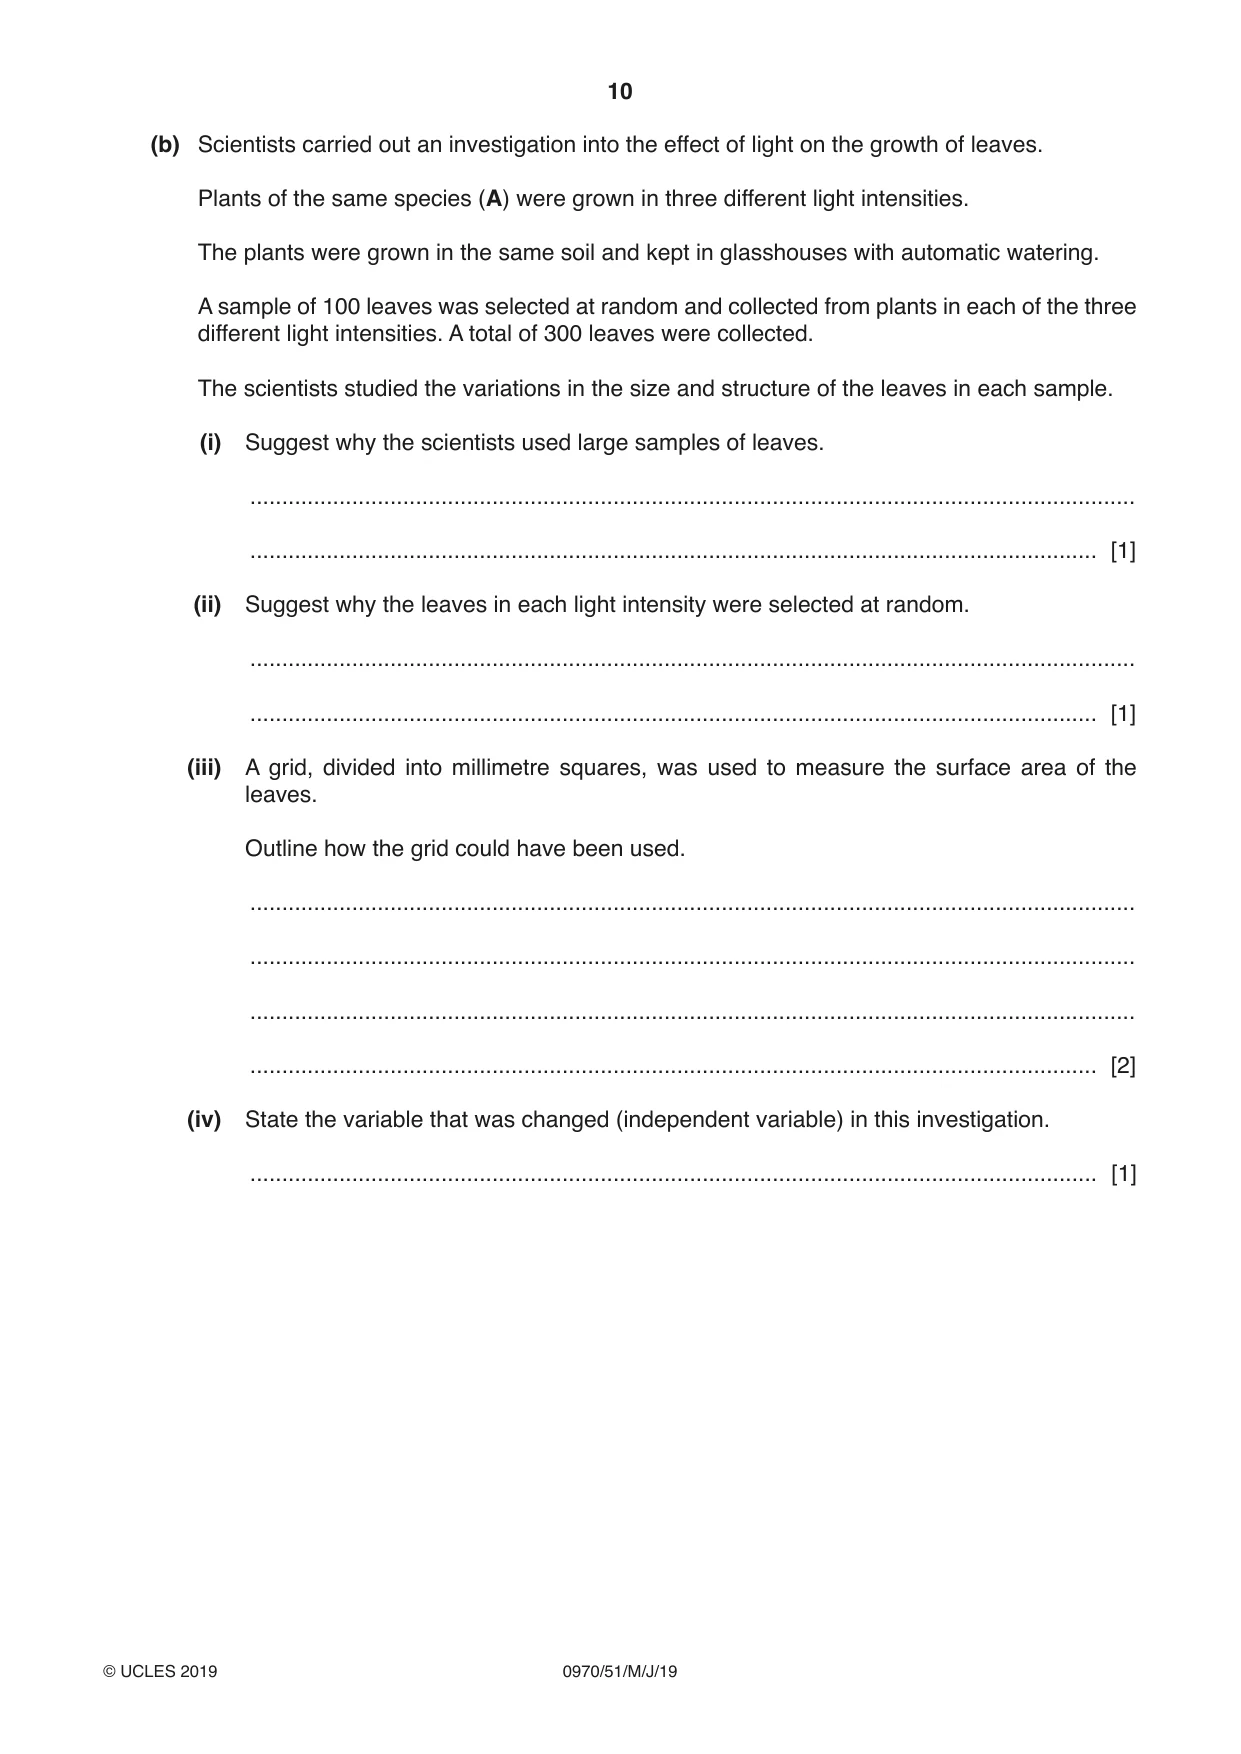
2 (a) Fig. 2.1 is a photomicrograph of a cross-section of part of a leaf. A B magnification ×100 Fig. 2.1 (i) Draw a large diagram to show the layers present in the leaf section shown in Fig. 2.1. Do not draw any cells. [3] (ii) Measure the thickness of the leaf along the line AB on Fig. 2.1. length of line AB ....................................... Calculate the actual thickness of the leaf using your measurement and the formula. Include the units. length of line AB on Fig. 2.1 magnification = actual thickness of leaf ................................................................ [3] (iii) Fig. 2.2 shows a photomicrograph of cells from one type of tissue found in leaves. magnification ×300 Fig. 2.2 Label the layer on your drawing, with the letter X, to show where this type of tissue is found. [1] (b) Scientists carried out an investigation into the effect of light on the growth of leaves. Plants of the same species (A) were grown in three different light intensities. The plants were grown in the same soil and kept in glasshouses with automatic watering. A sample of 100 leaves was selected at random and collected from plants in each of the three different light intensities. A total of 300 leaves were collected. The scientists studied the variations in the size and structure of the leaves in each sample. (i) Suggest why the scientists used large samples of leaves. ........................................................................................................................................... ..................................................................................................................................... [1] (ii) Suggest why the leaves in each light intensity were selected at random. ........................................................................................................................................... ..................................................................................................................................... [1] (iii) A grid, divided into millimetre squares, was used to measure the surface area of the leaves. Outline how the grid could have been used. ........................................................................................................................................... ........................................................................................................................................... ........................................................................................................................................... ..................................................................................................................................... [2] (iv) State the variable that was changed (independent variable) in this investigation. ..................................................................................................................................... [1]
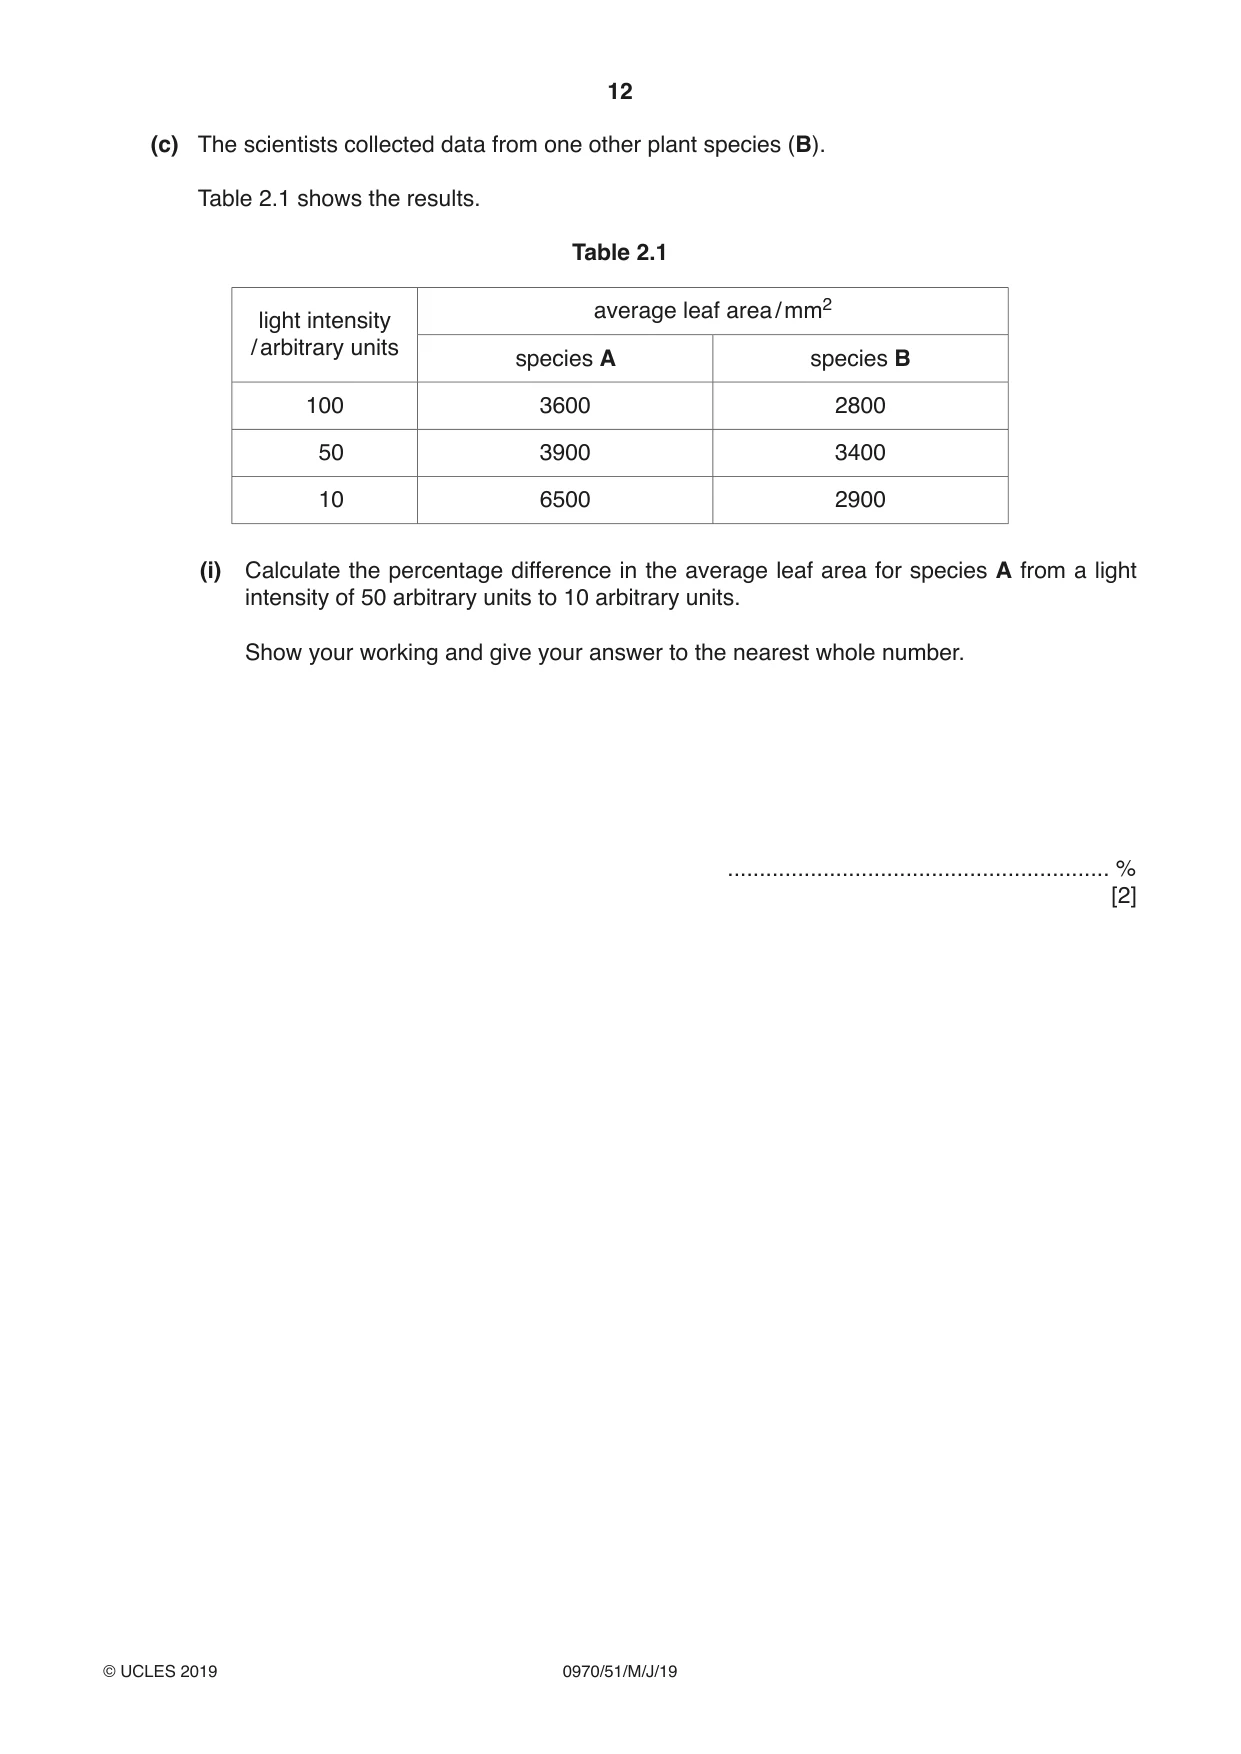
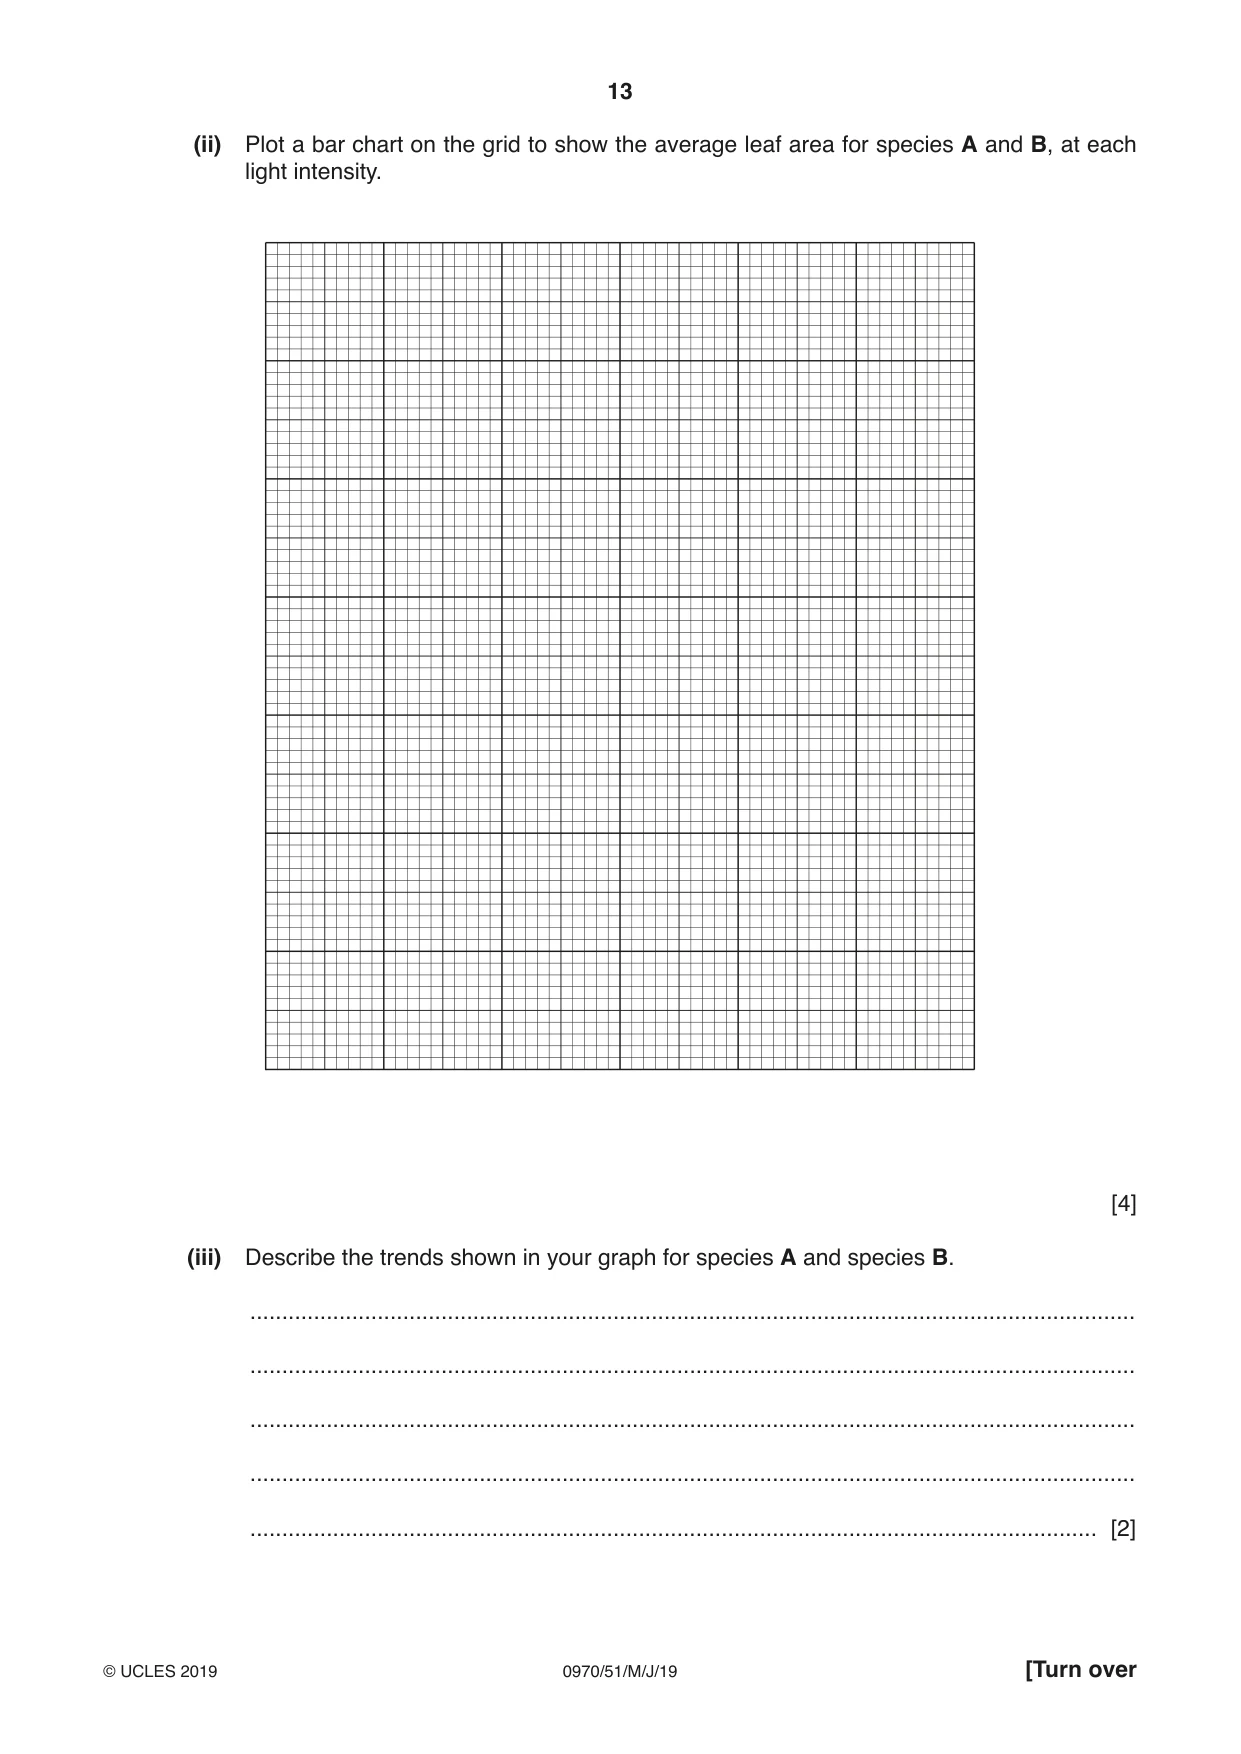
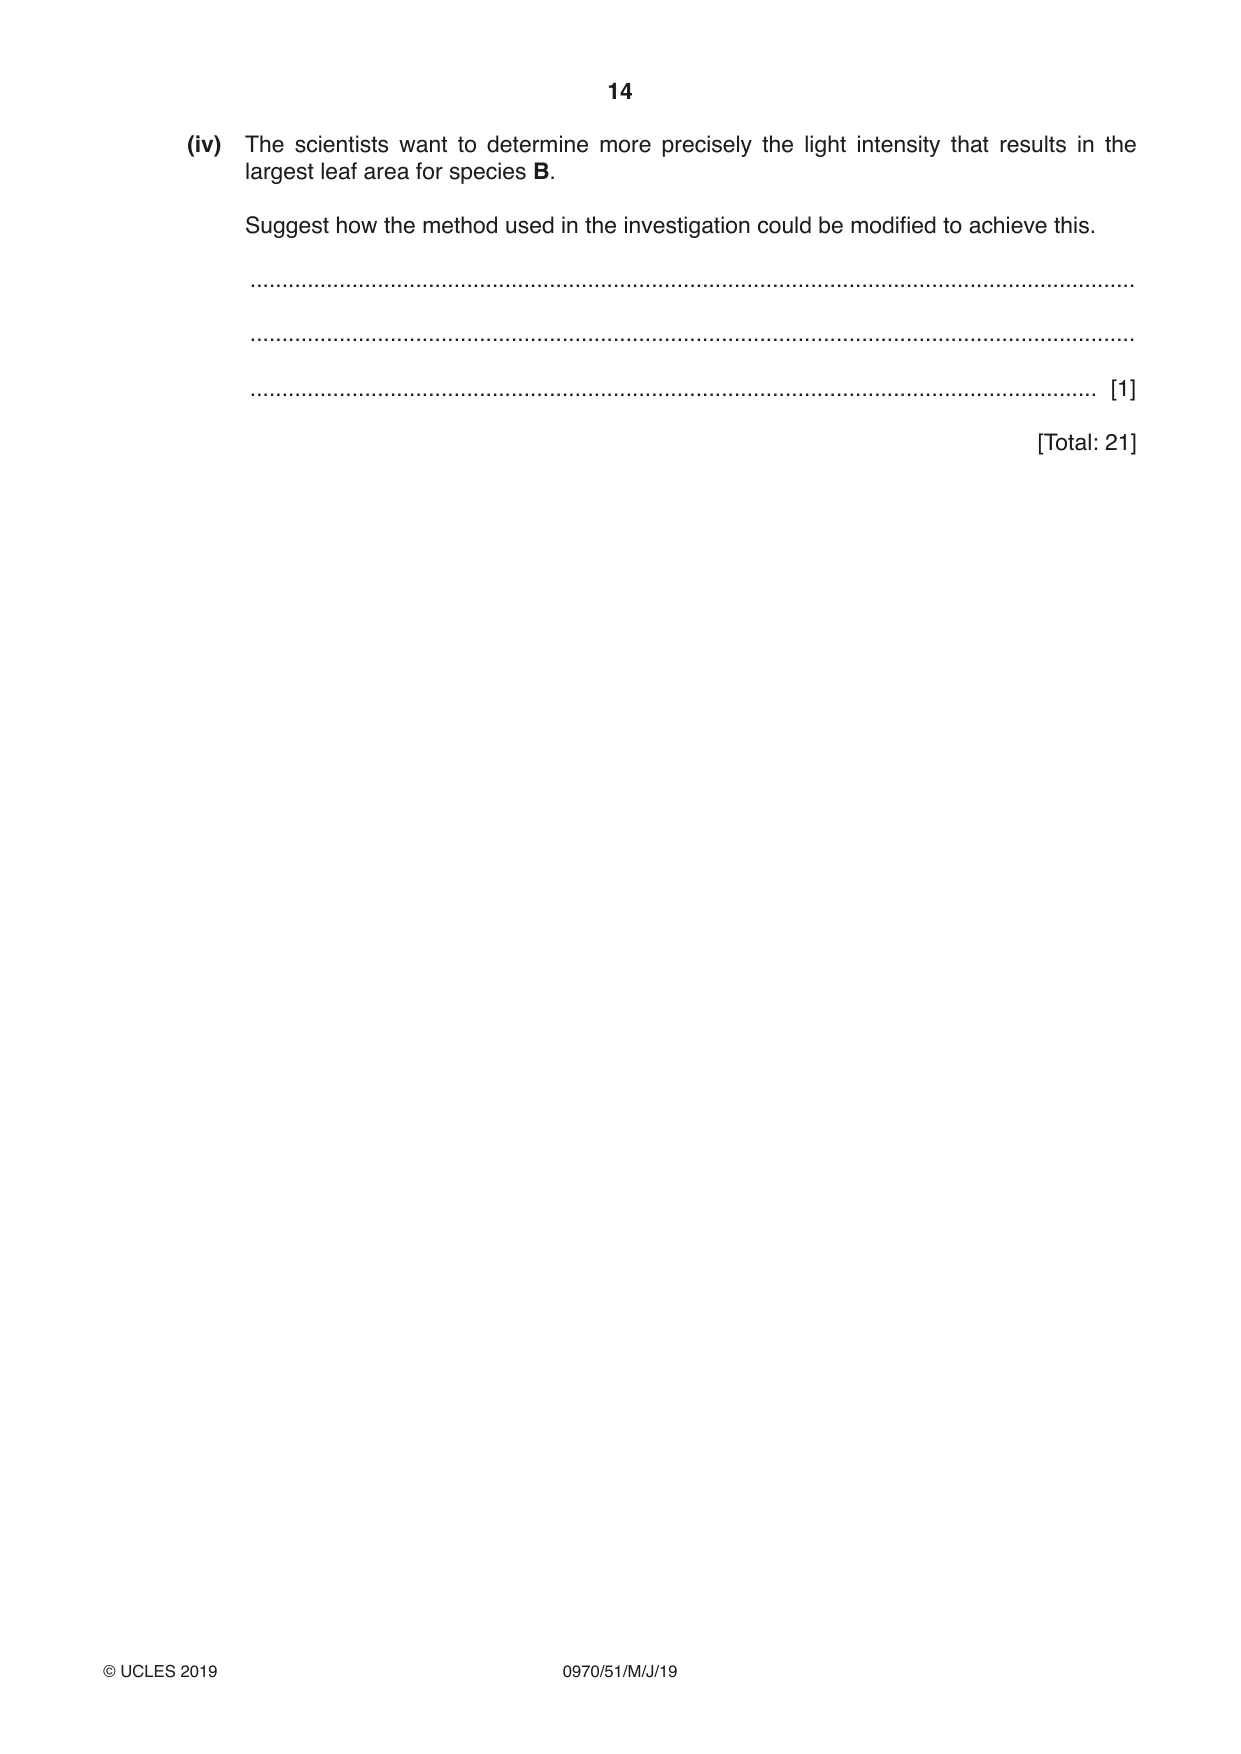
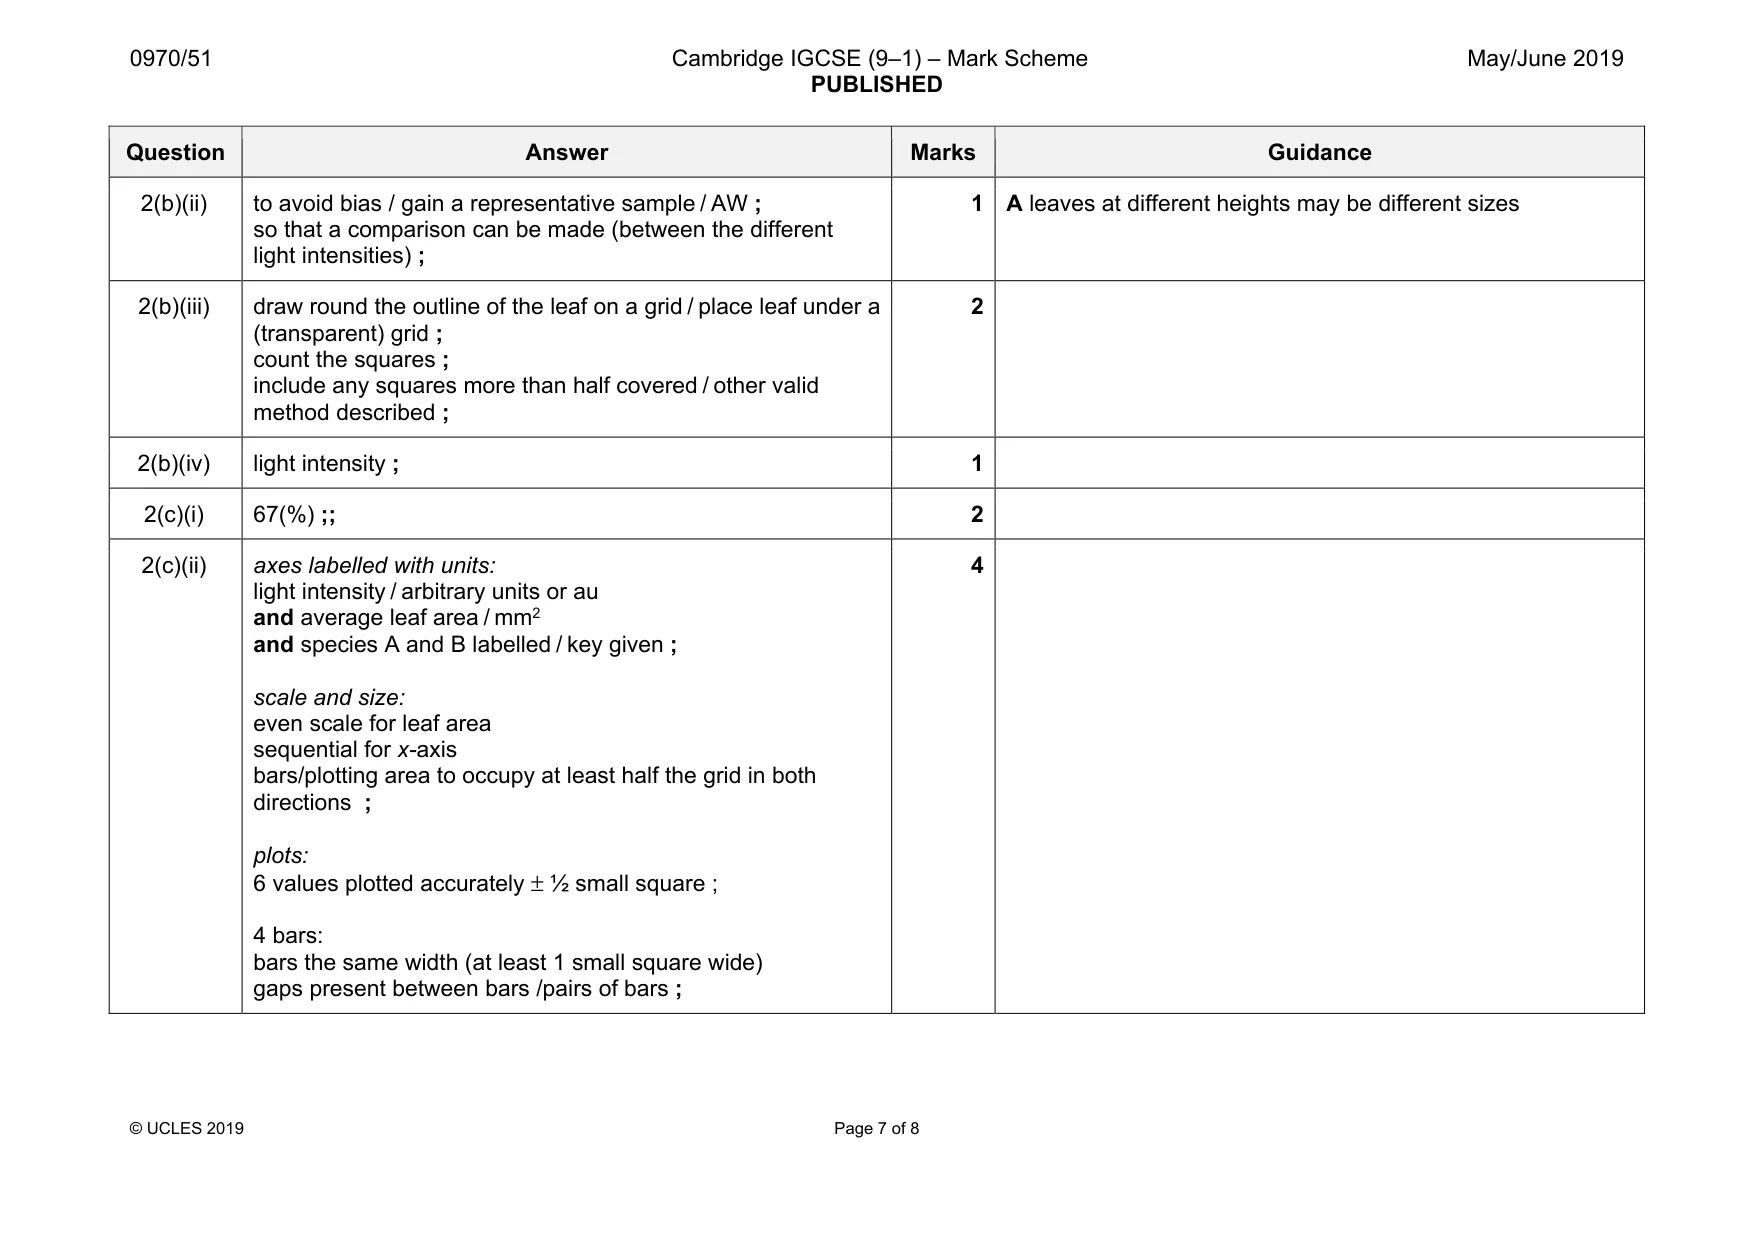
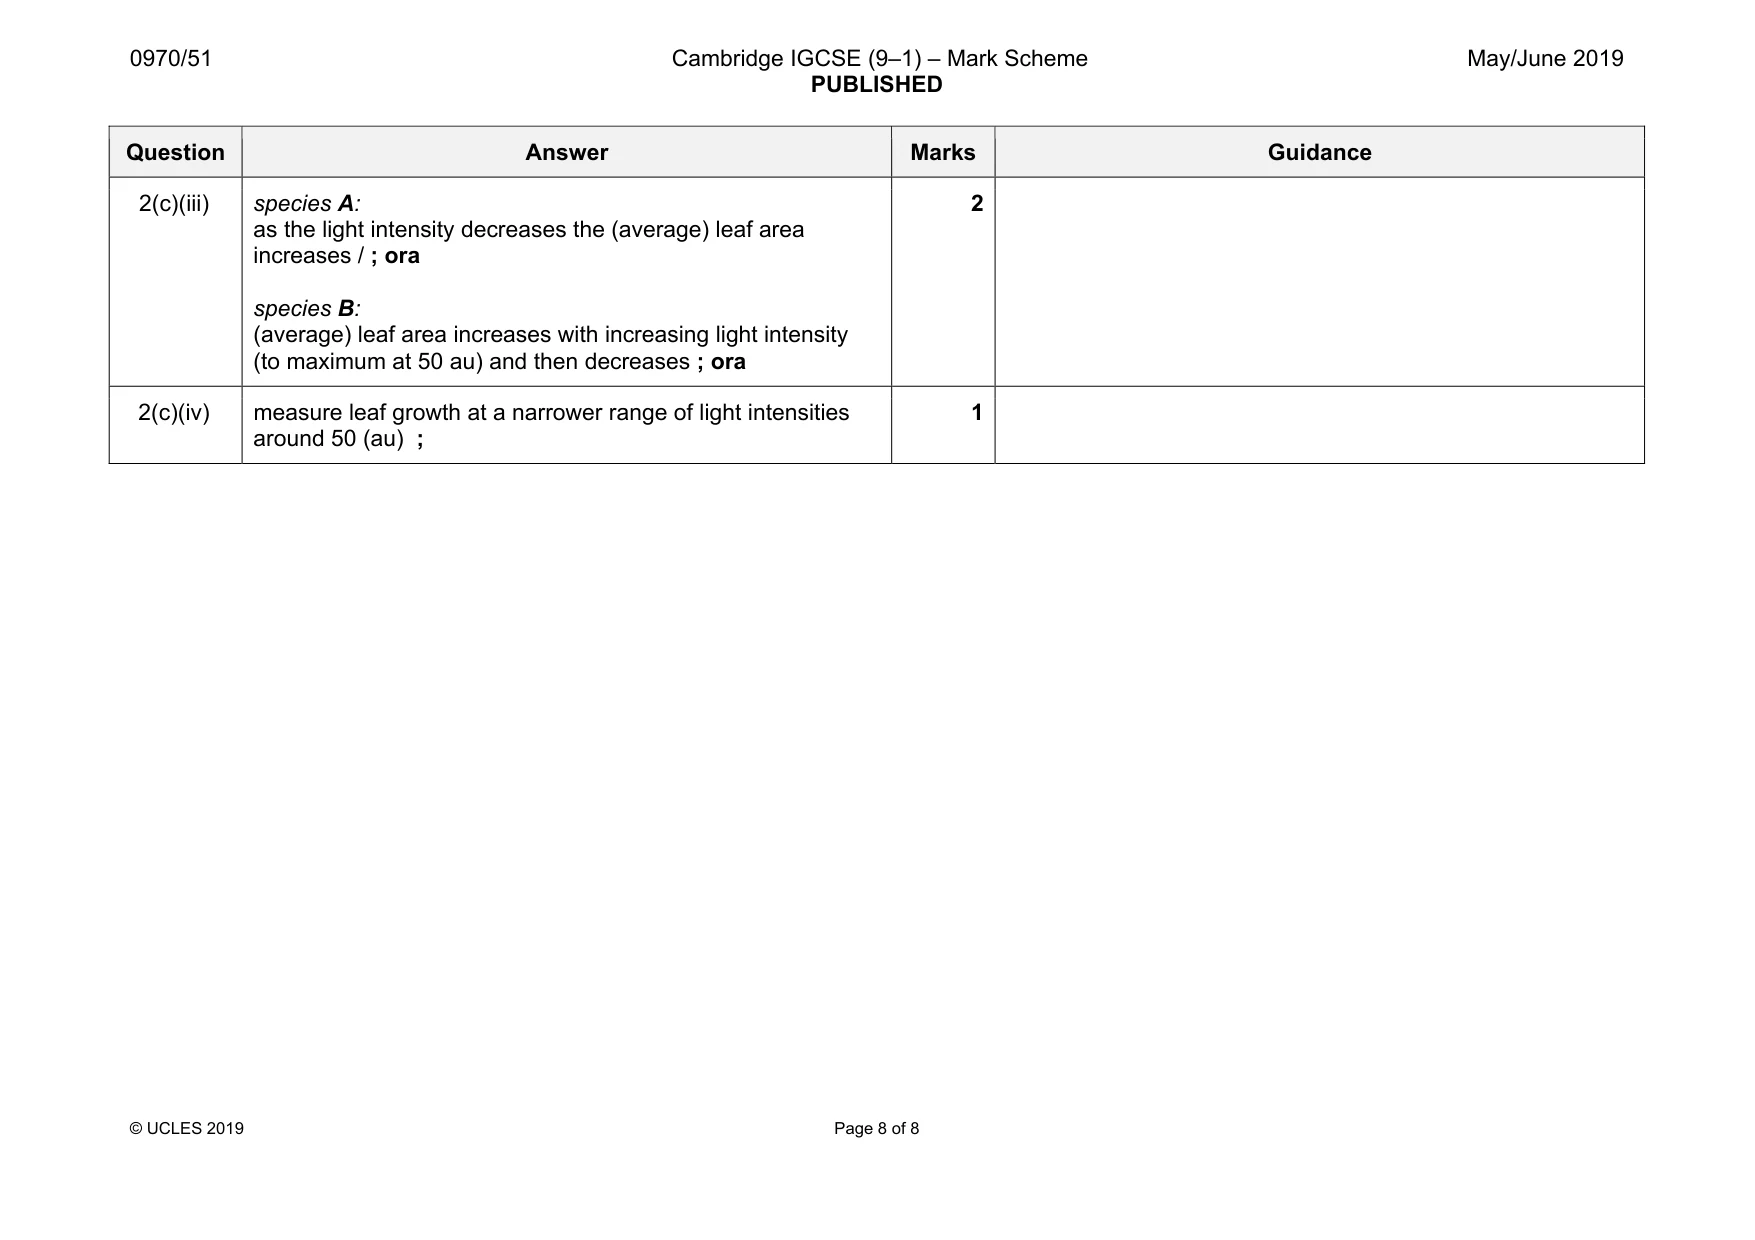
Mark scheme: 2(a)(i) line: clear single continuous lines without shading ; size: occupies at least half the space available ; detail: layers in correct proportions ; 3 2(a)(ii) length of line AB = 40 mm ; actual length =0.4 mm ;; 3 A ±1 mm A ±0.01 mm 2(a)(iii) X written on the spongy mesophyll of drawing ; 1 2(b)(i) to obtain a representative leaf size ; to identify anomalous results ; 1 Question Answer Marks Guidance 2(b)(ii) to avoid bias / gain a representative sample / AW ; so that a comparison can be made (between the different light intensities) ; 1 A leaves at different heights may be different sizes 2(b)(iii) draw round the outline of the leaf on a grid / place leaf under a (transparent) grid ; count the squares ; include any squares more than half covered / other valid method described ; 2 2(b)(iv) light intensity ; 1 2(c)(i) 67(%) ;; 2 2(c)(ii) axes labelled with units: light intensity / arbitrary units or au and average leaf area / mm2 and species A and B labelled / key given ; scale and size: even scale for leaf area sequential for x-axis bars/plotting area to occupy at least half the grid in both directions ; plots: 6 values plotted accurately ± ½ small square ; 4 bars: bars the same width (at least 1 small square wide) gaps present between bars /pairs of bars ; 4 Question Answer Marks Guidance 2(c)(iii) species A: as the light intensity decreases the (average) leaf area increases / ; ora species B: (average) leaf area increases with increasing light intensity (to maximum at 50 au) and then decreases ; ora 2 2(c)(iv) measure leaf growth at a narrower range of light intensities around 50 (au) ; 1
What was in this paper
The subtopics covered by these 2 questions, and how many questions each got. Open one in a new tab to see every Cambridge question on it.
What you needed in this session
Cambridge’s own grade thresholds for 2019 May/June, Paper 5 · Variant 1. A higher threshold means an easier paper — the bar moves with how the cohort did.