Cambridge IGCSE Biology (9-1) 0970 — 2020 May/June Paper 5 · Variant 1
0970/51/M/J/20 · 2 questions · 32 marks · ≈36 min
The question paper and its mark scheme, free to read here and free to download. This is Cambridge’s own paper, exactly as it was sat.
Question paper12 pages



Mark scheme8 pages
Answers below. Sit the paper first if you are practising.
Questions as text
Q1 · Sugars are a source of energy in the diet
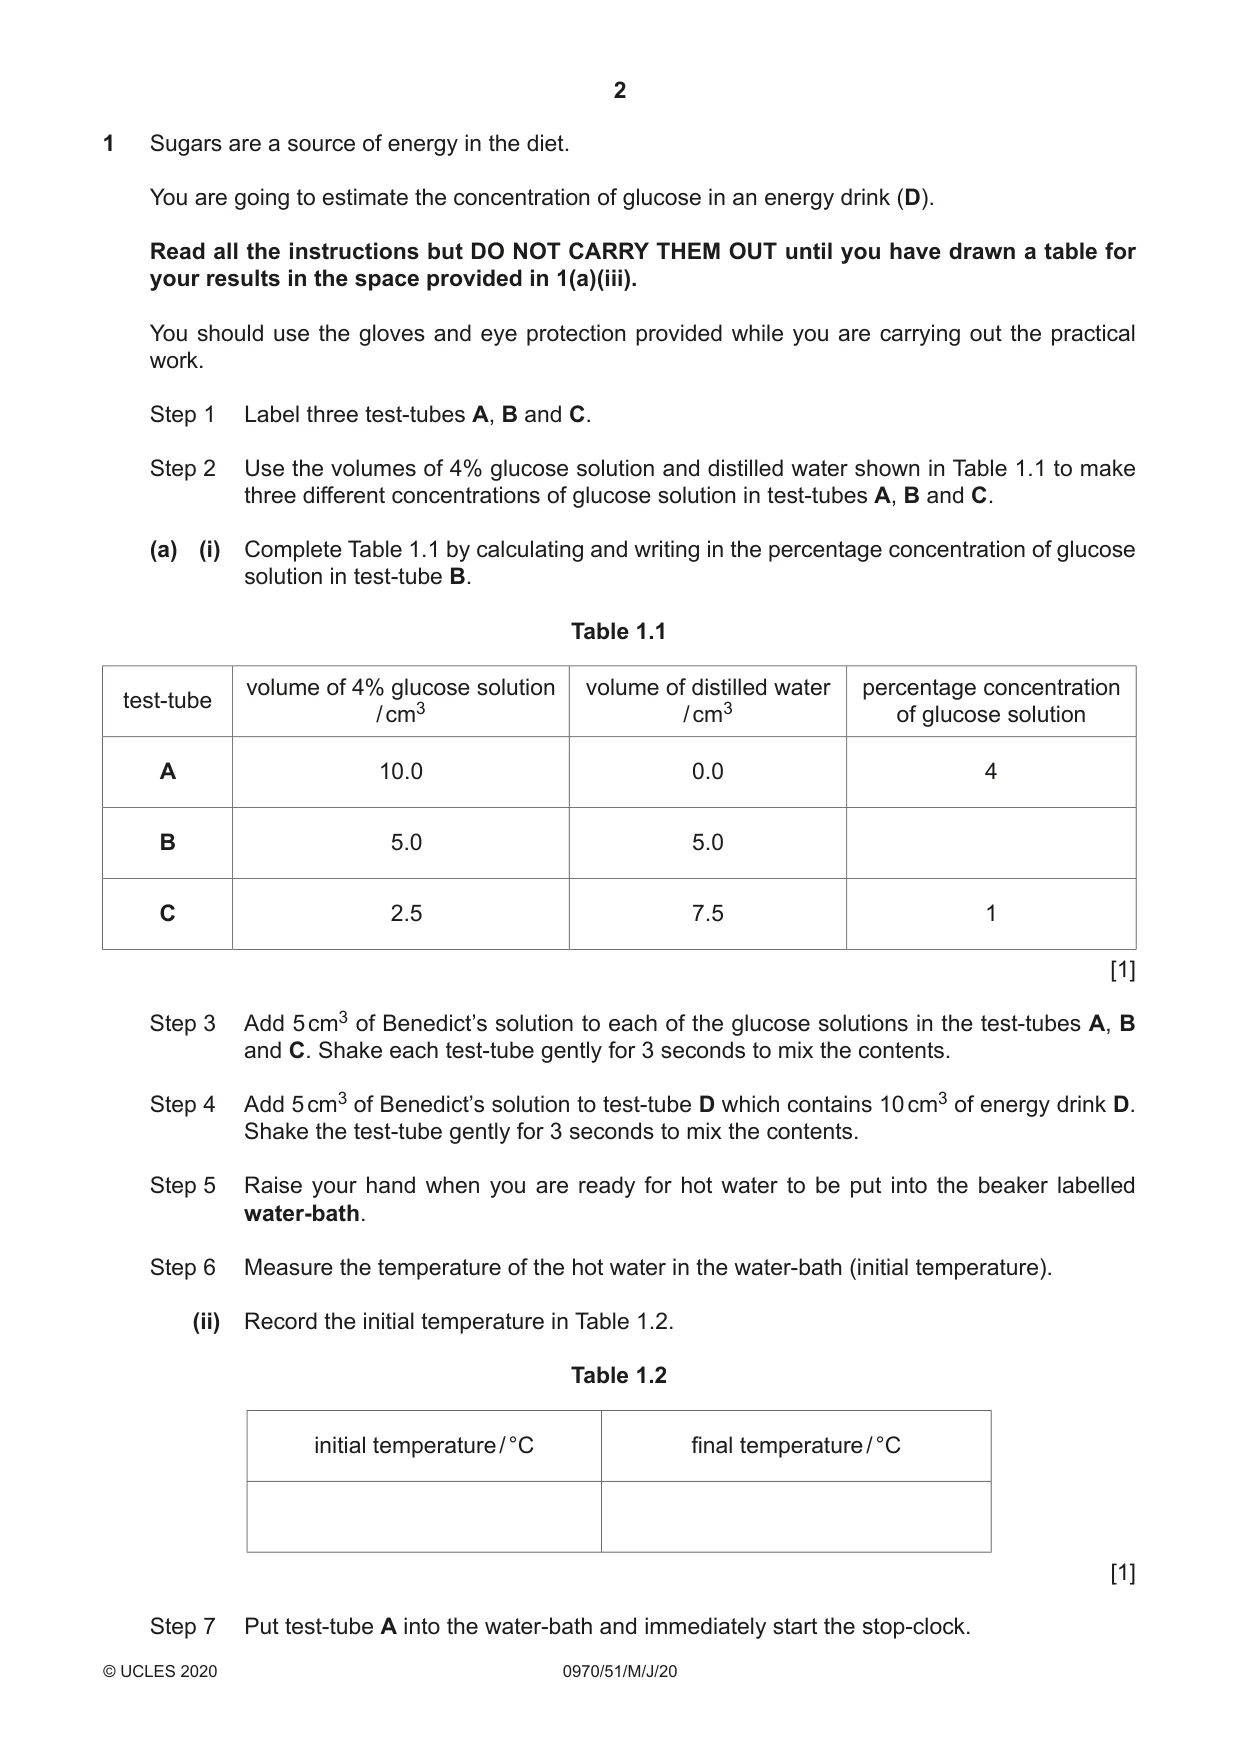
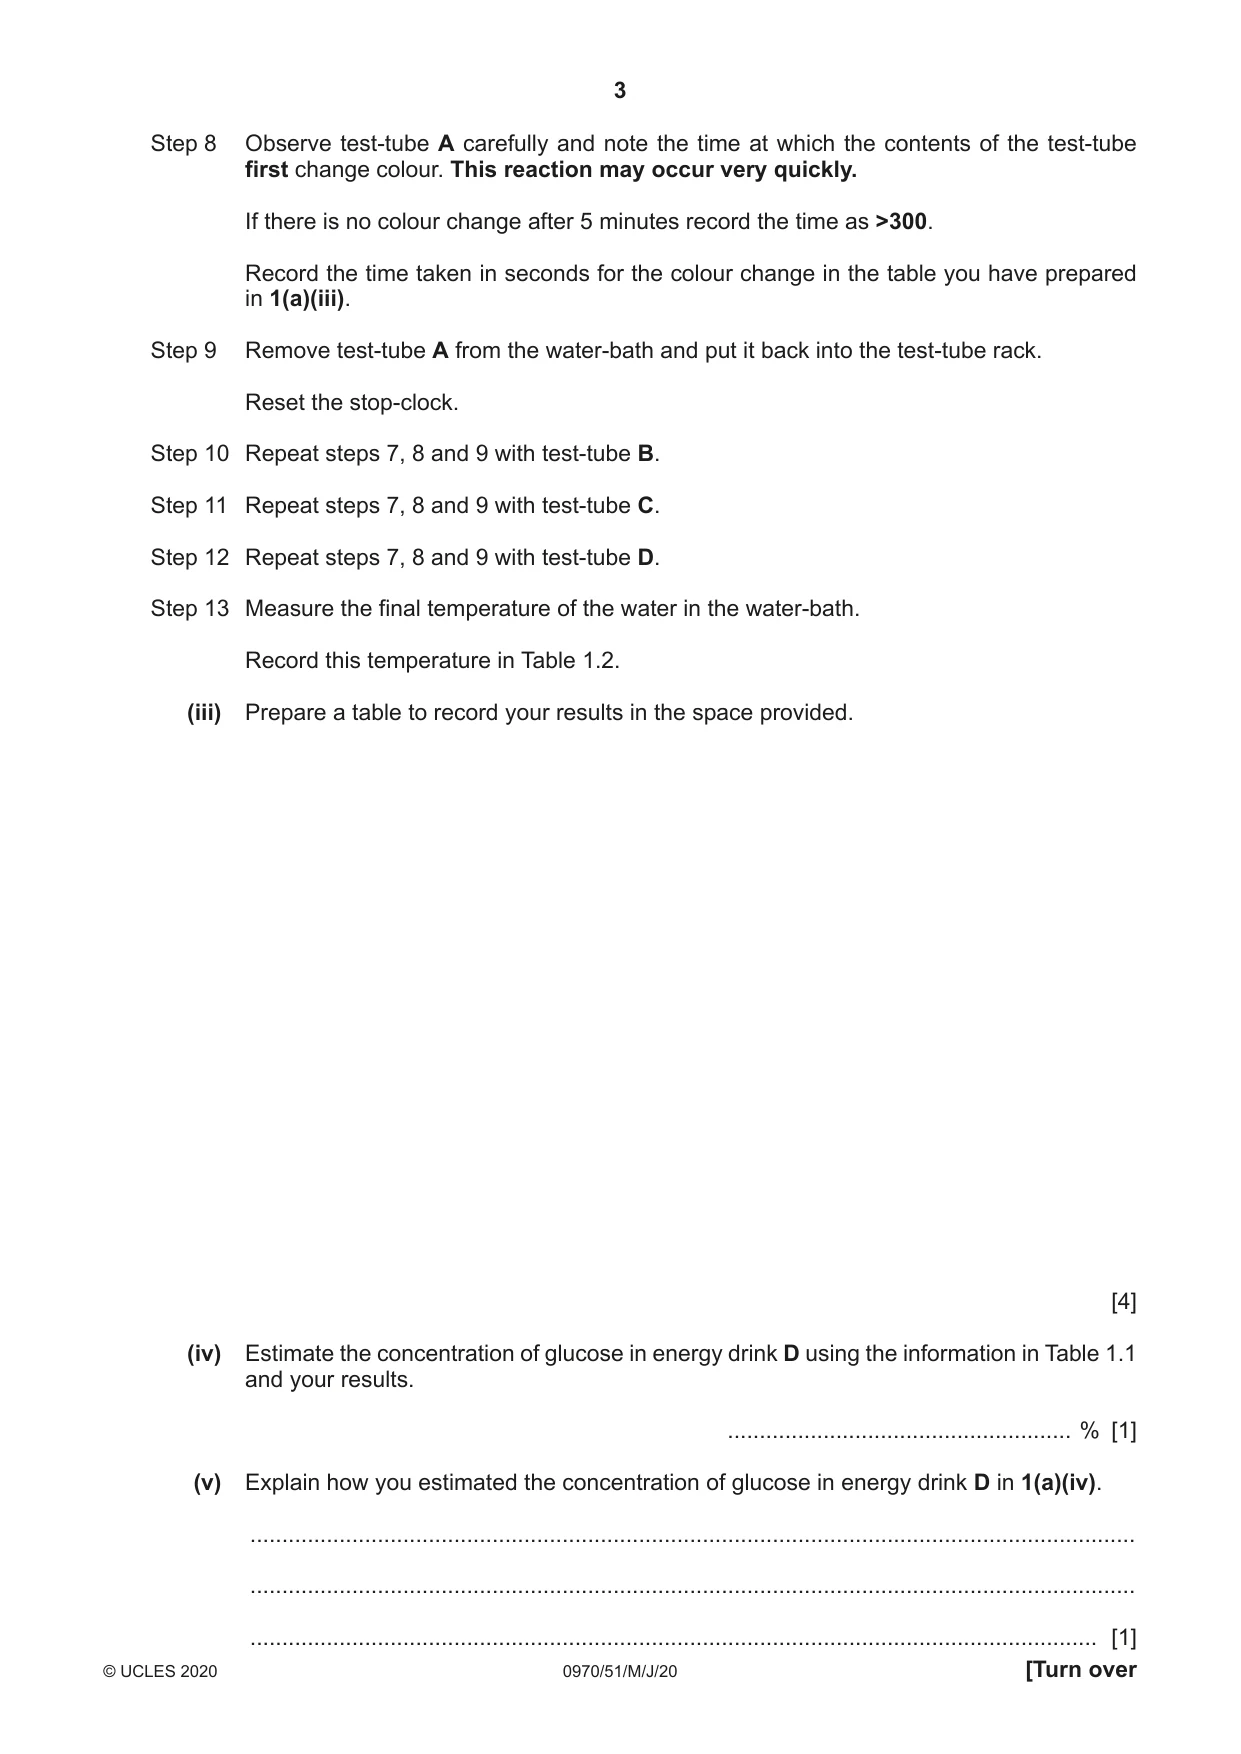
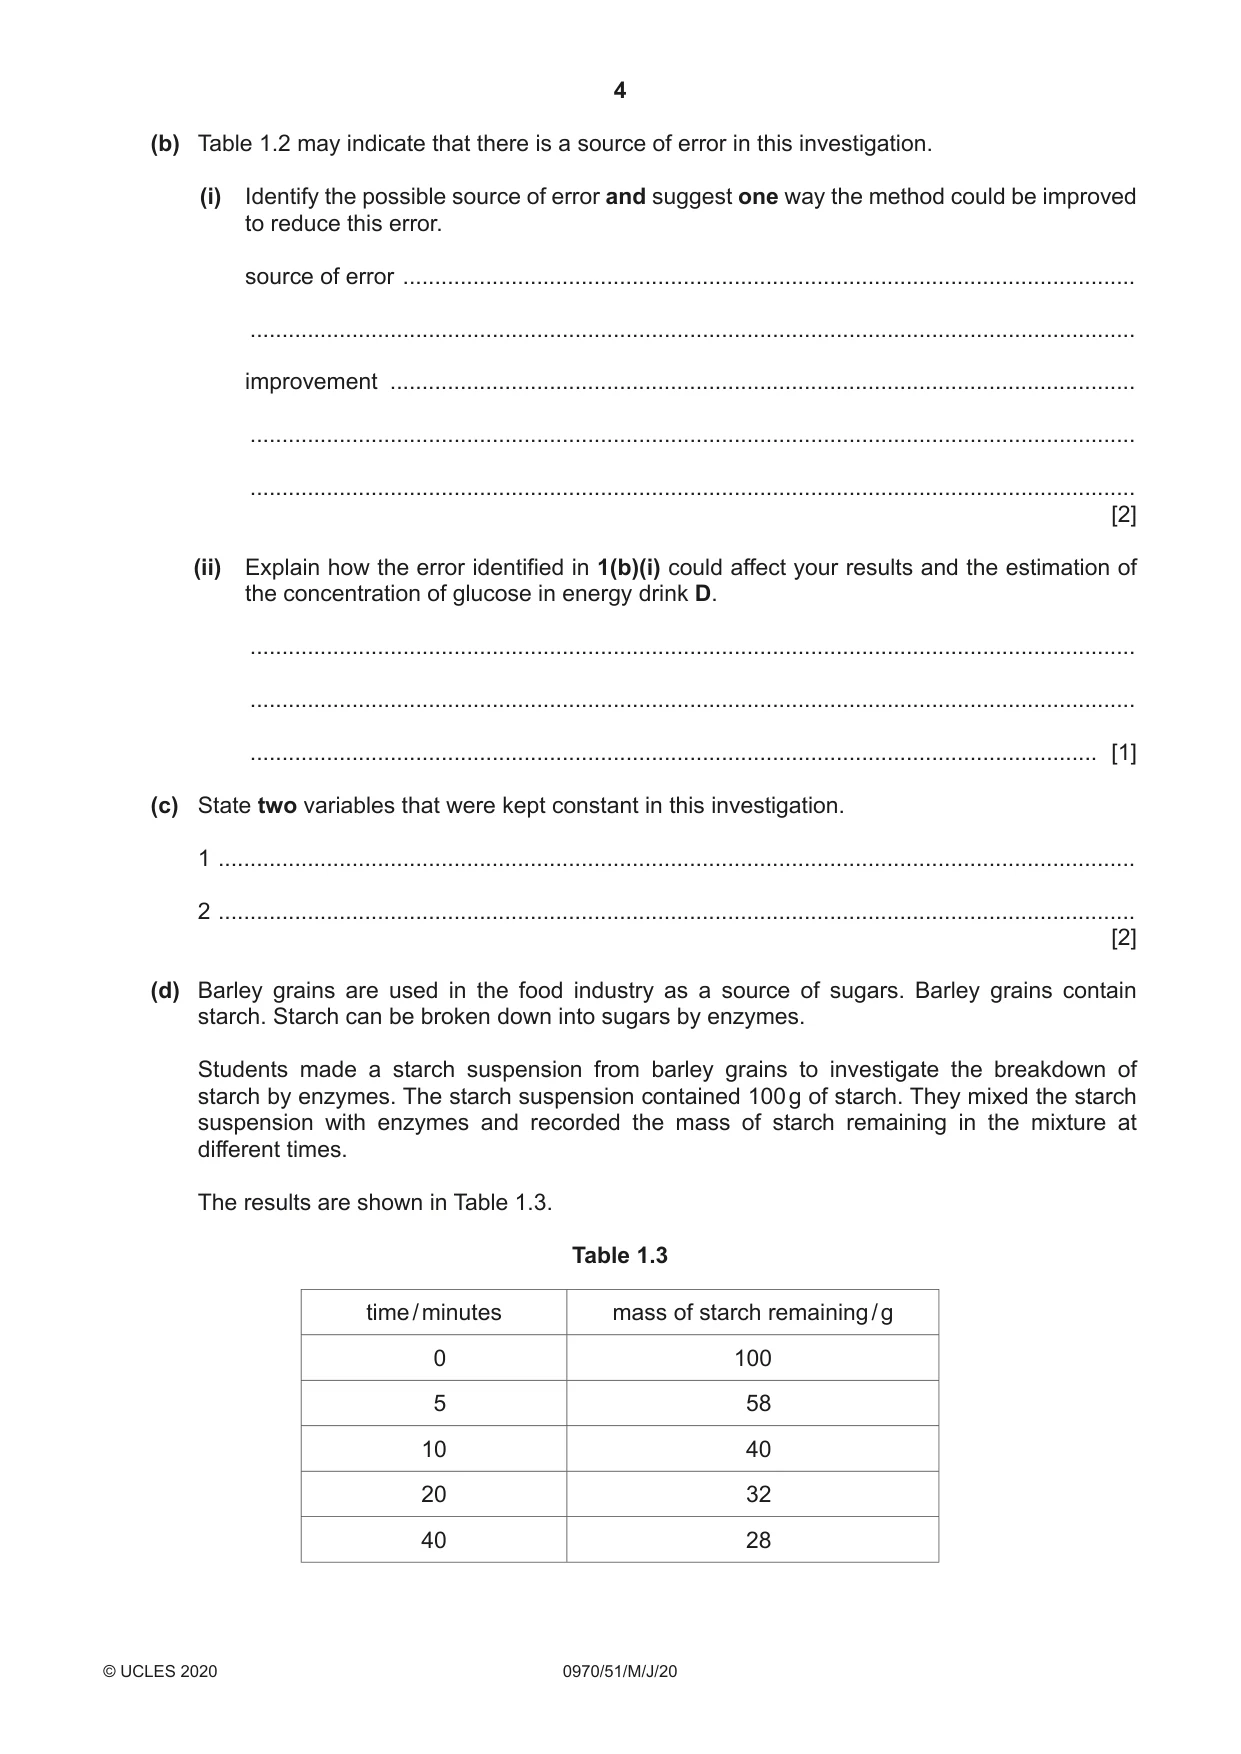
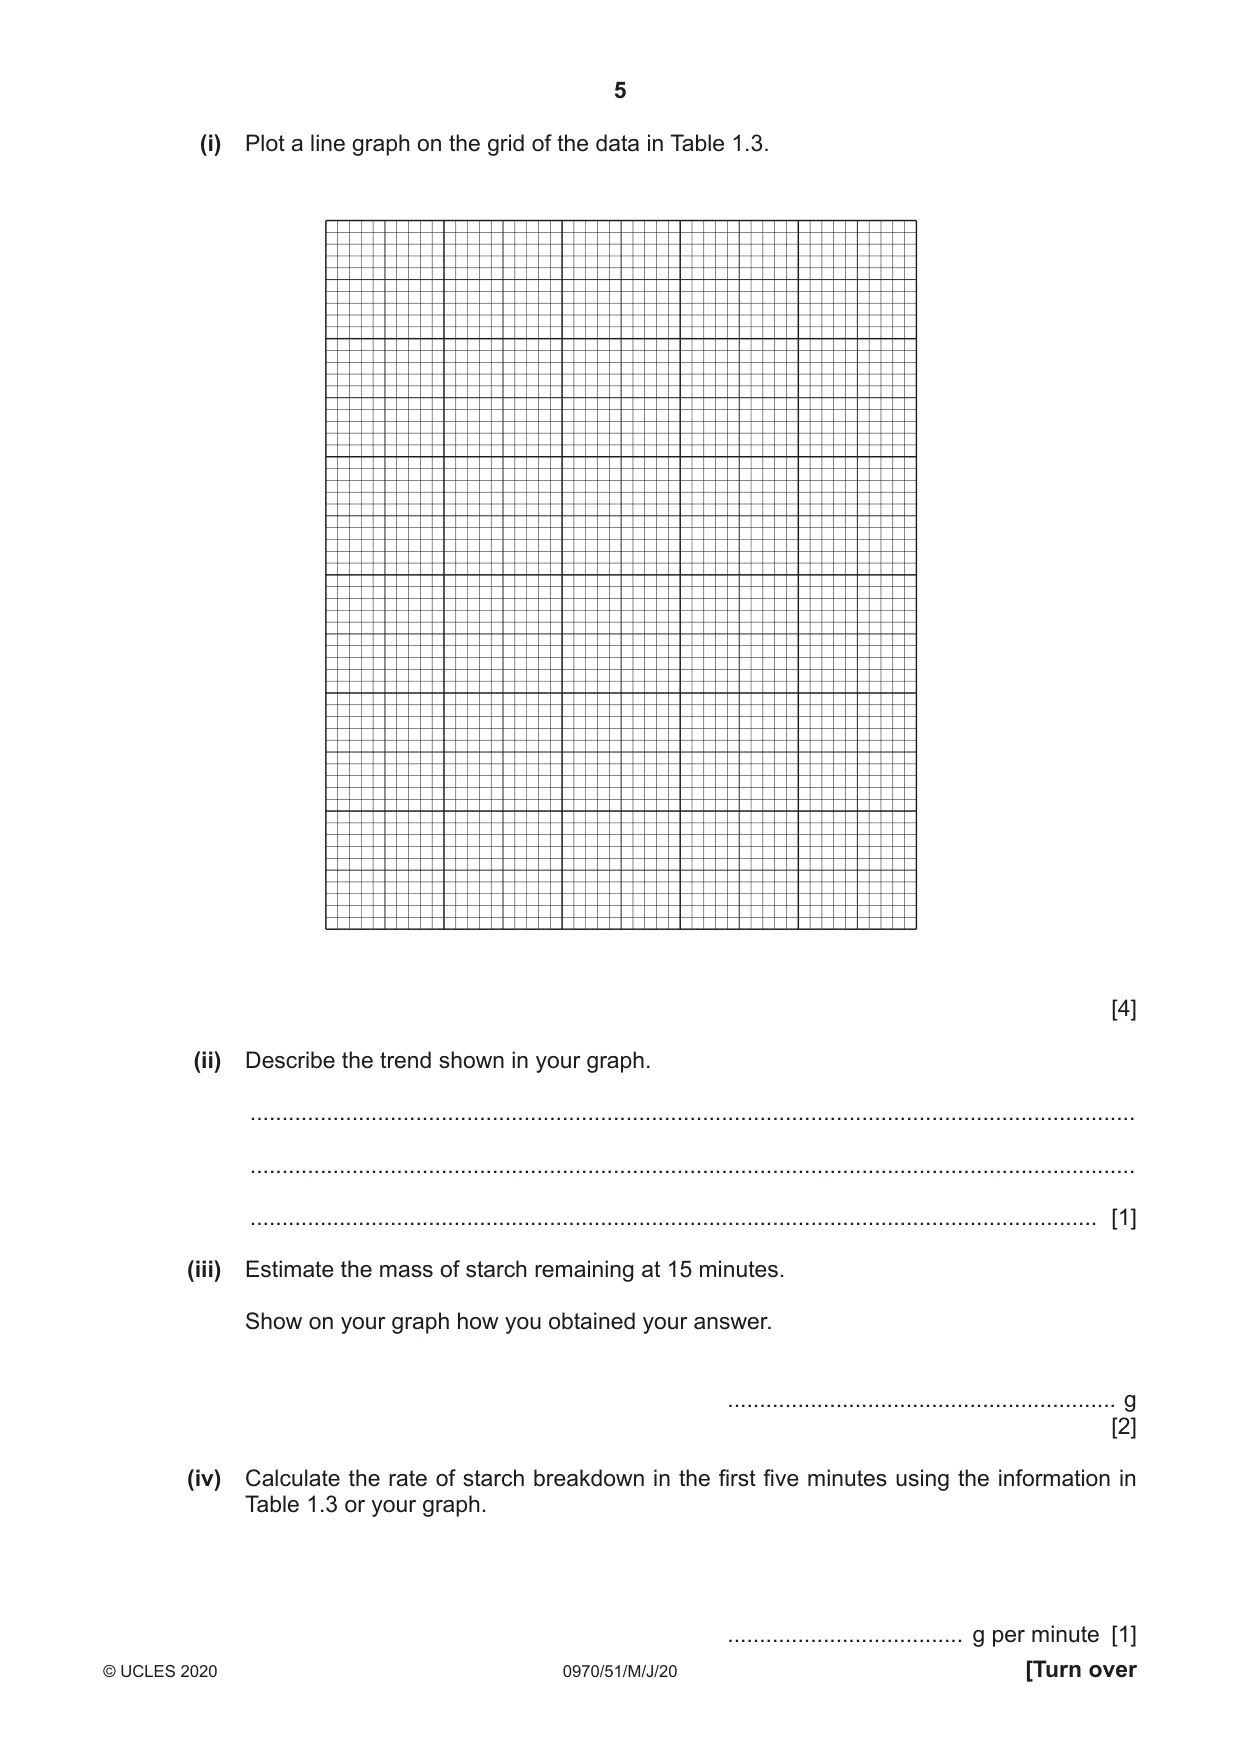
1 Sugars are a source of energy in the diet. You are going to estimate the concentration of glucose in an energy drink (D). Read all the instructions but DO NOT CARRY THEM OUT until you have drawn a table for your results in the space provided in 1(a)(iii). You should use the gloves and eye protection provided while you are carrying out the practical work. Step 1 Label three test-tubes A, B and C. Step 2 Use the volumes of 4% glucose solution and distilled water shown in Table 1.1 to make three different concentrations of glucose solution in test-tubes A, B and C. (a) (i) Complete Table 1.1 by calculating and writing in the percentage concentration of glucose solution in test-tube B. Table 1.1 volume of 4% glucose solution volume of distilled water percentage concentration test-tube / cm3 / cm3 of glucose solution A 10.0 0.0 4 B 5.0 5.0 C 2.5 7.5 1 [1] Step 3 Add 5 cm3 of Benedict’s solution to each of the glucose solutions in the test-tubes A, B and C. Shake each test-tube gently for 3 seconds to mix the contents. Step 4 Add 5 cm3 of Benedict’s solution to test-tube D which contains 10 cm3 of energy drink D. Shake the test-tube gently for 3 seconds to mix the contents. Step 5 Raise your hand when you are ready for hot water to be put into the beaker labelled water-bath. Step 6 Measure the temperature of the hot water in the water-bath (initial temperature). (ii) Record the initial temperature in Table 1.2. Table 1.2 initial temperature / °C final temperature / °C [1] Step 7 Put test-tube A into the water-bath and immediately start the stop-clock. Step 8 Observe test-tube A carefully and note the time at which the contents of the test-tube first change colour. This reaction may occur very quickly. If there is no colour change after 5 minutes record the time as >300. Record the time taken in seconds for the colour change in the table you have prepared in 1(a)(iii). Step 9 Remove test-tube A from the water-bath and put it back into the test-tube rack. Reset the stop-clock. Step 10 Repeat steps 7, 8 and 9 with test-tube B. Step 11 Repeat steps 7, 8 and 9 with test-tube C. Step 12 Repeat steps 7, 8 and 9 with test-tube D. Step 13 Measure the final temperature of the water in the water-bath. Record this temperature in Table 1.2. (iii) Prepare a table to record your results in the space provided. [4] (iv) Estimate the concentration of glucose in energy drink D using the information in Table 1.1 and your results. ...................................................... % [1] (v) Explain how you estimated the concentration of glucose in energy drink D in 1(a)(iv). ........................................................................................................................................... ........................................................................................................................................... ..................................................................................................................................... [1] (b) Table 1.2 may indicate that there is a source of error in this investigation. (i) Identify the possible source of error and suggest one way the method could be improved to reduce this error. source of error ................................................................................................................... ........................................................................................................................................... improvement ..................................................................................................................... ........................................................................................................................................... ........................................................................................................................................... [2] (ii) Explain how the error identified in 1(b)(i) could affect your results and the estimation of the concentration of glucose in energy drink D. ........................................................................................................................................... ........................................................................................................................................... ..................................................................................................................................... [1] (c) State two variables that were kept constant in this investigation. 1 ................................................................................................................................................ 2 ................................................................................................................................................ [2] (d) Barley grains are used in the food industry as a source of sugars. Barley grains contain starch. Starch can be broken down into sugars by enzymes. Students made a starch suspension from barley grains to investigate the breakdown of starch by enzymes. The starch suspension contained 100 g of starch. They mixed the starch suspension with enzymes and recorded the mass of starch remaining in the mixture at different times. The results are shown in Table 1.3. Table 1.3 time / minutes mass of starch remaining / g 0 100 5 58 10 40 20 32 40 28 (i) Plot a line graph on the grid of the data in Table 1.3. [4] (ii) Describe the trend shown in your graph. ........................................................................................................................................... ........................................................................................................................................... ..................................................................................................................................... [1] (iii) Estimate the mass of starch remaining at 15 minutes. Show on your graph how you obtained your answer. ............................................................. g [2] (iv) Calculate the rate of starch breakdown in the first five minutes using the information in Table 1.3 or your graph. ..................................... g per minute [1] (e) Plan an investigation to determine the effect of temperature on the breakdown of starch by enzymes. ................................................................................................................................................... ................................................................................................................................................... ................................................................................................................................................... ................................................................................................................................................... ................................................................................................................................................... ................................................................................................................................................... ................................................................................................................................................... ................................................................................................................................................... ................................................................................................................................................... ................................................................................................................................................... ................................................................................................................................................... ................................................................................................................................................... ............................................................................................................................................. [6] [Total: 27]
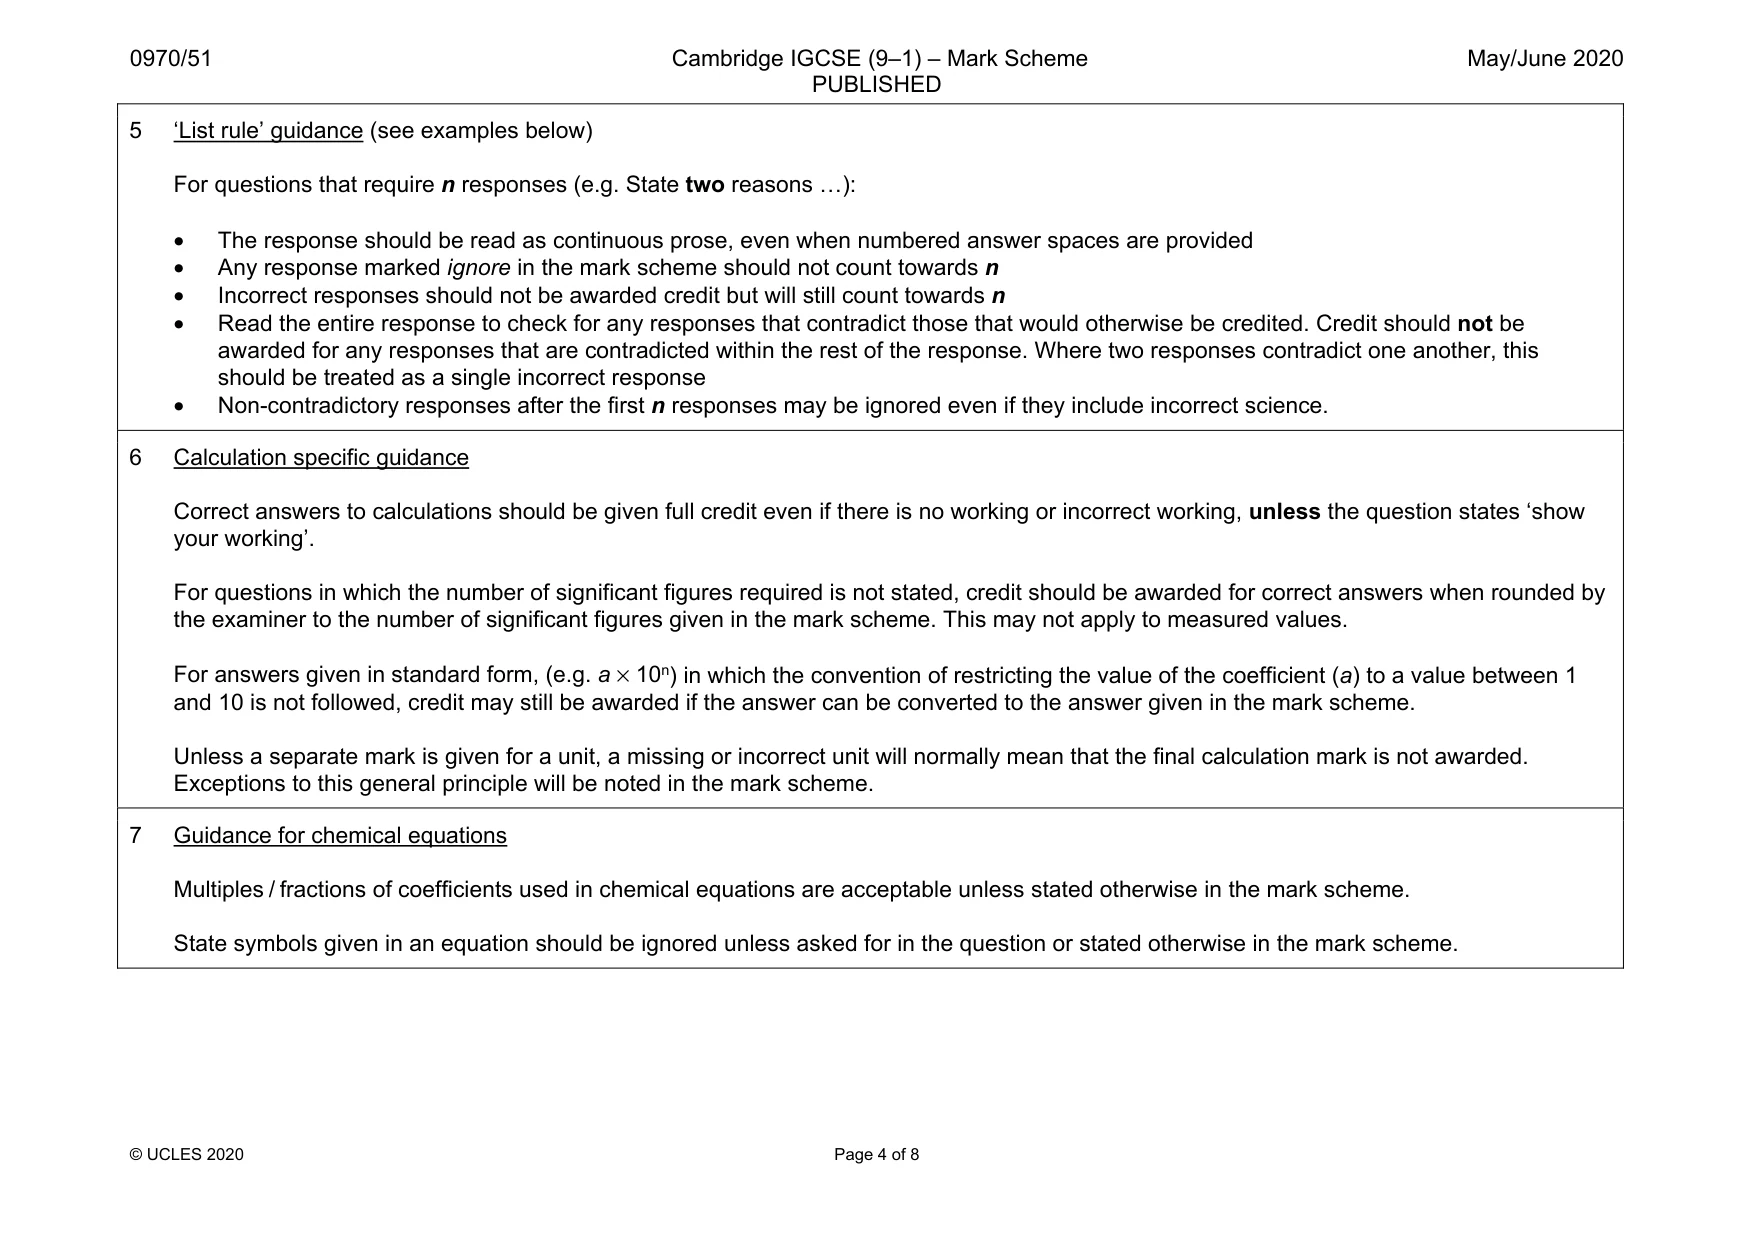
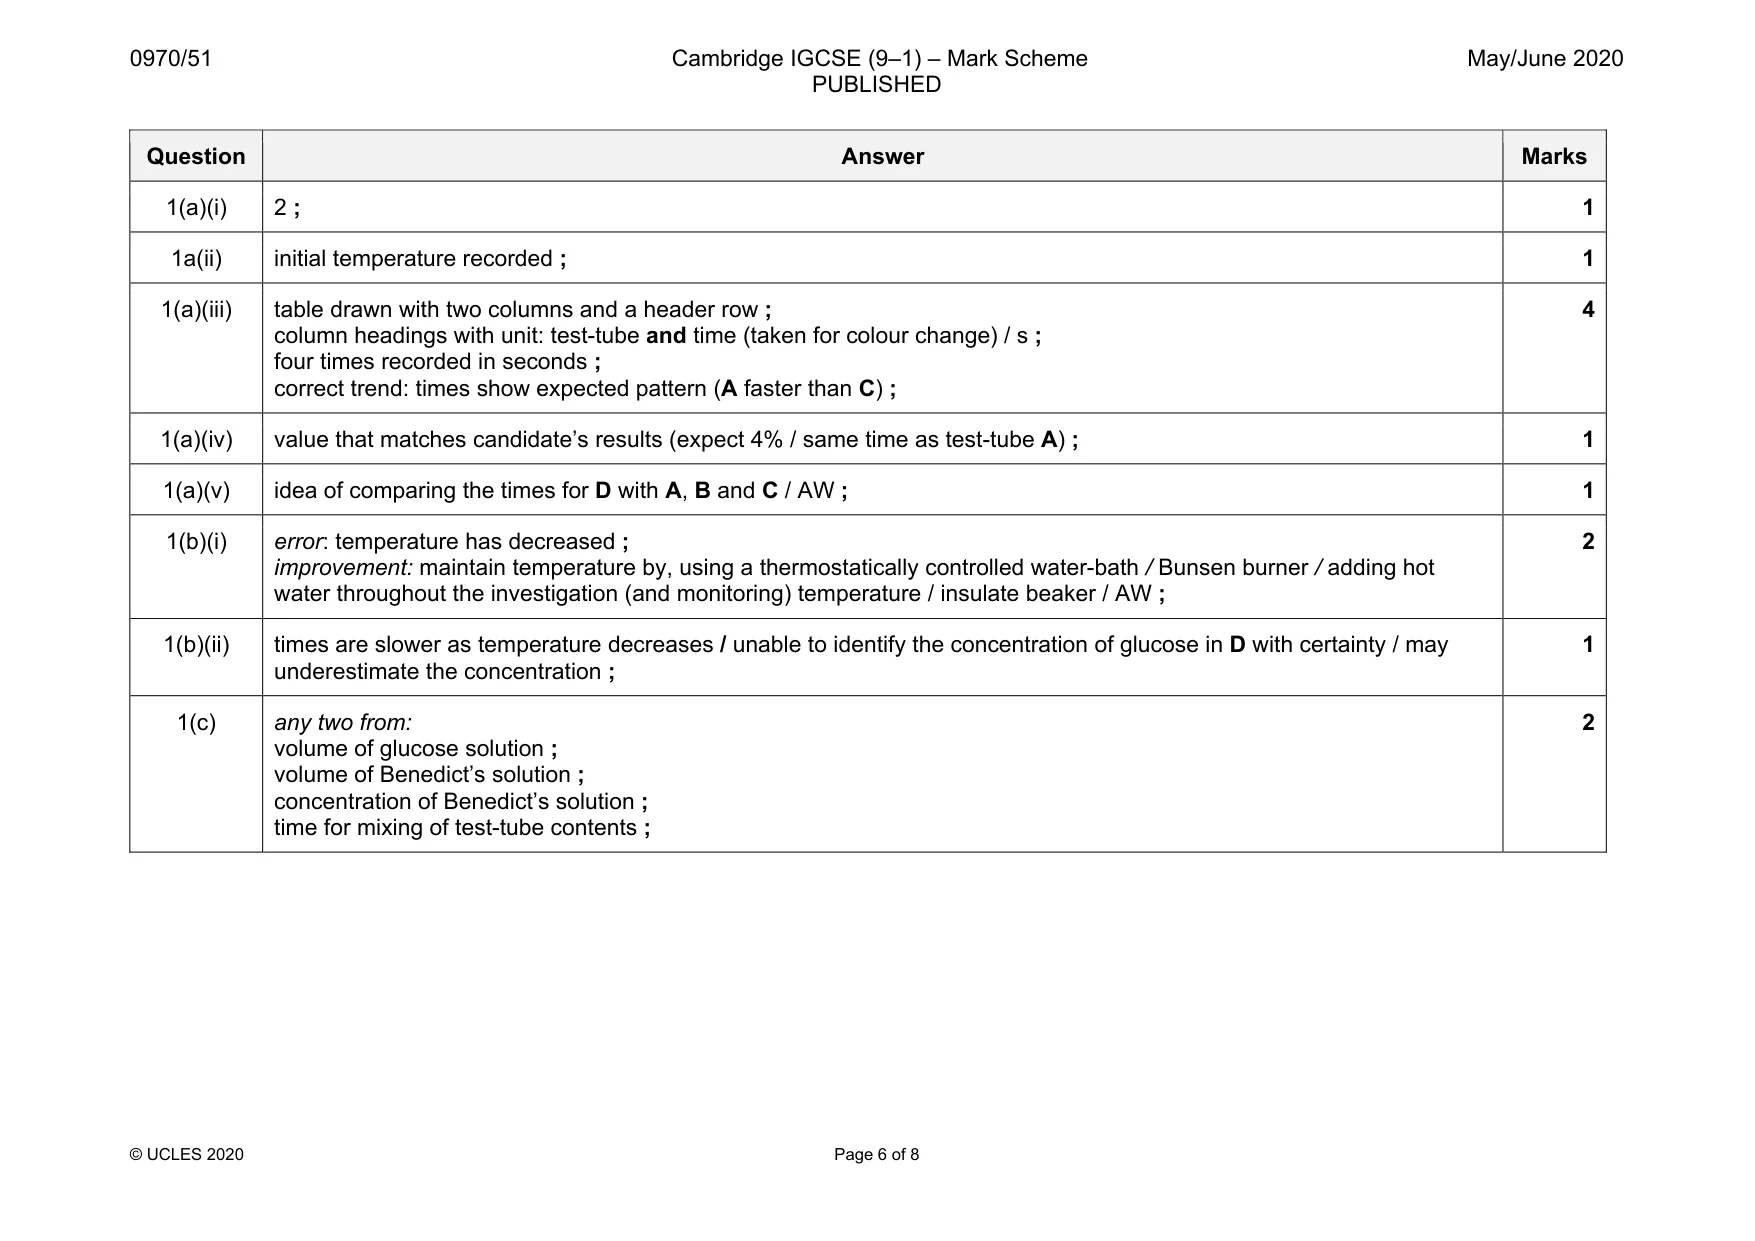
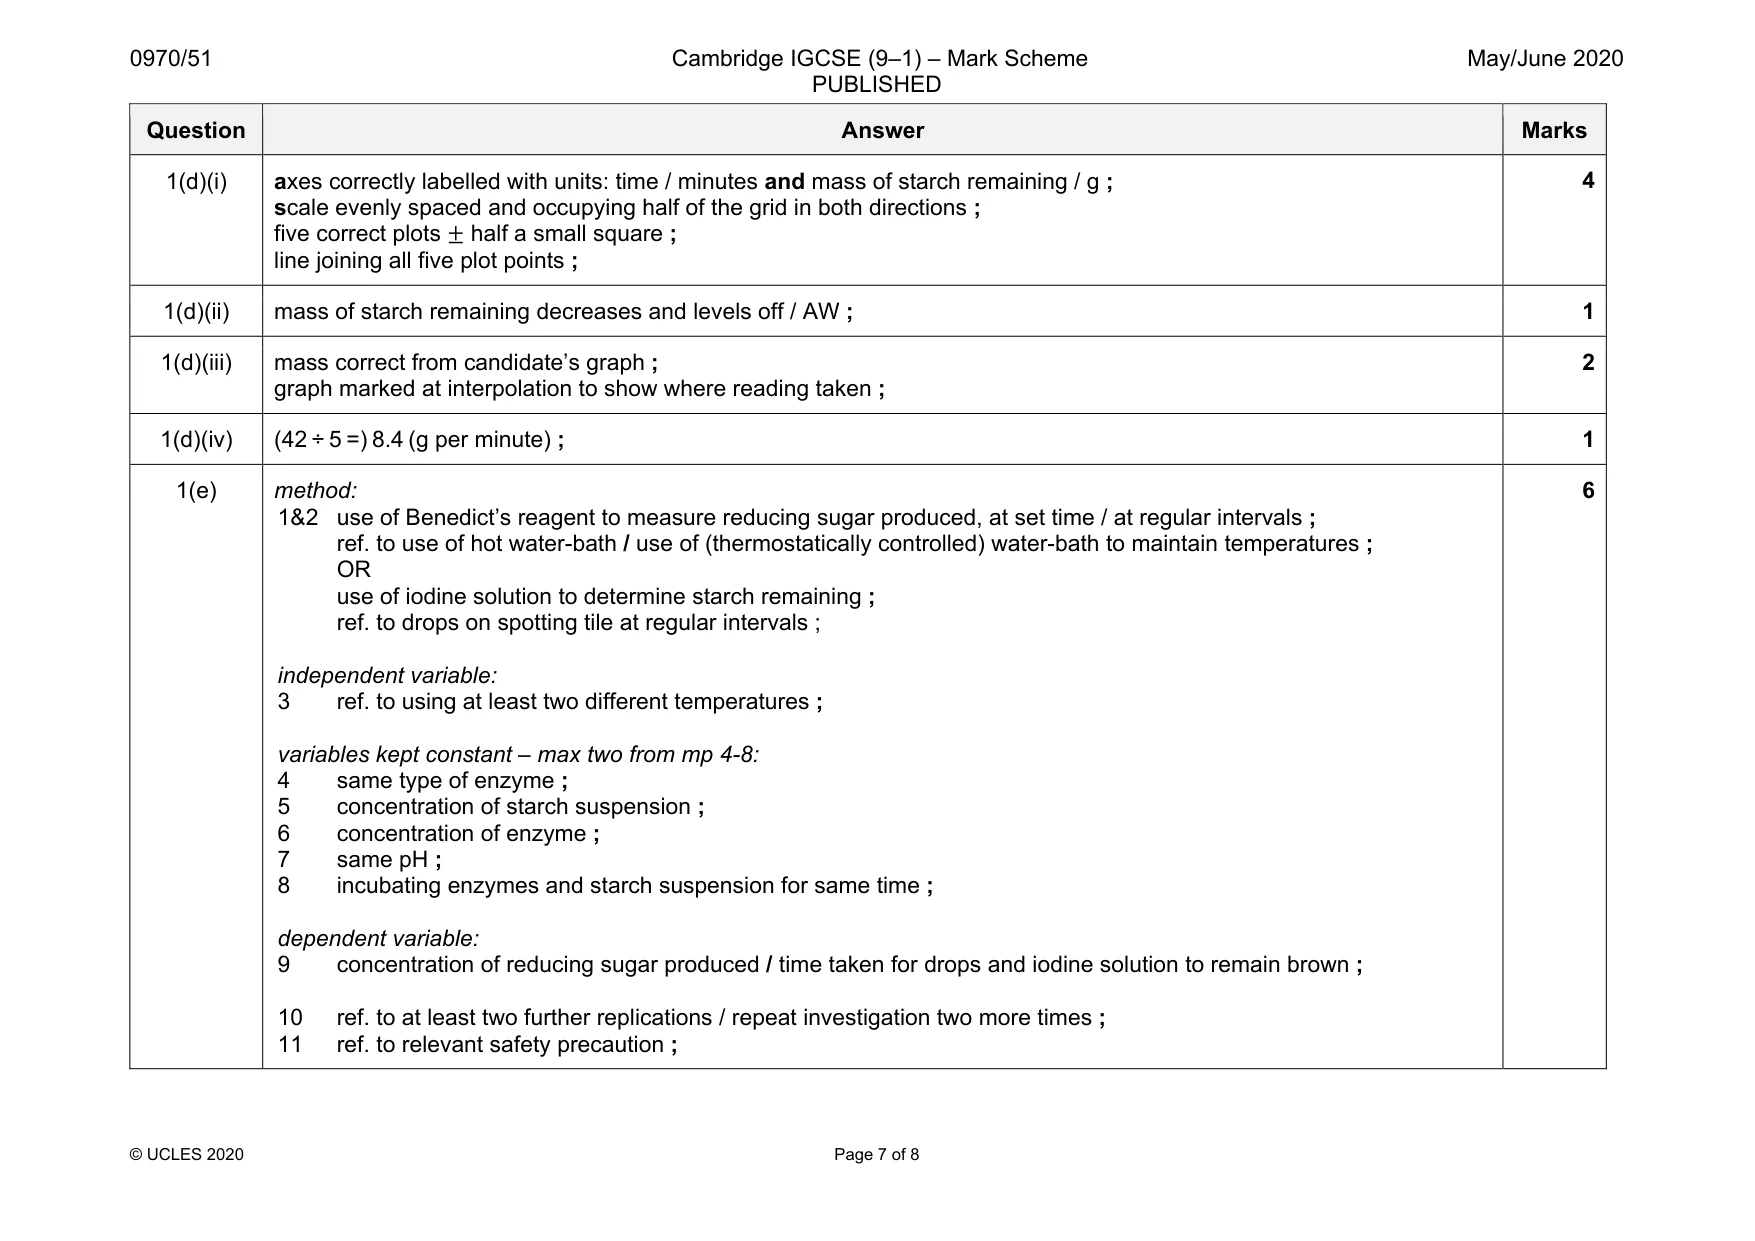
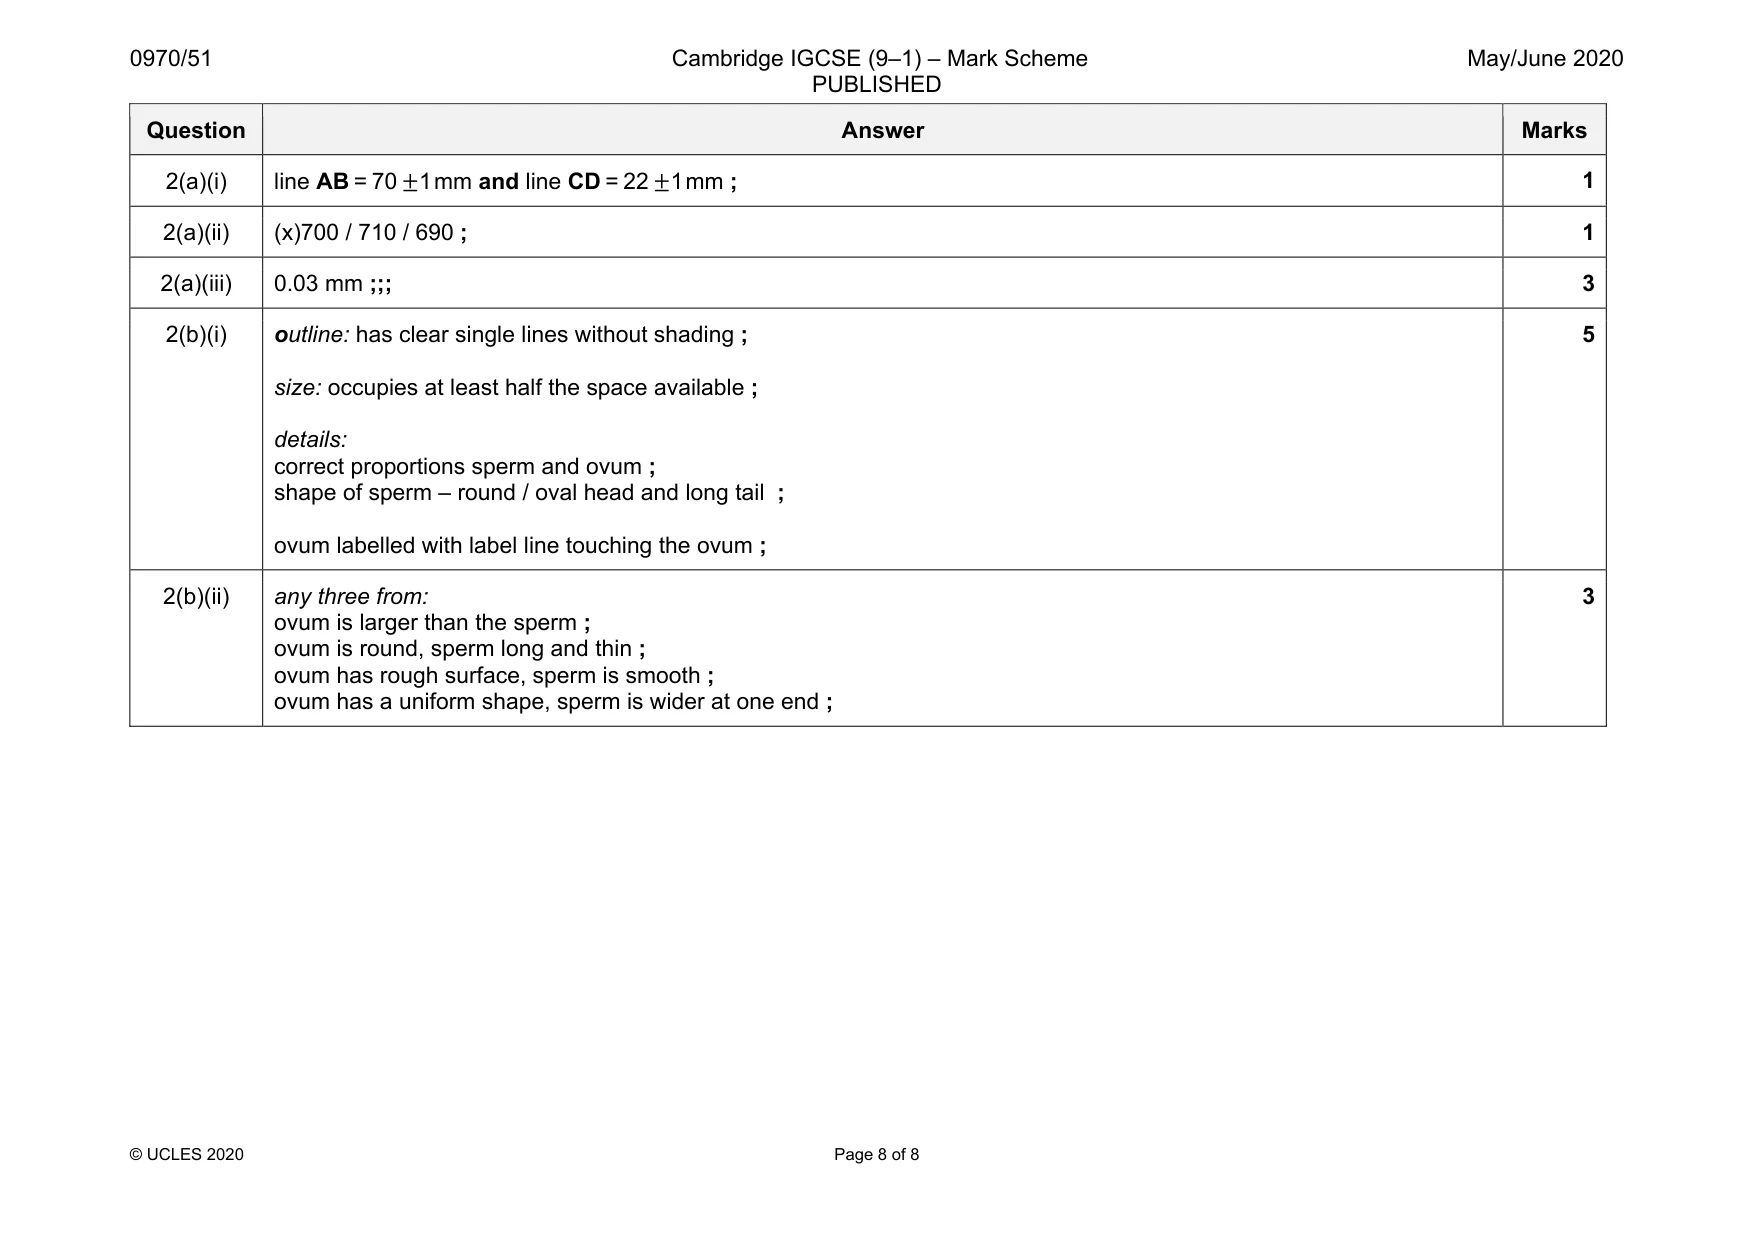
Mark scheme: 1(a)(i) 2 ; 1 1a(ii) initial temperature recorded ; 1 1(a)(iii) table drawn with two columns and a header row ; column headings with unit: test-tube and time (taken for colour change) / s ; four times recorded in seconds ; correct trend: times show expected pattern (A faster than C) ; 4 1(a)(iv) value that matches candidate’s results (expect 4% / same time as test-tube A) ; 1 1(a)(v) idea of comparing the times for D with A, B and C / AW ; 1 1(b)(i) error: temperature has decreased ; improvement: maintain temperature by, using a thermostatically controlled water-bath / Bunsen burner / adding hot water throughout the investigation (and monitoring) temperature / insulate beaker / AW ; 2 1(b)(ii) times are slower as temperature decreases / unable to identify the concentration of glucose in D with certainty / may underestimate the concentration ; 1 1(c) any two from: volume of glucose solution ; volume of Benedict’s solution ; concentration of Benedict’s solution ; time for mixing of test-tube contents ; 2 Question Answer Marks 1(d)(i) axes correctly labelled with units: time / minutes and mass of starch remaining / g ; scale evenly spaced and occupying half of the grid in both directions ; five correct plots ± half a small square ; line joining all five plot points ; 4 1(d)(ii) mass of starch remaining decreases and levels off / AW ; 1 1(d)(iii) mass correct from candidate’s graph ; graph marked at interpolation to show where reading taken ; 2 1(d)(iv) (42 ÷ 5 =) 8.4 (g per minute) ; 1 1(e) method: 1&2 use of Benedict’s reagent to measure reducing sugar produced, at set time / at regular intervals ; ref. to use of hot water-bath / use of (thermostatically controlled) water-bath to maintain temperatures ; OR use of iodine solution to determine starch remaining ; ref. to drops on spotting tile at regular intervals ; independent variable: 3 ref. to using at least two different temperatures ; variables kept constant – max two from mp 4-8: 4 same type of enzyme ; 5 concentration of starch suspension ; 6 concentration of enzyme ; 7 same pH ; 8 incubating enzymes and starch suspension for same time ; dependent variable: 9 concentration of reducing sugar produced / time taken for drops and iodine solution to remain brown ; 10 ref. to at least two further replications / repeat investigation two more times ; 11 ref. to relevant safety precaution ; 6
Q2 · Human reproduction involves a male gamete (sperm) and a female gamete (ovum)
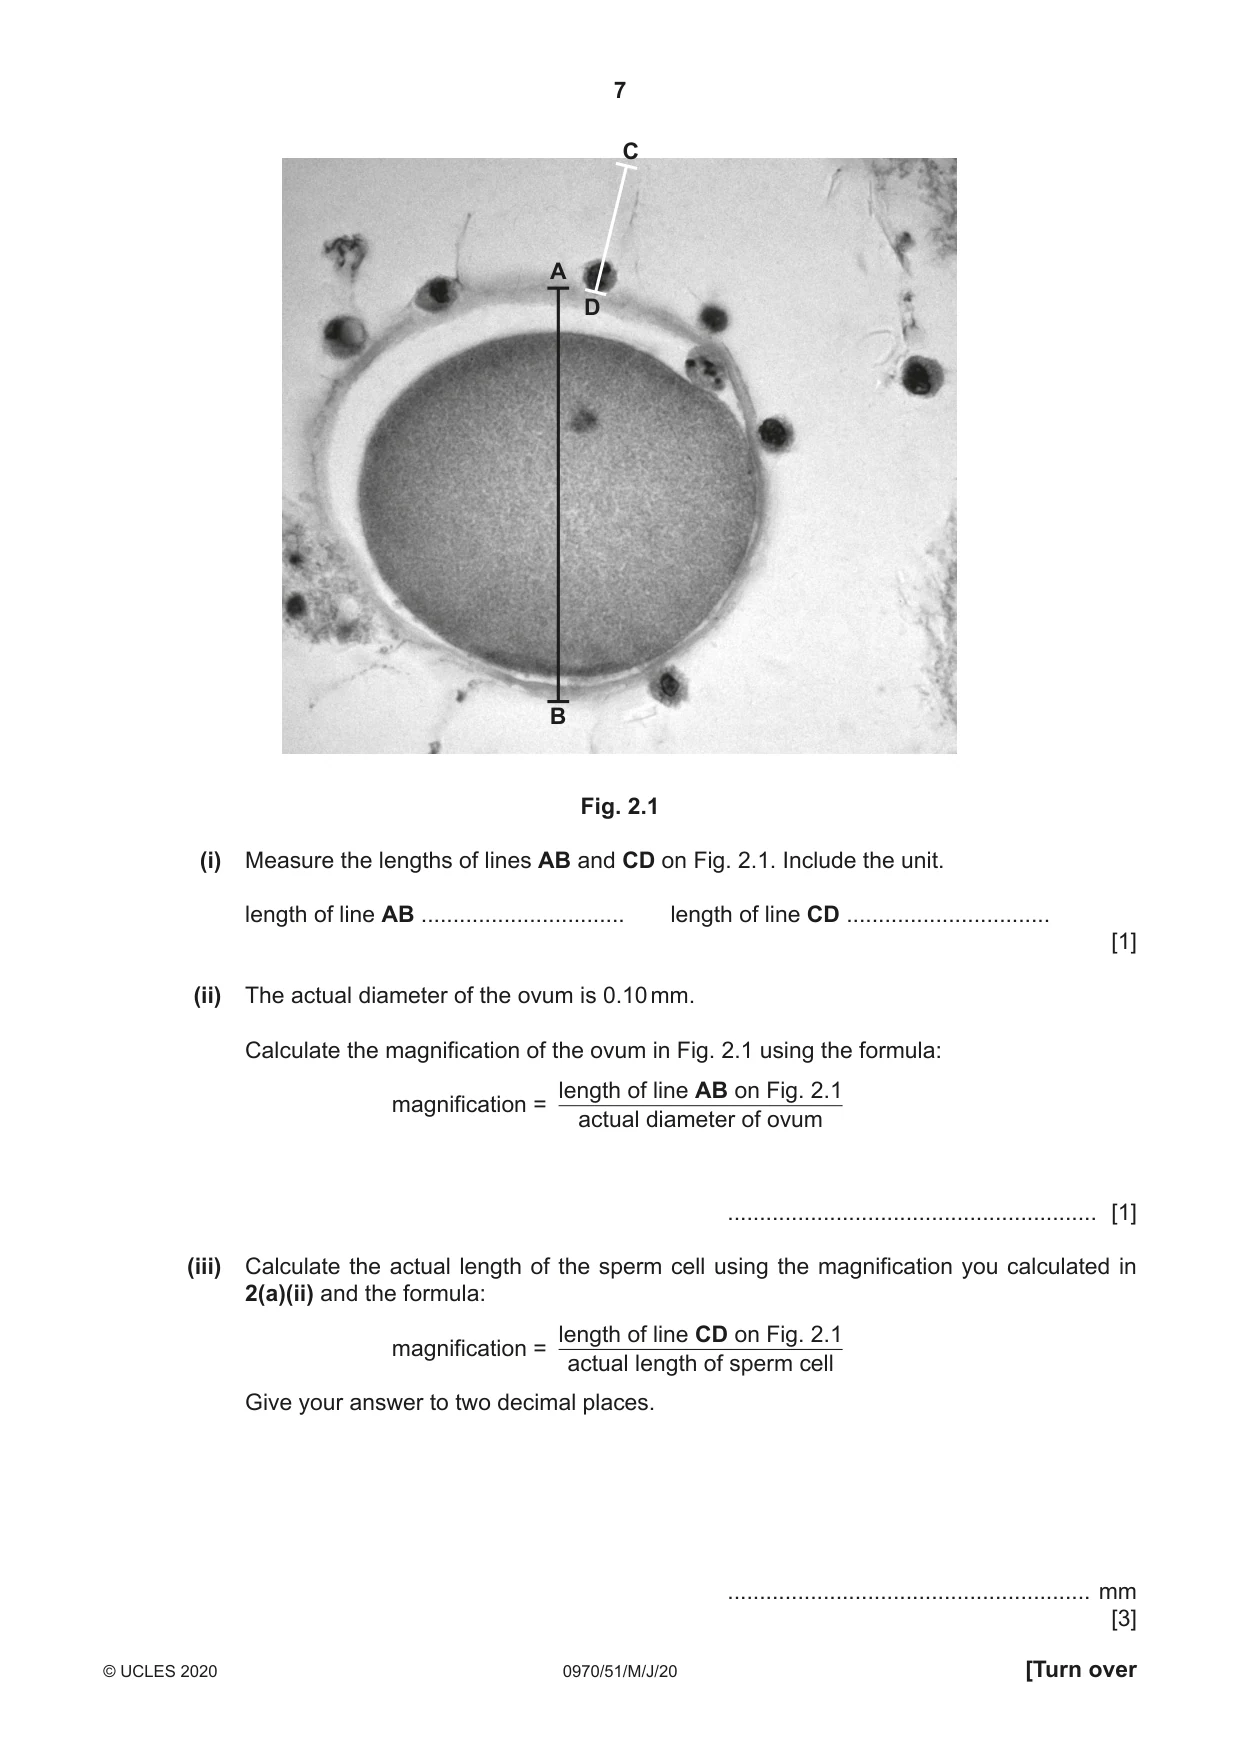
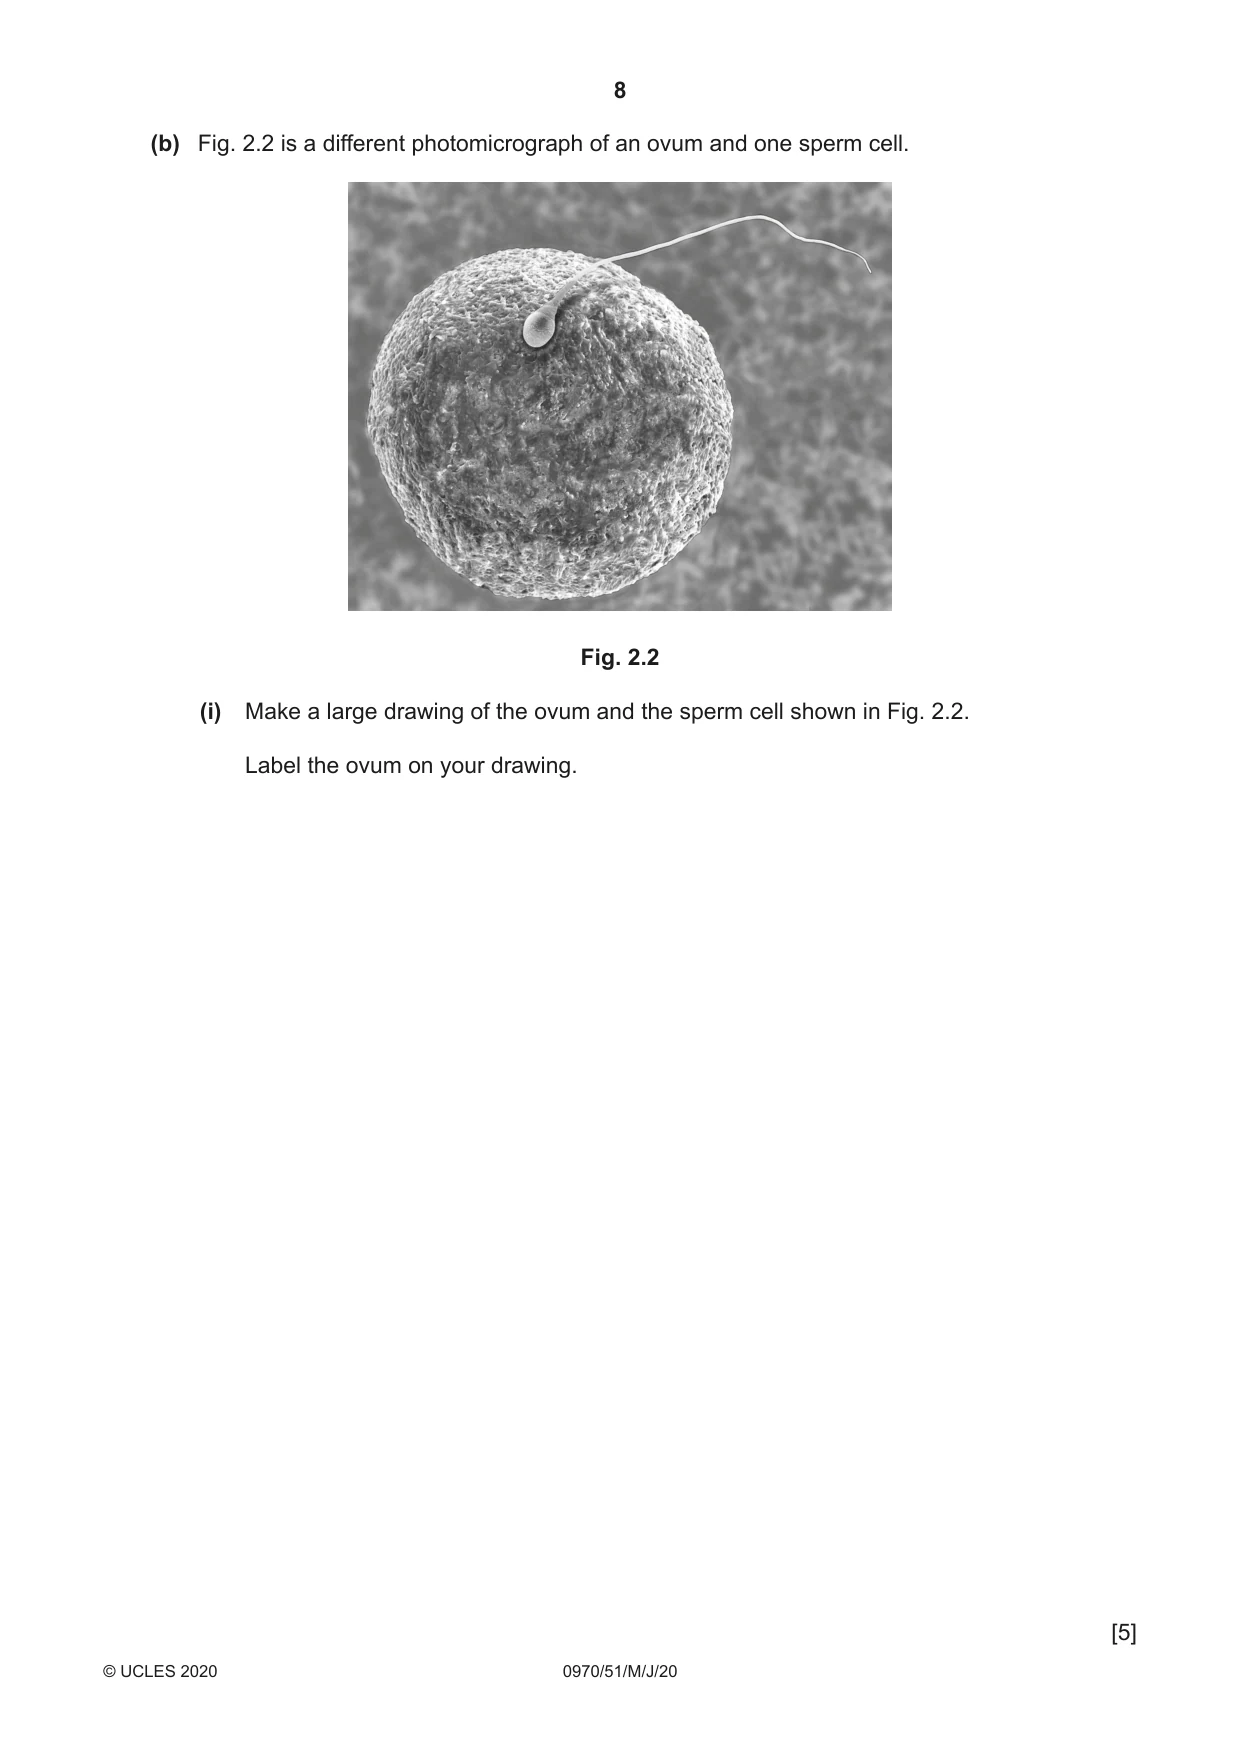
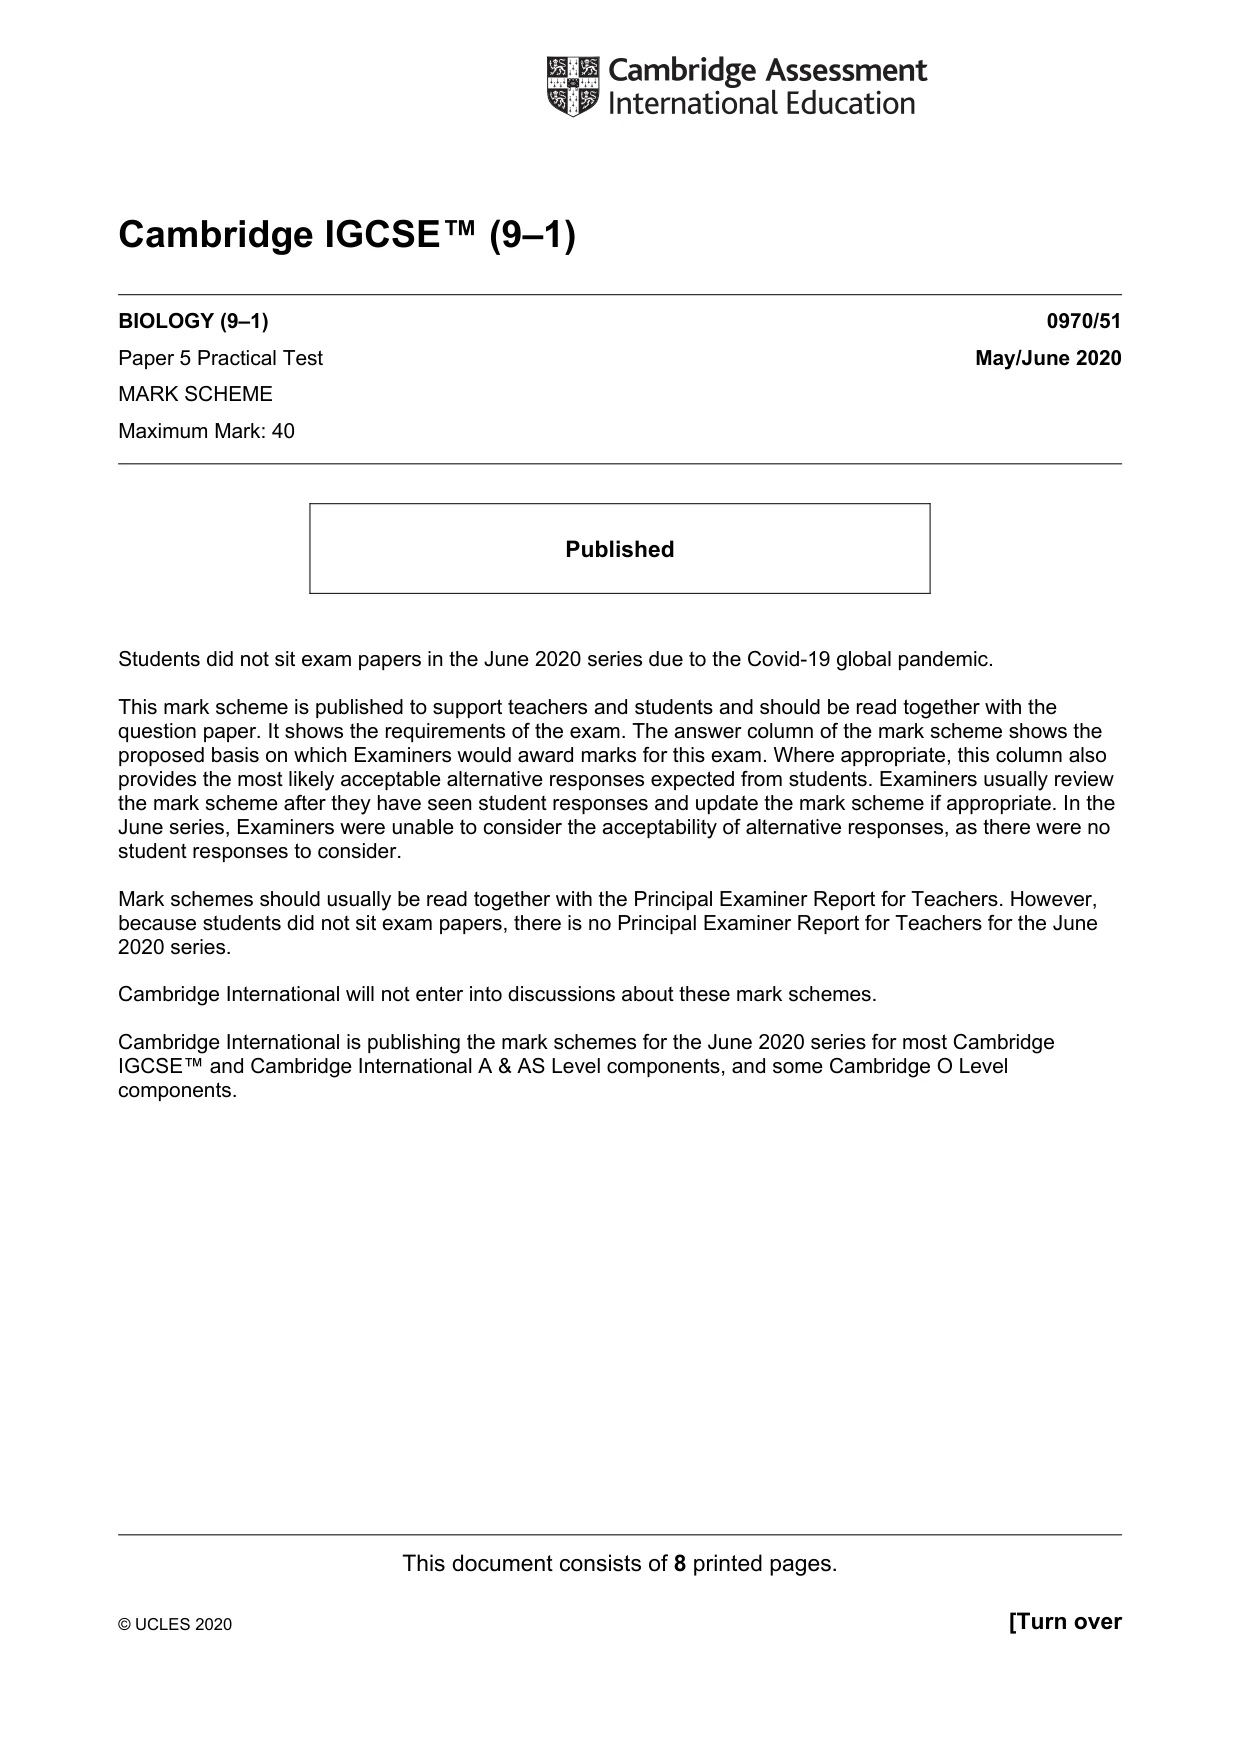
2 (a) Human reproduction involves a male gamete (sperm) and a female gamete (ovum). Fig. 2.1 is a photomicrograph of a single ovum and many sperm cells during fertilisation. Line AB represents the diameter of the ovum. Line CD represents the length of one sperm cell. C A D B Fig. 2.1 (i) Measure the lengths of lines AB and CD on Fig. 2.1. Include the unit. length of line AB ................................ length of line CD ................................ [1] (ii) The actual diameter of the ovum is 0.10 mm. Calculate the magnification of the ovum in Fig. 2.1 using the formula: length of line AB on Fig. 2.1 magnification = actual diameter of ovum .......................................................... [1] (iii) Calculate the actual length of the sperm cell using the magnification you calculated in 2(a)(ii) and the formula: length of line CD on Fig. 2.1 magnification = actual length of sperm cell Give your answer to two decimal places. ......................................................... mm [3] (b) Fig. 2.2 is a different photomicrograph of an ovum and one sperm cell. Fig. 2.2 (i) Make a large drawing of the ovum and the sperm cell shown in Fig. 2.2. Label the ovum on your drawing.
Mark scheme: 2(a)(i) 2(a)(ii) (x)700 / 710 / 690 ; 1 2(a)(iii) 0.03 mm ;;; 3 2(b)(i) outline: has clear single lines without shading ; size: occupies at least half the space available ; details: correct proportions sperm and ovum ; shape of sperm – round / oval head and long tail ; ovum labelled with label line touching the ovum ; 5 2(b)(ii) any three from: ovum is larger than the sperm ; ovum is round, sperm long and thin ; ovum has rough surface, sperm is smooth ; ovum has a uniform shape, sperm is wider at one end ; 3
What was in this paper
The subtopics covered by these 2 questions, and how many questions each got. Open one in a new tab to see every Cambridge question on it.