Cambridge IGCSE Biology (9-1) 0970 — 2022 Oct/Nov Paper 6 · Variant 2
0970/62/O/N/22 · 2 questions · 40 marks · ≈45 min
The question paper and its mark scheme, free to read here and free to download. This is Cambridge’s own paper, exactly as it was sat.
Question paper12 pages

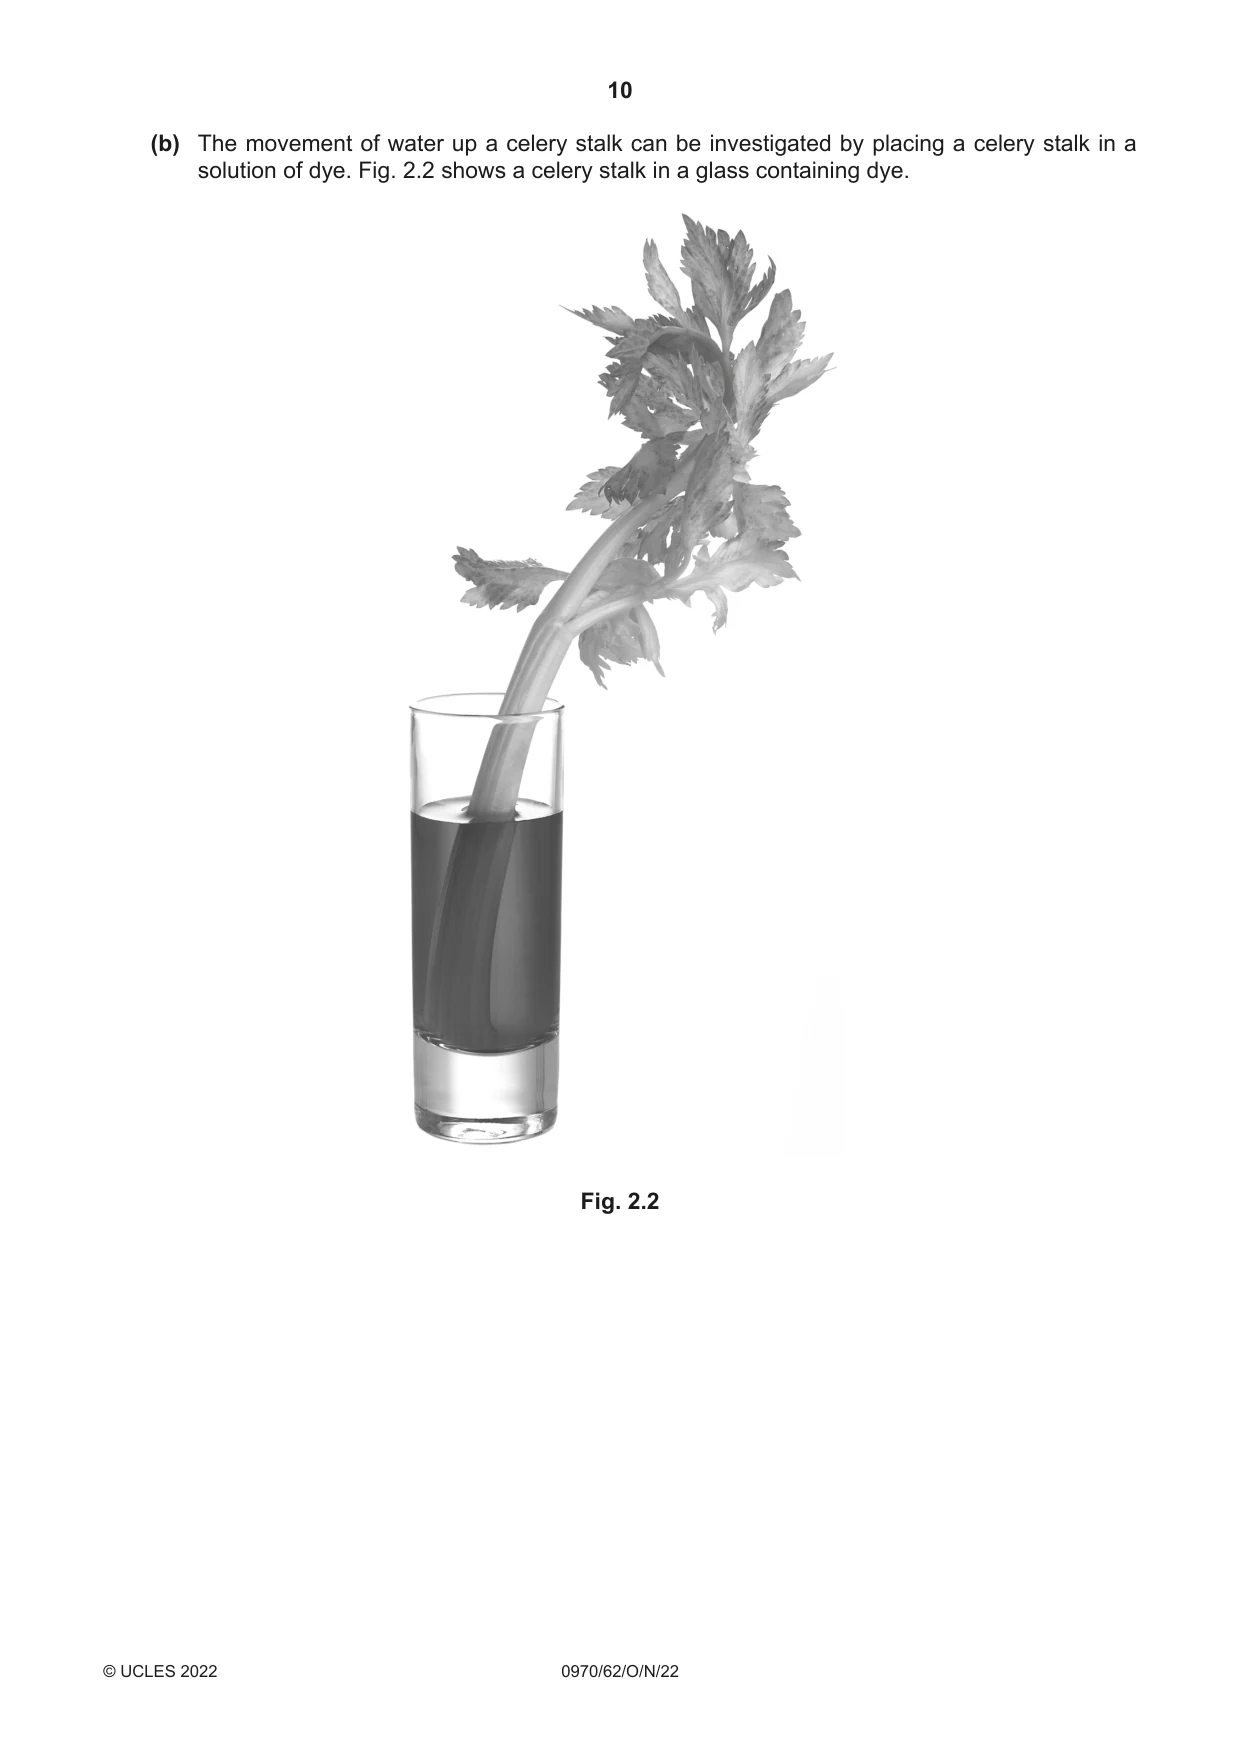

Mark scheme10 pages
Answers below. Sit the paper first if you are practising.
Questions as text
Q1 · Some students investigated the effect of hydrogen peroxide concentration on the activity…
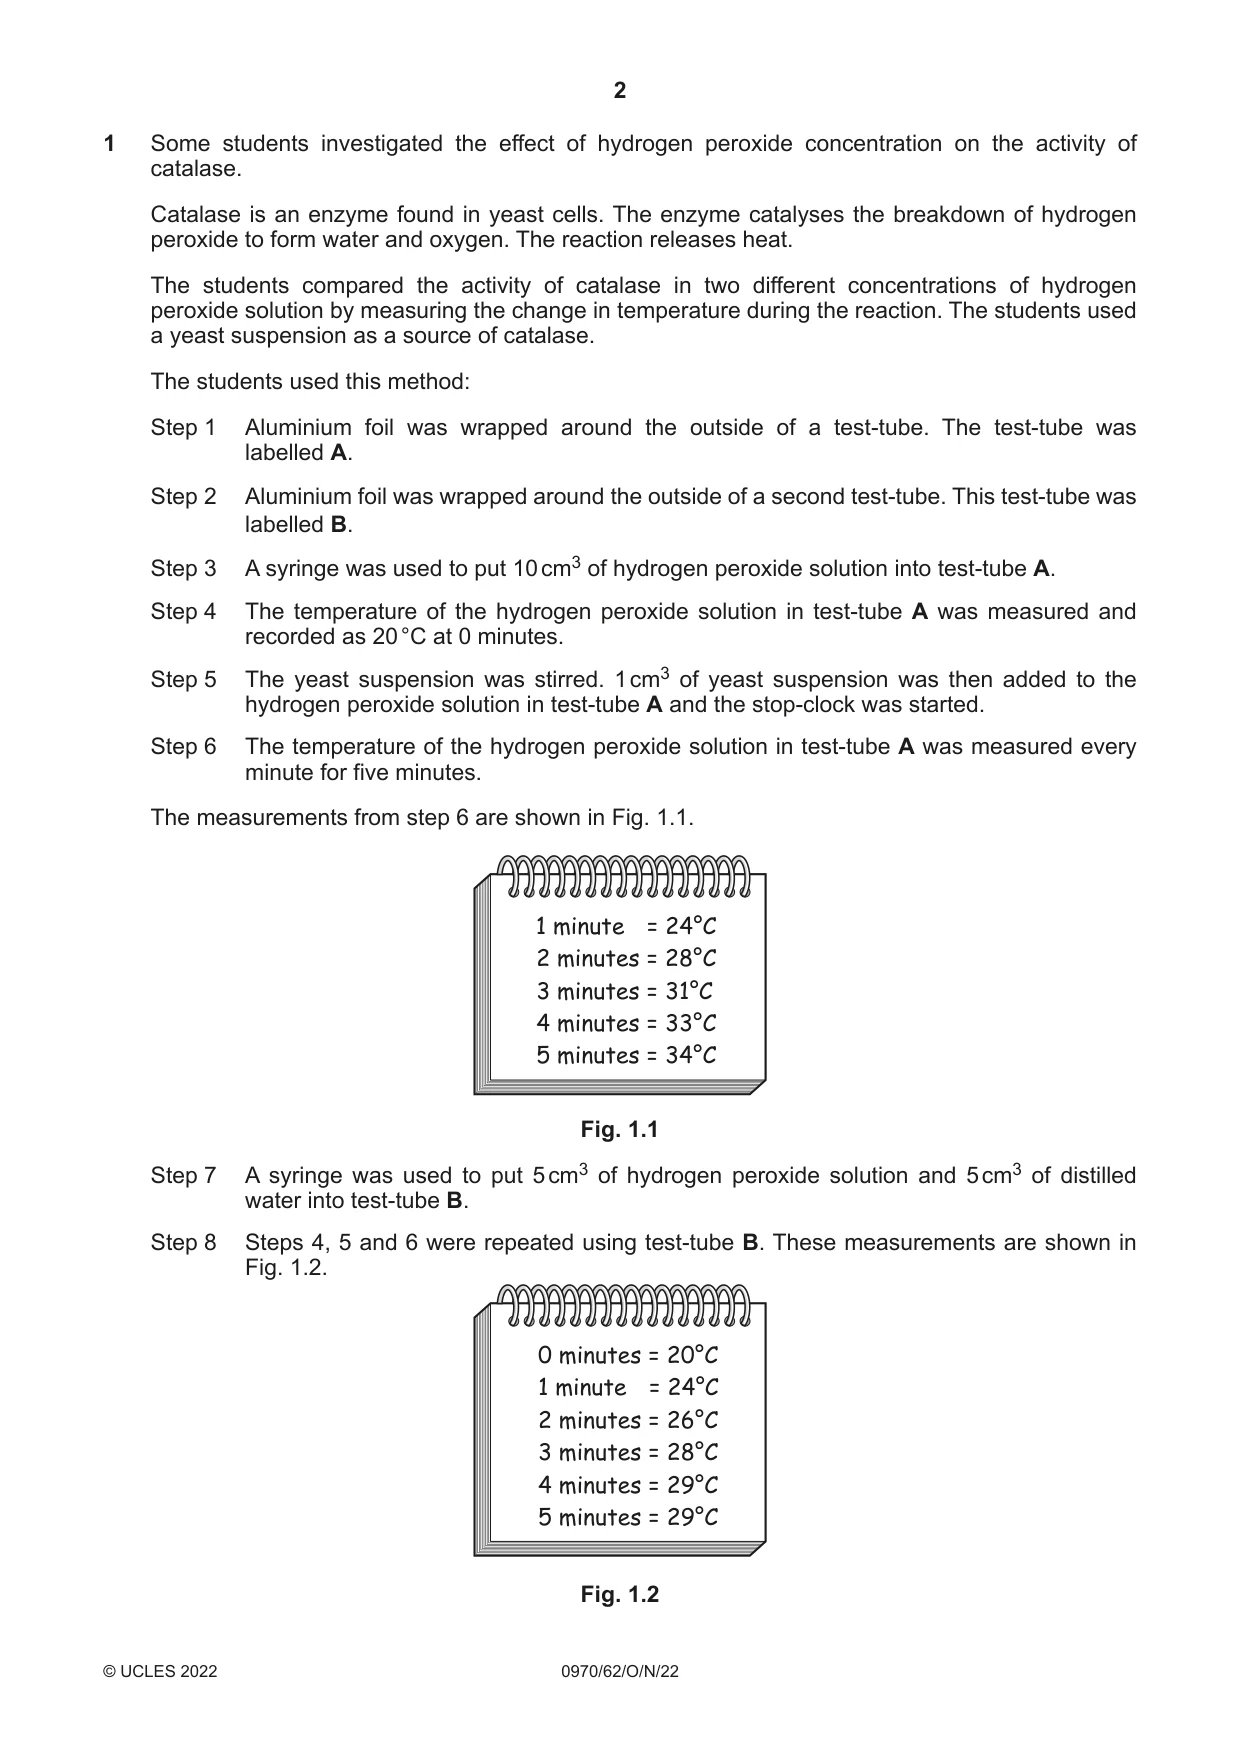
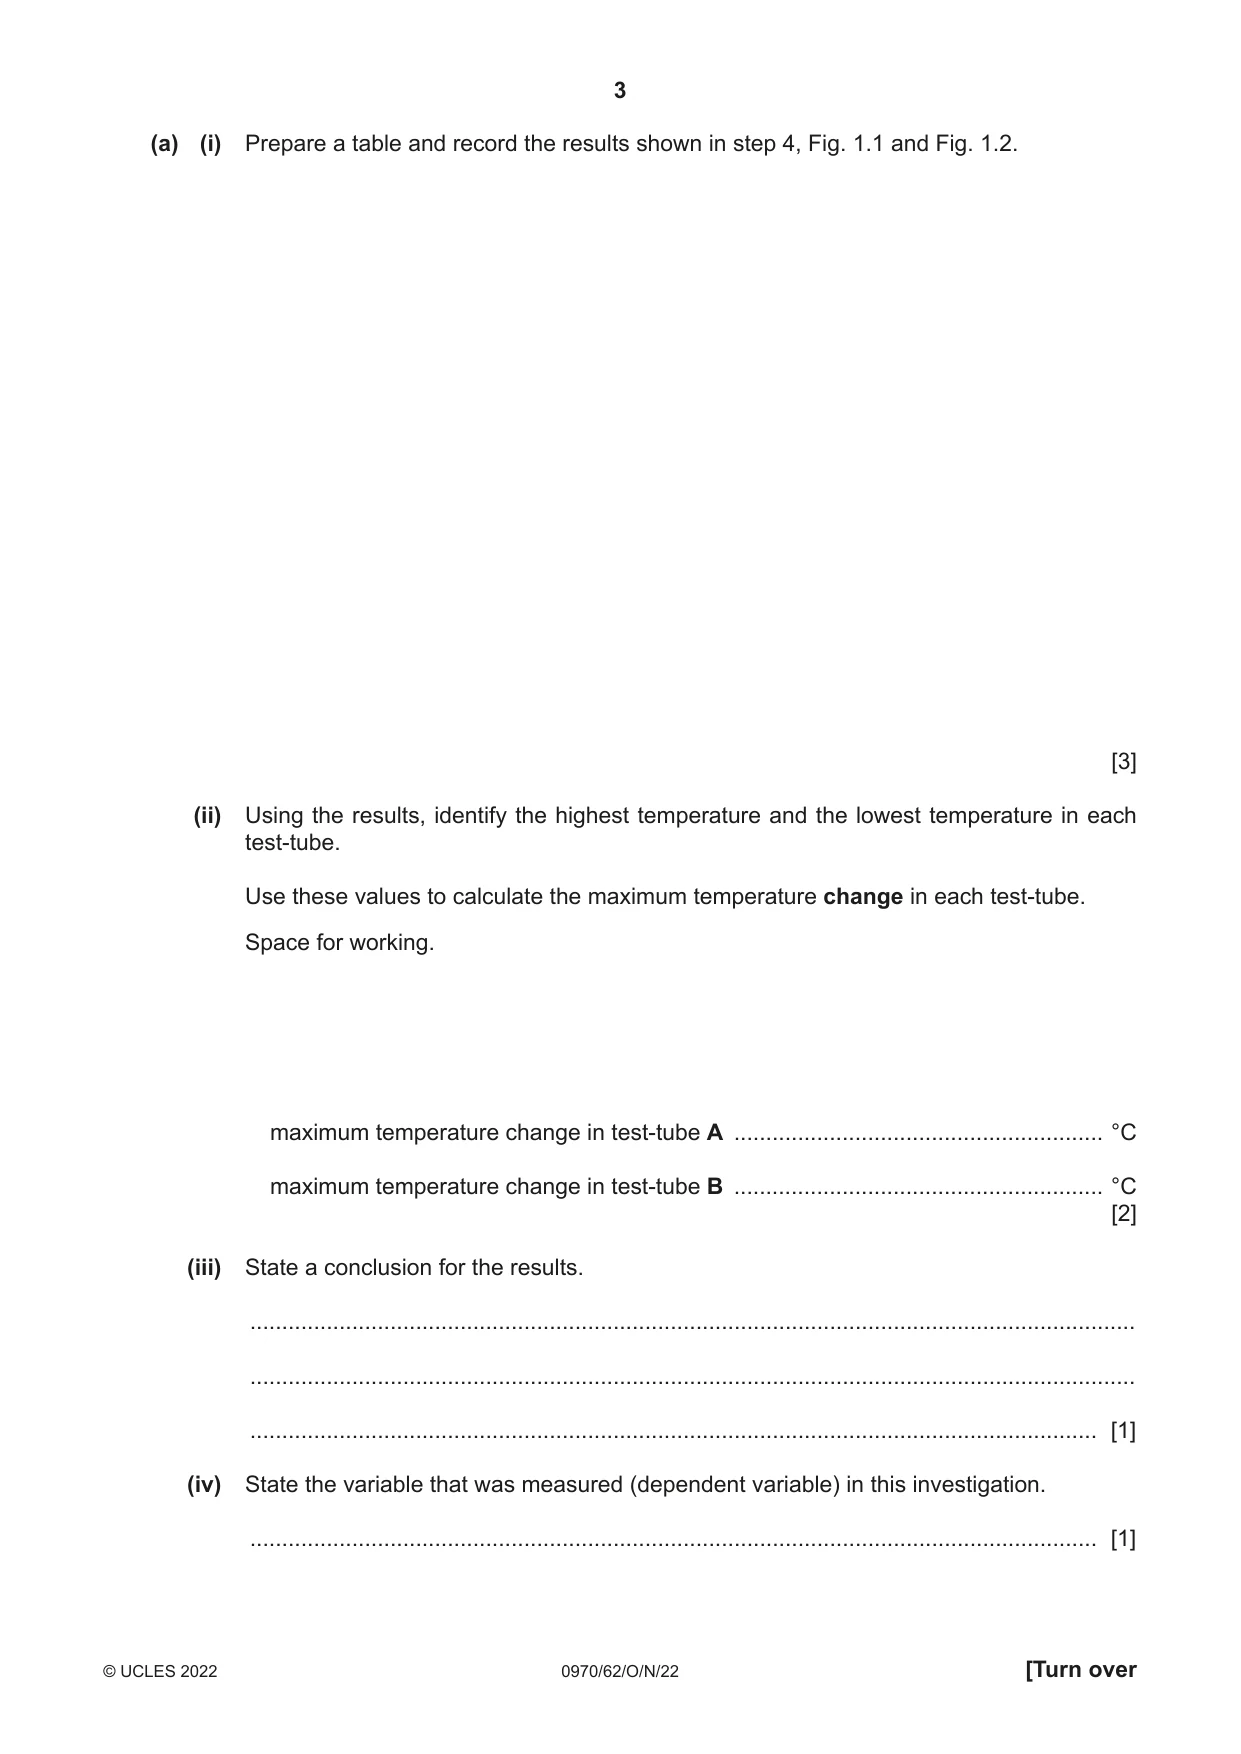
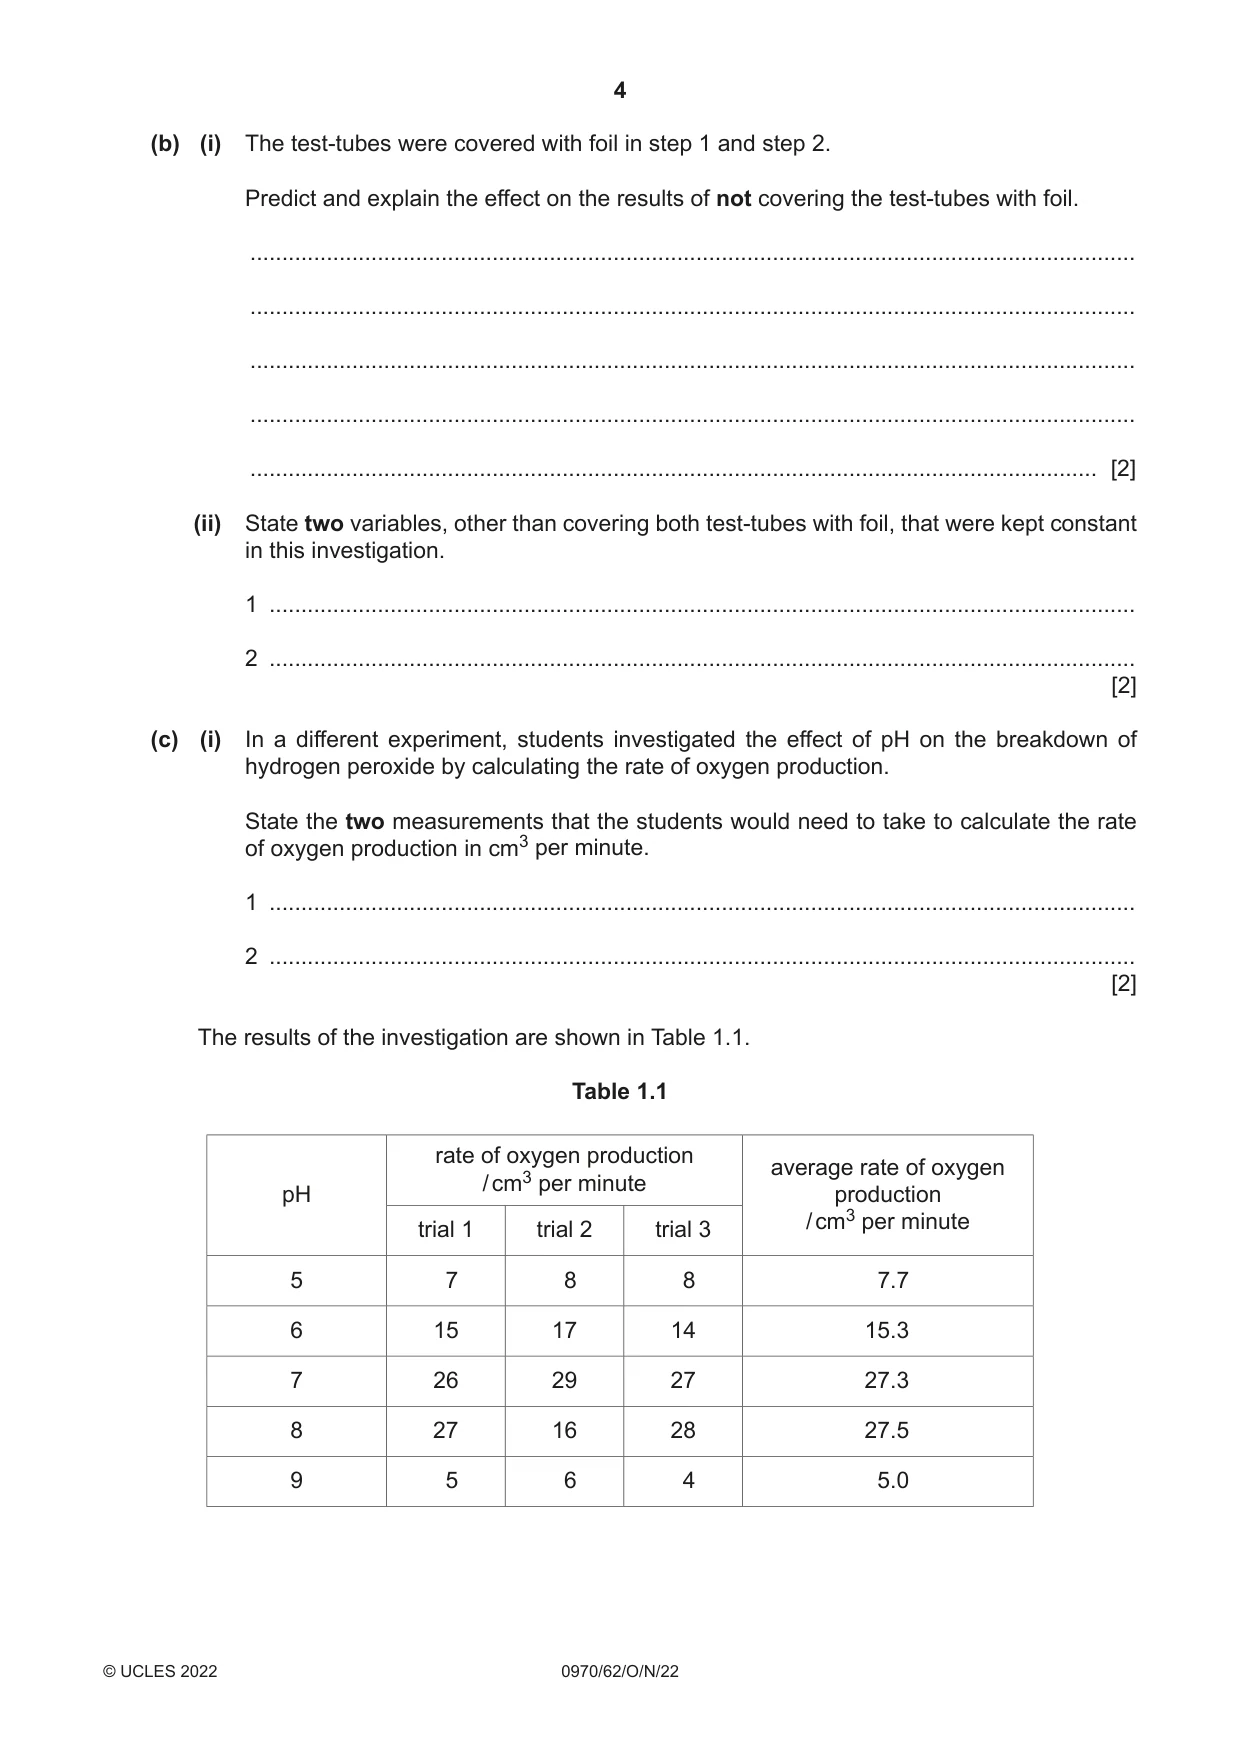
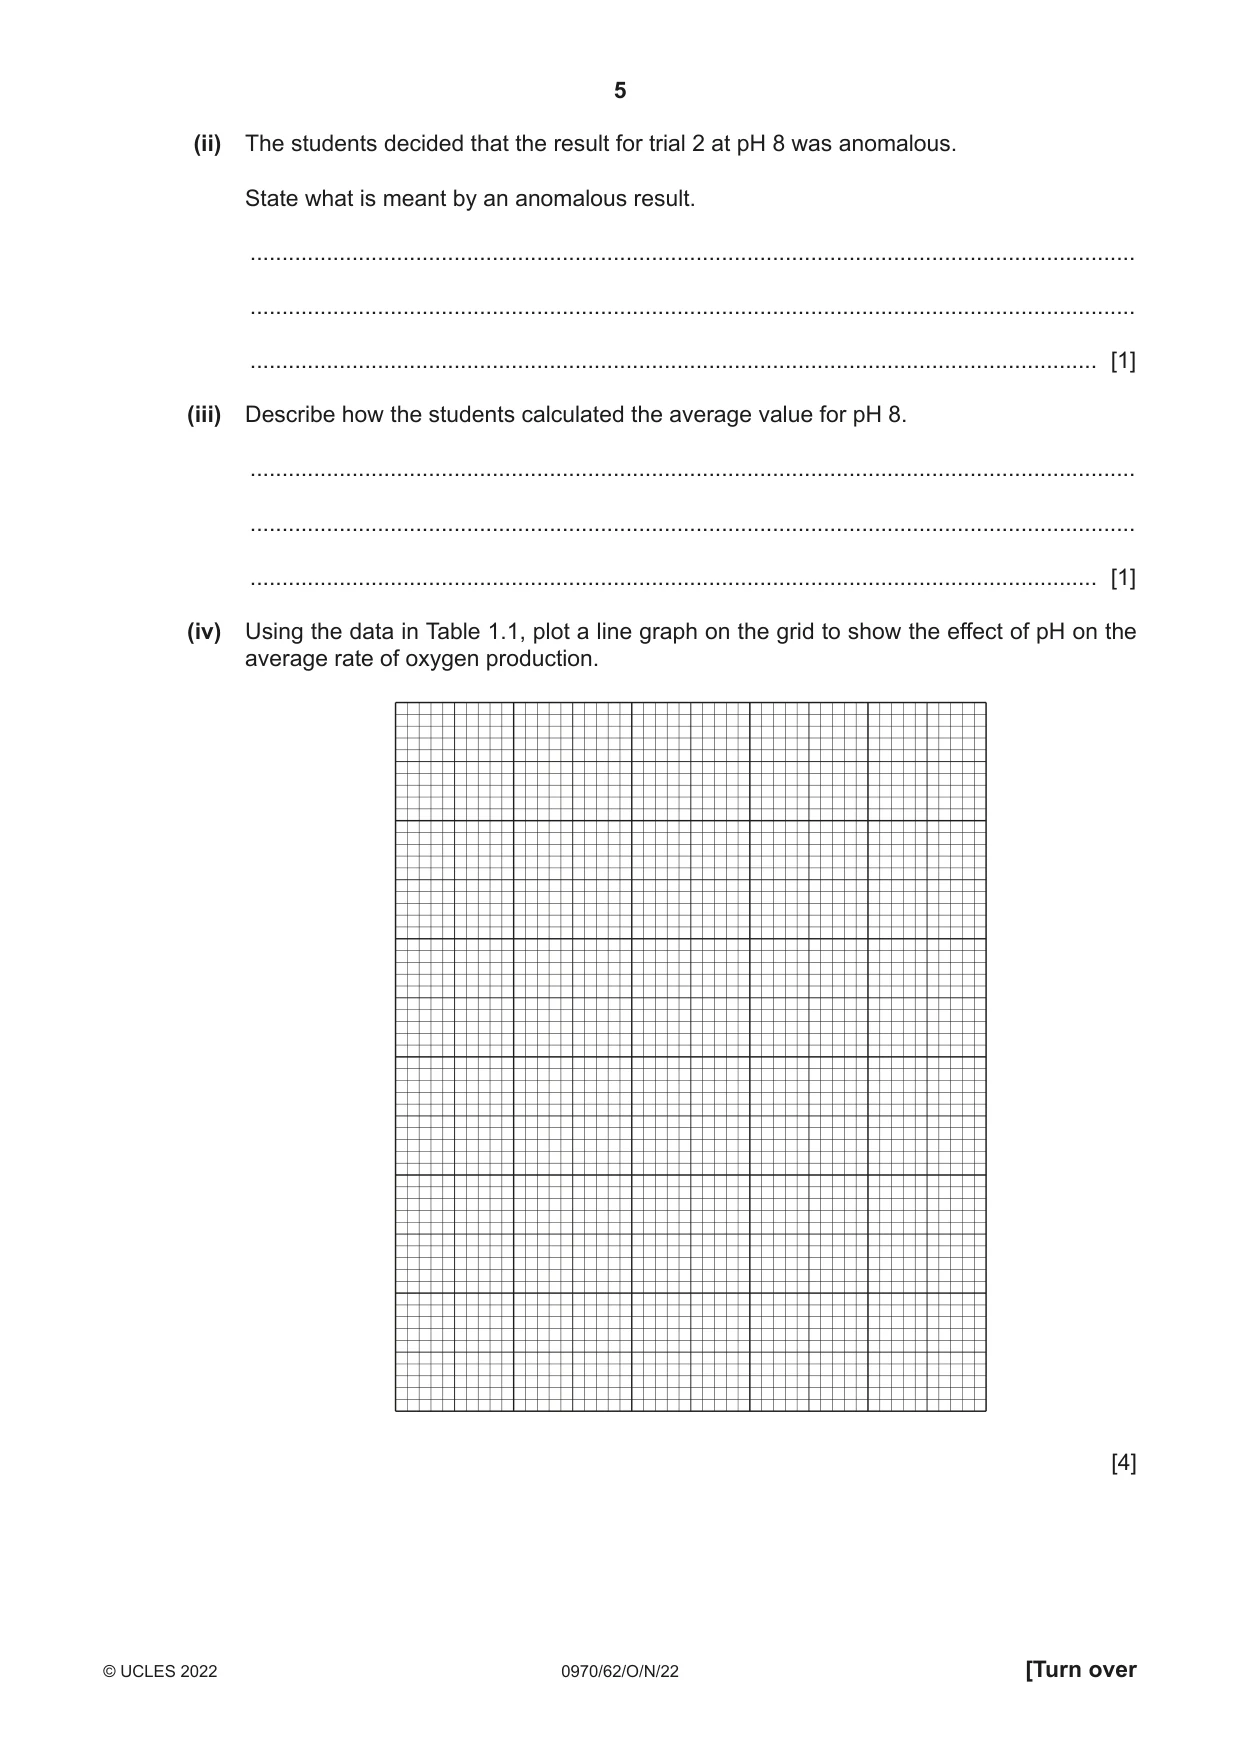
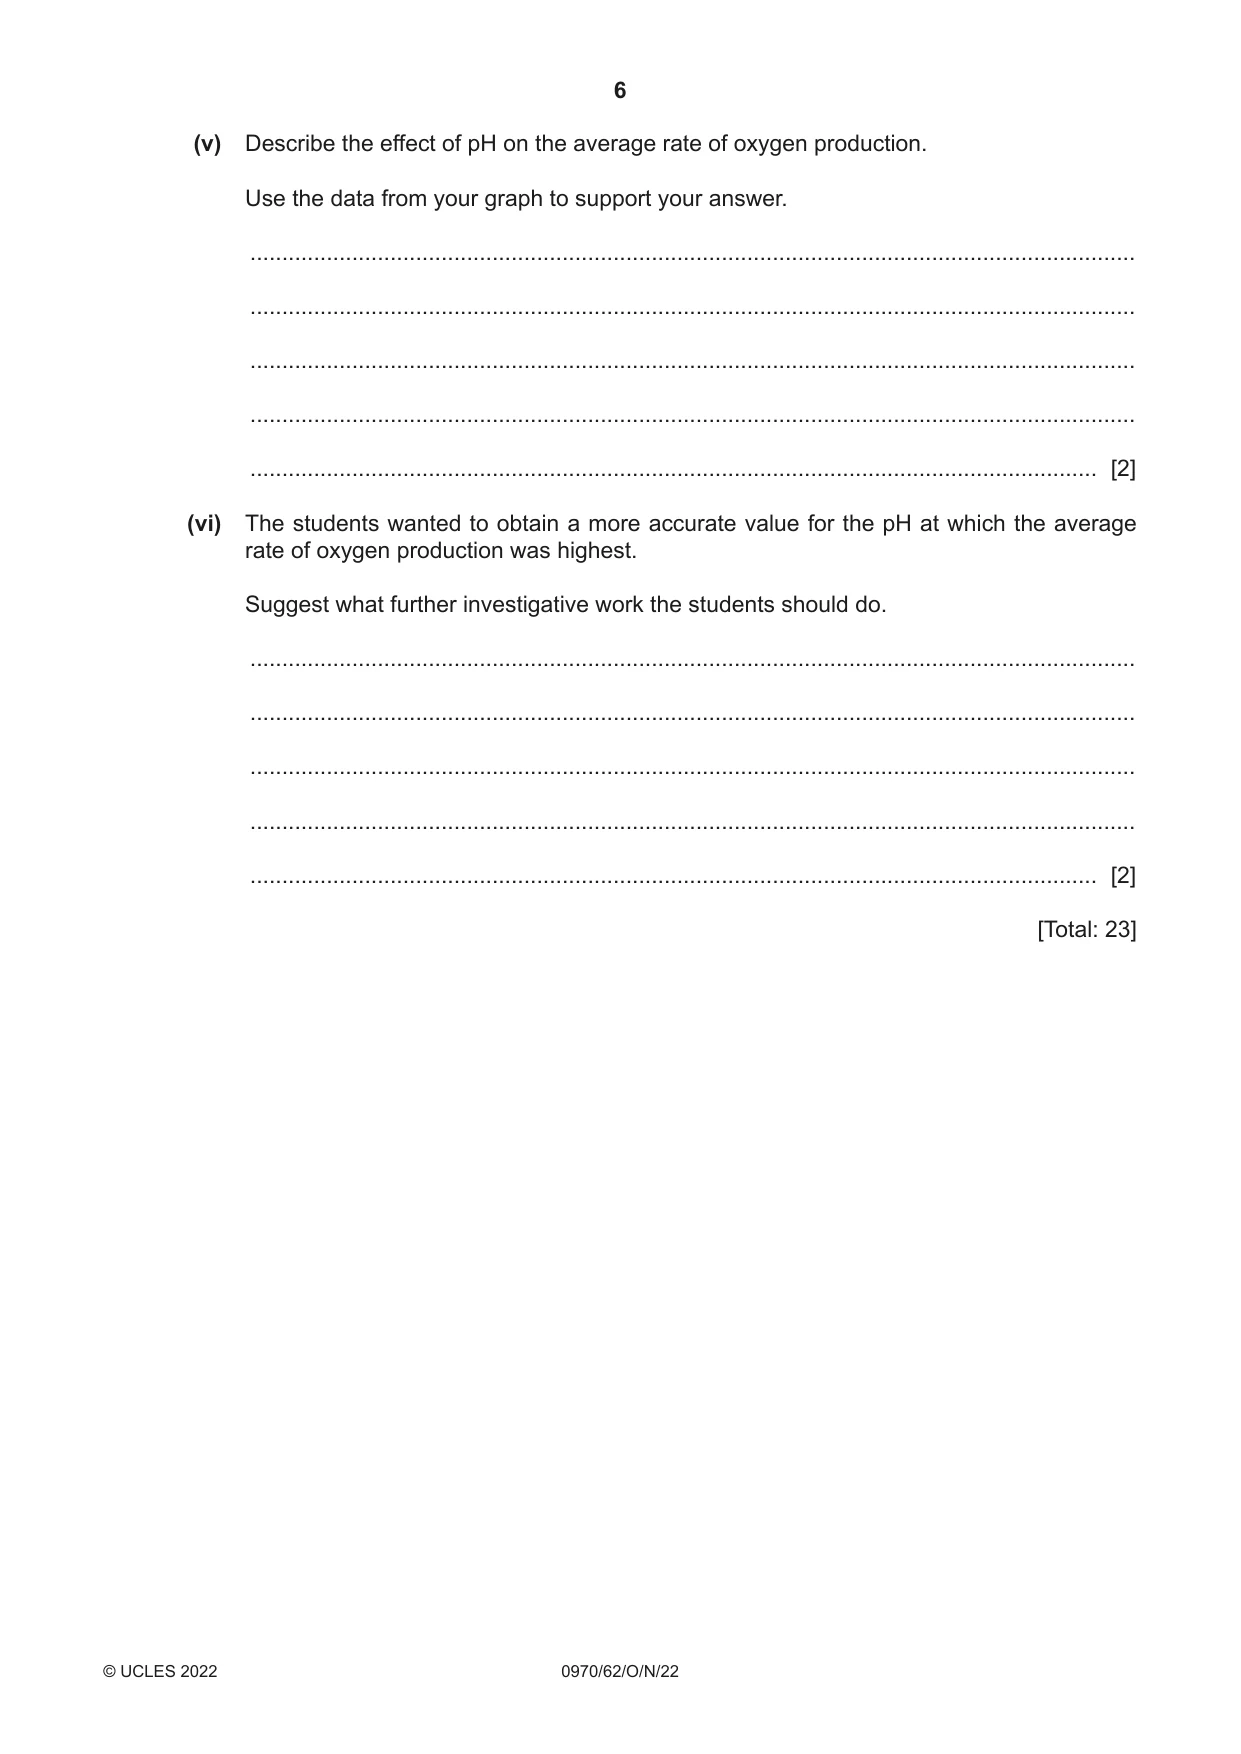
1 Some students investigated the effect of hydrogen peroxide concentration on the activity of catalase. Catalase is an enzyme found in yeast cells. The enzyme catalyses the breakdown of hydrogen peroxide to form water and oxygen. The reaction releases heat. The students compared the activity of catalase in two different concentrations of hydrogen peroxide solution by measuring the change in temperature during the reaction. The students used a yeast suspension as a source of catalase. The students used this method: Step 1 Aluminium foil was wrapped around the outside of a test-tube. The test-tube was labelled A. Step 2 Aluminium foil was wrapped around the outside of a second test-tube. This test-tube was labelled B. Step 3 A syringe was used to put 10 cm3 of hydrogen peroxide solution into test-tube A. Step 4 The temperature of the hydrogen peroxide solution in test-tube A was measured and recorded as 20 °C at 0 minutes. Step 5 The yeast suspension was stirred. 1 cm3 of yeast suspension was then added to the hydrogen peroxide solution in test-tube A and the stop-clock was started. Step 6 The temperature of the hydrogen peroxide solution in test-tube A was measured every minute for five minutes. The measurements from step 6 are shown in Fig. 1.1. 1 minute = 24°C 2 minutes = 28°C 3 minutes = 31°C 4 minutes = 33°C 5 minutes = 34°C Fig. 1.1 Step 7 A syringe was used to put 5 cm3 of hydrogen peroxide solution and 5 cm3 of distilled water into test-tube B. Step 8 Steps 4, 5 and 6 were repeated using test-tube B. These measurements are shown in Fig. 1.2. 0 minutes = 20°C 1 minute = 24°C 2 minutes = 26°C 3 minutes = 28°C 4 minutes = 29°C 5 minutes = 29°C Fig. 1.2 (a) (i) Prepare a table and record the results shown in step 4, Fig. 1.1 and Fig. 1.2. [3] (ii) Using the results, identify the highest temperature and the lowest temperature in each test-tube. Use these values to calculate the maximum temperature change in each test-tube. Space for working. maximum temperature change in test-tube A .......................................................... °C maximum temperature change in test-tube B .......................................................... °C [2] (iii) State a conclusion for the results. ........................................................................................................................................... ........................................................................................................................................... ..................................................................................................................................... [1] (iv) State the variable that was measured (dependent variable) in this investigation. ..................................................................................................................................... [1] (b) (i) The test-tubes were covered with foil in step 1 and step 2. Predict and explain the effect on the results of not covering the test-tubes with foil. ........................................................................................................................................... ........................................................................................................................................... ........................................................................................................................................... ........................................................................................................................................... ..................................................................................................................................... [2] (ii) State two variables, other than covering both test-tubes with foil, that were kept constant in this investigation. 1 ........................................................................................................................................ 2 ........................................................................................................................................ [2] (c) (i) In a different experiment, students investigated the effect of pH on the breakdown of hydrogen peroxide by calculating the rate of oxygen production. State the two measurements that the students would need to take to calculate the rate of oxygen production in cm3 per minute. 1 ........................................................................................................................................ 2 ........................................................................................................................................ [2] The results of the investigation are shown in Table 1.1. Table 1.1 rate of oxygen production average rate of oxygen / cm3 per minute pH production / cm3 per minute trial 1 trial 2 trial 3 5 7 8 8 7.7 6 15 17 14 15.3 7 26 29 27 27.3 8 27 16 28 27.5 9 5 6 4 5.0 (ii) The students decided that the result for trial 2 at pH 8 was anomalous. State what is meant by an anomalous result. ........................................................................................................................................... ........................................................................................................................................... ..................................................................................................................................... [1] (iii) Describe how the students calculated the average value for pH 8. ........................................................................................................................................... ........................................................................................................................................... ..................................................................................................................................... [1] (iv) Using the data in Table 1.1, plot a line graph on the grid to show the effect of pH on the average rate of oxygen production. [4] (v) Describe the effect of pH on the average rate of oxygen production. Use the data from your graph to support your answer. ........................................................................................................................................... ........................................................................................................................................... ........................................................................................................................................... ........................................................................................................................................... ..................................................................................................................................... [2] (vi) The students wanted to obtain a more accurate value for the pH at which the average rate of oxygen production was highest. Suggest what further investigative work the students should do. ........................................................................................................................................... ........................................................................................................................................... ........................................................................................................................................... ........................................................................................................................................... ..................................................................................................................................... [2] [Total: 23]
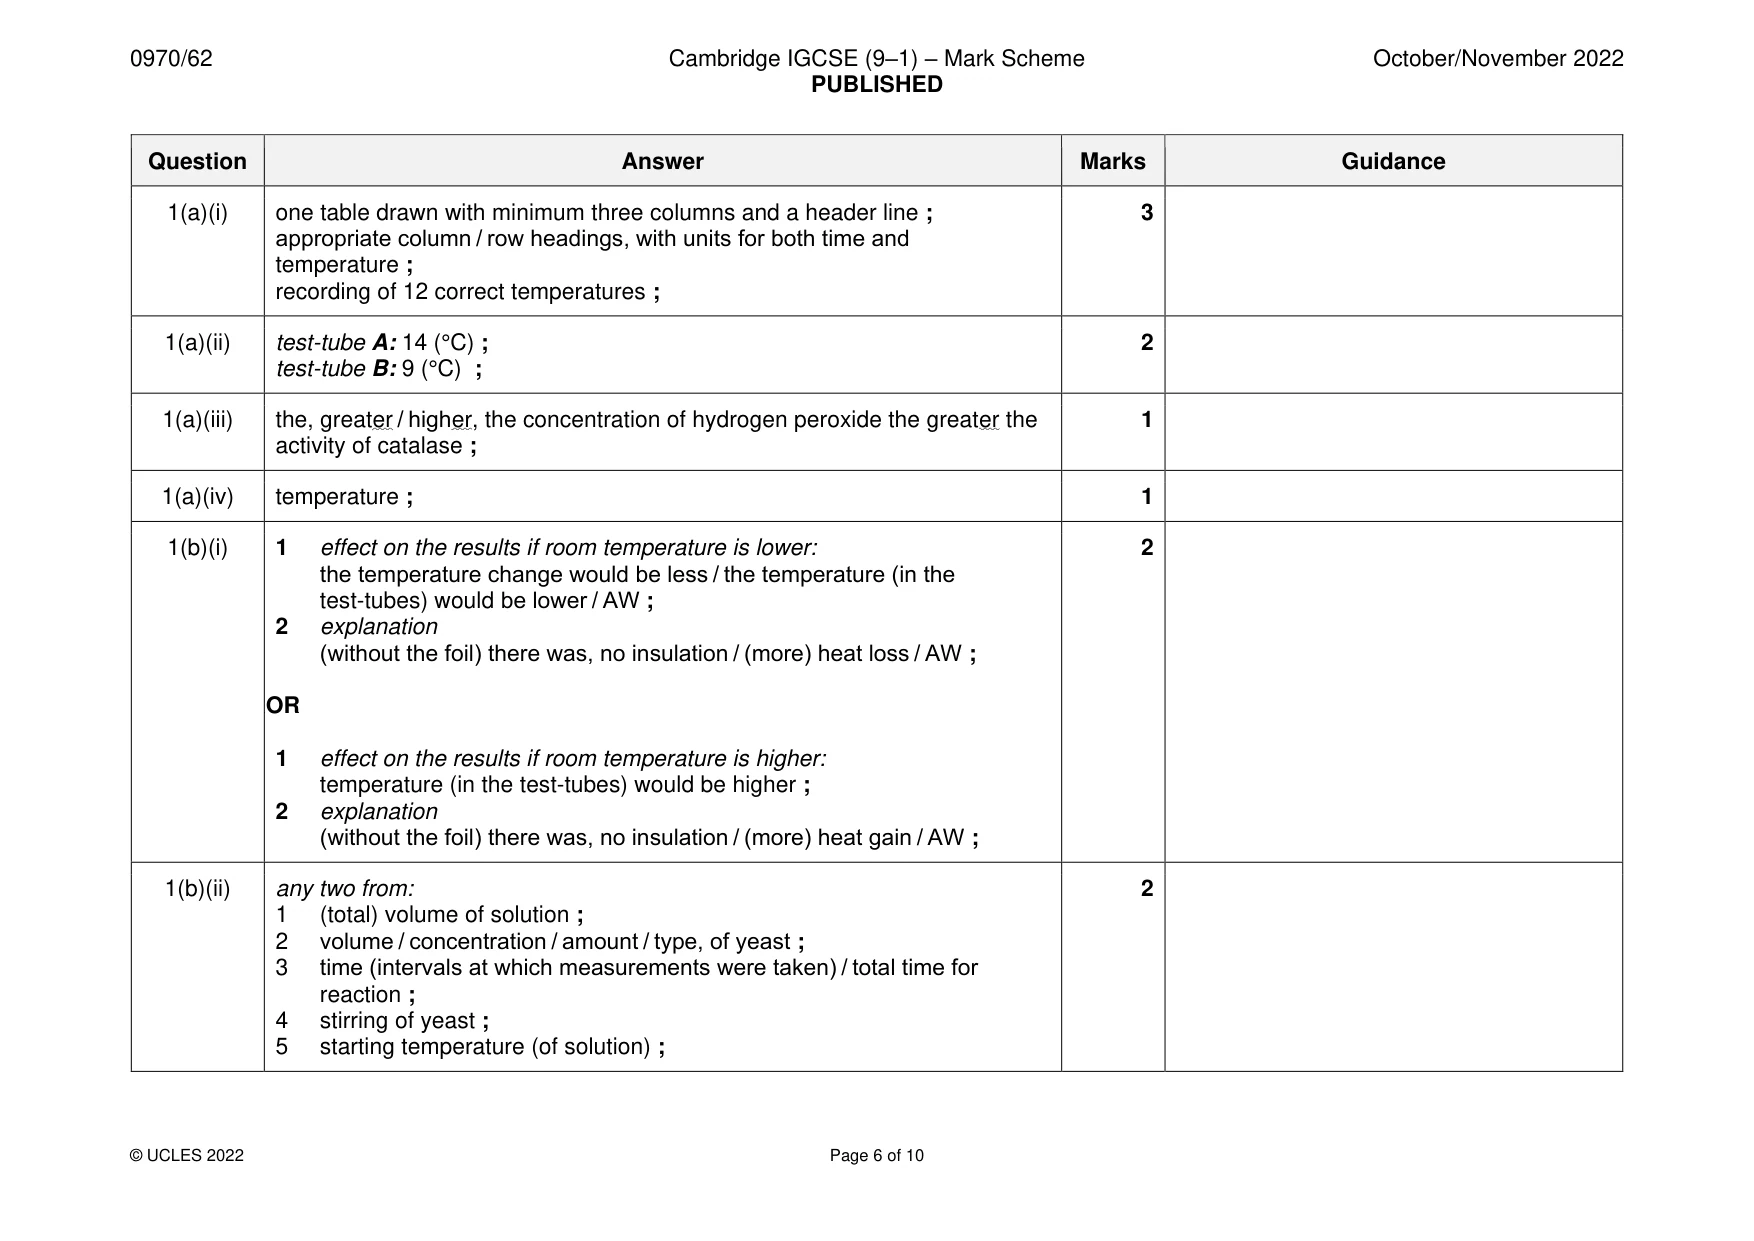
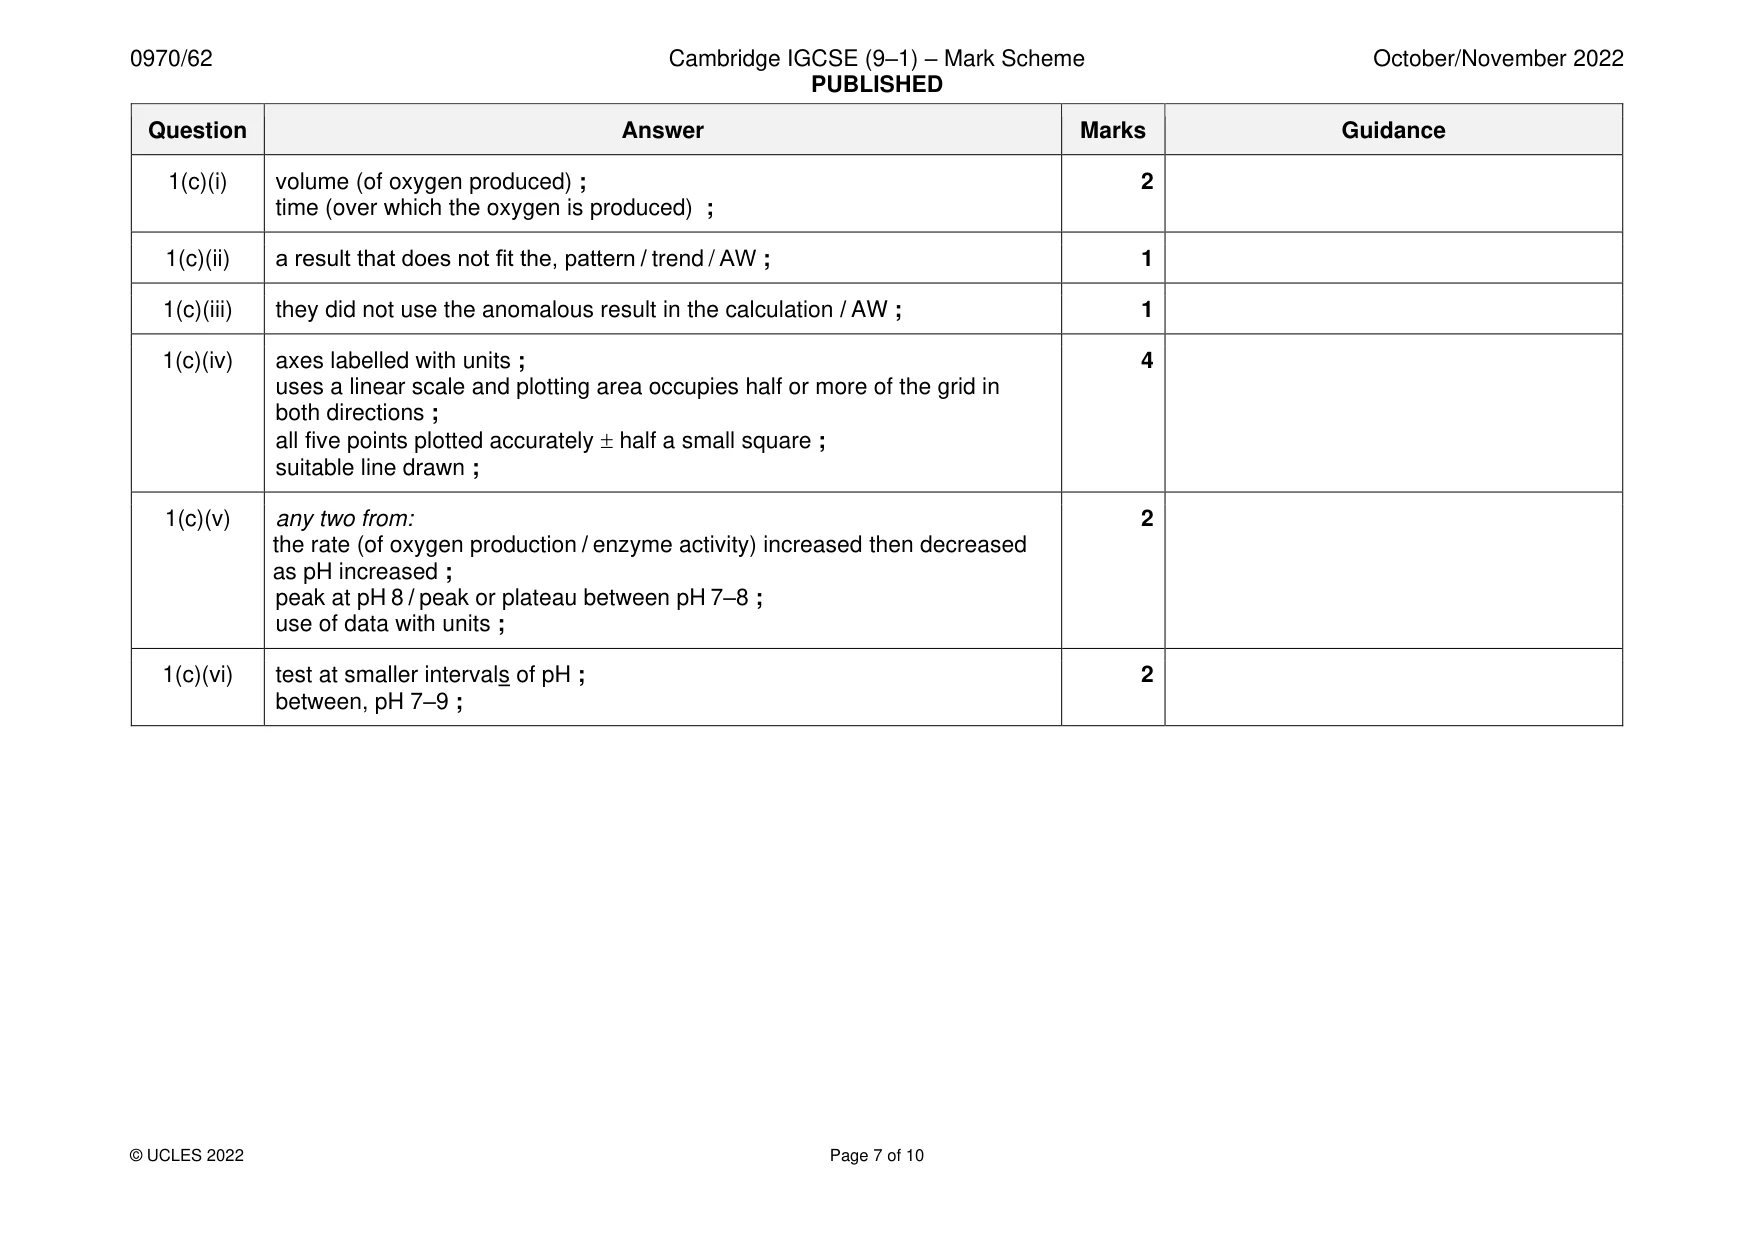
Mark scheme: Question Answer Marks Guidance 1(a)(i) one table drawn with minimum three columns and a header line ; 3 appropriate column / row headings, with units for both time and temperature ; recording of 12 correct temperatures ; 1(a)(ii) test-tube A: 14 (°C) ; 2 test-tube B: 9 (°C) ; 1(a)(iii) the, greater / higher, the concentration of hydrogen peroxide the greater the 1 activity of catalase ; 1(a)(iv) temperature ; 1 1(b)(i) 1 effect on the results if room temperature is lower: 2 the temperature change would be less / the temperature (in the test-tubes) would be lower / AW ; 2 explanation (without the foil) there was, no insulation / (more) heat loss / AW ; OR 1 effect on the results if room temperature is higher: temperature (in the test-tubes) would be higher ; 2 explanation (without the foil) there was, no insulation / (more) heat gain / AW ; 1(b)(ii) any two from: 2 1 (total) volume of solution ; 2 volume / concentration / amount / type, of yeast ; 3 time (intervals at which measurements were taken) / total time for reaction ; 4 stirring of yeast ; 5 starting temperature (of solution) ; 1(c)(i) volume (of oxygen produced) ; 2 time (over which the oxygen is produced) ; 1(c)(ii) a result that does not fit the, pattern / trend / AW ; 1 1(c)(iii) they did not use the anomalous result in the calculation / AW ; 1 1(c)(iv) axes labelled with units ; 4 uses a linear scale and plotting area occupies half or more of the grid in both directions ; all five points plotted accurately half a small square ; suitable line drawn ; 1(c)(v) any two from: 2 the rate (of oxygen production / enzyme activity) increased then decreased as pH increased ; peak at pH 8 / peak or plateau between pH 7–8 ; use of data with units ; 1(c)(vi) test at smaller intervals of pH ; 2 between, pH 7–9 ;
Q2 · A photomicrograph of a cross-section of a stalk of celery, Apium graveolens
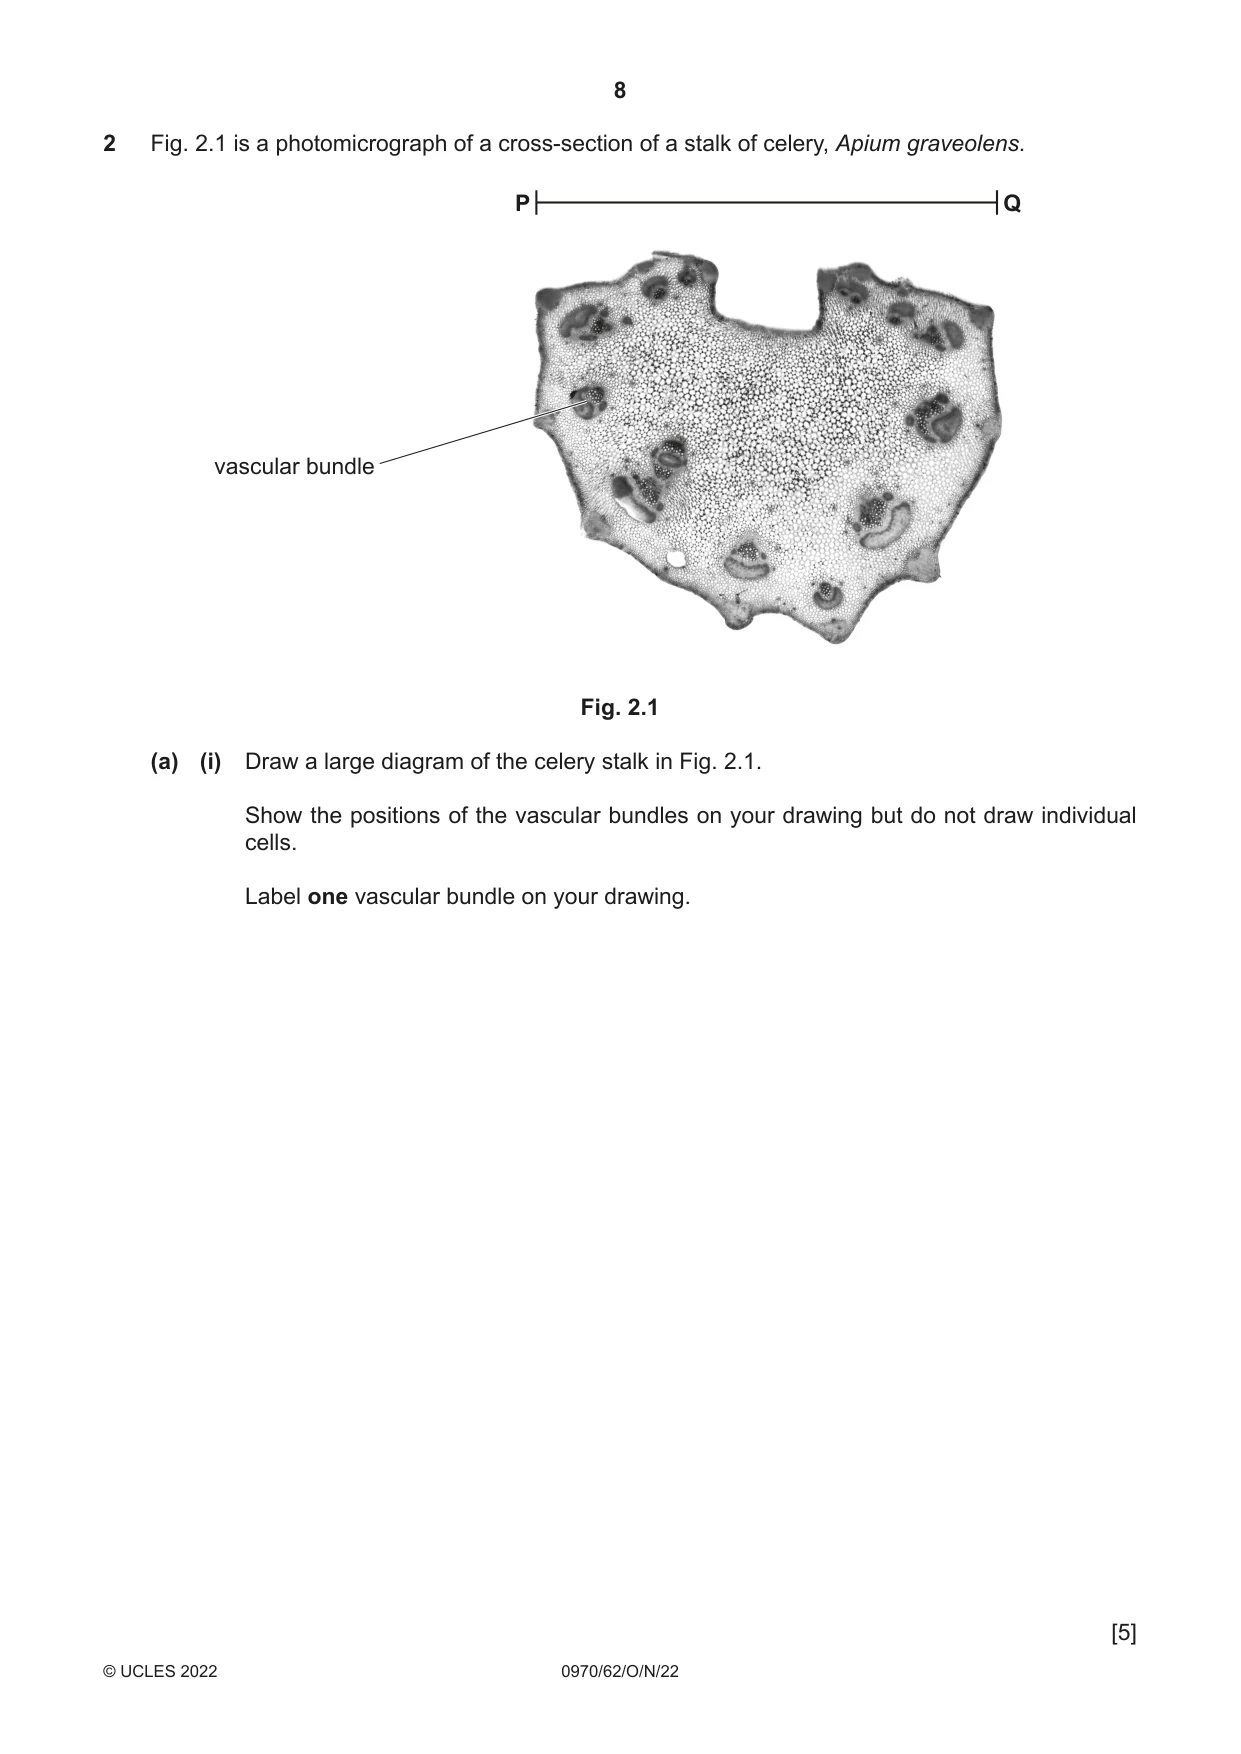
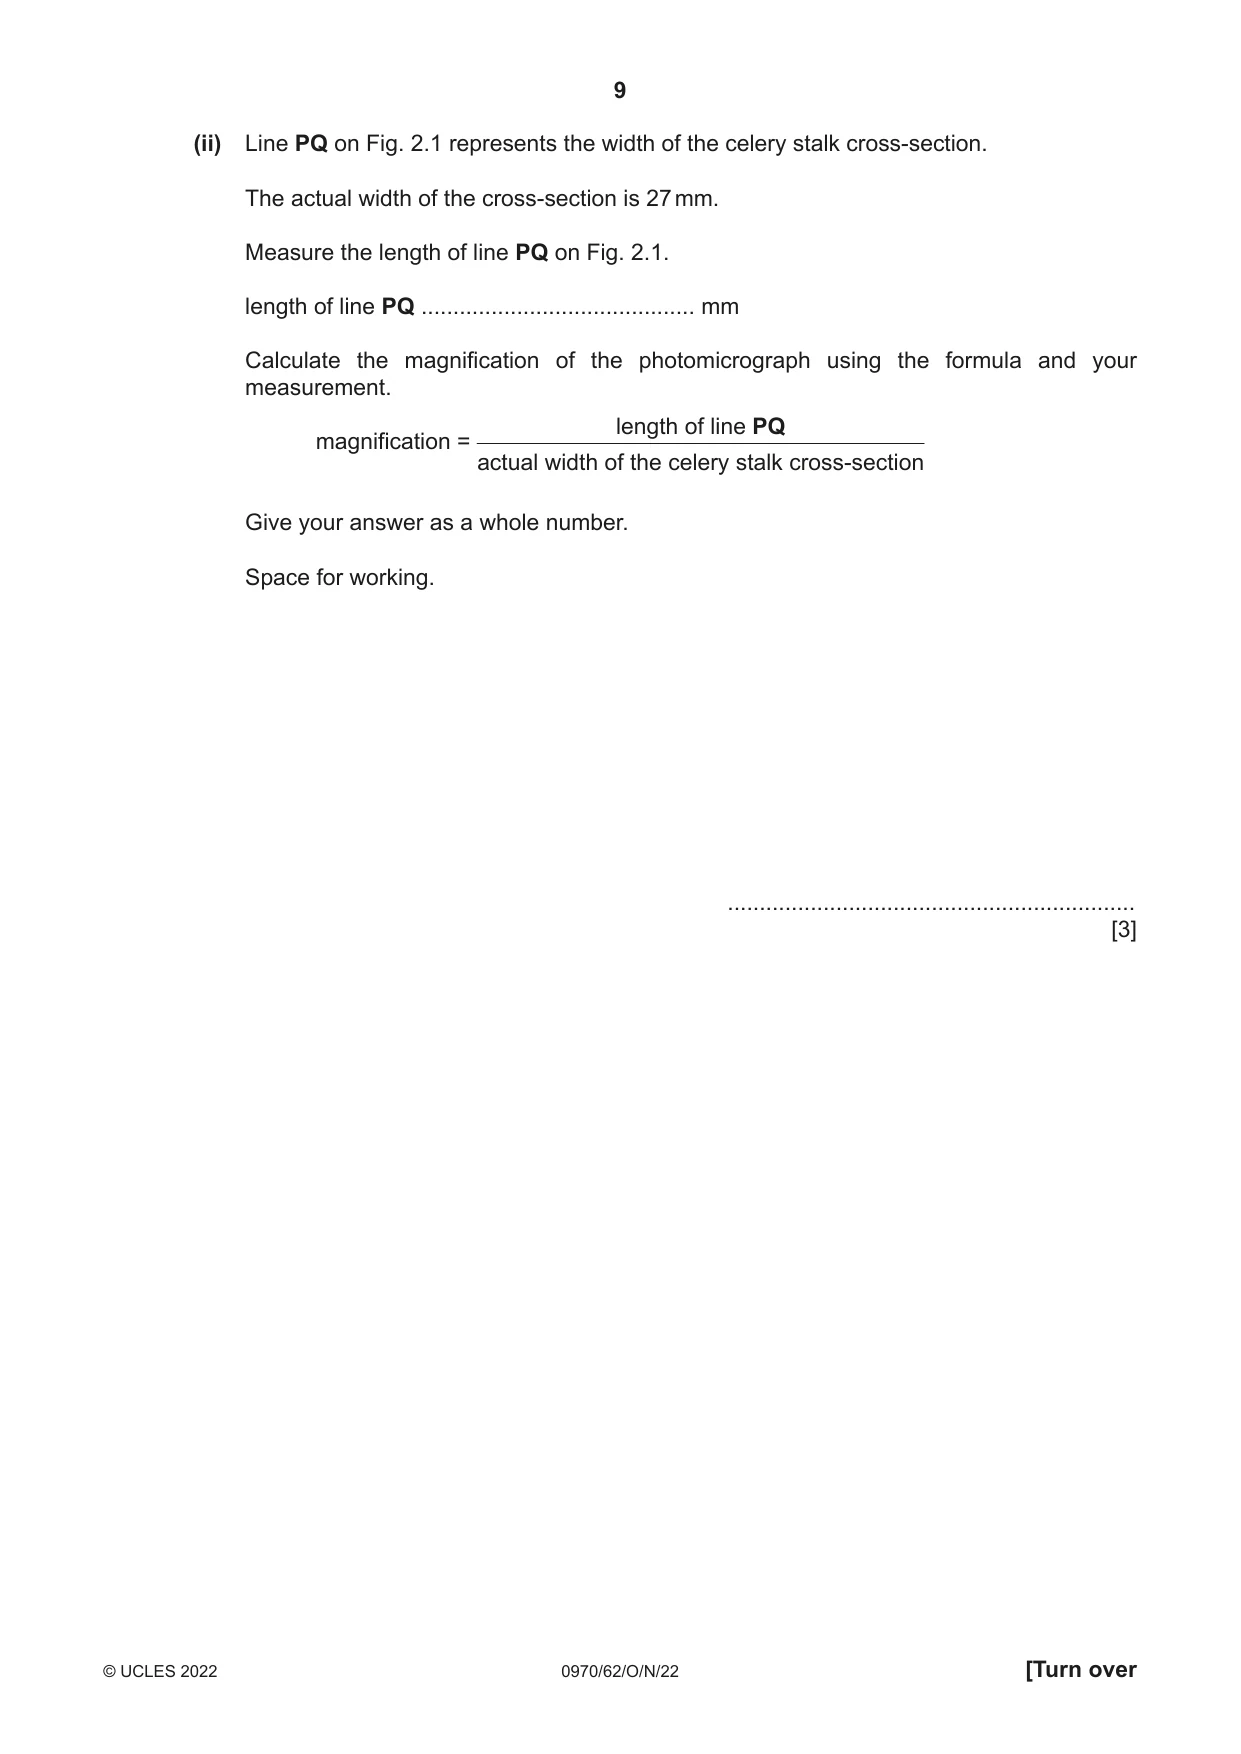
2 Fig. 2.1 is a photomicrograph of a cross-section of a stalk of celery, Apium graveolens. P Q vascular bundle Fig. 2.1 (a) (i) Draw a large diagram of the celery stalk in Fig. 2.1. Show the positions of the vascular bundles on your drawing but do not draw individual cells. Label one vascular bundle on your drawing. [5] (ii) Line PQ on Fig. 2.1 represents the width of the celery stalk cross-section. The actual width of the cross-section is 27 mm. Measure the length of line PQ on Fig. 2.1. length of line PQ ........................................... mm Calculate the magnification of the photomicrograph using the formula and your measurement. length of line PQ magnification = actual width of the celery stalk cross-section Give your answer as a whole number. Space for working. ................................................................ [3] (b) The movement of water up a celery stalk can be investigated by placing a celery stalk in a solution of dye. Fig. 2.2 shows a celery stalk in a glass containing dye. Fig. 2.2
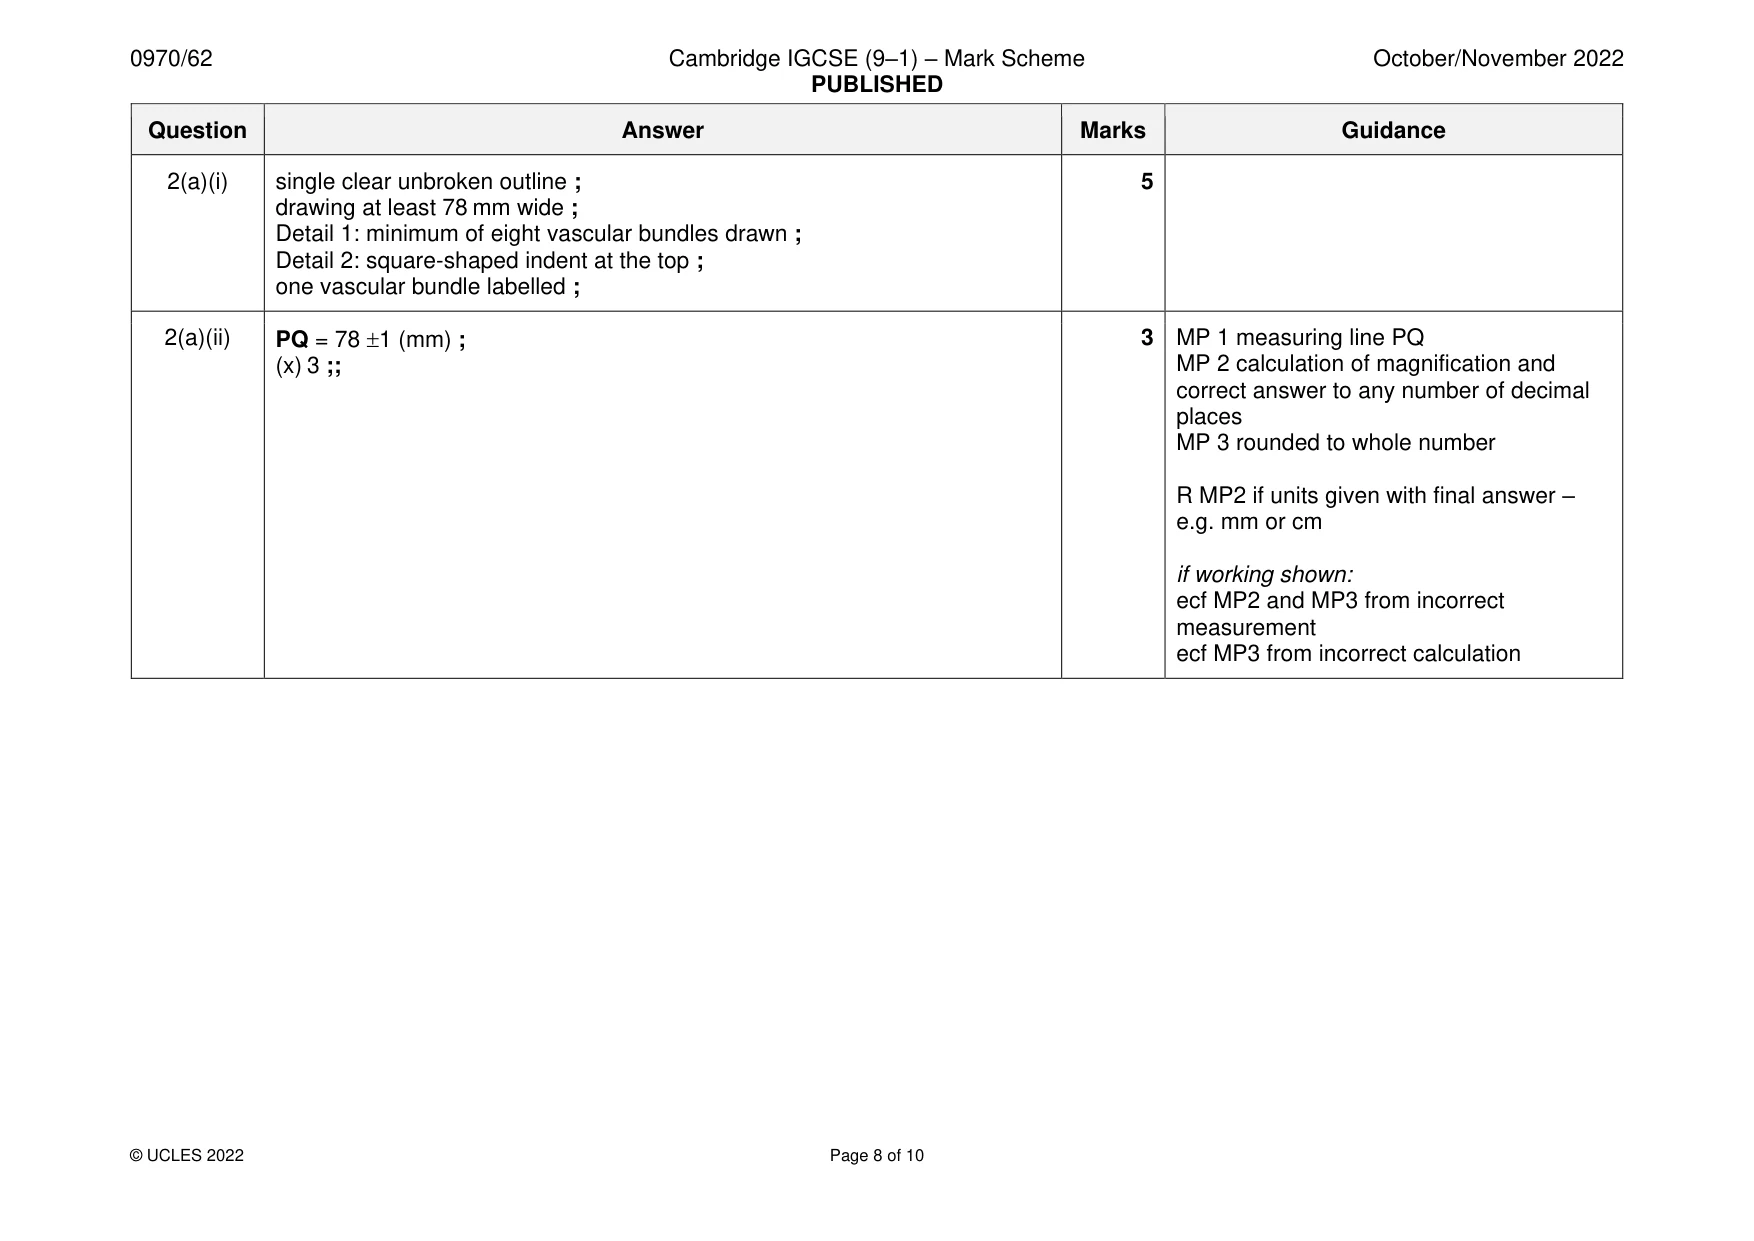
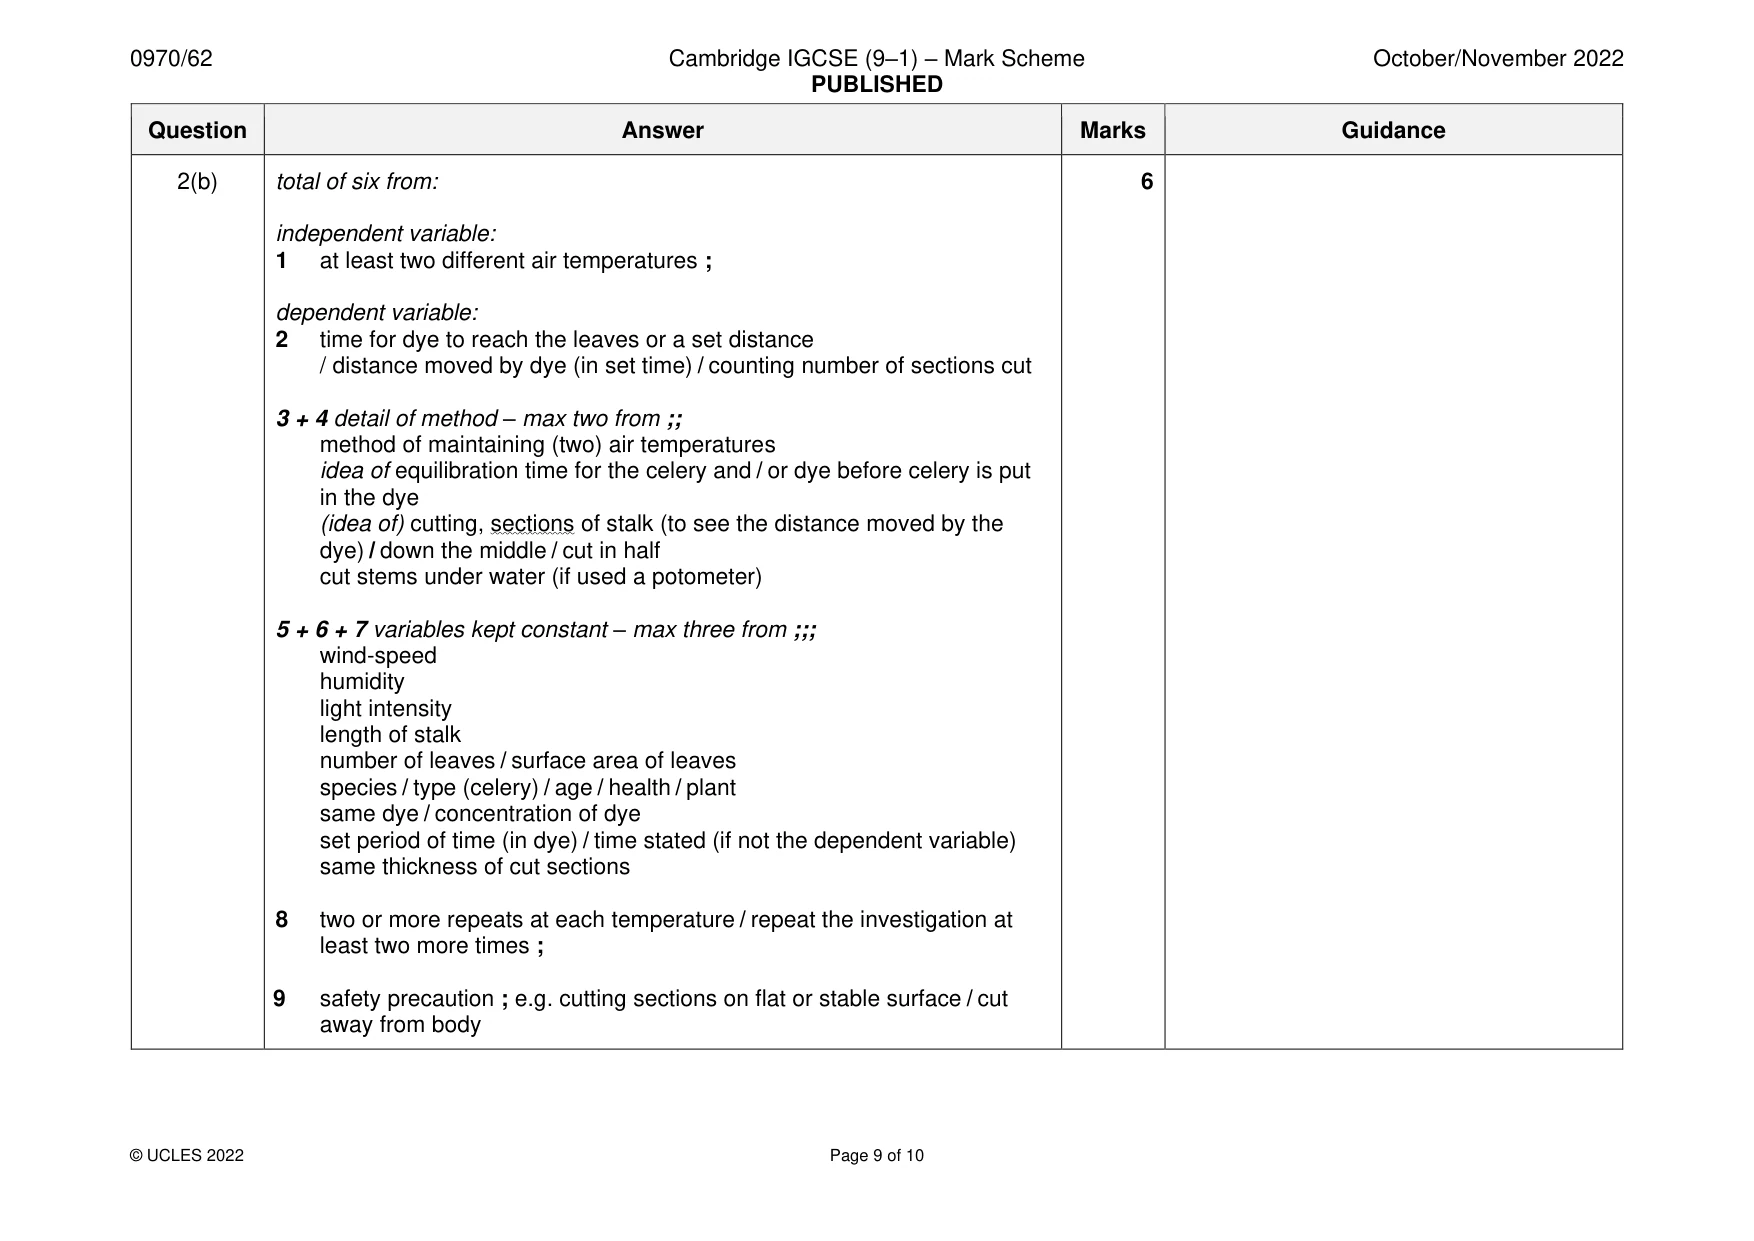
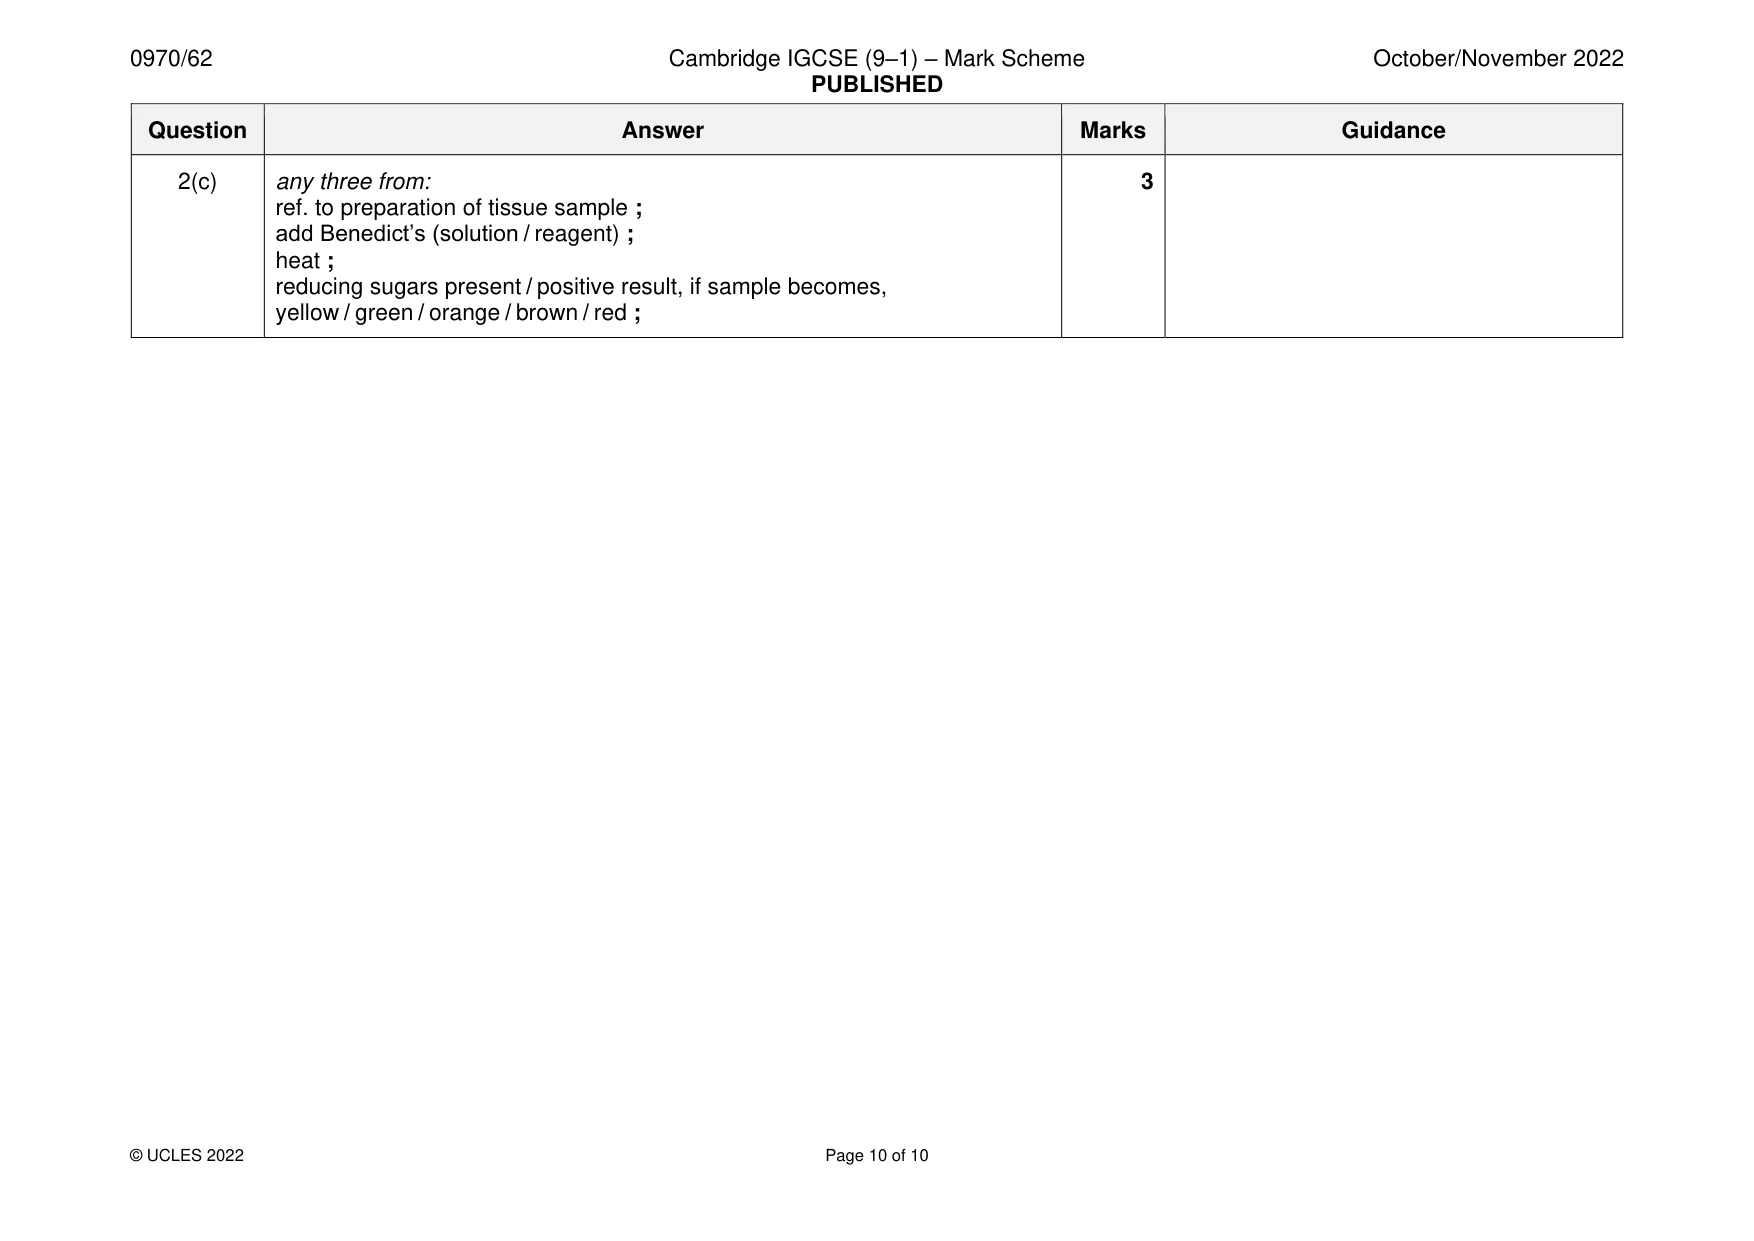
Mark scheme: 2(a)(i) single clear unbroken outline ; 5 drawing at least 78 mm wide ; Detail 1: minimum of eight vascular bundles drawn ; Detail 2: square-shaped indent at the top ; one vascular bundle labelled ; 2(a)(ii) PQ = 78 1 (mm) ; 3 MP 1 measuring line PQ (x) 3 ;; MP 2 calculation of magnification and correct answer to any number of decimal places MP 3 rounded to whole number R MP2 if units given with final answer – e.g. mm or cm if working shown: ecf MP2 and MP3 from incorrect measurement ecf MP3 from incorrect calculation 2(b) total of six from: 6 independent variable: 1 at least two different air temperatures ; dependent variable: 2 time for dye to reach the leaves or a set distance / distance moved by dye (in set time) / counting number of sections cut 3 + 4 detail of method – max two from ;; method of maintaining (two) air temperatures idea of equilibration time for the celery and / or dye before celery is put in the dye (idea of) cutting, sections of stalk (to see the distance moved by the dye) / down the middle / cut in half cut stems under water (if used a potometer) 5 + 6 + 7 variables kept constant – max three from ;;; wind-speed humidity light intensity length of stalk number of leaves / surface area of leaves species / type (celery) / age / health / plant same dye / concentration of dye set period of time (in dye) / time stated (if not the dependent variable) same thickness of cut sections 8 two or more repeats at each temperature / repeat the investigation at least two more times ; 9 safety precaution ; e.g. cutting sections on flat or stable surface / cut away from body 2(c) any three from: 3 ref. to preparation of tissue sample ; add Benedict’s (solution / reagent) ; heat ; reducing sugars present / positive result, if sample becomes, yellow / green / orange / brown / red ;
What was in this paper
The subtopics covered by these 2 questions, and how many questions each got. Open one in a new tab to see every Cambridge question on it.
What you needed in this session
Cambridge’s own grade thresholds for 2022 Oct/Nov, Paper 6 · Variant 2. A higher threshold means an easier paper — the bar moves with how the cohort did.