Cambridge IGCSE Biology (9-1) 0970 — 2021 May/June Paper 6 · Variant 2
0970/62/M/J/21 · 2 questions · 40 marks · ≈45 min
The question paper and its mark scheme, free to read here and free to download. This is Cambridge’s own paper, exactly as it was sat.
Question paper12 pages

Mark scheme7 pages
Answers below. Sit the paper first if you are practising.
Questions as text
Q1 · Catalase is an enzyme found in living cells
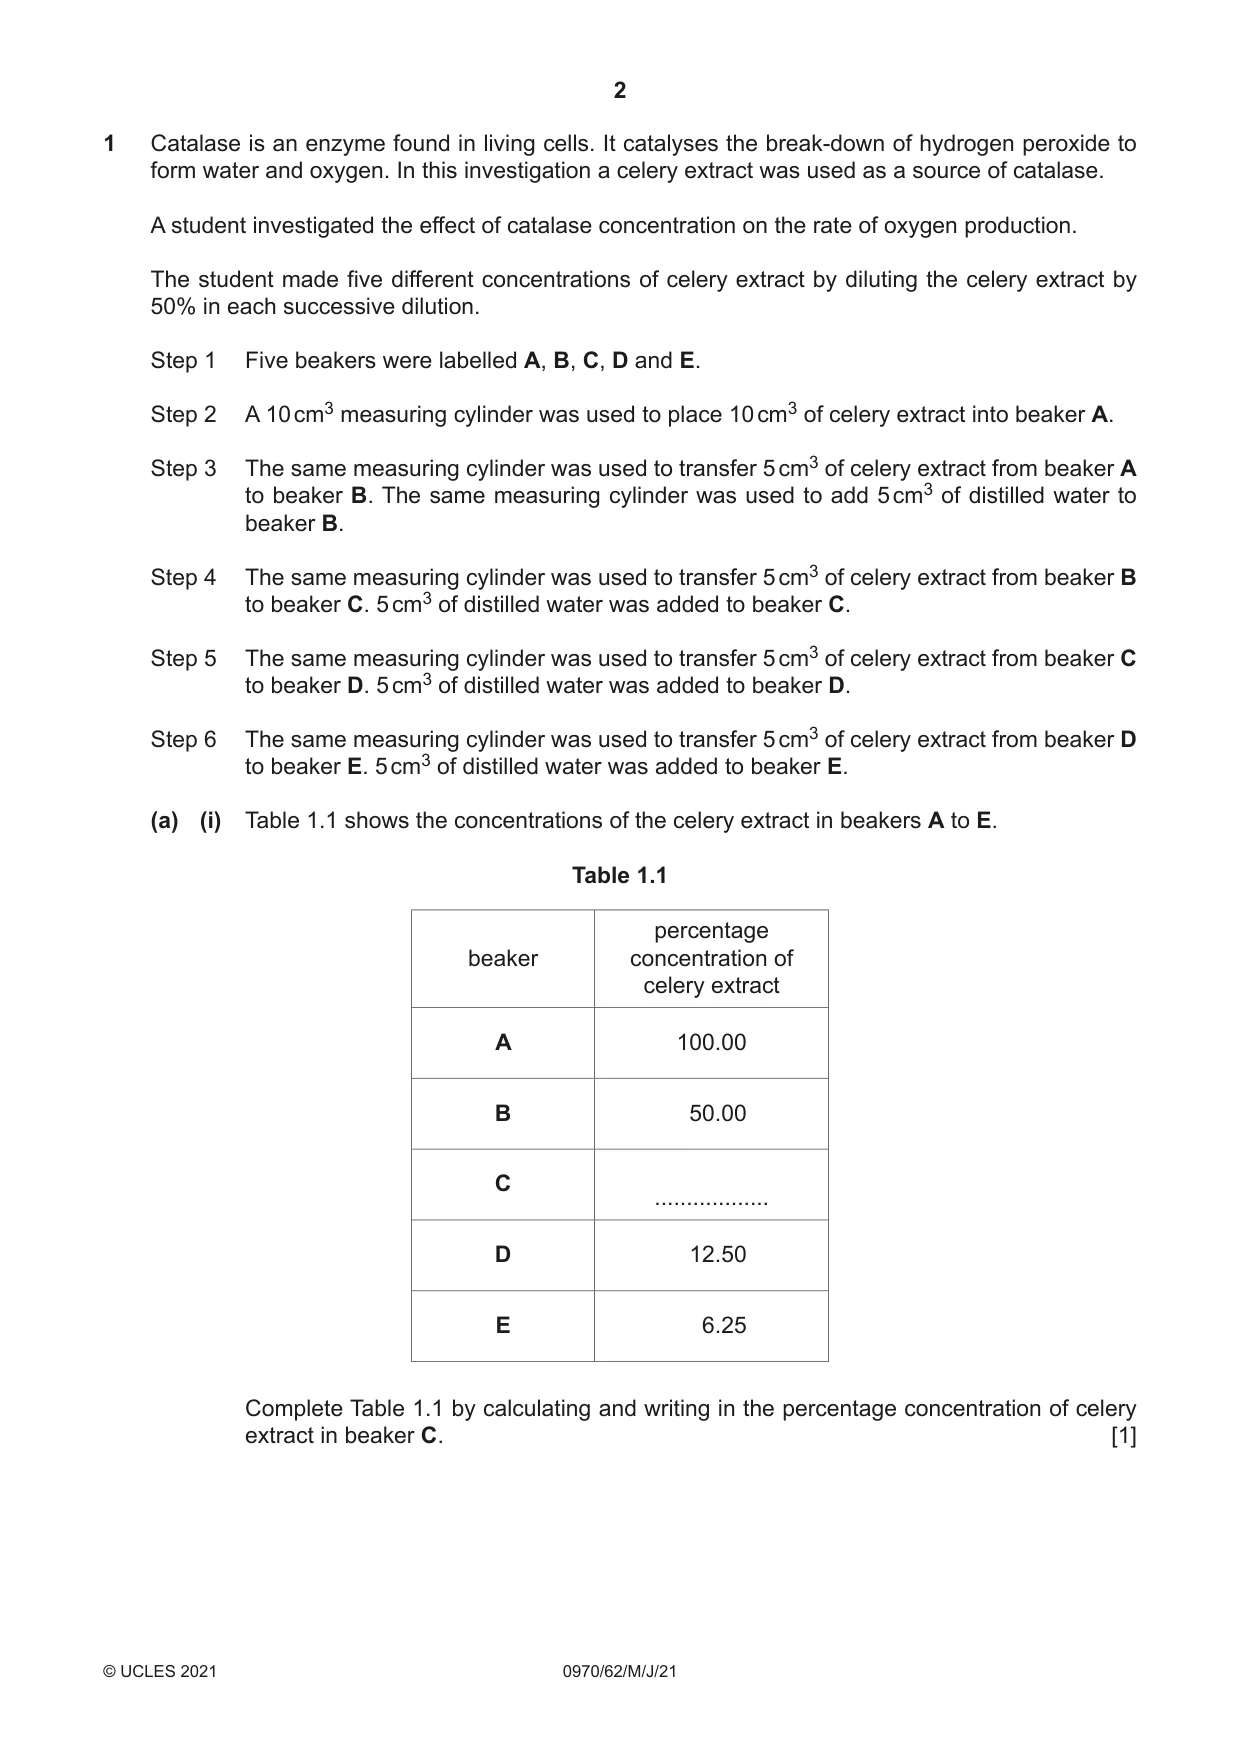
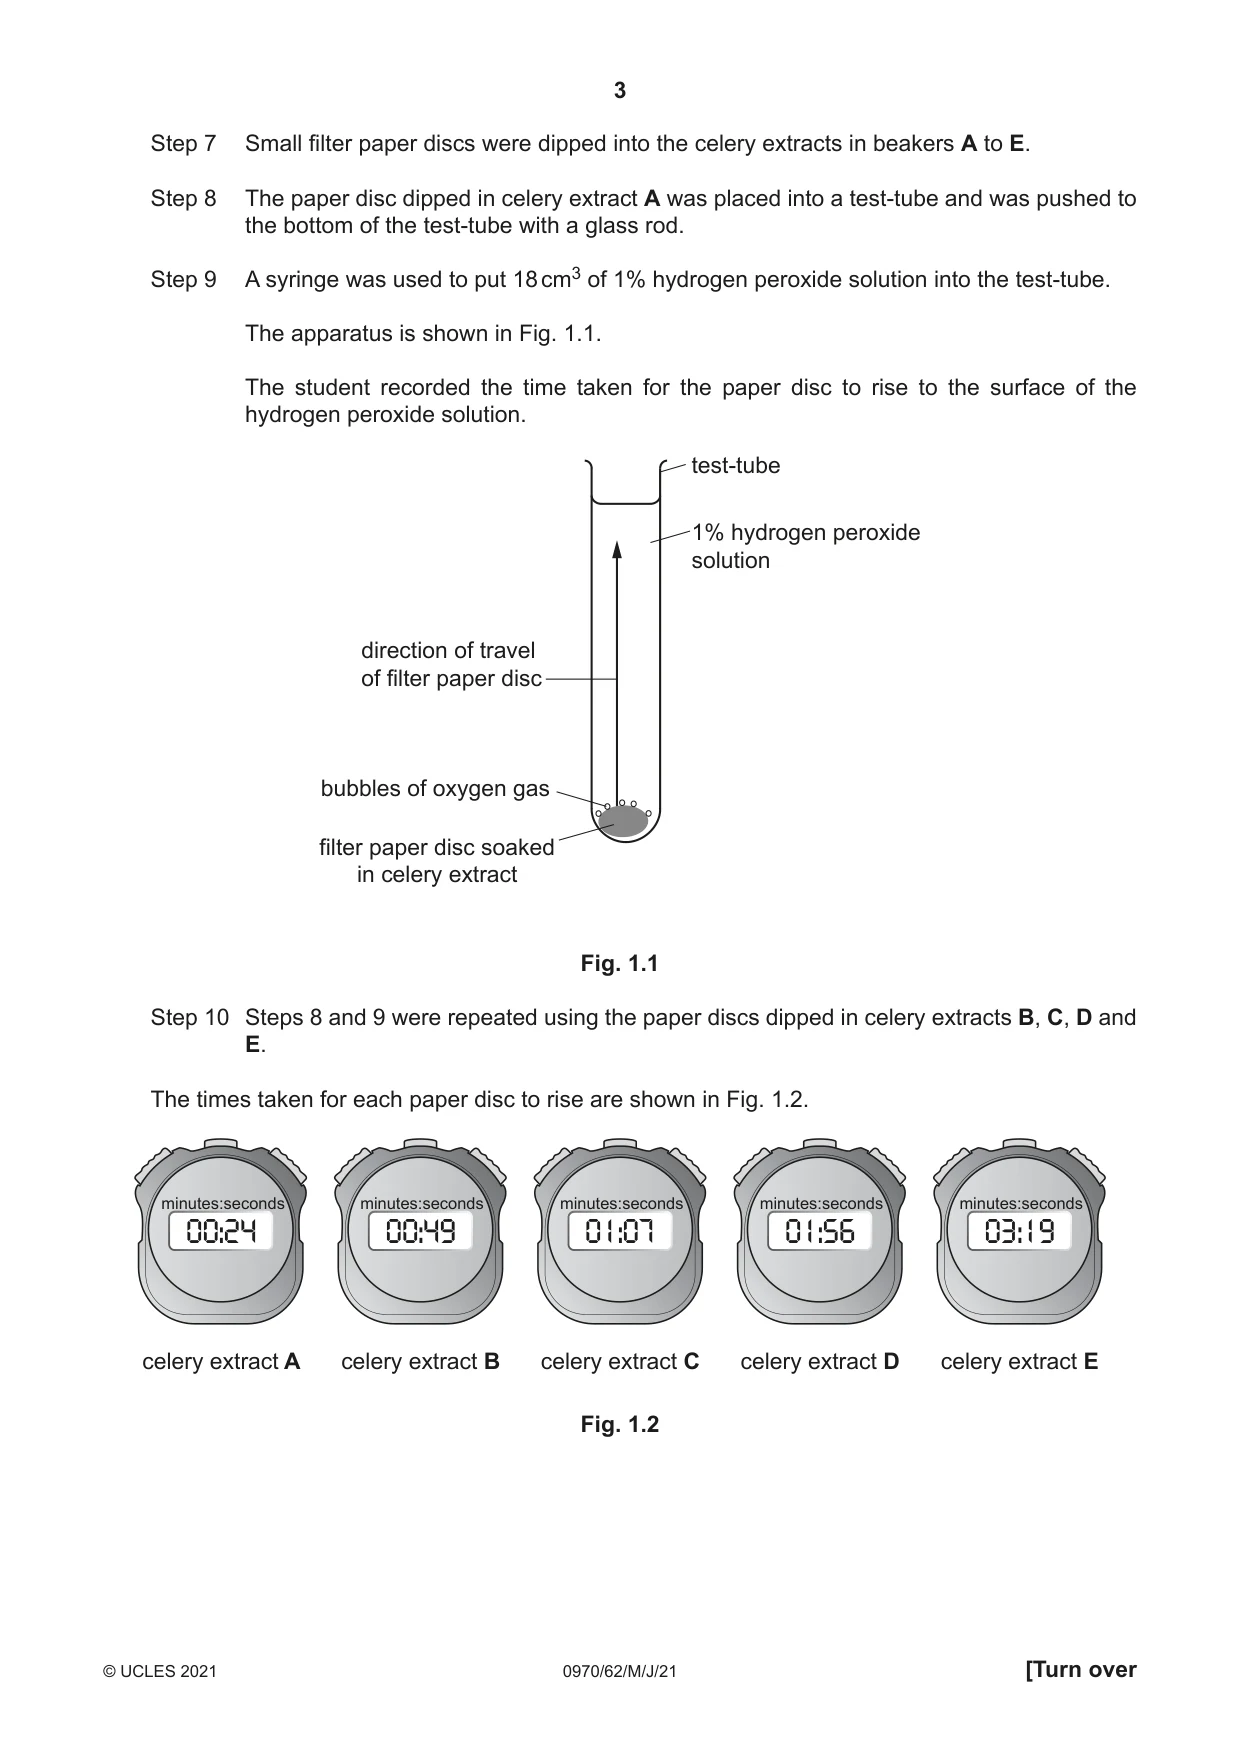
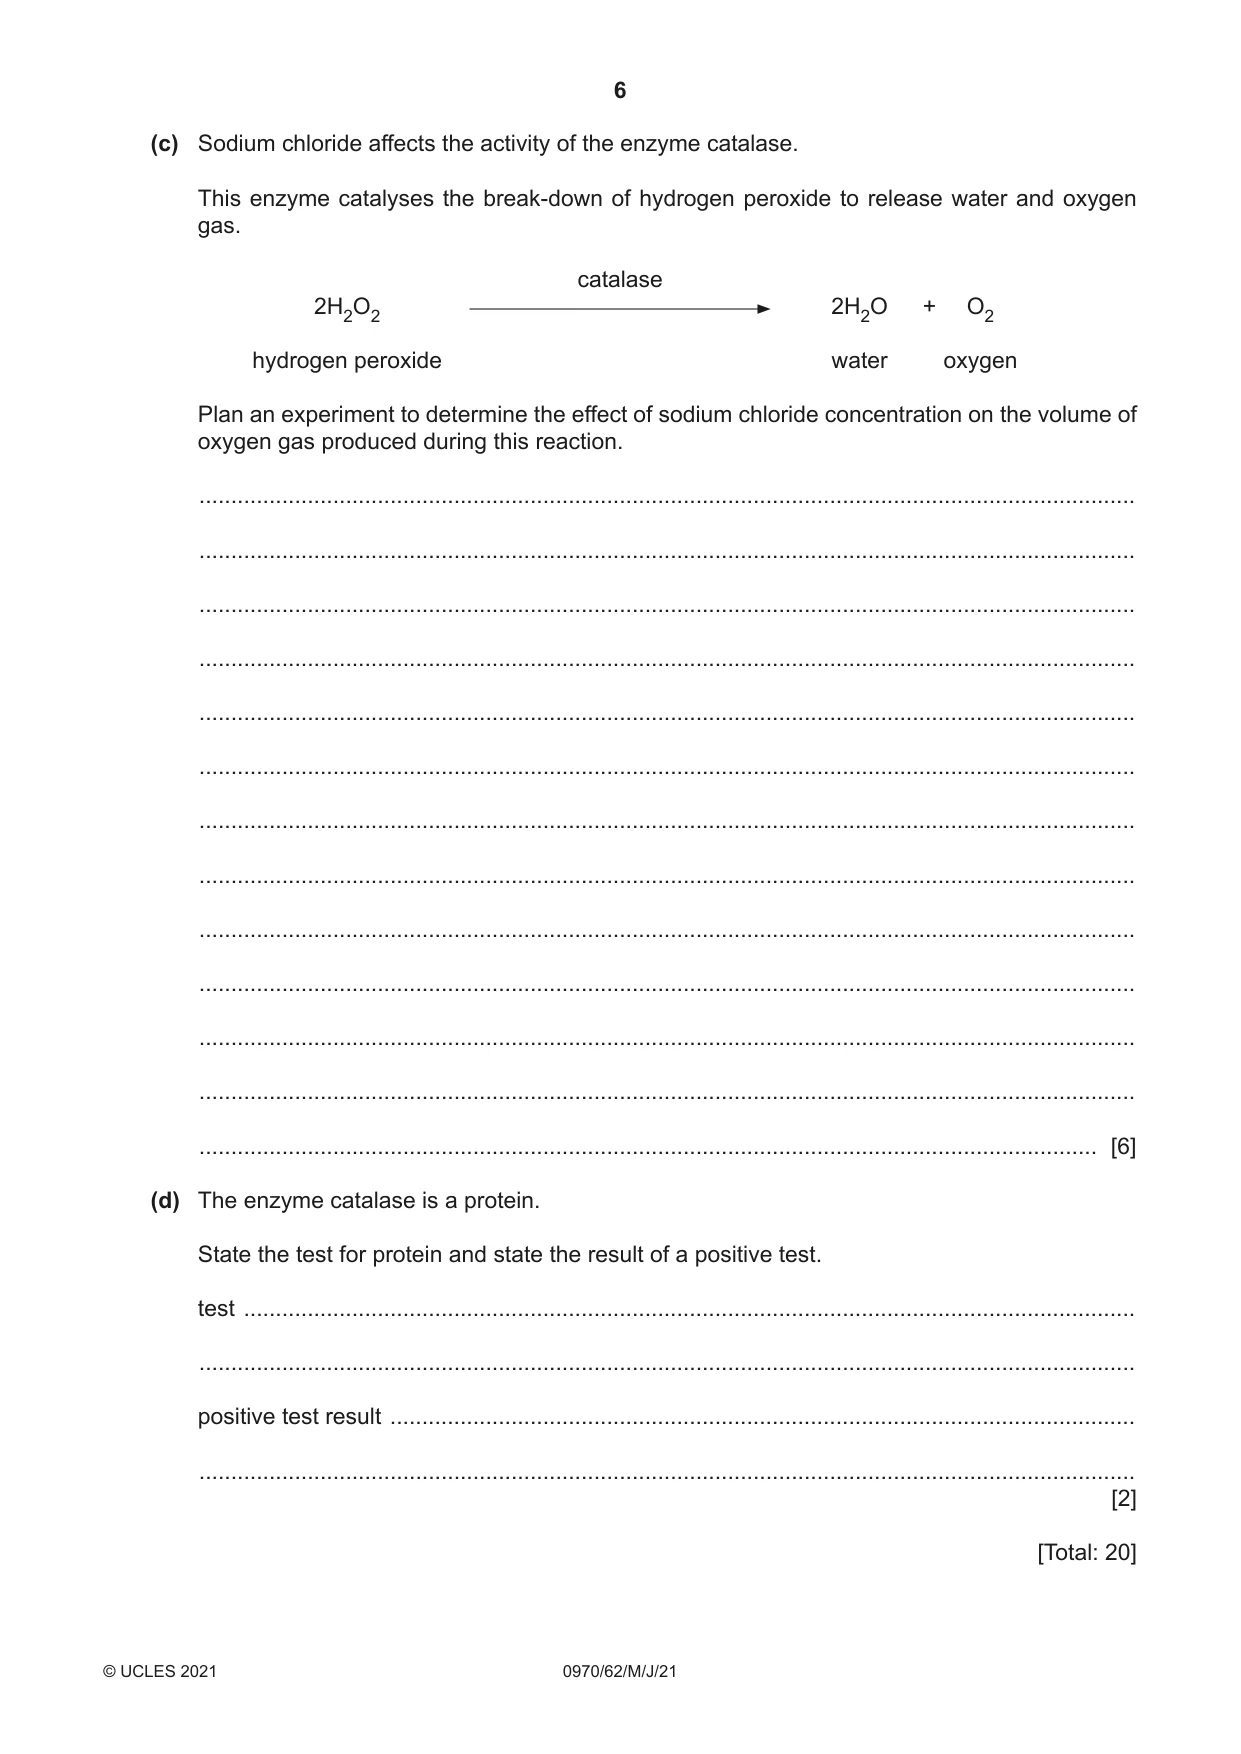
1 Catalase is an enzyme found in living cells. It catalyses the break-down of hydrogen peroxide to form water and oxygen. In this investigation a celery extract was used as a source of catalase. A student investigated the effect of catalase concentration on the rate of oxygen production. The student made five different concentrations of celery extract by diluting the celery extract by 50% in each successive dilution. Step 1 Five beakers were labelled A, B, C, D and E. Step 2 A 10 cm3 measuring cylinder was used to place 10 cm3 of celery extract into beaker A. Step 3 The same measuring cylinder was used to transfer 5 cm3 of celery extract from beaker A to beaker B. The same measuring cylinder was used to add 5 cm3 of distilled water to beaker B. Step 4 The same measuring cylinder was used to transfer 5 cm3 of celery extract from beaker B to beaker C. 5 cm3 of distilled water was added to beaker C. Step 5 The same measuring cylinder was used to transfer 5 cm3 of celery extract from beaker C to beaker D. 5 cm3 of distilled water was added to beaker D. Step 6 The same measuring cylinder was used to transfer 5 cm3 of celery extract from beaker D to beaker E. 5 cm3 of distilled water was added to beaker E. (a) (i) Table 1.1 shows the concentrations of the celery extract in beakers A to E. Table 1.1 percentage beaker concentration of celery extract A 100.00 B 50.00 C .................. D 12.50 E 6.25 Complete Table 1.1 by calculating and writing in the percentage concentration of celery extract in beaker C. [1] Step 7 Small filter paper discs were dipped into the celery extracts in beakers A to E. Step 8 The paper disc dipped in celery extract A was placed into a test-tube and was pushed to the bottom of the test-tube with a glass rod. Step 9 A syringe was used to put 18 cm3 of 1% hydrogen peroxide solution into the test-tube. The apparatus is shown in Fig. 1.1. The student recorded the time taken for the paper disc to rise to the surface of the hydrogen peroxide solution. test-tube 1% hydrogen peroxide solution direction of travel of filter paper disc bubbles of oxygen gas filter paper disc soaked in celery extract Fig. 1.1 Step 10 Steps 8 and 9 were repeated using the paper discs dipped in celery extracts B, C, D and E. The times taken for each paper disc to rise are shown in Fig. 1.2. minutes:seconds minutes:seconds minutes:seconds minutes:seconds minutes:seconds 00:24 00:49 01:07 01:56 03:19 celery extract A celery extract B celery extract C celery extract D celery extract E Fig. 1.2 (ii) Prepare a table to record the results shown in Fig. 1.2. Record all the times in seconds. [4] (iii) State a conclusion for this investigation. ........................................................................................................................................... ........................................................................................................................................... ..................................................................................................................................... [1] (iv) Identify the variable that the student changed (independent variable) and the variable that was measured (dependent variable) in this investigation. independent variable ......................................................................................................... ........................................................................................................................................... dependent variable ............................................................................................................ ........................................................................................................................................... [2] (b) (i) The oxygen gas produced by the reaction forms bubbles on the paper disc. The bubbles cause the disc to rise to the top of the hydrogen peroxide solution. The time taken for the disc to rise can be used to calculate the rate of the reaction. Explain how you could calculate the rate at which the disc rises. ........................................................................................................................................... ........................................................................................................................................... ........................................................................................................................................... ..................................................................................................................................... [2] (ii) Identify one source of error in step 4. ........................................................................................................................................... ........................................................................................................................................... ..................................................................................................................................... [1] (iii) Describe a suitable control for this investigation. ........................................................................................................................................... ........................................................................................................................................... ..................................................................................................................................... [1] (c) Sodium chloride affects the activity of the enzyme catalase. This enzyme catalyses the break-down of hydrogen peroxide to release water and oxygen gas. catalase 2H2O2 2H2O + O2 hydrogen peroxide water oxygen Plan an experiment to determine the effect of sodium chloride concentration on the volume of oxygen gas produced during this reaction. ................................................................................................................................................... ................................................................................................................................................... ................................................................................................................................................... ................................................................................................................................................... ................................................................................................................................................... ................................................................................................................................................... ................................................................................................................................................... ................................................................................................................................................... ................................................................................................................................................... ................................................................................................................................................... ................................................................................................................................................... ................................................................................................................................................... ............................................................................................................................................. [6] (d) The enzyme catalase is a protein. State the test for protein and state the result of a positive test. test ............................................................................................................................................ ................................................................................................................................................... positive test result ..................................................................................................................... ................................................................................................................................................... [2] [Total: 20]
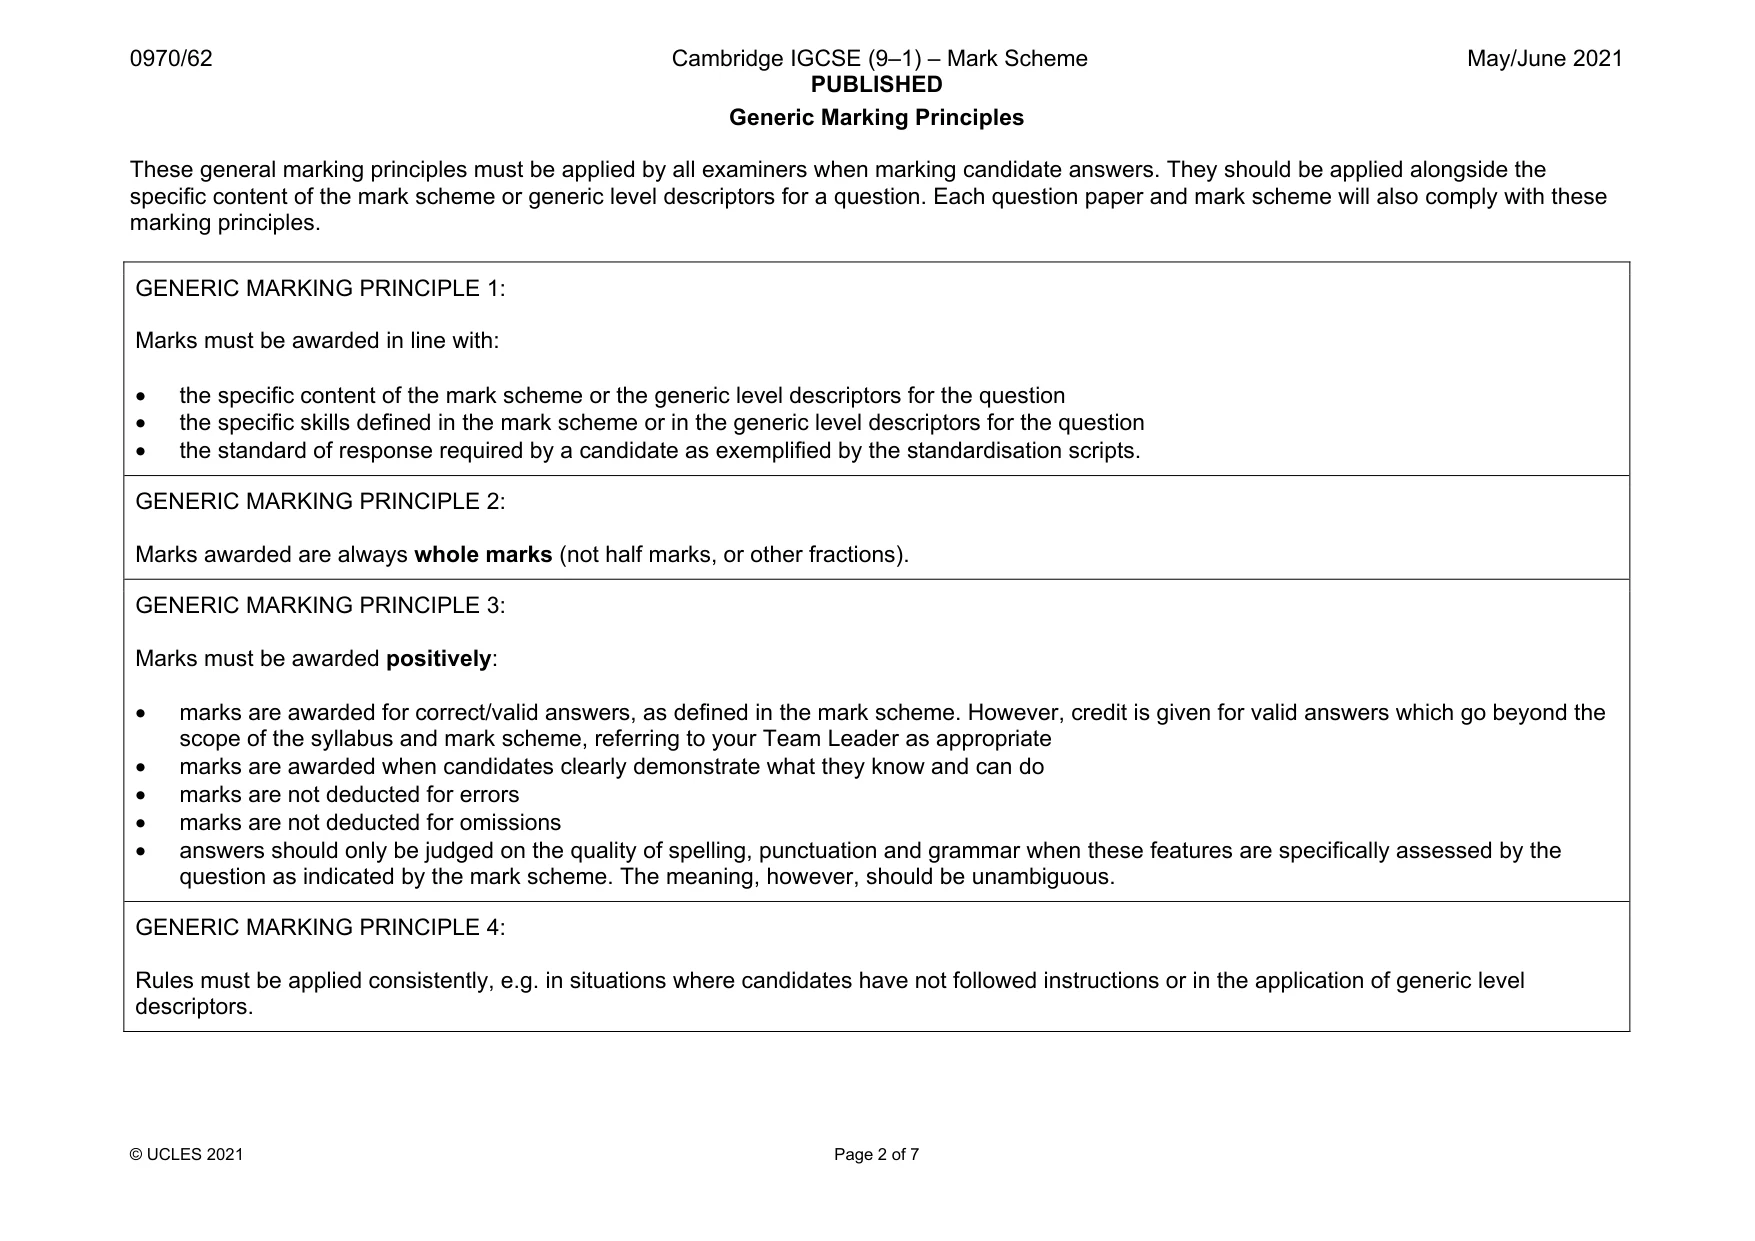
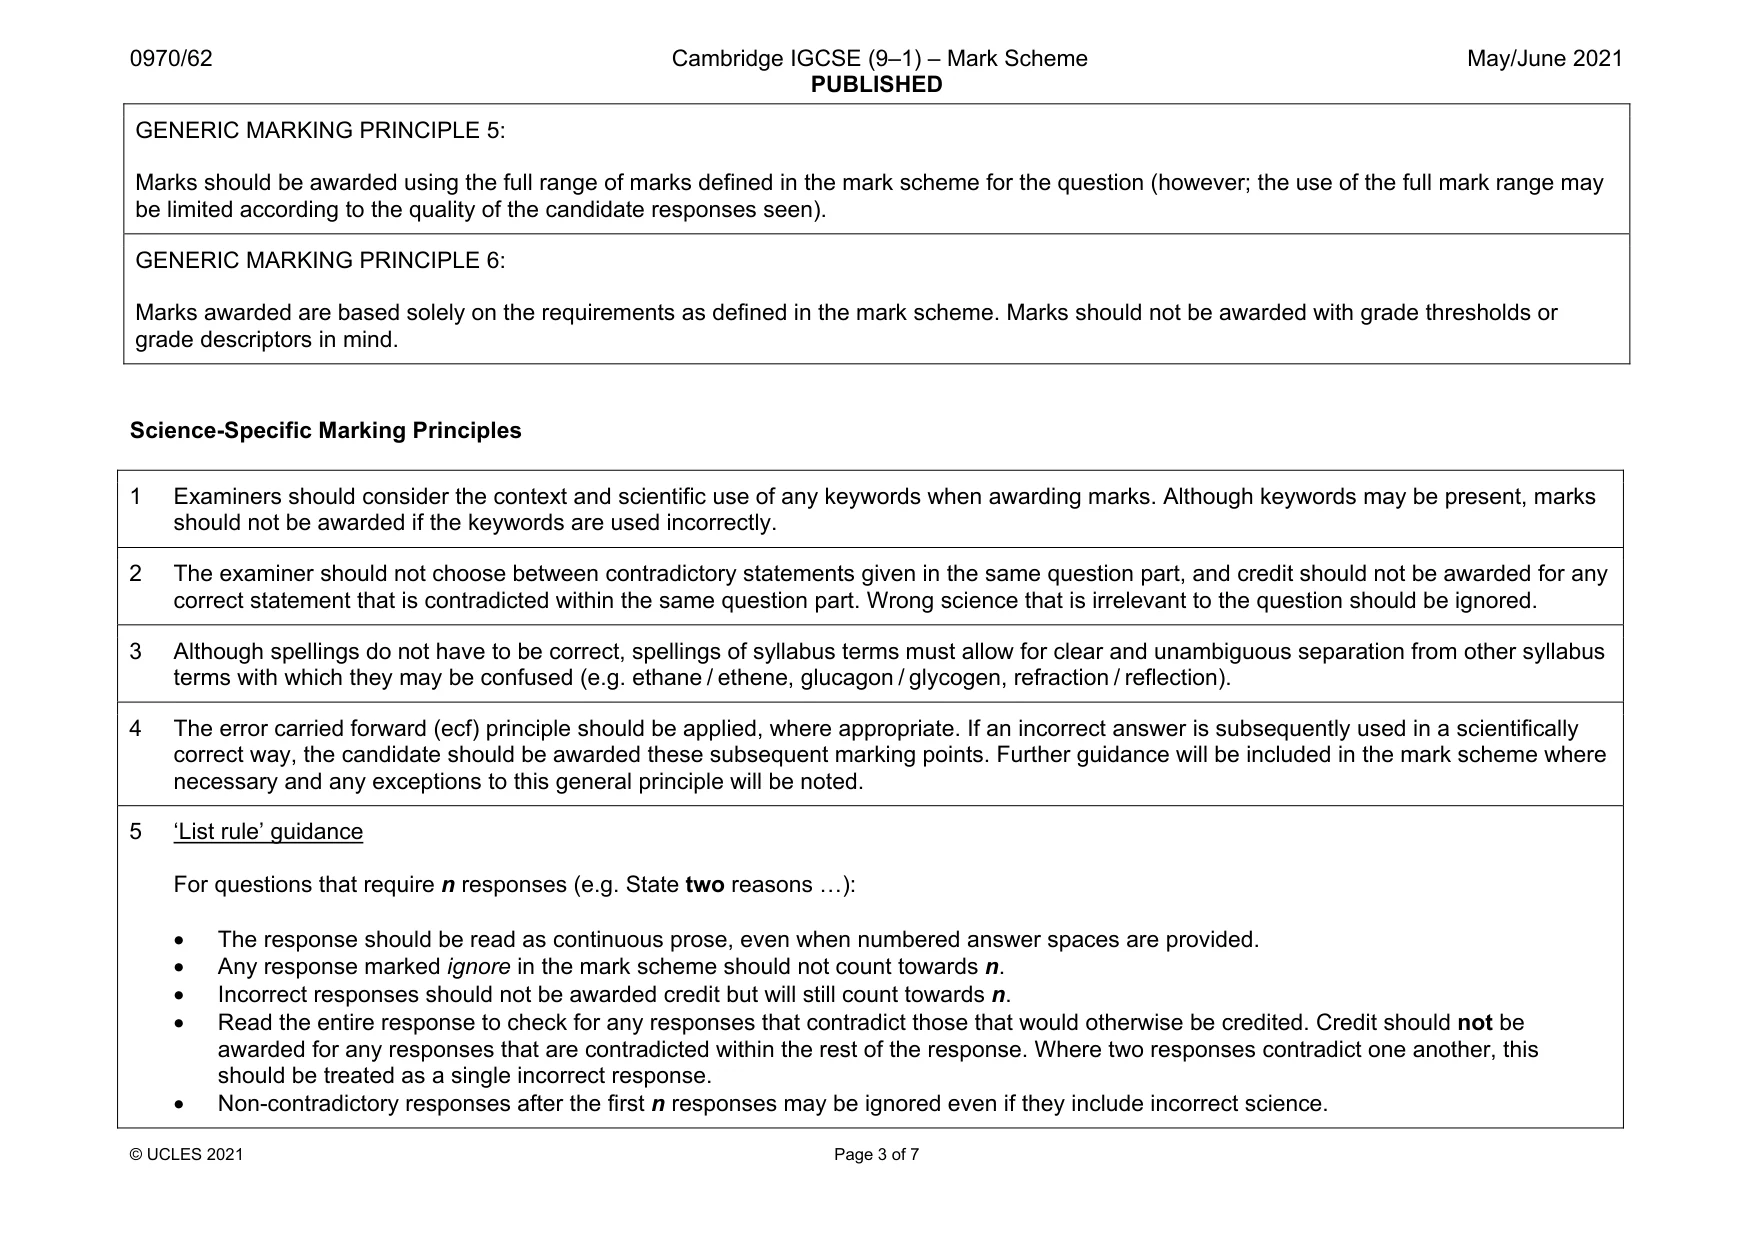
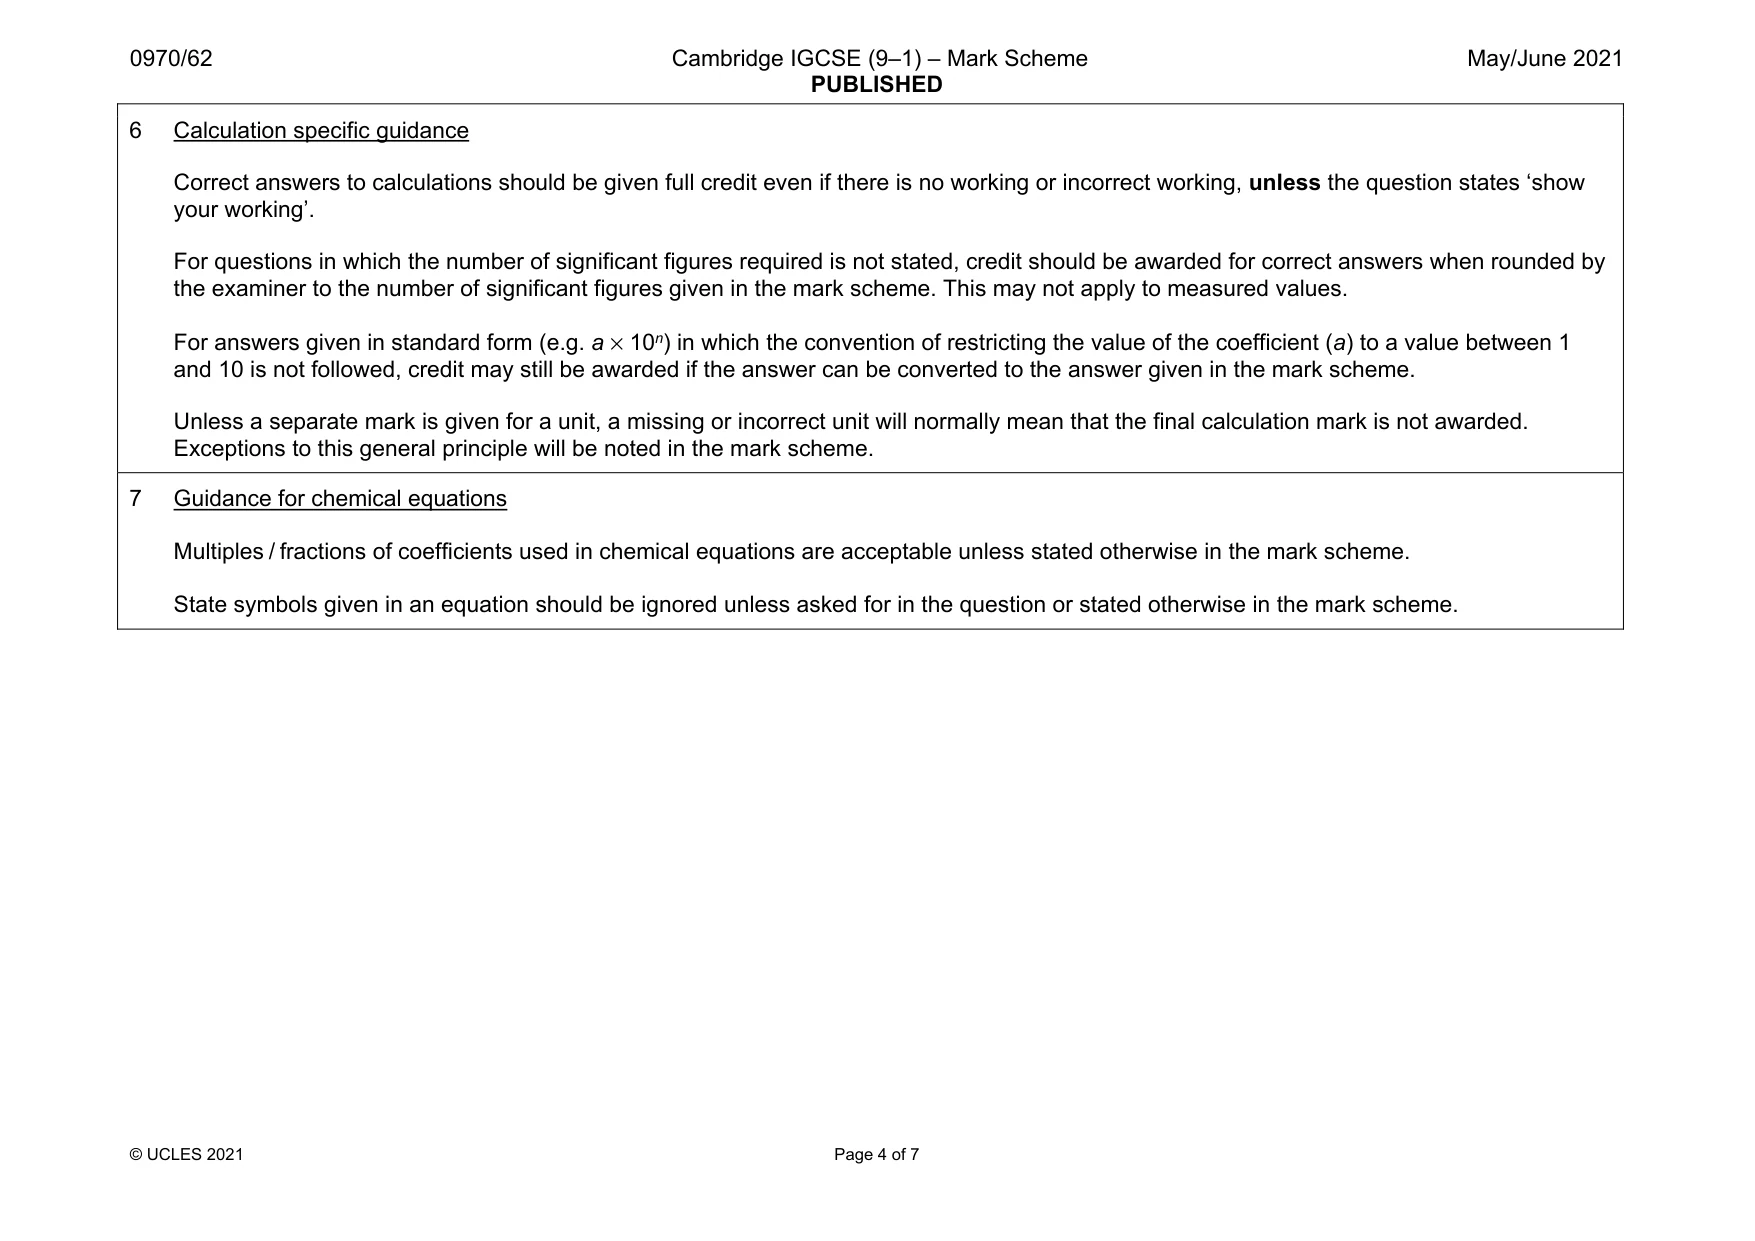
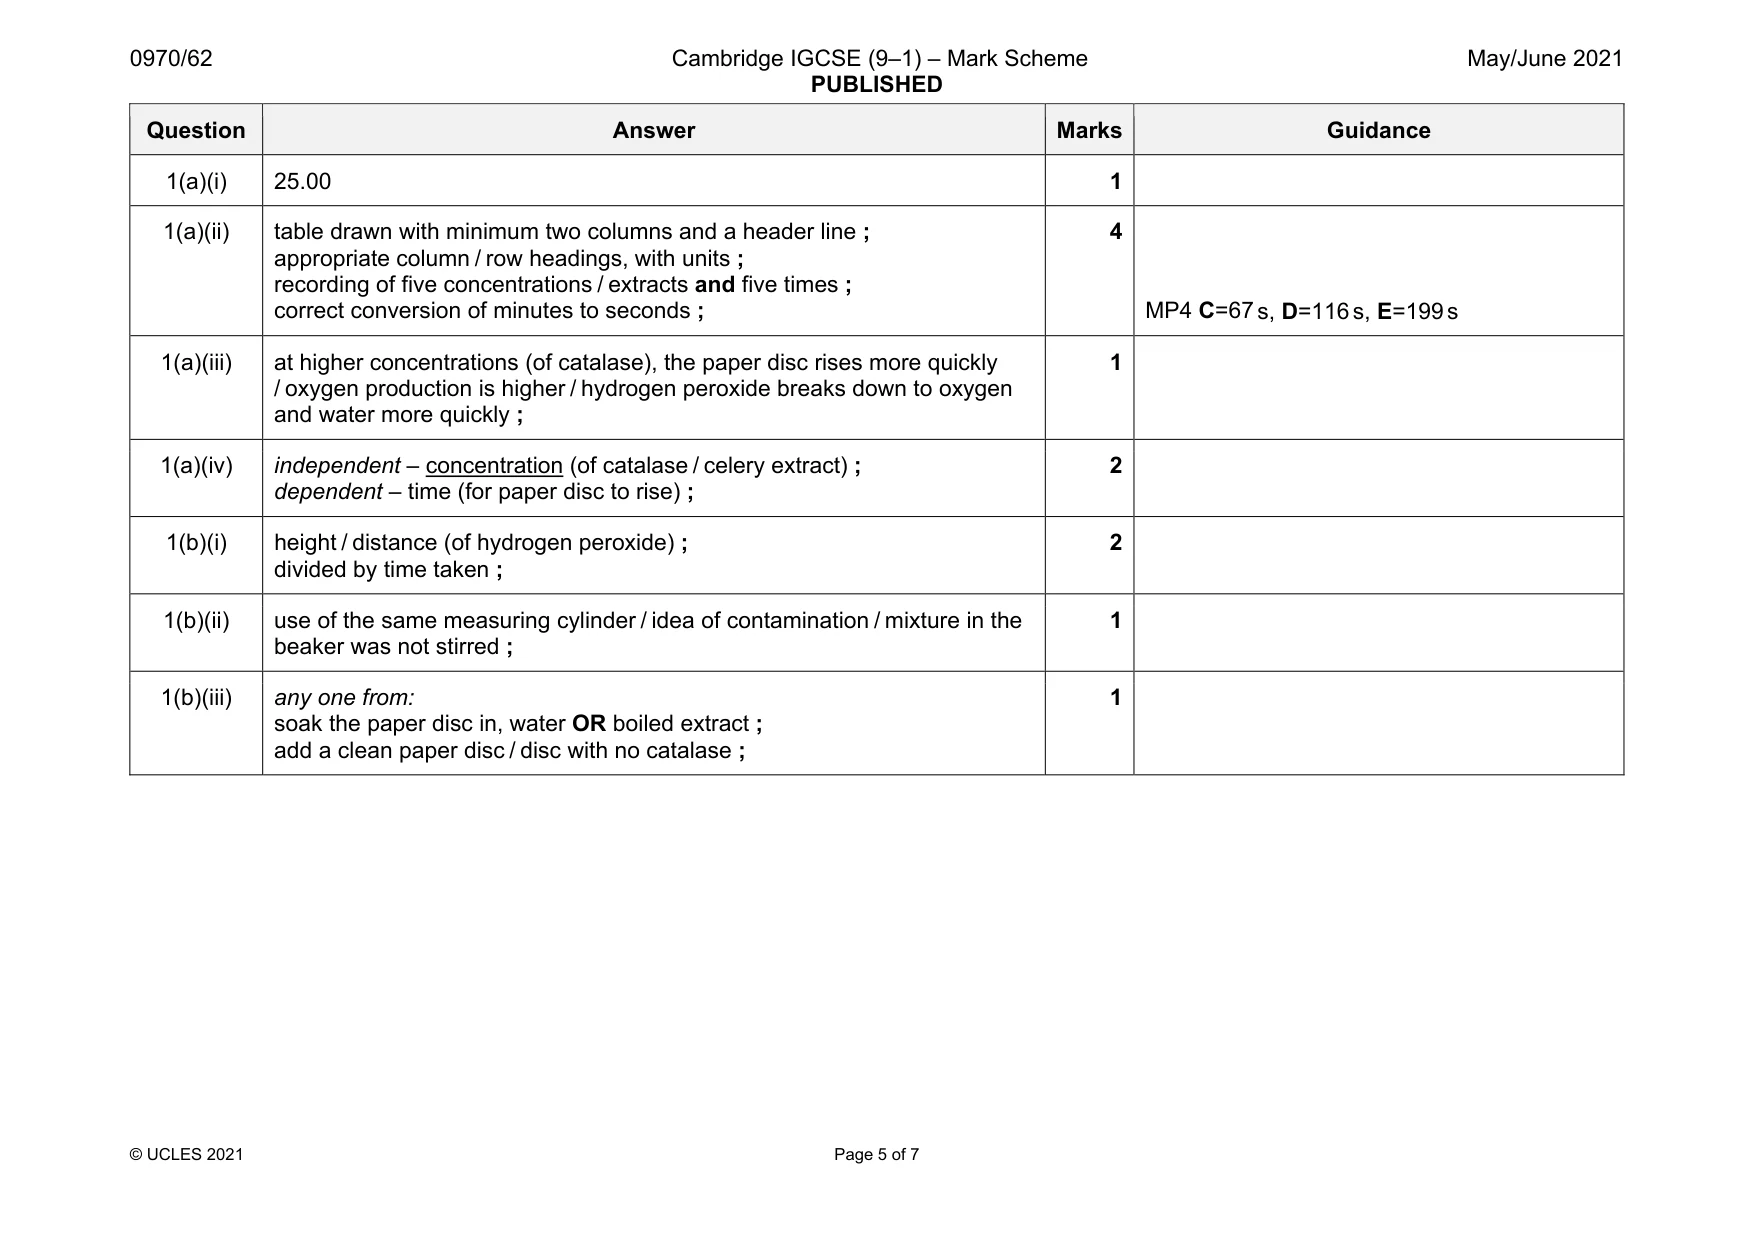
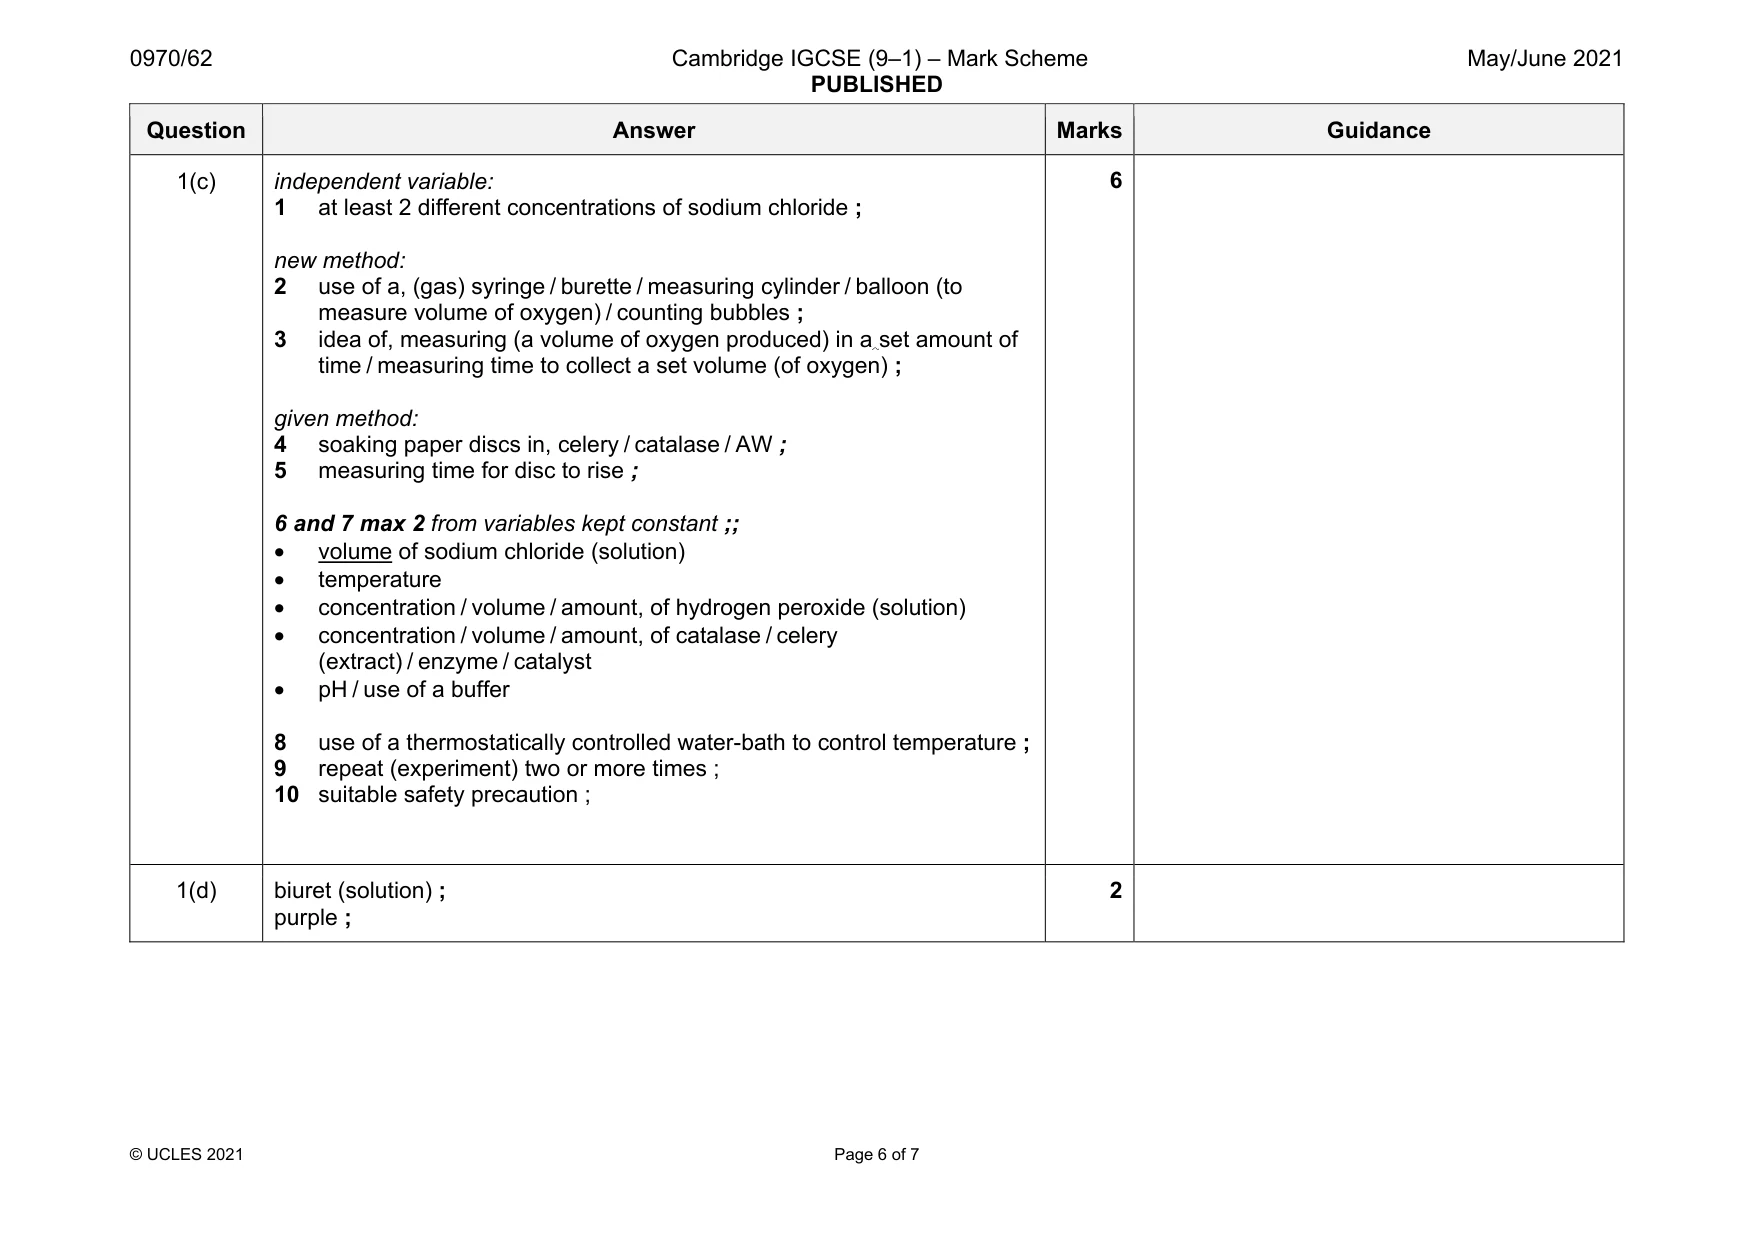
Mark scheme: 1(a)(i) 25.00 1 1(a)(ii) table drawn with minimum two columns and a header line ; appropriate column / row headings, with units ; recording of five concentrations / extracts and five times ; correct conversion of minutes to seconds ; 4 MP4 C=67 s, D=116 s, E=199 s 1(a)(iii) at higher concentrations (of catalase), the paper disc rises more quickly / oxygen production is higher / hydrogen peroxide breaks down to oxygen and water more quickly ; 1 1(a)(iv) independent – concentration (of catalase / celery extract) ; dependent – time (for paper disc to rise) ; 2 1(b)(i) height / distance (of hydrogen peroxide) ; divided by time taken ; 2 1(b)(ii) use of the same measuring cylinder / idea of contamination / mixture in the beaker was not stirred ; 1 1(b)(iii) any one from: soak the paper disc in, water OR boiled extract ; add a clean paper disc / disc with no catalase ; 1 Question Answer Marks Guidance 1(c) independent variable: 1 at least 2 different concentrations of sodium chloride ; new method: 2 use of a, (gas) syringe / burette / measuring cylinder / balloon (to measure volume of oxygen) / counting bubbles ; 3 idea of, measuring (a volume of oxygen produced) in a set amount of time / measuring time to collect a set volume (of oxygen) ; given method: 4 soaking paper discs in, celery / catalase / AW ; 5 measuring time for disc to rise ; 6 and 7 max 2 from variables kept constant ;; • volume of sodium chloride (solution) • temperature • concentration / volume / amount, of hydrogen peroxide (solution) • concentration / volume / amount, of catalase / celery (extract) / enzyme / catalyst • pH / use of a buffer 8 use of a thermostatically controlled water-bath to control temperature ; 9 repeat (experiment) two or more times ; 10 suitable safety precaution ; 6 1(d) biuret (solution) ; purple ; 2
Q2 · The photograph in Fig
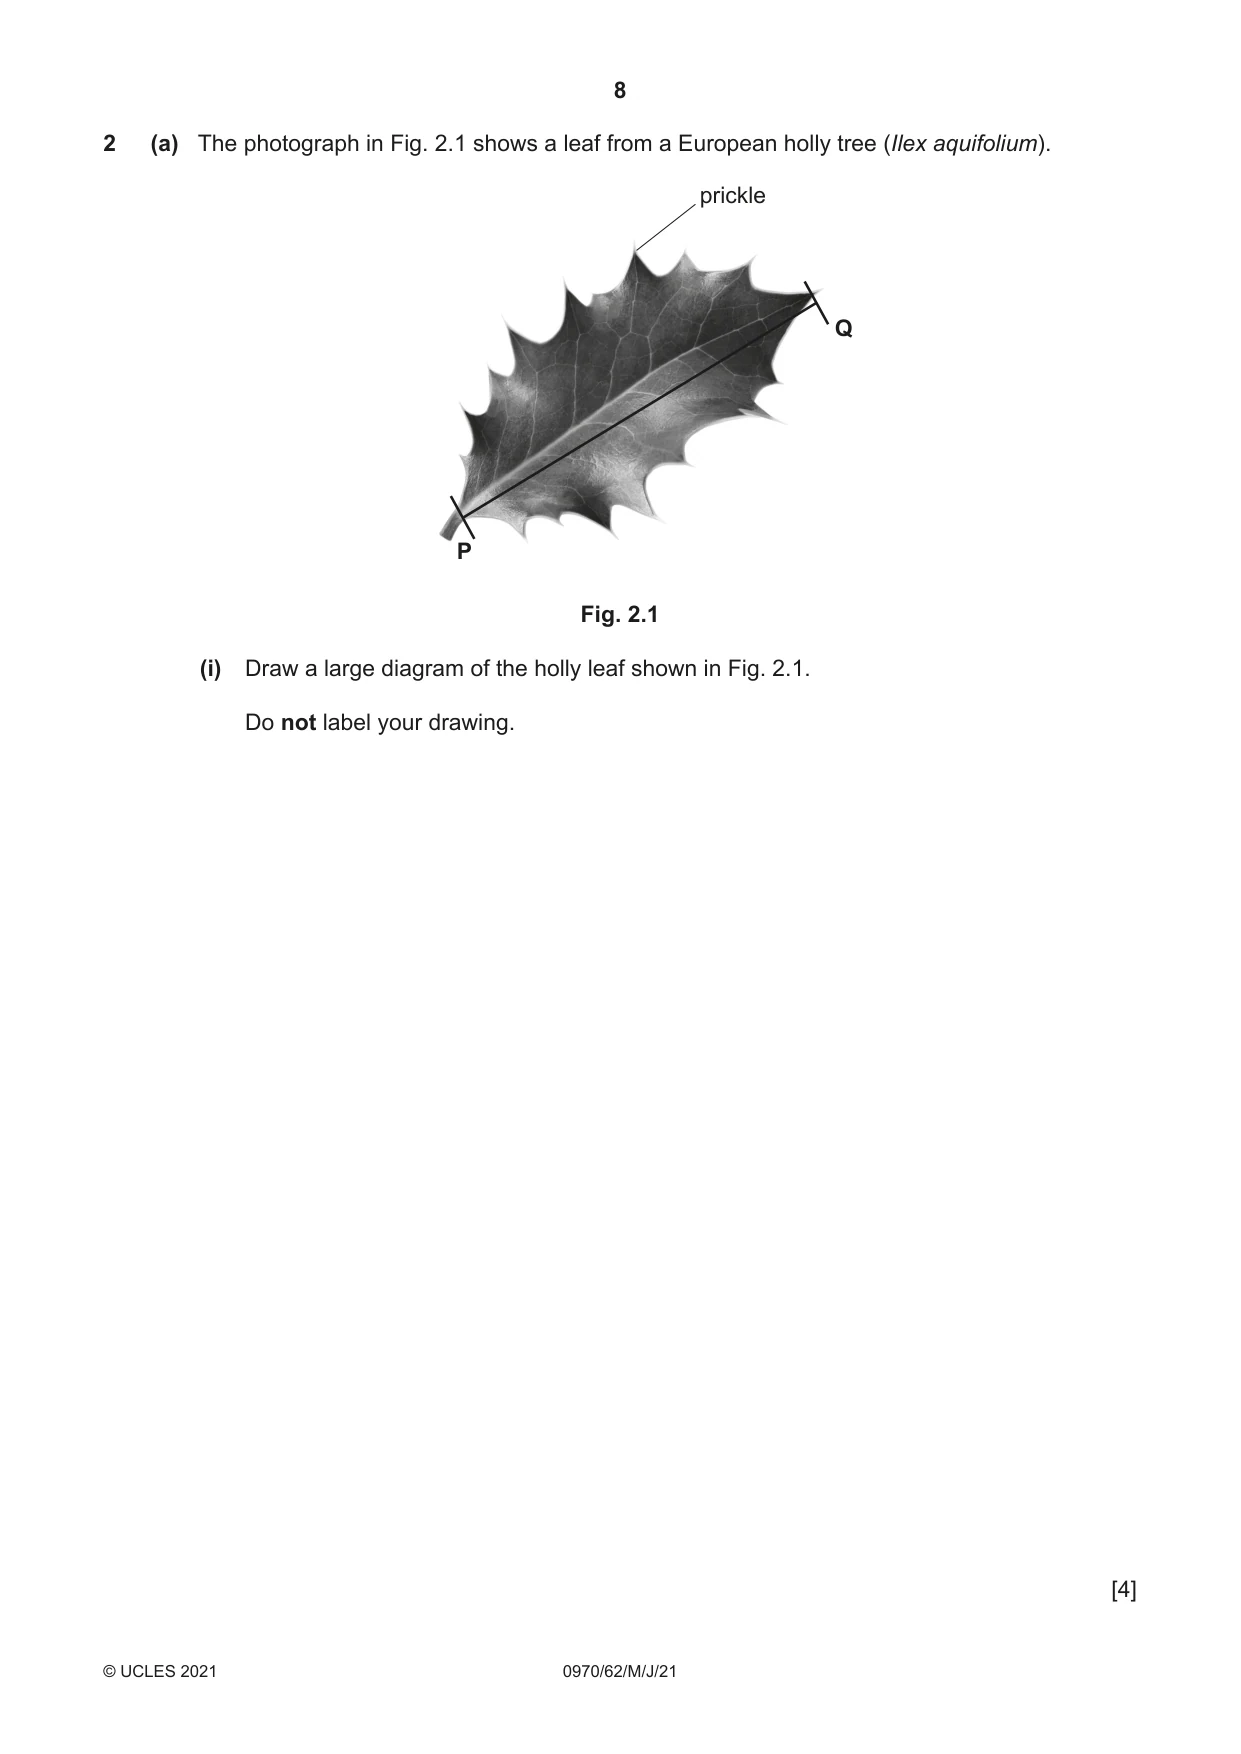
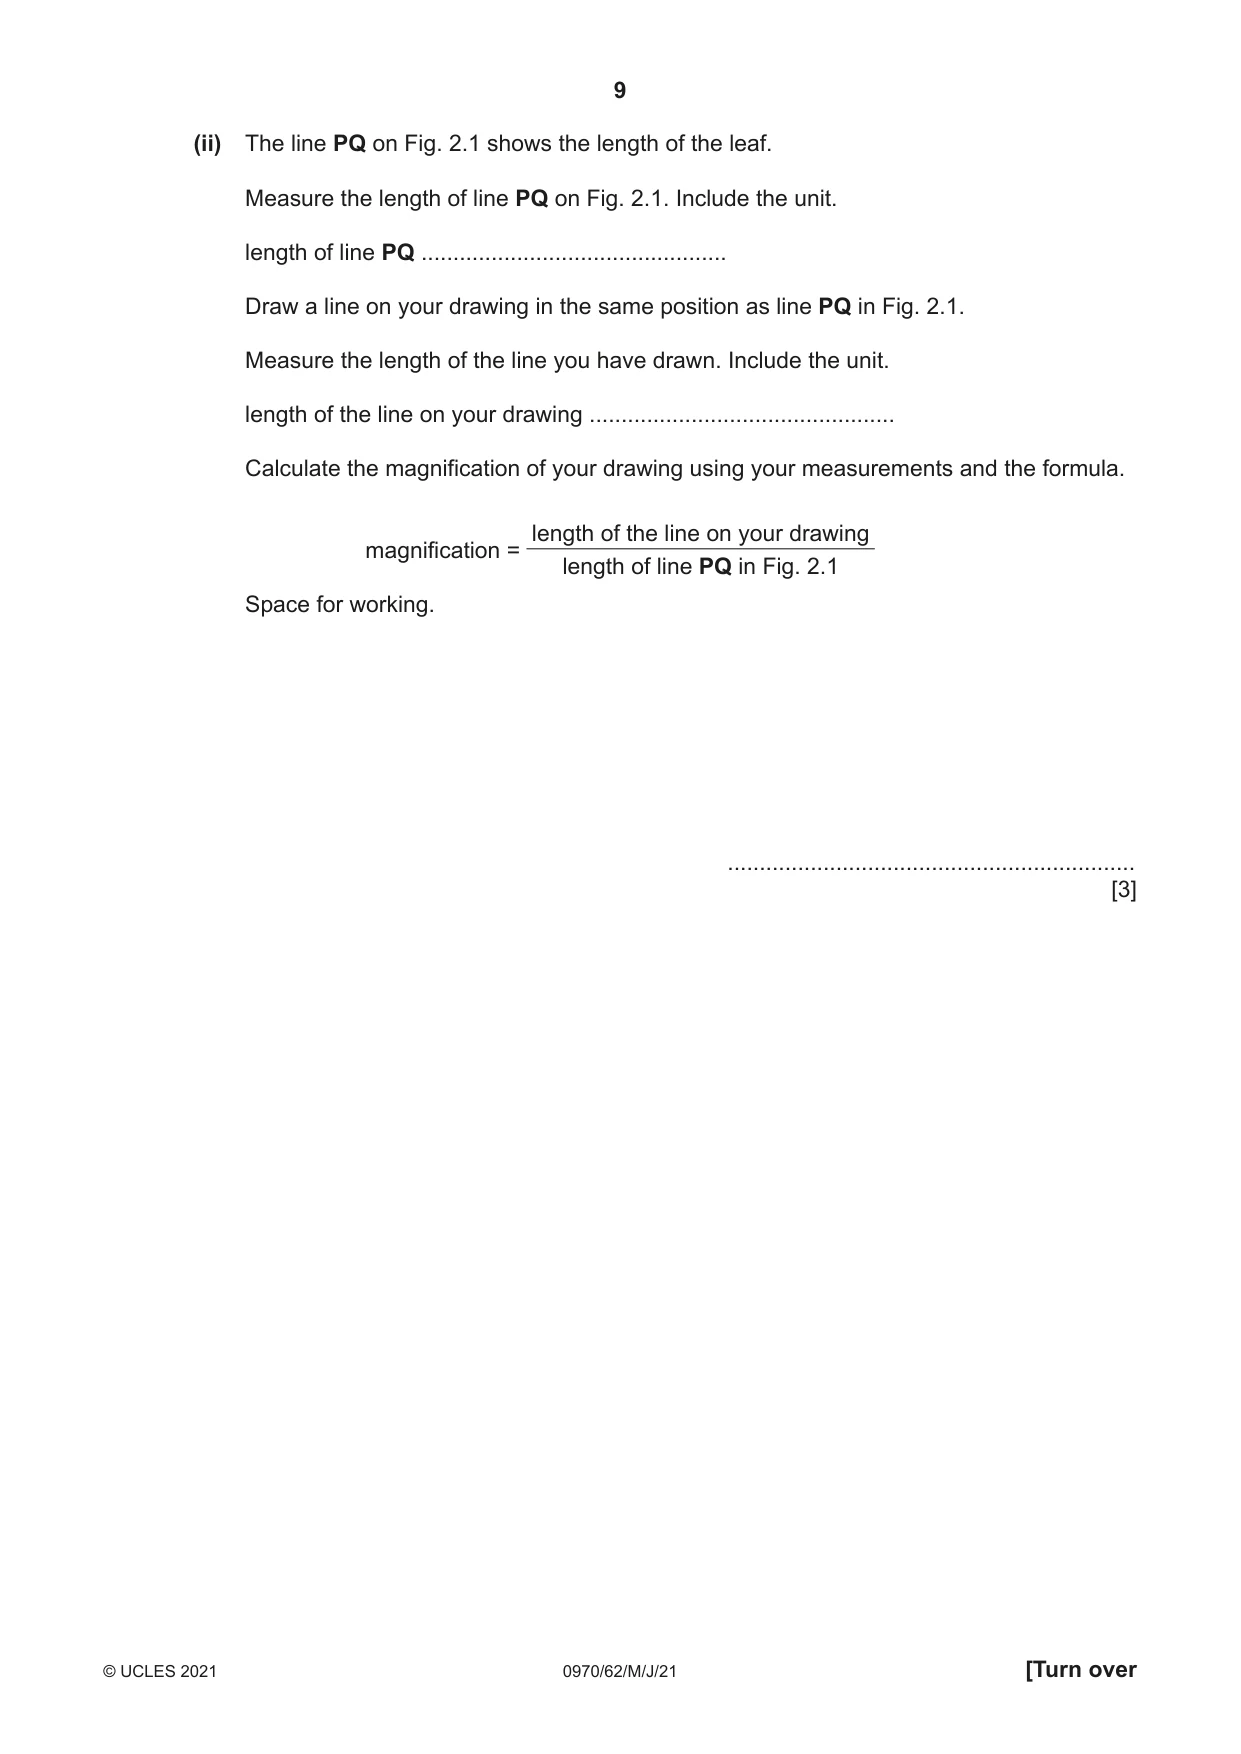
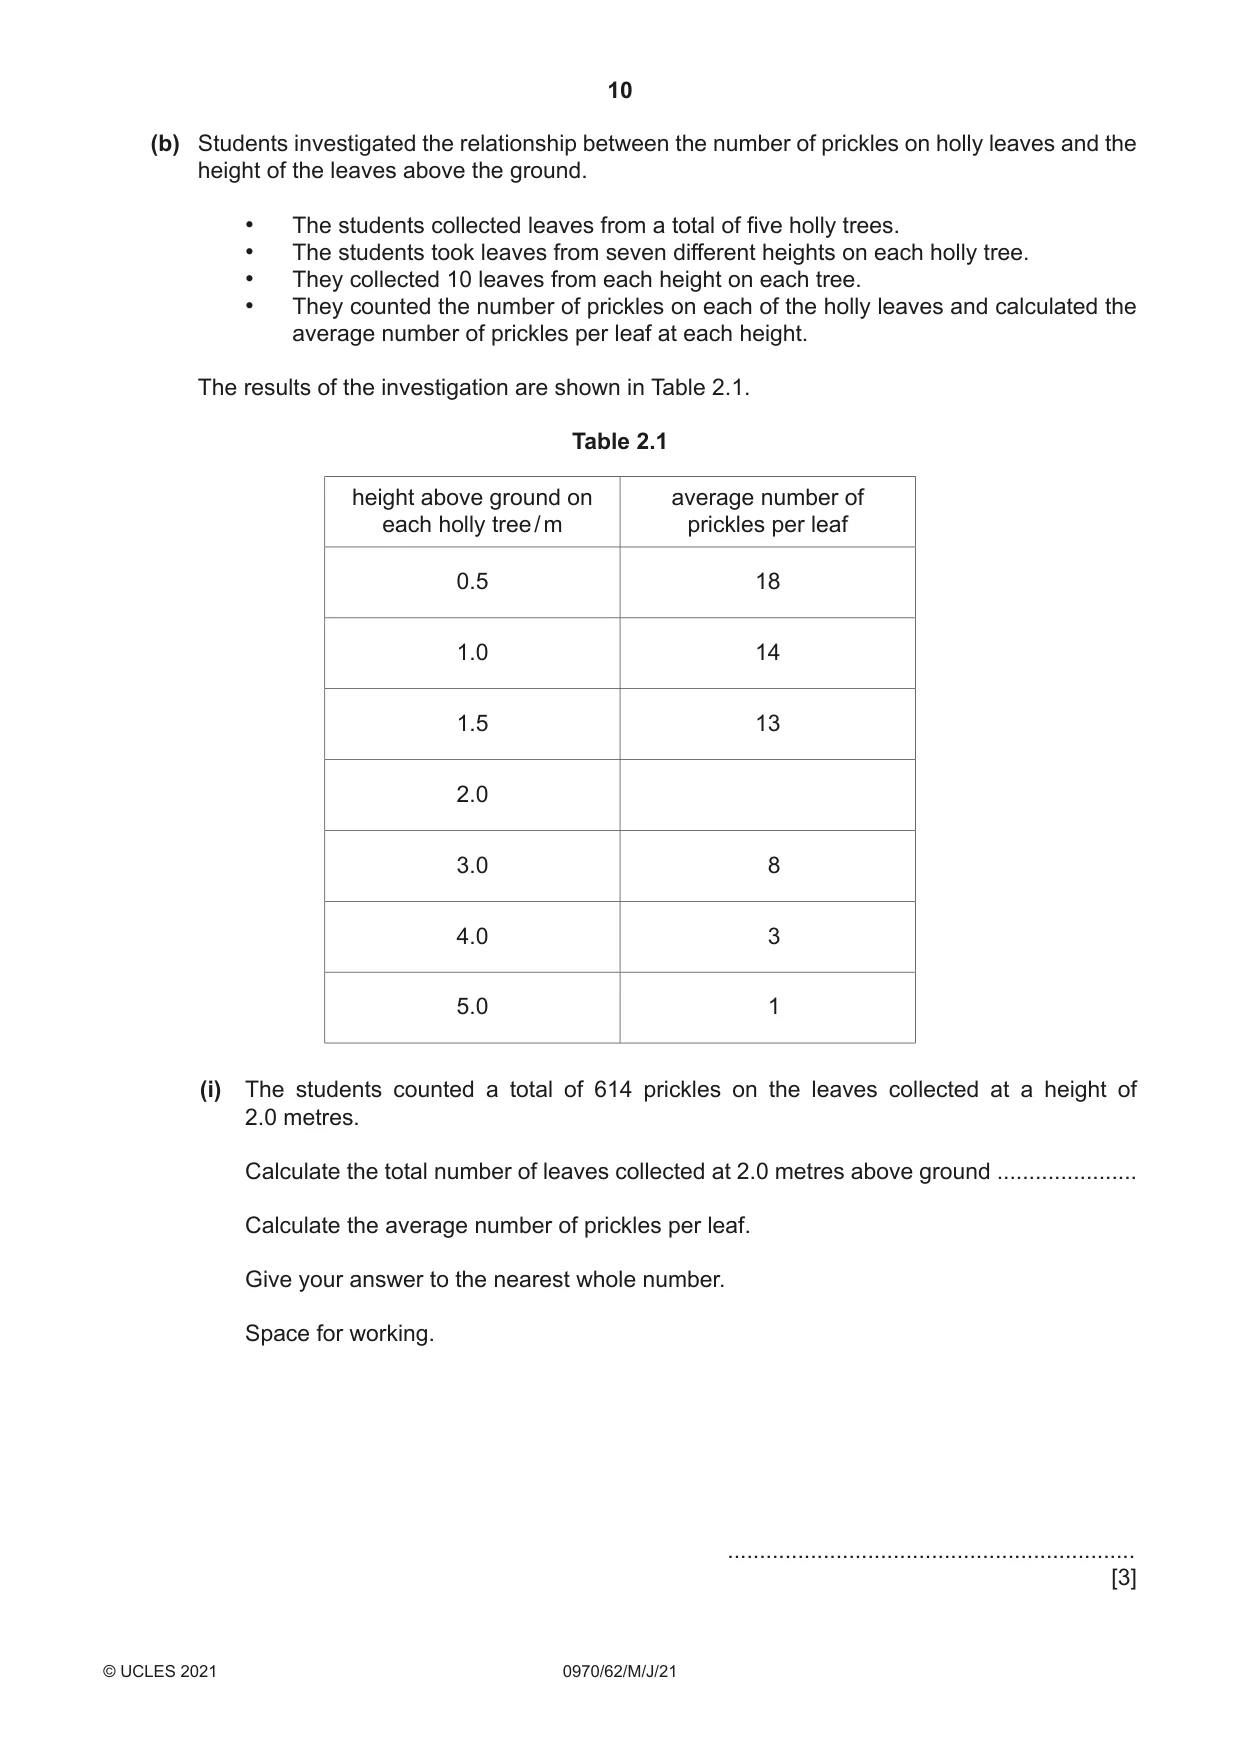
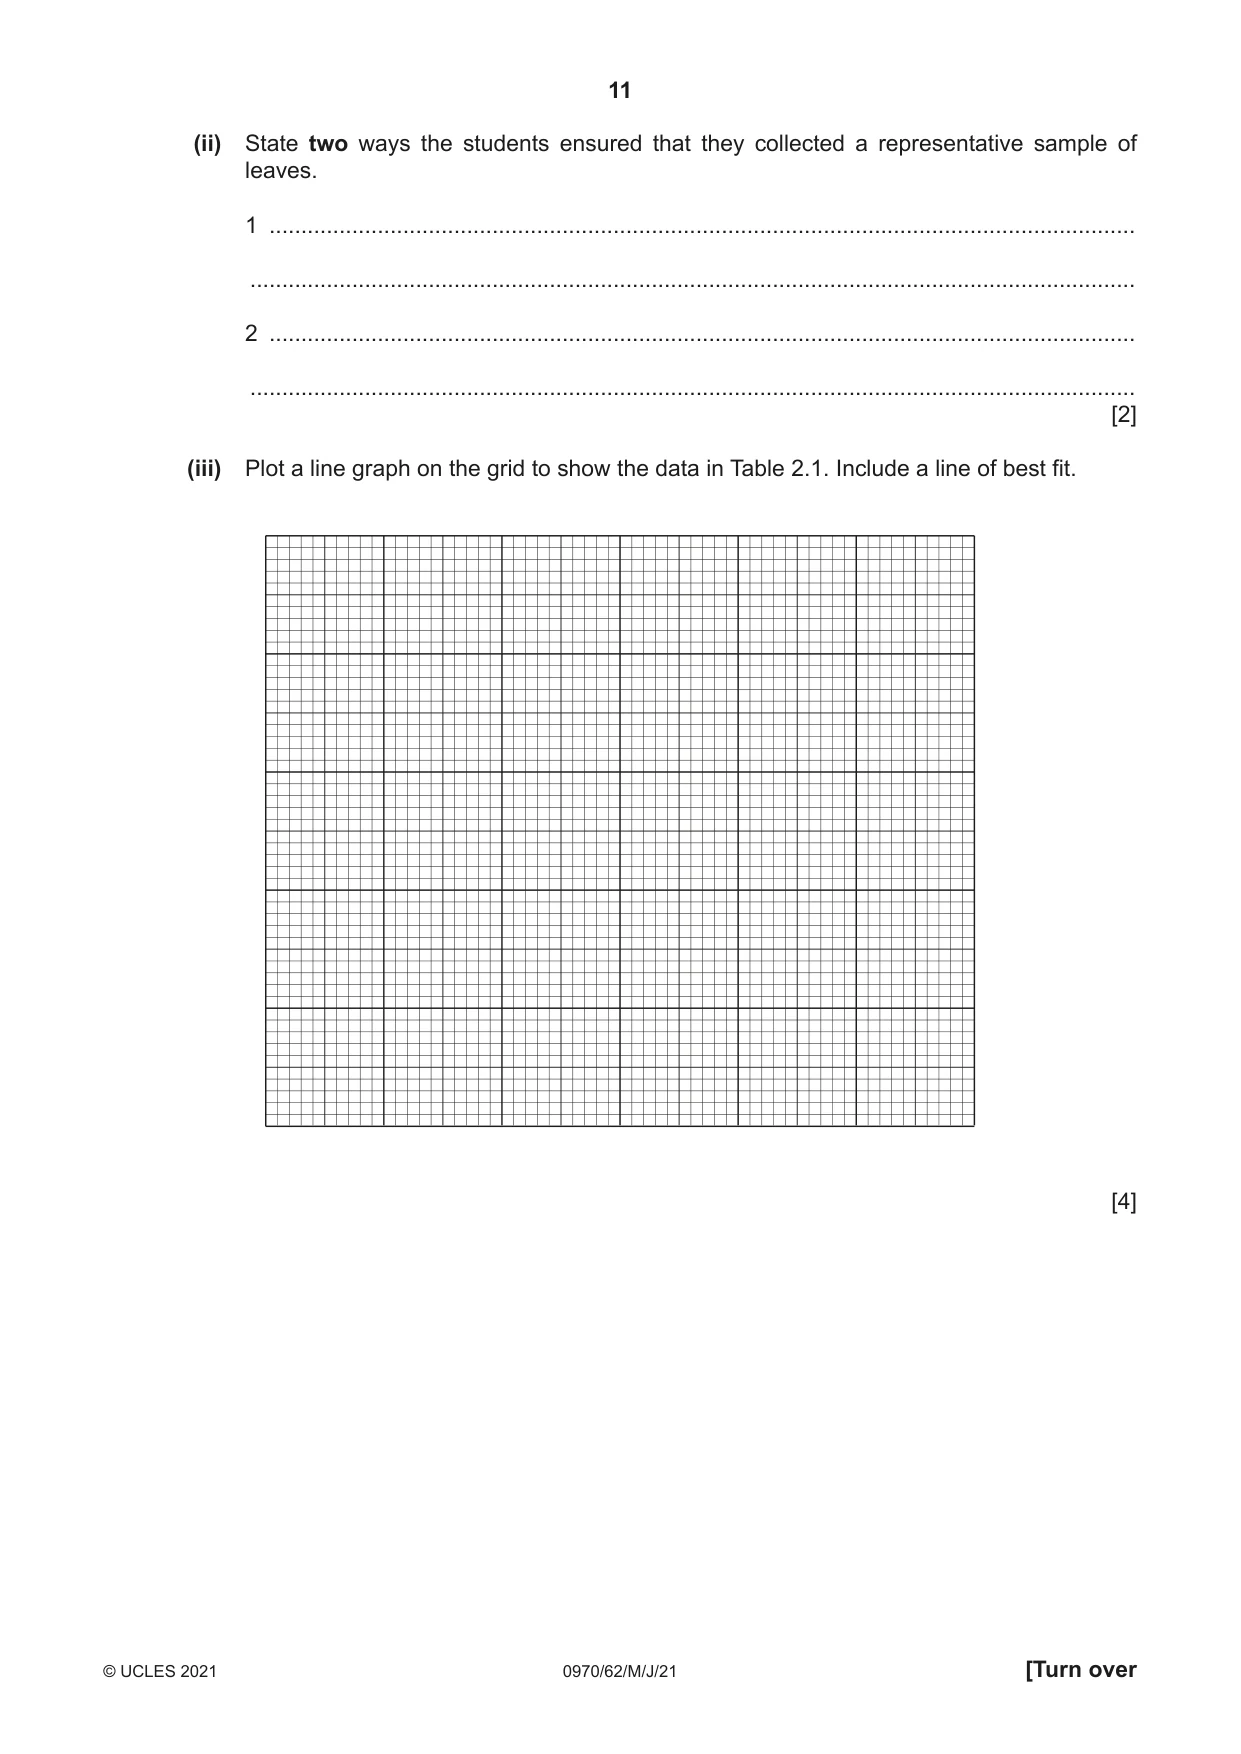
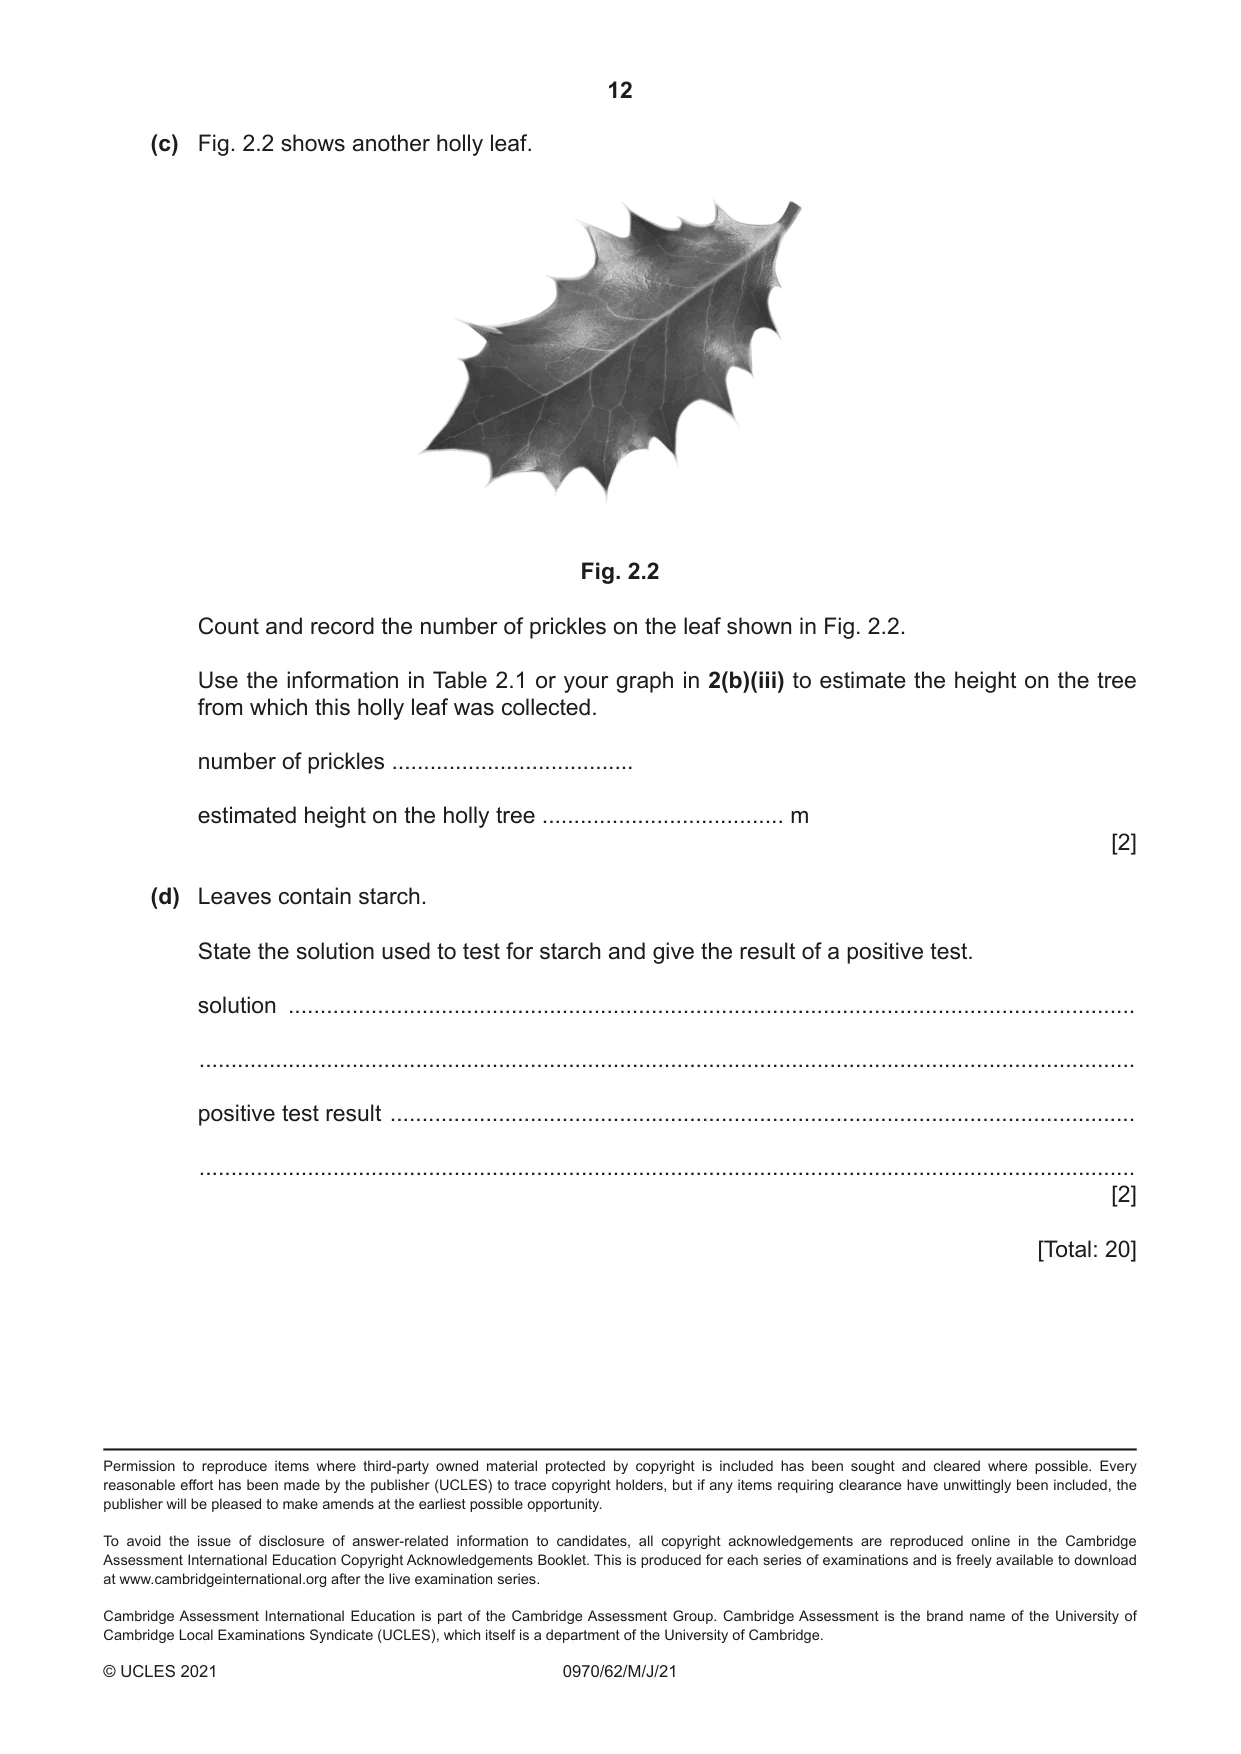
2 (a) The photograph in Fig. 2.1 shows a leaf from a European holly tree (Ilex aquifolium). prickle Q P Fig. 2.1 (i) Draw a large diagram of the holly leaf shown in Fig. 2.1. Do not label your drawing. [4] (ii) The line PQ on Fig. 2.1 shows the length of the leaf. Measure the length of line PQ on Fig. 2.1. Include the unit. length of line PQ ................................................ Draw a line on your drawing in the same position as line PQ in Fig. 2.1. Measure the length of the line you have drawn. Include the unit. length of the line on your drawing ................................................ Calculate the magnification of your drawing using your measurements and the formula. length of the line on your drawing magnification = length of line PQ in Fig. 2.1 Space for working. ................................................................ [3] (b) Students investigated the relationship between the number of prickles on holly leaves and the height of the leaves above the ground. • The students collected leaves from a total of five holly trees. • The students took leaves from seven different heights on each holly tree. • They collected 10 leaves from each height on each tree. • They counted the number of prickles on each of the holly leaves and calculated the average number of prickles per leaf at each height. The results of the investigation are shown in Table 2.1. Table 2.1 height above ground on average number of each holly tree / m prickles per leaf 0.5 18 1.0 14 1.5 13 2.0 3.0 8 4.0 3 5.0 1 (i) The students counted a total of 614 prickles on the leaves collected at a height of 2.0 metres. Calculate the total number of leaves collected at 2.0 metres above ground ...................... Calculate the average number of prickles per leaf. Give your answer to the nearest whole number. Space for working. ................................................................ [3]
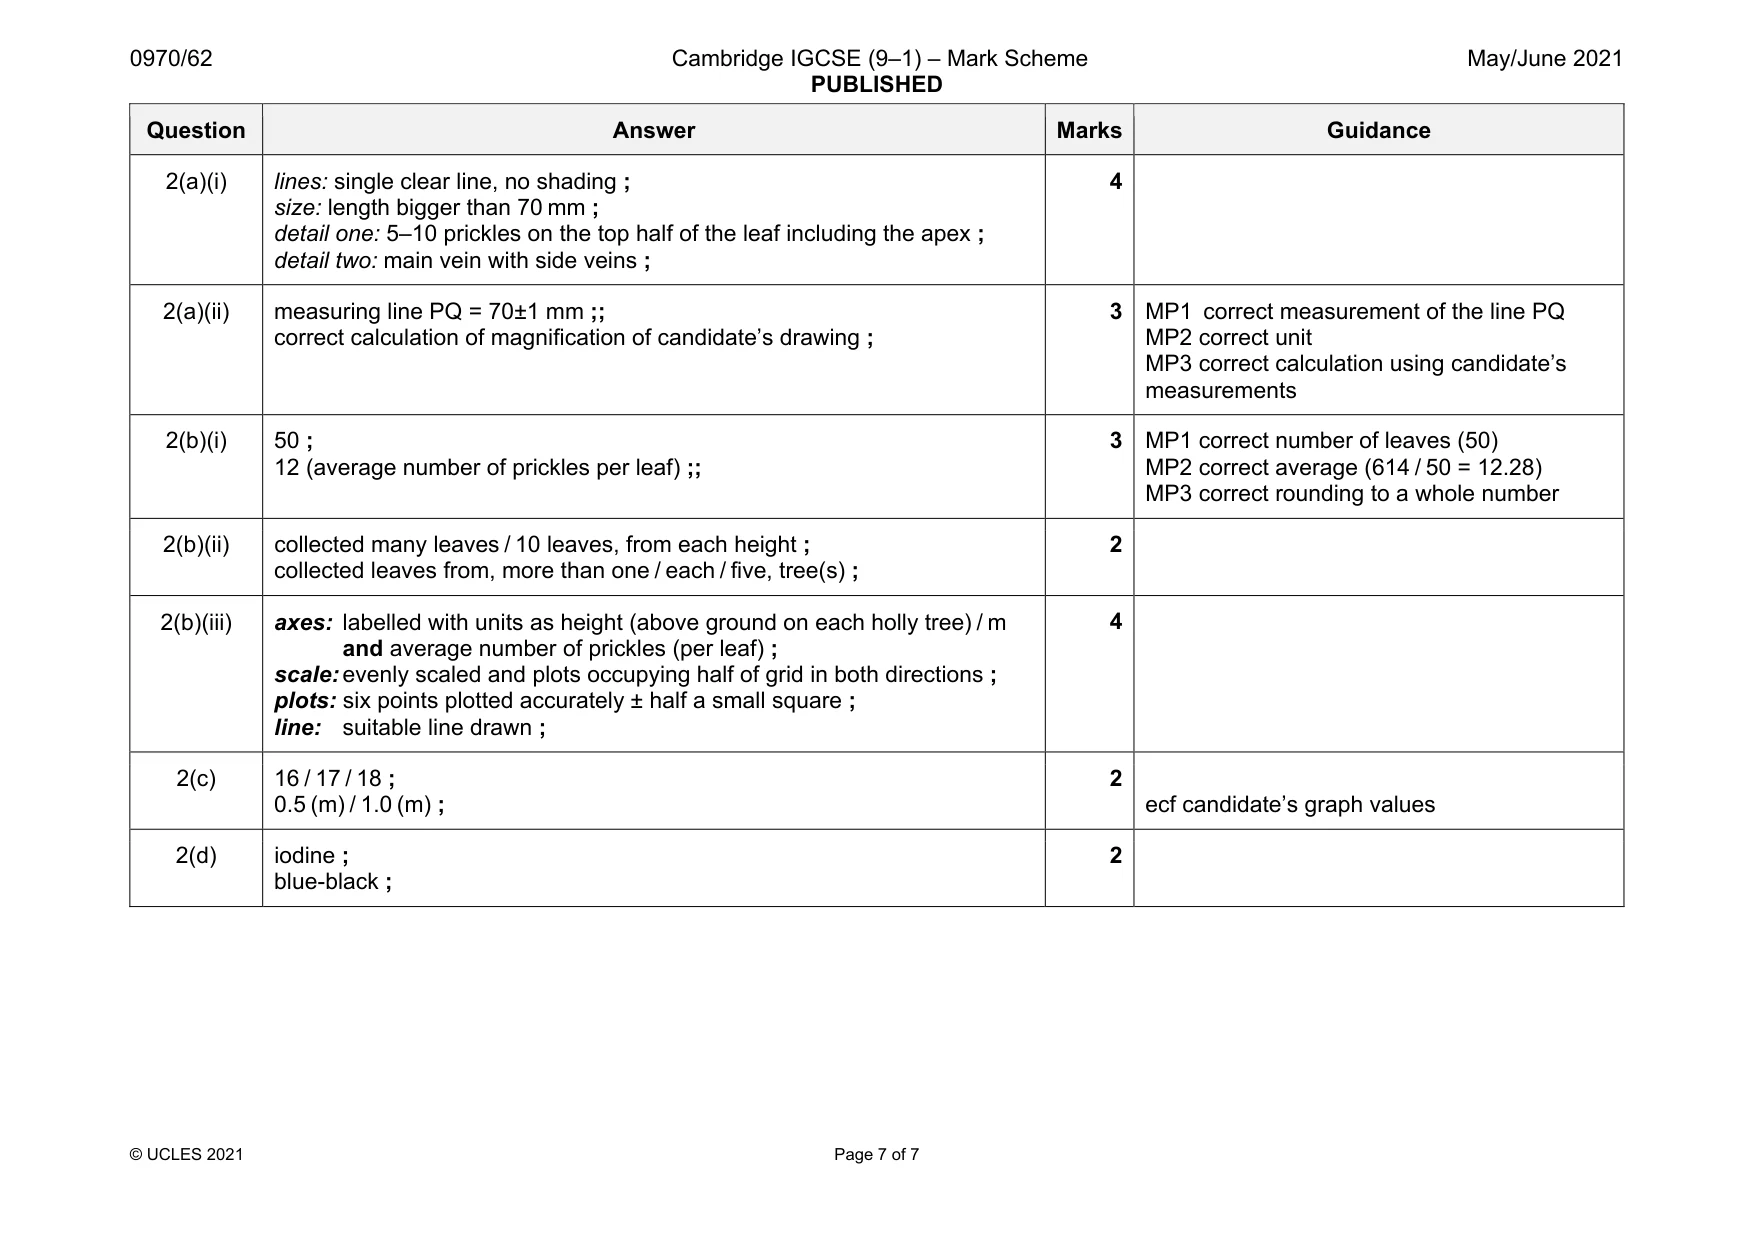
Mark scheme: 2(a)(i) lines: single clear line, no shading ; size: length bigger than 70 mm ; detail one: 5–10 prickles on the top half of the leaf including the apex ; detail two: main vein with side veins ; 4 2(a)(ii) measuring line PQ = 70±1 mm ;; correct calculation of magnification of candidate’s drawing ; 3 MP1 correct measurement of the line PQ MP2 correct unit MP3 correct calculation using candidate’s measurements 2(b)(i) 50 ; 12 (average number of prickles per leaf) ;; 3 MP1 correct number of leaves (50) MP2 correct average (614 / 50 = 12.28) MP3 correct rounding to a whole number 2(b)(ii) collected many leaves / 10 leaves, from each height ; collected leaves from, more than one / each / five, tree(s) ; 2 2(b)(iii) axes: labelled with units as height (above ground on each holly tree) / m and average number of prickles (per leaf) ; scale: evenly scaled and plots occupying half of grid in both directions ; plots: six points plotted accurately ± half a small square ; line: suitable line drawn ; 4 2(c) 16 / 17 / 18 ; 0.5 (m) / 1.0 (m) ; 2 ecf candidate’s graph values 2(d) iodine ; blue-black ; 2
What was in this paper
The subtopics covered by these 2 questions, and how many questions each got. Open one in a new tab to see every Cambridge question on it.
What you needed in this session
Cambridge’s own grade thresholds for 2021 May/June, Paper 6 · Variant 2. A higher threshold means an easier paper — the bar moves with how the cohort did.