Cambridge IGCSE Biology (9-1) 0970 — 2020 Oct/Nov Paper 6 · Variant 2
0970/62/O/N/20 · 2 questions · 40 marks · ≈45 min
The question paper and its mark scheme, free to read here and free to download. This is Cambridge’s own paper, exactly as it was sat.
Question paper12 pages

Mark scheme9 pages
Answers below. Sit the paper first if you are practising.
Questions as text
Q1 · A student investigated the effect of temperature on the rate of rising of bread dough
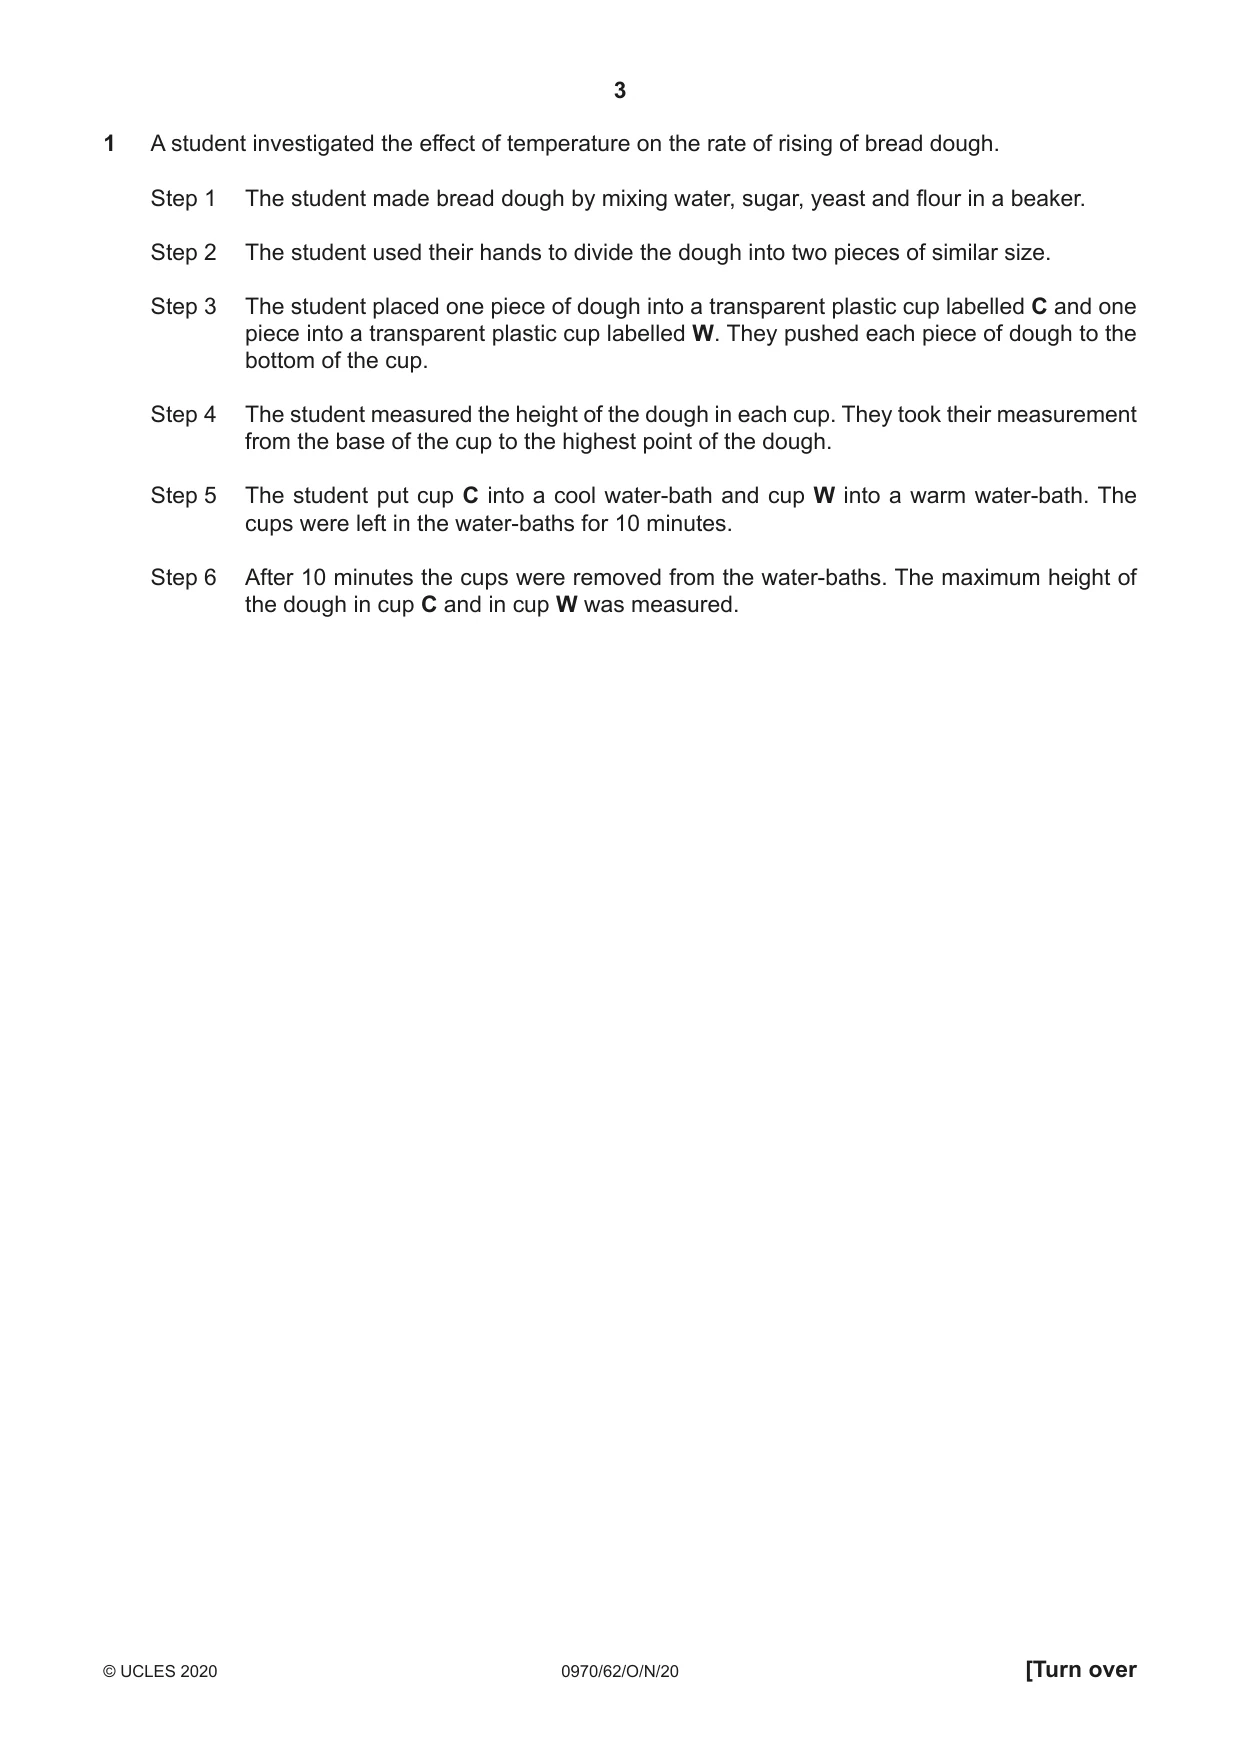
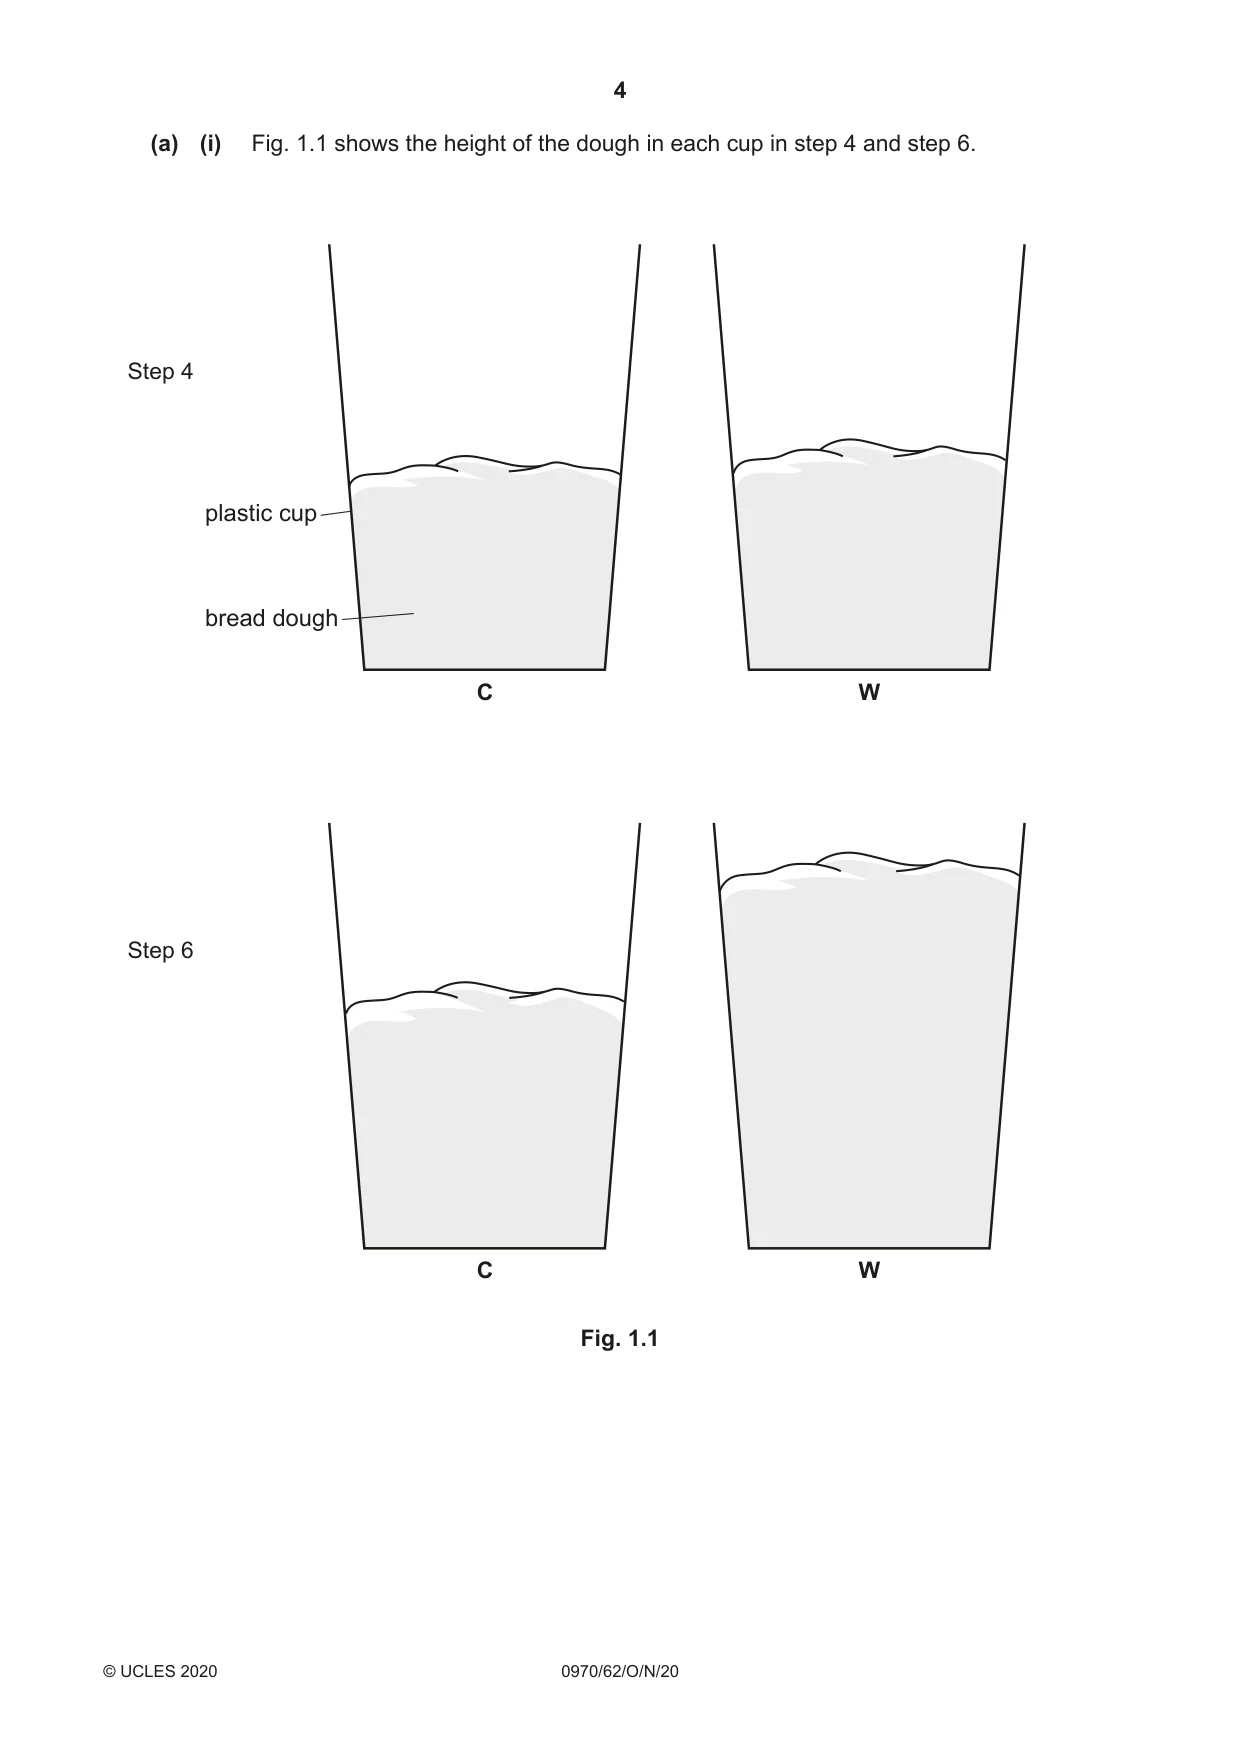
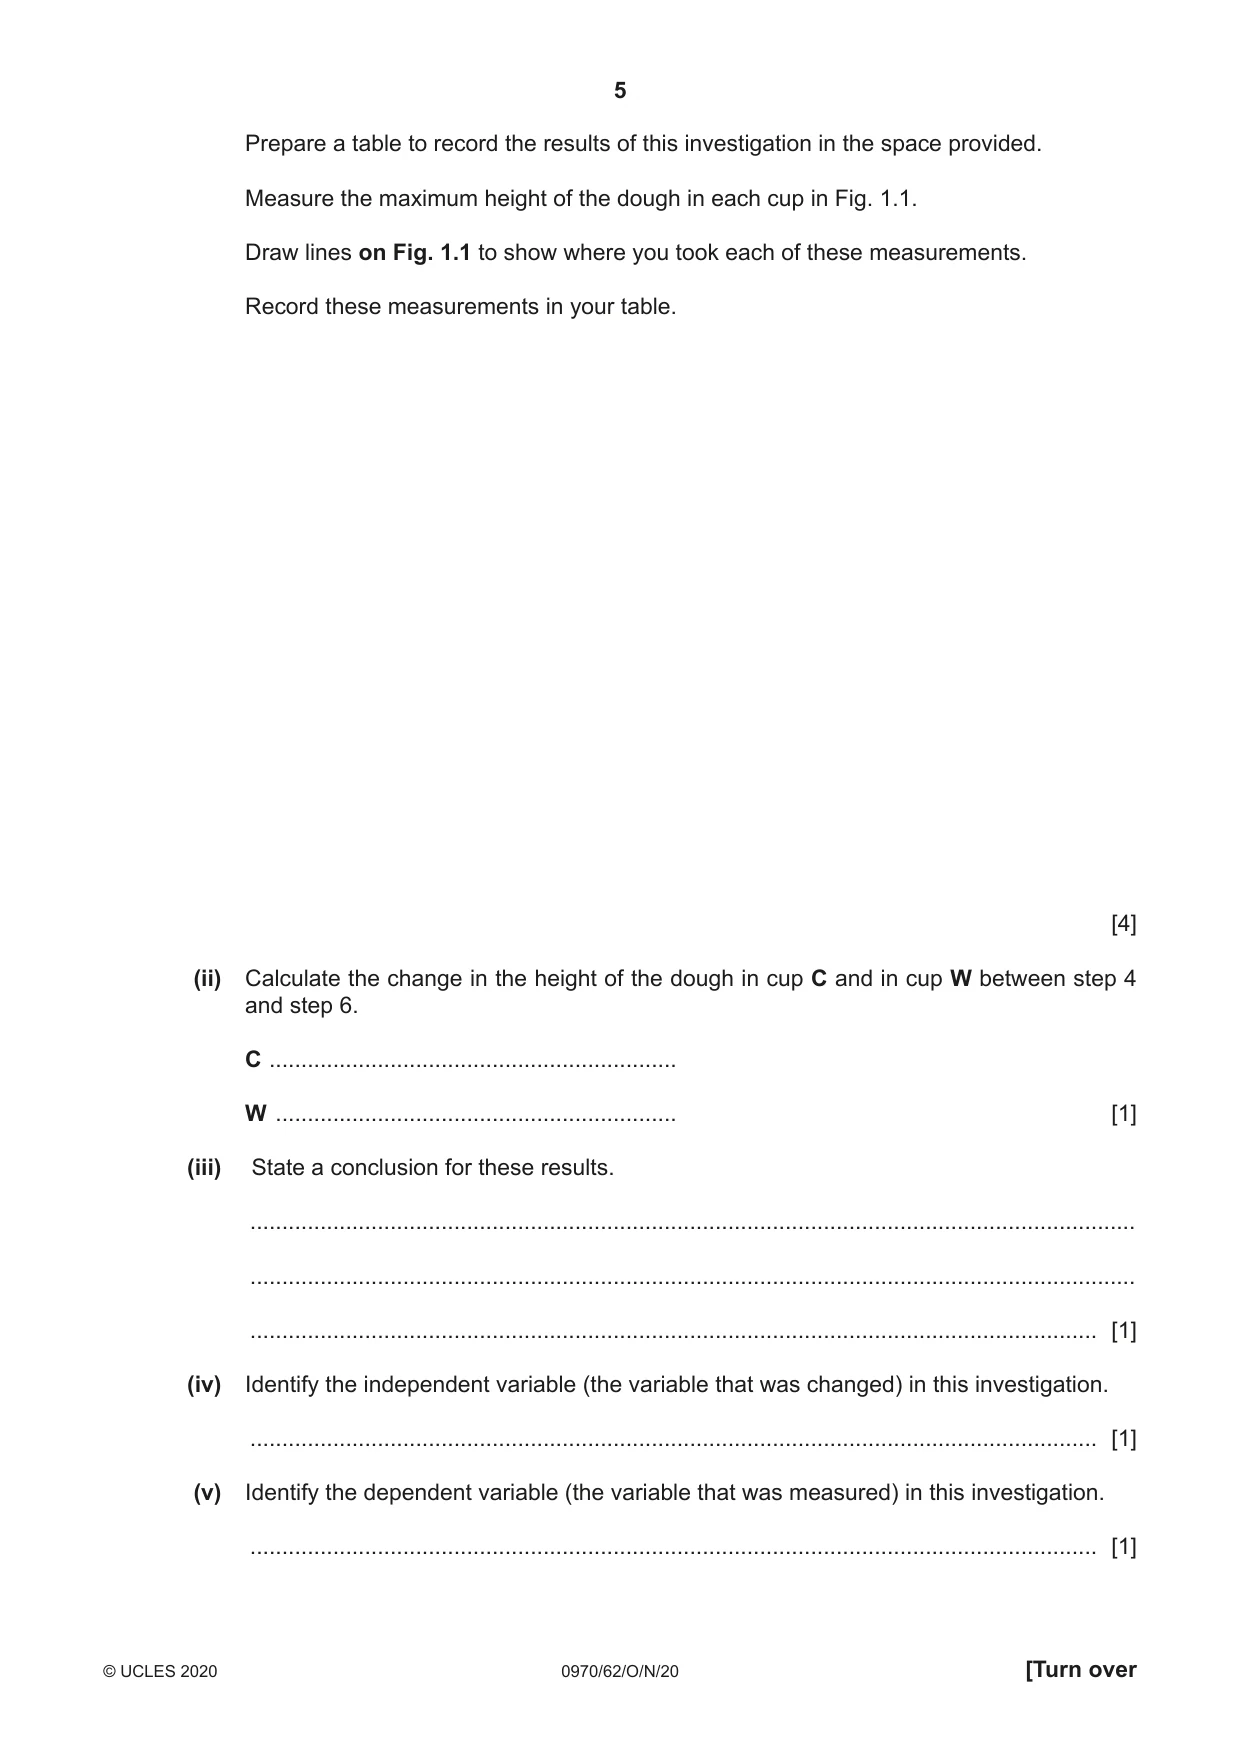
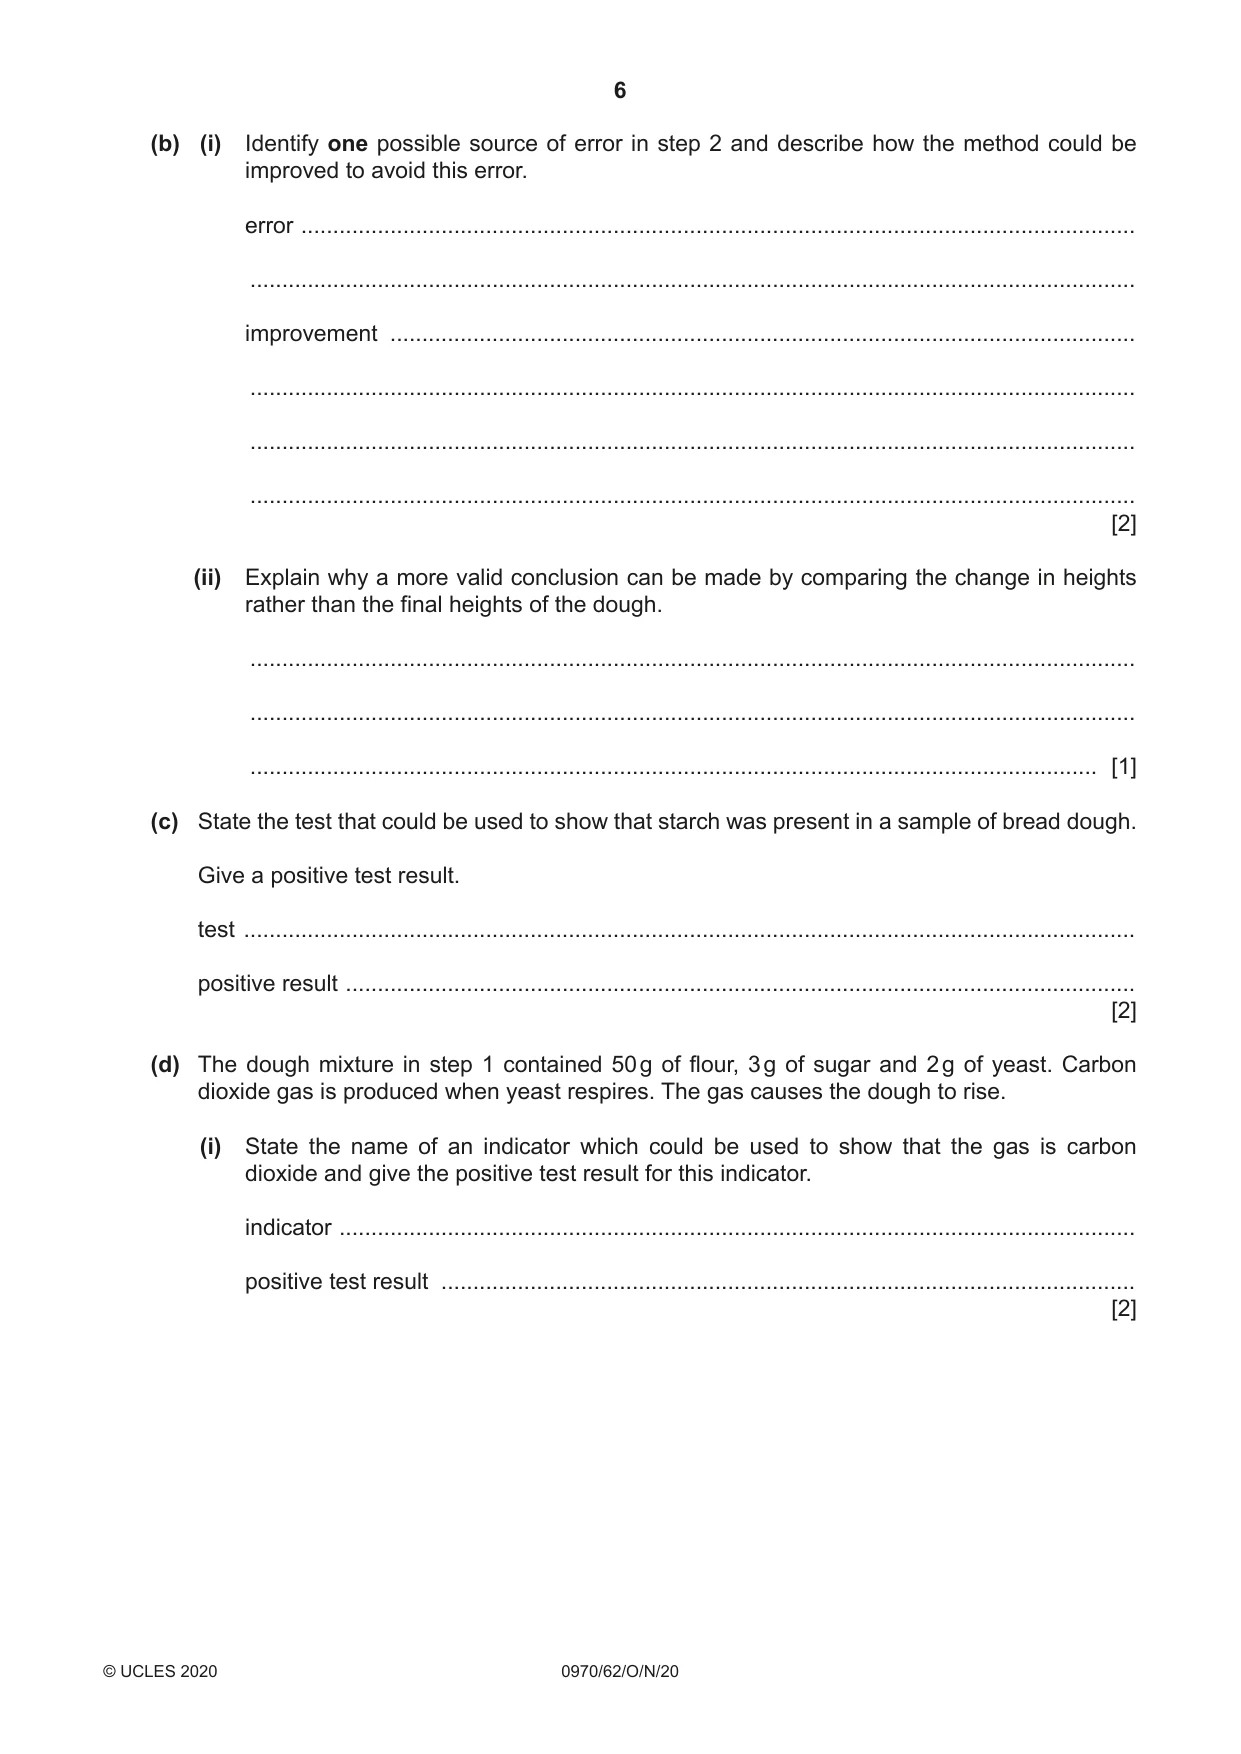
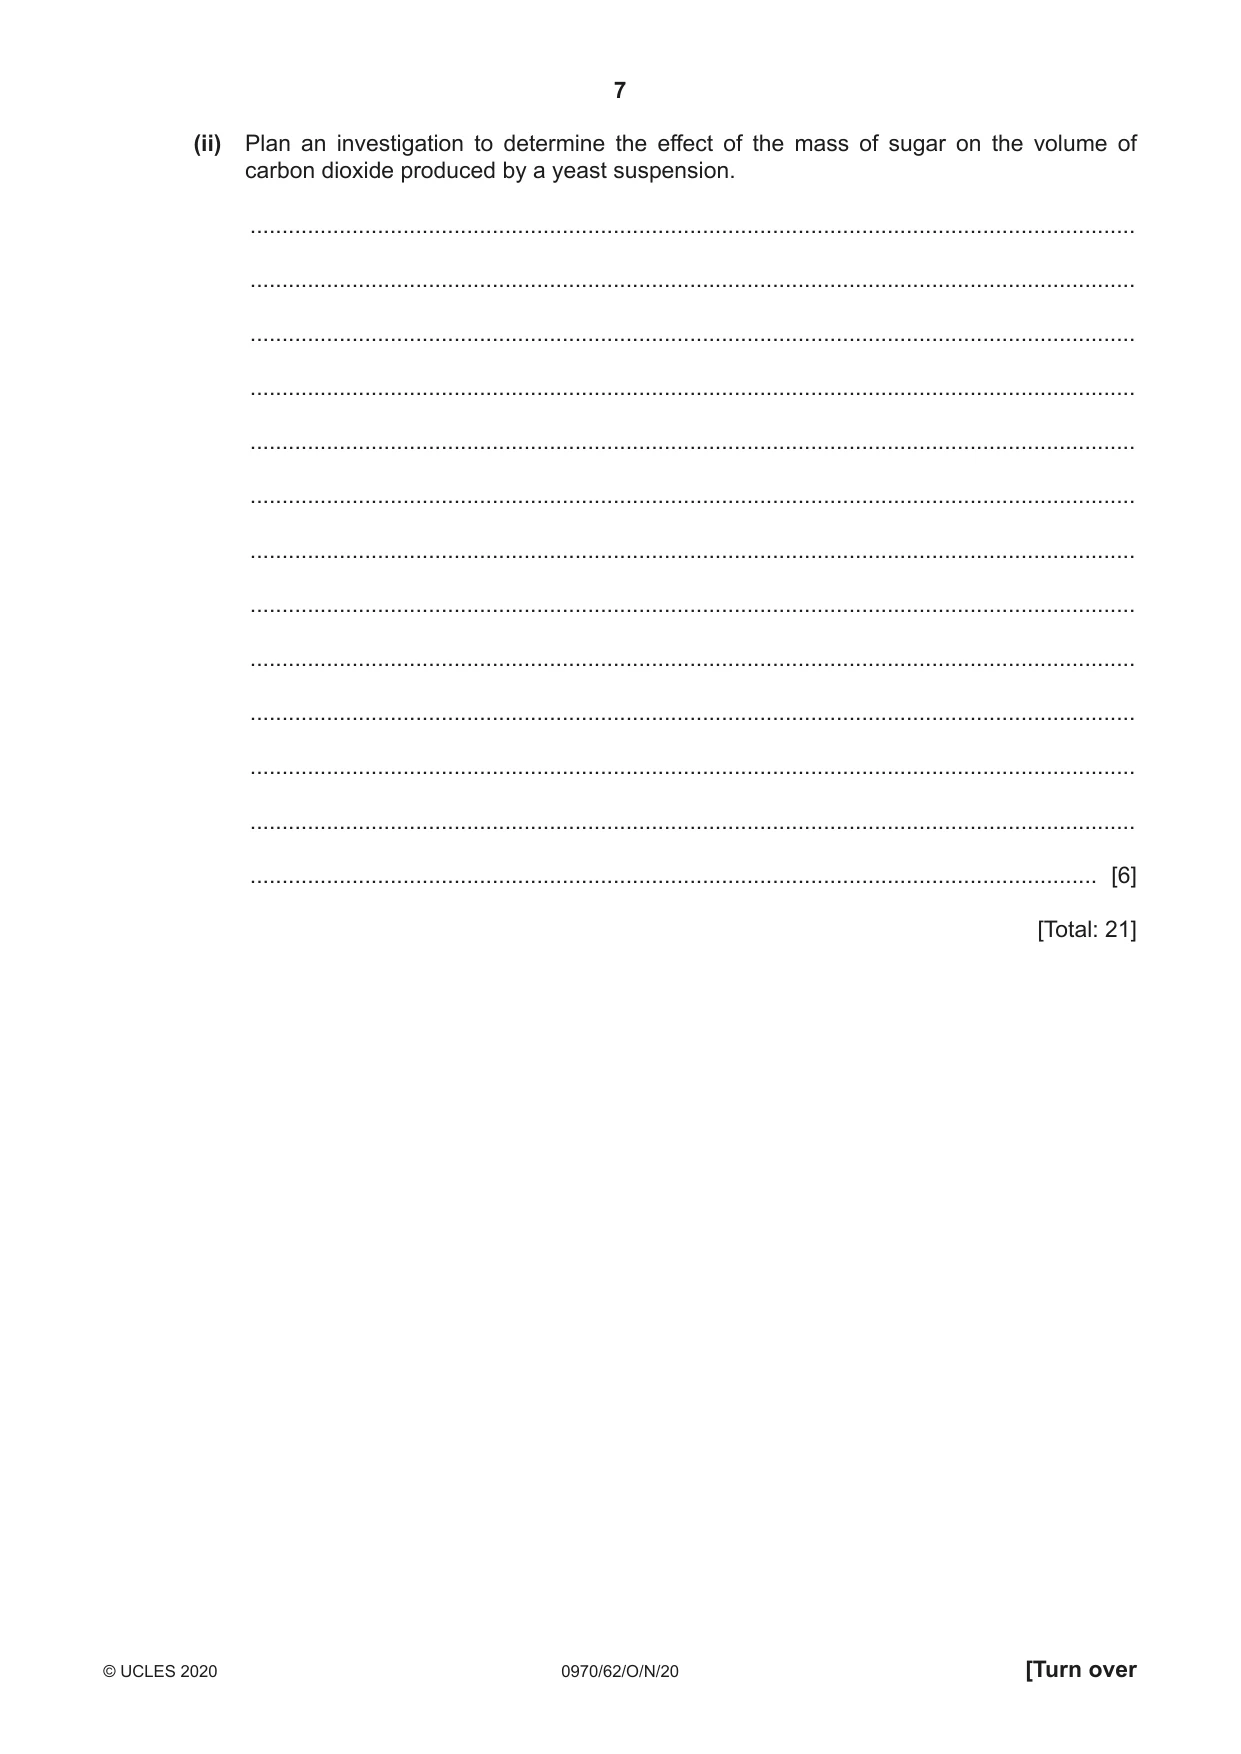
1 A student investigated the effect of temperature on the rate of rising of bread dough. Step 1 The student made bread dough by mixing water, sugar, yeast and flour in a beaker. Step 2 The student used their hands to divide the dough into two pieces of similar size. Step 3 The student placed one piece of dough into a transparent plastic cup labelled C and one piece into a transparent plastic cup labelled W. They pushed each piece of dough to the bottom of the cup. Step 4 The student measured the height of the dough in each cup. They took their measurement from the base of the cup to the highest point of the dough. Step 5 The student put cup C into a cool water-bath and cup W into a warm water-bath. The cups were left in the water-baths for 10 minutes. Step 6 After 10 minutes the cups were removed from the water-baths. The maximum height of the dough in cup C and in cup W was measured. (a) (i) Fig. 1.1 shows the height of the dough in each cup in step 4 and step 6. Step 4 plastic cup bread dough C W Step 6 C W Fig. 1.1 Prepare a table to record the results of this investigation in the space provided. Measure the maximum height of the dough in each cup in Fig. 1.1. Draw lines on Fig. 1.1 to show where you took each of these measurements. Record these measurements in your table. [4] (ii) Calculate the change in the height of the dough in cup C and in cup W between step 4 and step 6. C ................................................................ W ............................................................... [1] (iii) State a conclusion for these results. ........................................................................................................................................... ........................................................................................................................................... ..................................................................................................................................... [1] (iv) Identify the independent variable (the variable that was changed) in this investigation. ..................................................................................................................................... [1] (v) Identify the dependent variable (the variable that was measured) in this investigation. ..................................................................................................................................... [1] (b) (i) Identify one possible source of error in step 2 and describe how the method could be improved to avoid this error. error ................................................................................................................................... ........................................................................................................................................... improvement ..................................................................................................................... ........................................................................................................................................... ........................................................................................................................................... ........................................................................................................................................... [2] (ii) Explain why a more valid conclusion can be made by comparing the change in heights rather than the final heights of the dough. ........................................................................................................................................... ........................................................................................................................................... ..................................................................................................................................... [1] (c) State the test that could be used to show that starch was present in a sample of bread dough. Give a positive test result. test ............................................................................................................................................ positive result ............................................................................................................................ [2] (d) The dough mixture in step 1 contained 50 g of flour, 3 g of sugar and 2 g of yeast. Carbon dioxide gas is produced when yeast respires. The gas causes the dough to rise. (i) State the name of an indicator which could be used to show that the gas is carbon dioxide and give the positive test result for this indicator. indicator ............................................................................................................................. positive test result ............................................................................................................. [2] (ii) Plan an investigation to determine the effect of the mass of sugar on the volume of carbon dioxide produced by a yeast suspension. ........................................................................................................................................... ........................................................................................................................................... ........................................................................................................................................... ........................................................................................................................................... ........................................................................................................................................... ........................................................................................................................................... ........................................................................................................................................... ........................................................................................................................................... ........................................................................................................................................... ........................................................................................................................................... ........................................................................................................................................... ........................................................................................................................................... ..................................................................................................................................... [6] [Total: 21]
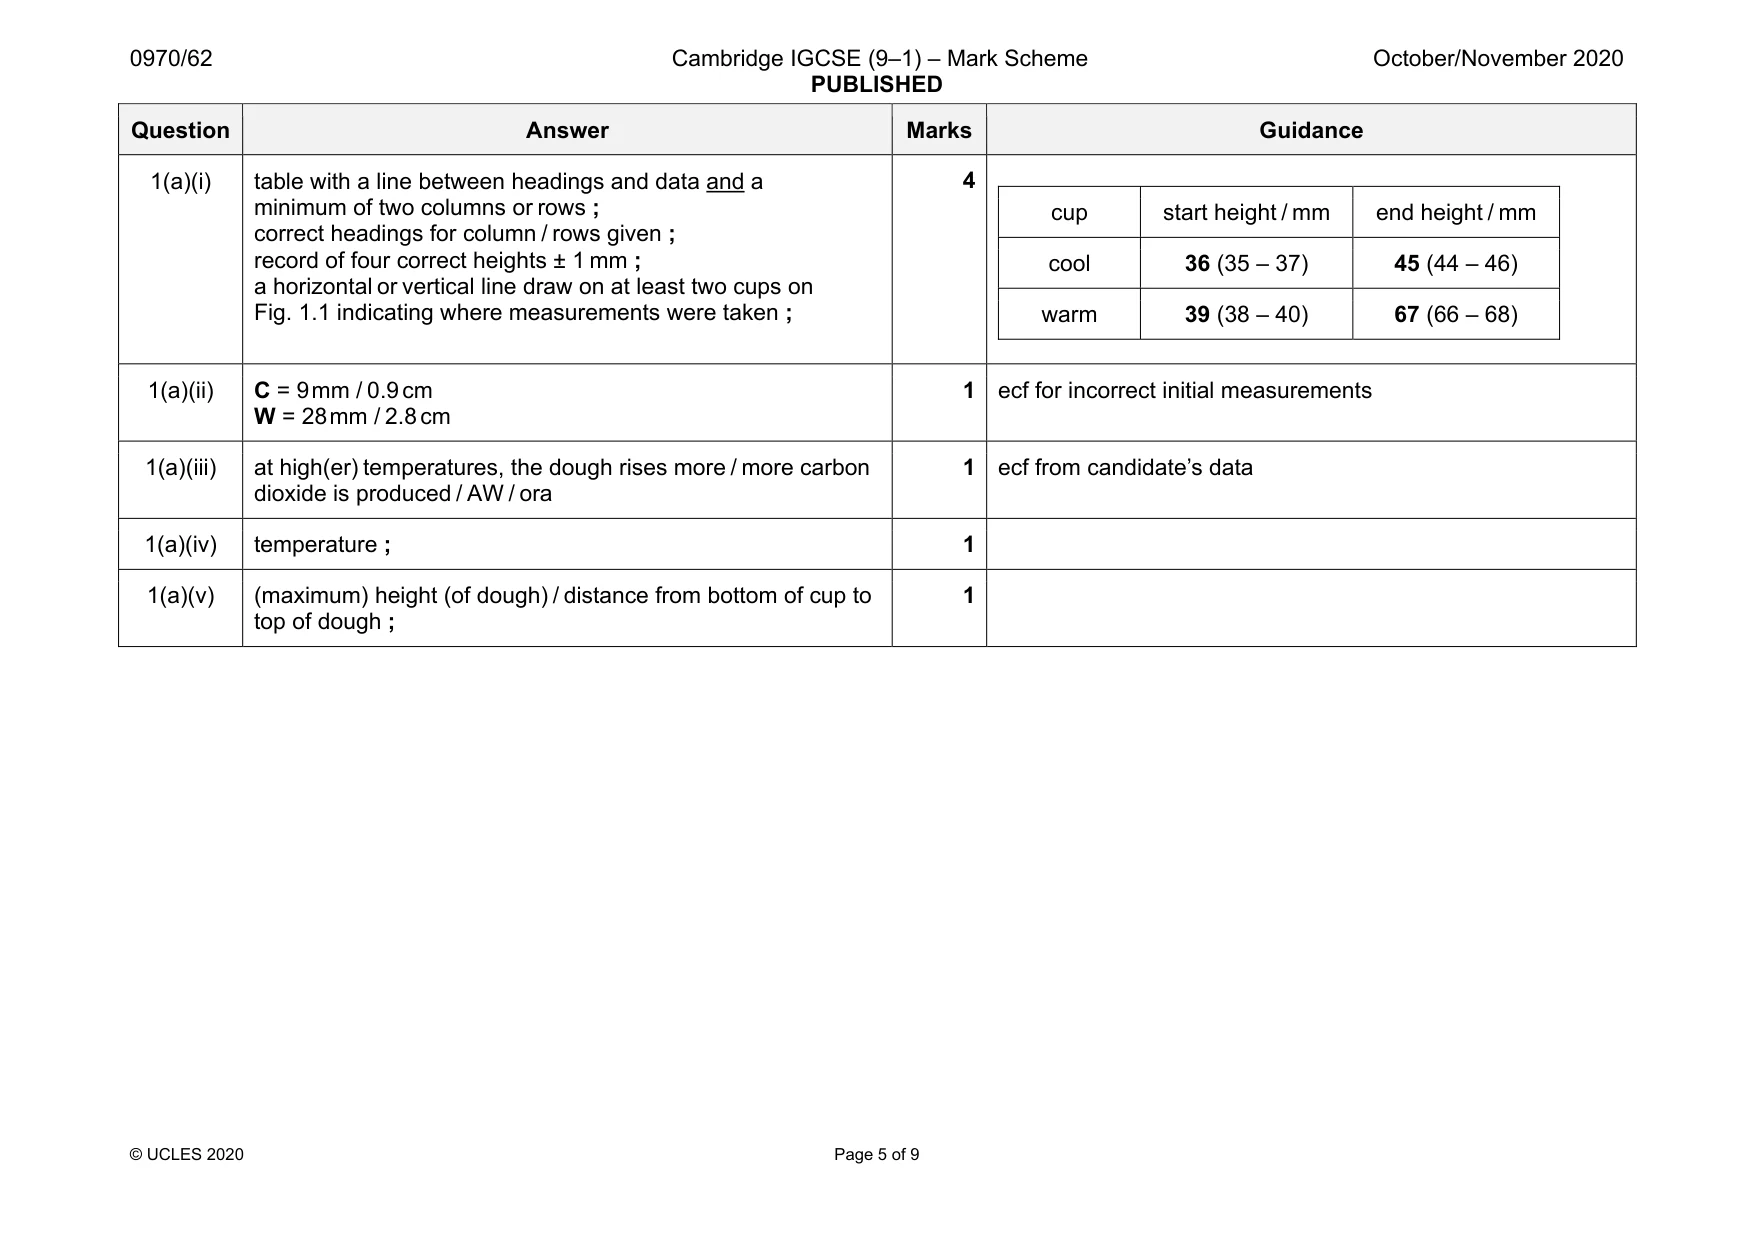
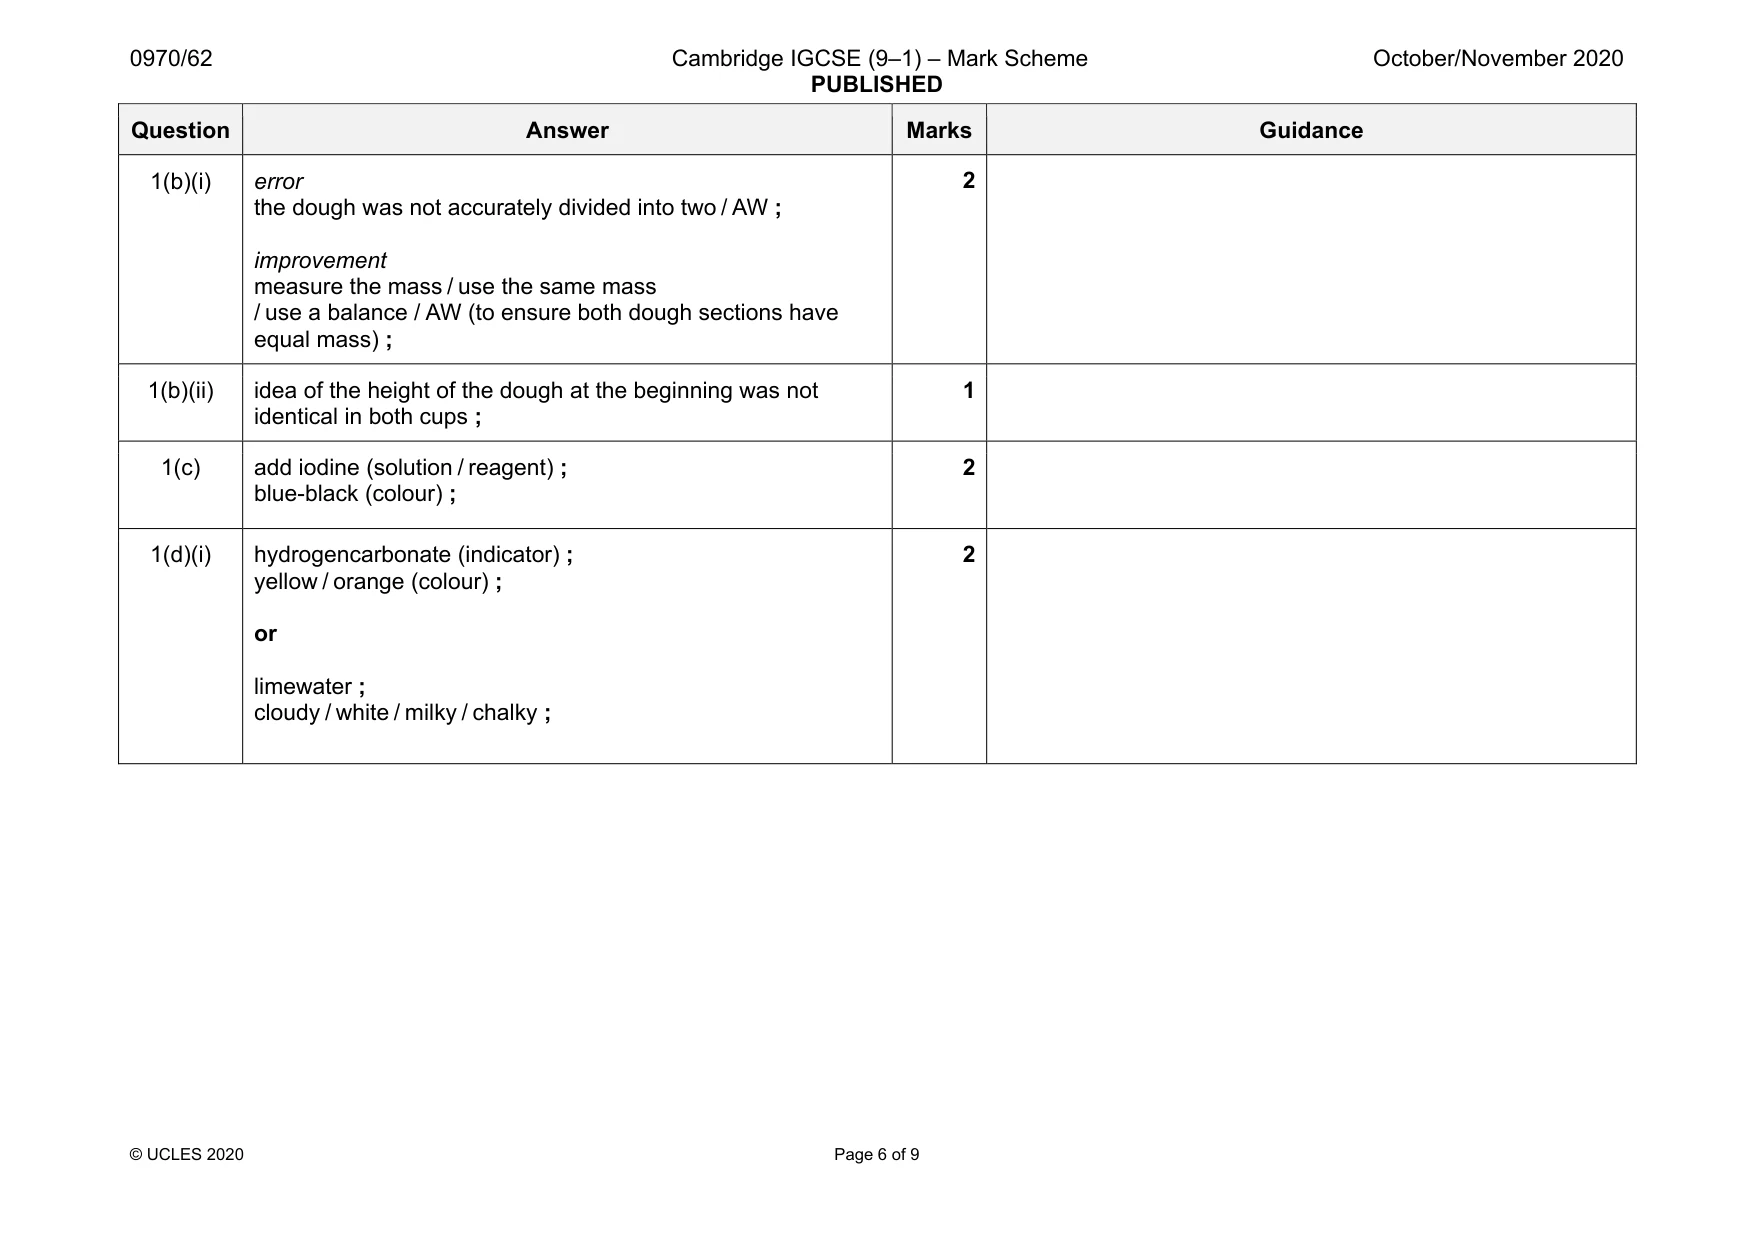
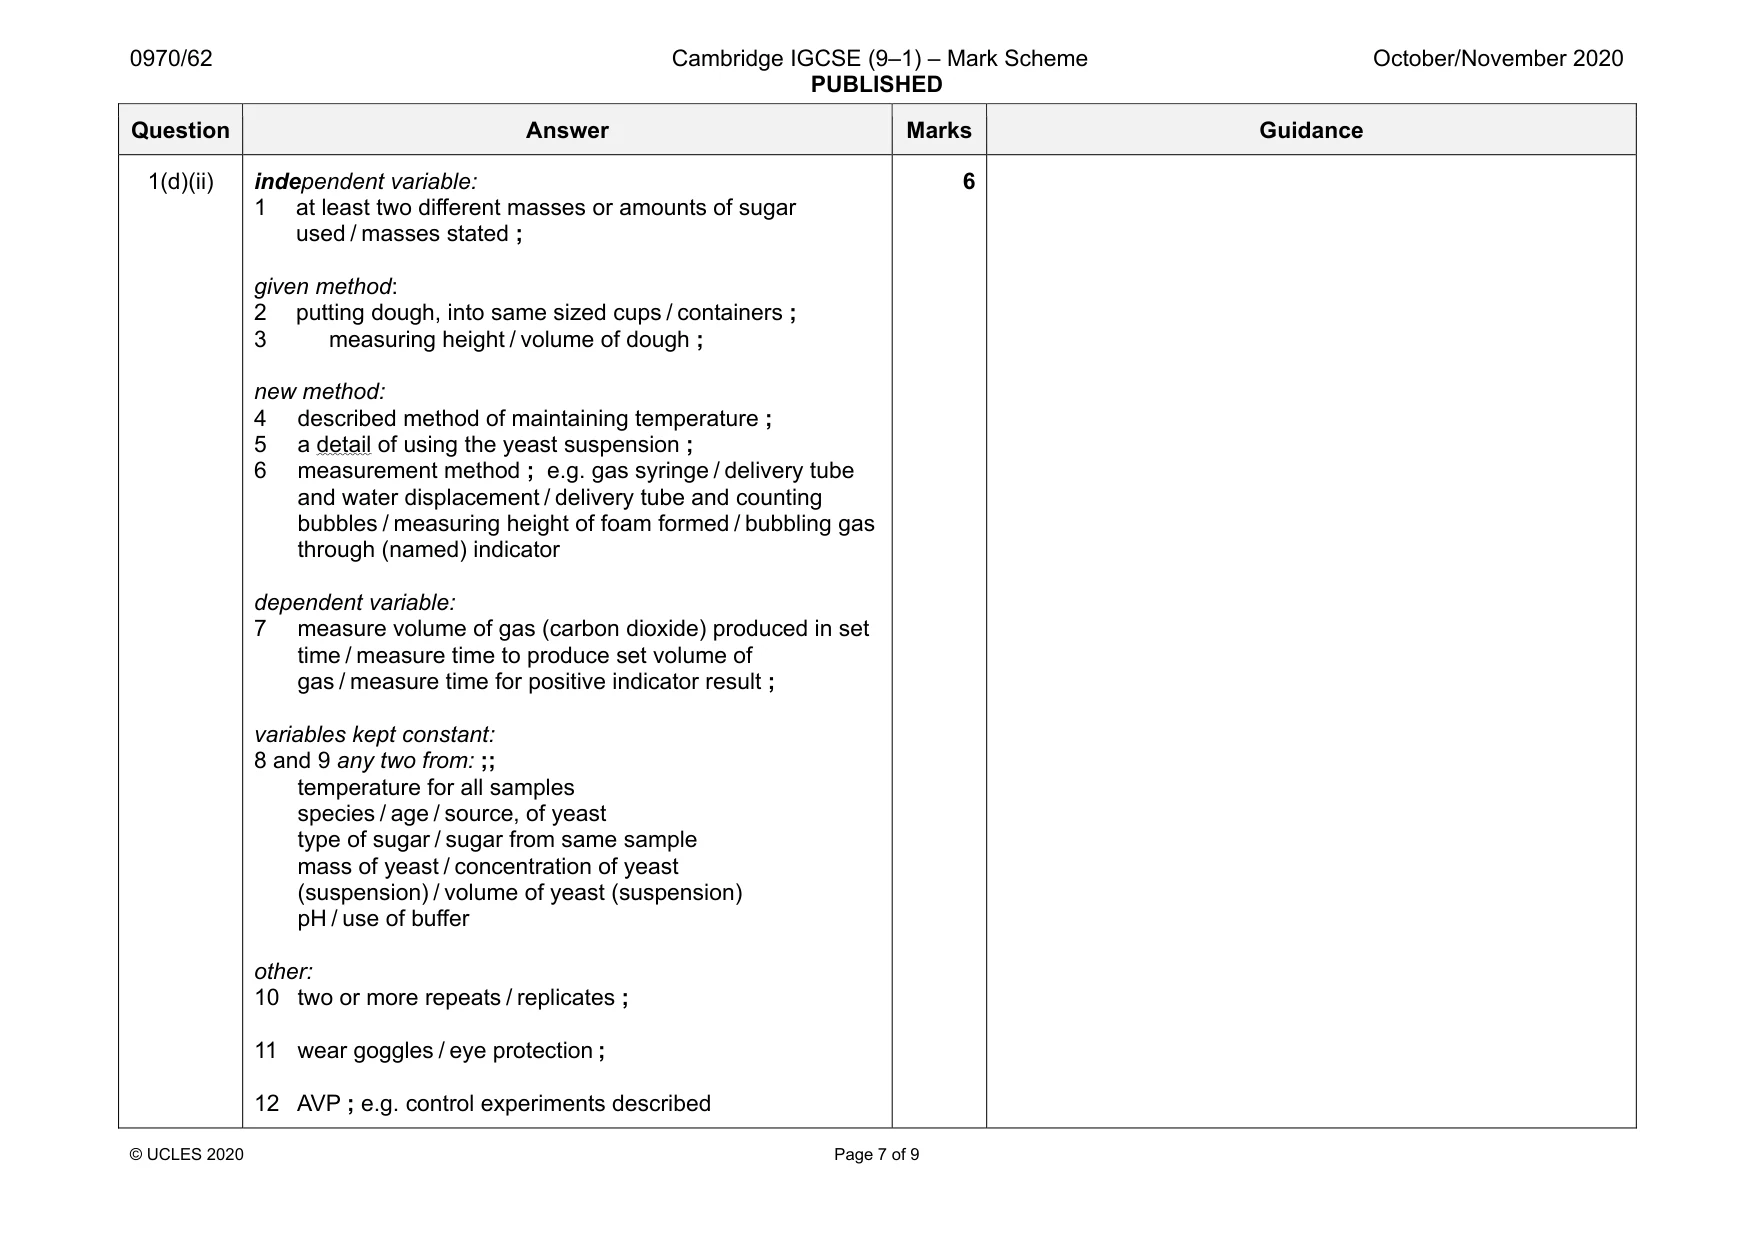
Mark scheme: 1(a)(i) table with a line between headings and data and a minimum of two columns or rows ; correct headings for column / rows given ; record of four correct heights ± 1 mm ; a horizontal or vertical line draw on at least two cups on Fig. 1.1 indicating where measurements were taken ; cup start height / mm end height / mm cool 36 (35 – 37) 45 (44 – 46) warm 39 (38 – 40) 67 (66 – 68) 1(a)(ii) C = 9 mm / 0.9 cm W = 28 mm / 2.8 cm 1 ecf for incorrect initial measurements 1(a)(iii) at high(er) temperatures, the dough rises more / more carbon dioxide is produced / AW / ora 1 ecf from candidate’s data 1(a)(iv) temperature ; 1 1(a)(v) (maximum) height (of dough) / distance from bottom of cup to top of dough ; 1 Question Answer Marks Guidance 1(b)(i) error the dough was not accurately divided into two / AW ; improvement measure the mass / use the same mass / use a balance / AW (to ensure both dough sections have equal mass) ; 2 1(b)(ii) idea of the height of the dough at the beginning was not identical in both cups ; 1 1(c) add iodine (solution / reagent) ; blue-black (colour) ; 2 1(d)(i) hydrogencarbonate (indicator) ; yellow / orange (colour) ; or limewater ; cloudy / white / milky / chalky ; 2 Question Answer Marks Guidance 1(d)(ii) independent variable: 1 at least two different masses or amounts of sugar used / masses stated ; given method: 2 putting dough, into same sized cups / containers ; 3 measuring height / volume of dough ; new method: 4 described method of maintaining temperature ; 5 a detail of using the yeast suspension ; 6 measurement method ; e.g. gas syringe / delivery tube and water displacement / delivery tube and counting bubbles / measuring height of foam formed / bubbling gas through (named) indicator dependent variable: 7 measure volume of gas (carbon dioxide) produced in set time / measure time to produce set volume of gas / measure time for positive indicator result ; variables kept constant: 8 and 9 any two from: ;; temperature for all samples species / age / source, of yeast type of sugar / sugar from same sample mass of yeast / concentration of yeast (suspension) / volume of yeast (suspension) pH / use of buffer other: 10 two or more repeats / replicates ; 11 wear goggles / eye protection ; 12 AVP ; e.g. control experiments described 6
Q2 · A photomicrograph showing several cells from an Elodea sp
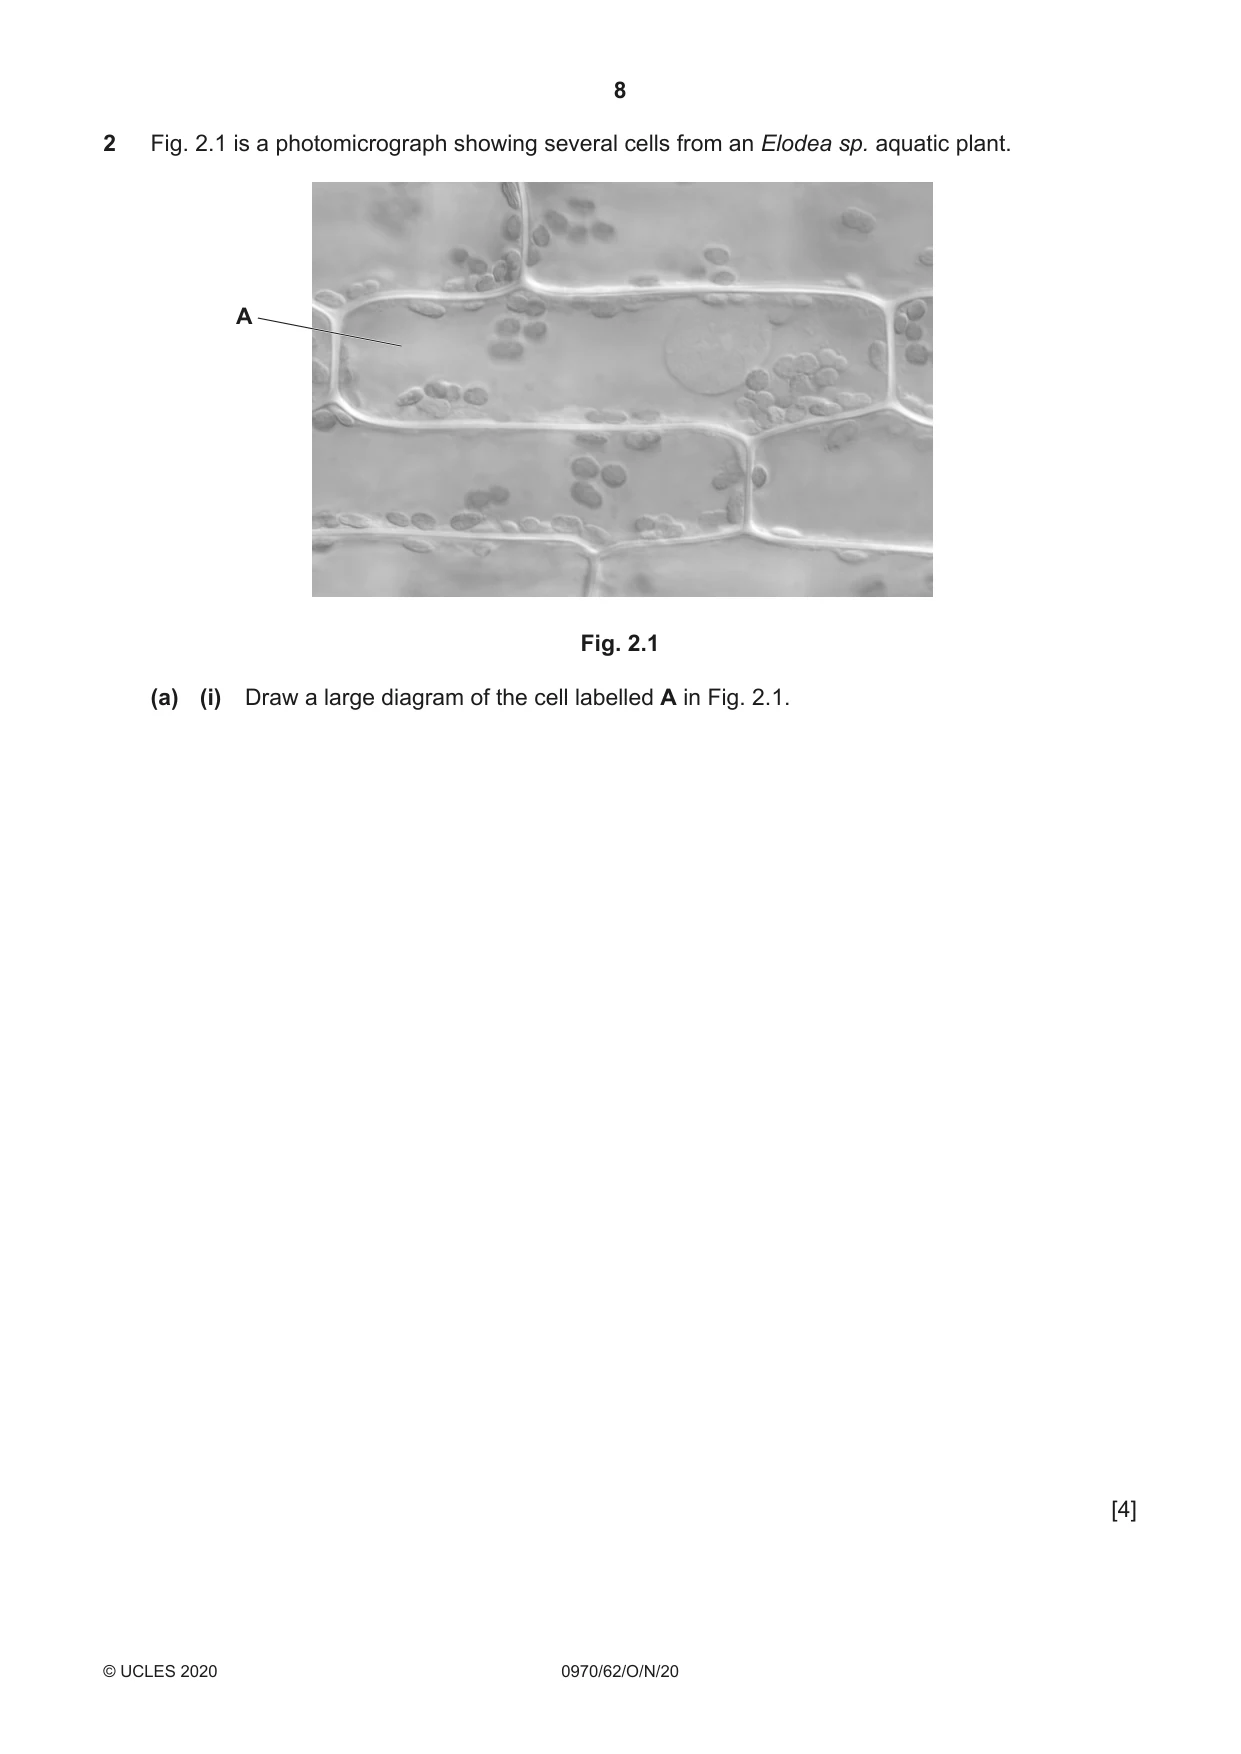
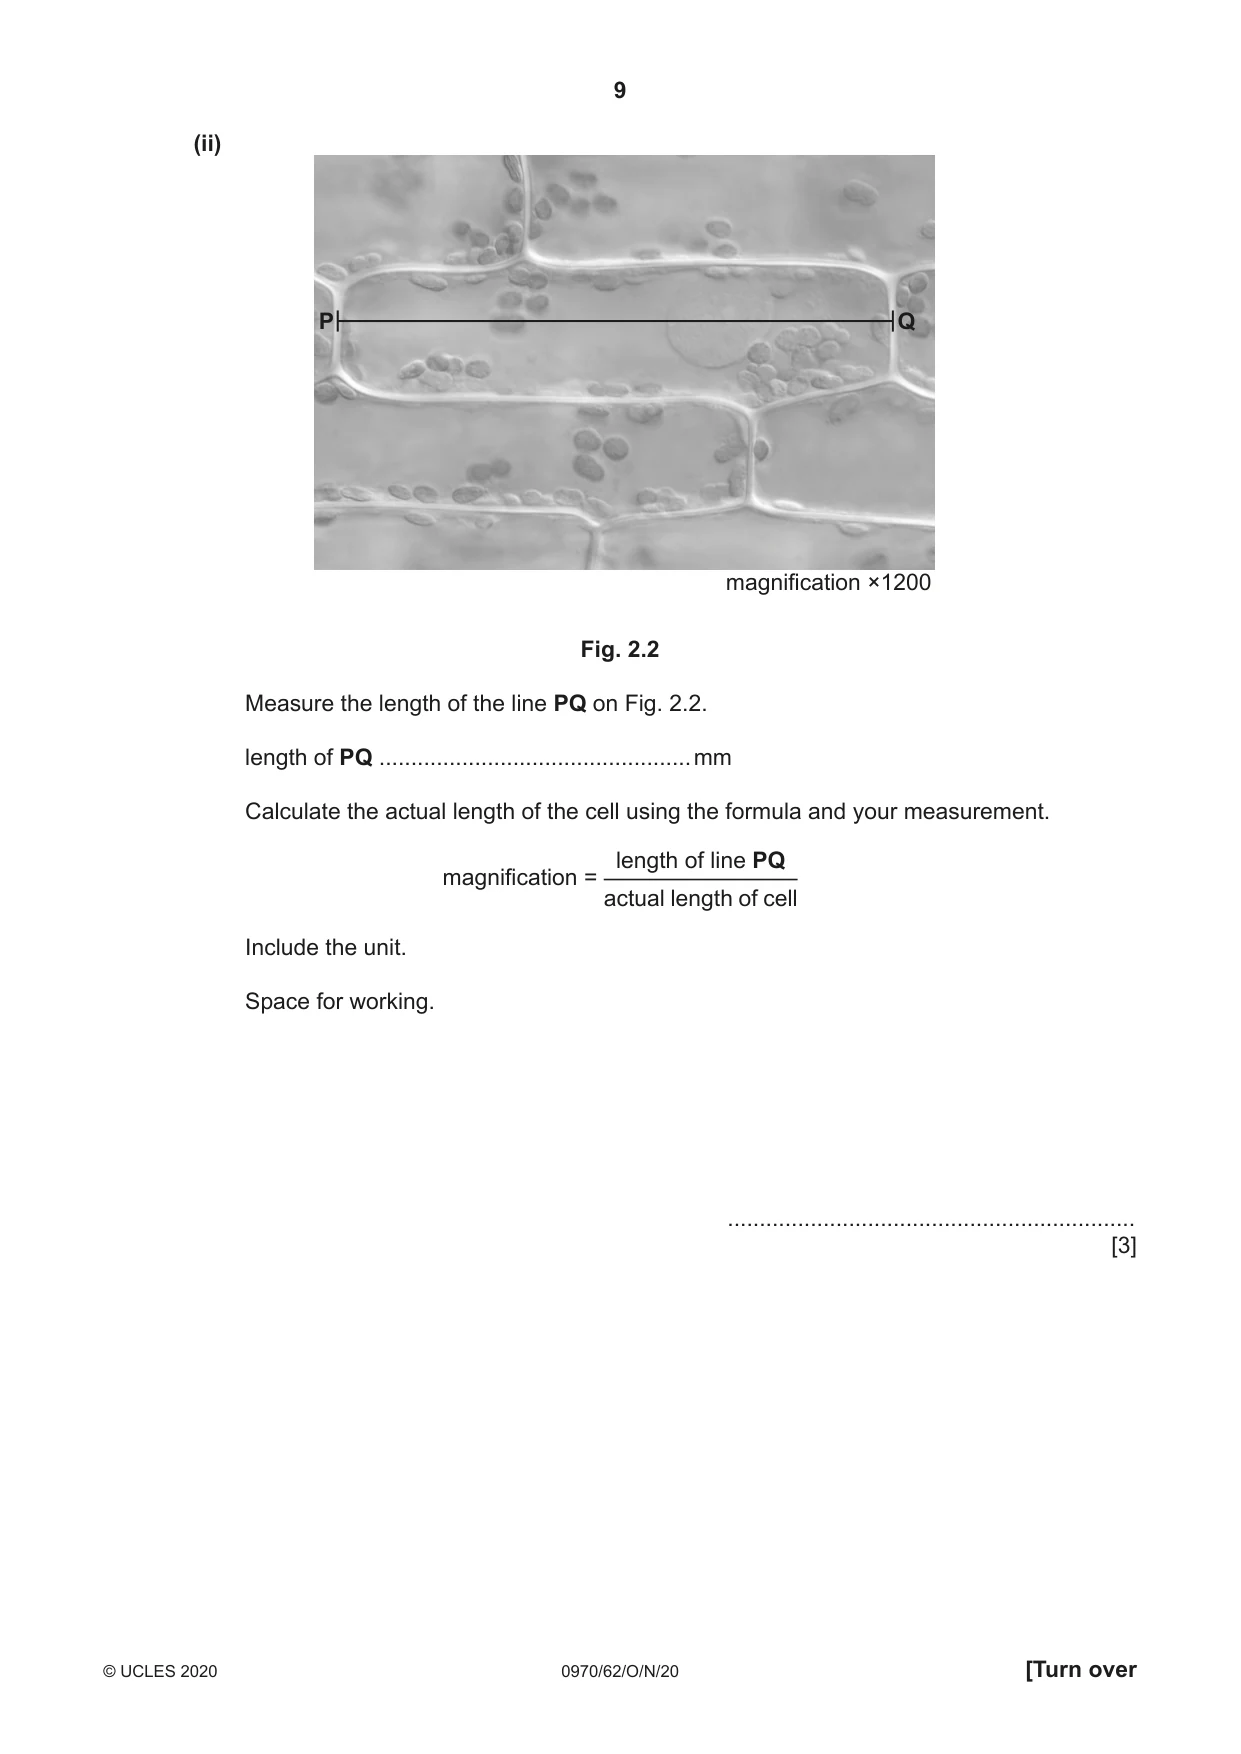
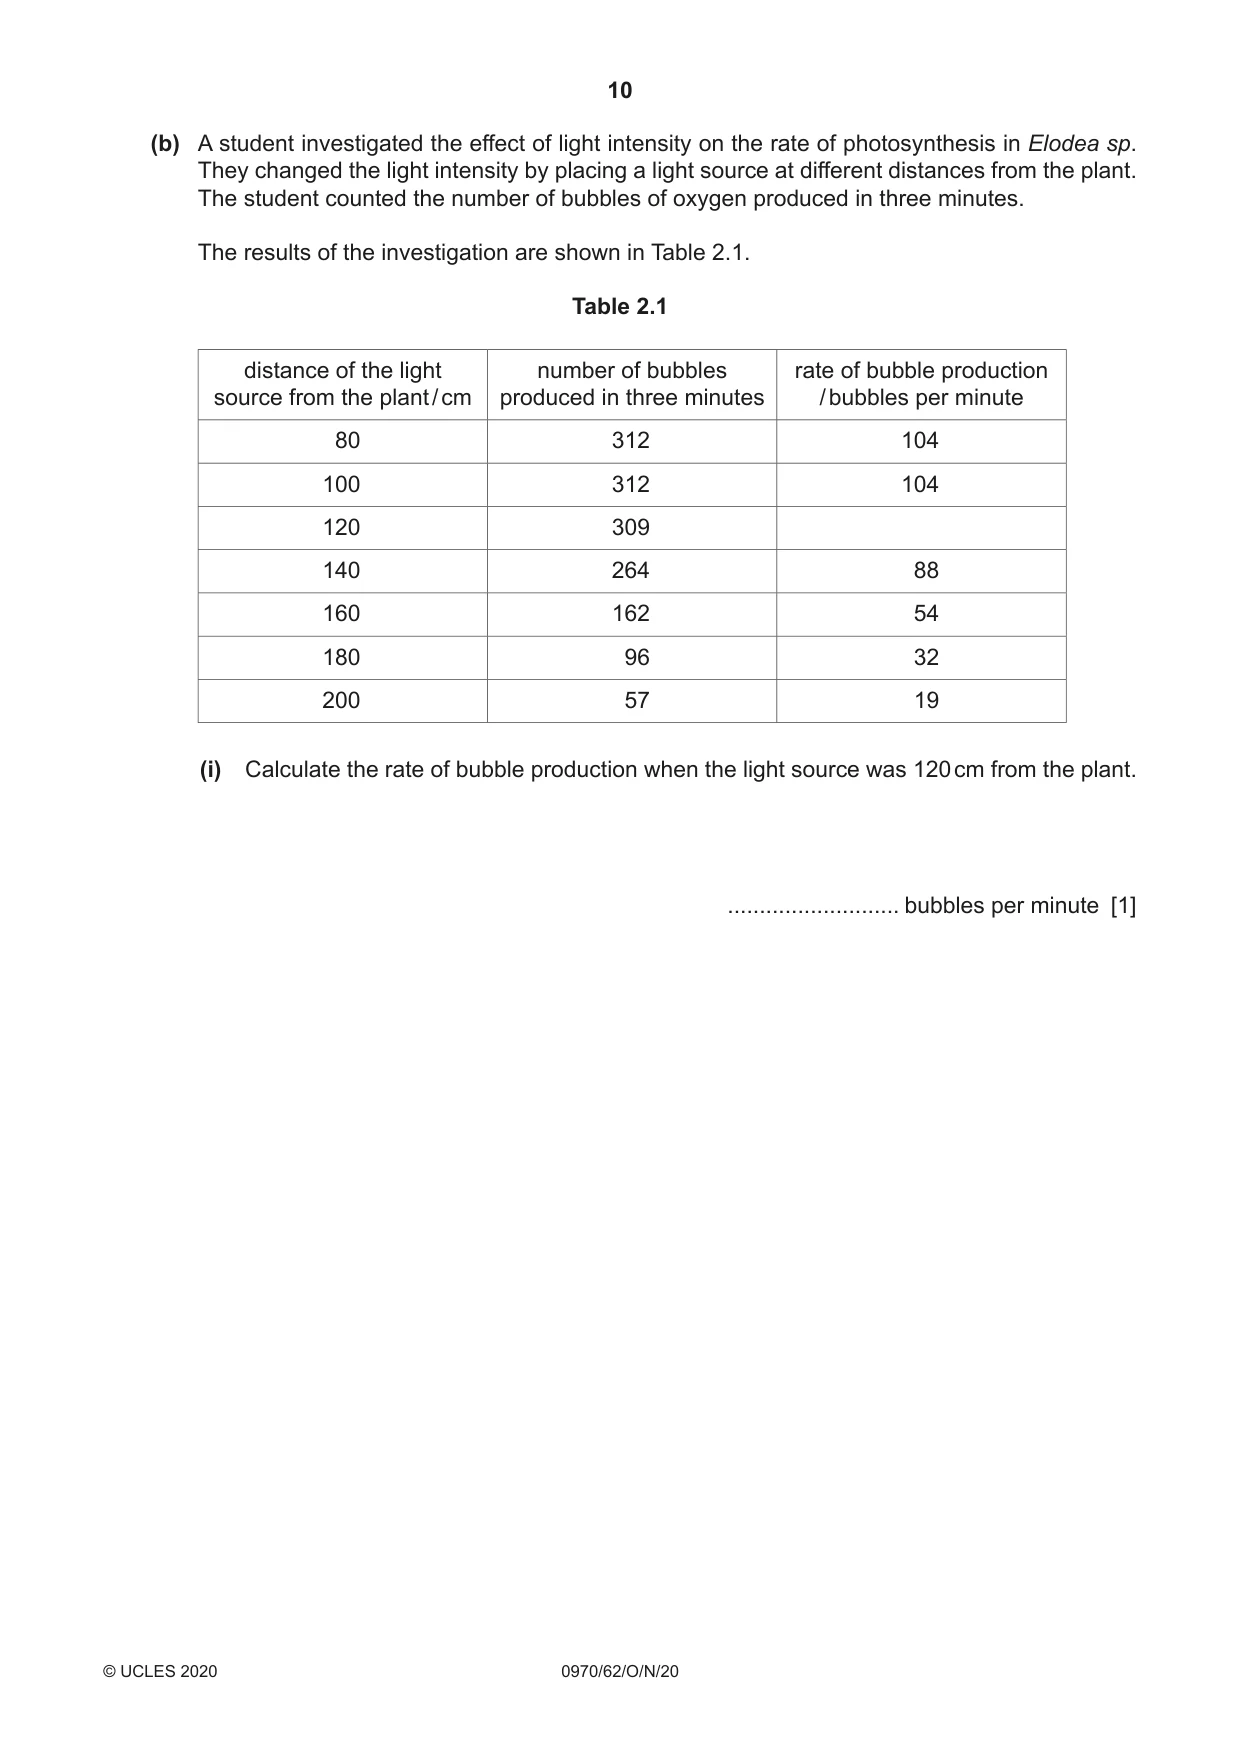
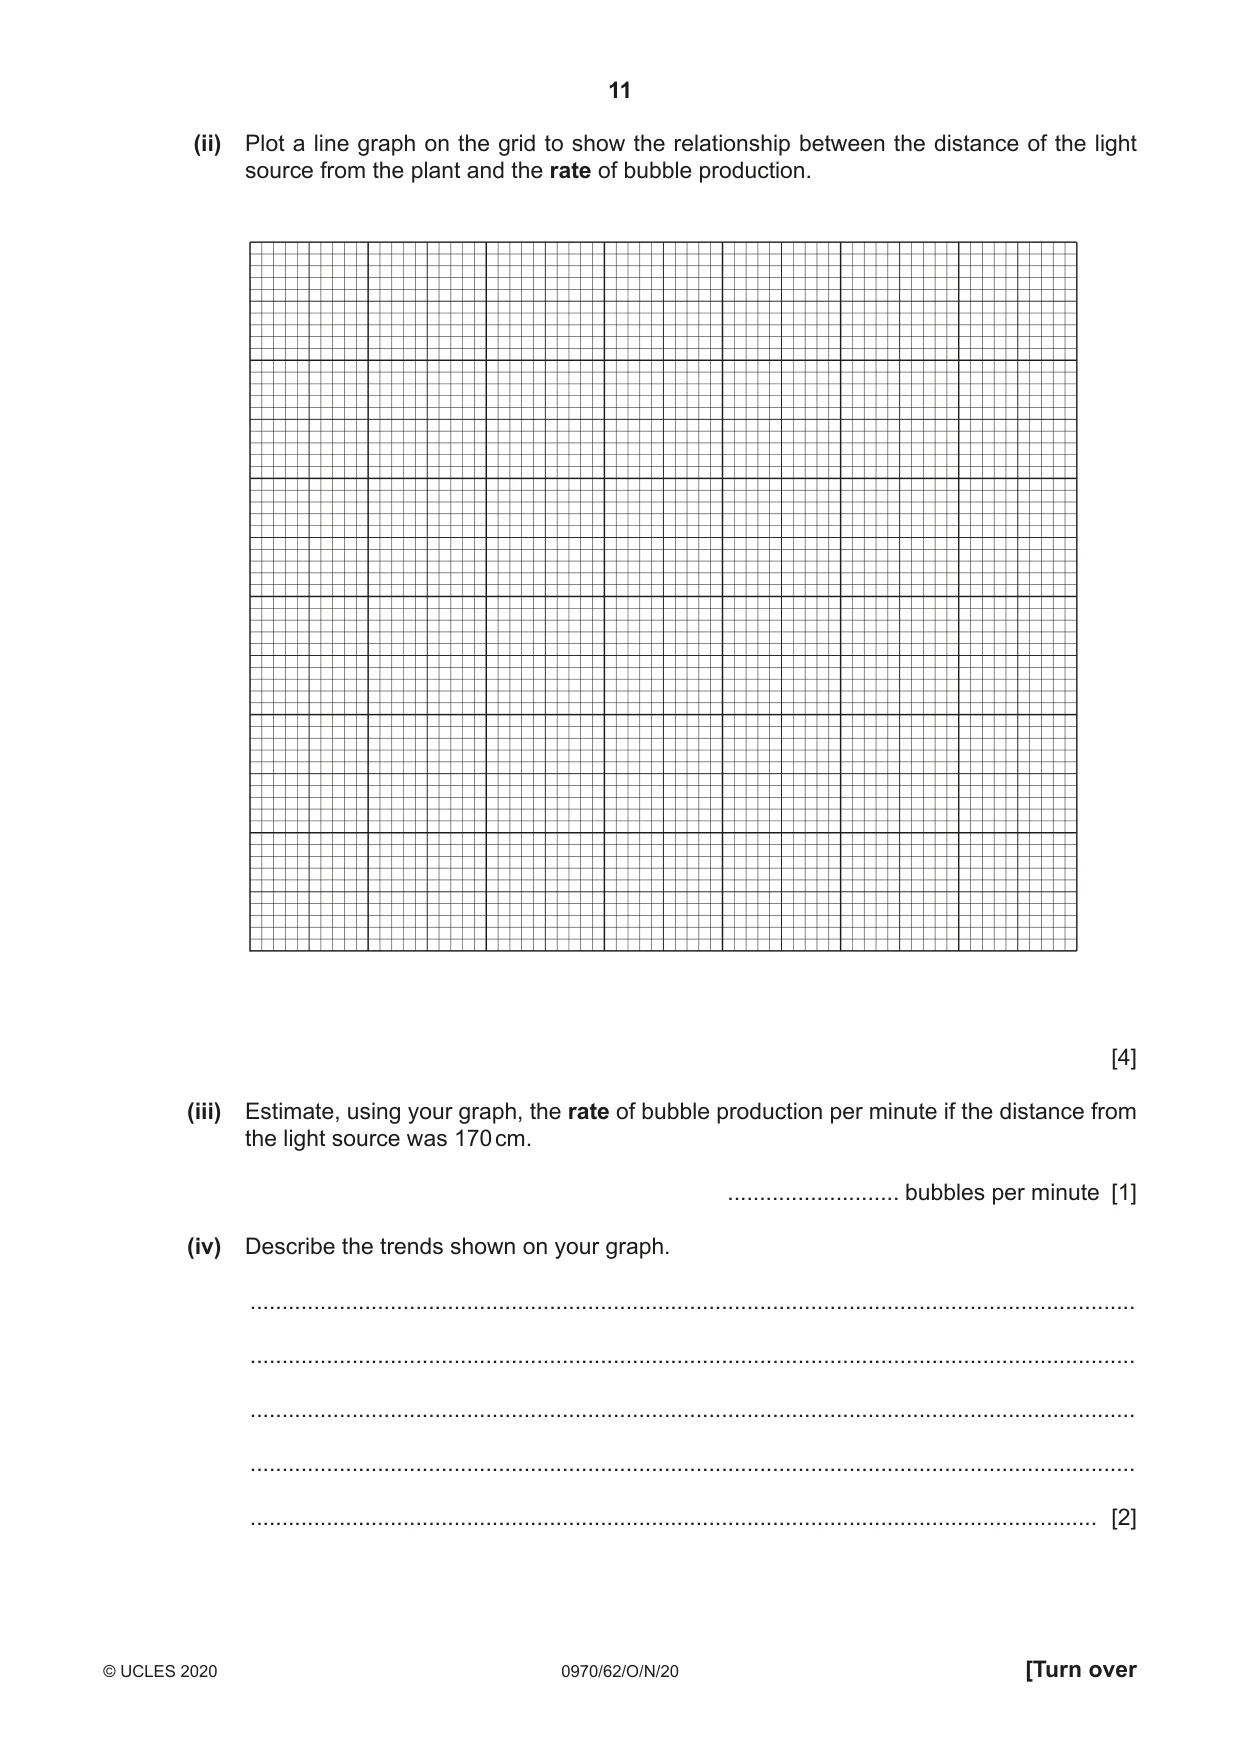
2 Fig. 2.1 is a photomicrograph showing several cells from an Elodea sp. aquatic plant. A Fig. 2.1 (a) (i) Draw a large diagram of the cell labelled A in Fig. 2.1. [4] (ii) P Q magnification ×1200 Fig. 2.2 Measure the length of the line PQ on Fig. 2.2. length of PQ ................................................. mm Calculate the actual length of the cell using the formula and your measurement. length of line PQ magnification = actual length of cell Include the unit. Space for working. ................................................................ [3] (b) A student investigated the effect of light intensity on the rate of photosynthesis in Elodea sp. They changed the light intensity by placing a light source at different distances from the plant. The student counted the number of bubbles of oxygen produced in three minutes. The results of the investigation are shown in Table 2.1. Table 2.1 distance of the light number of bubbles rate of bubble production source from the plant / cm produced in three minutes / bubbles per minute 80 312 104 100 312 104 120 309 140 264 88 160 162 54 180 96 32 200 57 19 (i) Calculate the rate of bubble production when the light source was 120 cm from the plant. ........................... bubbles per minute [1]
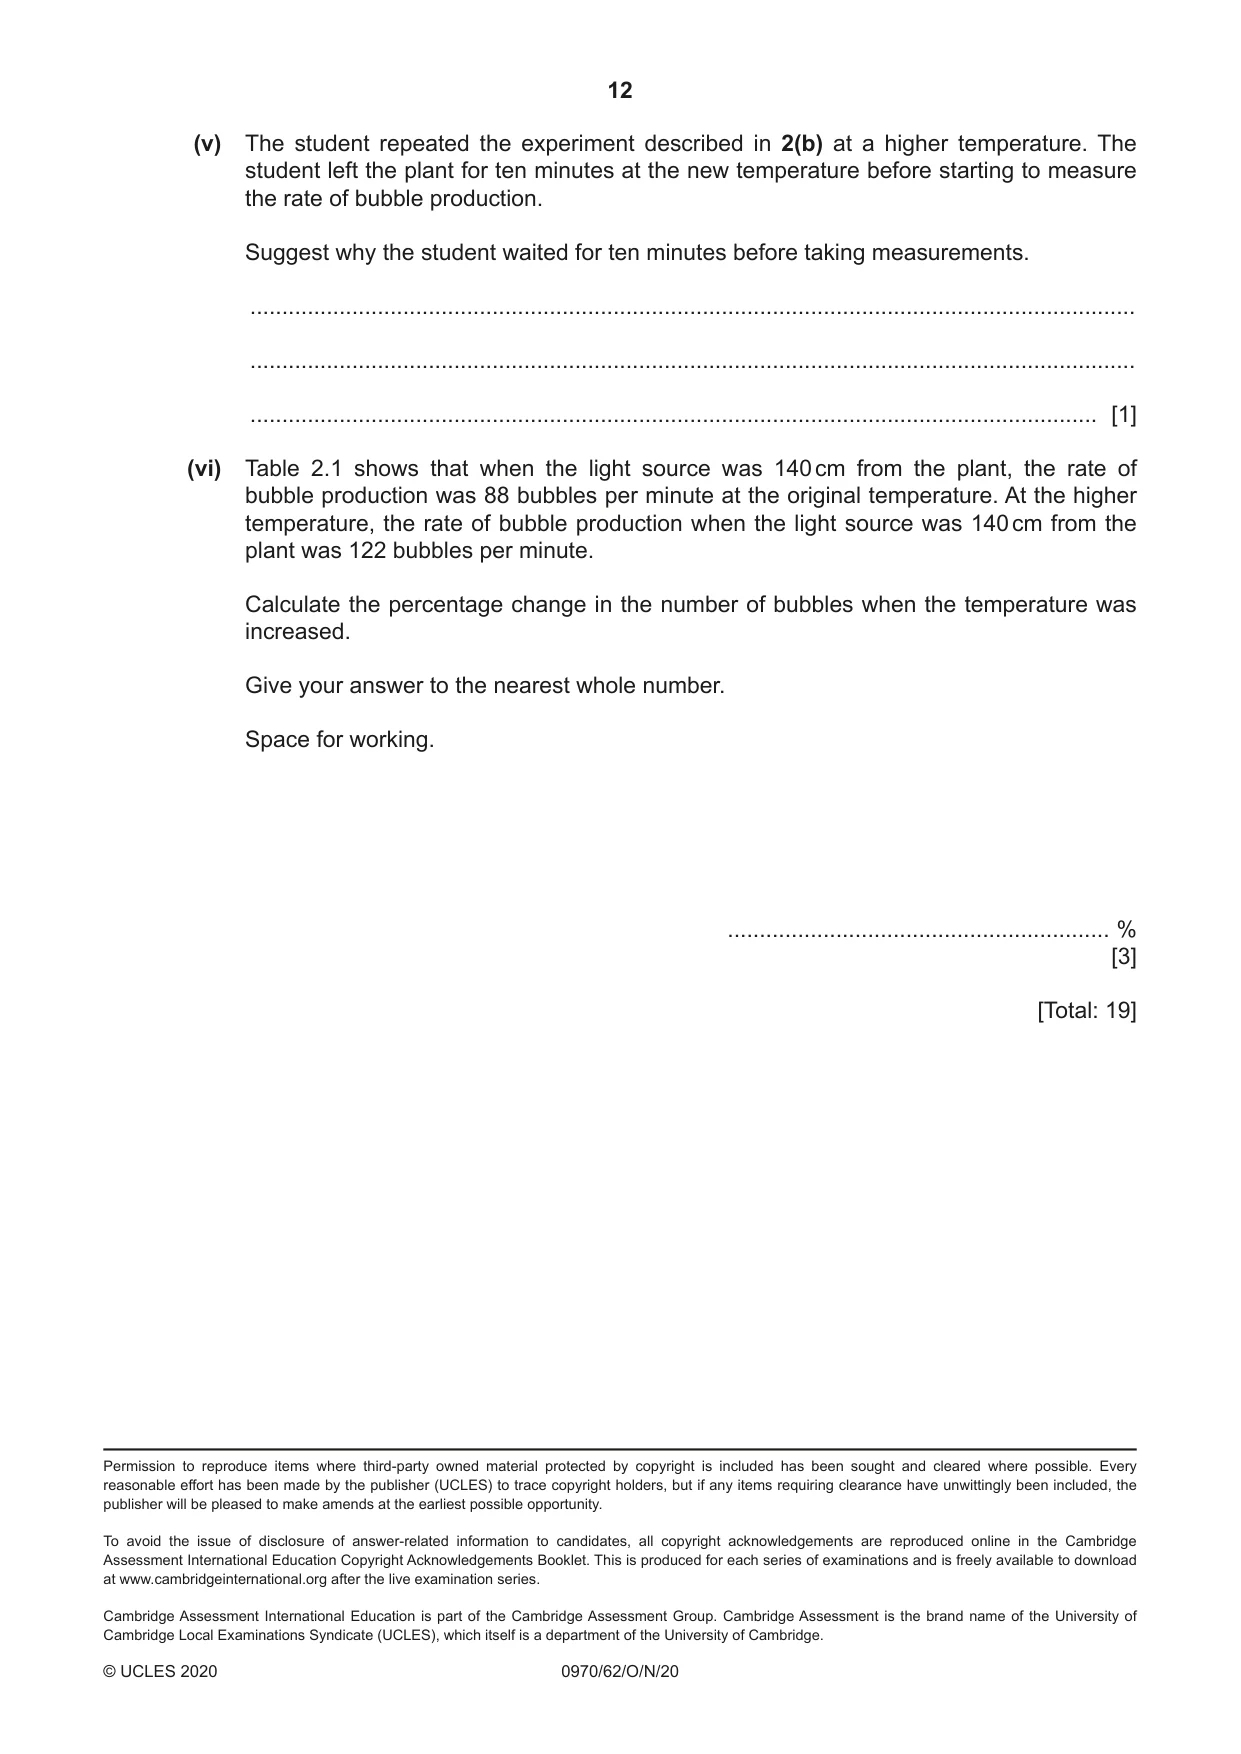
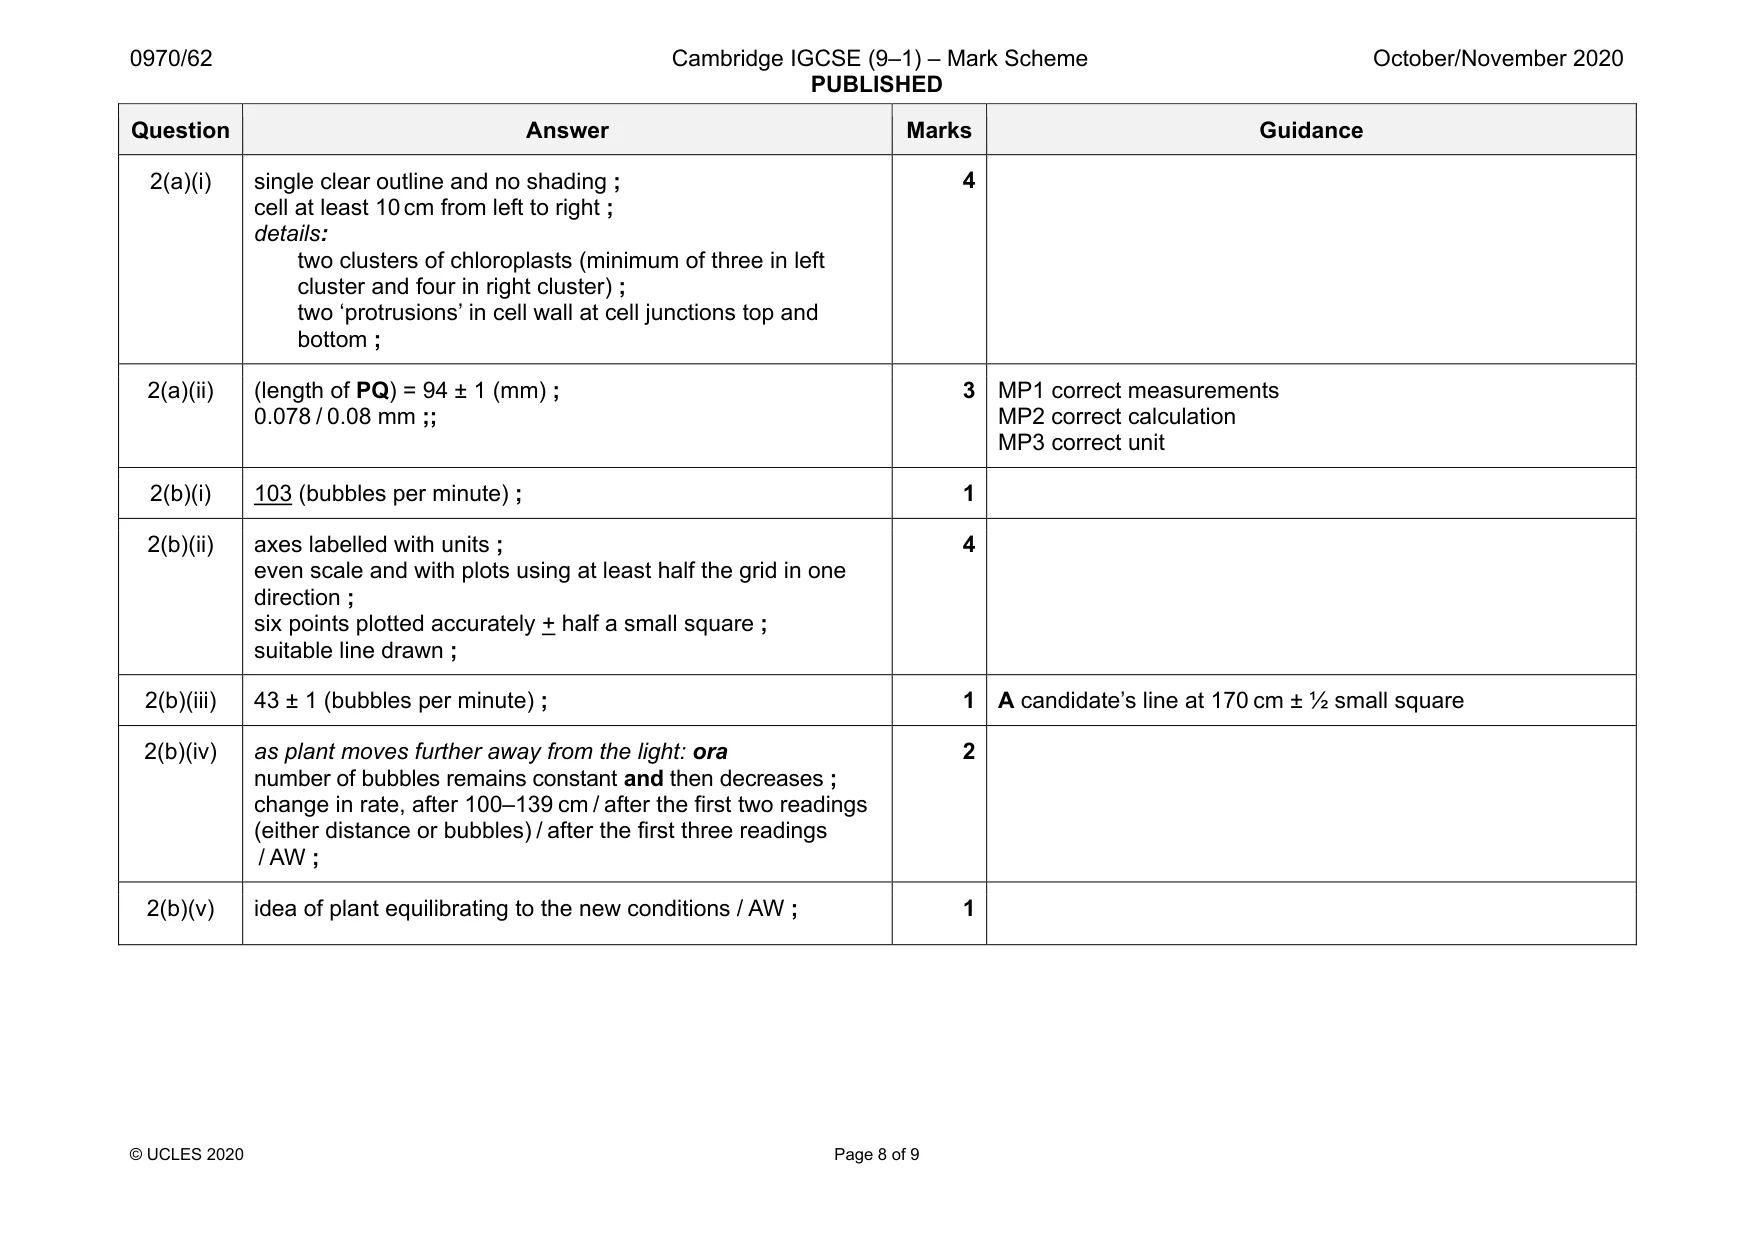
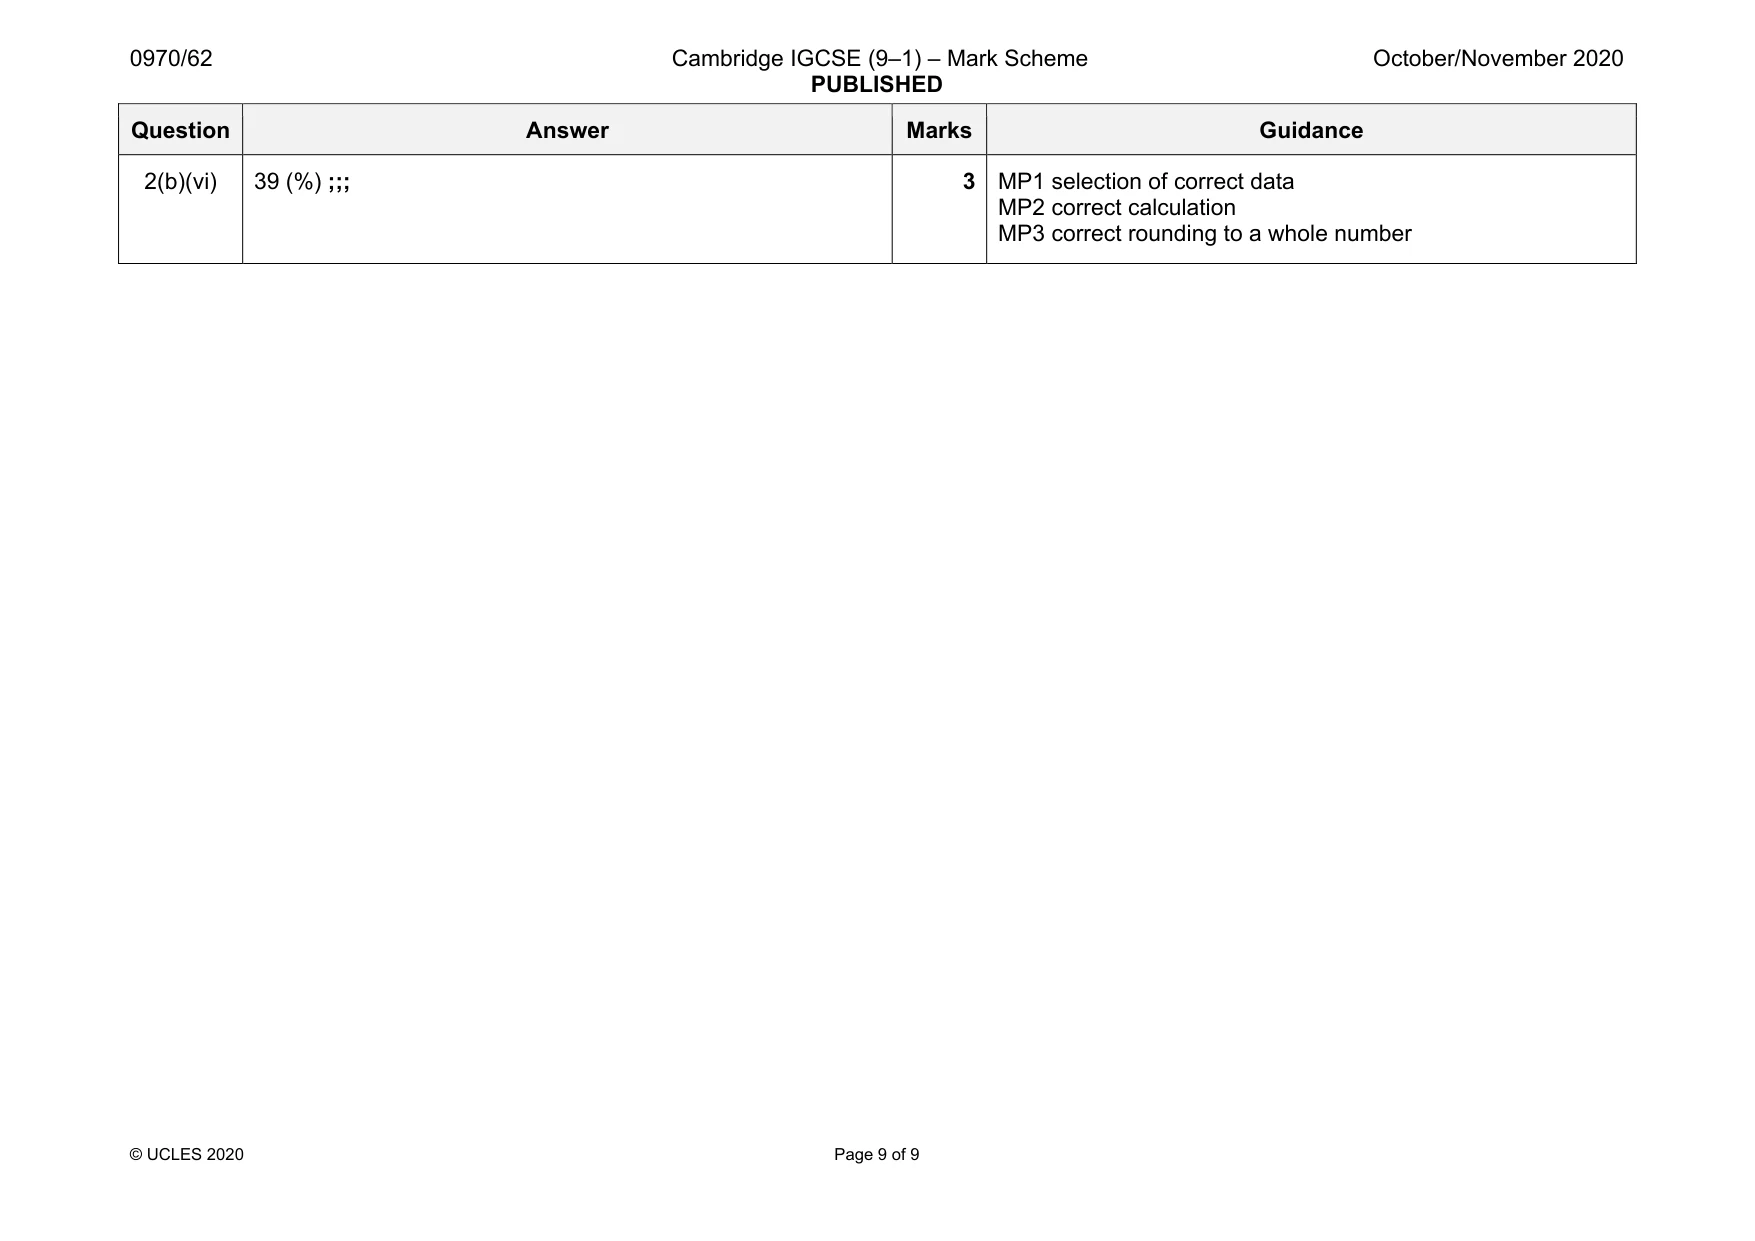
Mark scheme: 2(a)(i) single clear outline and no shading ; cell at least 10 cm from left to right ; details: two clusters of chloroplasts (minimum of three in left cluster and four in right cluster) ; two ‘protrusions’ in cell wall at cell junctions top and bottom ; 2(a)(ii) (length of PQ) = 94 ± 1 (mm) ; 0.078 / 0.08 mm ;; 3 MP1 correct measurements MP2 correct calculation MP3 correct unit 2(b)(i) 103 (bubbles per minute) ; 1 2(b)(ii) axes labelled with units ; even scale and with plots using at least half the grid in one direction ; six points plotted accurately + half a small square ; suitable line drawn ; 4 2(b)(iii) 43 ± 1 (bubbles per minute) ; 1 A candidate’s line at 170 cm ± ½ small square 2(b)(iv) as plant moves further away from the light: ora number of bubbles remains constant and then decreases ; change in rate, after 100–139 cm / after the first two readings (either distance or bubbles) / after the first three readings / AW ; 2 2(b)(v) idea of plant equilibrating to the new conditions / AW ; 1 Question Answer Marks Guidance 2(b)(vi) 39 (%) ;;; 3 MP1 selection of correct data MP2 correct calculation MP3 correct rounding to a whole number
What was in this paper
The subtopics covered by these 2 questions, and how many questions each got. Open one in a new tab to see every Cambridge question on it.
What you needed in this session
Cambridge’s own grade thresholds for 2020 Oct/Nov, Paper 6 · Variant 2. A higher threshold means an easier paper — the bar moves with how the cohort did.