Cambridge IGCSE Biology (9-1) 0970 — 2020 May/June Paper 6 · Variant 2
0970/62/M/J/20 · 2 questions · 28 marks · ≈32 min
The question paper and its mark scheme, free to read here and free to download. This is Cambridge’s own paper, exactly as it was sat.
Question paper12 pages
Mark scheme9 pages
Answers below. Sit the paper first if you are practising.
Questions as text
Q1 · A student investigated the effect of temperature on diffusion
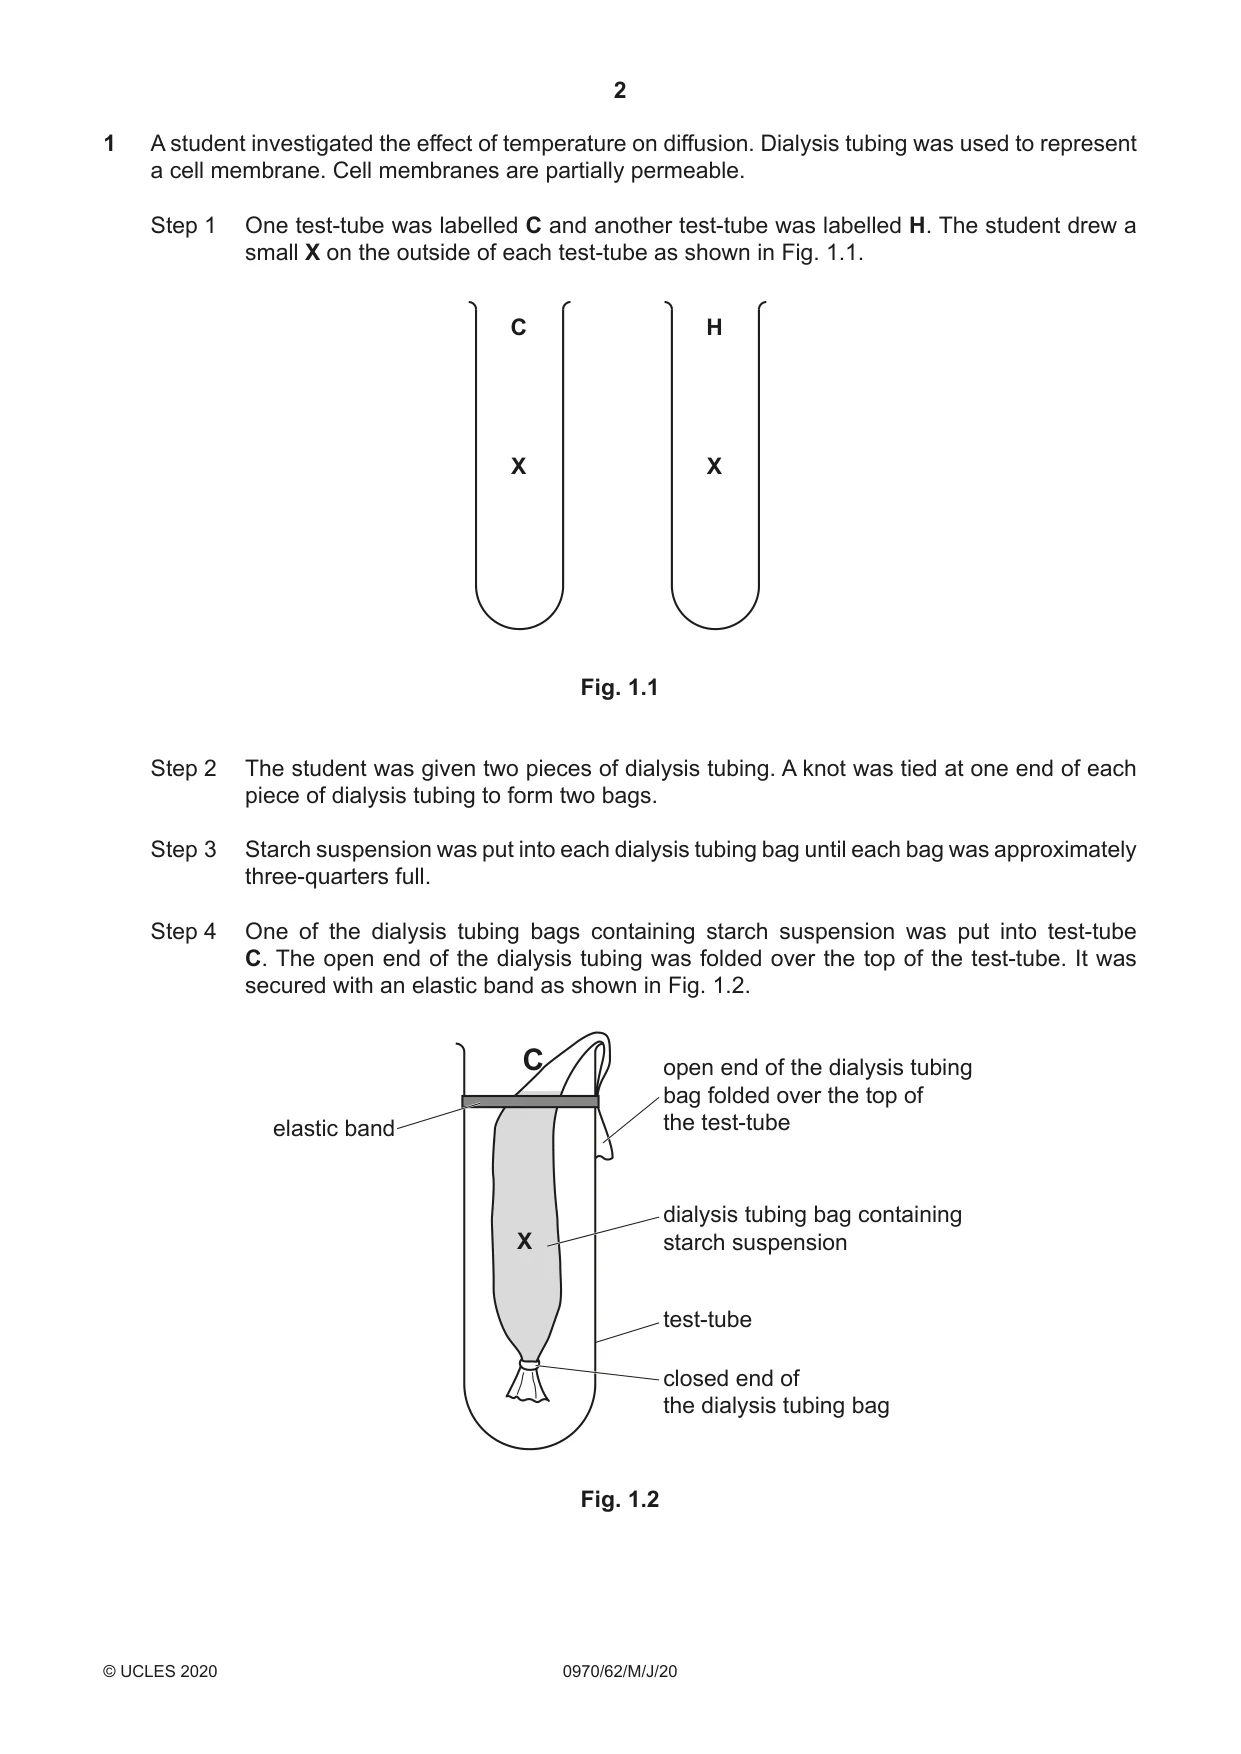
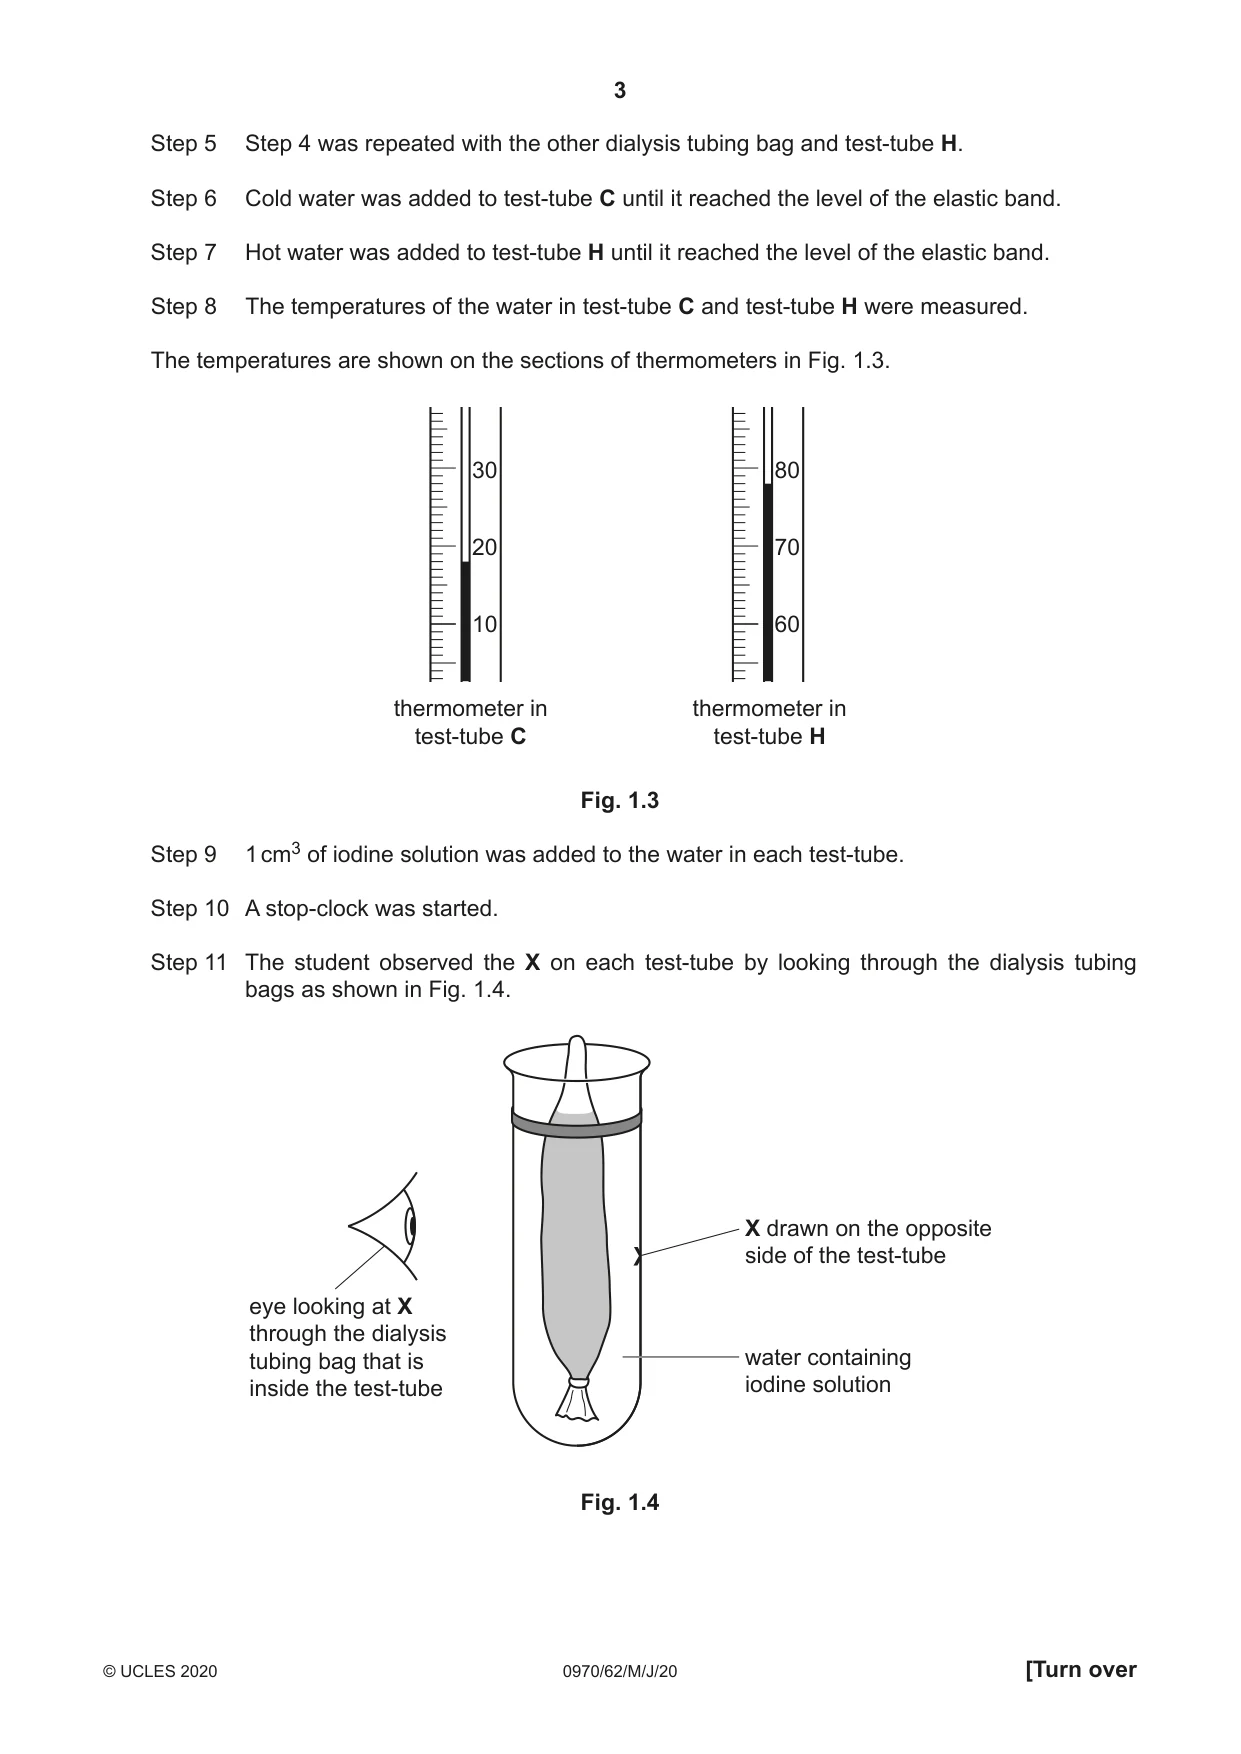
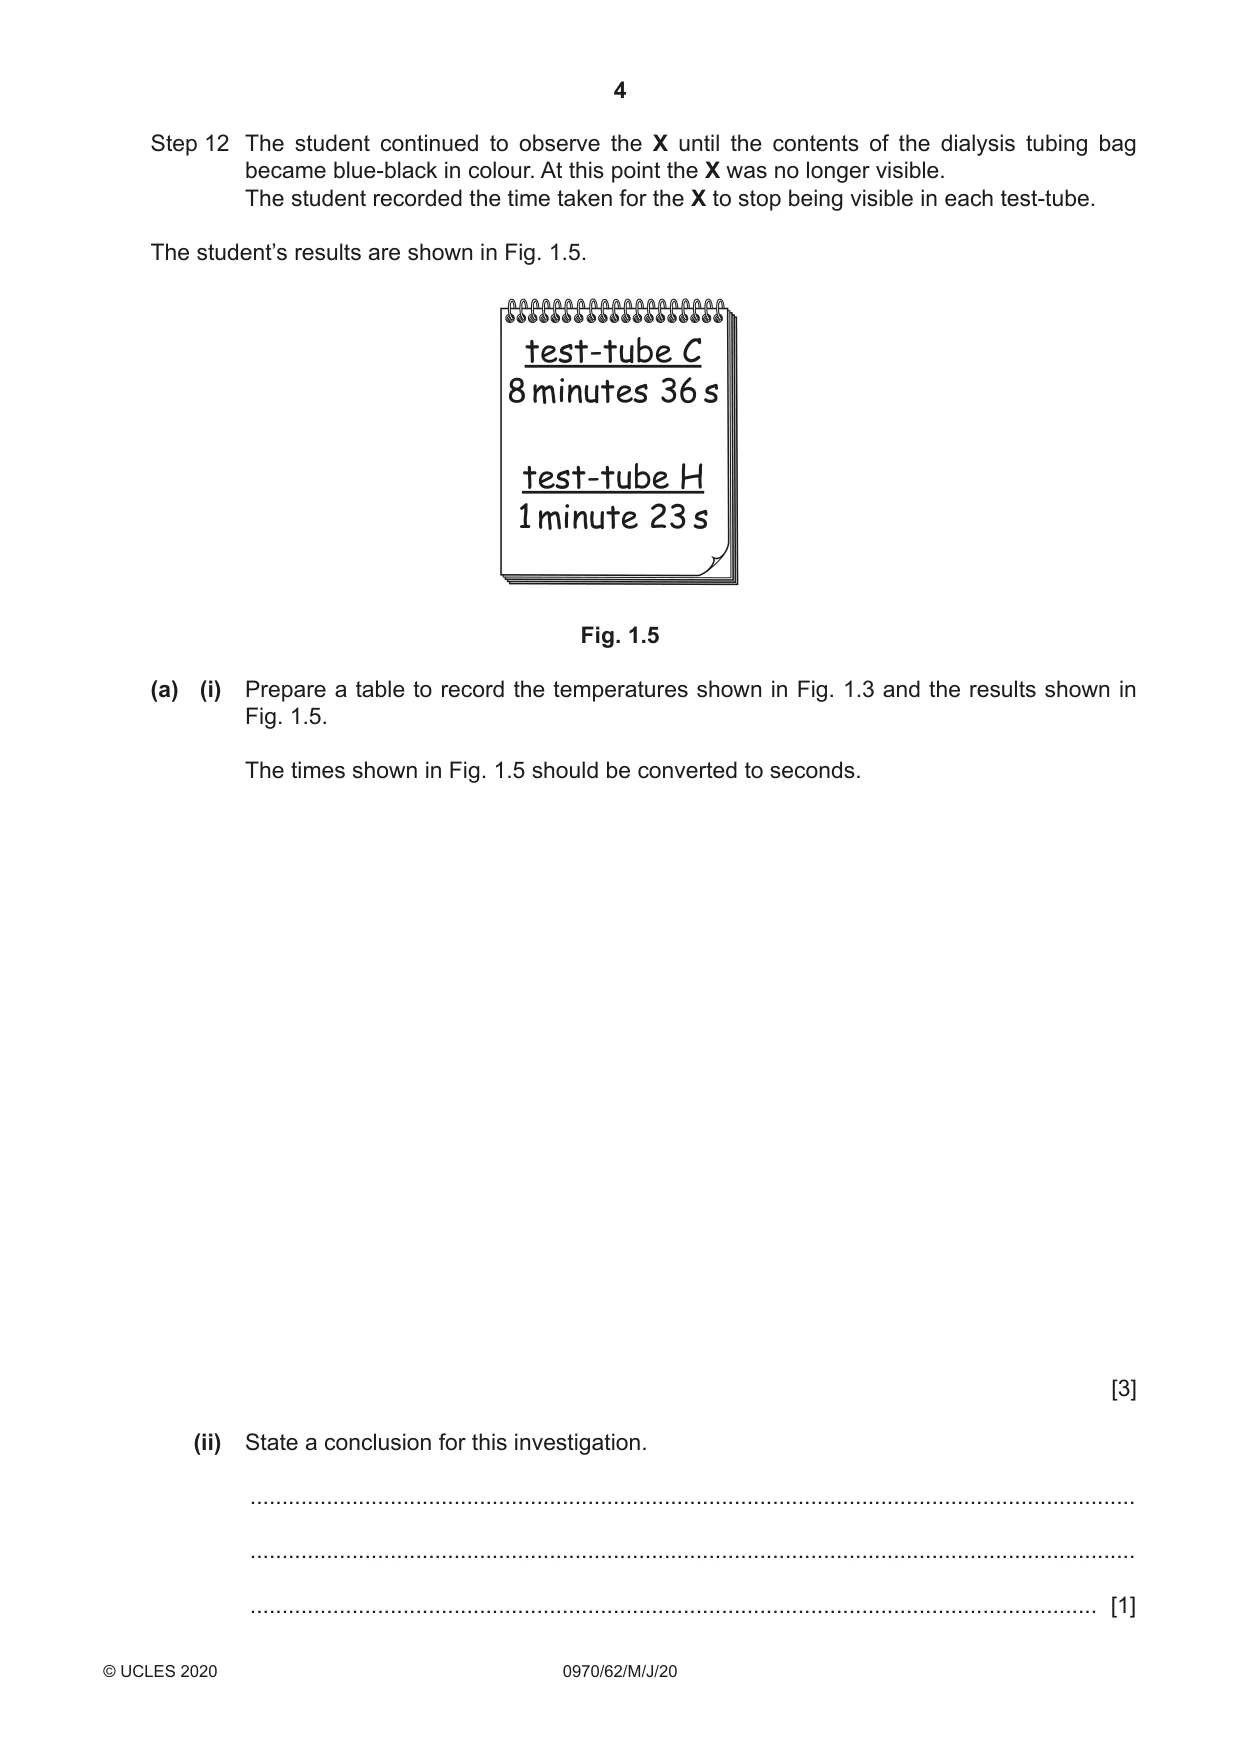
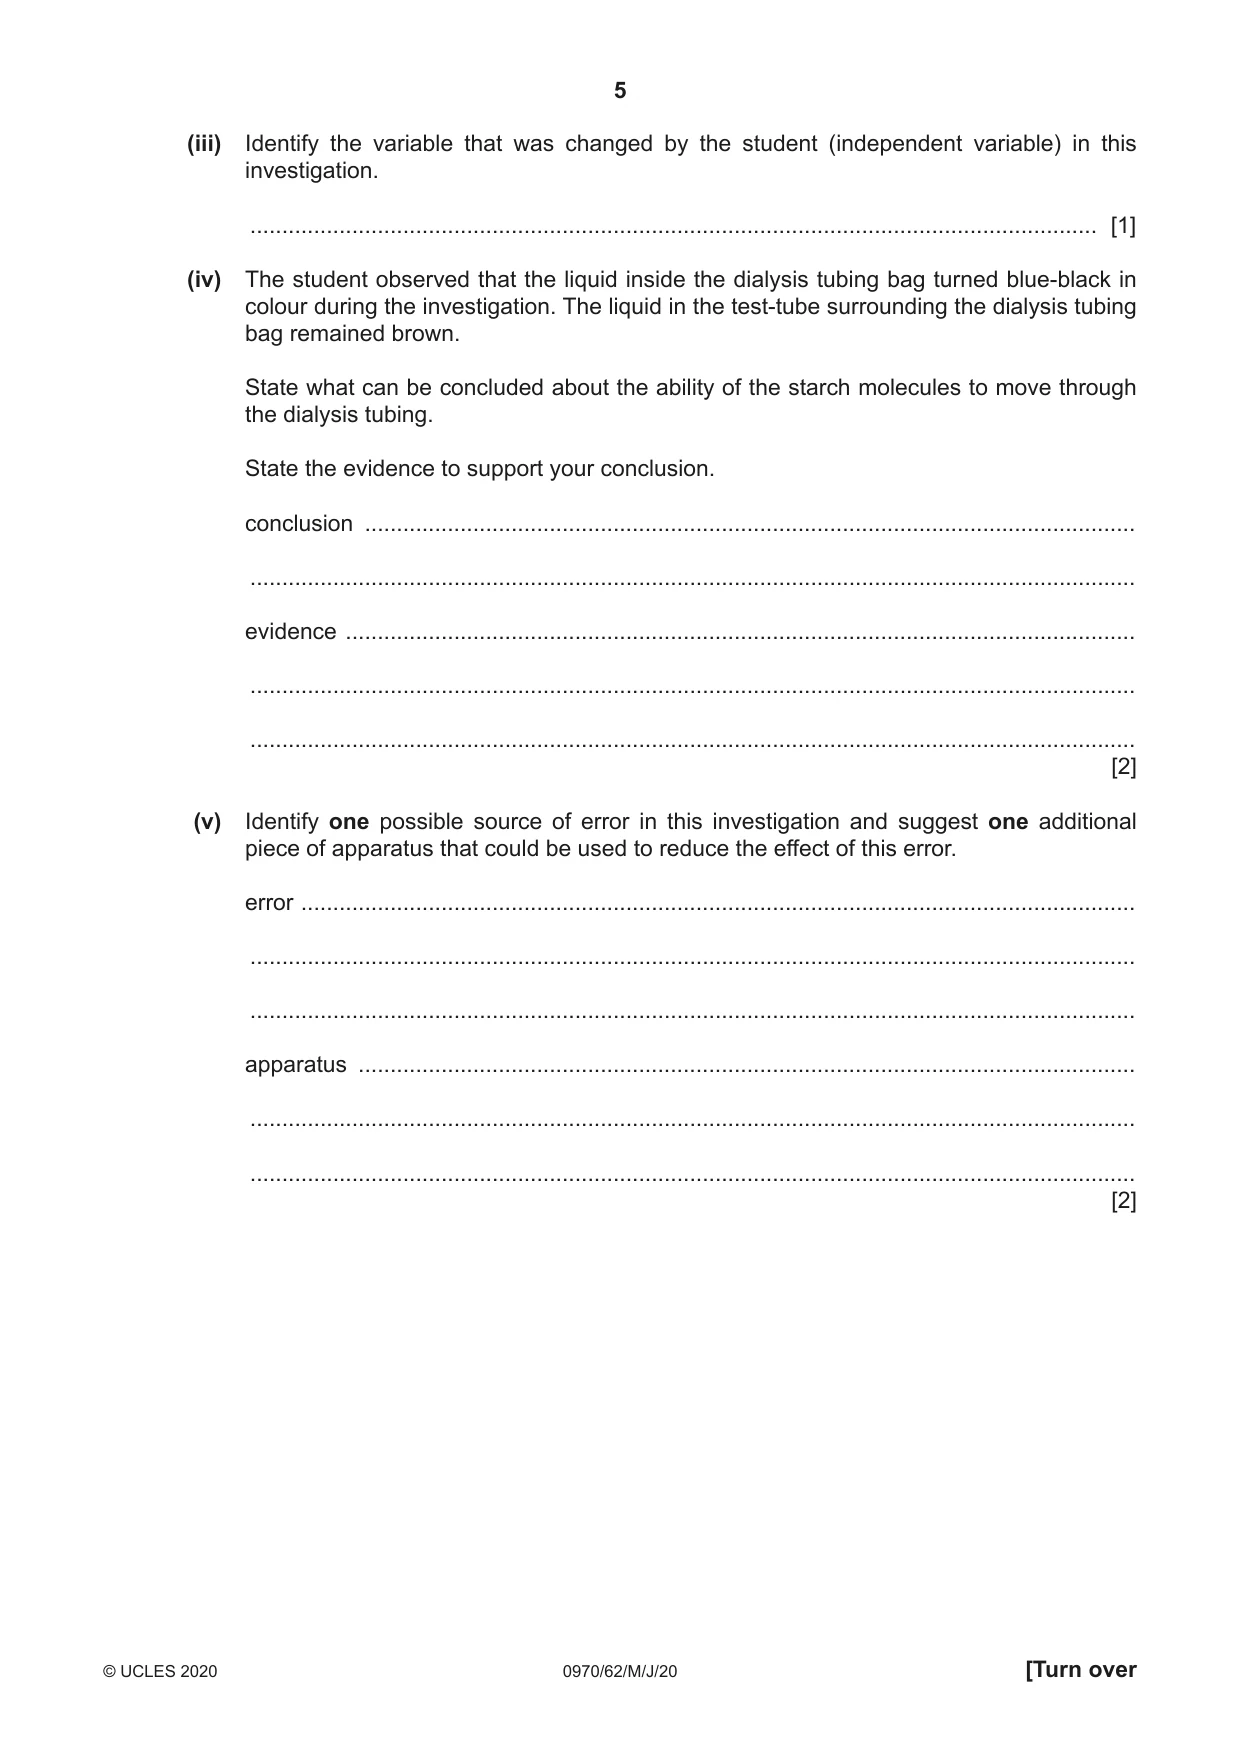
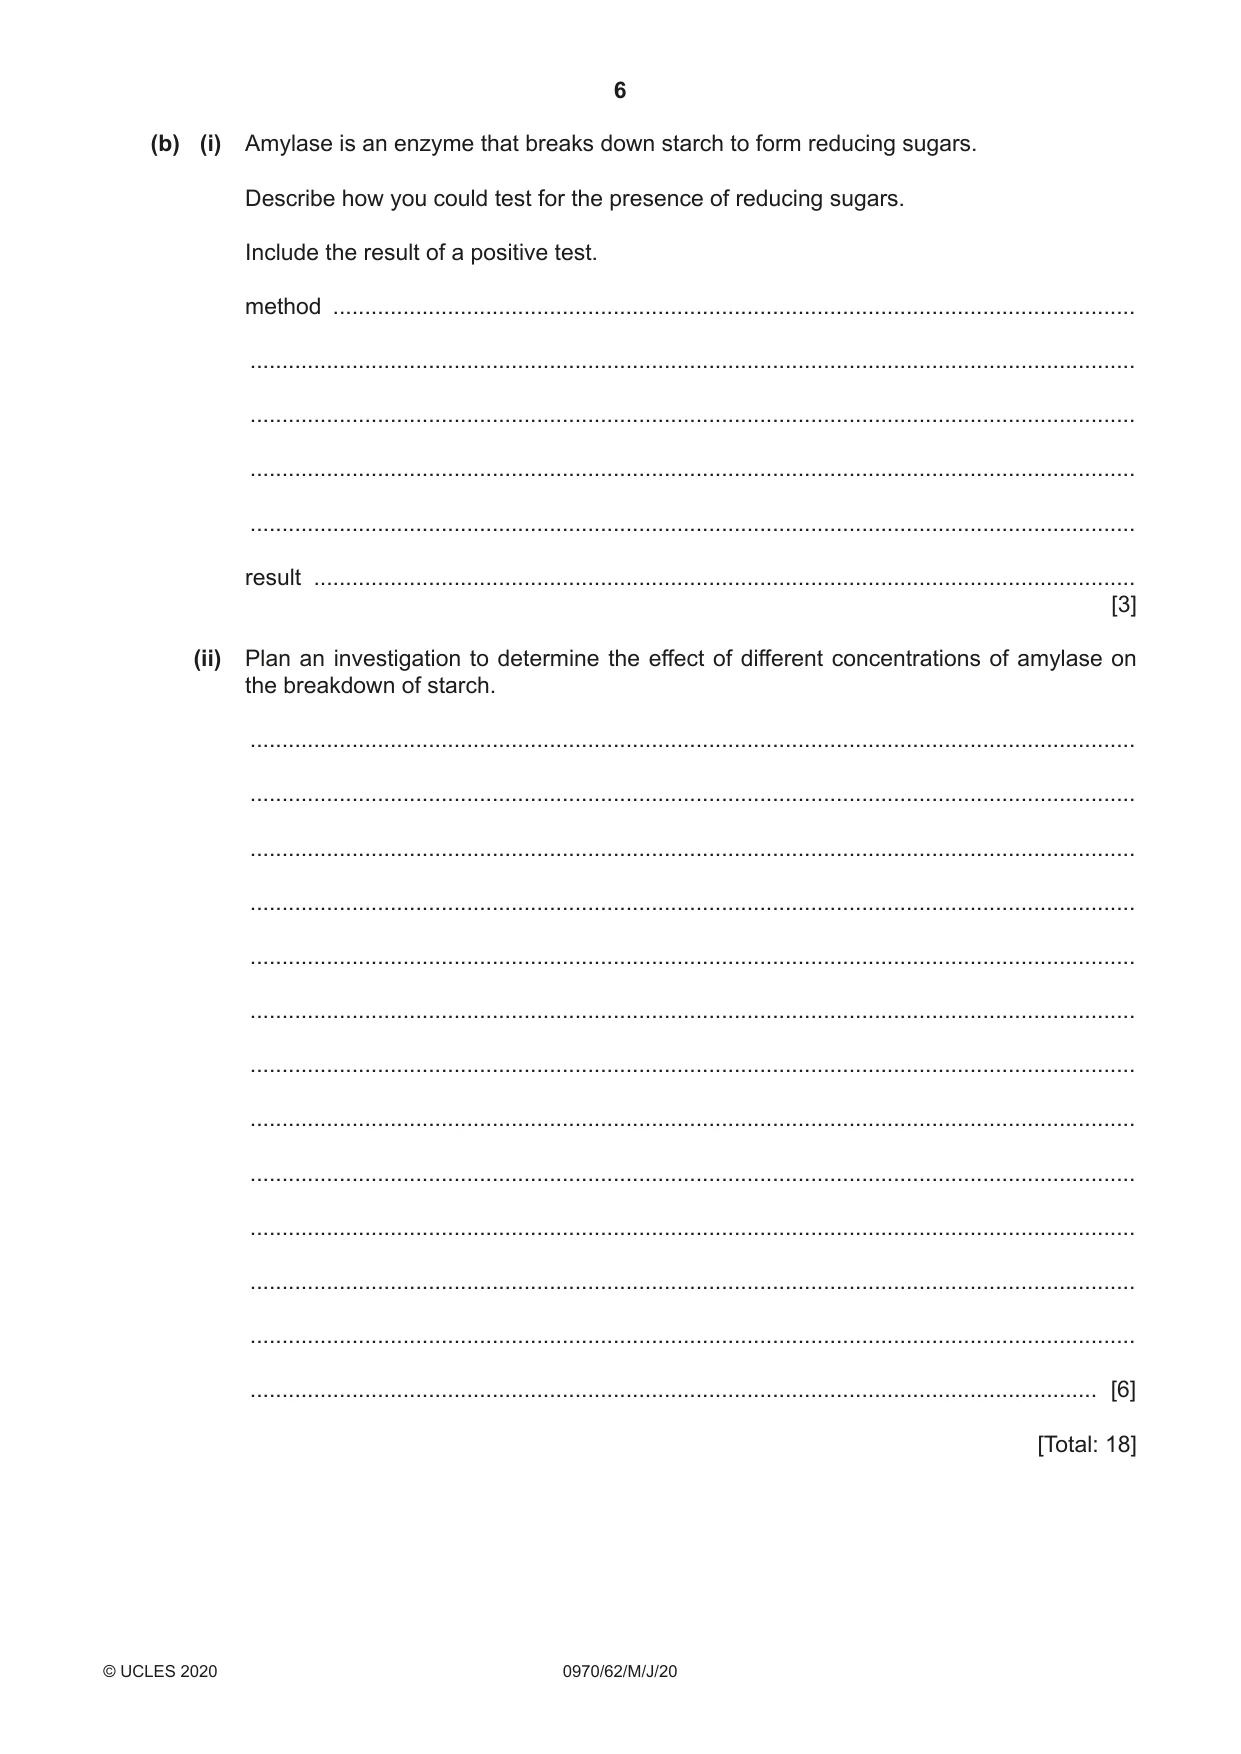
1 A student investigated the effect of temperature on diffusion. Dialysis tubing was used to represent a cell membrane. Cell membranes are partially permeable. Step 1 One test-tube was labelled C and another test-tube was labelled H. The student drew a small X on the outside of each test-tube as shown in Fig. 1.1. C H X X Fig. 1.1 Step 2 The student was given two pieces of dialysis tubing. A knot was tied at one end of each piece of dialysis tubing to form two bags. Step 3 Starch suspension was put into each dialysis tubing bag until each bag was approximately three-quarters full. Step 4 One of the dialysis tubing bags containing starch suspension was put into test-tube C. The open end of the dialysis tubing was folded over the top of the test-tube. It was secured with an elastic band as shown in Fig. 1.2. C open end of the dialysis tubing bag folded over the top of elastic band the test-tube dialysis tubing bag containing X starch suspension test-tube closed end of the dialysis tubing bag Fig. 1.2 Step 5 Step 4 was repeated with the other dialysis tubing bag and test-tube H. Step 6 Cold water was added to test-tube C until it reached the level of the elastic band. Step 7 Hot water was added to test-tube H until it reached the level of the elastic band. Step 8 The temperatures of the water in test-tube C and test-tube H were measured. The temperatures are shown on the sections of thermometers in Fig. 1.3. 30 80 20 70 10 60 thermometer in thermometer in test-tube C test-tube H Fig. 1.3 Step 9 1 cm3 of iodine solution was added to the water in each test-tube. Step 10 A stop-clock was started. Step 11 The student observed the X on each test-tube by looking through the dialysis tubing bags as shown in Fig. 1.4. X drawn on the opposite side of the test-tube eye looking at X through the dialysis tubing bag that is water containing inside the test-tube iodine solution Fig. 1.4 Step 12 The student continued to observe the X until the contents of the dialysis tubing bag became blue-black in colour. At this point the X was no longer visible. The student recorded the time taken for the X to stop being visible in each test-tube. The student’s results are shown in Fig. 1.5. test-tube C 8 minutes 36 s test-tube H 1 minute 23 s Fig. 1.5 (a) (i) Prepare a table to record the temperatures shown in Fig. 1.3 and the results shown in Fig. 1.5. The times shown in Fig. 1.5 should be converted to seconds. [3] (ii) State a conclusion for this investigation. ........................................................................................................................................... ........................................................................................................................................... ..................................................................................................................................... [1] (iii) Identify the variable that was changed by the student (independent variable) in this investigation. ..................................................................................................................................... [1] (iv) The student observed that the liquid inside the dialysis tubing bag turned blue-black in colour during the investigation. The liquid in the test-tube surrounding the dialysis tubing bag remained brown. State what can be concluded about the ability of the starch molecules to move through the dialysis tubing. State the evidence to support your conclusion. conclusion ......................................................................................................................... ........................................................................................................................................... evidence ............................................................................................................................ ........................................................................................................................................... ........................................................................................................................................... [2] (v) Identify one possible source of error in this investigation and suggest one additional piece of apparatus that could be used to reduce the effect of this error. error ................................................................................................................................... ........................................................................................................................................... ........................................................................................................................................... apparatus .......................................................................................................................... ........................................................................................................................................... ........................................................................................................................................... [2] (b) (i) Amylase is an enzyme that breaks down starch to form reducing sugars. Describe how you could test for the presence of reducing sugars. Include the result of a positive test. method .............................................................................................................................. ........................................................................................................................................... ........................................................................................................................................... ........................................................................................................................................... ........................................................................................................................................... result ................................................................................................................................. [3] (ii) Plan an investigation to determine the effect of different concentrations of amylase on the breakdown of starch. ........................................................................................................................................... ........................................................................................................................................... ........................................................................................................................................... ........................................................................................................................................... ........................................................................................................................................... ........................................................................................................................................... ........................................................................................................................................... ........................................................................................................................................... ........................................................................................................................................... ........................................................................................................................................... ........................................................................................................................................... ........................................................................................................................................... ..................................................................................................................................... [6] [Total: 18]
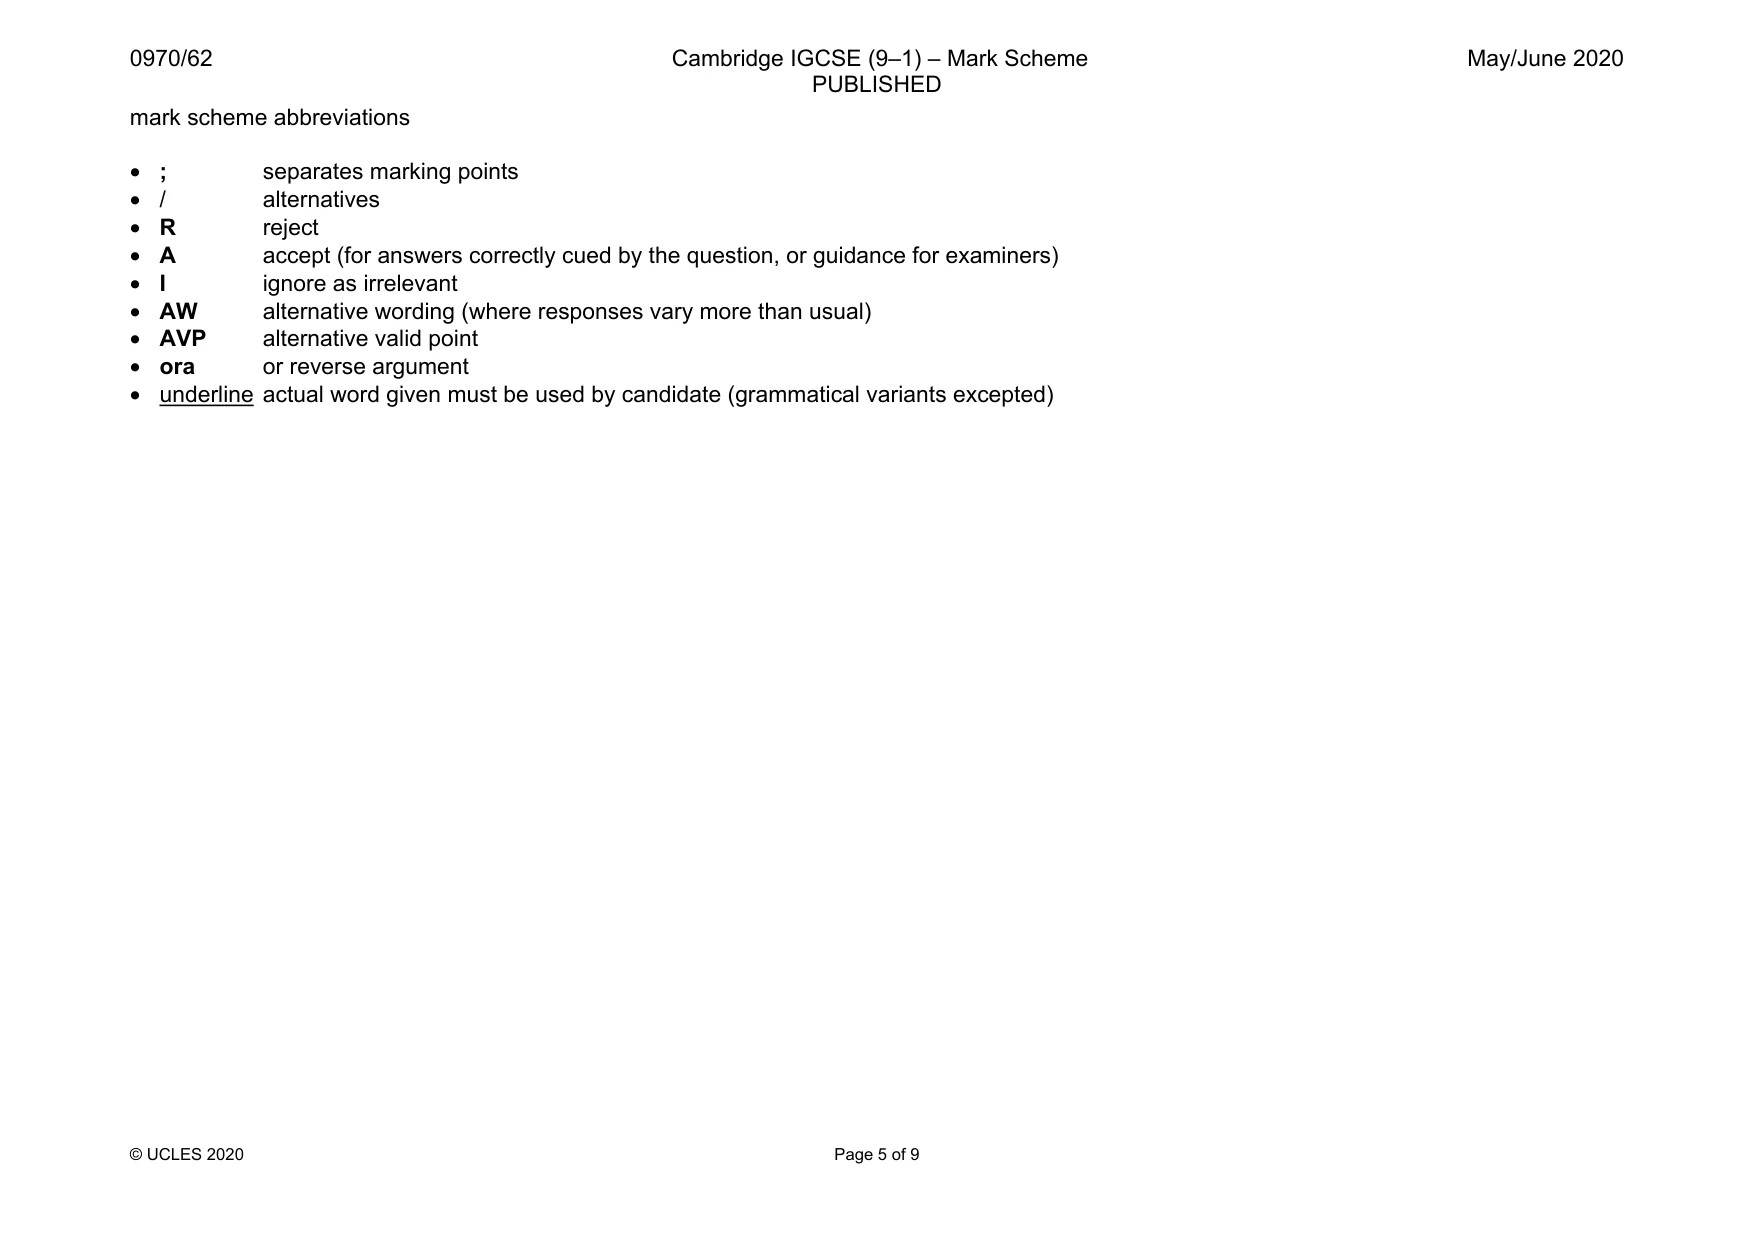
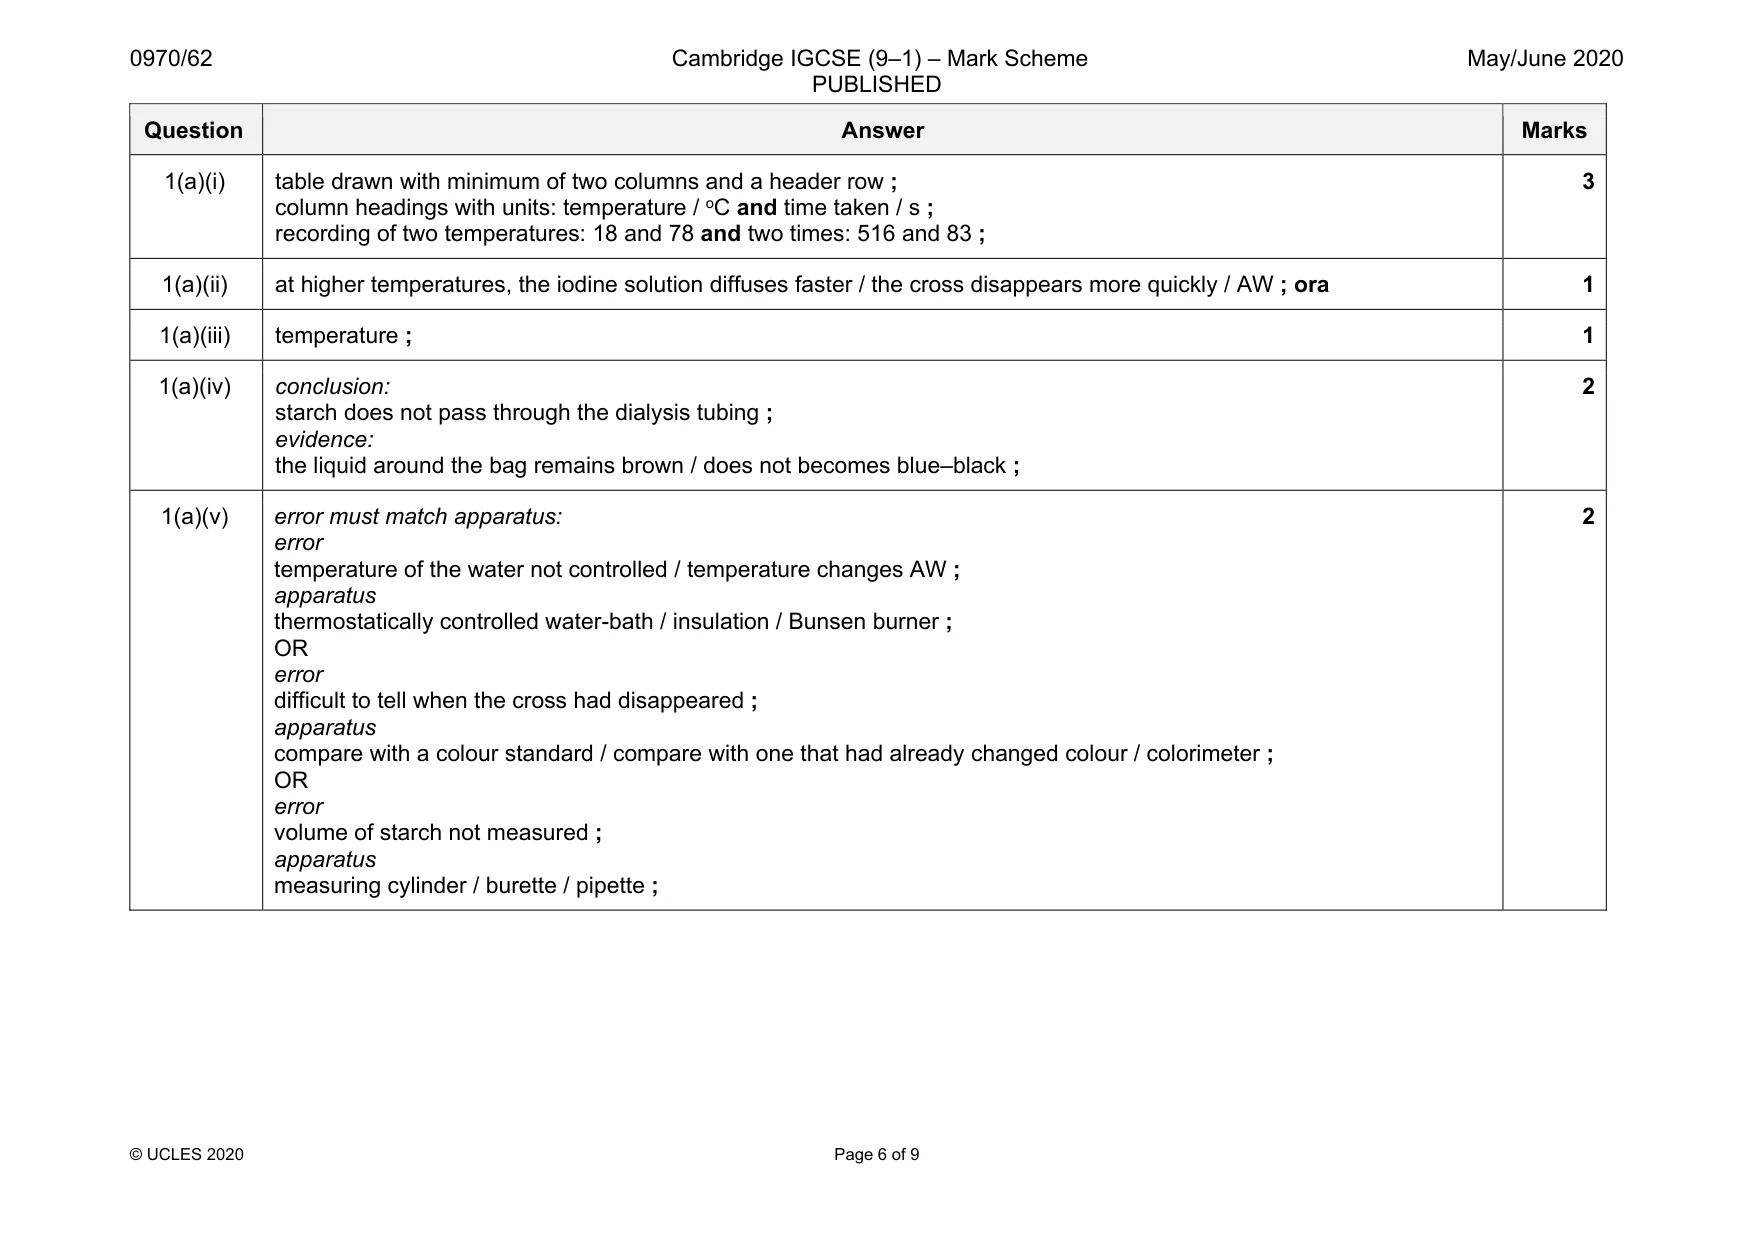
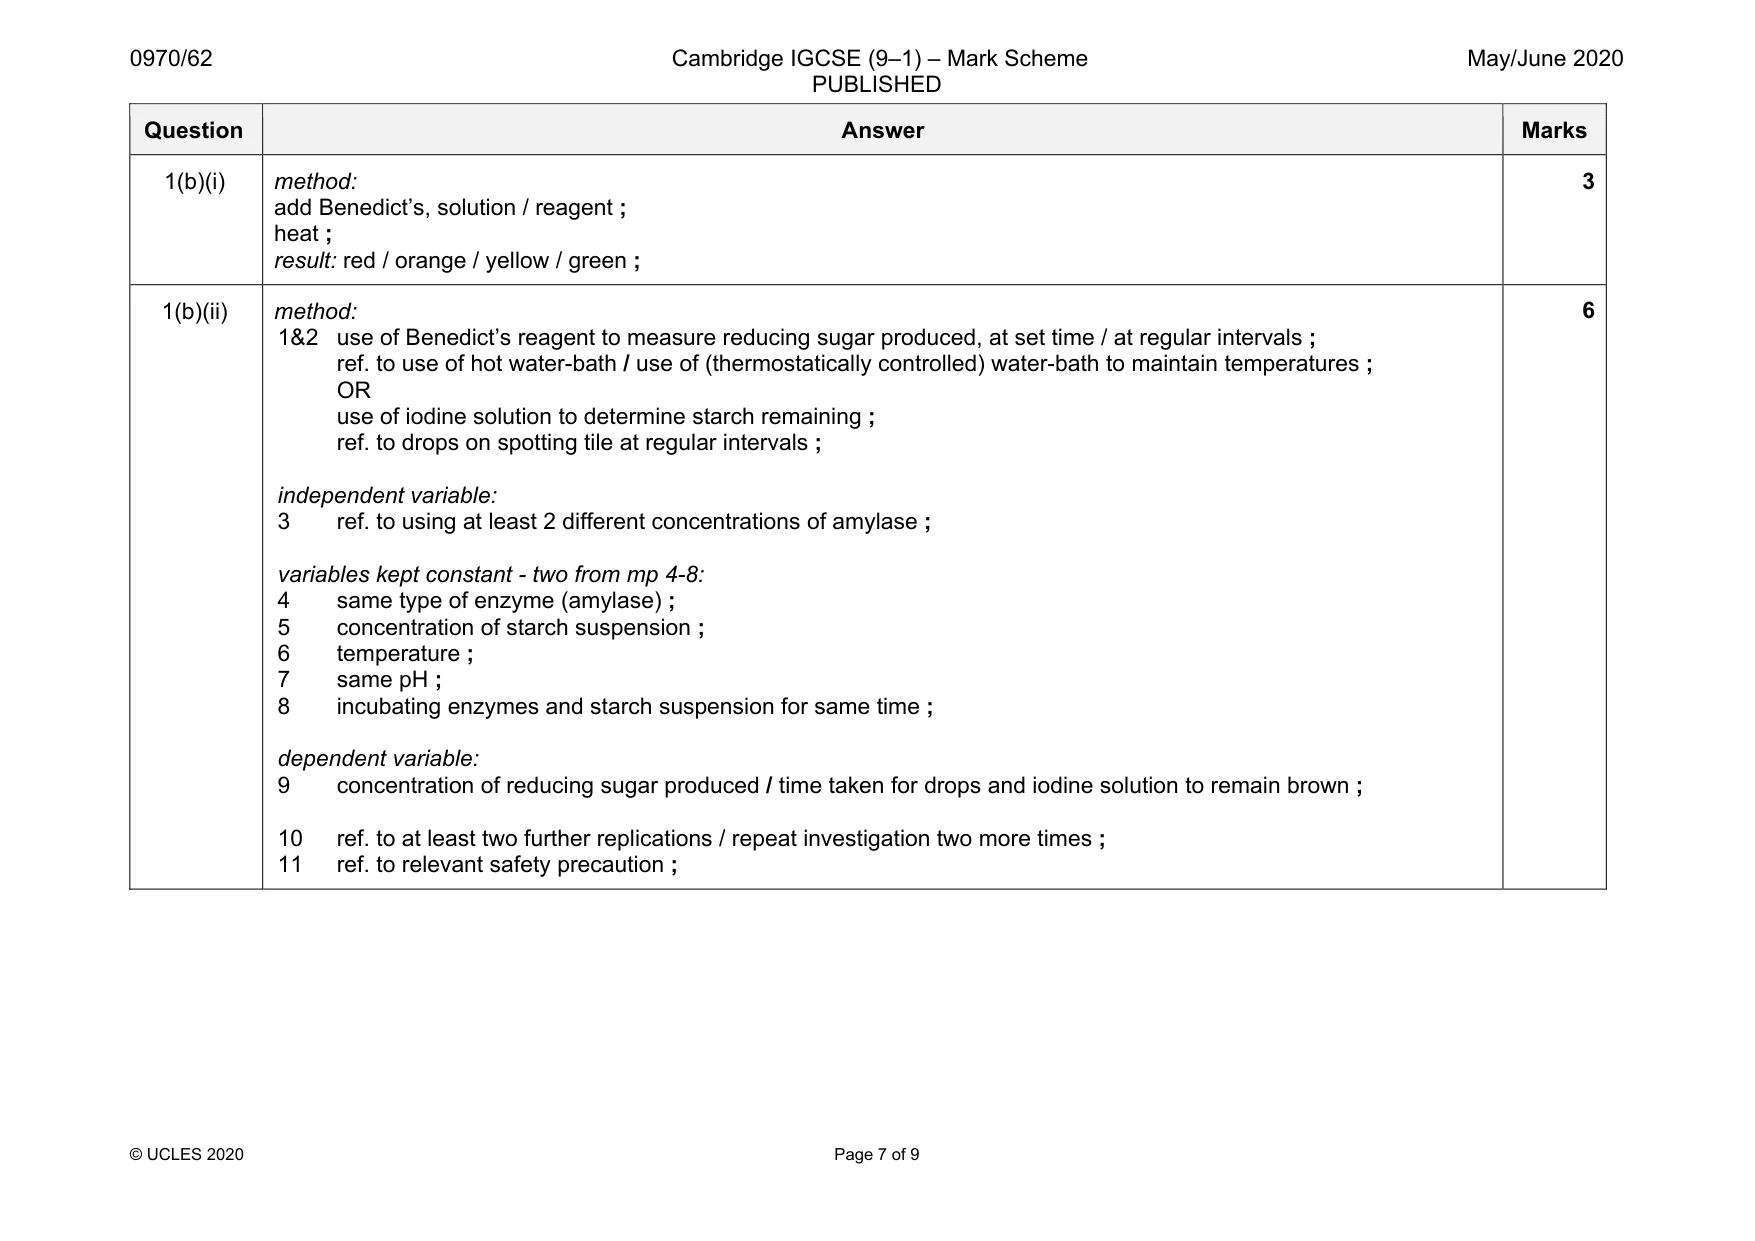
Mark scheme: 1(a)(i) table drawn with minimum of two columns and a header row ; column headings with units: temperature / oC and time taken / s ; recording of two temperatures: 18 and 78 and two times: 516 and 83 ; 3 1(a)(ii) at higher temperatures, the iodine solution diffuses faster / the cross disappears more quickly / AW ; ora 1 1(a)(iii) temperature ; 1 1(a)(iv) conclusion: starch does not pass through the dialysis tubing ; evidence: the liquid around the bag remains brown / does not becomes blue–black ; 2 1(a)(v) error must match apparatus: error temperature of the water not controlled / temperature changes AW ; apparatus thermostatically controlled water-bath / insulation / Bunsen burner ; OR error difficult to tell when the cross had disappeared ; apparatus compare with a colour standard / compare with one that had already changed colour / colorimeter ; OR error volume of starch not measured ; apparatus measuring cylinder / burette / pipette ; 2 Question Answer Marks 1(b)(i) method: add Benedict’s, solution / reagent ; heat ; result: red / orange / yellow / green ; 3 1(b)(ii) method: 1&2 use of Benedict’s reagent to measure reducing sugar produced, at set time / at regular intervals ; ref. to use of hot water-bath / use of (thermostatically controlled) water-bath to maintain temperatures ; OR use of iodine solution to determine starch remaining ; ref. to drops on spotting tile at regular intervals ; independent variable: 3 ref. to using at least 2 different concentrations of amylase ; variables kept constant - two from mp 4-8: 4 same type of enzyme (amylase) ; 5 concentration of starch suspension ; 6 temperature ; 7 same pH ; 8 incubating enzymes and starch suspension for same time ; dependent variable: 9 concentration of reducing sugar produced / time taken for drops and iodine solution to remain brown ; 10 ref. to at least two further replications / repeat investigation two more times ; 11 ref. to relevant safety precaution ; 6
Q2 · A student investigated the effect of different concentrations of sugar solution on…
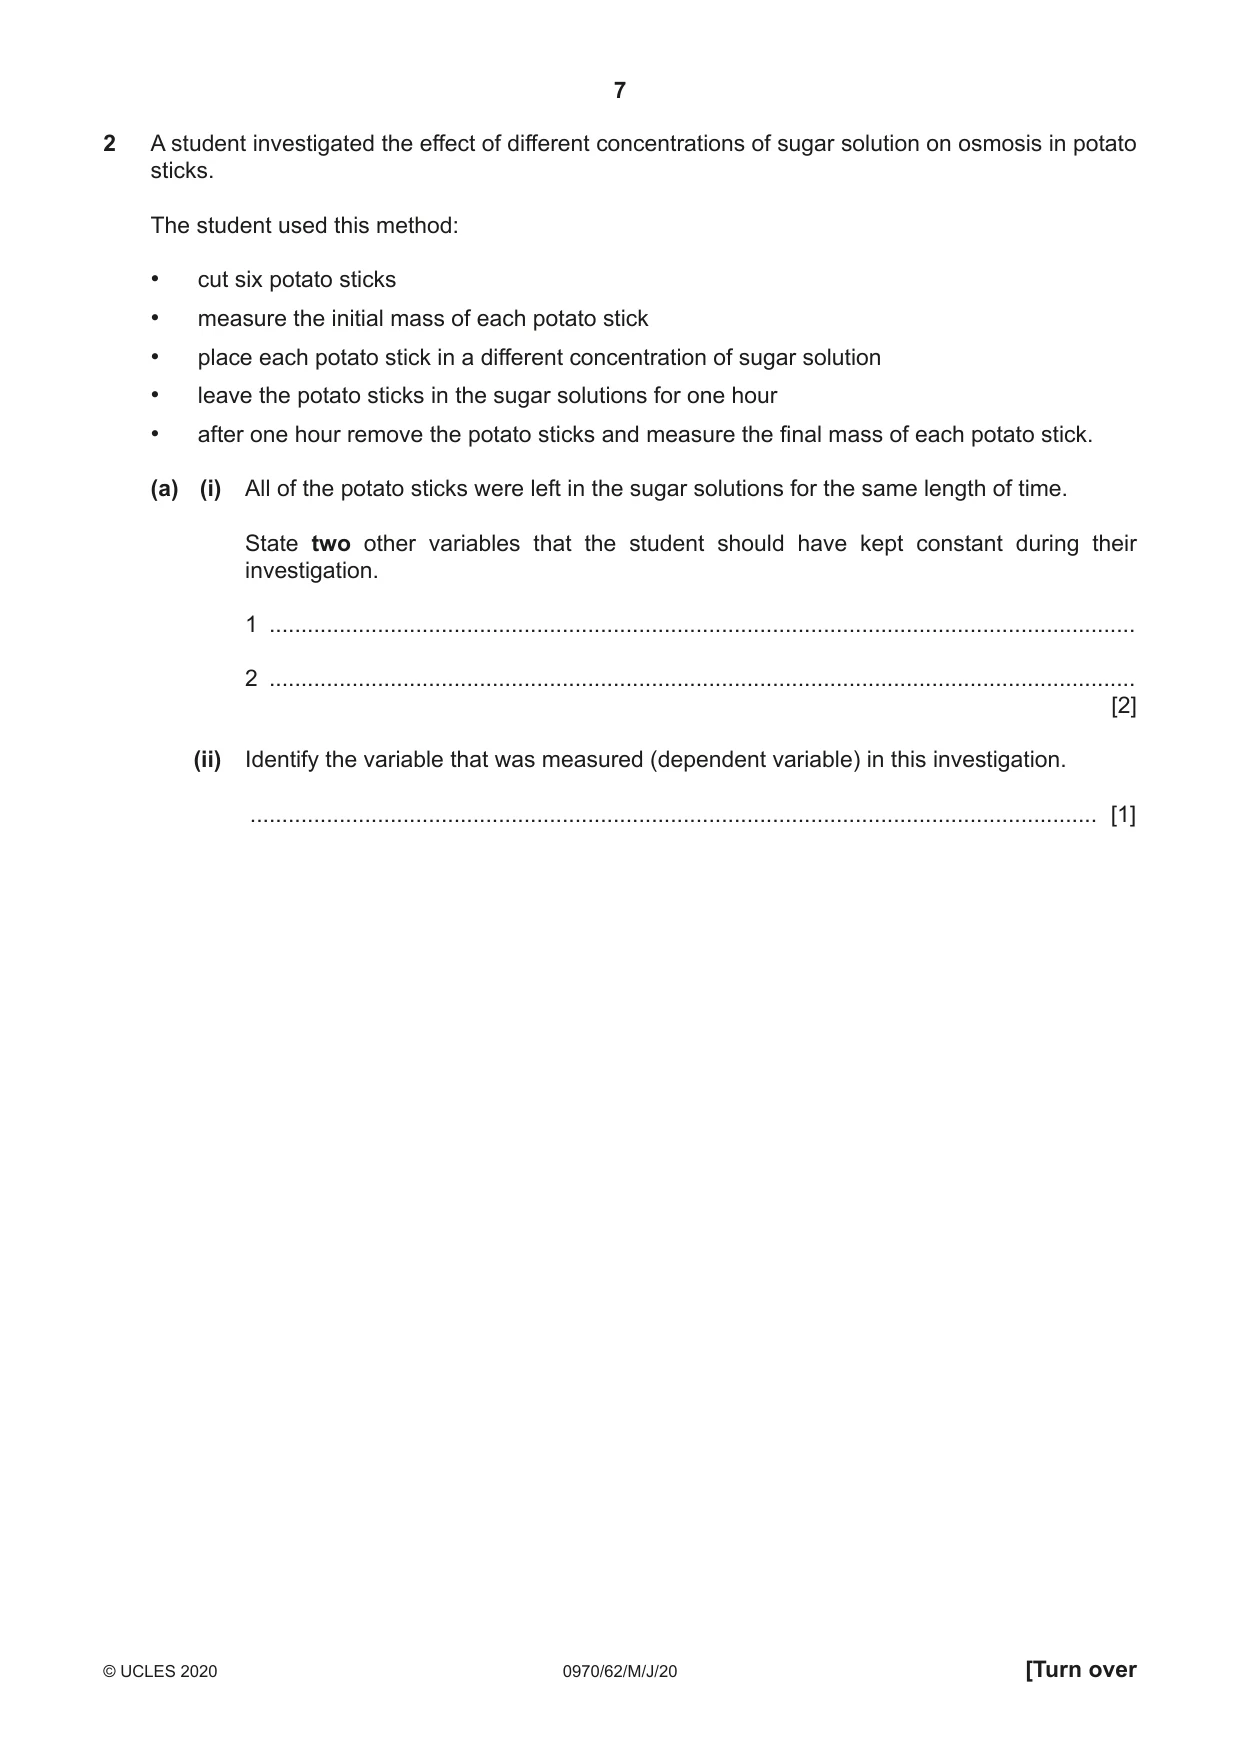
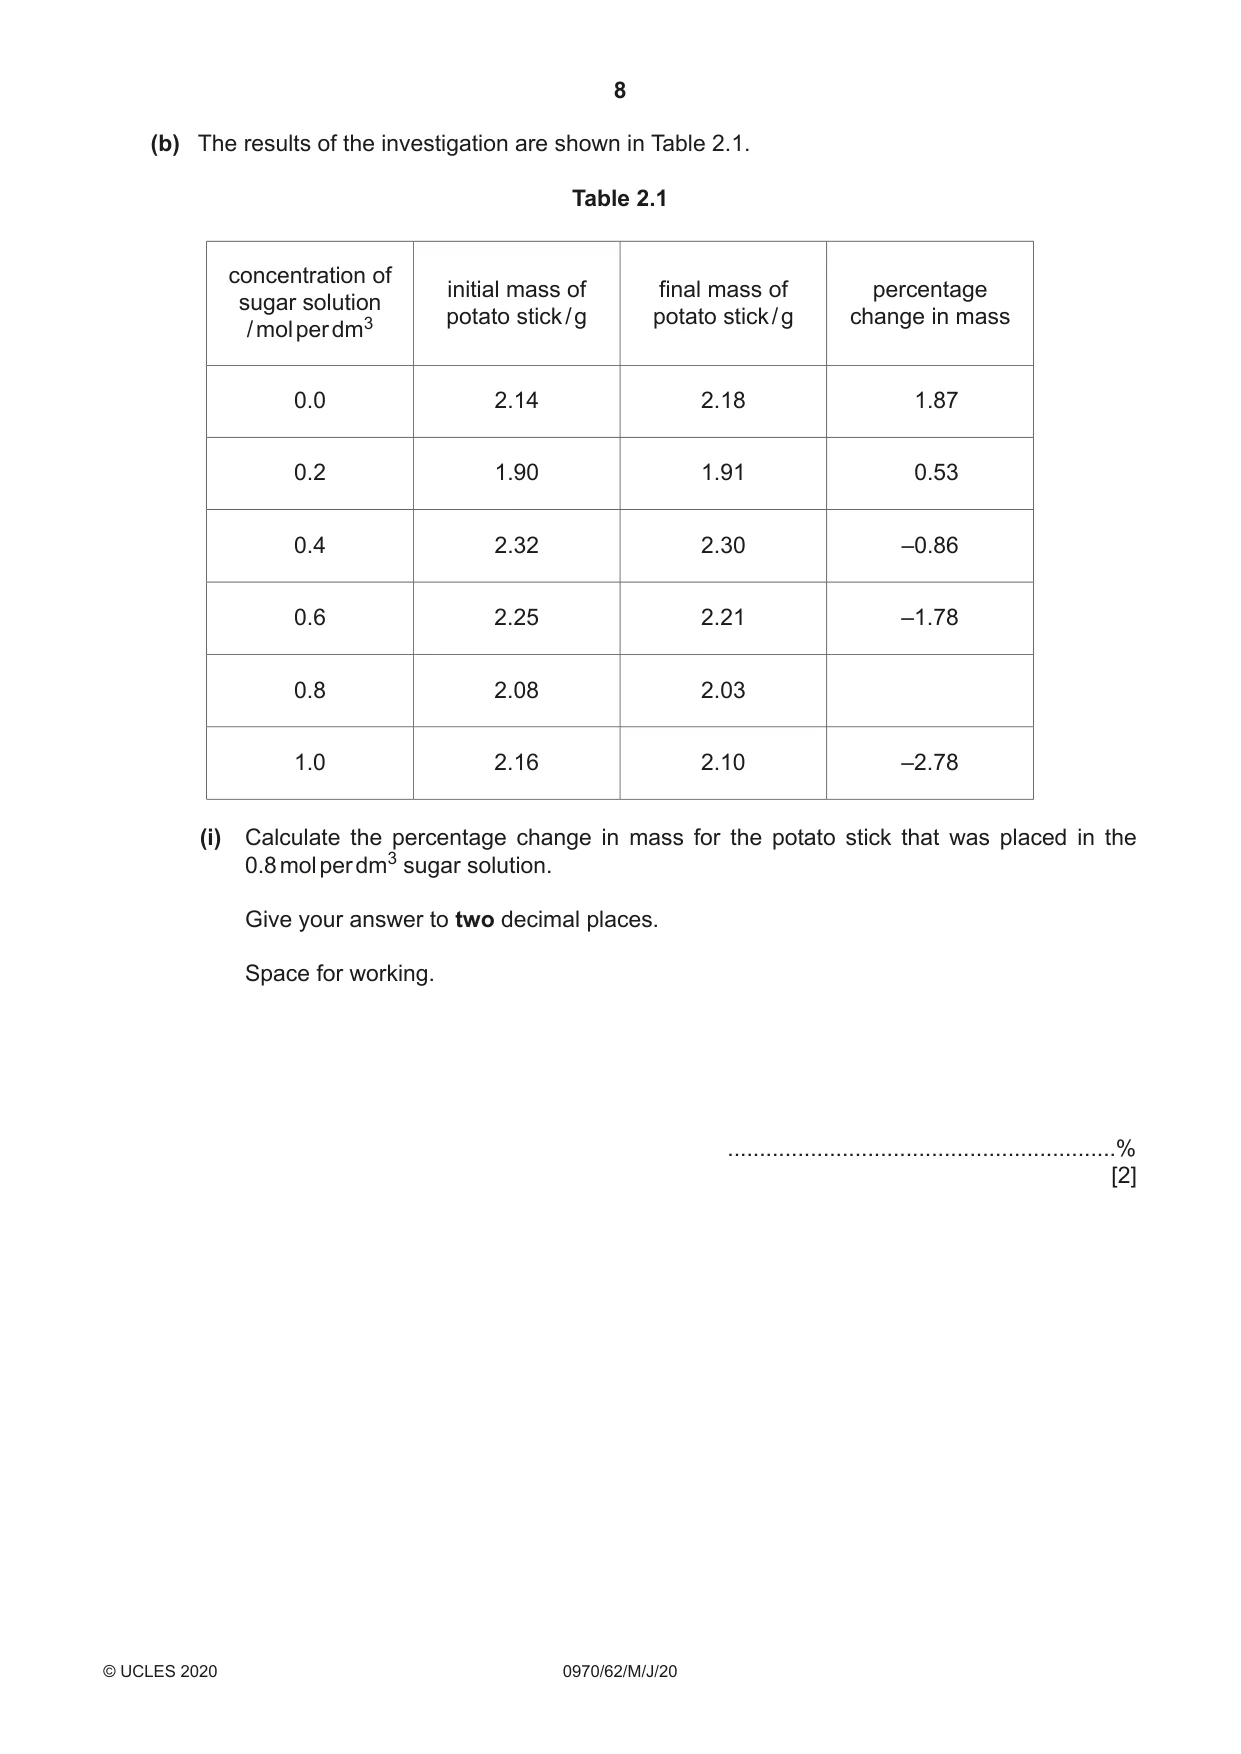
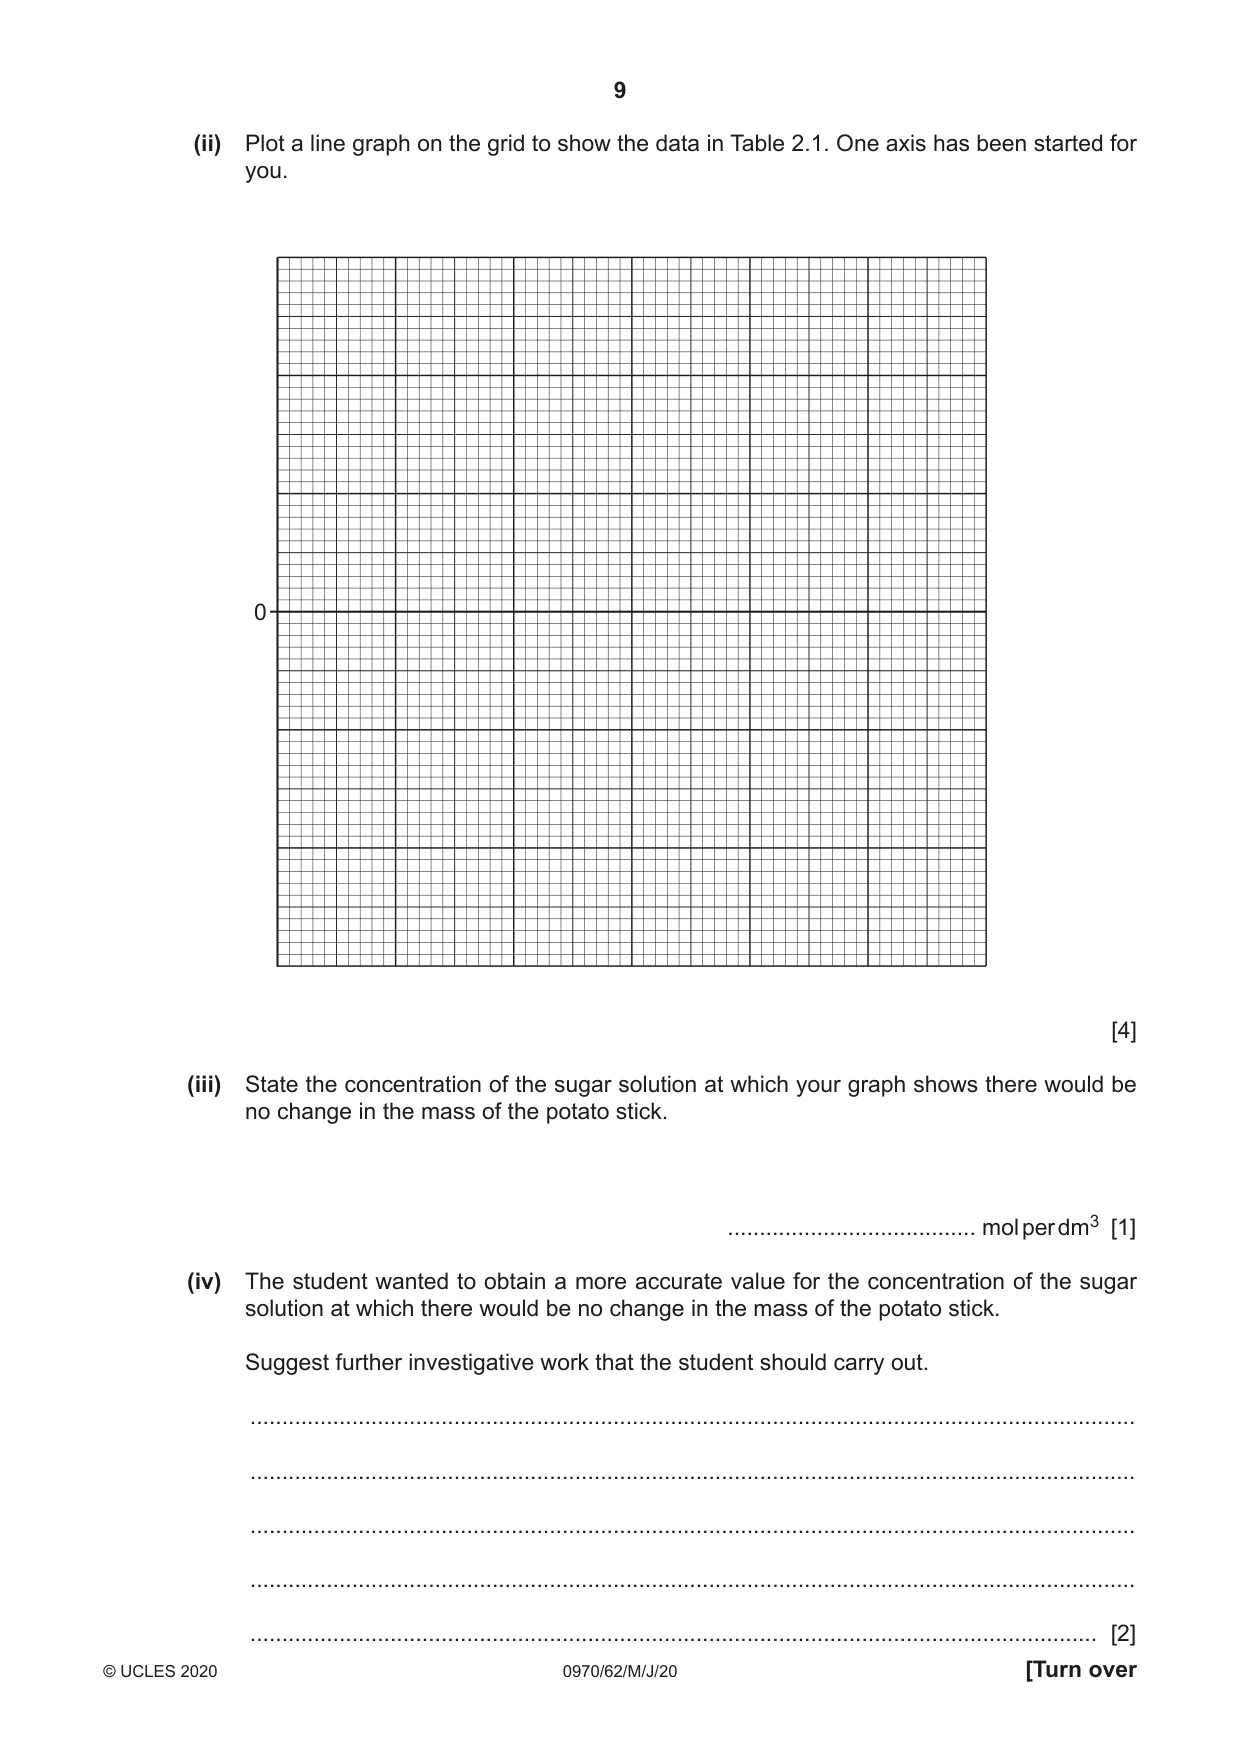
2 A student investigated the effect of different concentrations of sugar solution on osmosis in potato sticks. The student used this method: • cut six potato sticks • measure the initial mass of each potato stick • place each potato stick in a different concentration of sugar solution • leave the potato sticks in the sugar solutions for one hour • after one hour remove the potato sticks and measure the final mass of each potato stick. (a) (i) All of the potato sticks were left in the sugar solutions for the same length of time. State two other variables that the student should have kept constant during their investigation. 1 ........................................................................................................................................ 2 ........................................................................................................................................ [2] (ii) Identify the variable that was measured (dependent variable) in this investigation. ..................................................................................................................................... [1] (b) The results of the investigation are shown in Table 2.1. Table 2.1 concentration of initial mass of final mass of percentage sugar solution potato stick / g potato stick / g change in mass / mol per dm3 0.0 2.14 2.18 1.87 0.2 1.90 1.91 0.53 0.4 2.32 2.30 –0.86 0.6 2.25 2.21 –1.78 0.8 2.08 2.03 1.0 2.16 2.10 –2.78 (i) Calculate the percentage change in mass for the potato stick that was placed in the 0.8 mol per dm3 sugar solution. Give your answer to two decimal places. Space for working. .............................................................% [2] (ii) Plot a line graph on the grid to show the data in Table 2.1. One axis has been started for you. 0 [4] (iii) State the concentration of the sugar solution at which your graph shows there would be no change in the mass of the potato stick. ....................................... mol per dm3 [1] (iv) The student wanted to obtain a more accurate value for the concentration of the sugar solution at which there would be no change in the mass of the potato stick. Suggest further investigative work that the student should carry out. ........................................................................................................................................... ........................................................................................................................................... ........................................................................................................................................... ...........................................................................................................................................
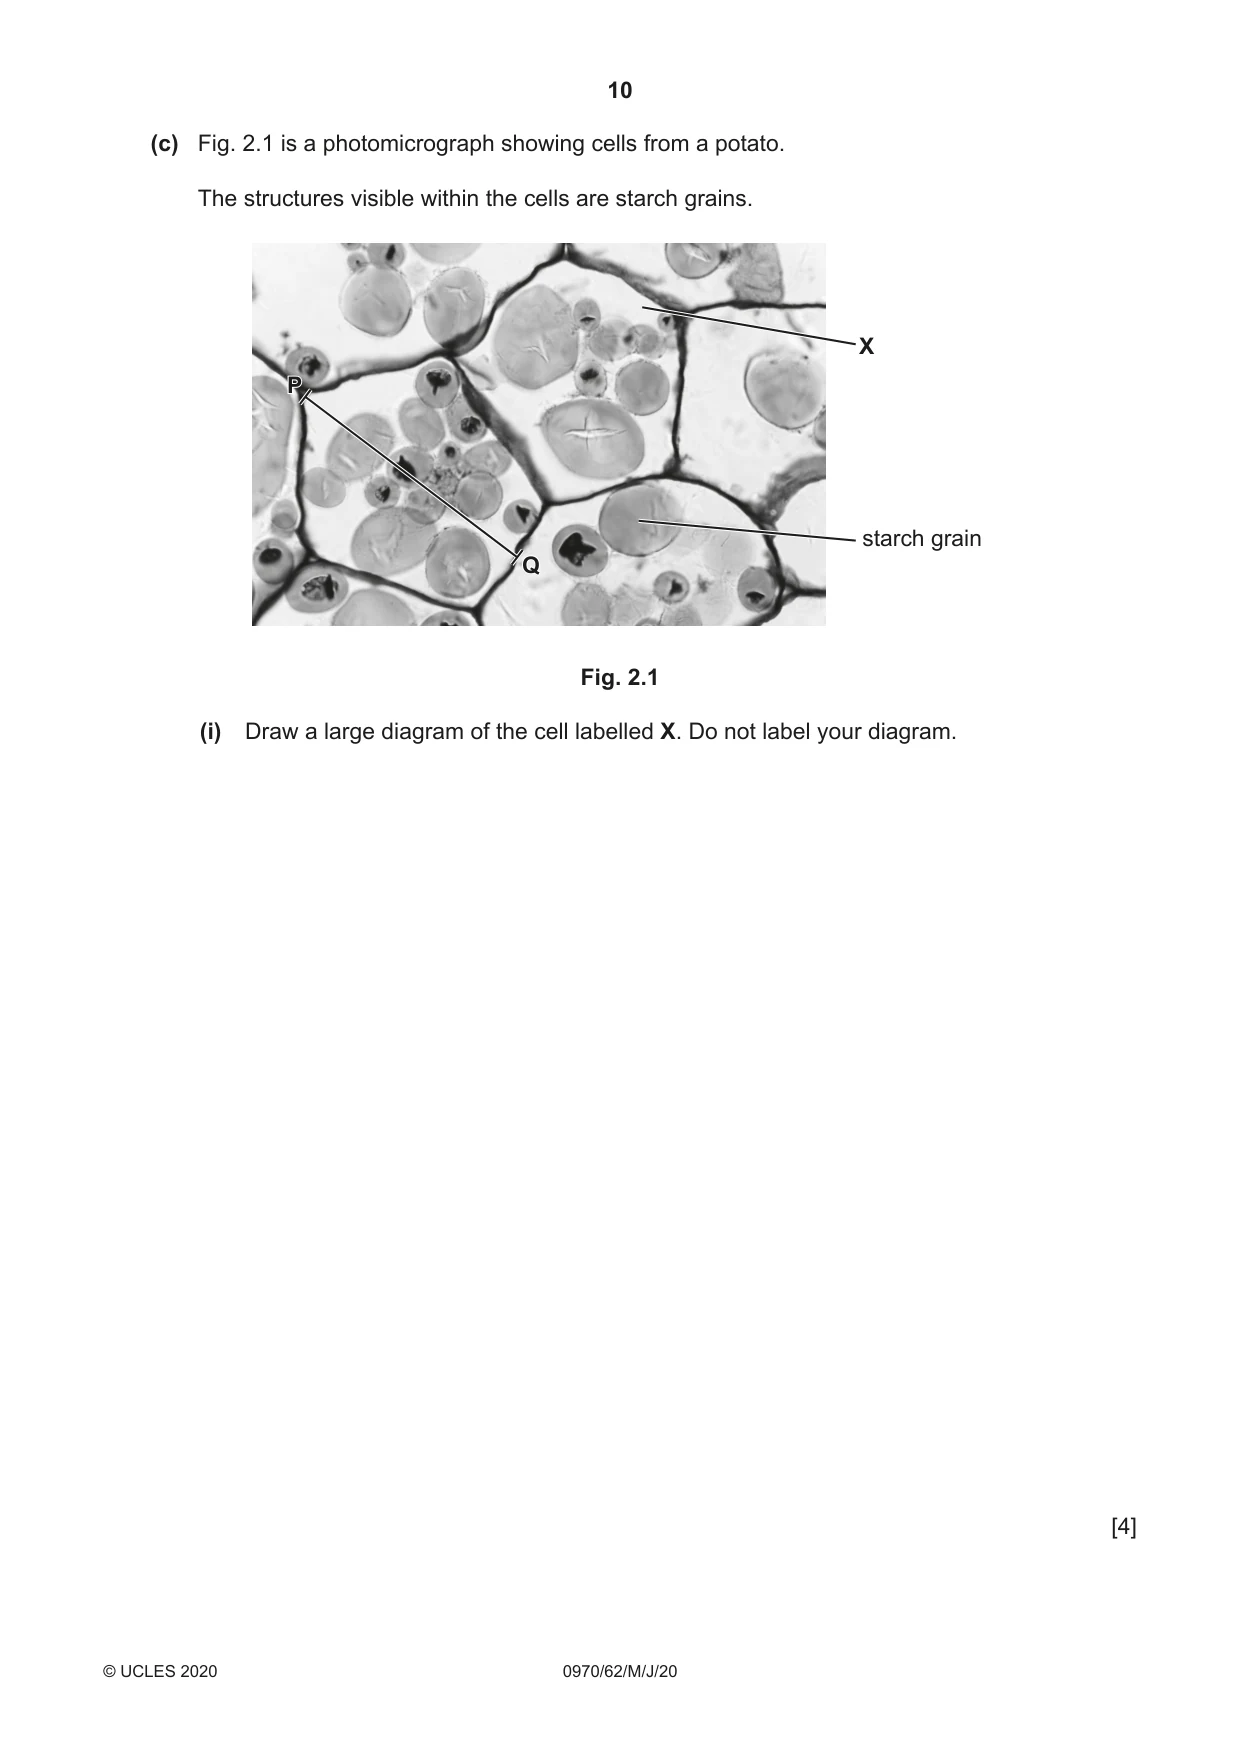
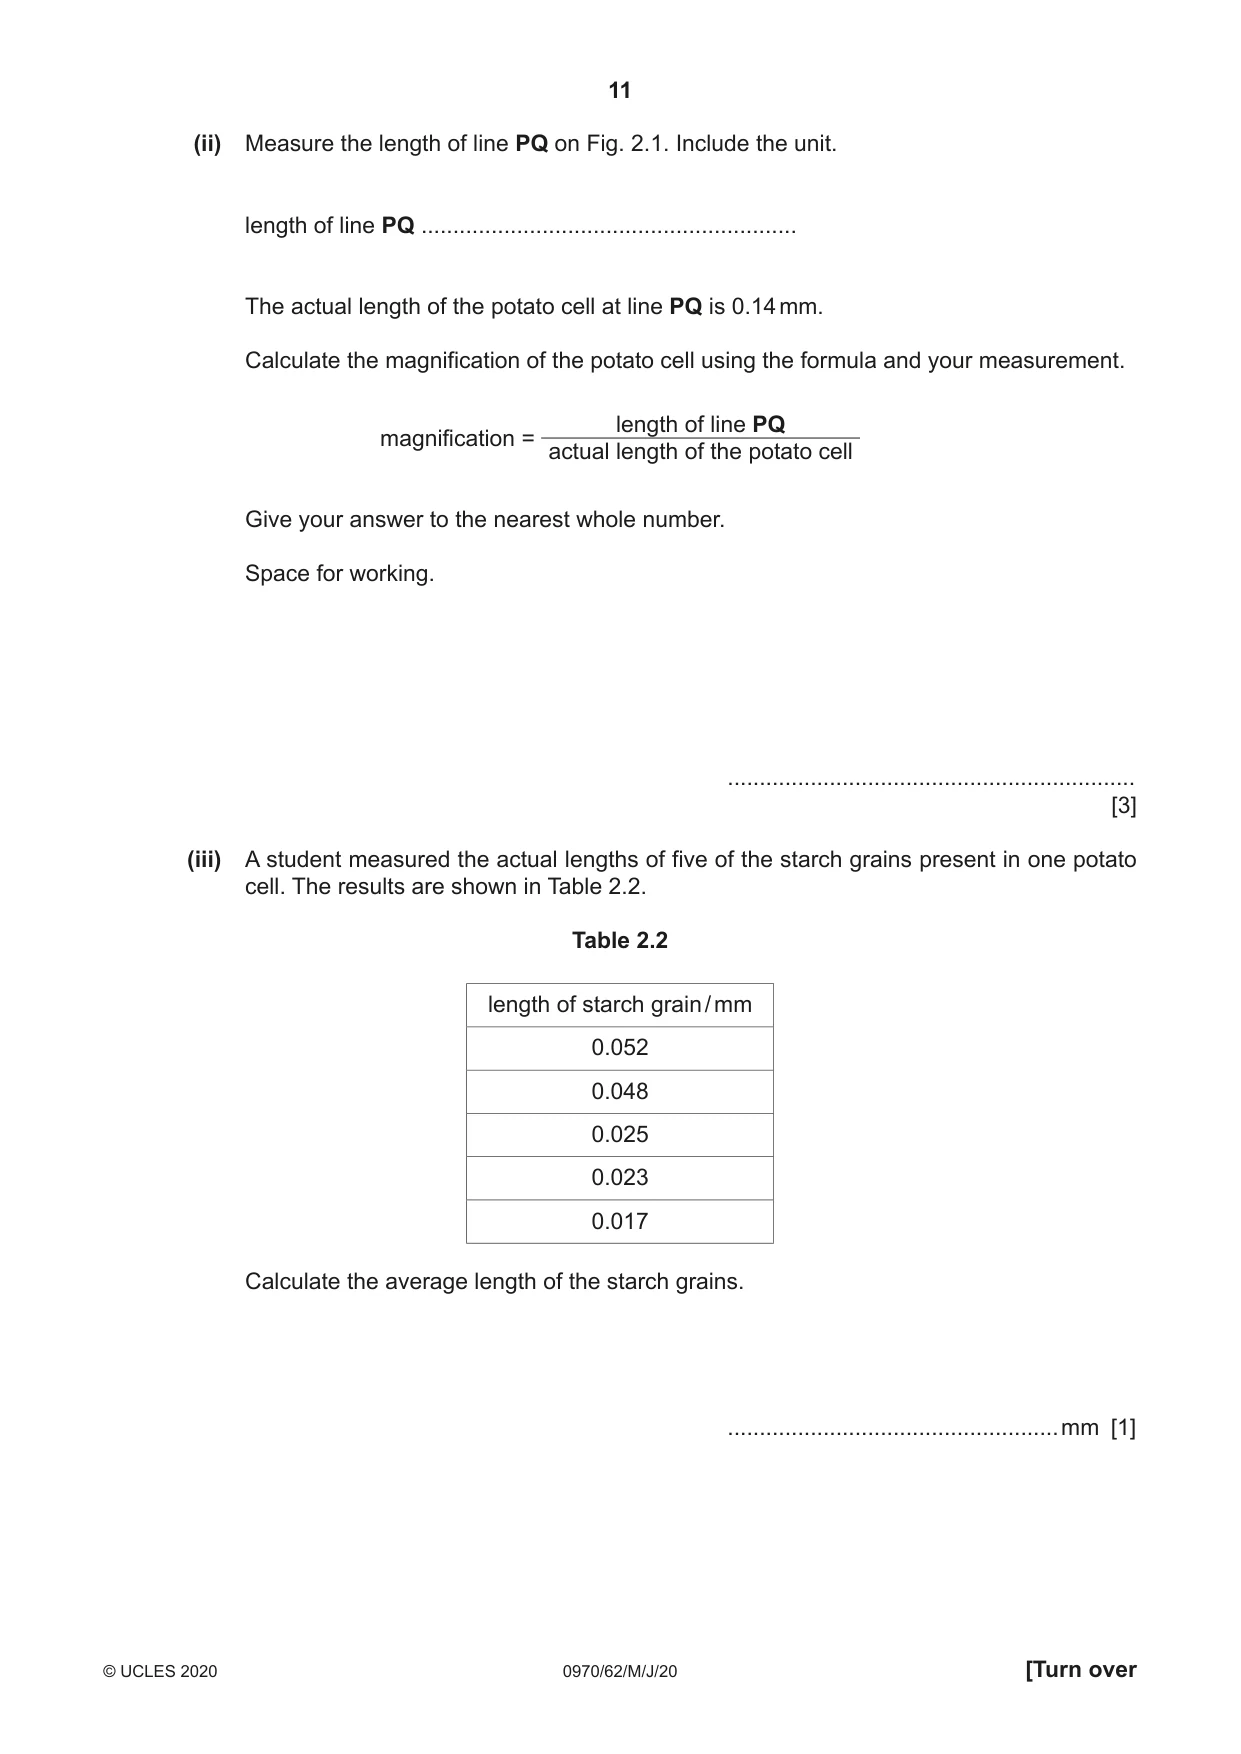
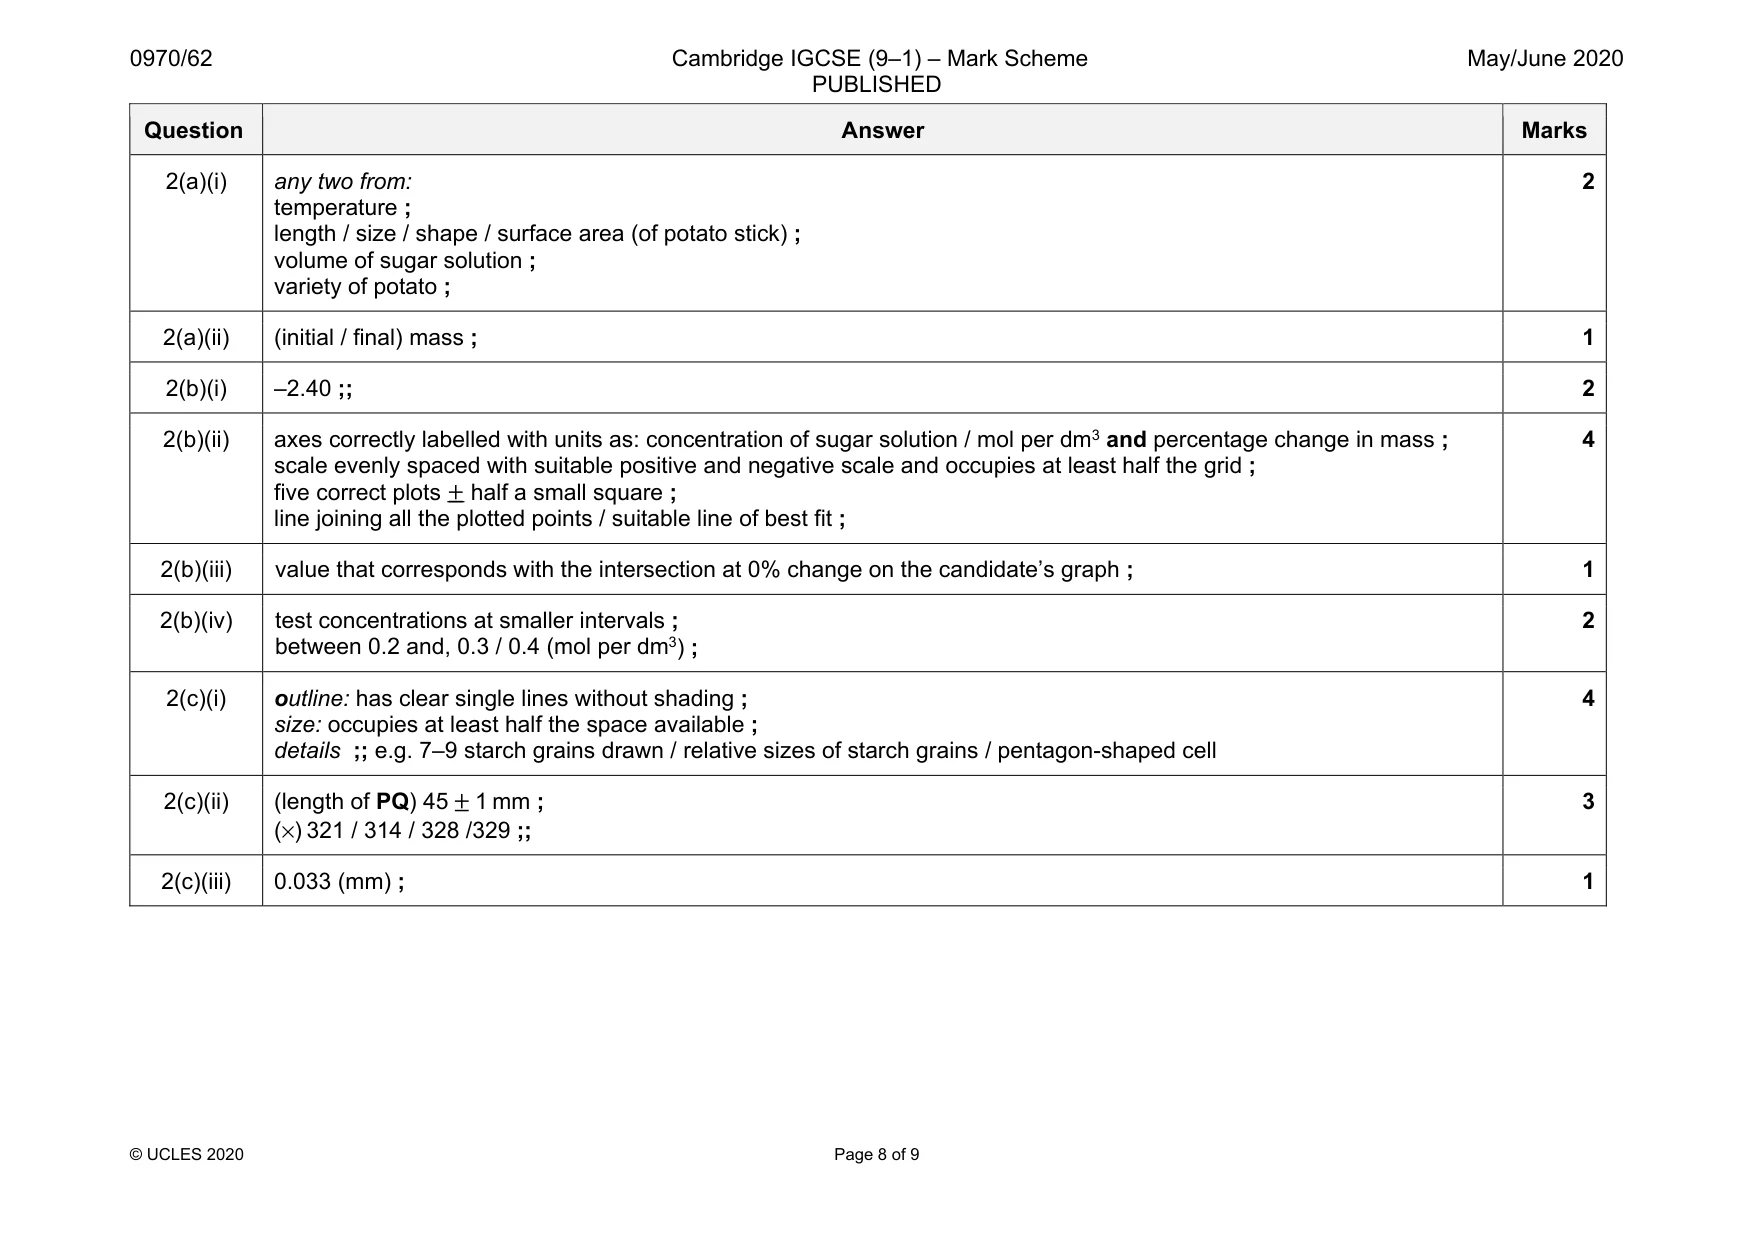
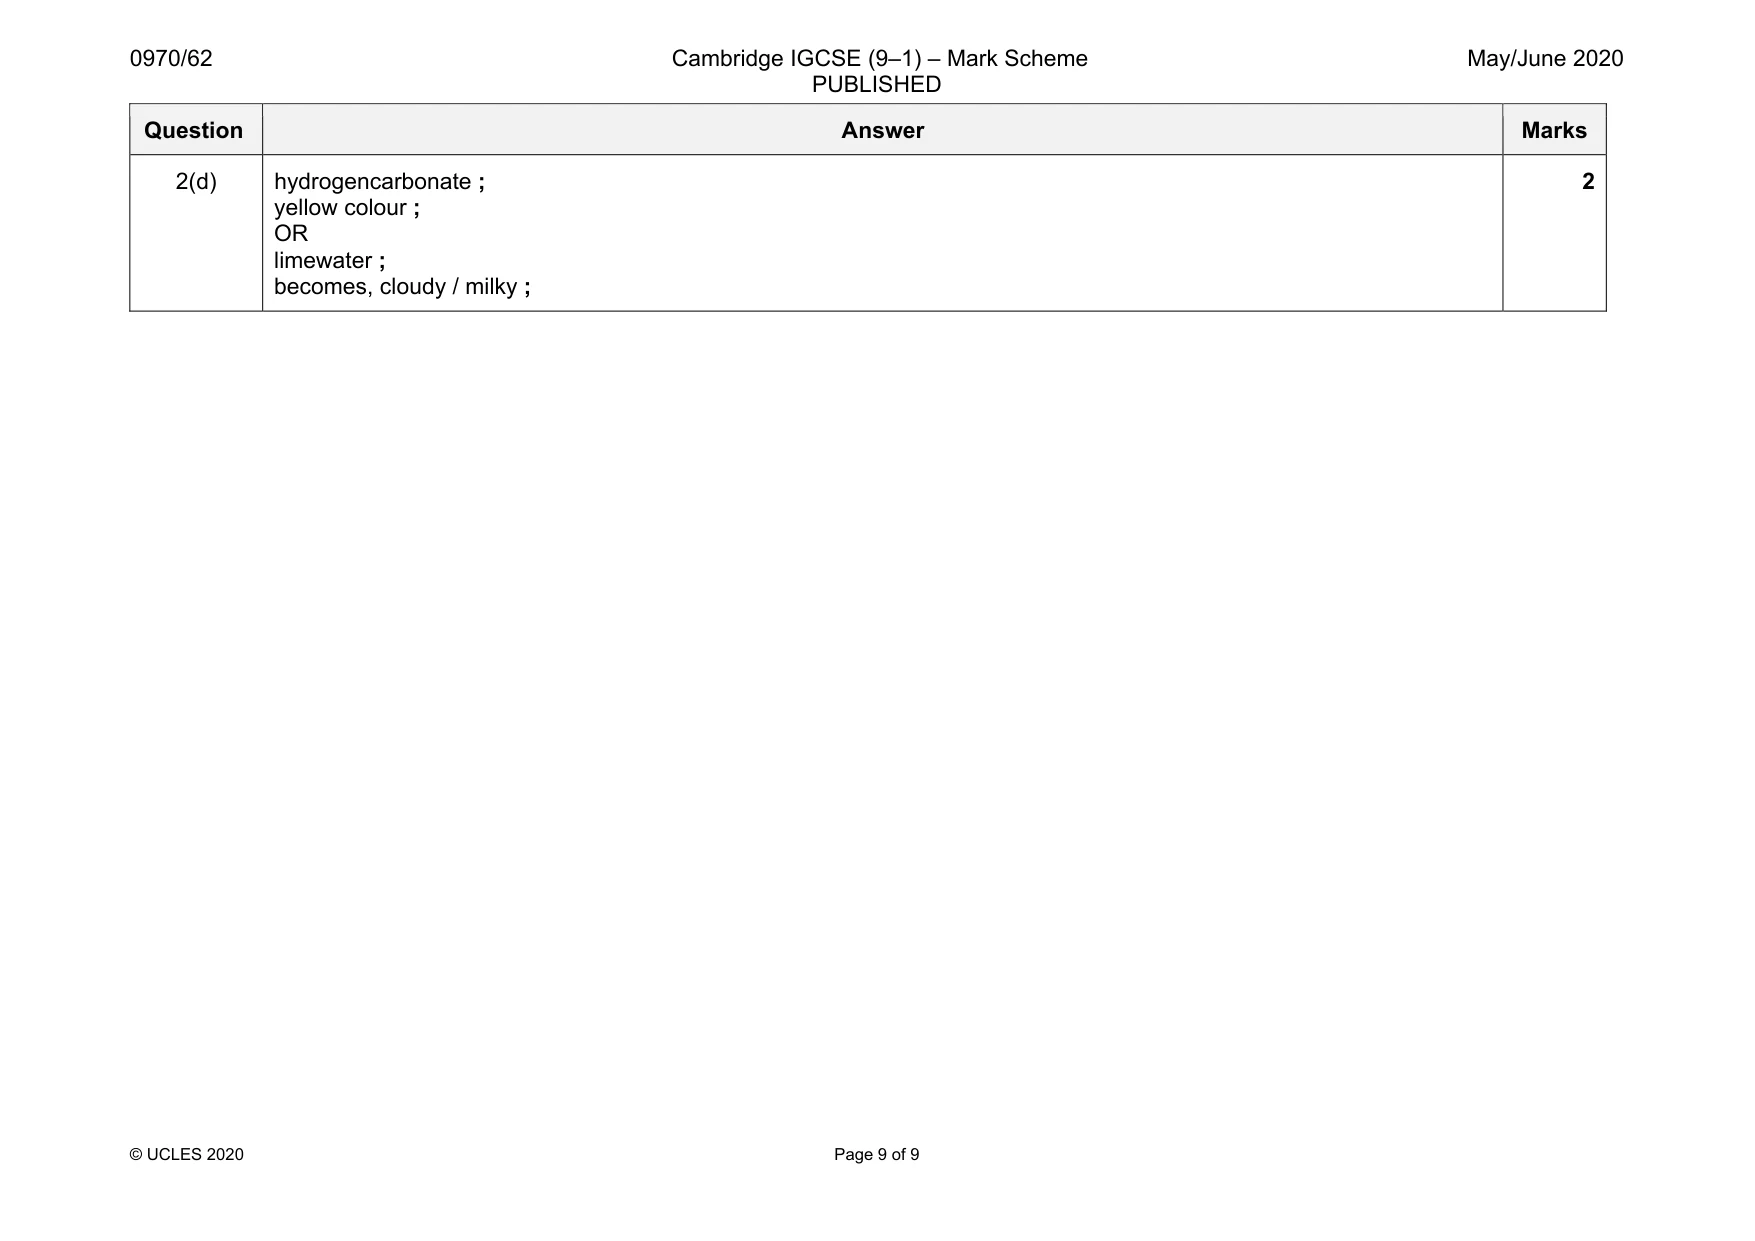
Mark scheme: 2(a)(i) any two from: temperature ; length / size / shape / surface area (of potato stick) ; volume of sugar solution ; variety of potato ; 2 2(a)(ii) (initial / final) mass ; 1 2(b)(i) –2.40 ;; 2 2(b)(ii) axes correctly labelled with units as: concentration of sugar solution / mol per dm3 and percentage change in mass ; scale evenly spaced with suitable positive and negative scale and occupies at least half the grid ; five correct plots ± half a small square ; line joining all the plotted points / suitable line of best fit ; 4 2(b)(iii) value that corresponds with the intersection at 0% change on the candidate’s graph ; 1 2(b)(iv) test concentrations at smaller intervals ; between 0.2 and, 0.3 / 0.4 (mol per dm3) ; 2 2(c)(i) outline: has clear single lines without shading ; size: occupies at least half the space available ; details ;; e.g. 7–9 starch grains drawn / relative sizes of starch grains / pentagon-shaped cell 4 2(c)(ii) (length of PQ) 45 ± 1 mm ; (×) 321 / 314 / 328 /329 ;; 3 2(c)(iii) 0.033 (mm) ; 1 Question Answer Marks 2(d) hydrogencarbonate ; yellow colour ; OR limewater ; becomes, cloudy / milky ; 2
What was in this paper
The subtopics covered by these 2 questions, and how many questions each got. Open one in a new tab to see every Cambridge question on it.