Cambridge IGCSE Biology (9-1) 0970 — 2019 Oct/Nov Paper 6 · Variant 2
0970/62/O/N/19 · 2 questions · 40 marks · ≈45 min
The question paper and its mark scheme, free to read here and free to download. This is Cambridge’s own paper, exactly as it was sat.
Question paper12 pages

Mark scheme7 pages
Answers below. Sit the paper first if you are practising.
Questions as text
Q1 · A student investigated the effect of the enzyme amylase on the breakdown of a starch…
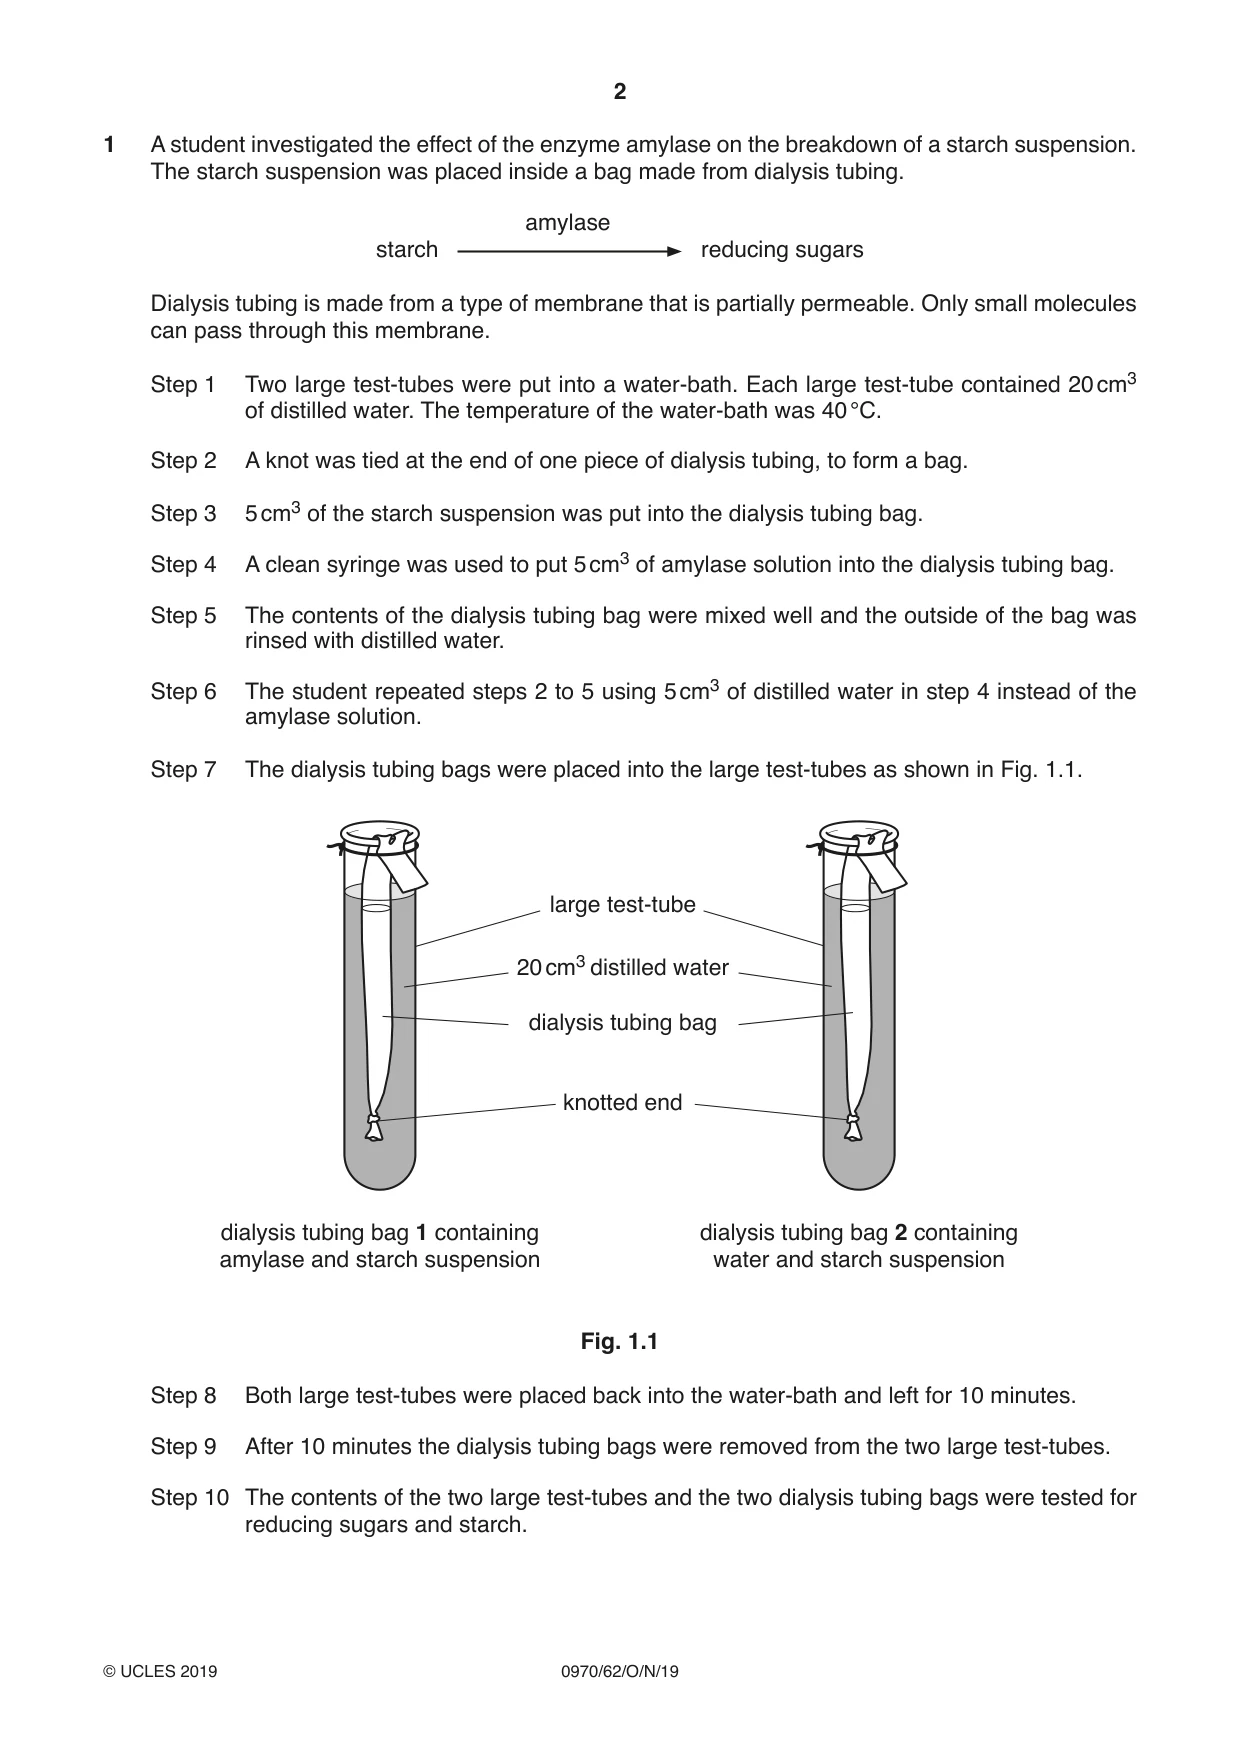
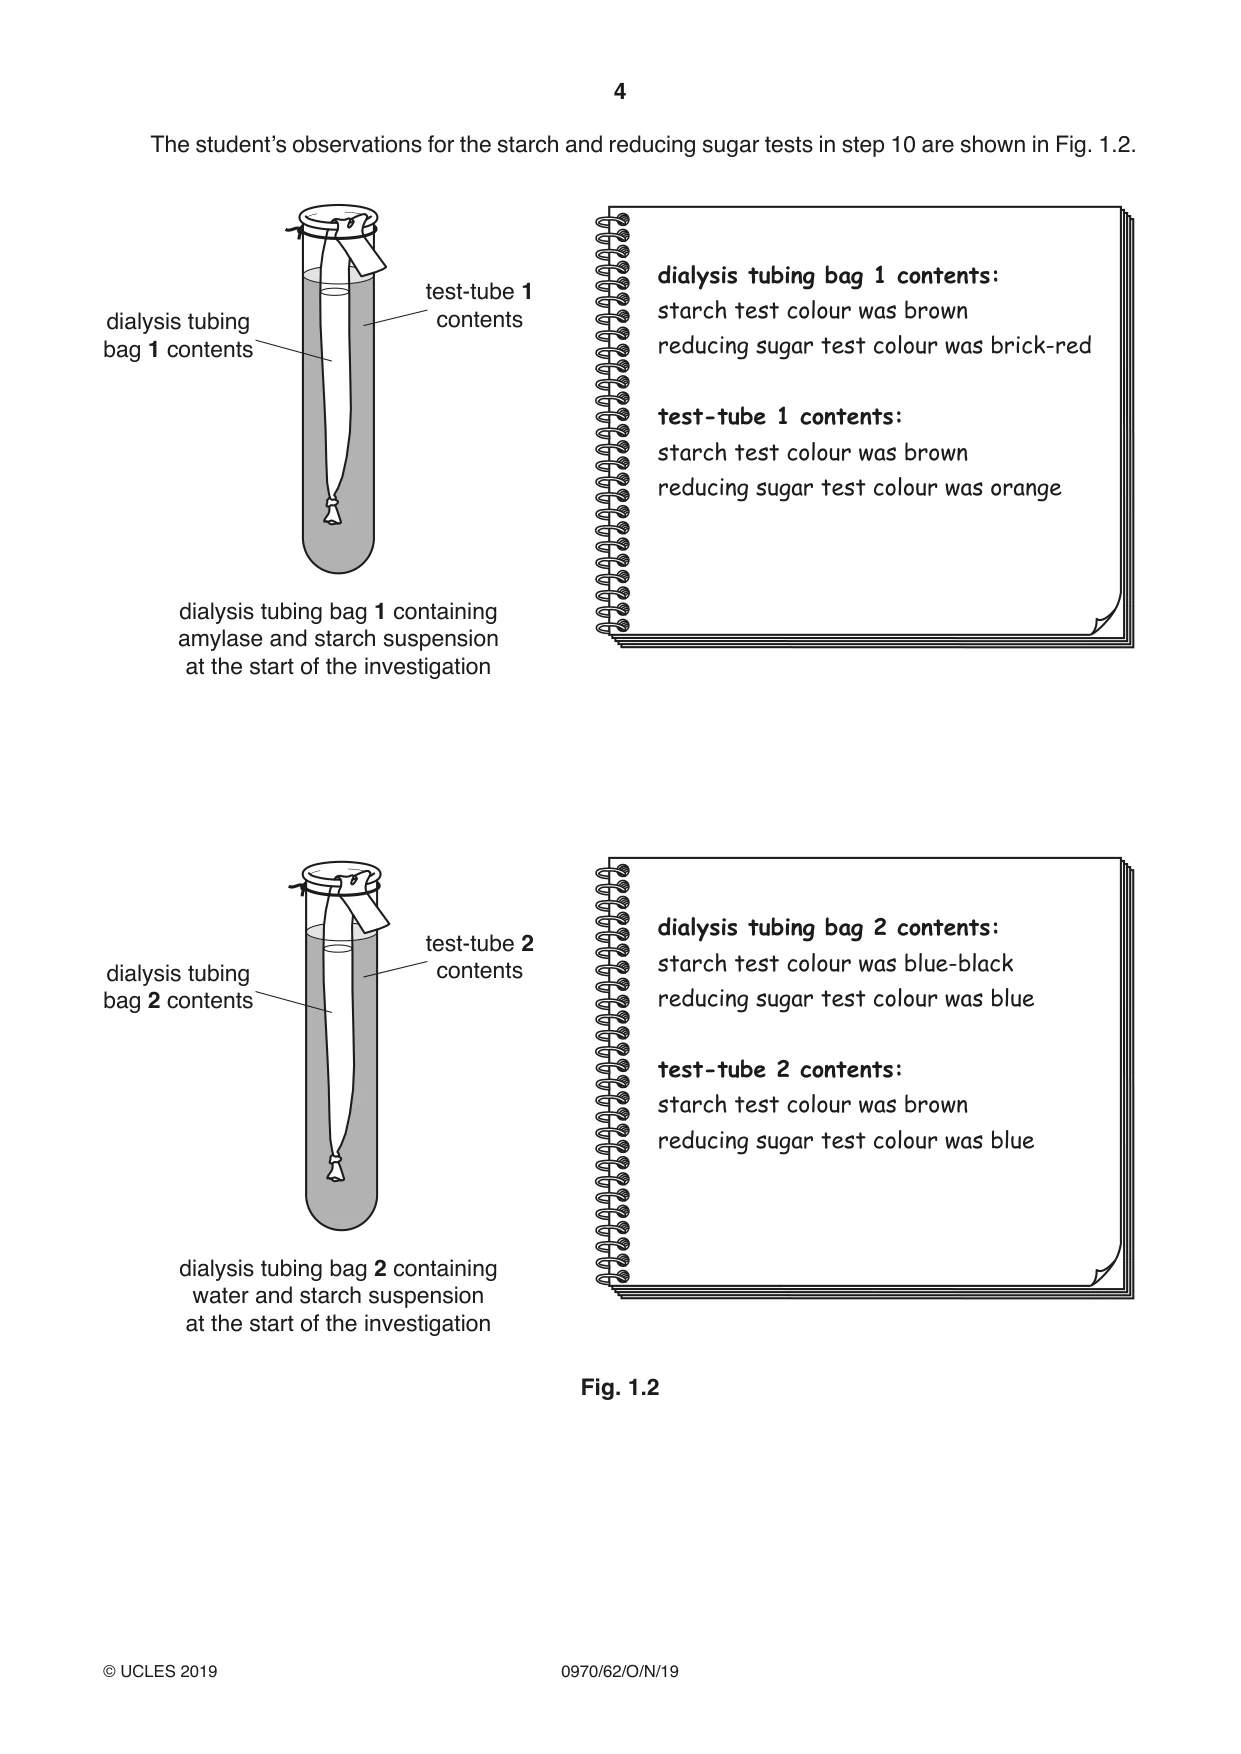
1 A student investigated the effect of the enzyme amylase on the breakdown of a starch suspension. The starch suspension was placed inside a bag made from dialysis tubing. amylase starch reducing sugars Dialysis tubing is made from a type of membrane that is partially permeable. Only small molecules can pass through this membrane. Step 1 Two large test-tubes were put into a water-bath. Each large test-tube contained 20 cm3 of distilled water. The temperature of the water-bath was 40 °C. Step 2 A knot was tied at the end of one piece of dialysis tubing, to form a bag. Step 3 5 cm3 of the starch suspension was put into the dialysis tubing bag. Step 4 A clean syringe was used to put 5 cm3 of amylase solution into the dialysis tubing bag. Step 5 The contents of the dialysis tubing bag were mixed well and the outside of the bag was rinsed with distilled water. Step 6 The student repeated steps 2 to 5 using 5 cm3 of distilled water in step 4 instead of the amylase solution. Step 7 The dialysis tubing bags were placed into the large test-tubes as shown in Fig. 1.1. large test-tube 20 cm3 distilled water dialysis tubing bag knotted end dialysis tubing bag 1 containing dialysis tubing bag 2 containing amylase and starch suspension water and starch suspension Fig. 1.1 Step 8 Both large test-tubes were placed back into the water-bath and left for 10 minutes. Step 9 After 10 minutes the dialysis tubing bags were removed from the two large test-tubes. Step 10 The contents of the two large test-tubes and the two dialysis tubing bags were tested for reducing sugars and starch. (a) State the name of the solution that the student would use to test substances for starch. ............................................................................................................................................. [1] (b) Describe how the student would test substances for reducing sugars. ................................................................................................................................................... ................................................................................................................................................... ................................................................................................................................................... ................................................................................................................................................... ............................................................................................................................................. [2] (c) Suggest why the outside of the dialysis tubing bag was rinsed in Step 5. ................................................................................................................................................... ............................................................................................................................................. [1] The student’s observations for the starch and reducing sugar tests in step 10 are shown in Fig. 1.2. dialysis tubing bag 1 contents: test-tube 1 starch test colour was browndialysis tubing contents bag 1 contents reducing sugar test colour was brick-red test-tube 1 contents: starch test colour was brown reducing sugar test colour was orange dialysis tubing bag 1 containing amylase and starch suspension at the start of the investigation dialysis tubing bag 2 contents: test-tube 2 starch test colour was blue-blackdialysis tubing contents bag 2 contents reducing sugar test colour was blue test-tube 2 contents: starch test colour was brown reducing sugar test colour was blue dialysis tubing bag 2 containing water and starch suspension at the start of the investigation Fig. 1.2 (d) (i) Prepare a table and record the results of the starch and reducing sugar tests from Fig. 1.2 in the space provided. [3] (ii) State three conclusions for the results shown in Fig. 1.2. ........................................................................................................................................... ........................................................................................................................................... ........................................................................................................................................... ........................................................................................................................................... ........................................................................................................................................... ........................................................................................................................................... ..................................................................................................................................... [3] (e) State two variables that were kept constant during this investigation. 1 ................................................................................................................................................ 2 ................................................................................................................................................ [2] (f) Plan an investigation using dialysis tubing to determine the effect of temperature on the activity of the enzyme amylase. ................................................................................................................................................... ................................................................................................................................................... ................................................................................................................................................... ................................................................................................................................................... ................................................................................................................................................... ................................................................................................................................................... ................................................................................................................................................... ................................................................................................................................................... ................................................................................................................................................... ................................................................................................................................................... ................................................................................................................................................... ................................................................................................................................................... ................................................................................................................................................... ................................................................................................................................................... ................................................................................................................................................... ................................................................................................................................................... ............................................................................................................................................. [6] (g) The student wanted to find out if the amylase enzyme passed through the dialysis tubing into the large test-tube. Amylase is made of protein. Describe how the student could find out if the solution in the large test-tube contained protein. ................................................................................................................................................... ................................................................................................................................................... ................................................................................................................................................... ................................................................................................................................................... ............................................................................................................................................. [2] [Total: 20]
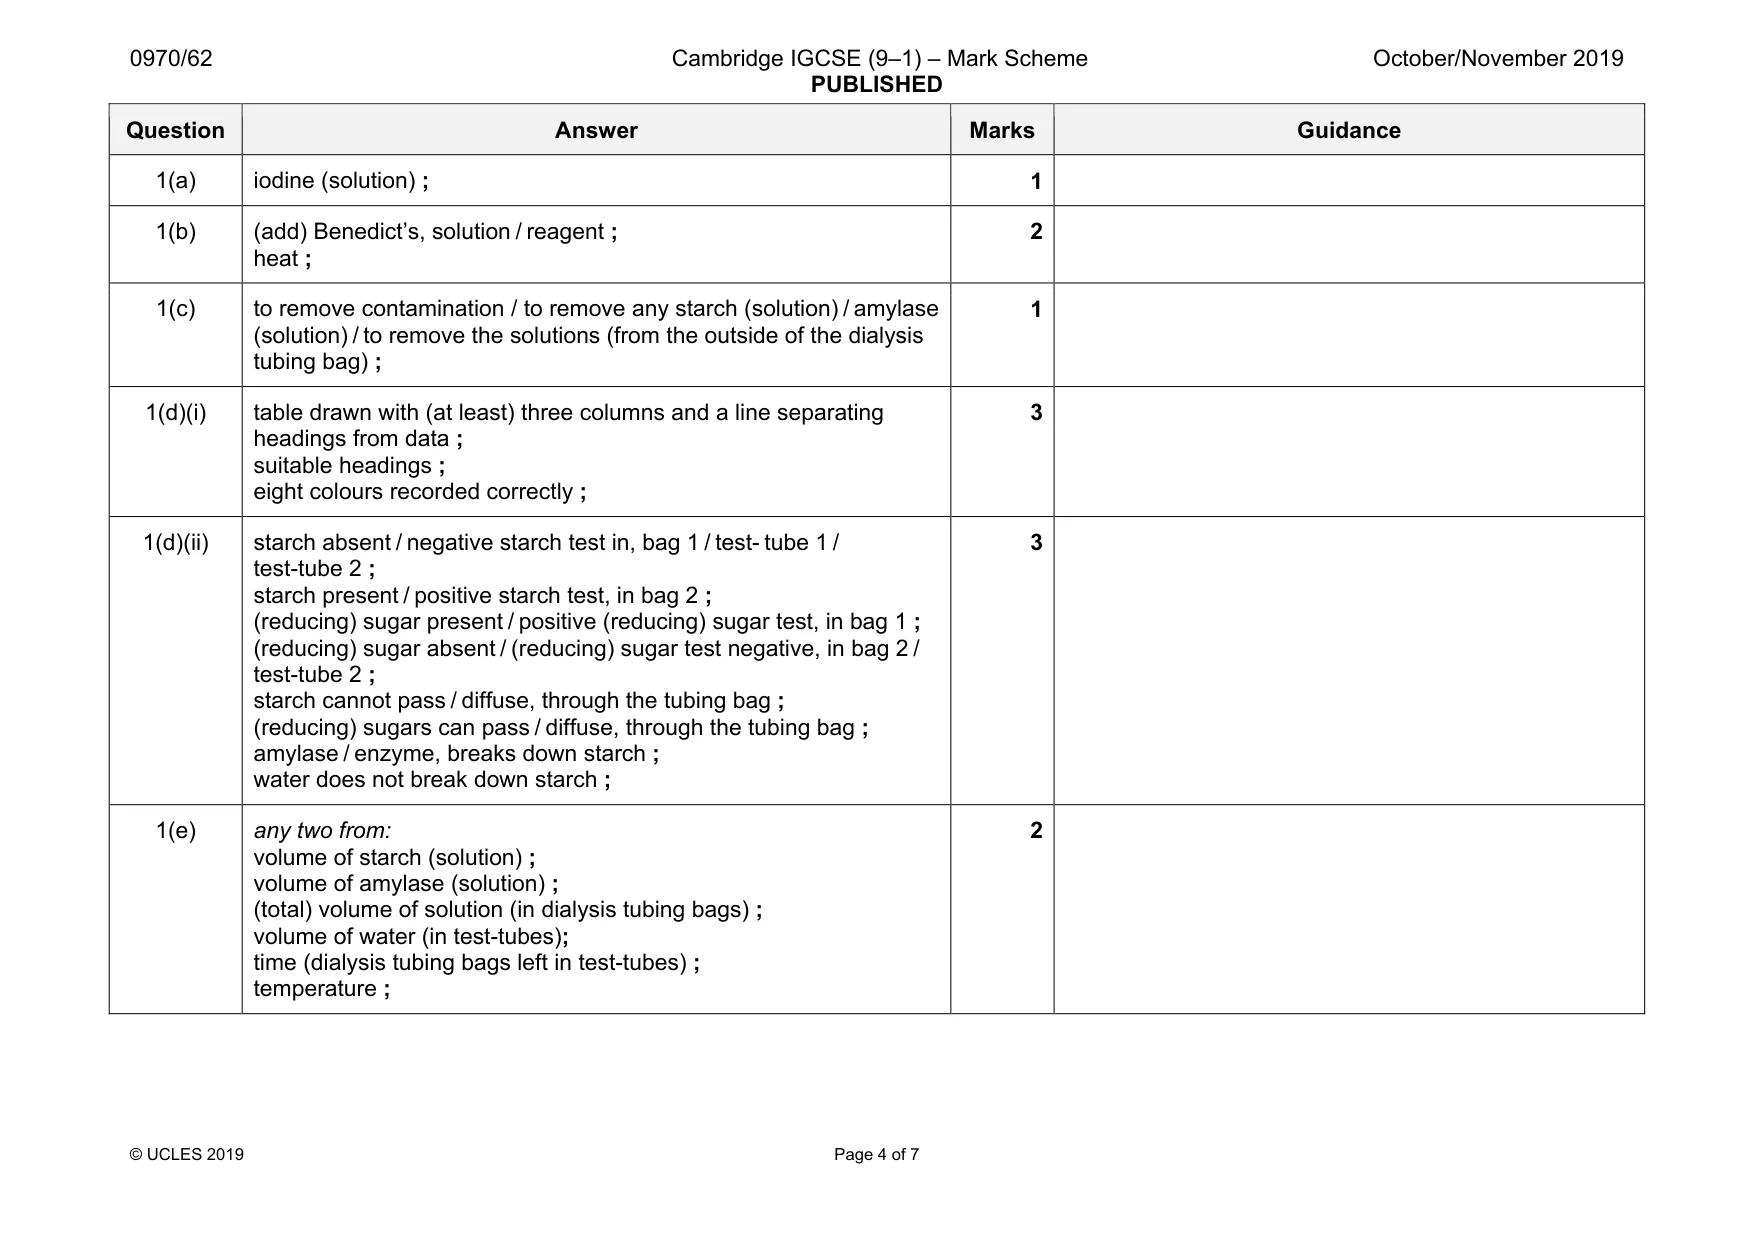
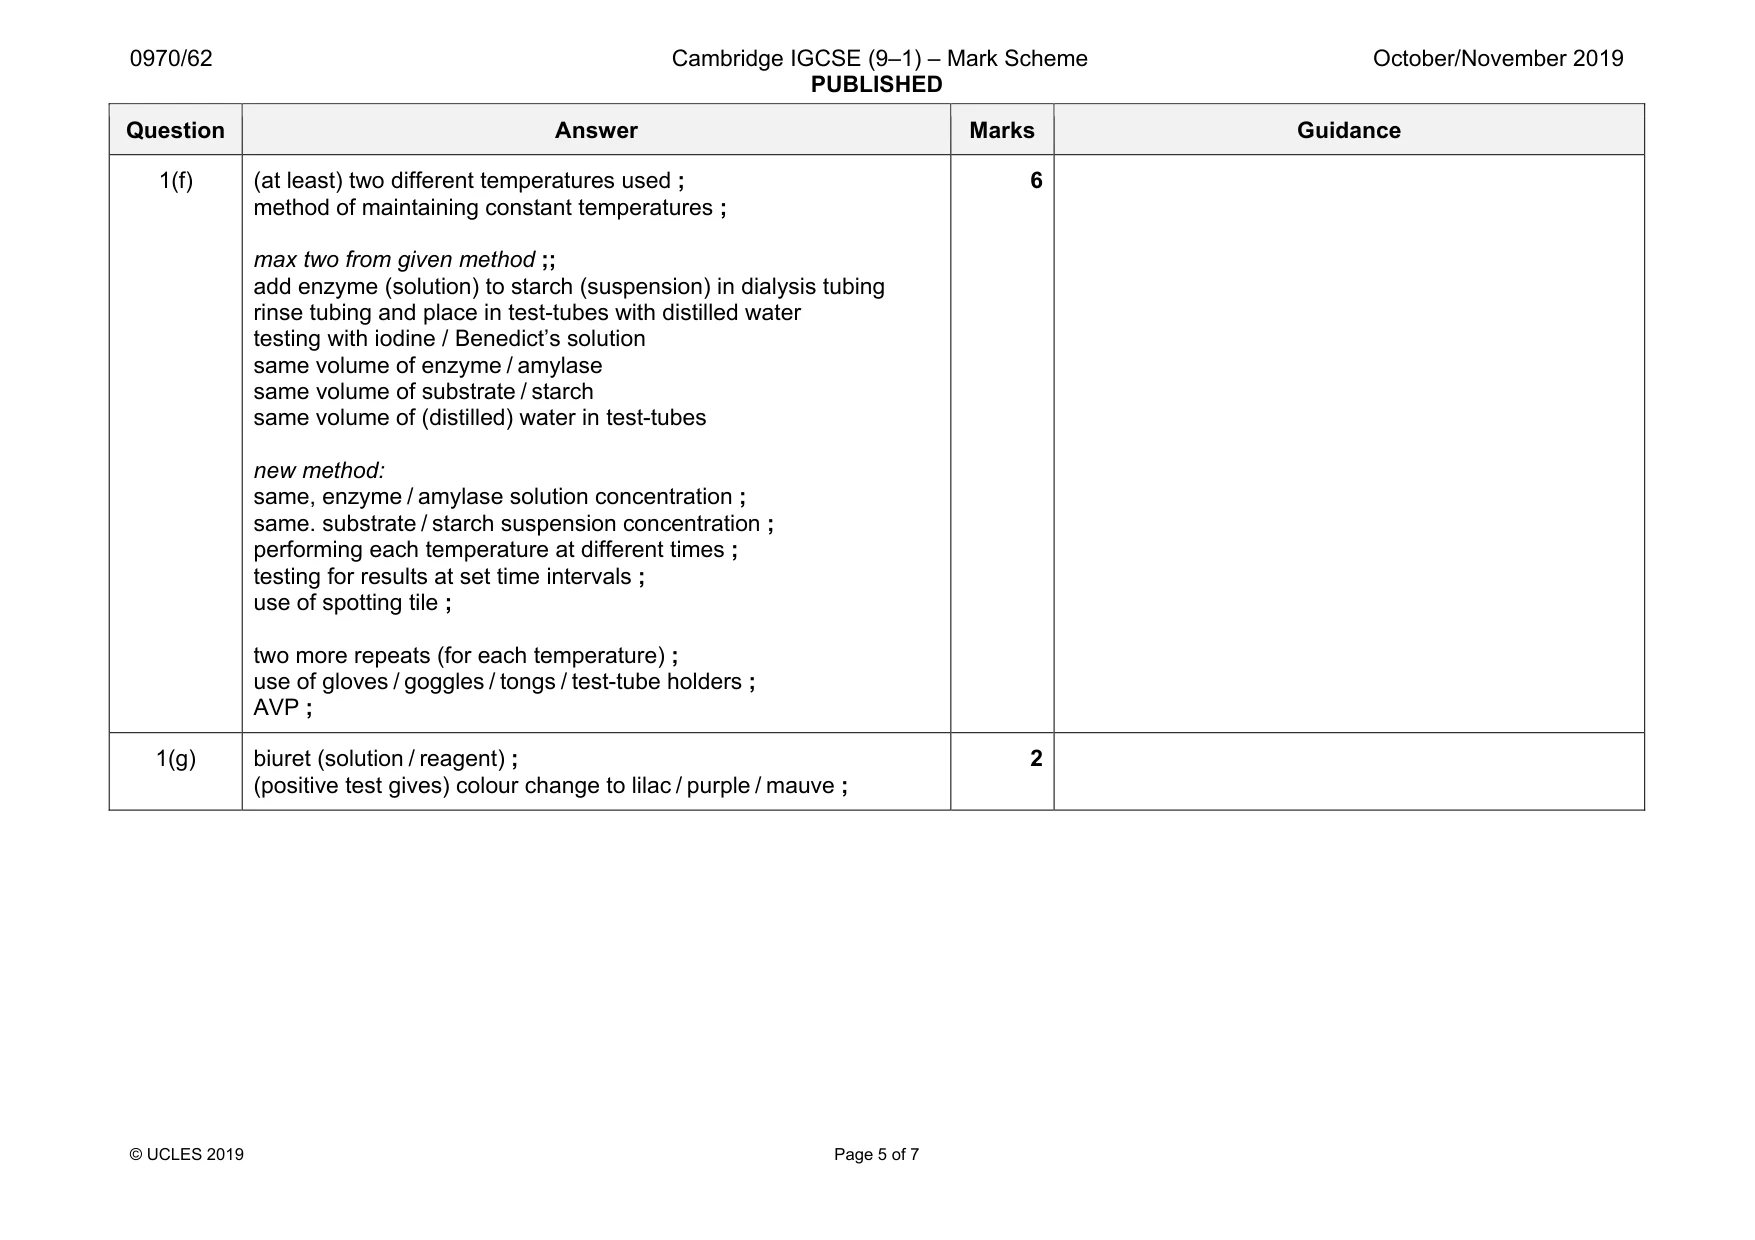
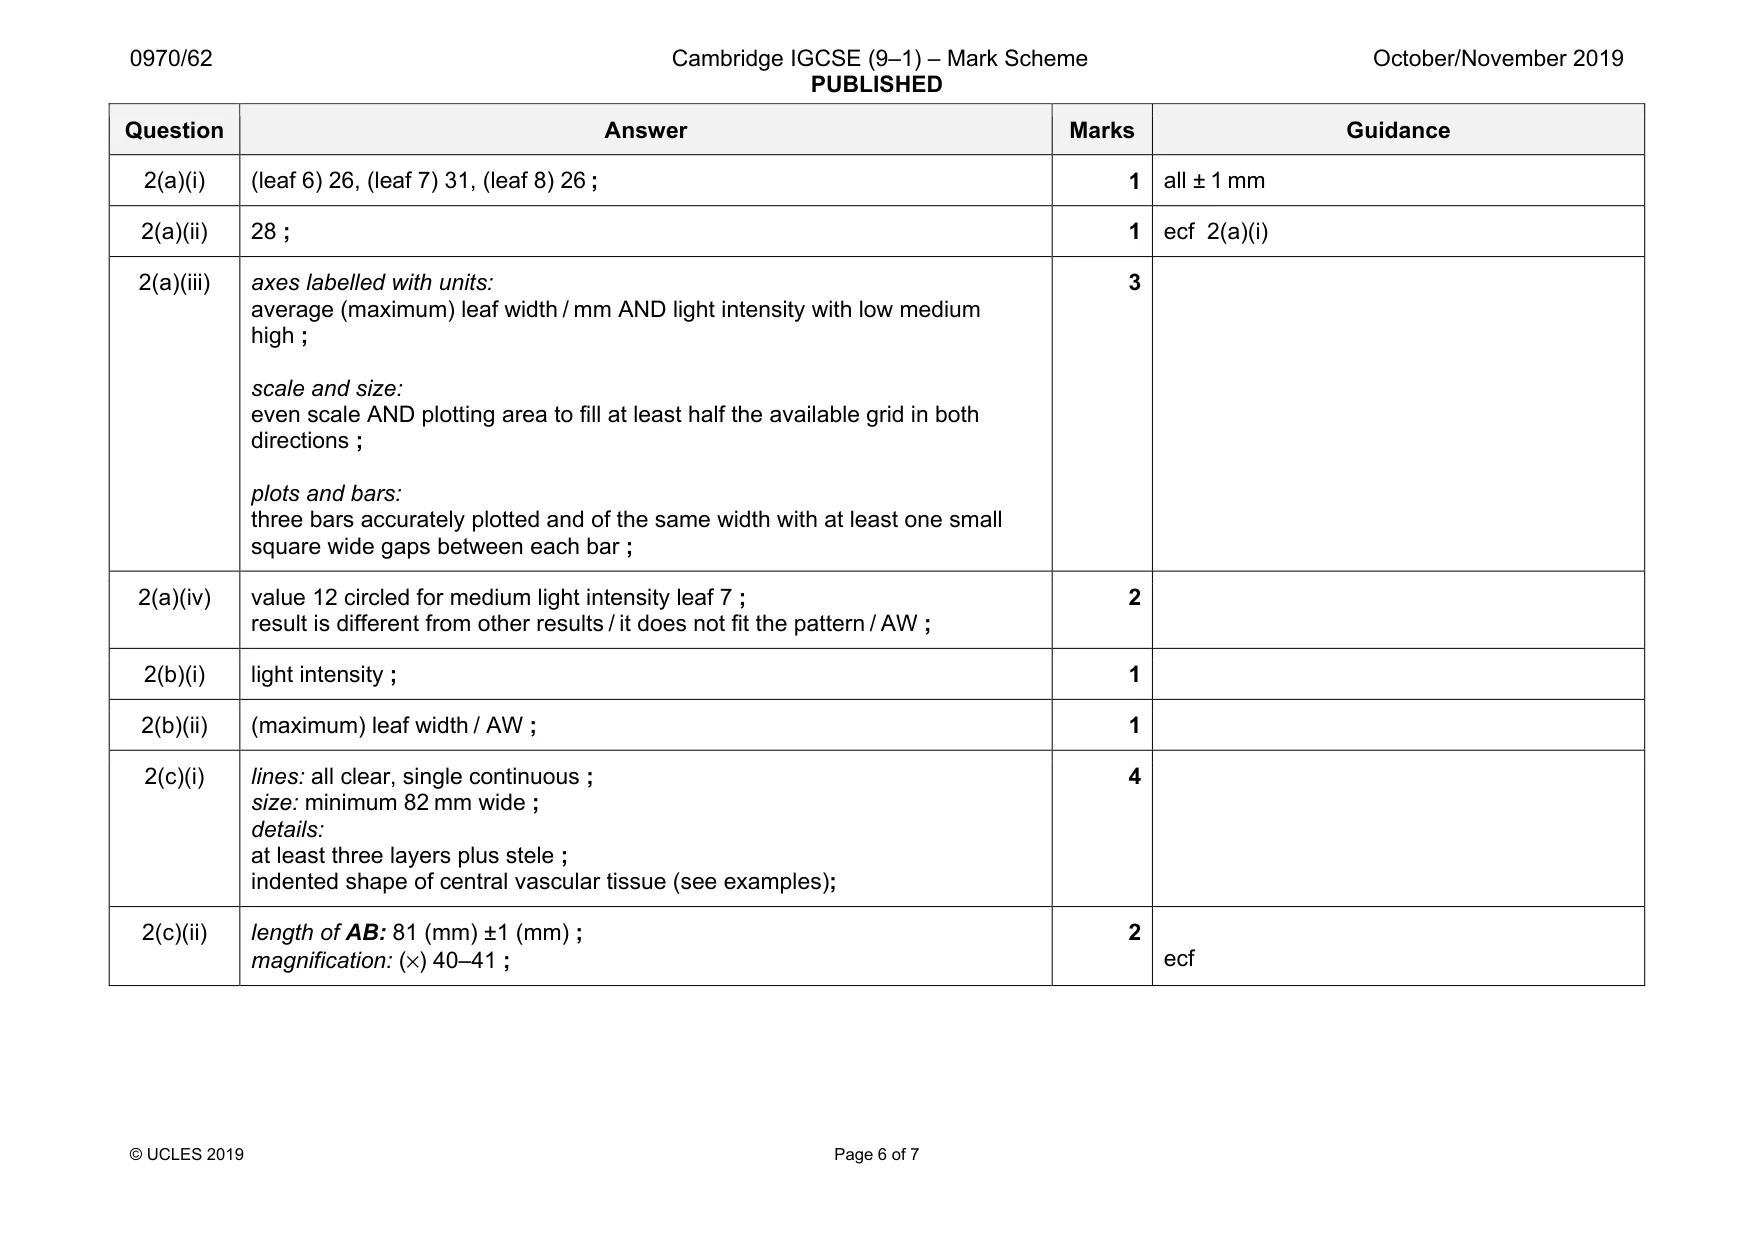
Mark scheme: 1(a) iodine (solution) ; 1 1(b) (add) Benedict’s, solution / reagent ; heat ; 2 1(c) to remove contamination / to remove any starch (solution) / amylase (solution) / to remove the solutions (from the outside of the dialysis tubing bag) ; 1 1(d)(i) table drawn with (at least) three columns and a line separating headings from data ; suitable headings ; eight colours recorded correctly ; 3 1(d)(ii) starch absent / negative starch test in, bag 1 / test- tube 1 / test-tube 2 ; starch present / positive starch test, in bag 2 ; (reducing) sugar present / positive (reducing) sugar test, in bag 1 ; (reducing) sugar absent / (reducing) sugar test negative, in bag 2 / test-tube 2 ; starch cannot pass / diffuse, through the tubing bag ; (reducing) sugars can pass / diffuse, through the tubing bag ; amylase / enzyme, breaks down starch ; water does not break down starch ; 3 1(e) any two from: volume of starch (solution) ; volume of amylase (solution) ; (total) volume of solution (in dialysis tubing bags) ; volume of water (in test-tubes); time (dialysis tubing bags left in test-tubes) ; temperature ; 2 Question Answer Marks Guidance 1(f) (at least) two different temperatures used ; method of maintaining constant temperatures ; max two from given method ;; add enzyme (solution) to starch (suspension) in dialysis tubing rinse tubing and place in test-tubes with distilled water testing with iodine / Benedict’s solution same volume of enzyme / amylase same volume of substrate / starch same volume of (distilled) water in test-tubes new method: same, enzyme / amylase solution concentration ; same. substrate / starch suspension concentration ; performing each temperature at different times ; testing for results at set time intervals ; use of spotting tile ; two more repeats (for each temperature) ; use of gloves / goggles / tongs / test-tube holders ; AVP ; 6 1(g) biuret (solution / reagent) ; (positive test gives) colour change to lilac / purple / mauve ; 2
Q2 · An investigation was performed to determine the effect of light intensity on leaf size in…
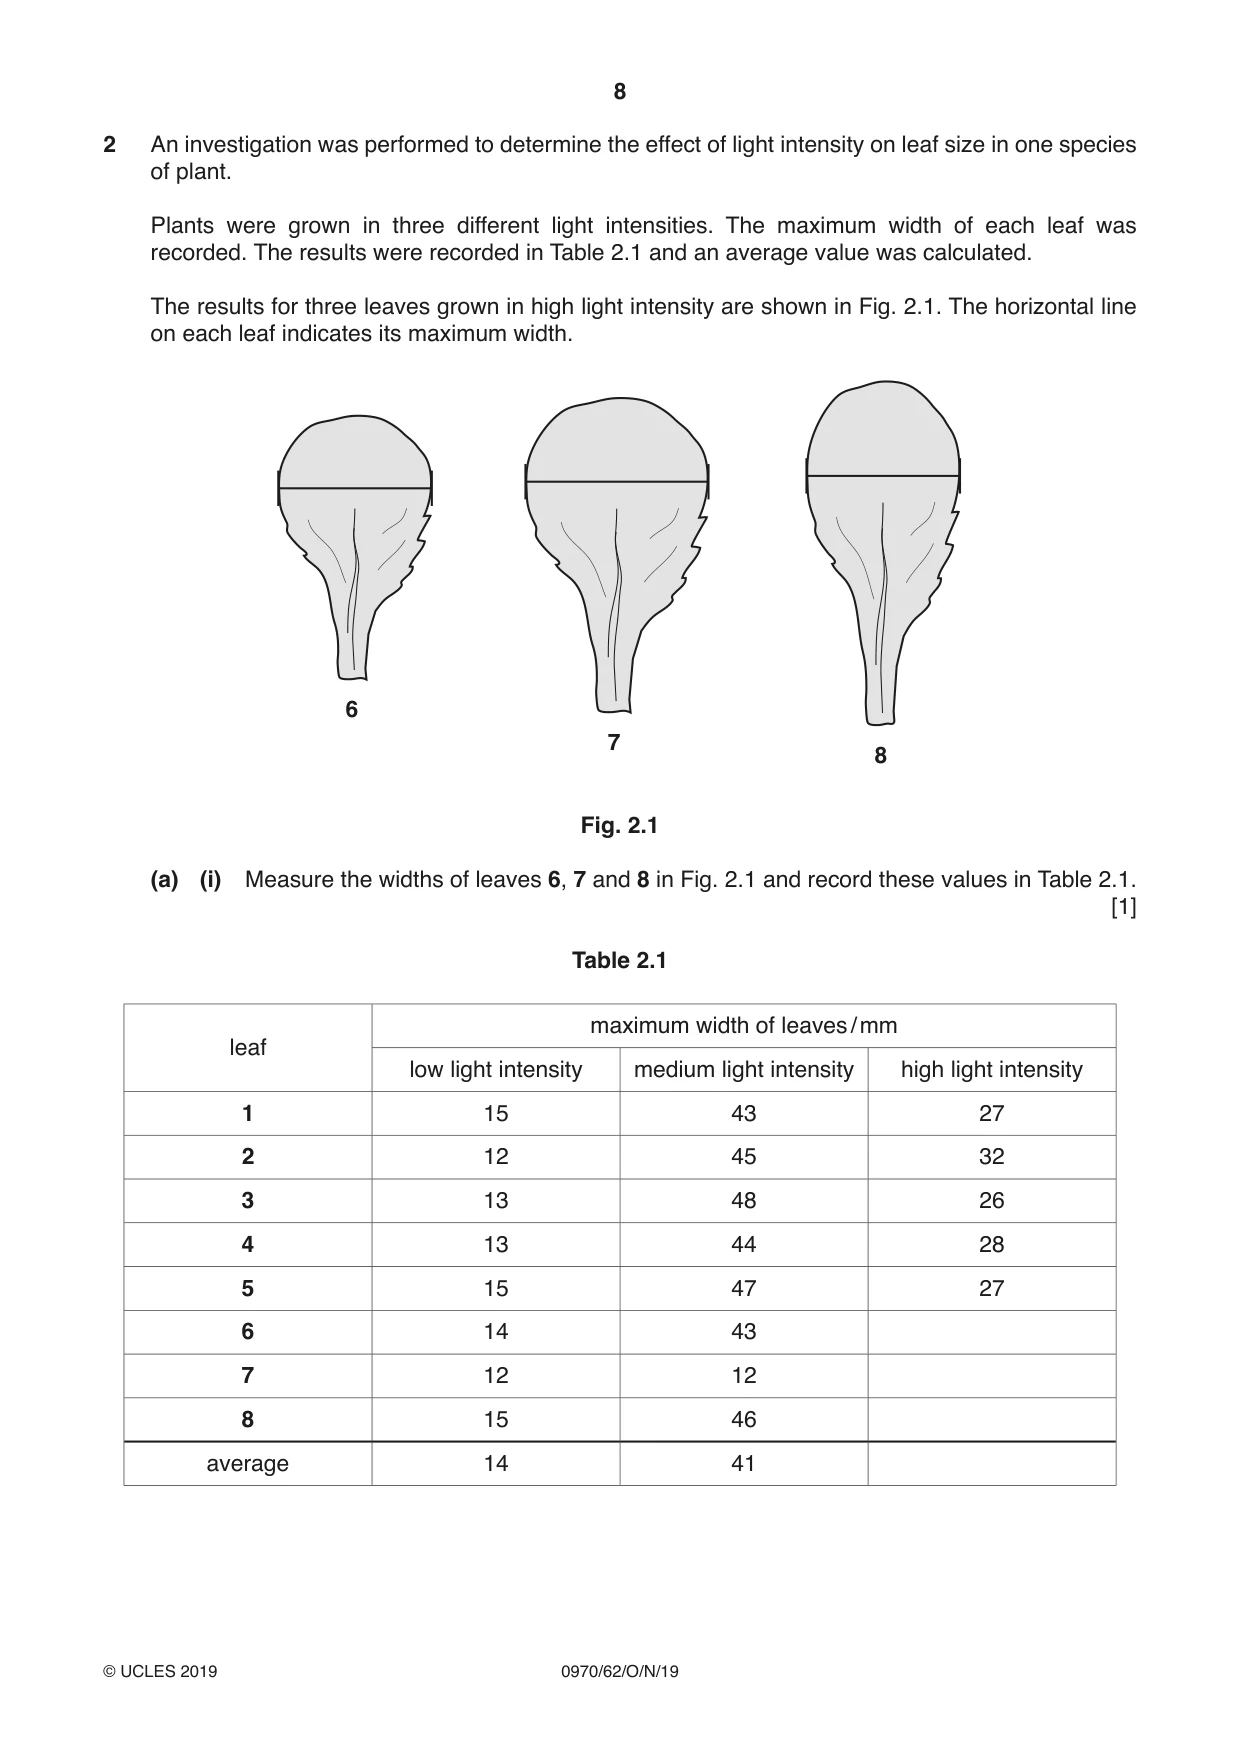
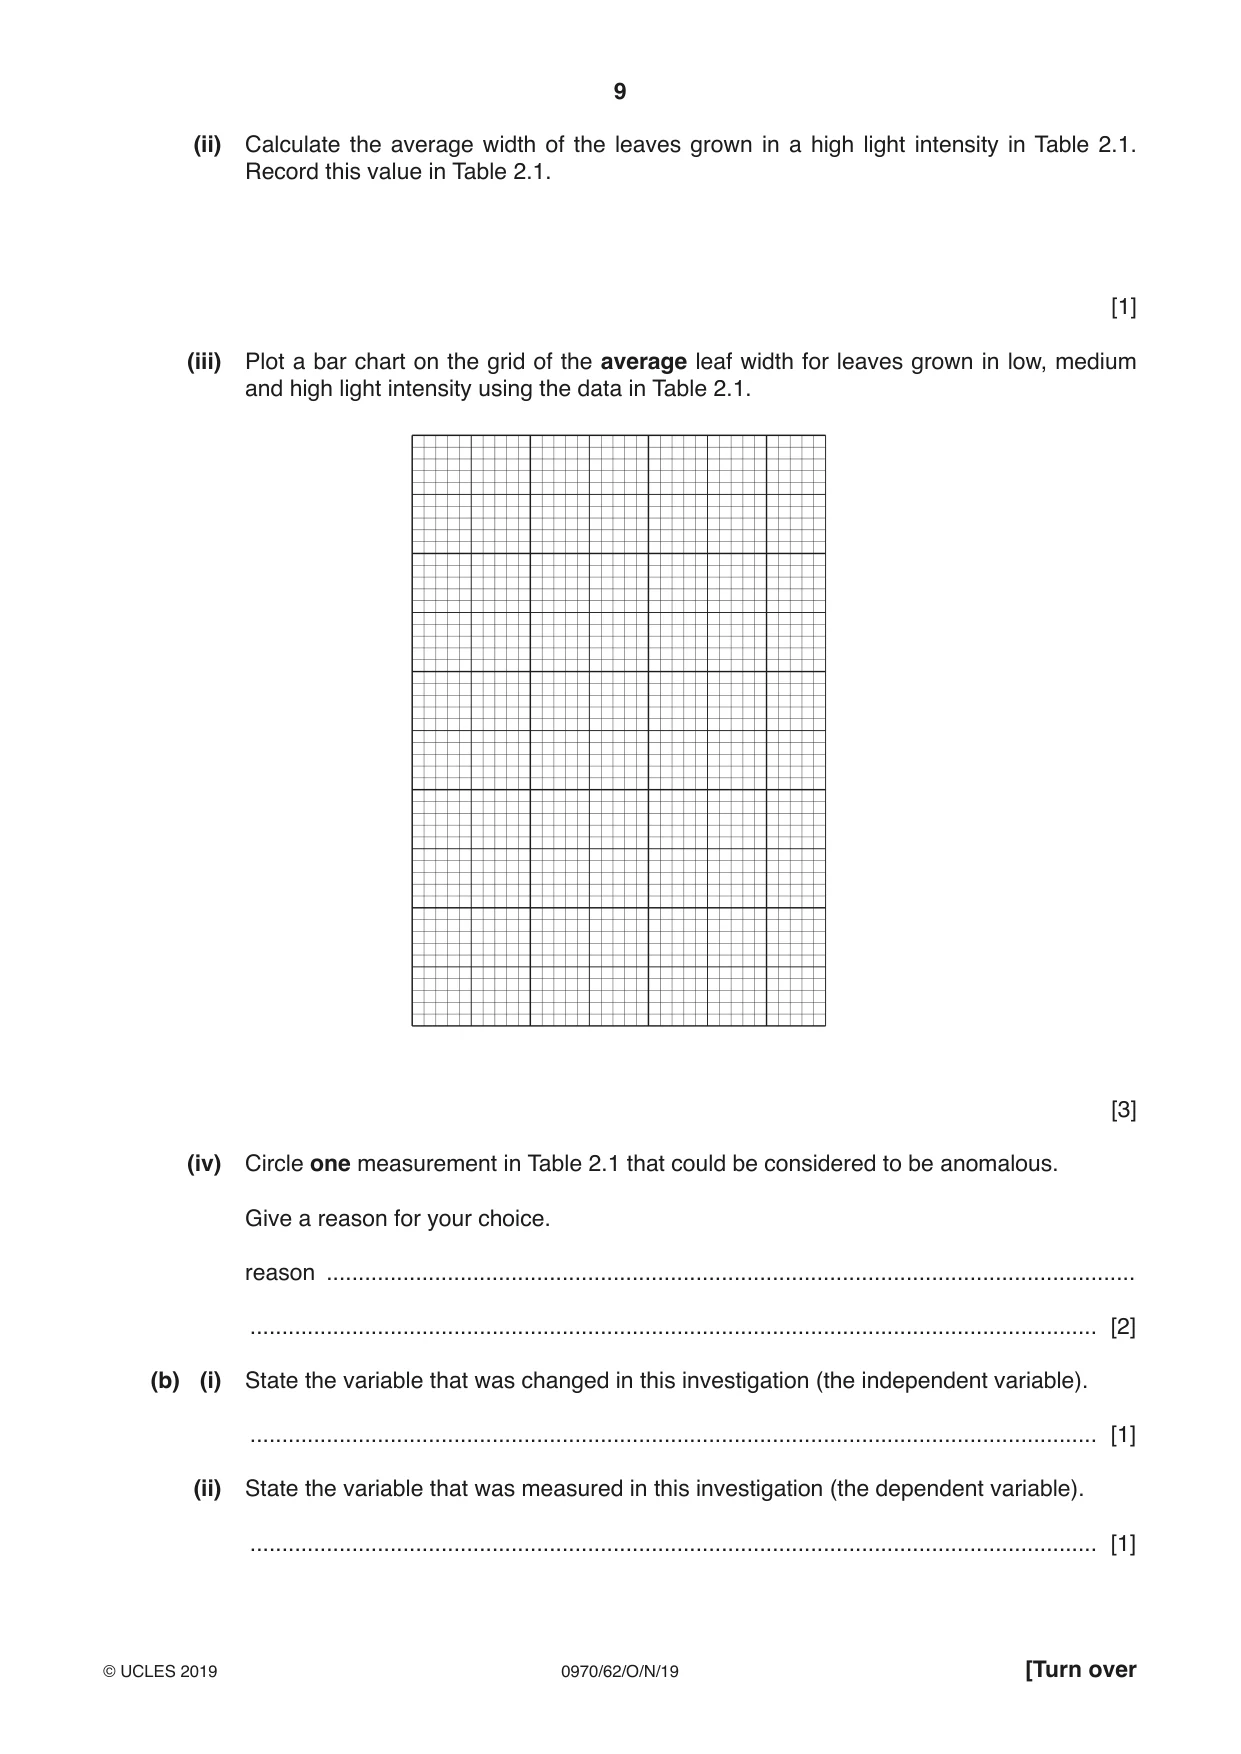
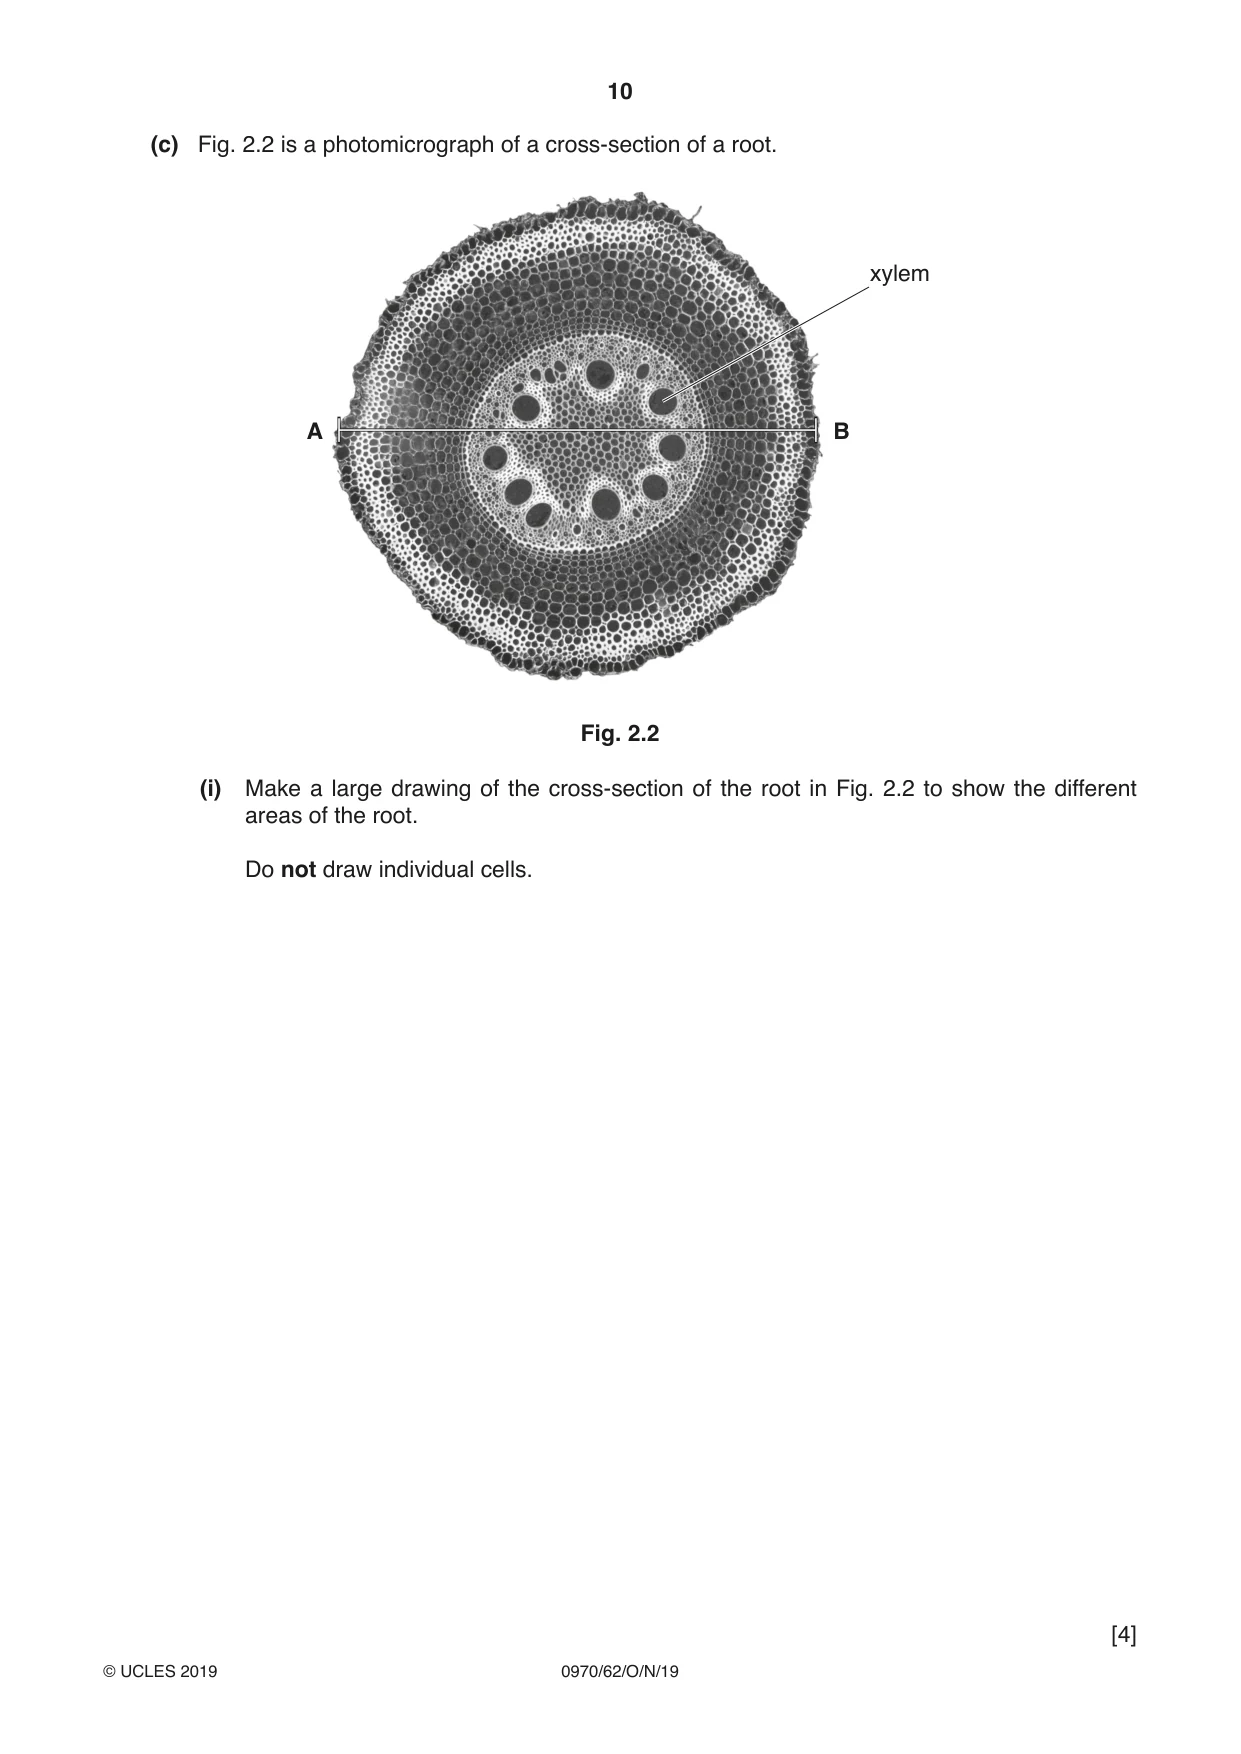
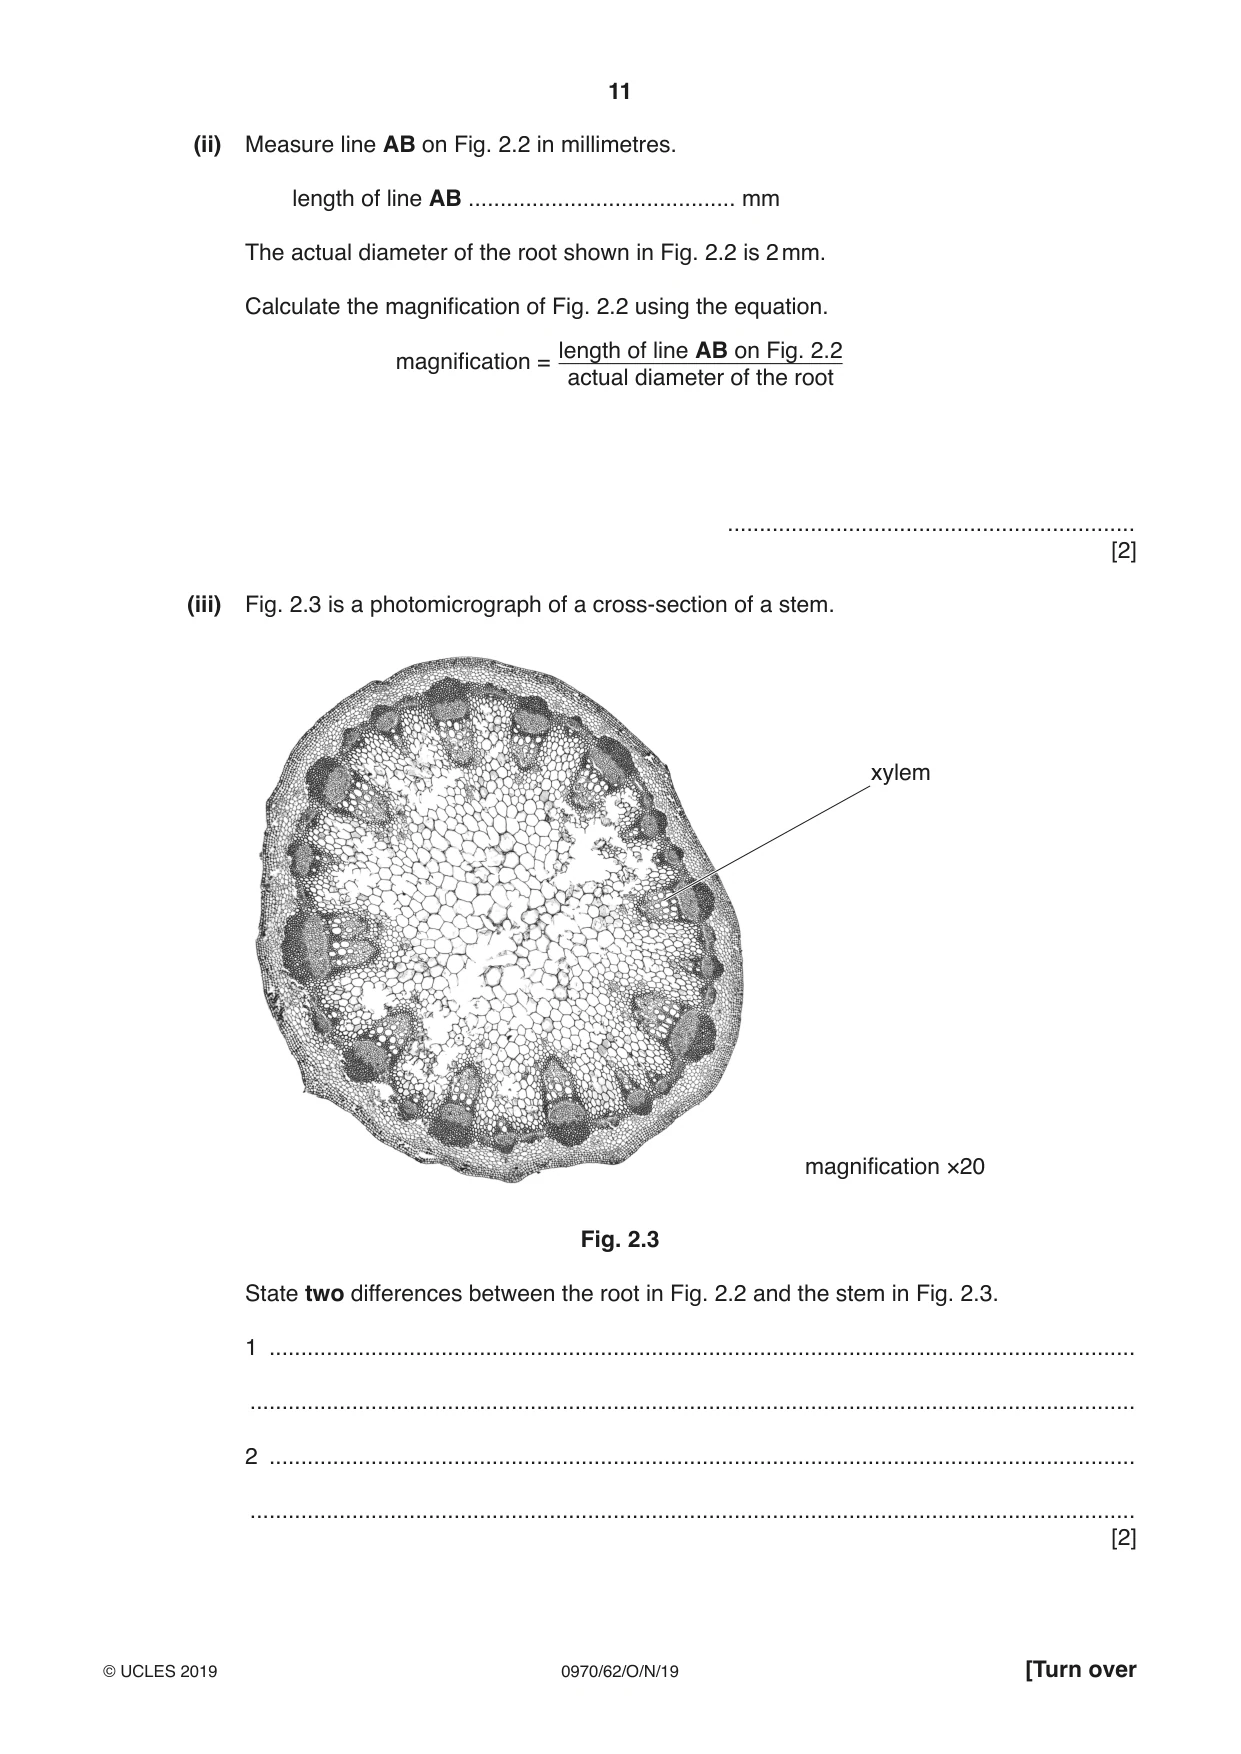
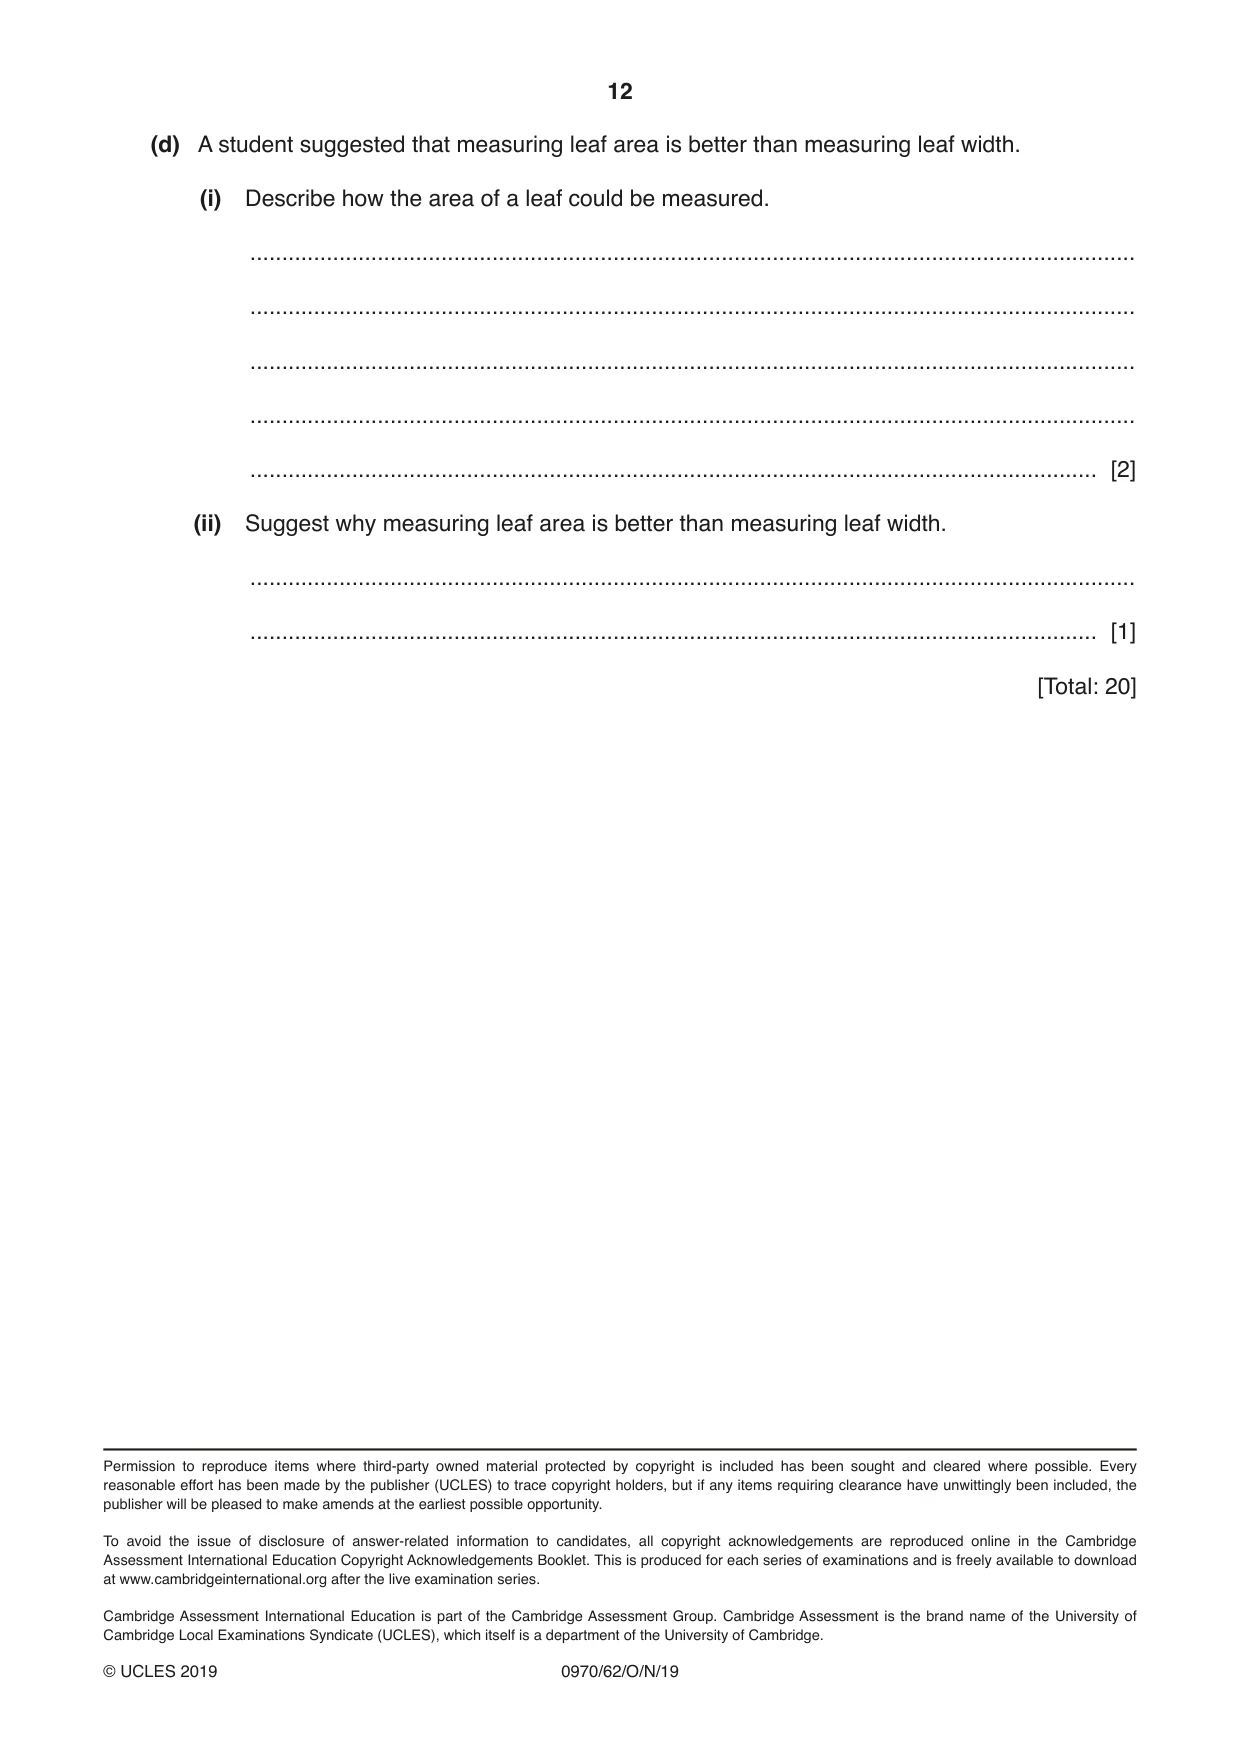
2 An investigation was performed to determine the effect of light intensity on leaf size in one species of plant. Plants were grown in three different light intensities. The maximum width of each leaf was recorded. The results were recorded in Table 2.1 and an average value was calculated. The results for three leaves grown in high light intensity are shown in Fig. 2.1. The horizontal line on each leaf indicates its maximum width. 6 7 8 Fig. 2.1 (a) (i) Measure the widths of leaves 6, 7 and 8 in Fig. 2.1 and record these values in Table 2.1. [1] Table 2.1 maximum width of leaves / mm leaf low light intensity medium light intensity high light intensity 1 15 43 27 2 12 45 32 3 13 48 26 4 13 44 28 5 15 47 27 6 14 43 7 12 12 8 15 46 average 14 41 (ii) Calculate the average width of the leaves grown in a high light intensity in Table 2.1. Record this value in Table 2.1. [1] (iii) Plot a bar chart on the grid of the average leaf width for leaves grown in low, medium and high light intensity using the data in Table 2.1. [3] (iv) Circle one measurement in Table 2.1 that could be considered to be anomalous. Give a reason for your choice. reason ............................................................................................................................... ..................................................................................................................................... [2] (b) (i) State the variable that was changed in this investigation (the independent variable). ..................................................................................................................................... [1] (ii) State the variable that was measured in this investigation (the dependent variable). ..................................................................................................................................... [1] (c) Fig. 2.2 is a photomicrograph of a cross-section of a root. xylem A B Fig. 2.2 (i) Make a large drawing of the cross-section of the root in Fig. 2.2 to show the different areas of the root. Do not draw individual cells.
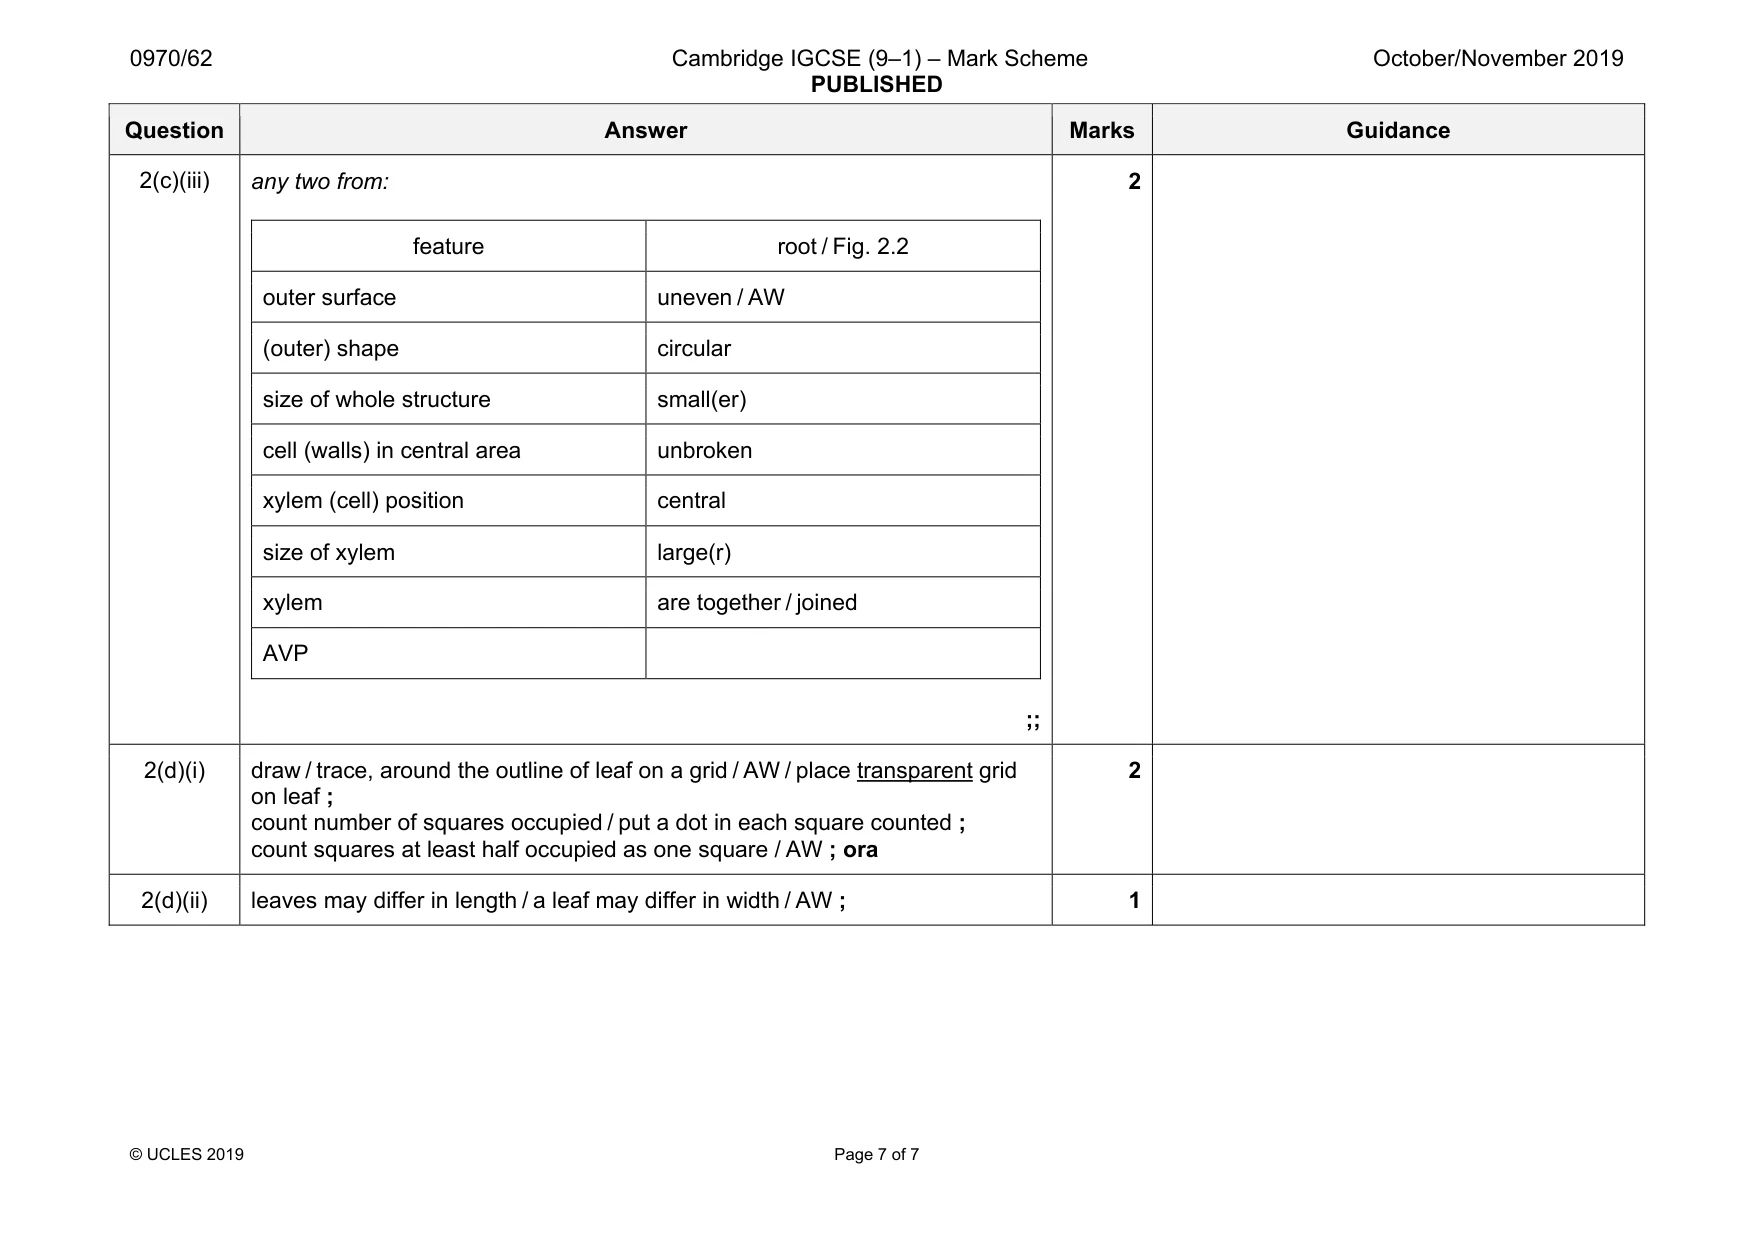
Mark scheme: 2(a)(i) (leaf 6) 26, (leaf 7) 31, (leaf 8) 26 ; 1 all ± 1 mm 2(a)(ii) 28 ; 1 ecf 2(a)(i) 2(a)(iii) axes labelled with units: average (maximum) leaf width / mm AND light intensity with low medium high ; scale and size: even scale AND plotting area to fill at least half the available grid in both directions ; plots and bars: three bars accurately plotted and of the same width with at least one small square wide gaps between each bar ; 3 2(a)(iv) value 12 circled for medium light intensity leaf 7 ; result is different from other results / it does not fit the pattern / AW ; 2 2(b)(i) light intensity ; 1 2(b)(ii) (maximum) leaf width / AW ; 1 2(c)(i) lines: all clear, single continuous ; size: minimum 82 mm wide ; details: at least three layers plus stele ; indented shape of central vascular tissue (see examples); 4 2(c)(ii) length of AB: 81 (mm) ±1 (mm) ; magnification: (×) 40–41 ; 2 ecf Question Answer Marks Guidance 2(c)(iii) any two from: feature root / Fig. 2.2 outer surface uneven / AW (outer) shape circular size of whole structure small(er) cell (walls) in central area unbroken xylem (cell) position central size of xylem large(r) xylem are together / joined AVP ;; 2 2(d)(i) draw / trace, around the outline of leaf on a grid / AW / place transparent grid on leaf ; count number of squares occupied / put a dot in each square counted ; count squares at least half occupied as one square / AW ; ora 2 2(d)(ii) leaves may differ in length / a leaf may differ in width / AW ; 1
What was in this paper
The subtopics covered by these 2 questions, and how many questions each got. Open one in a new tab to see every Cambridge question on it.
What you needed in this session
Cambridge’s own grade thresholds for 2019 Oct/Nov, Paper 6 · Variant 2. A higher threshold means an easier paper — the bar moves with how the cohort did.