Cambridge IGCSE Biology (9-1) 0970 — 2019 May/June Paper 6 · Variant 2
0970/62/M/J/19 · 2 questions · 40 marks · ≈45 min
The question paper and its mark scheme, free to read here and free to download. This is Cambridge’s own paper, exactly as it was sat.
Question paper12 pages

Mark scheme7 pages
Answers below. Sit the paper first if you are practising.
Questions as text
Q1 · Anaerobic respiration in yeast causes the blue dye, methylene blue, to become colourless
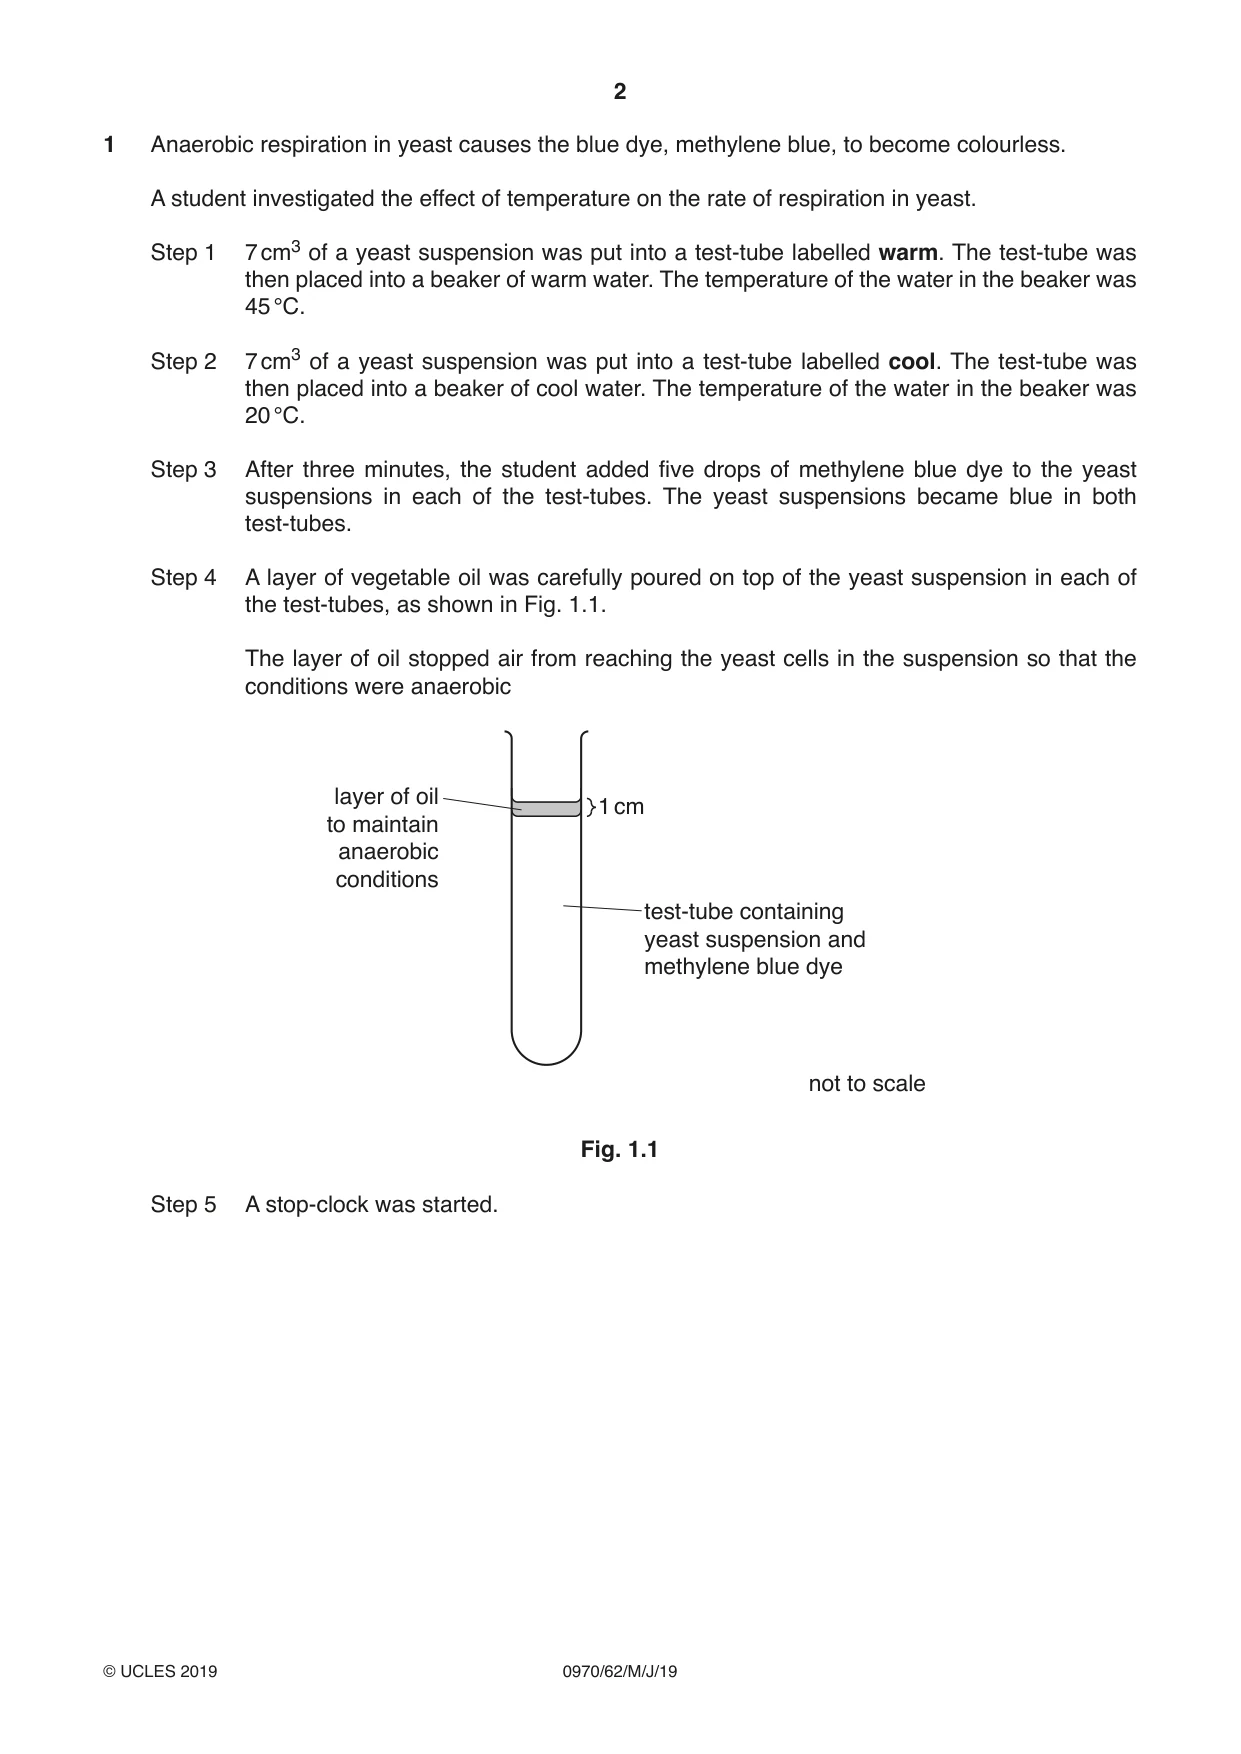
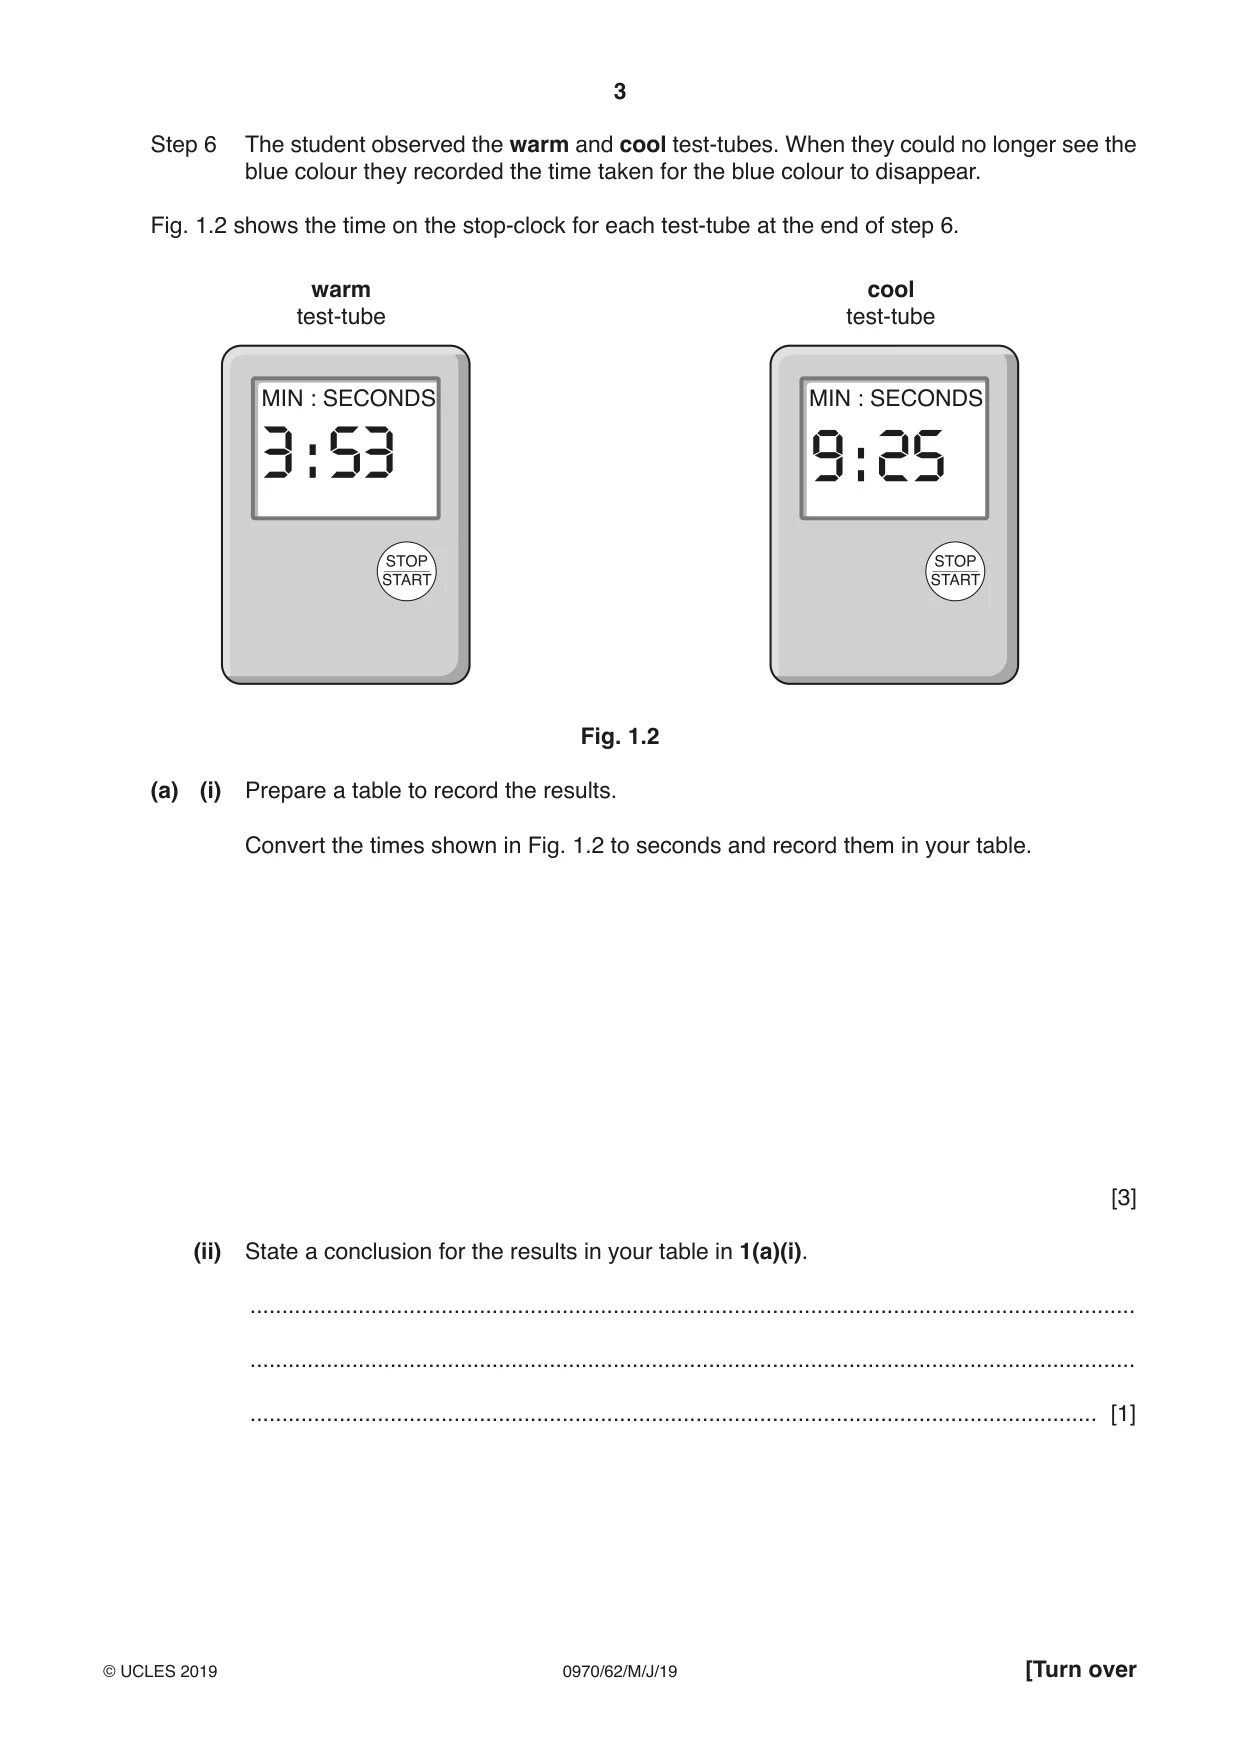
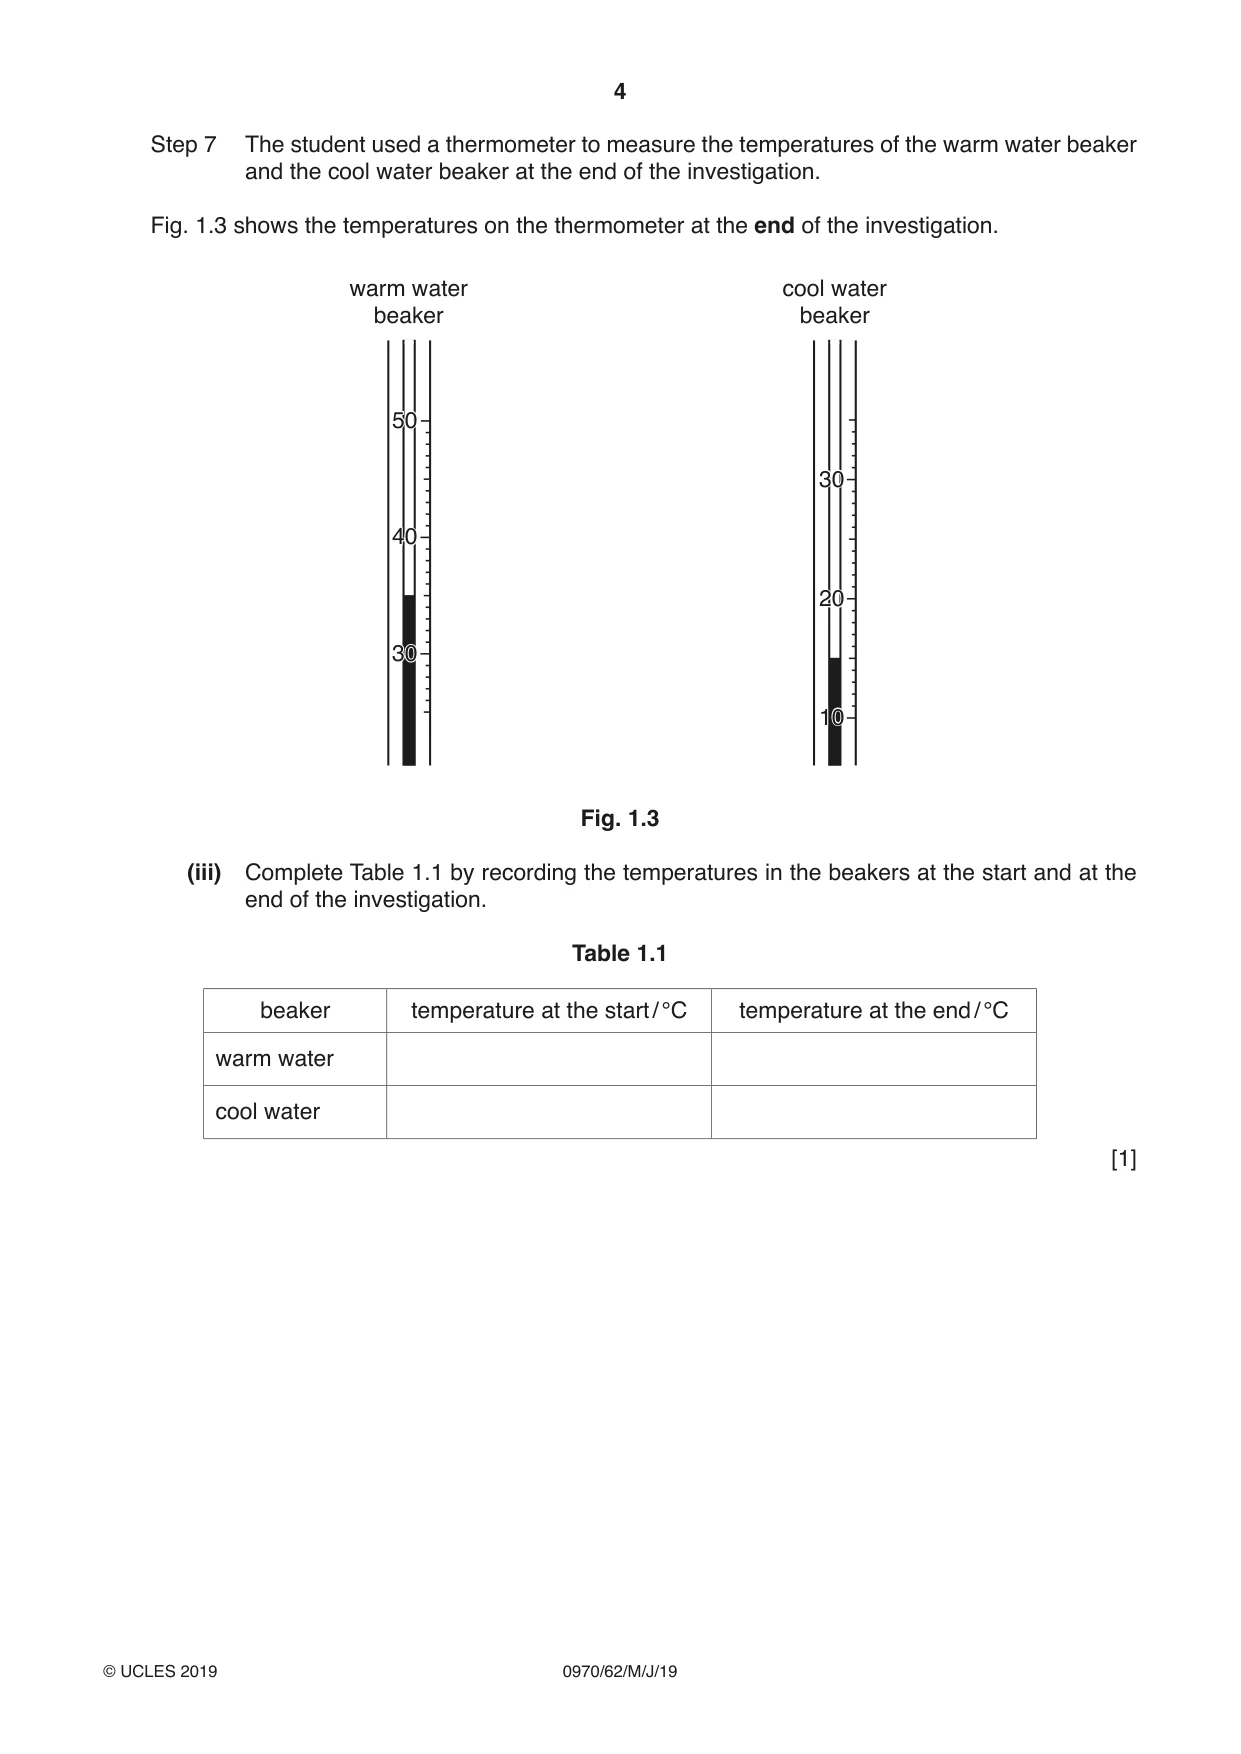
1 Anaerobic respiration in yeast causes the blue dye, methylene blue, to become colourless. A student investigated the effect of temperature on the rate of respiration in yeast. Step 1 7 cm3 of a yeast suspension was put into a test-tube labelled warm. The test-tube was then placed into a beaker of warm water. The temperature of the water in the beaker was 45 °C. Step 2 7 cm3 of a yeast suspension was put into a test-tube labelled cool. The test-tube was then placed into a beaker of cool water. The temperature of the water in the beaker was 20 °C. Step 3 After three minutes, the student added five drops of methylene blue dye to the yeast suspensions in each of the test-tubes. The yeast suspensions became blue in both test-tubes. Step 4 A layer of vegetable oil was carefully poured on top of the yeast suspension in each of the test-tubes, as shown in Fig. 1.1. The layer of oil stopped air from reaching the yeast cells in the suspension so that the conditions were anaerobic layer of oil 1 cm to maintain anaerobic conditions test-tube containing yeast suspension and methylene blue dye not to scale Fig. 1.1 Step 5 A stop-clock was started. Step 6 The student observed the warm and cool test-tubes. When they could no longer see the blue colour they recorded the time taken for the blue colour to disappear. Fig. 1.2 shows the time on the stop-clock for each test-tube at the end of step 6. warm cool test-tube test-tube MIN : SECONDS MIN : SECONDS Fig. 1.2 (a) (i) Prepare a table to record the results. Convert the times shown in Fig. 1.2 to seconds and record them in your table. [3] (ii) State a conclusion for the results in your table in 1(a)(i). ........................................................................................................................................... ........................................................................................................................................... ..................................................................................................................................... [1] Step 7 The student used a thermometer to measure the temperatures of the warm water beaker and the cool water beaker at the end of the investigation. Fig. 1.3 shows the temperatures on the thermometer at the end of the investigation. warm water cool water beaker beaker 5050 3030 4040 2020 3030 1010 Fig. 1.3 (iii) Complete Table 1.1 by recording the temperatures in the beakers at the start and at the end of the investigation. Table 1.1 beaker temperature at the start / °C temperature at the end / °C warm water cool water [1] (iv) Identify the variable that was changed (independent variable) in this investigation. ..................................................................................................................................... [1] (v) Identify two variables that were kept constant in this investigation. 1 ........................................................................................................................................ 2 ........................................................................................................................................ [2] (b) (i) Identify one possible source of error in step 6 and suggest an improvement for this error. error ................................................................................................................................... ........................................................................................................................................... improvement ..................................................................................................................... ........................................................................................................................................... ........................................................................................................................................... [2] (ii) The data you have recorded in Table 1.1 may indicate that there is a source of error with the method used in this investigation. Identify the possible error and suggest an improvement to the method to reduce the effect of this error. error ................................................................................................................................... ........................................................................................................................................... improvement ..................................................................................................................... ........................................................................................................................................... ........................................................................................................................................... [2] (c) Anaerobic respiration in yeast produces a gas. State the name of an indicator which could be used to show that the gas is carbon dioxide and state the expected result. indicator .................................................................................................................................... expected result ......................................................................................................................... [2] (d) Anaerobic respiration in yeast cells also produces ethanol. In high concentrations ethanol can slow down the rate of respiration. Plan an investigation to determine the effect of different concentrations of ethanol on the rate of respiration in yeast cells. ................................................................................................................................................... ................................................................................................................................................... ................................................................................................................................................... ................................................................................................................................................... ................................................................................................................................................... ................................................................................................................................................... ................................................................................................................................................... ................................................................................................................................................... ................................................................................................................................................... ................................................................................................................................................... ................................................................................................................................................... ................................................................................................................................................... ............................................................................................................................................. [6] [Total: 20]
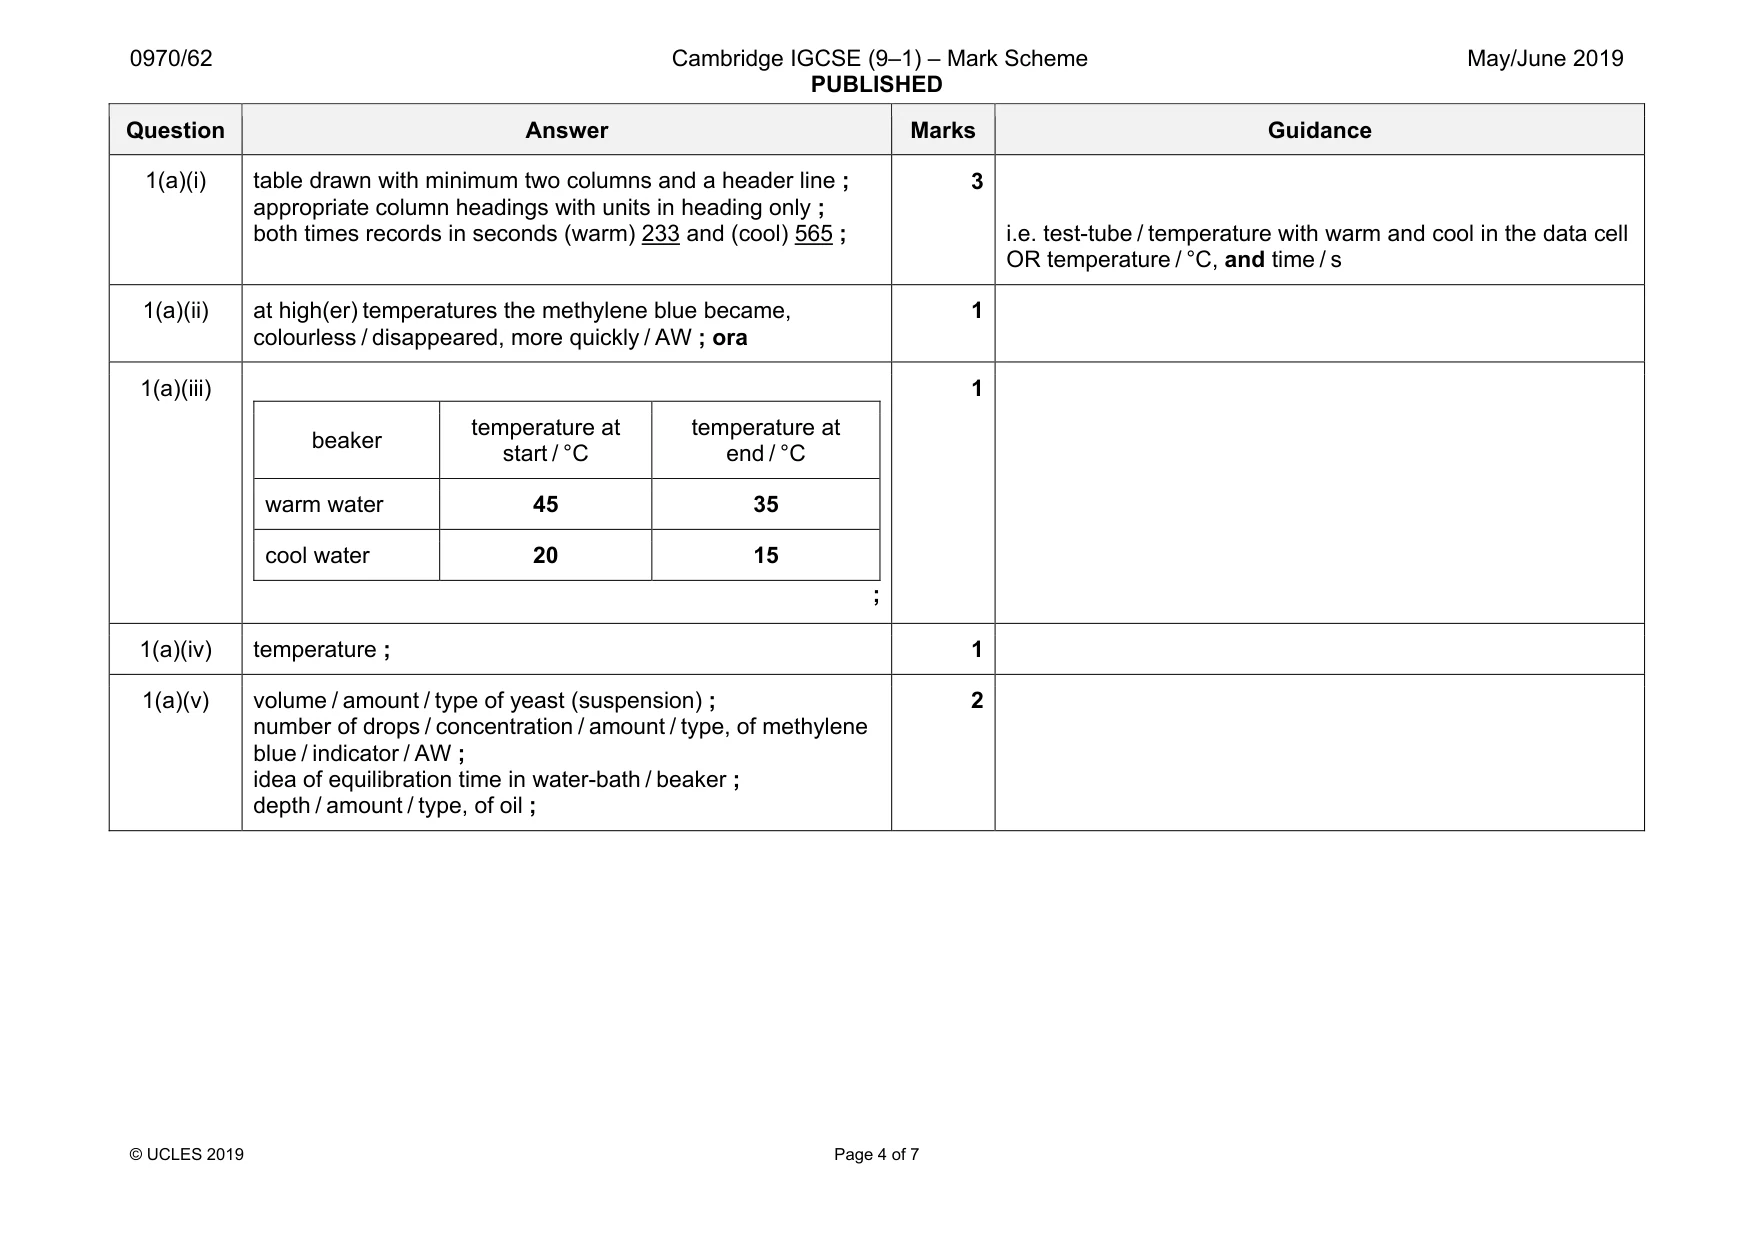
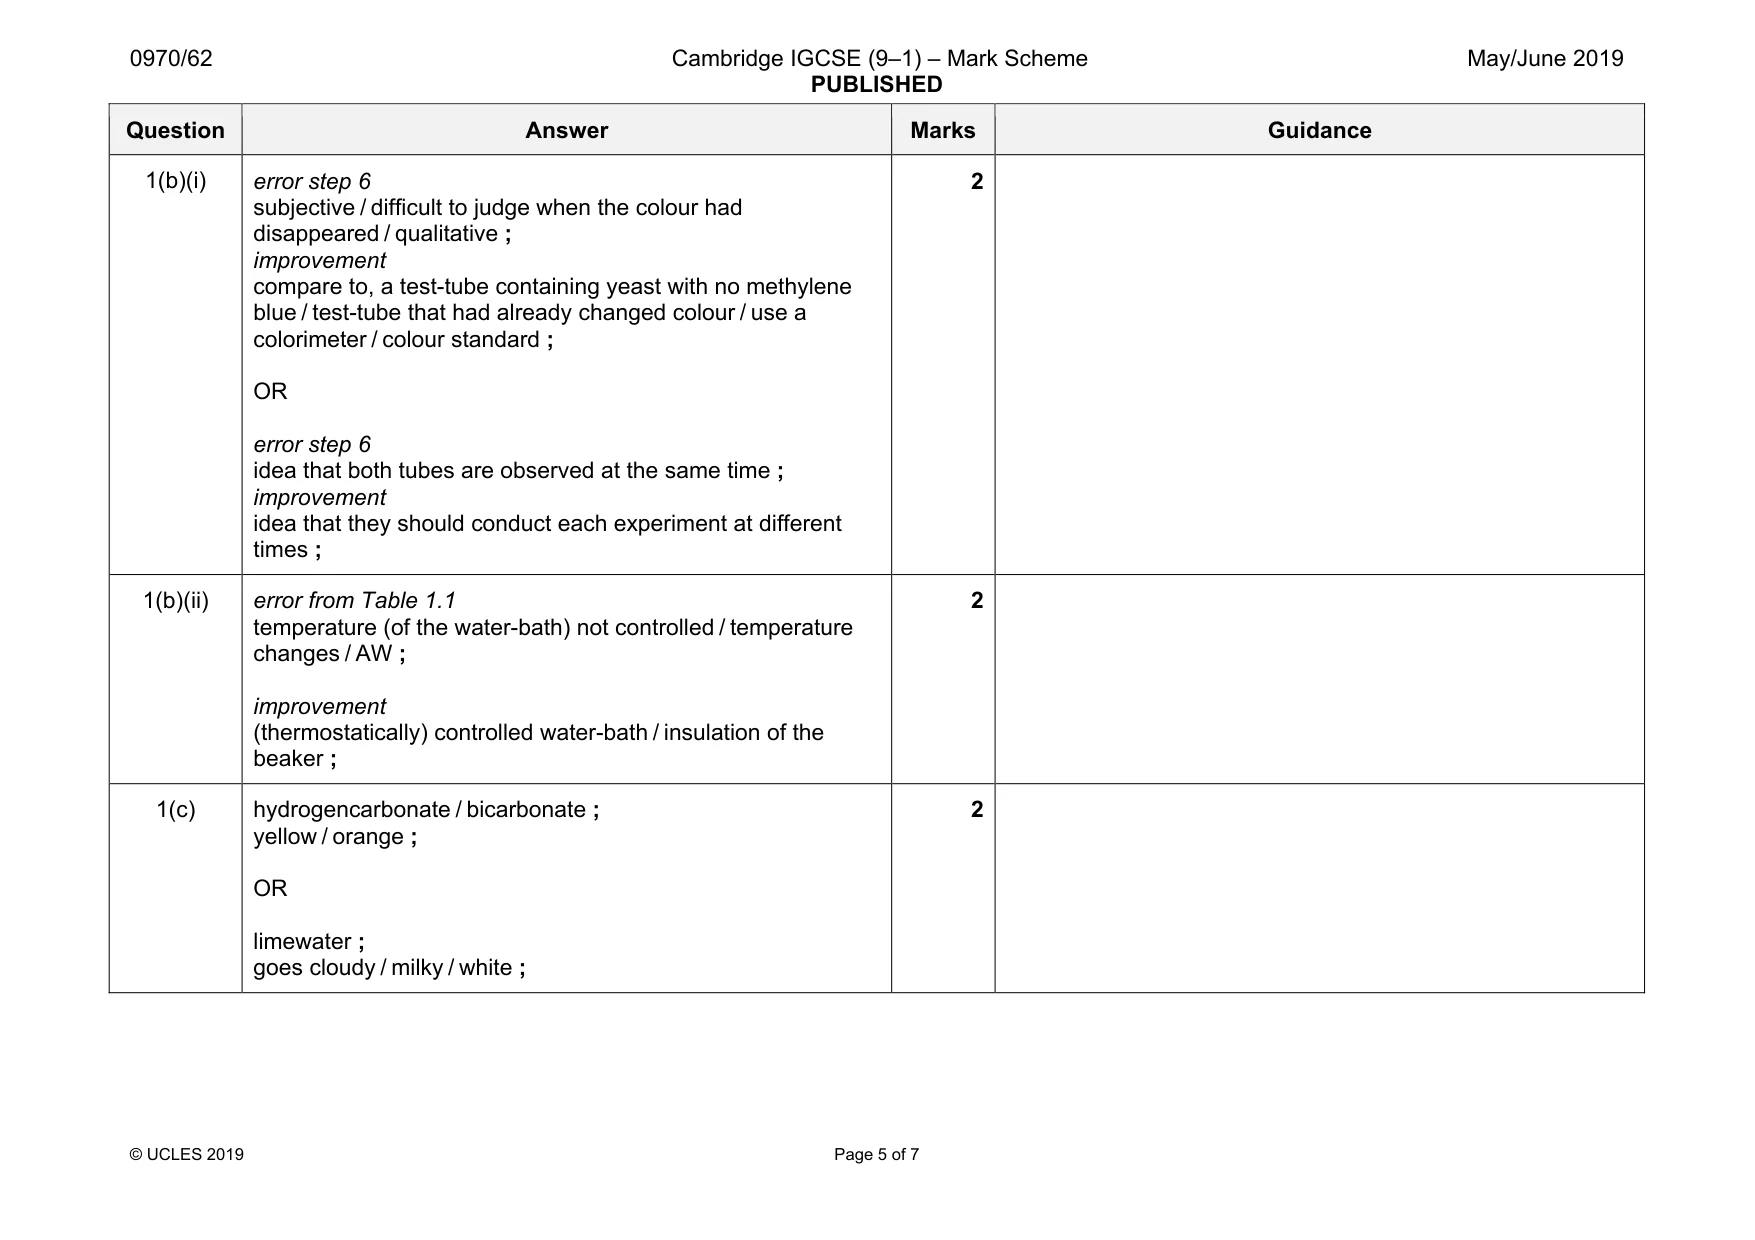
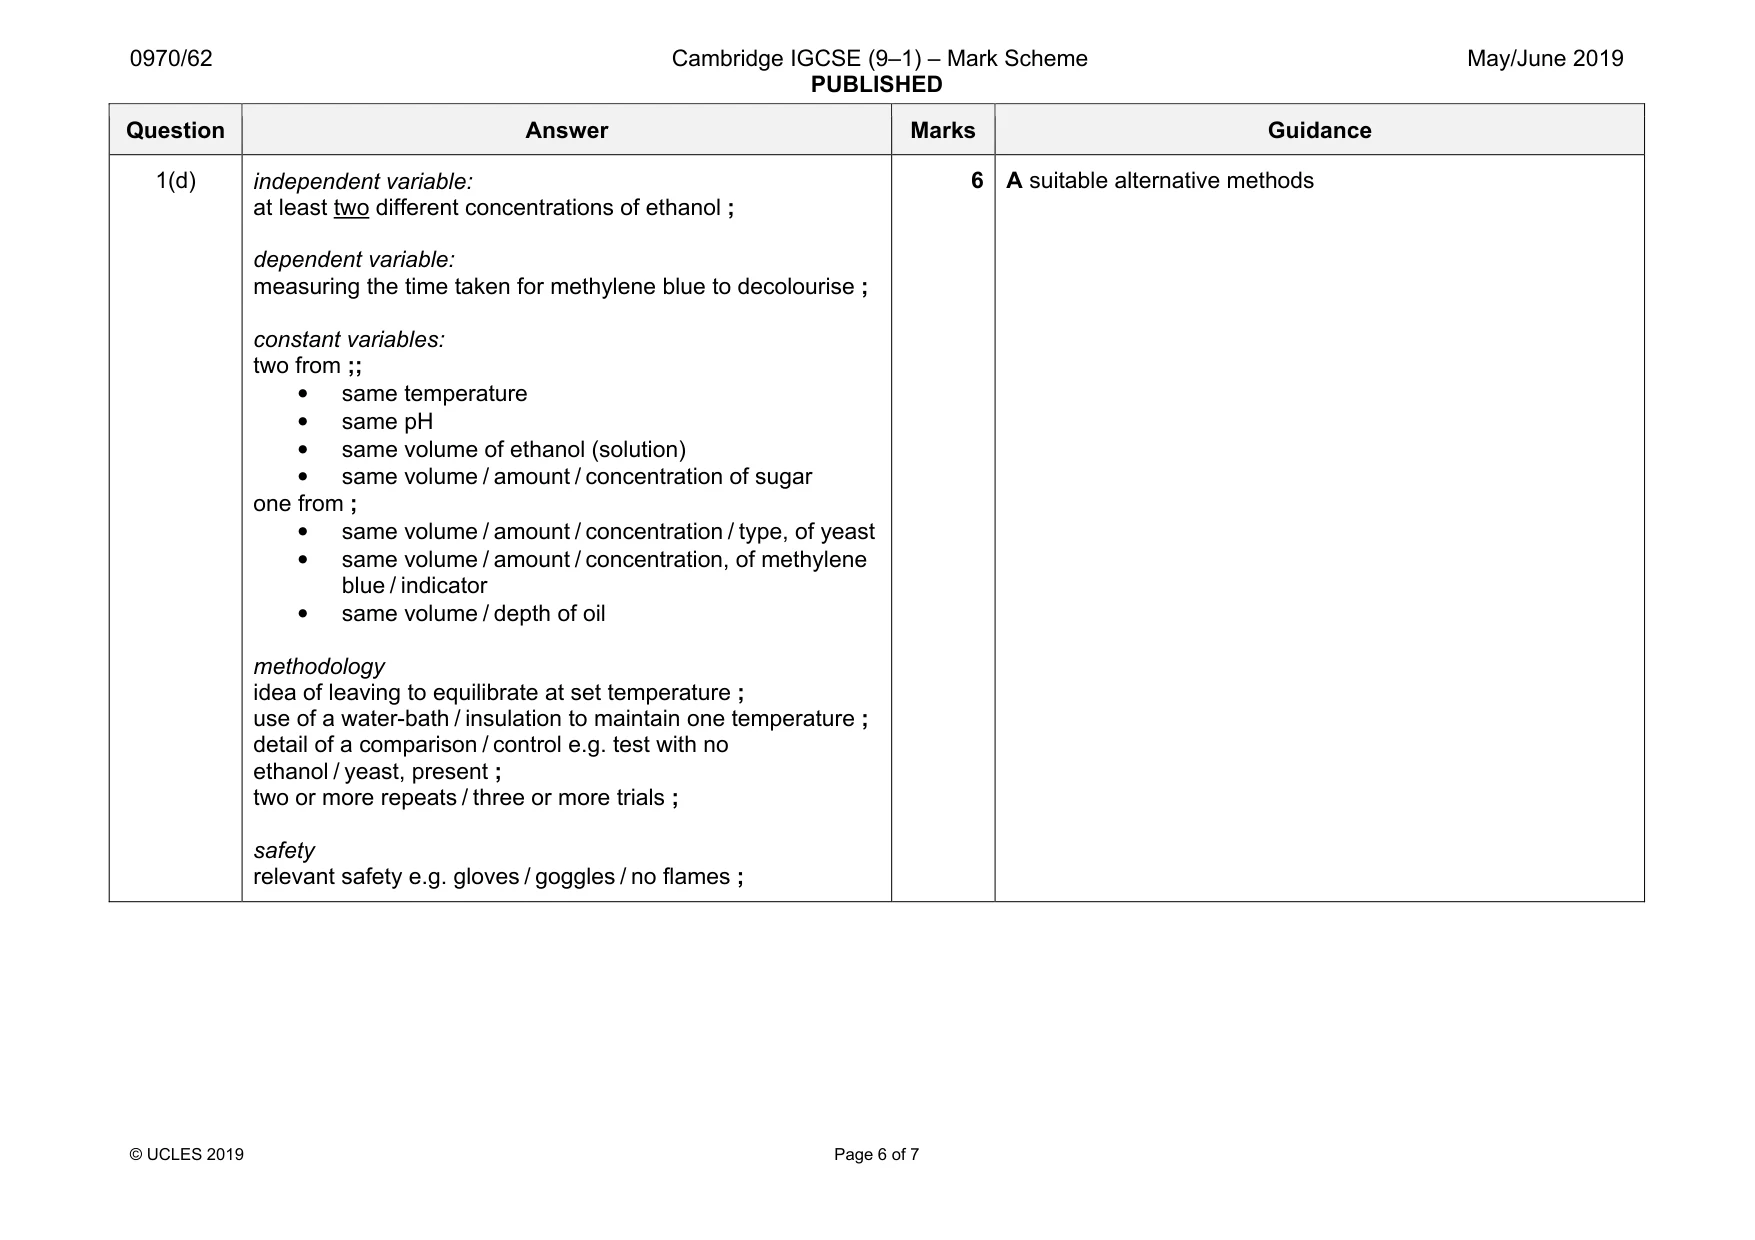
Mark scheme: 1(a)(i) table drawn with minimum two columns and a header line ; appropriate column headings with units in heading only ; both times records in seconds (warm) 233 and (cool) 565 ; i.e. test-tube / temperature with warm and cool in the data cell OR temperature / °C, and time / s 1(a)(ii) at high(er) temperatures the methylene blue became, colourless / disappeared, more quickly / AW ; ora 1 1(a)(iii) beaker temperature at start / °C temperature at end / °C warm water 45 35 cool water 20 15 ; 1 1(a)(iv) temperature ; 1 1(a)(v) volume / amount / type of yeast (suspension) ; number of drops / concentration / amount / type, of methylene blue / indicator / AW ; idea of equilibration time in water-bath / beaker ; depth / amount / type, of oil ; 2 Question Answer Marks Guidance 1(b)(i) error step 6 subjective / difficult to judge when the colour had disappeared / qualitative ; improvement compare to, a test-tube containing yeast with no methylene blue / test-tube that had already changed colour / use a colorimeter / colour standard ; OR error step 6 idea that both tubes are observed at the same time ; improvement idea that they should conduct each experiment at different times ; 2 1(b)(ii) error from Table 1.1 temperature (of the water-bath) not controlled / temperature changes / AW ; improvement (thermostatically) controlled water-bath / insulation of the beaker ; 2 1(c) hydrogencarbonate / bicarbonate ; yellow / orange ; OR limewater ; goes cloudy / milky / white ; 2 Question Answer Marks Guidance 1(d) independent variable: at least two different concentrations of ethanol ; dependent variable: measuring the time taken for methylene blue to decolourise ; constant variables: two from ;; • same temperature • same pH • same volume of ethanol (solution) • same volume / amount / concentration of sugar one from ; • same volume / amount / concentration / type, of yeast • same volume / amount / concentration, of methylene blue / indicator • same volume / depth of oil methodology idea of leaving to equilibrate at set temperature ; use of a water-bath / insulation to maintain one temperature ; detail of a comparison / control e.g. test with no ethanol / yeast, present ; two or more repeats / three or more trials ; safety relevant safety e.g. gloves / goggles / no flames ; 6 A suitable alternative methods
Q2 · A photograph showing four seed heads from a poppy plant
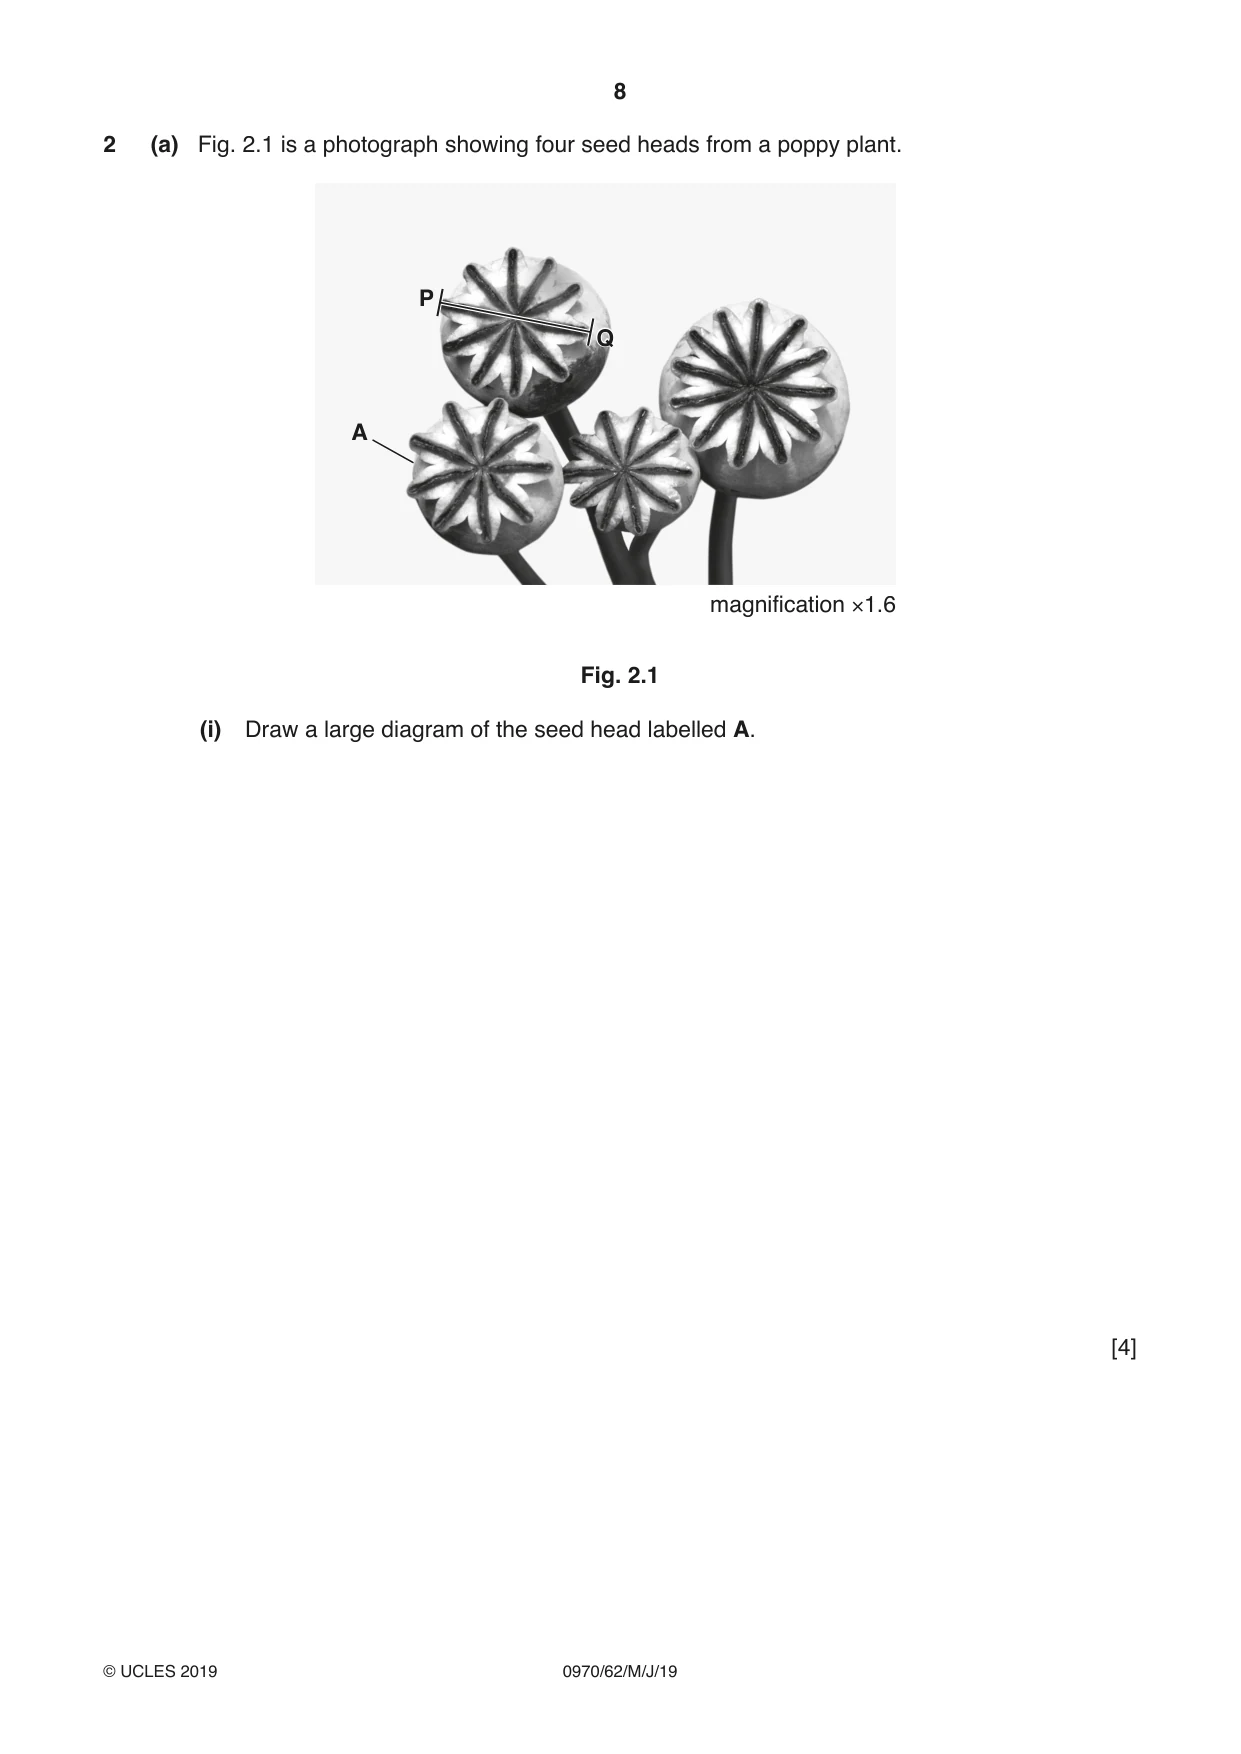
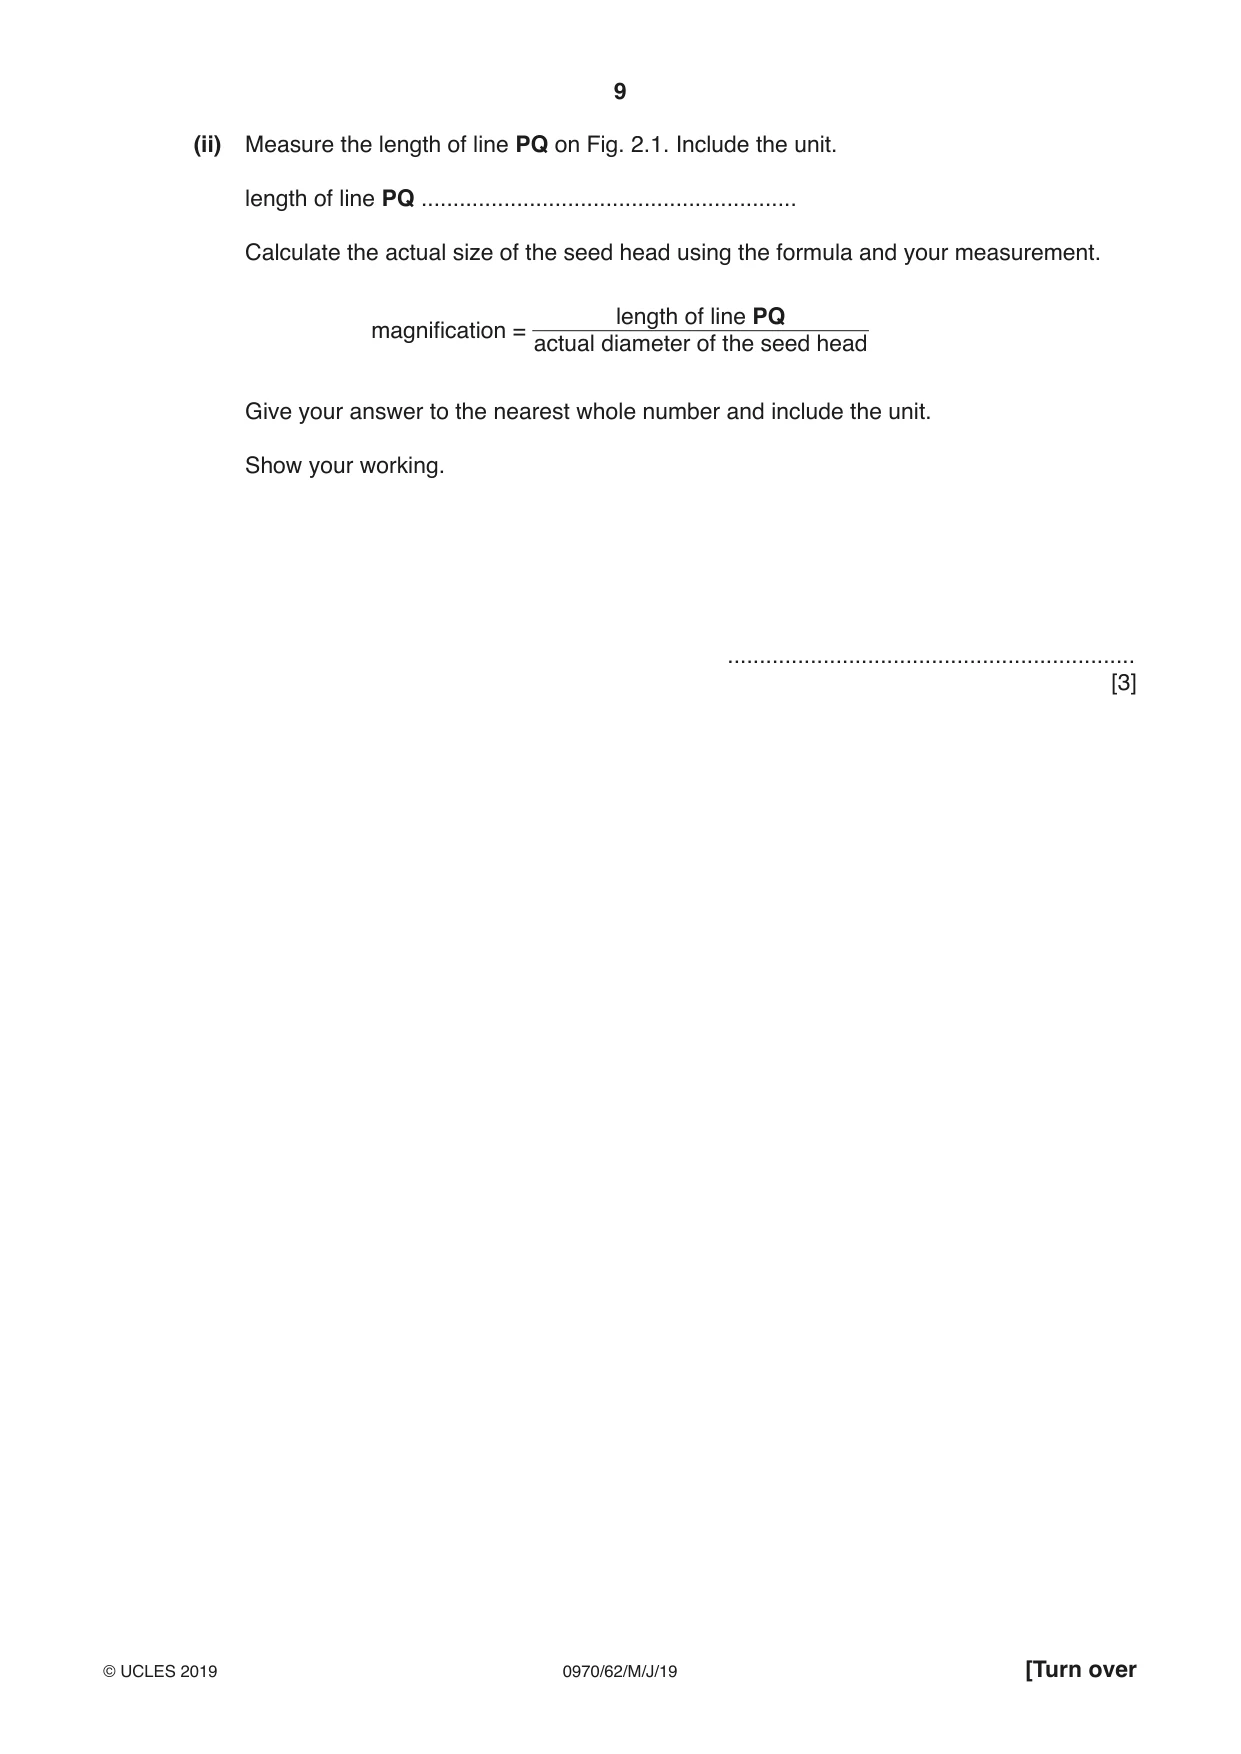
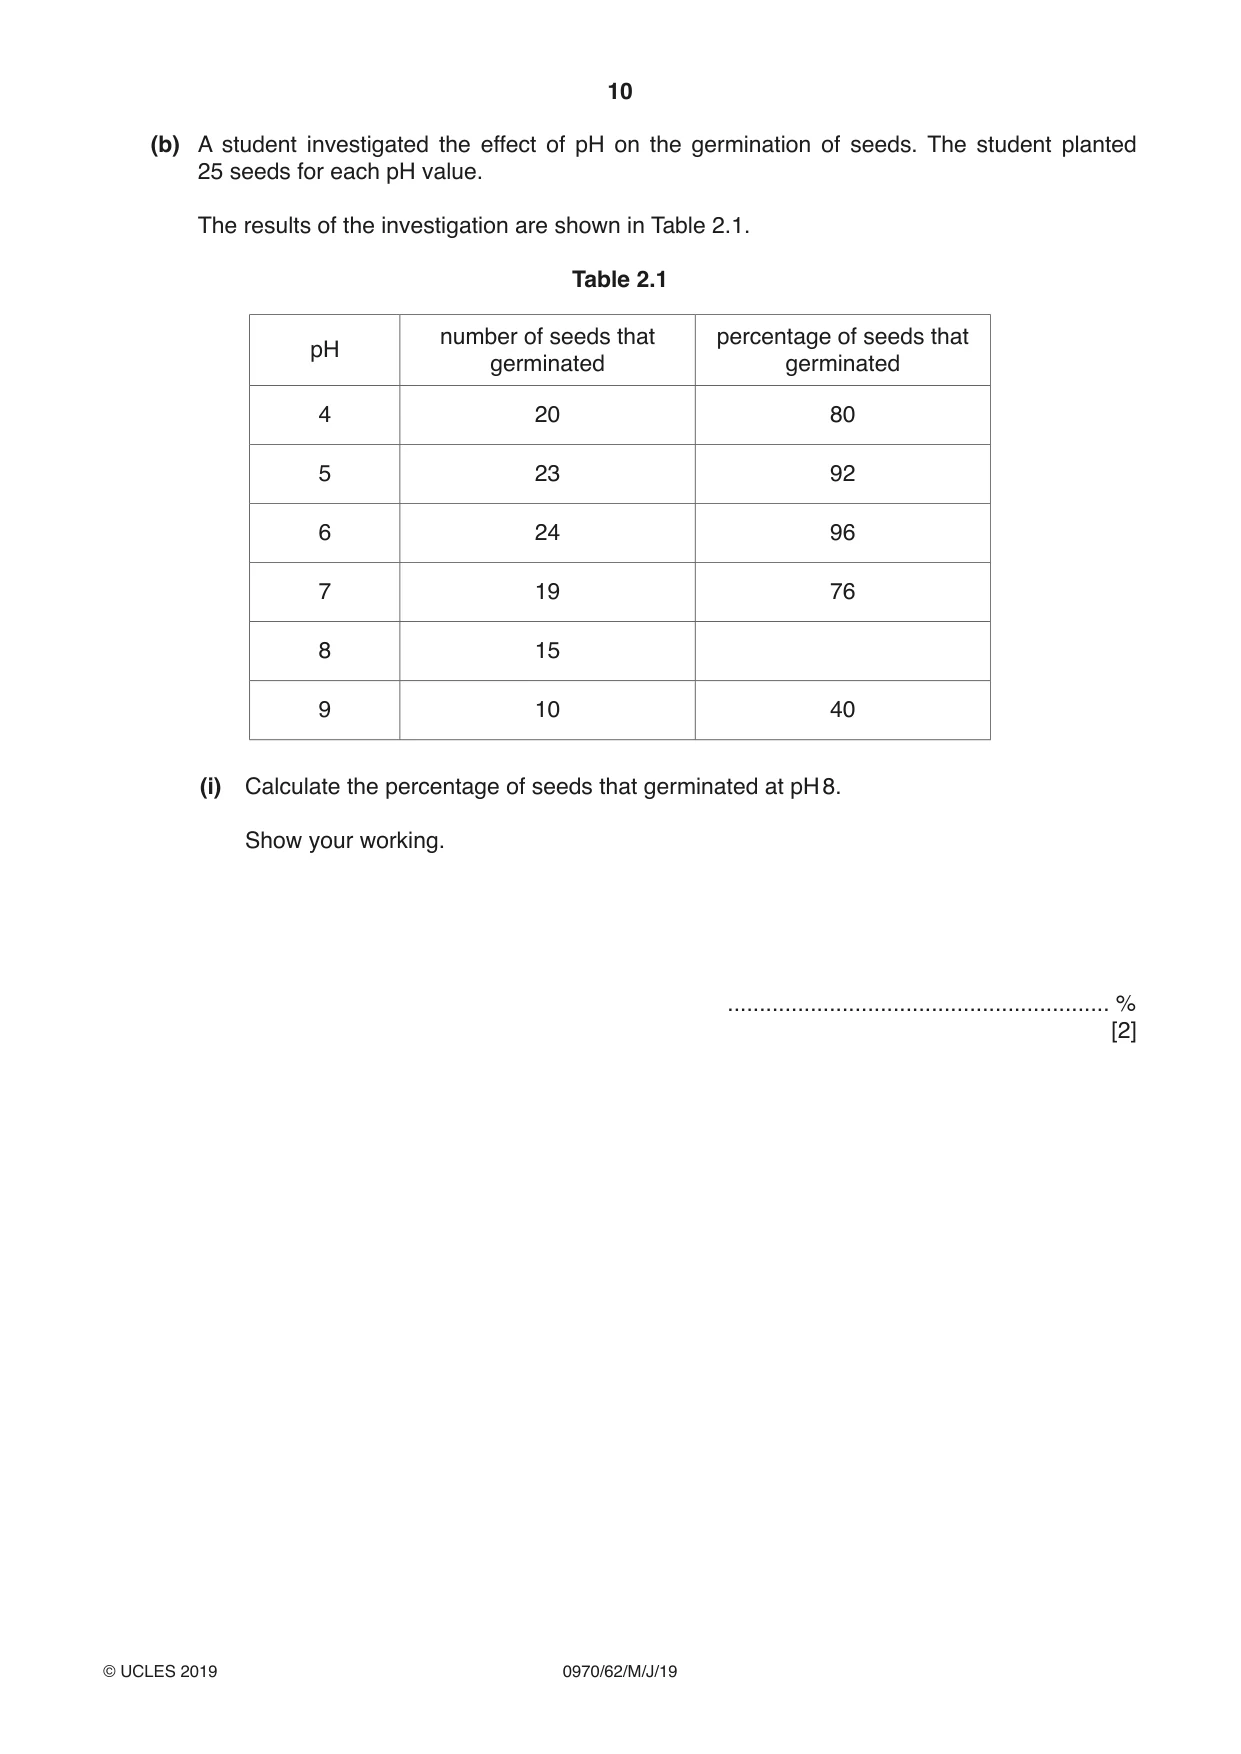
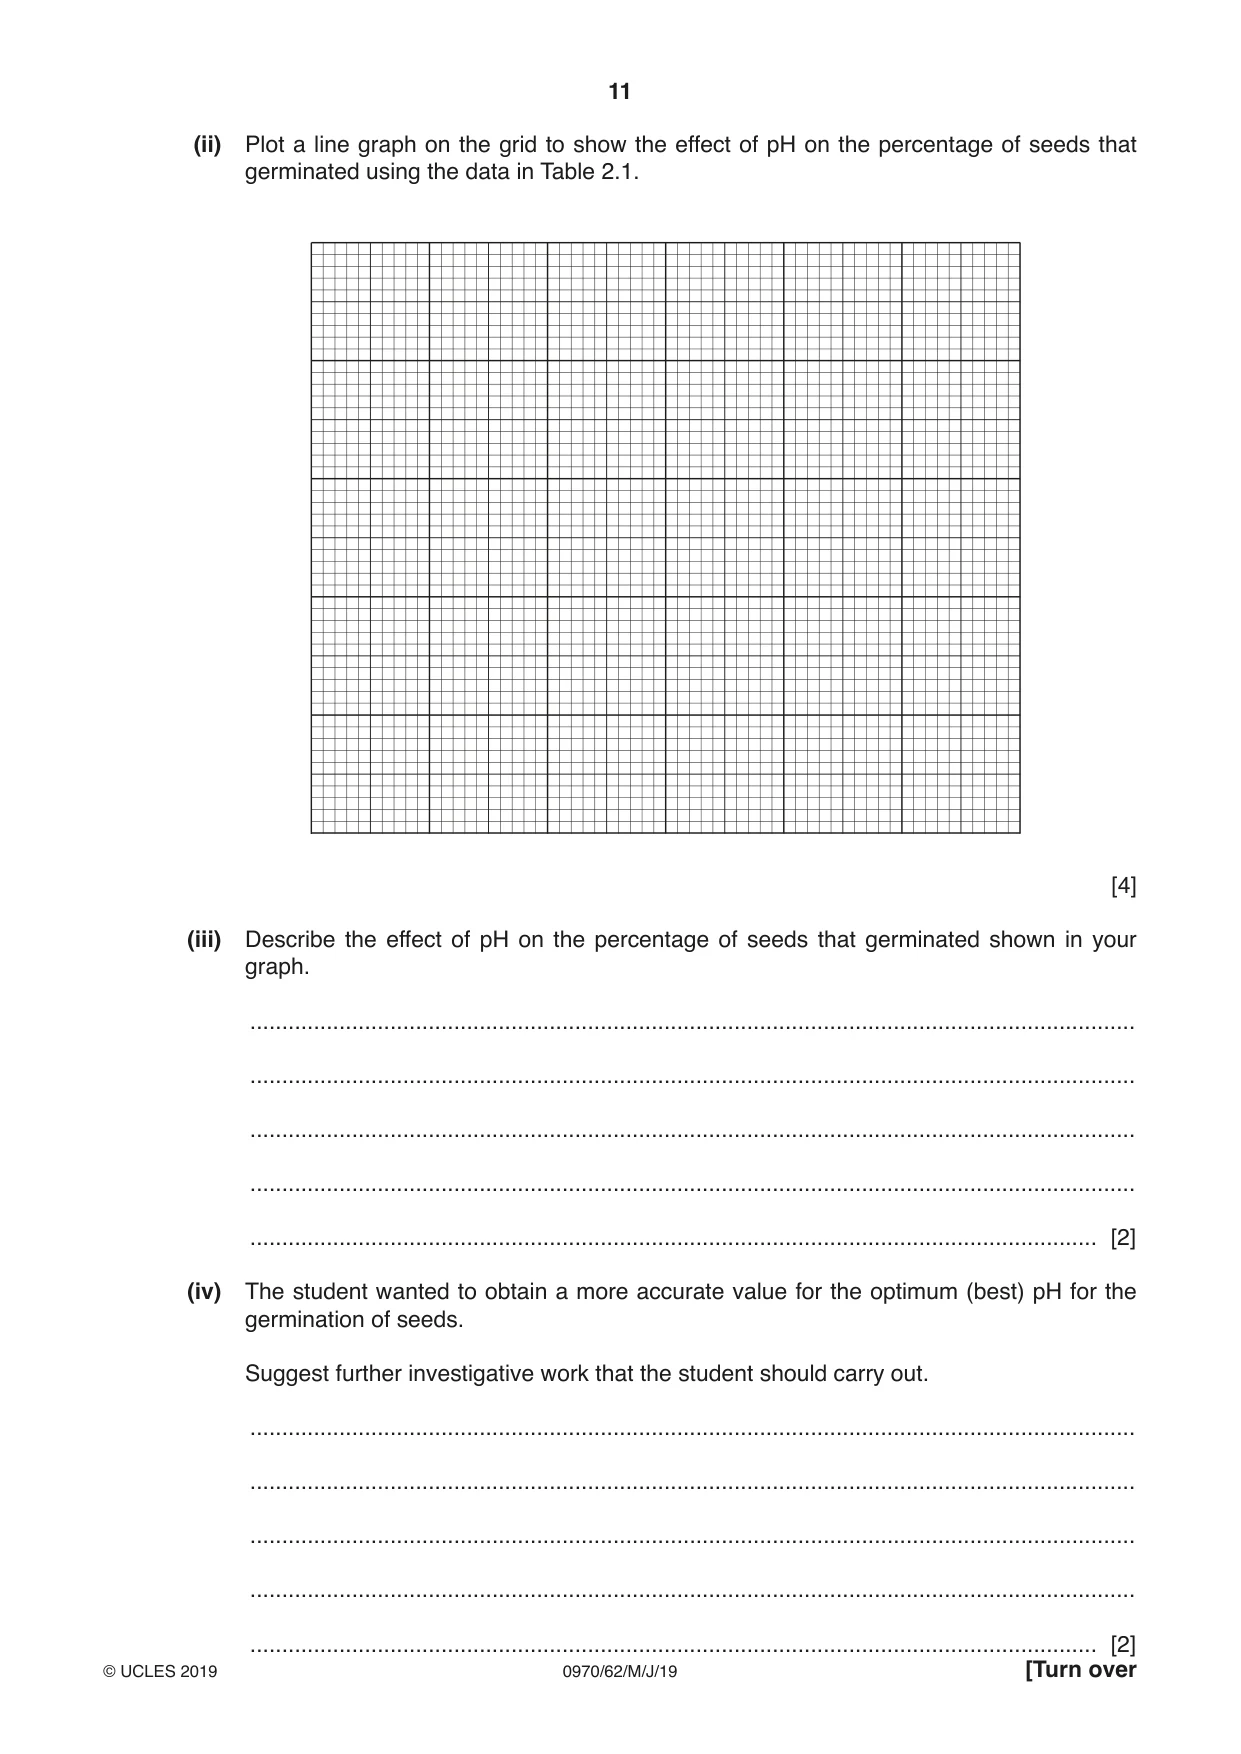
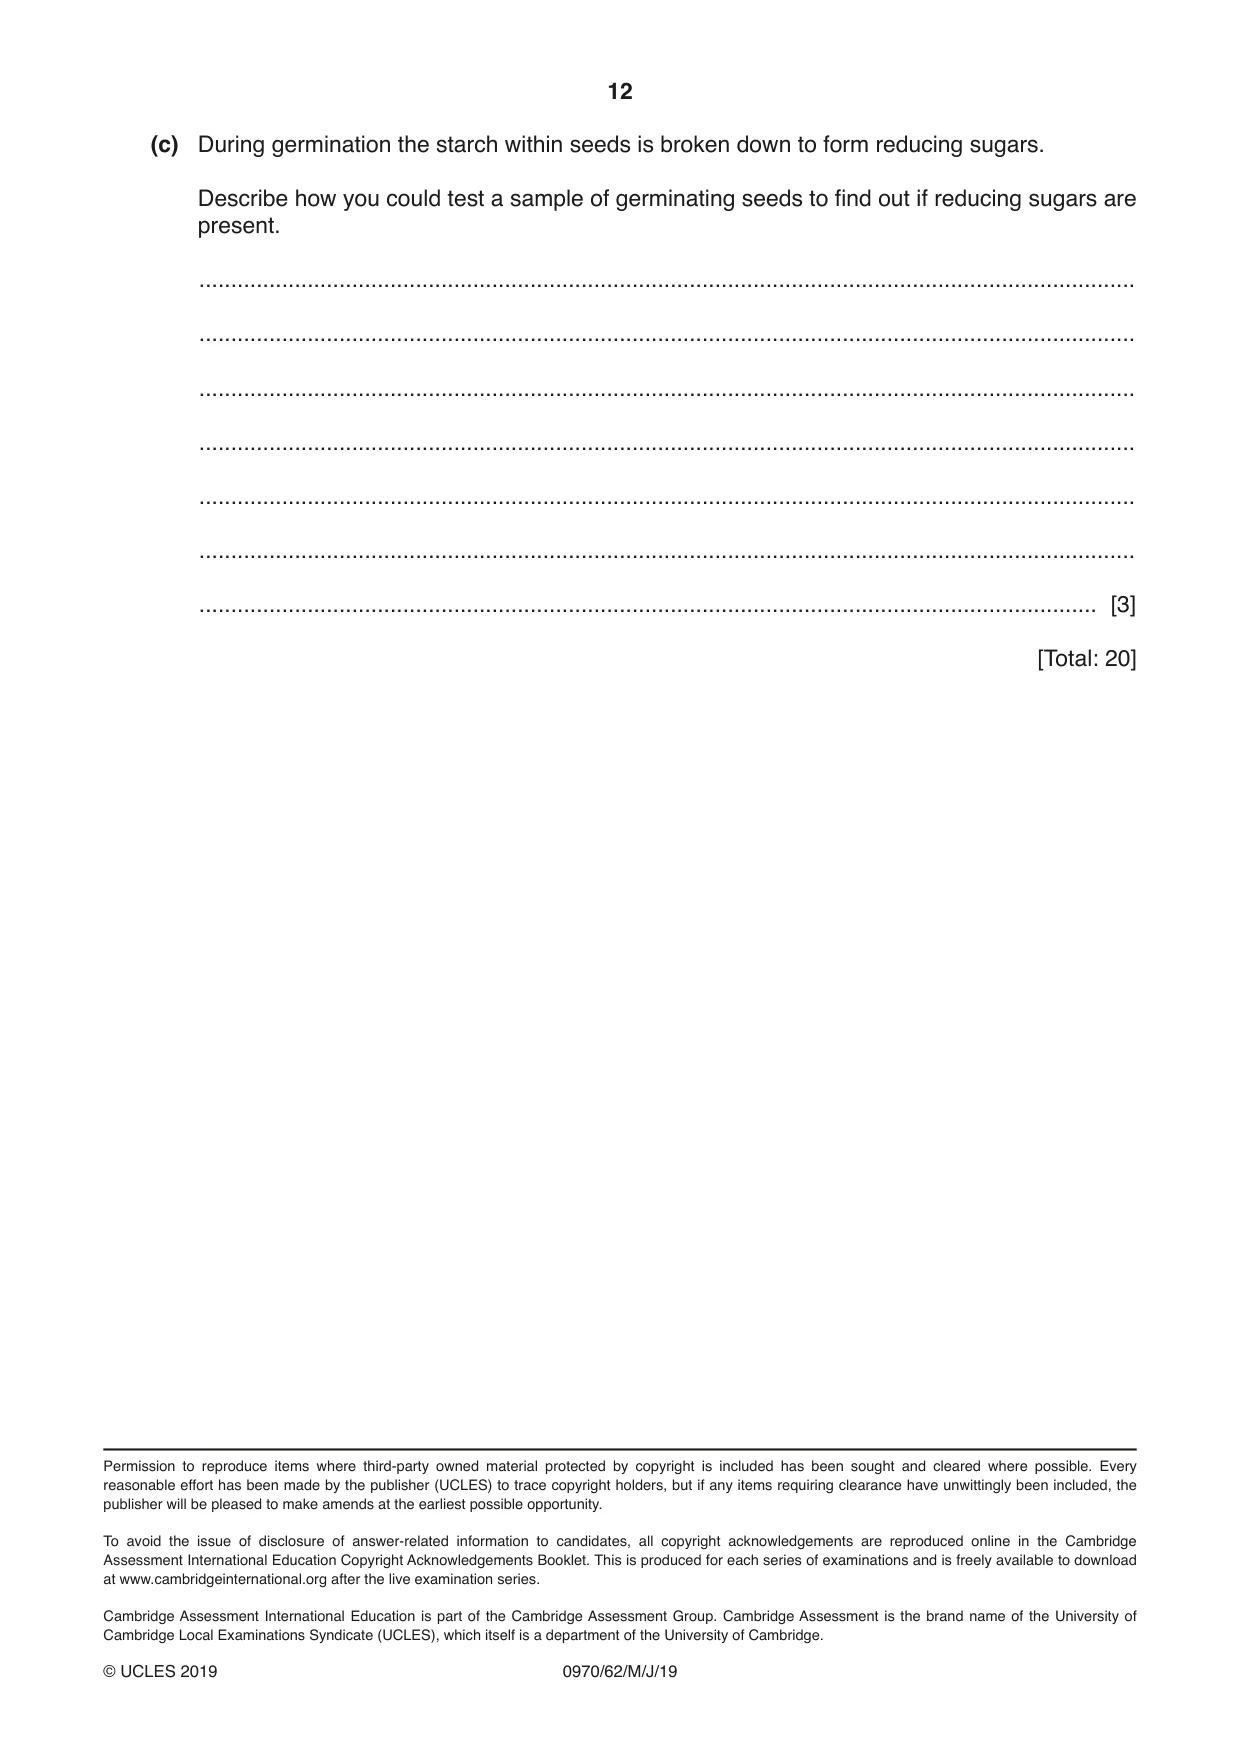
2 (a) Fig. 2.1 is a photograph showing four seed heads from a poppy plant. P Q A magnification ×1.6 Fig. 2.1 (i) Draw a large diagram of the seed head labelled A. [4] (ii) Measure the length of line PQ on Fig. 2.1. Include the unit. length of line PQ ........................................................... Calculate the actual size of the seed head using the formula and your measurement. length of line PQ magnification = actual diameter of the seed head Give your answer to the nearest whole number and include the unit. Show your working. ................................................................ [3] (b) A student investigated the effect of pH on the germination of seeds. The student planted 25 seeds for each pH value. The results of the investigation are shown in Table 2.1. Table 2.1 number of seeds that percentage of seeds that pH germinated germinated 4 20 80 5 23 92 6 24 96 7 19 76 8 15 9 10 40 (i) Calculate the percentage of seeds that germinated at pH 8. Show your working. ............................................................ % [2]
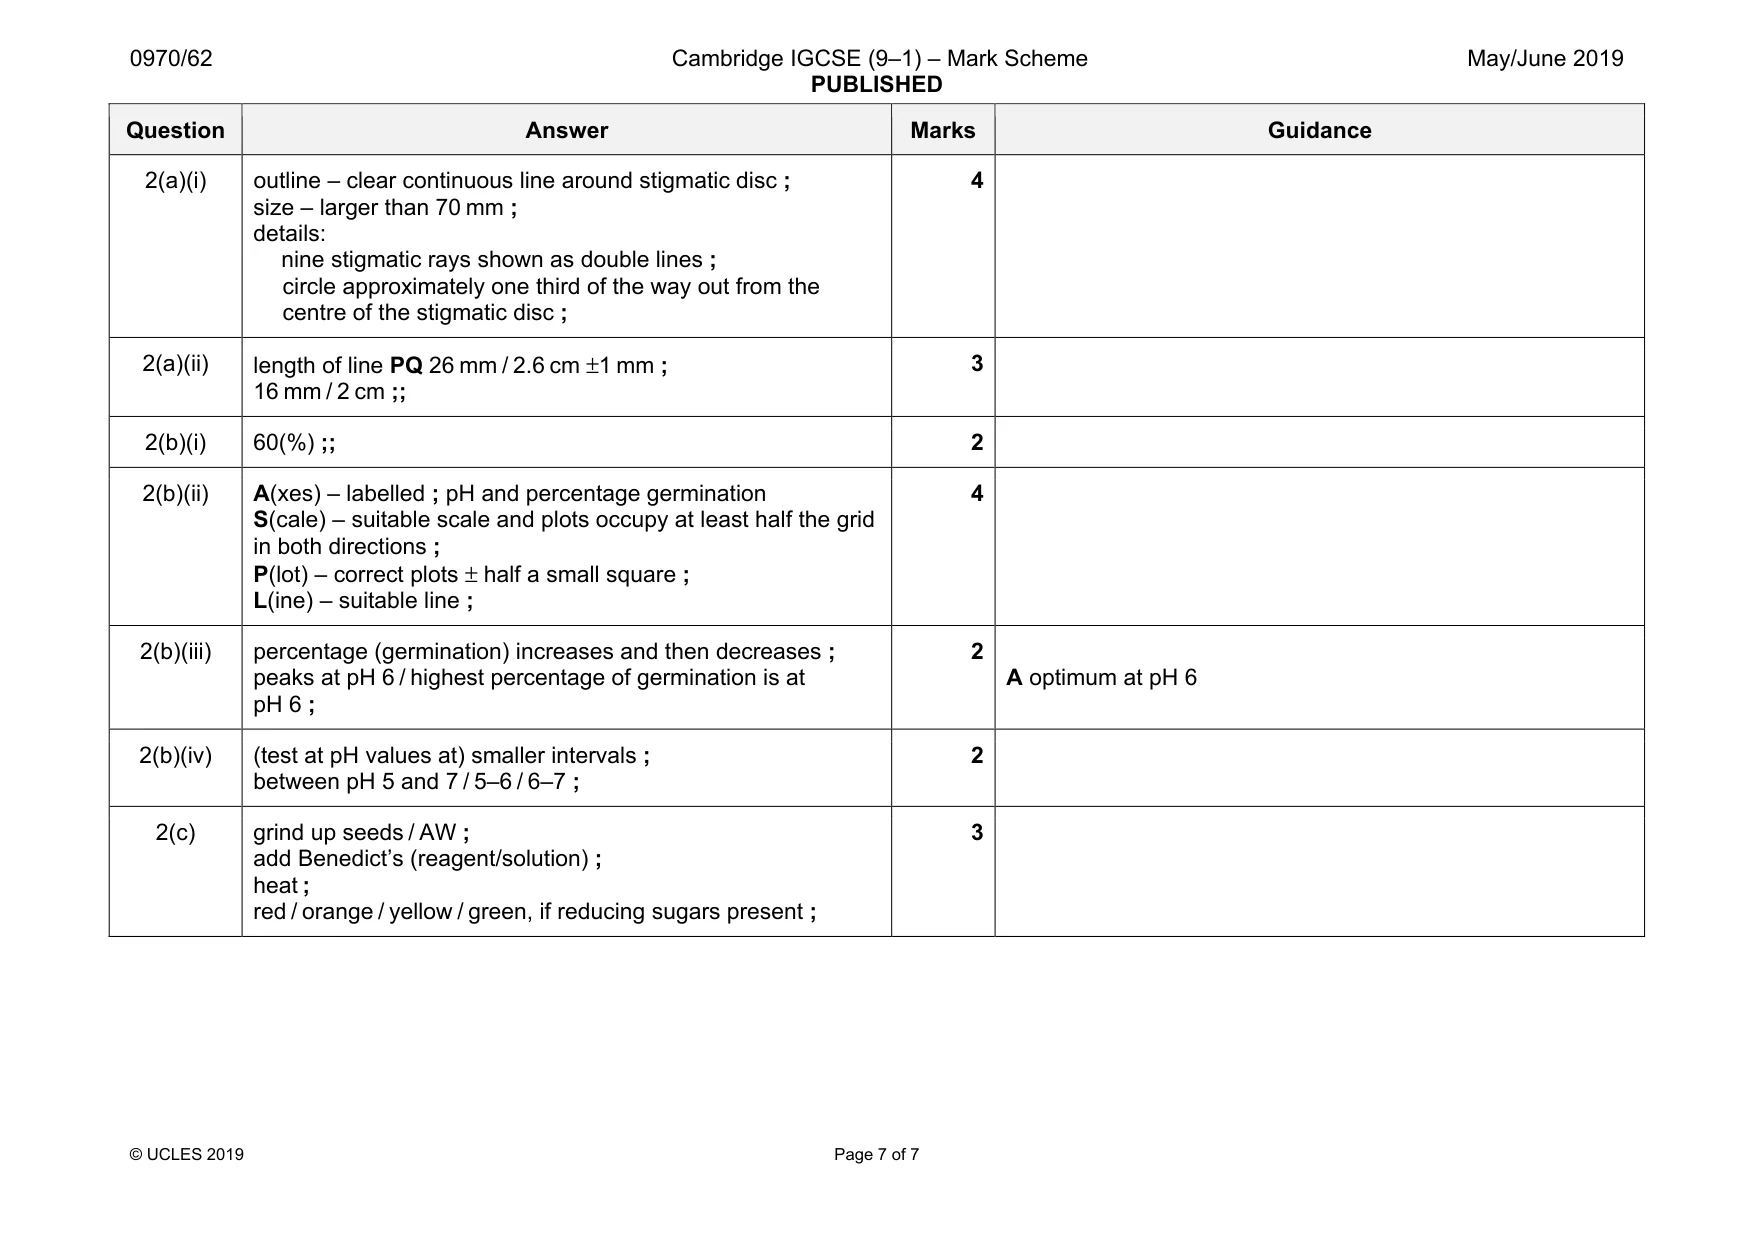
Mark scheme: 2(a)(i) outline – clear continuous line around stigmatic disc ; size – larger than 70 mm ; details: nine stigmatic rays shown as double lines ; circle approximately one third of the way out from the centre of the stigmatic disc ; 2(a)(ii) length of line PQ 26 mm / 2.6 cm ±1 mm ; 16 mm / 2 cm ;; 3 2(b)(i) 60(%) ;; 2 2(b)(ii) A(xes) – labelled ; pH and percentage germination S(cale) – suitable scale and plots occupy at least half the grid in both directions ; P(lot) – correct plots ± half a small square ; L(ine) – suitable line ; 4 2(b)(iii) percentage (germination) increases and then decreases ; peaks at pH 6 / highest percentage of germination is at pH 6 ; 2 A optimum at pH 6 2(b)(iv) (test at pH values at) smaller intervals ; between pH 5 and 7 / 5–6 / 6–7 ; 2 2(c) grind up seeds / AW ; add Benedict’s (reagent/solution) ; heat ; red / orange / yellow / green, if reducing sugars present ; 3
What was in this paper
The subtopics covered by these 2 questions, and how many questions each got. Open one in a new tab to see every Cambridge question on it.
What you needed in this session
Cambridge’s own grade thresholds for 2019 May/June, Paper 6 · Variant 2. A higher threshold means an easier paper — the bar moves with how the cohort did.