Cambridge IGCSE Biology (9-1) 0970 — 2018 Oct/Nov Paper 6 · Variant 2
0970/62/O/N/18 · 2 questions · 40 marks · ≈45 min
The question paper and its mark scheme, free to read here and free to download. This is Cambridge’s own paper, exactly as it was sat.
Question paper12 pages


Mark scheme8 pages
Answers below. Sit the paper first if you are practising.
Questions as text
Q1 · Fruit juice can be produced by crushing and squeezing fresh fruit
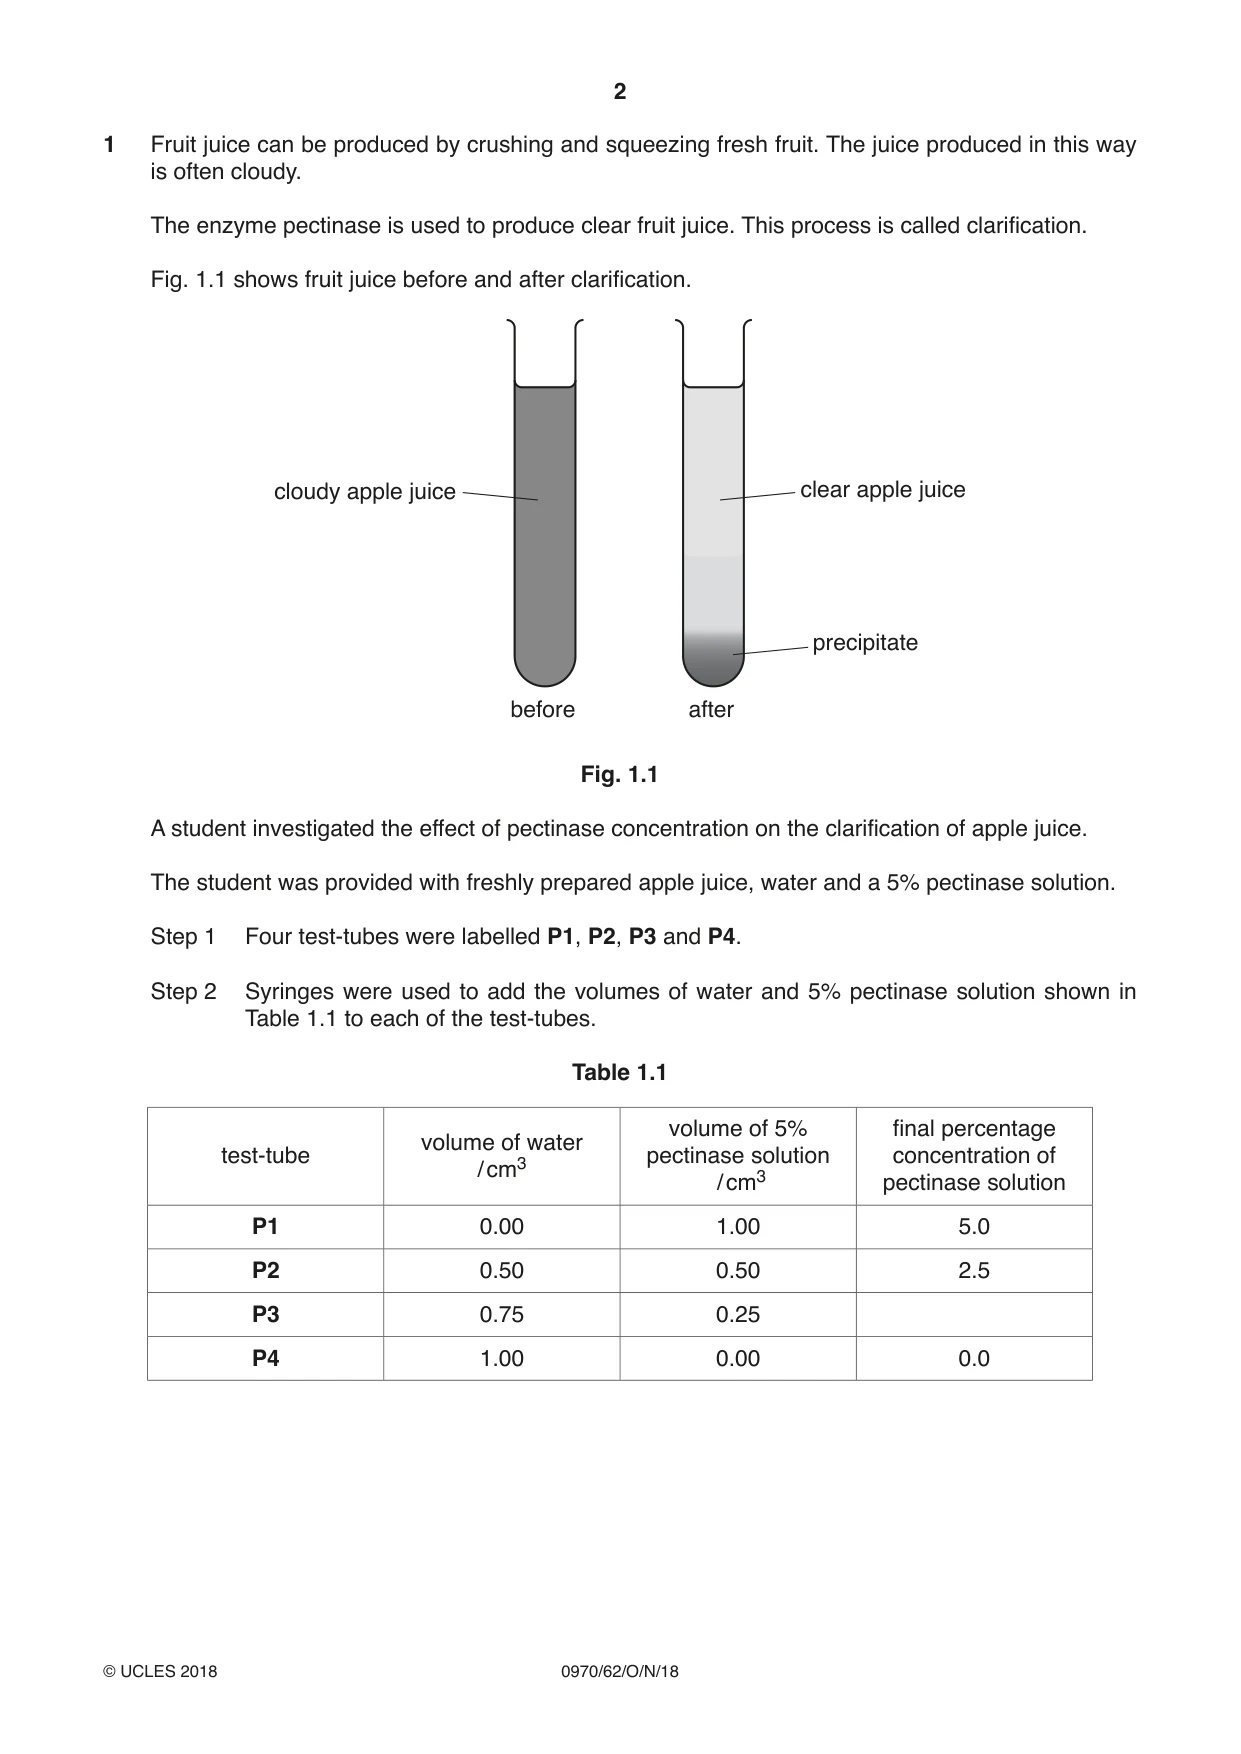
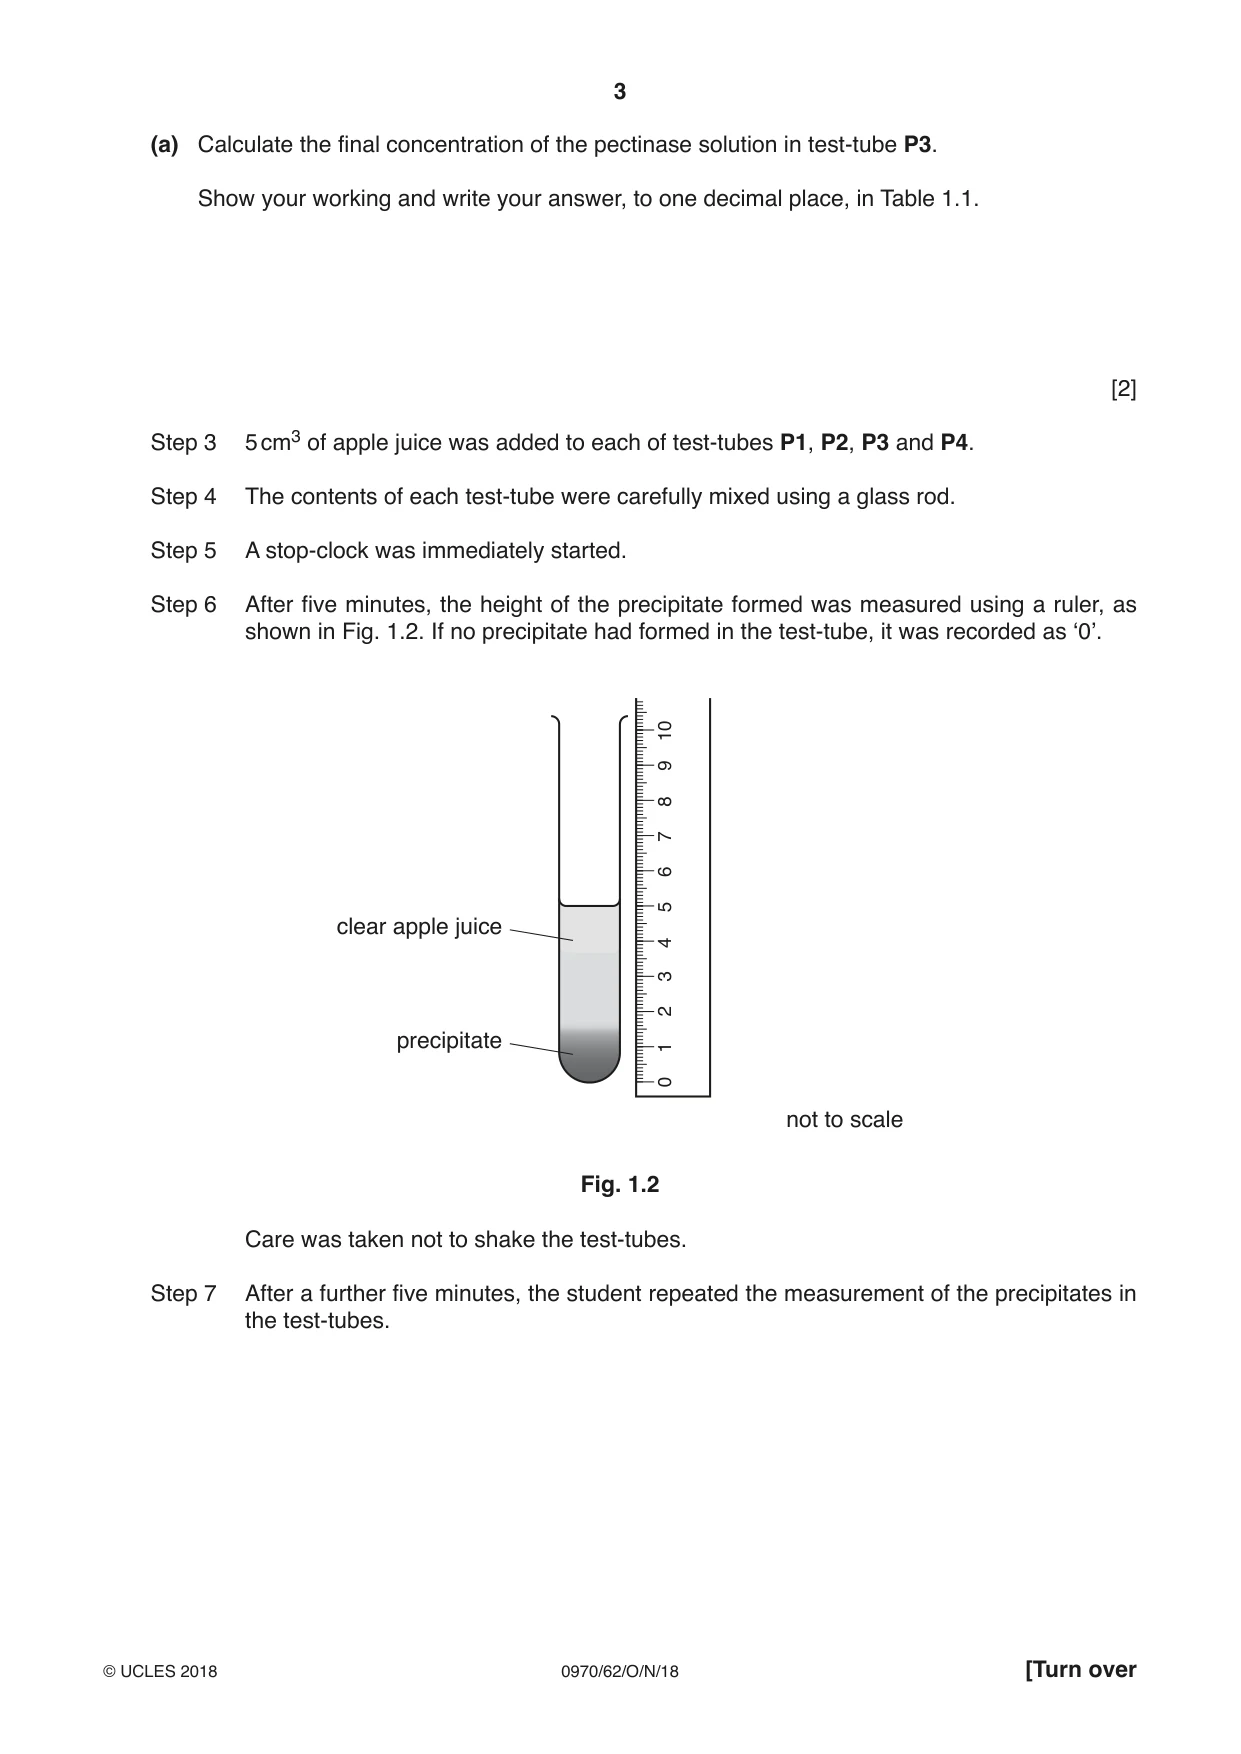
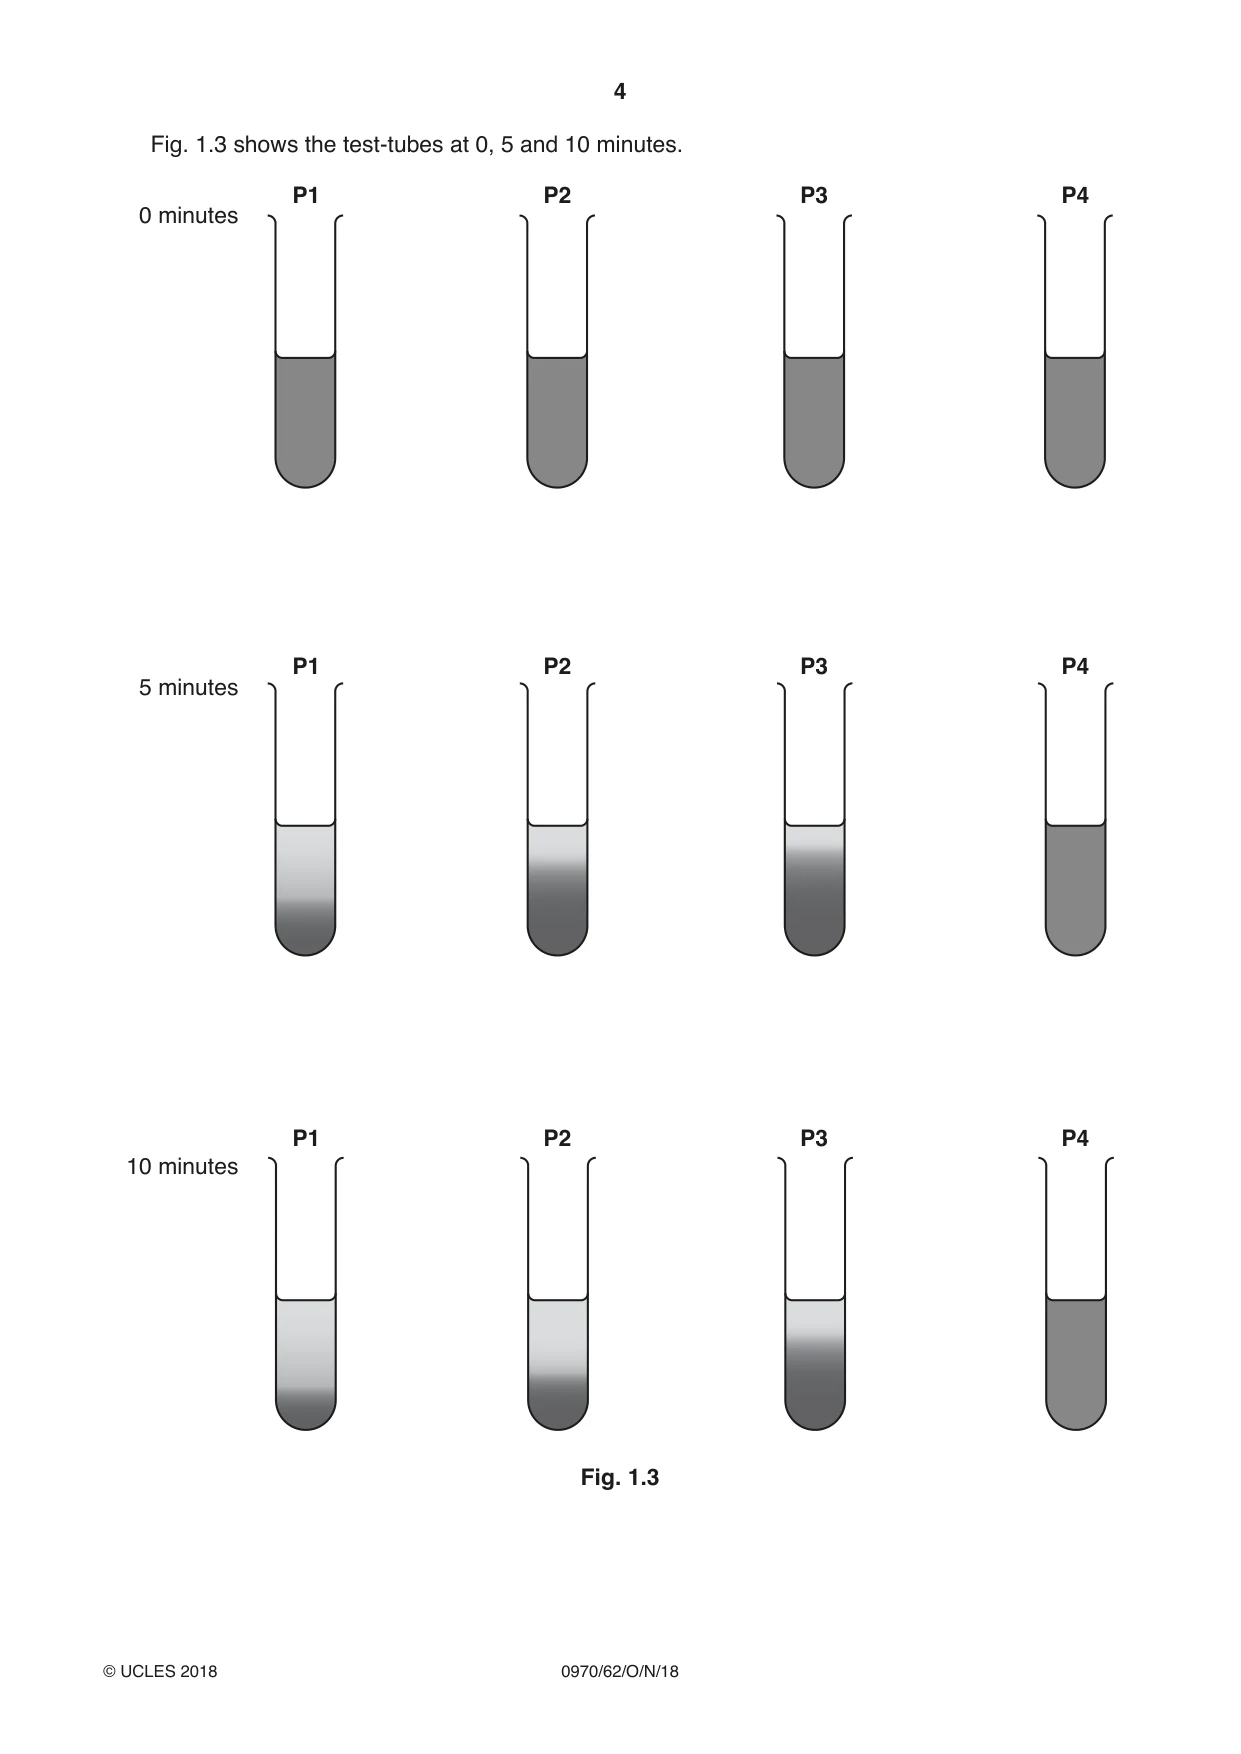
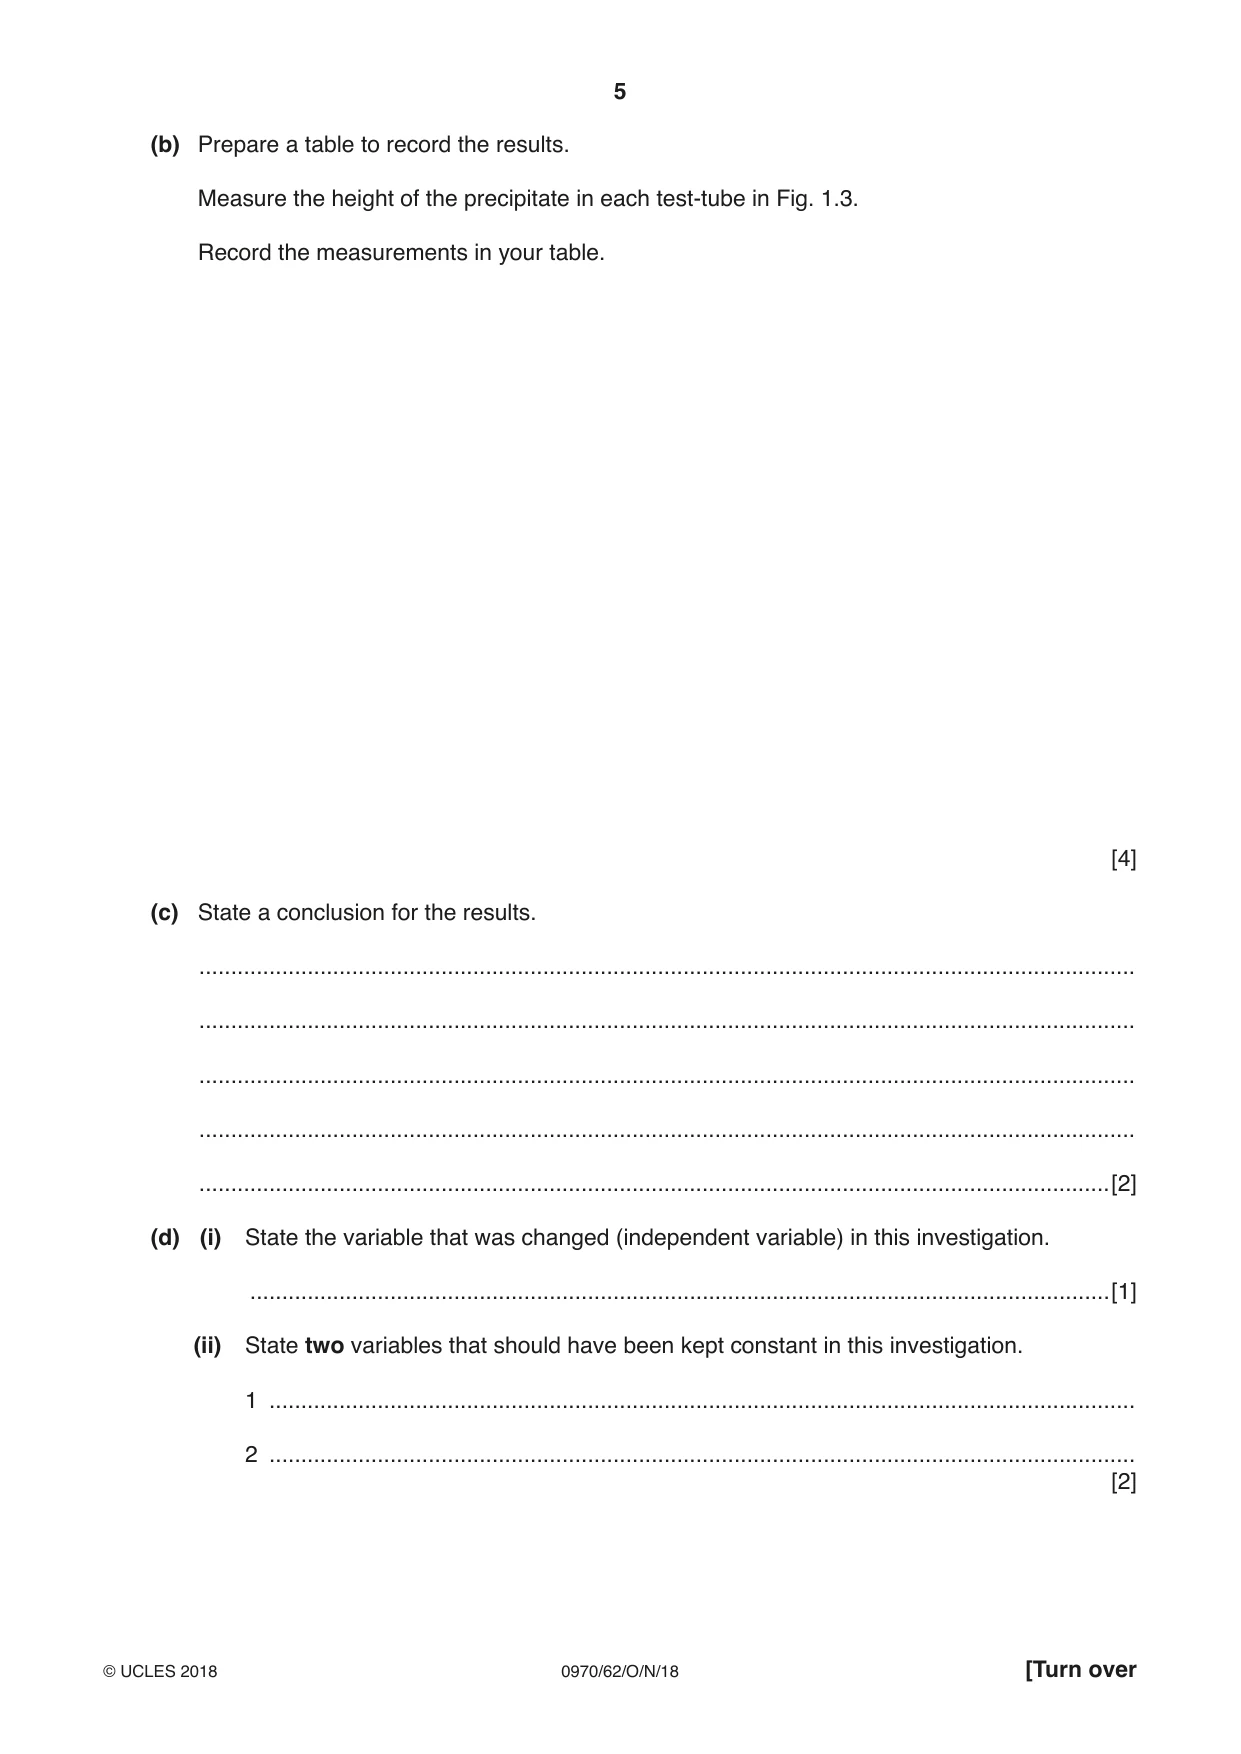
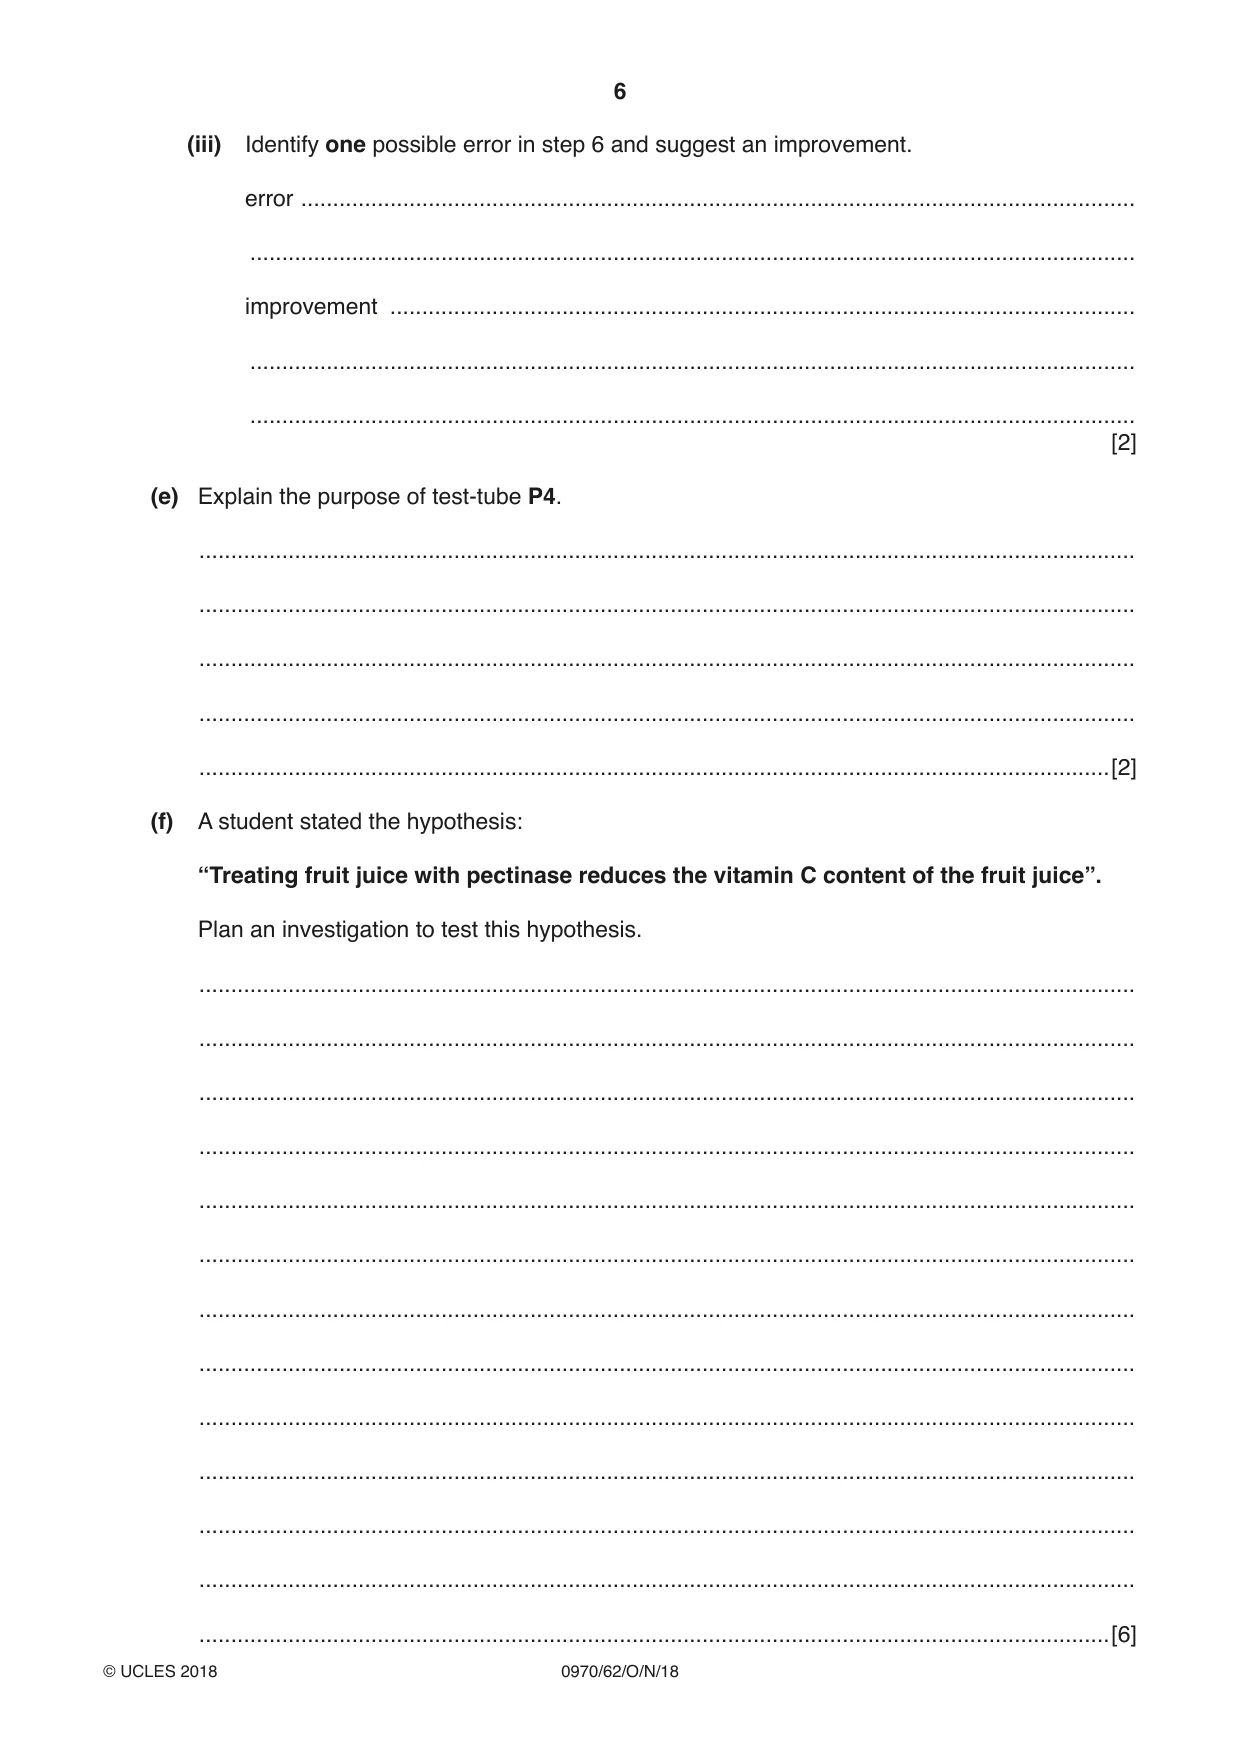
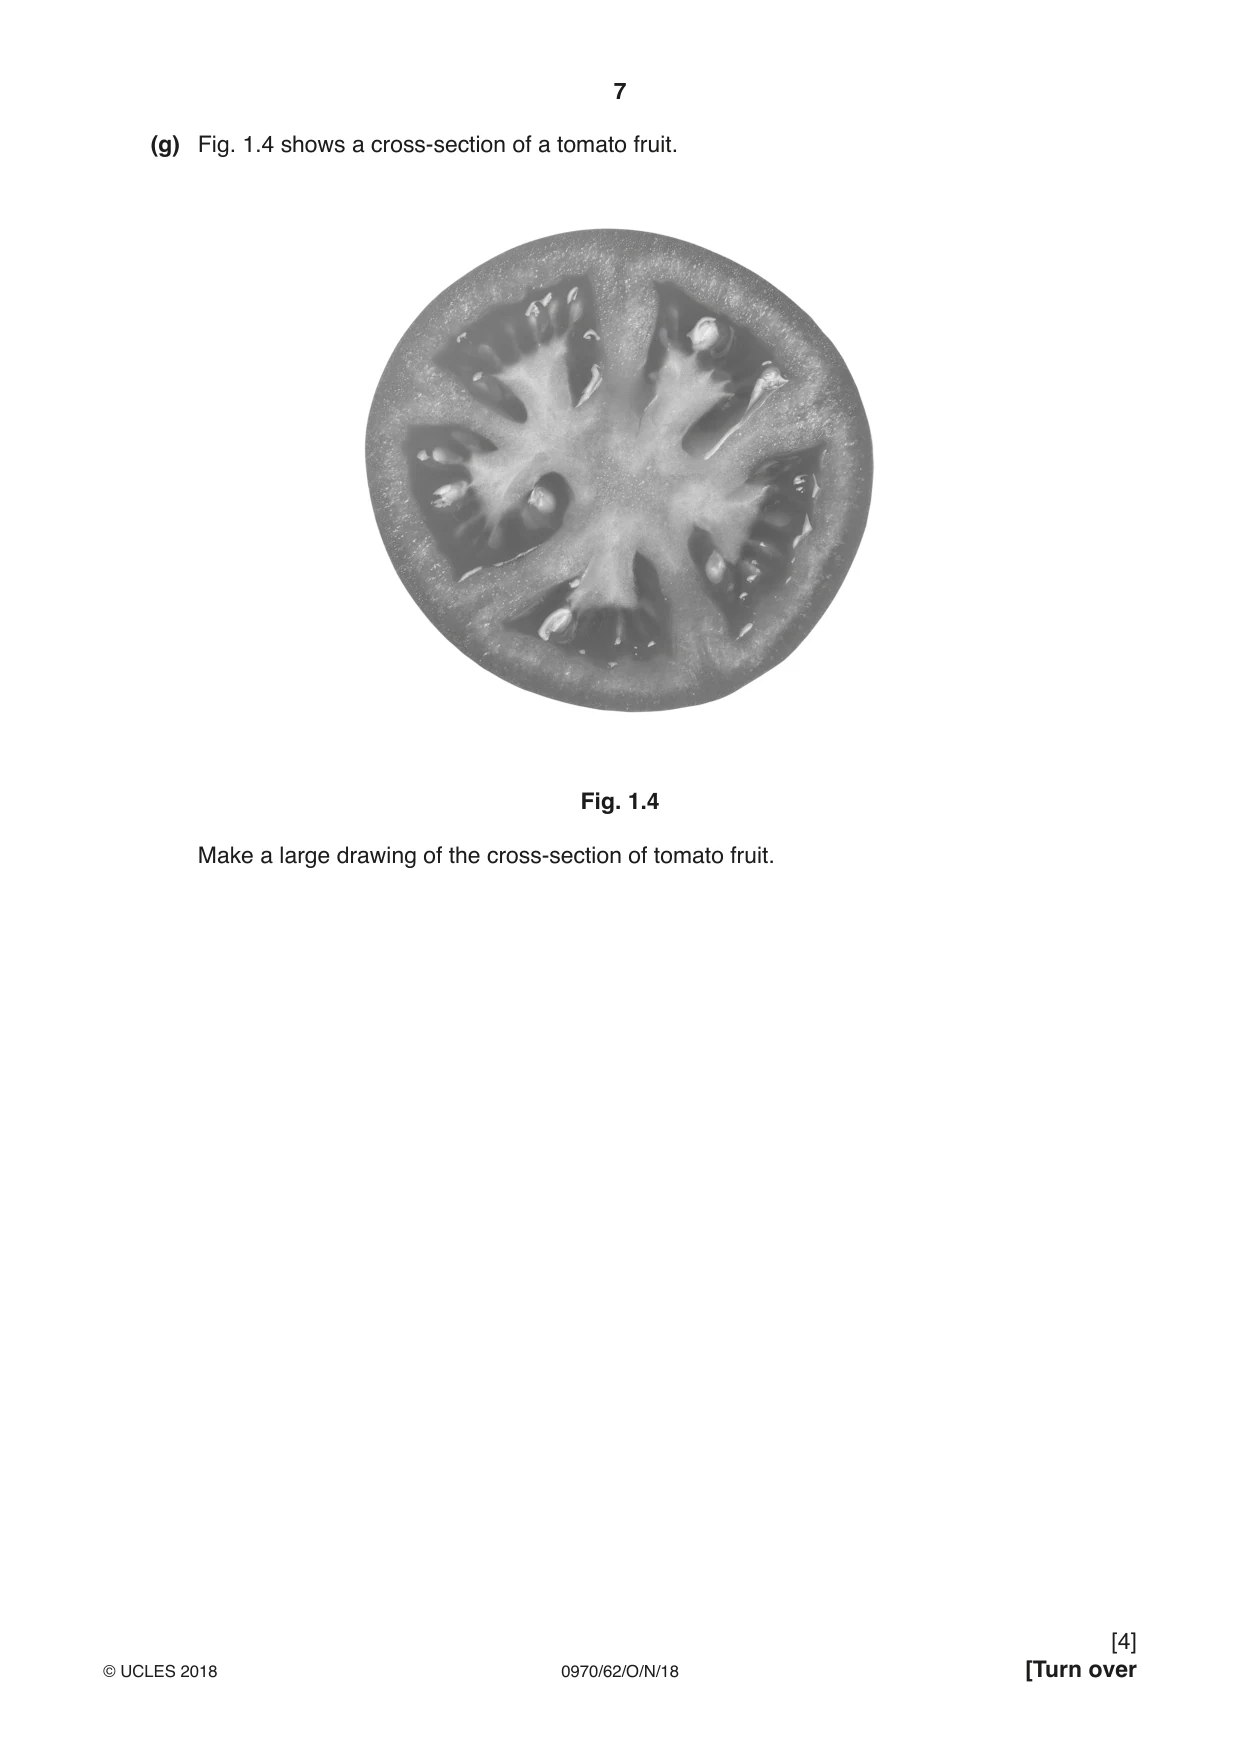
1 Fruit juice can be produced by crushing and squeezing fresh fruit. The juice produced in this way is often cloudy. The enzyme pectinase is used to produce clear fruit juice. This process is called clarification. Fig. 1.1 shows fruit juice before and after clarification. cloudy apple juice clear apple juice precipitate before after Fig. 1.1 A student investigated the effect of pectinase concentration on the clarification of apple juice. The student was provided with freshly prepared apple juice, water and a 5% pectinase solution. Step 1 Four test-tubes were labelled P1, P2, P3 and P4. Step 2 Syringes were used to add the volumes of water and 5% pectinase solution shown in Table 1.1 to each of the test-tubes. Table 1.1 volume of 5% final percentage volume of water test-tube pectinase solution concentration of / cm3 / cm3 pectinase solution P1 0.00 1.00 5.0 P2 0.50 0.50 2.5 P3 0.75 0.25 P4 1.00 0.00 0.0 (a) Calculate the final concentration of the pectinase solution in test-tube P3. Show your working and write your answer, to one decimal place, in Table 1.1. [2] Step 3 5 cm3 of apple juice was added to each of test-tubes P1, P2, P3 and P4. Step 4 The contents of each test-tube were carefully mixed using a glass rod. Step 5 A stop-clock was immediately started. Step 6 After five minutes, the height of the precipitate formed was measured using a ruler, as shown in Fig. 1.2. If no precipitate had formed in the test-tube, it was recorded as ‘0’. 10 9 8 7 6 5 clear apple juice 4 3 2 1 precipitate 0 not to scale Fig. 1.2 Care was taken not to shake the test-tubes. Step 7 After a further five minutes, the student repeated the measurement of the precipitates in the test-tubes. Fig. 1.3 shows the test-tubes at 0, 5 and 10 minutes. P1 P2 P3 P4 0 minutes P1 P2 P3 P4 5 minutes P1 P2 P3 P4 10 minutes Fig. 1.3 (b) Prepare a table to record the results. Measure the height of the precipitate in each test-tube in Fig. 1.3. Record the measurements in your table. [4] (c) State a conclusion for the results. ................................................................................................................................................... ................................................................................................................................................... ................................................................................................................................................... ................................................................................................................................................... ...............................................................................................................................................[2] (d) (i) State the variable that was changed (independent variable) in this investigation. .......................................................................................................................................[1] (ii) State two variables that should have been kept constant in this investigation. 1 ........................................................................................................................................ 2 ........................................................................................................................................ [2] (iii) Identify one possible error in step 6 and suggest an improvement. error ................................................................................................................................... ........................................................................................................................................... improvement ..................................................................................................................... ........................................................................................................................................... ........................................................................................................................................... [2] (e) Explain the purpose of test-tube P4. ................................................................................................................................................... ................................................................................................................................................... ................................................................................................................................................... ................................................................................................................................................... ...............................................................................................................................................[2] (f) A student stated the hypothesis: “Treating fruit juice with pectinase reduces the vitamin C content of the fruit juice”. Plan an investigation to test this hypothesis. ................................................................................................................................................... ................................................................................................................................................... ................................................................................................................................................... ................................................................................................................................................... ................................................................................................................................................... ................................................................................................................................................... ................................................................................................................................................... ................................................................................................................................................... ................................................................................................................................................... ................................................................................................................................................... ................................................................................................................................................... ................................................................................................................................................... ...............................................................................................................................................[6] (g) Fig. 1.4 shows a cross-section of a tomato fruit. Fig. 1.4 Make a large drawing of the cross-section of tomato fruit. (h) A student wanted to find out if tomatoes contained starch. State the result you would expect for a positive test for starch. ...............................................................................................................................................[1] [Total: 26]
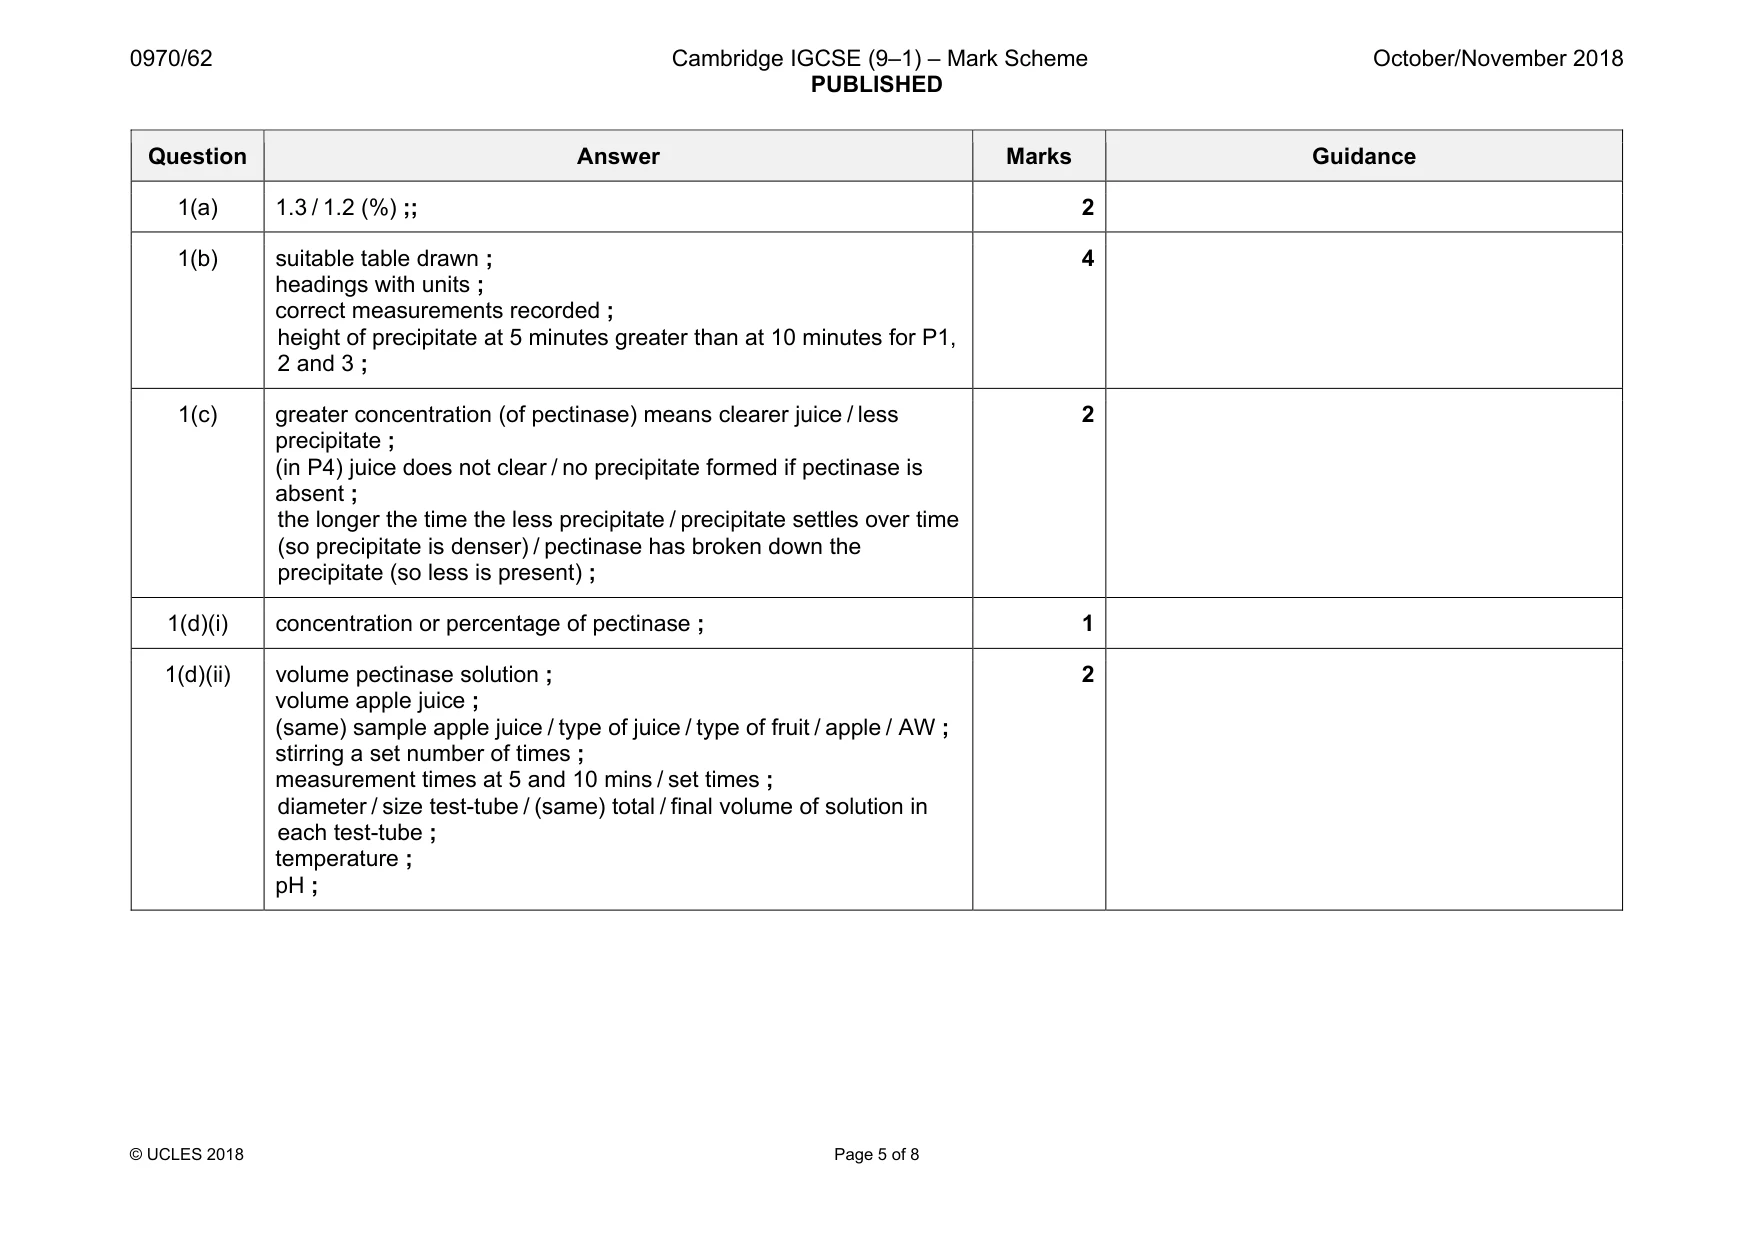
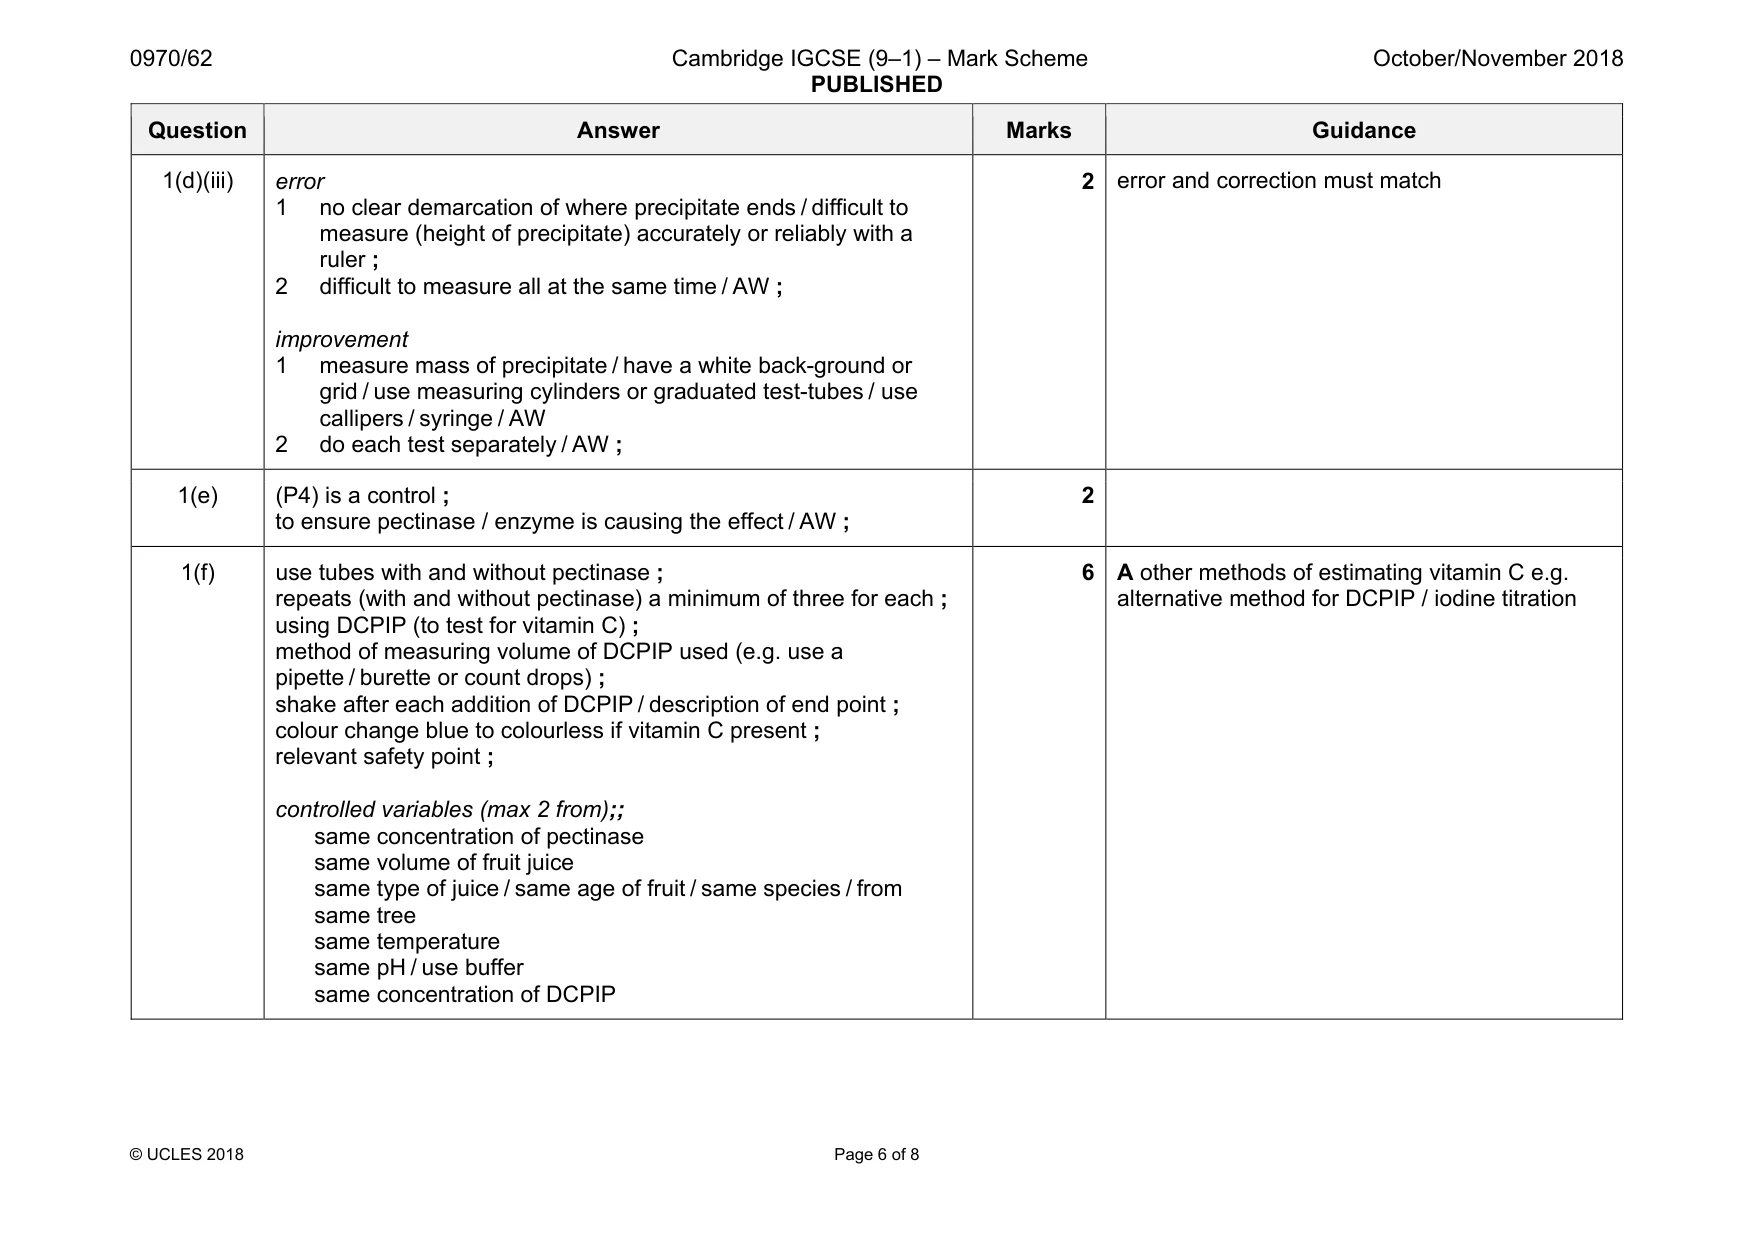
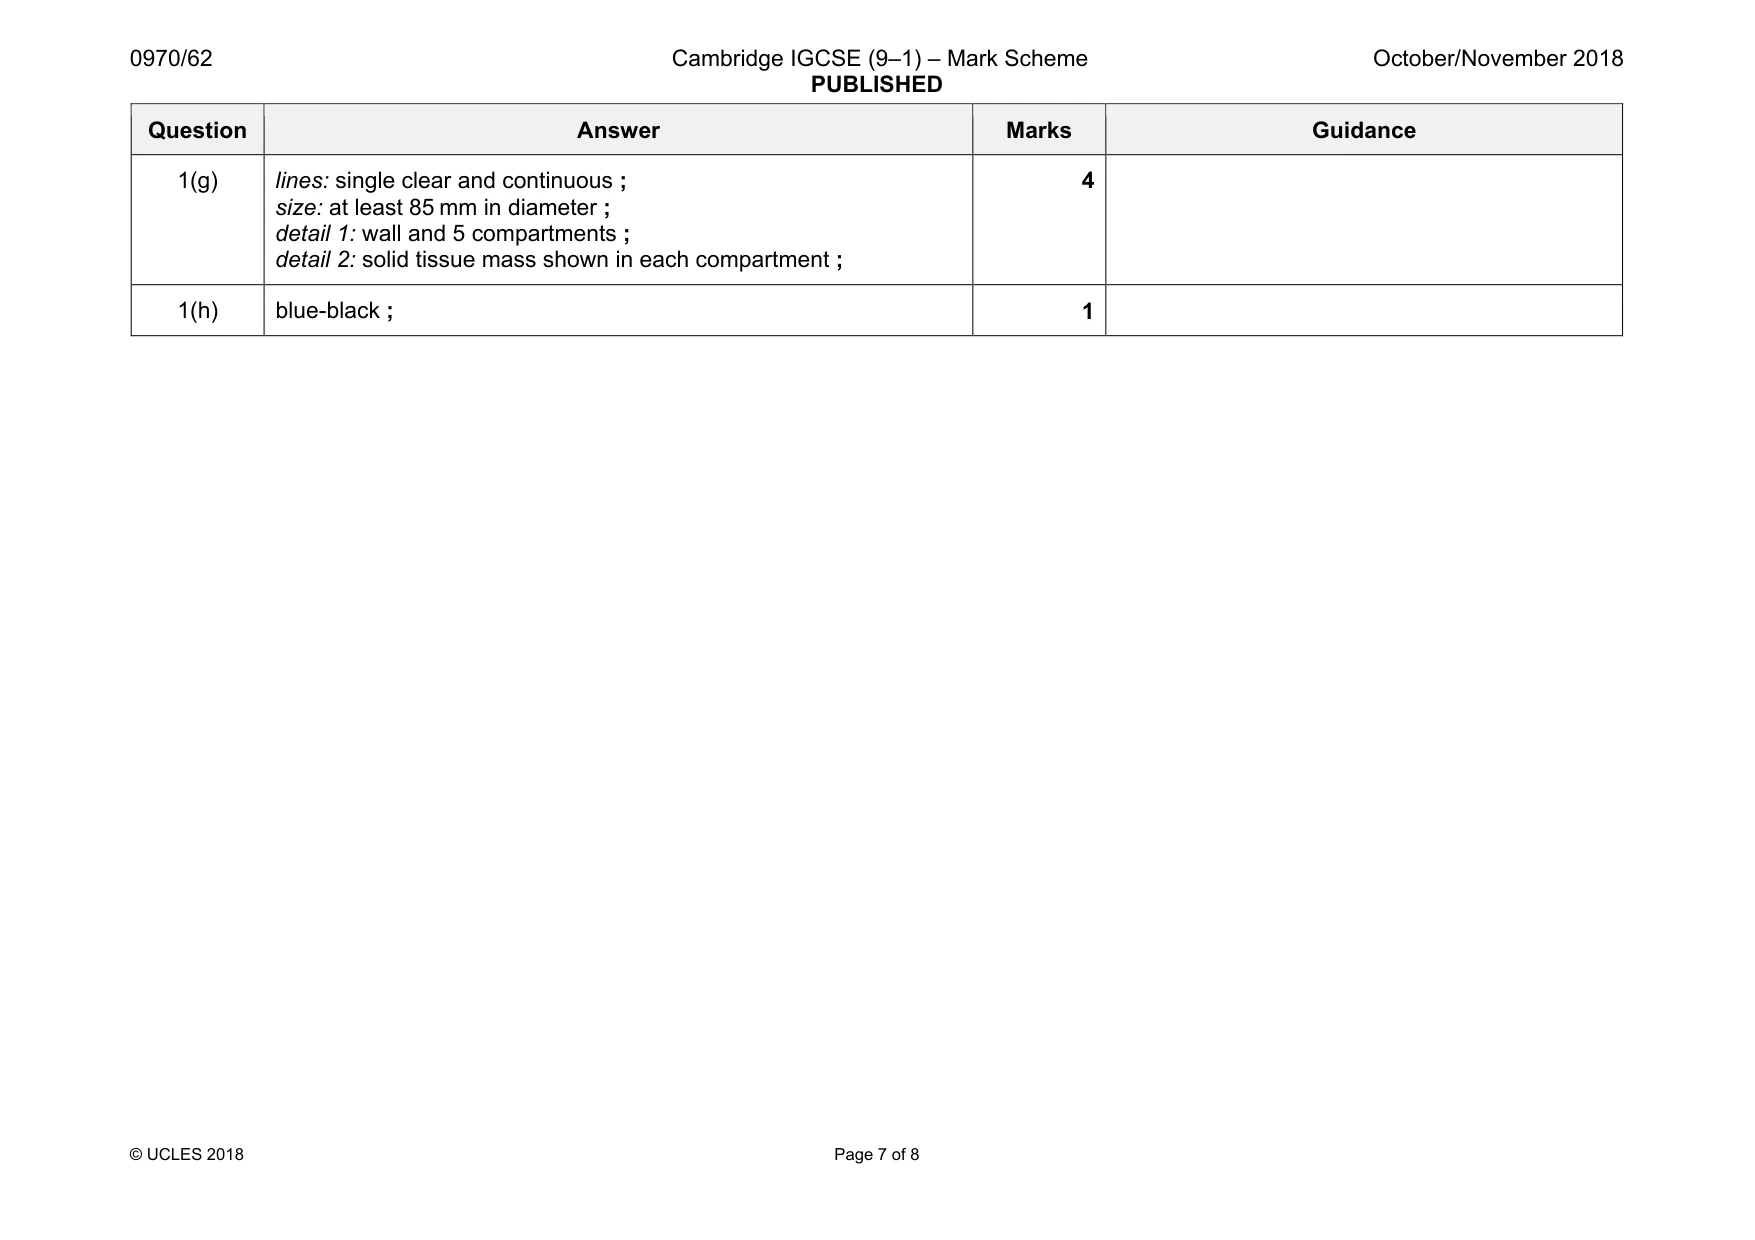
Mark scheme: 1(a) 1.3 / 1.2 (%) ;; 2 1(b) suitable table drawn ; headings with units ; correct measurements recorded ; height of precipitate at 5 minutes greater than at 10 minutes for P1, 2 and 3 ; 4 1(c) greater concentration (of pectinase) means clearer juice / less precipitate ; (in P4) juice does not clear / no precipitate formed if pectinase is absent ; the longer the time the less precipitate / precipitate settles over time (so precipitate is denser) / pectinase has broken down the precipitate (so less is present) ; 2 1(d)(i) concentration or percentage of pectinase ; 1 1(d)(ii) volume pectinase solution ; volume apple juice ; (same) sample apple juice / type of juice / type of fruit / apple / AW ; stirring a set number of times ; measurement times at 5 and 10 mins / set times ; diameter / size test-tube / (same) total / final volume of solution in each test-tube ; temperature ; pH ; 2 Question Answer Marks Guidance 1(d)(iii) error 1 no clear demarcation of where precipitate ends / difficult to measure (height of precipitate) accurately or reliably with a ruler ; 2 difficult to measure all at the same time / AW ; improvement 1 measure mass of precipitate / have a white back-ground or grid / use measuring cylinders or graduated test-tubes / use callipers / syringe / AW 2 do each test separately / AW ; 2 error and correction must match 1(e) (P4) is a control ; to ensure pectinase / enzyme is causing the effect / AW ; 2 1(f) use tubes with and without pectinase ; repeats (with and without pectinase) a minimum of three for each ; using DCPIP (to test for vitamin C) ; method of measuring volume of DCPIP used (e.g. use a pipette / burette or count drops) ; shake after each addition of DCPIP / description of end point ; colour change blue to colourless if vitamin C present ; relevant safety point ; controlled variables (max 2 from);; same concentration of pectinase same volume of fruit juice same type of juice / same age of fruit / same species / from same tree same temperature same pH / use buffer same concentration of DCPIP 6 A other methods of estimating vitamin C e.g. alternative method for DCPIP / iodine titration Question Answer Marks Guidance 1(g) lines: single clear and continuous ; size: at least 85 mm in diameter ; detail 1: wall and 5 compartments ; detail 2: solid tissue mass shown in each compartment ; 4 1(h) blue-black ; 1
Q2 · A student investigated the number of petals on the flowers of two species of daisy…
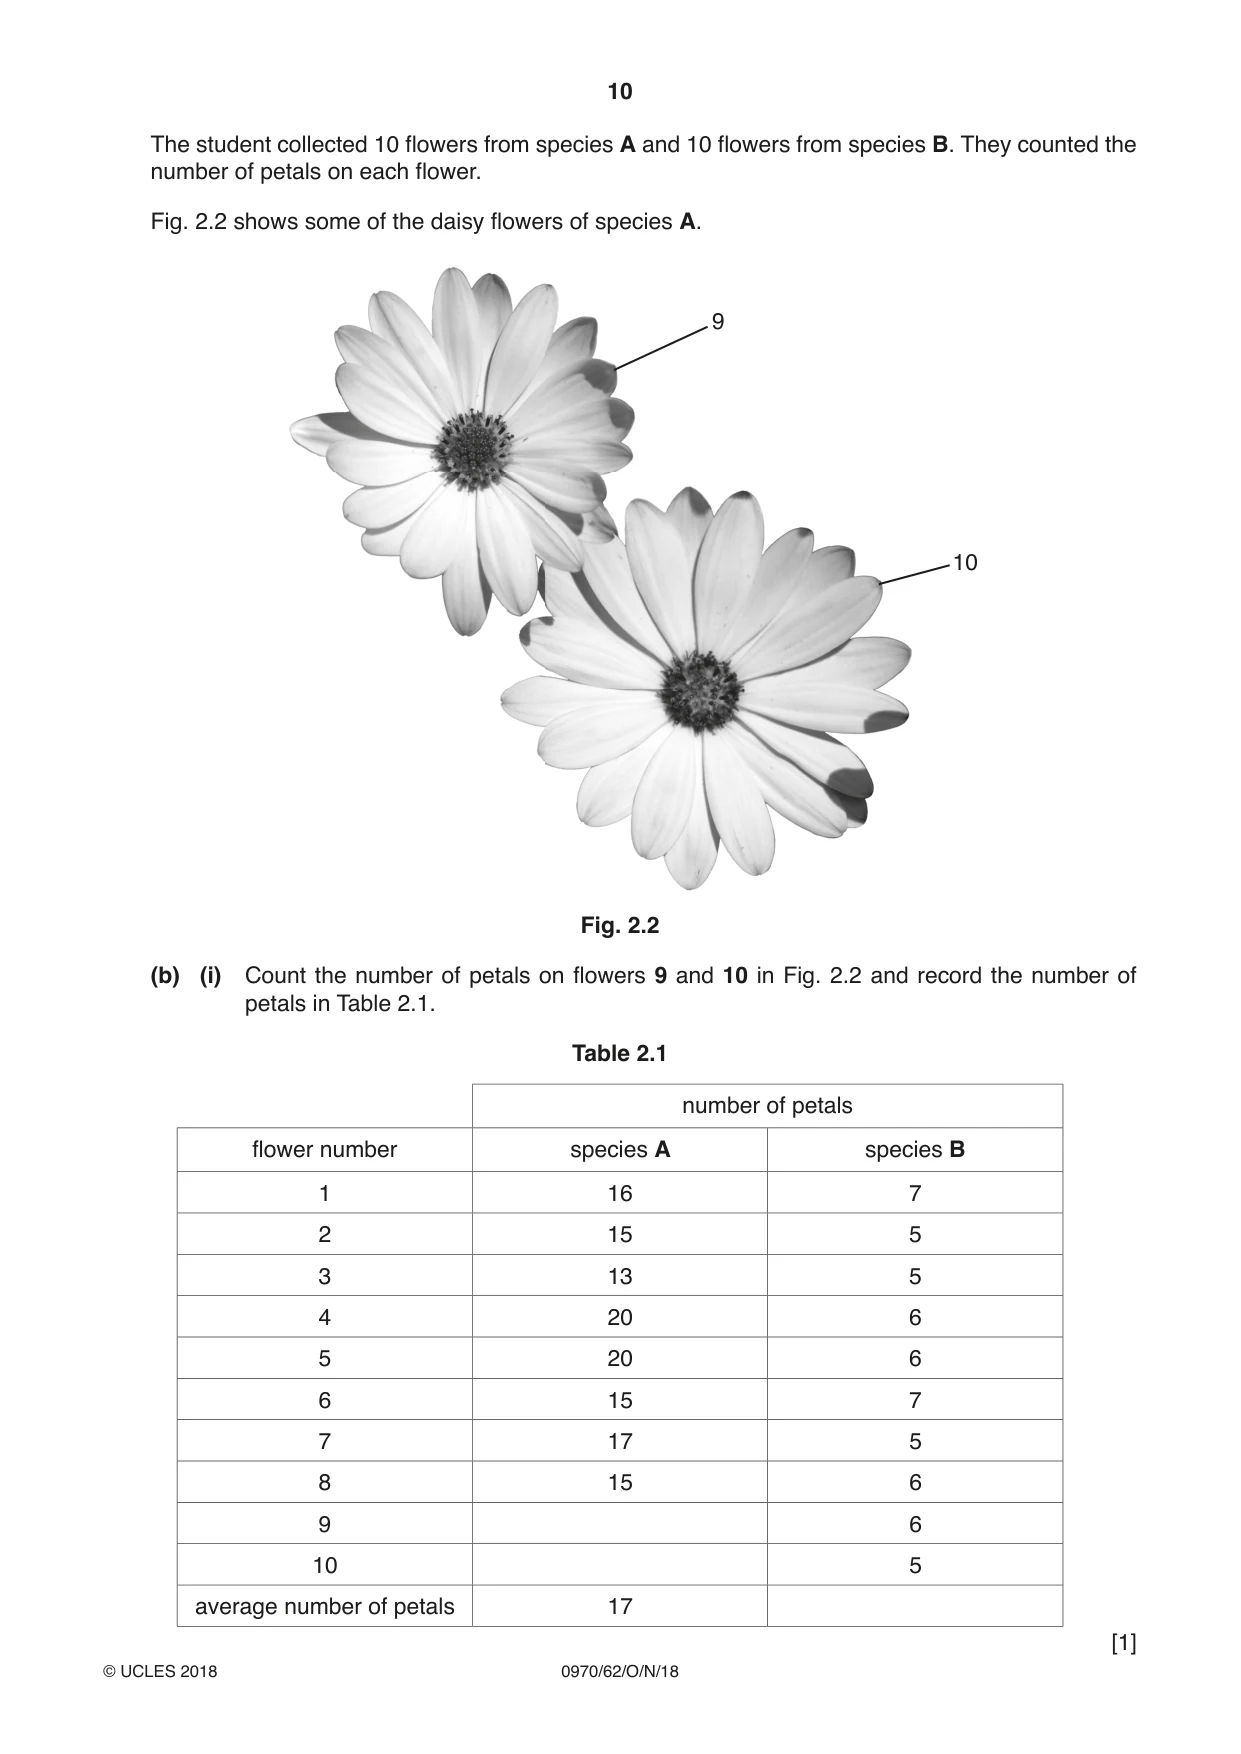
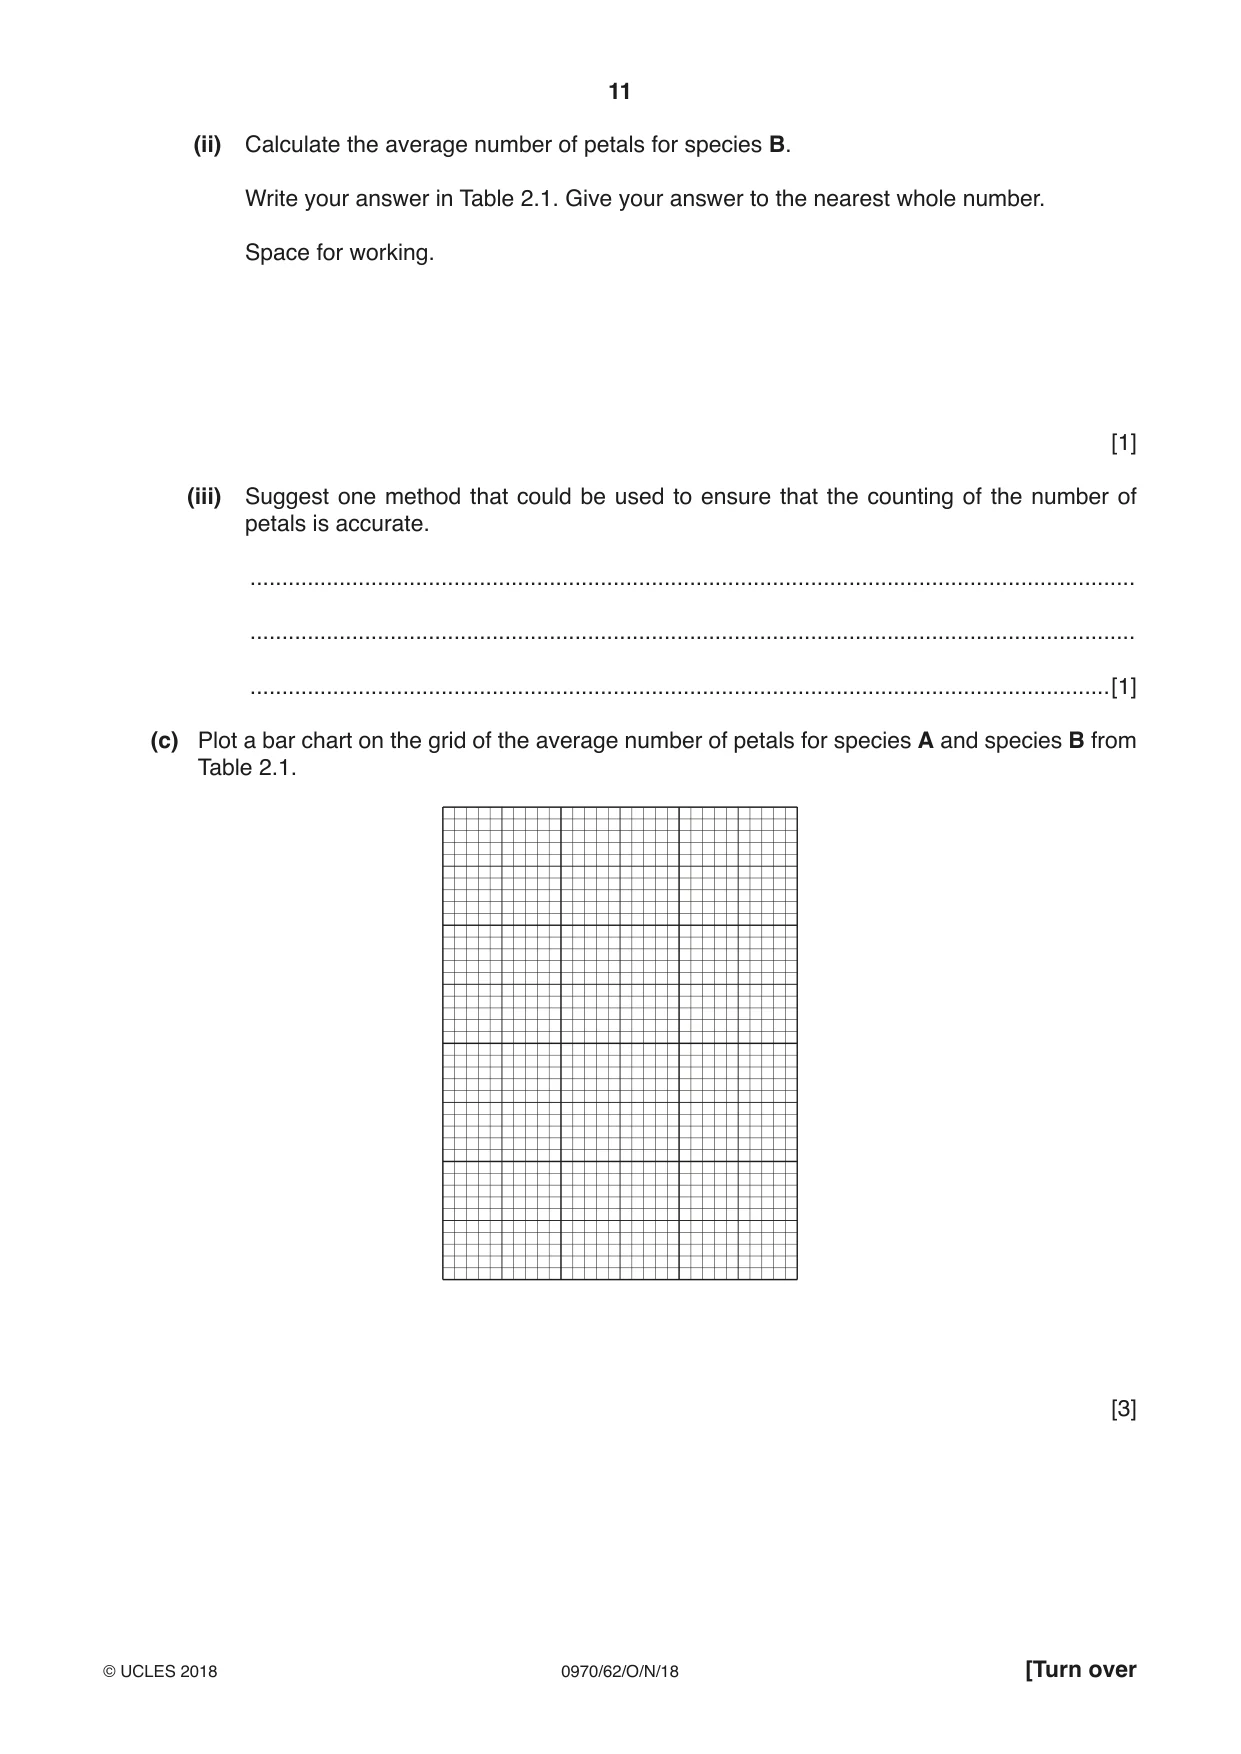
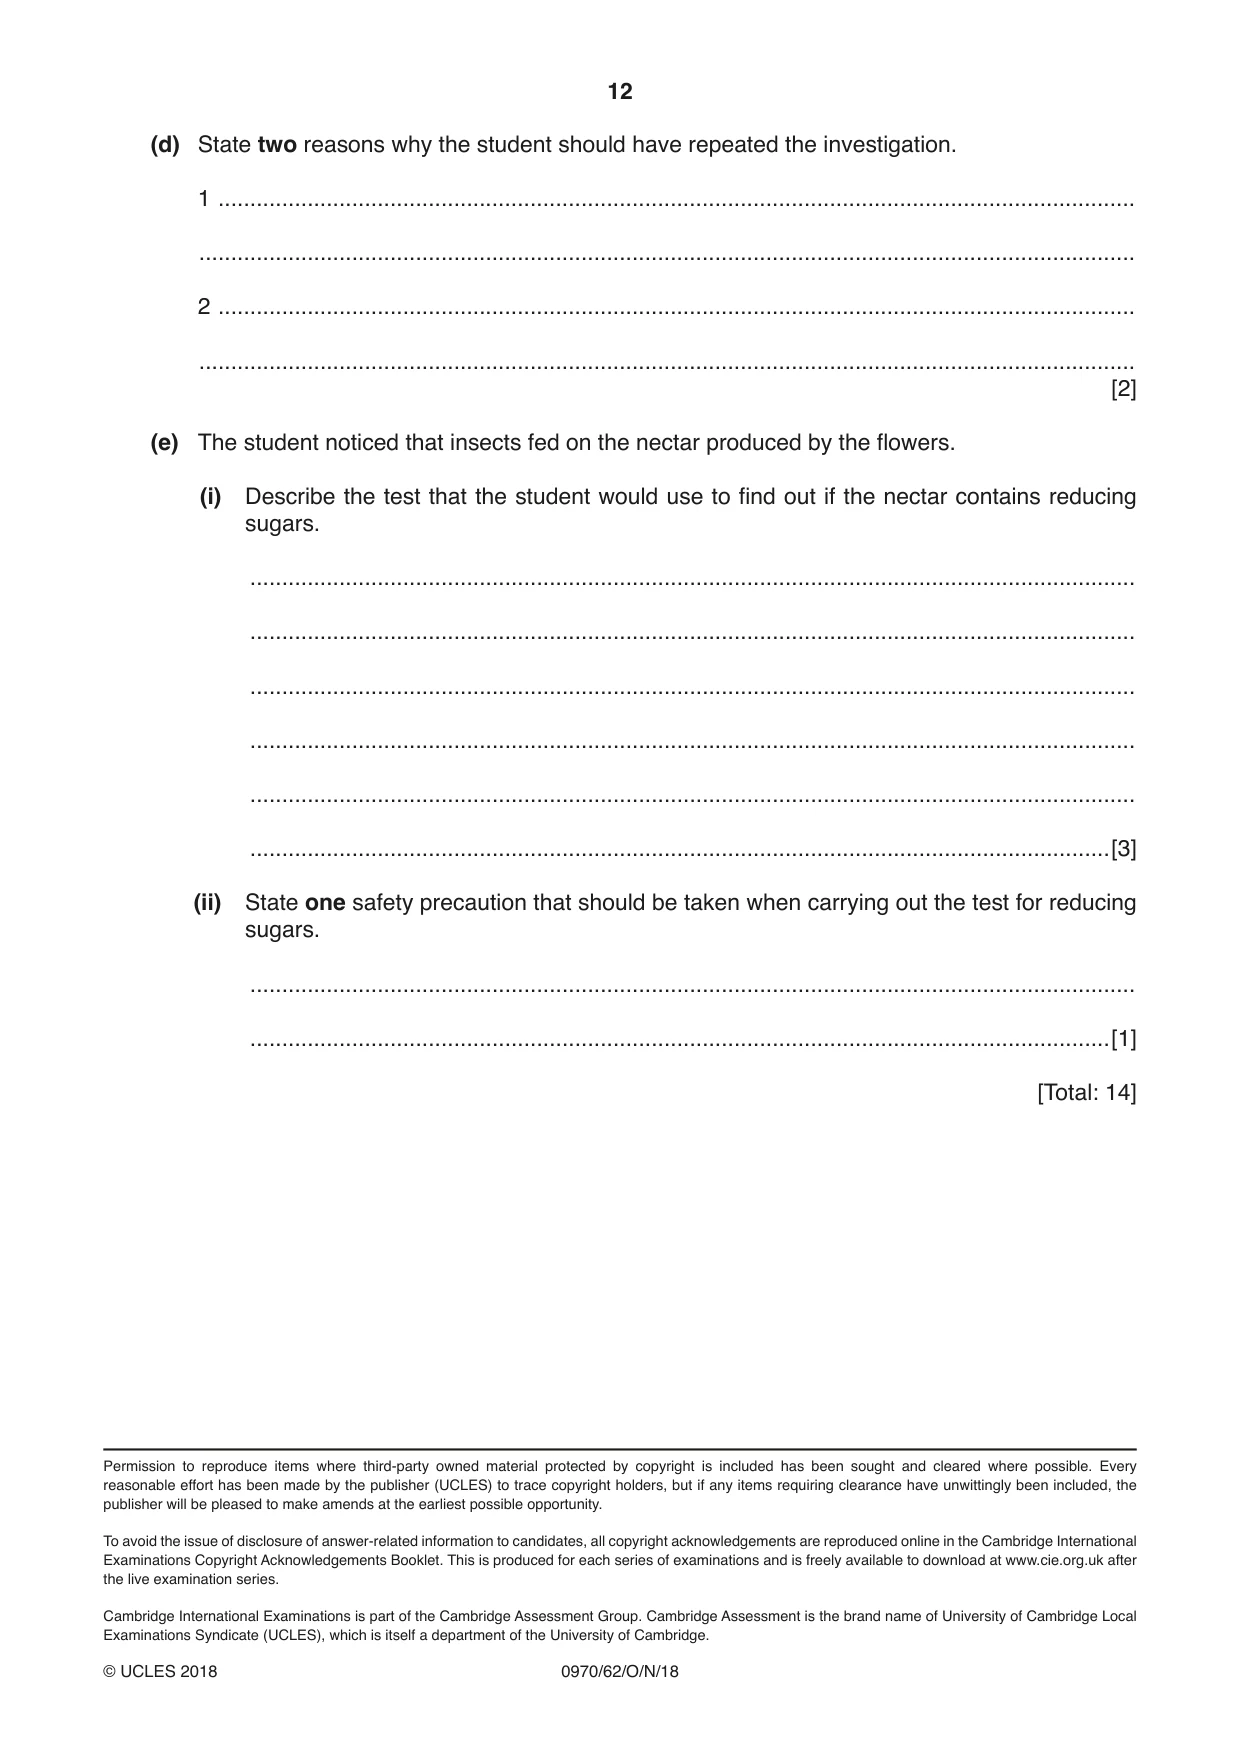
2 A student investigated the number of petals on the flowers of two species of daisy, species A and species B. (a) Fig. 2.1 shows one daisy flower of species A. Y X Fig. 2.1 The actual length of petal XY of the daisy in Fig. 2.1 was measured by the student as 5 mm. Measure the length of petal XY on Fig. 2.1. Include the units. length of XY on Fig. 2.1 ........................................ Use the formula to calculate the magnification of the photograph. length of XY on Fig. 2.1 magnification = actual length of petal XY Show your working. ................................................................ [2] The student collected 10 flowers from species A and 10 flowers from species B. They counted the number of petals on each flower. Fig. 2.2 shows some of the daisy flowers of species A. 9 10 Fig. 2.2 (b) (i) Count the number of petals on flowers 9 and 10 in Fig. 2.2 and record the number of petals in Table 2.1. Table 2.1 number of petals flower number species A species B 1 16 7 2 15 5 3 13 5 4 20 6 5 20 6 6 15 7 7 17 5 8 15 6 9 6 10 5 average number of petals 17 [1] (ii) Calculate the average number of petals for species B. Write your answer in Table 2.1. Give your answer to the nearest whole number. Space for working. [1] (iii) Suggest one method that could be used to ensure that the counting of the number of petals is accurate. ........................................................................................................................................... ........................................................................................................................................... .......................................................................................................................................[1] (c) Plot a bar chart on the grid of the average number of petals for species A and species B from Table 2.1. [3]
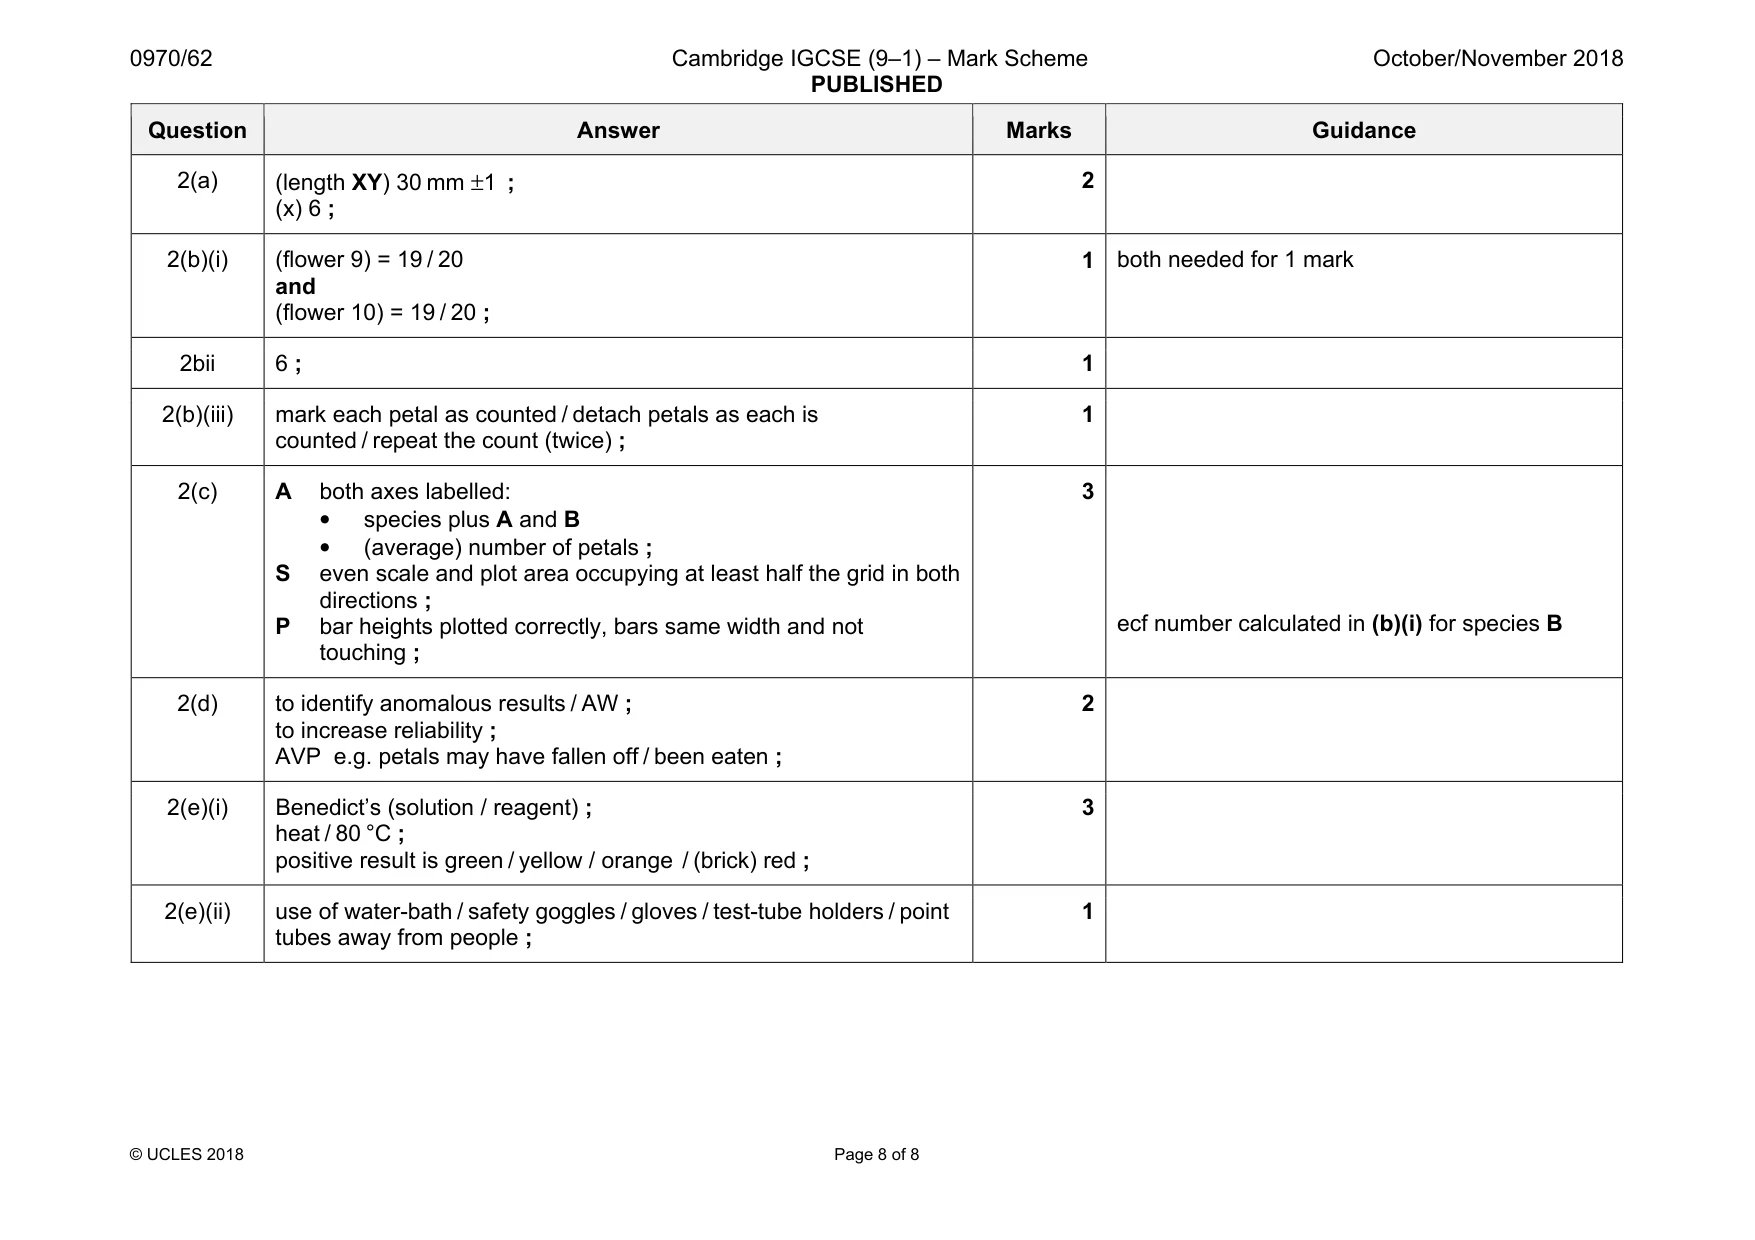
Mark scheme: 2(a) (x) 6 ; 2 2(b)(i) (flower 9) = 19 / 20 and (flower 10) = 19 / 20 ; 1 both needed for 1 mark 2bii 6 ; 1 2(b)(iii) mark each petal as counted / detach petals as each is counted / repeat the count (twice) ; 1 2(c) A both axes labelled: • species plus A and B • (average) number of petals ; S even scale and plot area occupying at least half the grid in both directions ; P bar heights plotted correctly, bars same width and not touching ; 3 ecf number calculated in (b)(i) for species B 2(d) to identify anomalous results / AW ; to increase reliability ; AVP e.g. petals may have fallen off / been eaten ; 2 2(e)(i) Benedict’s (solution / reagent) ; heat / 80 °C ; positive result is green / yellow / orange / (brick) red ; 3 2(e)(ii) use of water-bath / safety goggles / gloves / test-tube holders / point tubes away from people ; 1
What was in this paper
The subtopics covered by these 2 questions, and how many questions each got. Open one in a new tab to see every Cambridge question on it.
What you needed in this session
Cambridge’s own grade thresholds for 2018 Oct/Nov, Paper 6 · Variant 2. A higher threshold means an easier paper — the bar moves with how the cohort did.