Cambridge IGCSE Biology (9-1) 0970 — 2018 May/June Paper 5 · Variant 1
0970/51/M/J/18 · 2 questions · 40 marks · ≈45 min
The question paper and its mark scheme, free to read here and free to download. This is Cambridge’s own paper, exactly as it was sat.
Question paper12 pages
Mark scheme9 pages
Answers below. Sit the paper first if you are practising.
Questions as text
Q1 · Young mammals feed on milk
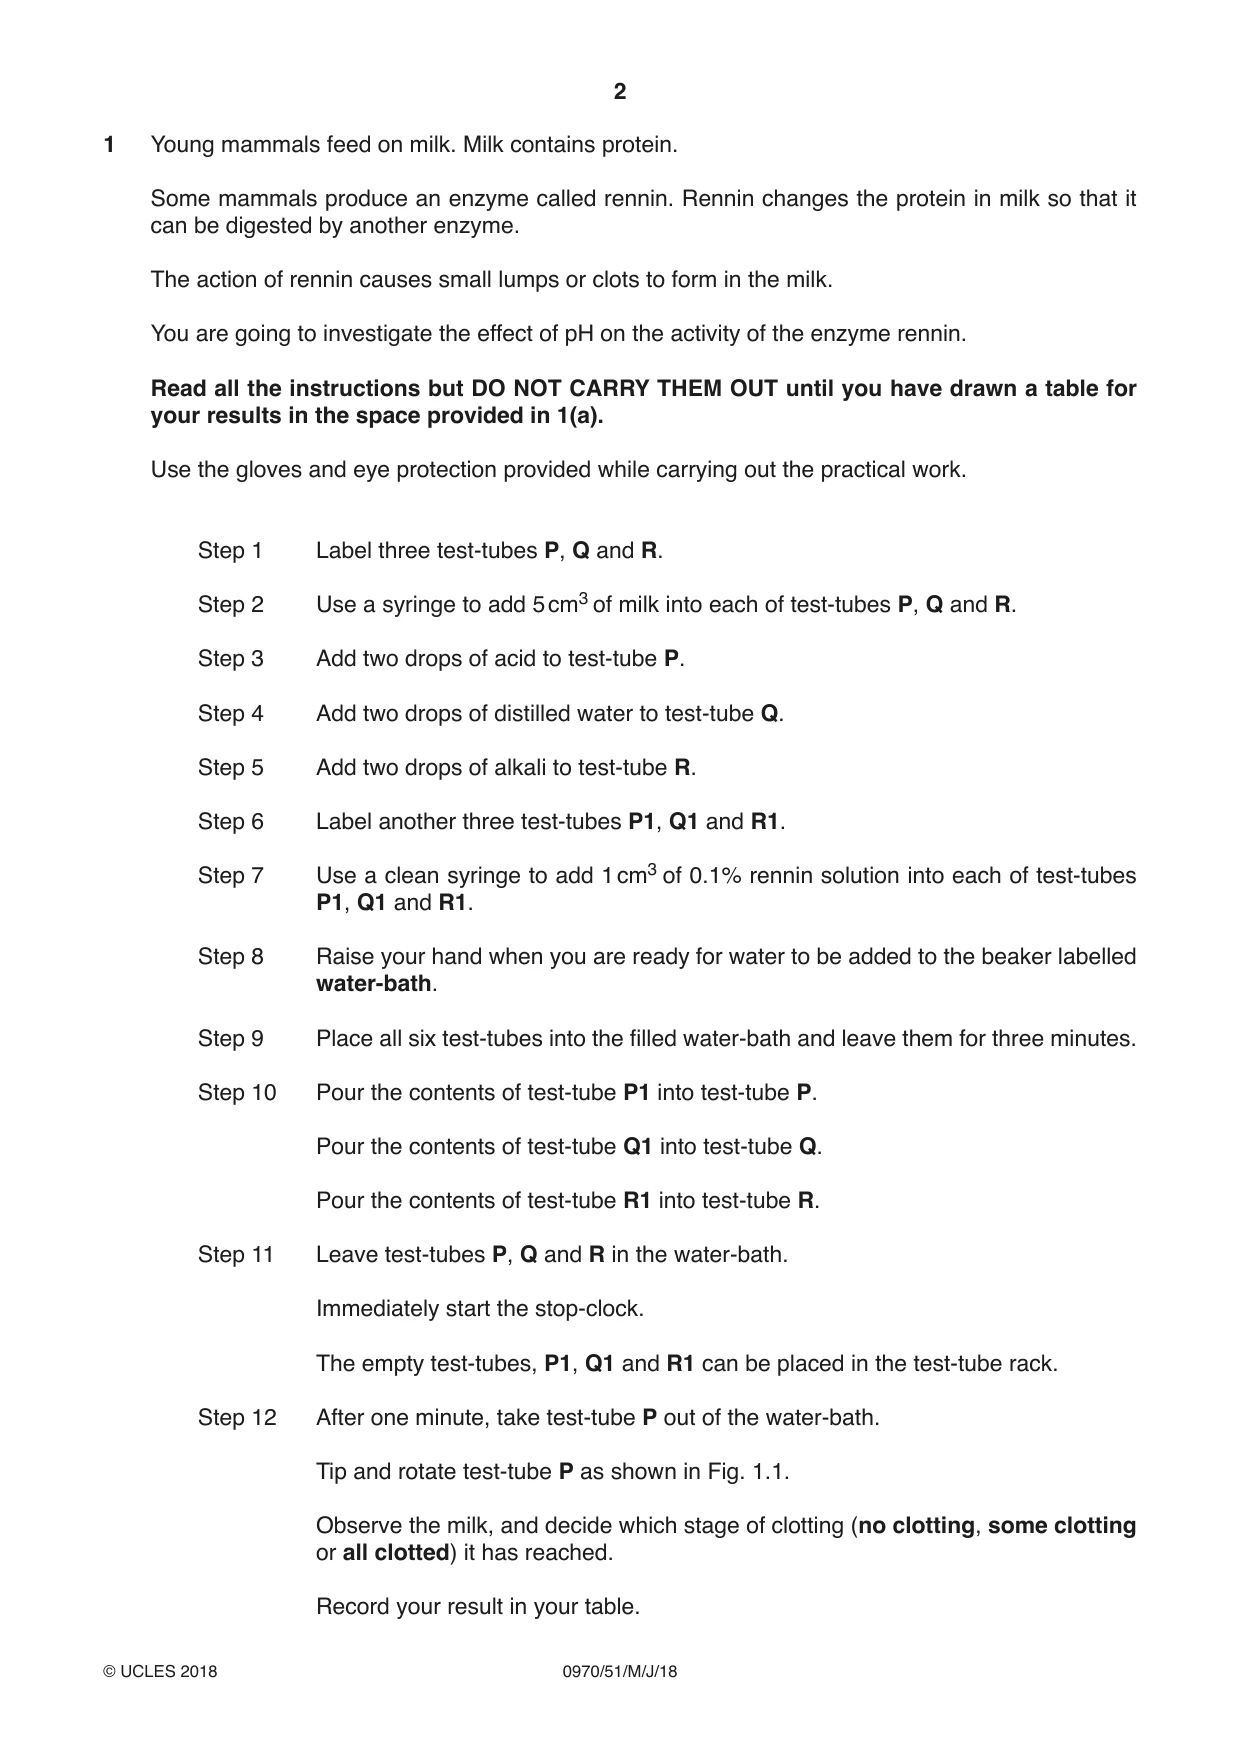
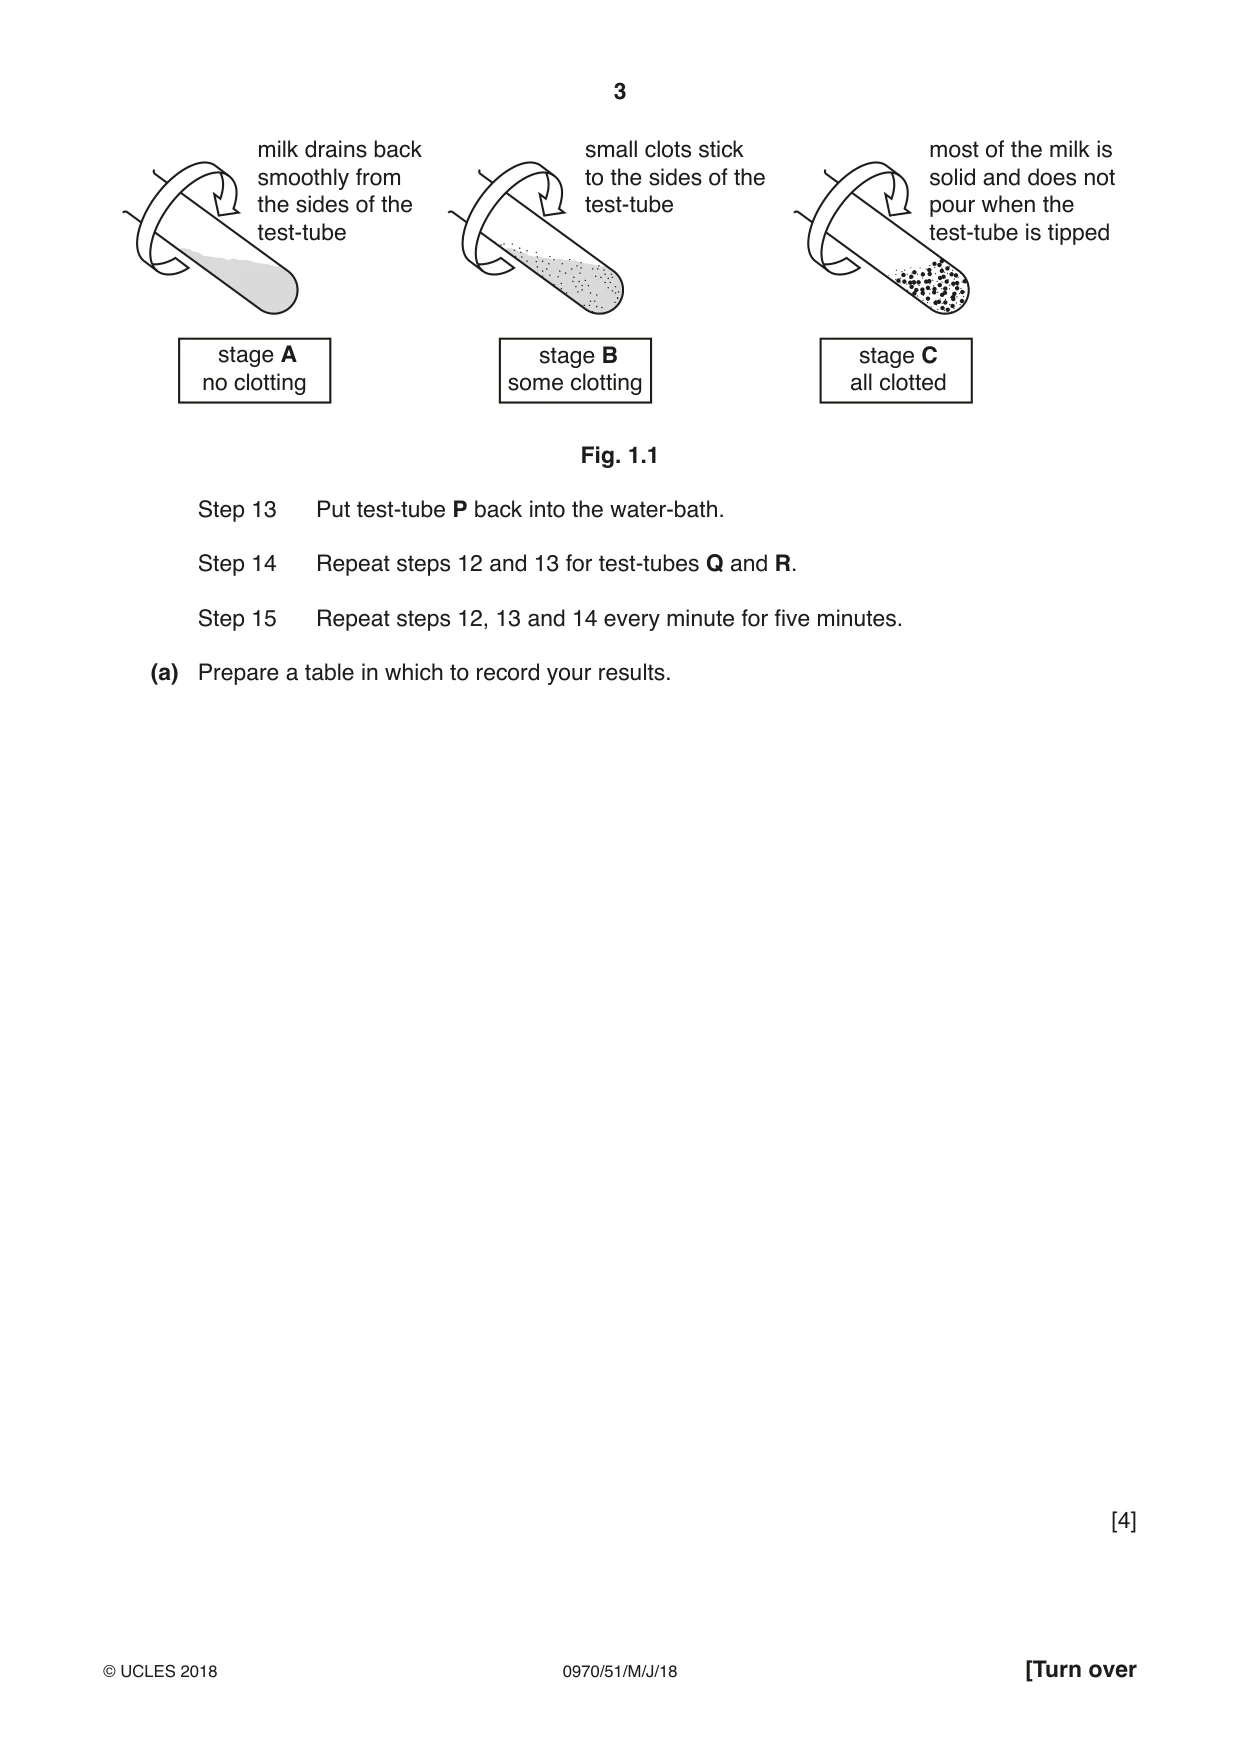
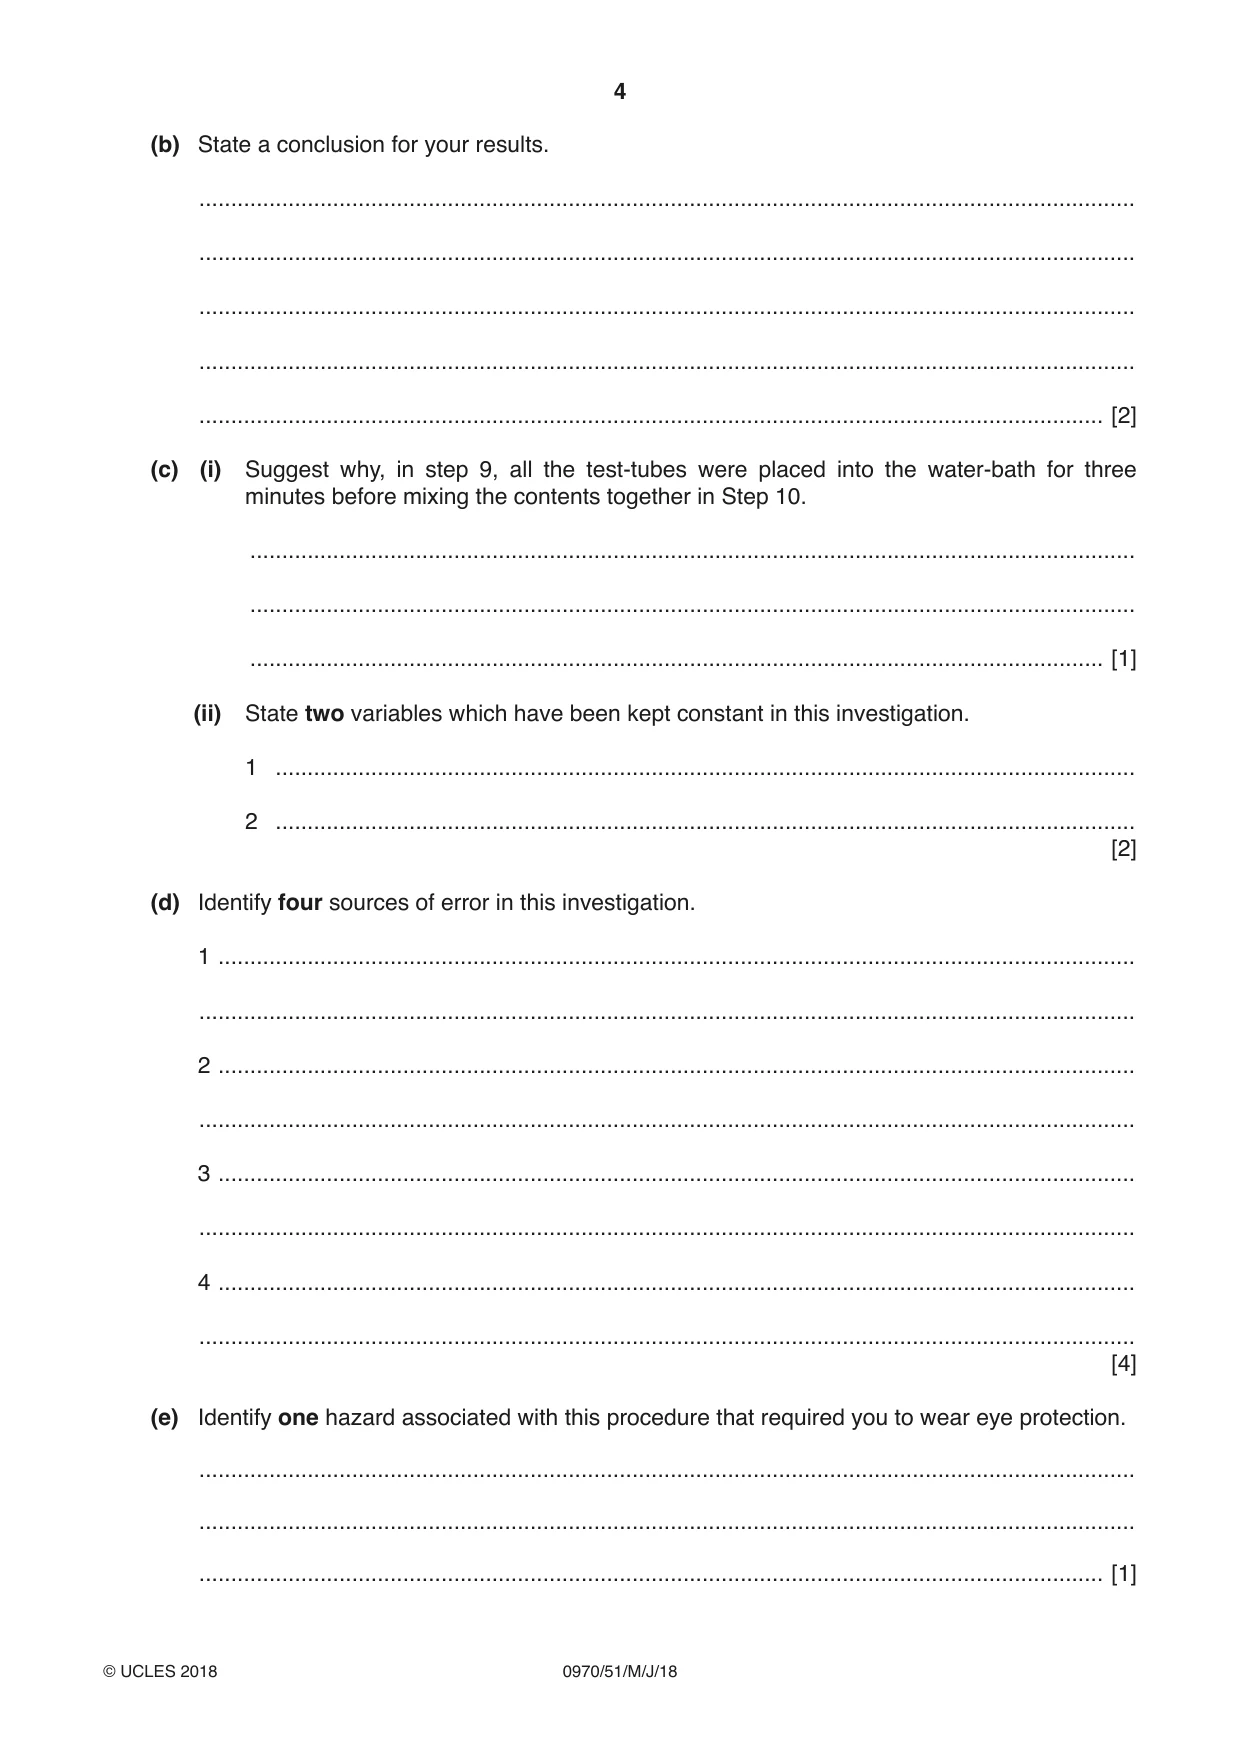
1 Young mammals feed on milk. Milk contains protein. Some mammals produce an enzyme called rennin. Rennin changes the protein in milk so that it can be digested by another enzyme. The action of rennin causes small lumps or clots to form in the milk. You are going to investigate the effect of pH on the activity of the enzyme rennin. Read all the instructions but DO NOT CARRY THEM OUT until you have drawn a table for your results in the space provided in 1(a). Use the gloves and eye protection provided while carrying out the practical work. Step 1 Label three test-tubes P, Q and R. Step 2 Use a syringe to add 5 cm3 of milk into each of test-tubes P, Q and R. Step 3 Add two drops of acid to test-tube P. Step 4 Add two drops of distilled water to test-tube Q. Step 5 Add two drops of alkali to test-tube R. Step 6 Label another three test-tubes P1, Q1 and R1. Step 7 Use a clean syringe to add 1 cm3 of 0.1% rennin solution into each of test-tubes P1, Q1 and R1. Step 8 Raise your hand when you are ready for water to be added to the beaker labelled water-bath. Step 9 Place all six test-tubes into the filled water-bath and leave them for three minutes. Step 10 Pour the contents of test-tube P1 into test-tube P. Pour the contents of test-tube Q1 into test-tube Q. Pour the contents of test-tube R1 into test-tube R. Step 11 Leave test-tubes P, Q and R in the water-bath. Immediately start the stop-clock. The empty test-tubes, P1, Q1 and R1 can be placed in the test-tube rack. Step 12 After one minute, take test-tube P out of the water-bath. Tip and rotate test-tube P as shown in Fig. 1.1. Observe the milk, and decide which stage of clotting (no clotting, some clotting or all clotted) it has reached. Record your result in your table. milk drains back small clots stick most of the milk is smoothly from to the sides of the solid and does not the sides of the test-tube pour when the test-tube test-tube is tipped stage A stage B stage C no clotting some clotting all clotted Fig. 1.1 Step 13 Put test-tube P back into the water-bath. Step 14 Repeat steps 12 and 13 for test-tubes Q and R. Step 15 Repeat steps 12, 13 and 14 every minute for five minutes. (a) Prepare a table in which to record your results. [4] (b) State a conclusion for your results. ................................................................................................................................................... ................................................................................................................................................... ................................................................................................................................................... ................................................................................................................................................... .............................................................................................................................................. [2] (c) (i) Suggest why, in step 9, all the test-tubes were placed into the water-bath for three minutes before mixing the contents together in Step 10. ........................................................................................................................................... ........................................................................................................................................... ...................................................................................................................................... [1] (ii) State two variables which have been kept constant in this investigation. 1 ....................................................................................................................................... 2 ....................................................................................................................................... [2] (d) Identify four sources of error in this investigation. 1 ................................................................................................................................................ ................................................................................................................................................... 2 ................................................................................................................................................ ................................................................................................................................................... 3 ................................................................................................................................................ ................................................................................................................................................... 4 ................................................................................................................................................ ................................................................................................................................................... [4] (e) Identify one hazard associated with this procedure that required you to wear eye protection. ................................................................................................................................................... ................................................................................................................................................... .............................................................................................................................................. [1] (f) Clotting separates milk into a solid part and a liquid part. Describe how you could find out if there was any protein remaining in the liquid part. ................................................................................................................................................... ................................................................................................................................................... ................................................................................................................................................... .............................................................................................................................................. [2] (g) After rennin has changed the protein in milk into a white solid, protease enzymes can be used to digest the protein. The digested protein forms a colourless liquid. A hypothesis stated: The optimum temperature for protease enzymes to digest changed milk protein is 37 °C. Describe a method that could be used to test this hypothesis. Do not carry out this investigation. ................................................................................................................................................... ................................................................................................................................................... ................................................................................................................................................... ................................................................................................................................................... ................................................................................................................................................... ................................................................................................................................................... ................................................................................................................................................... ................................................................................................................................................... ................................................................................................................................................... ................................................................................................................................................... ................................................................................................................................................... ................................................................................................................................................... .............................................................................................................................................. [6] [Total: 22]
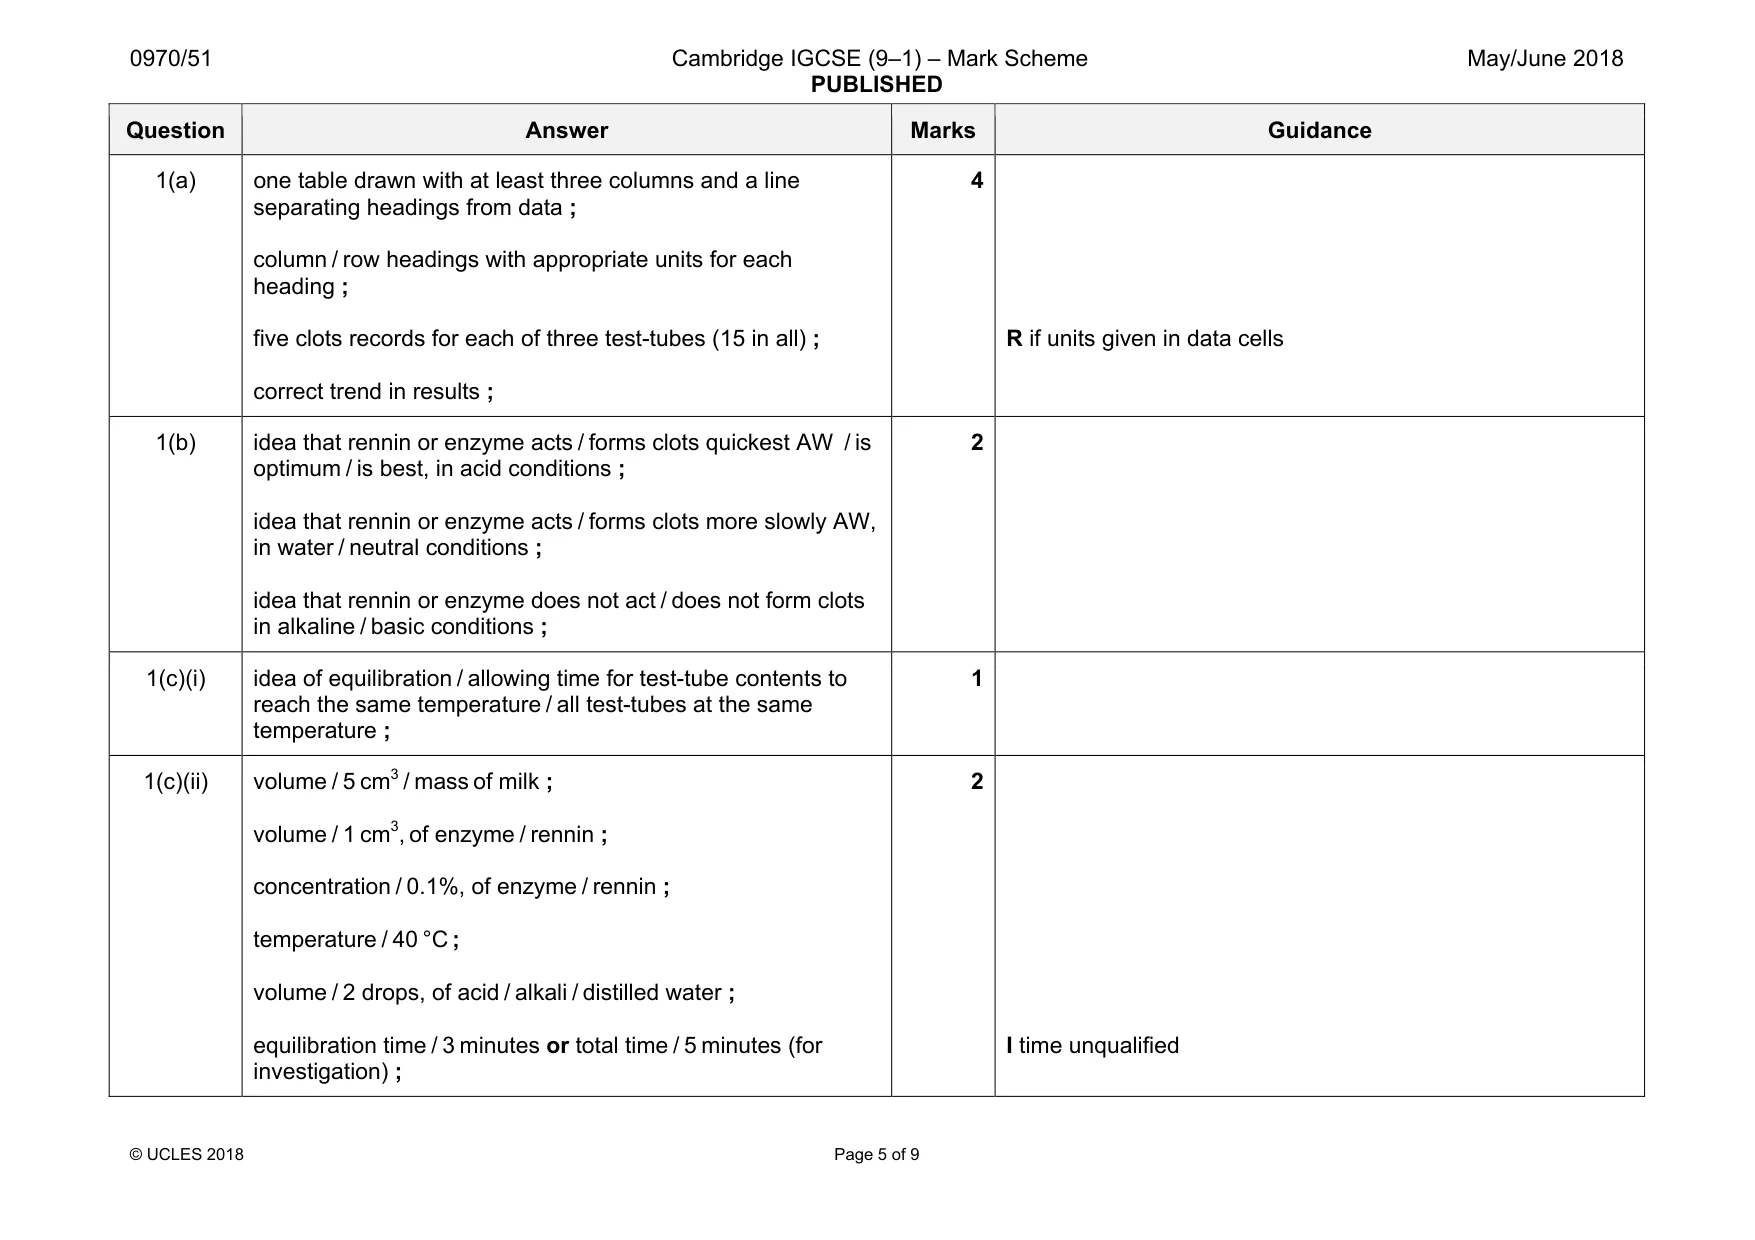
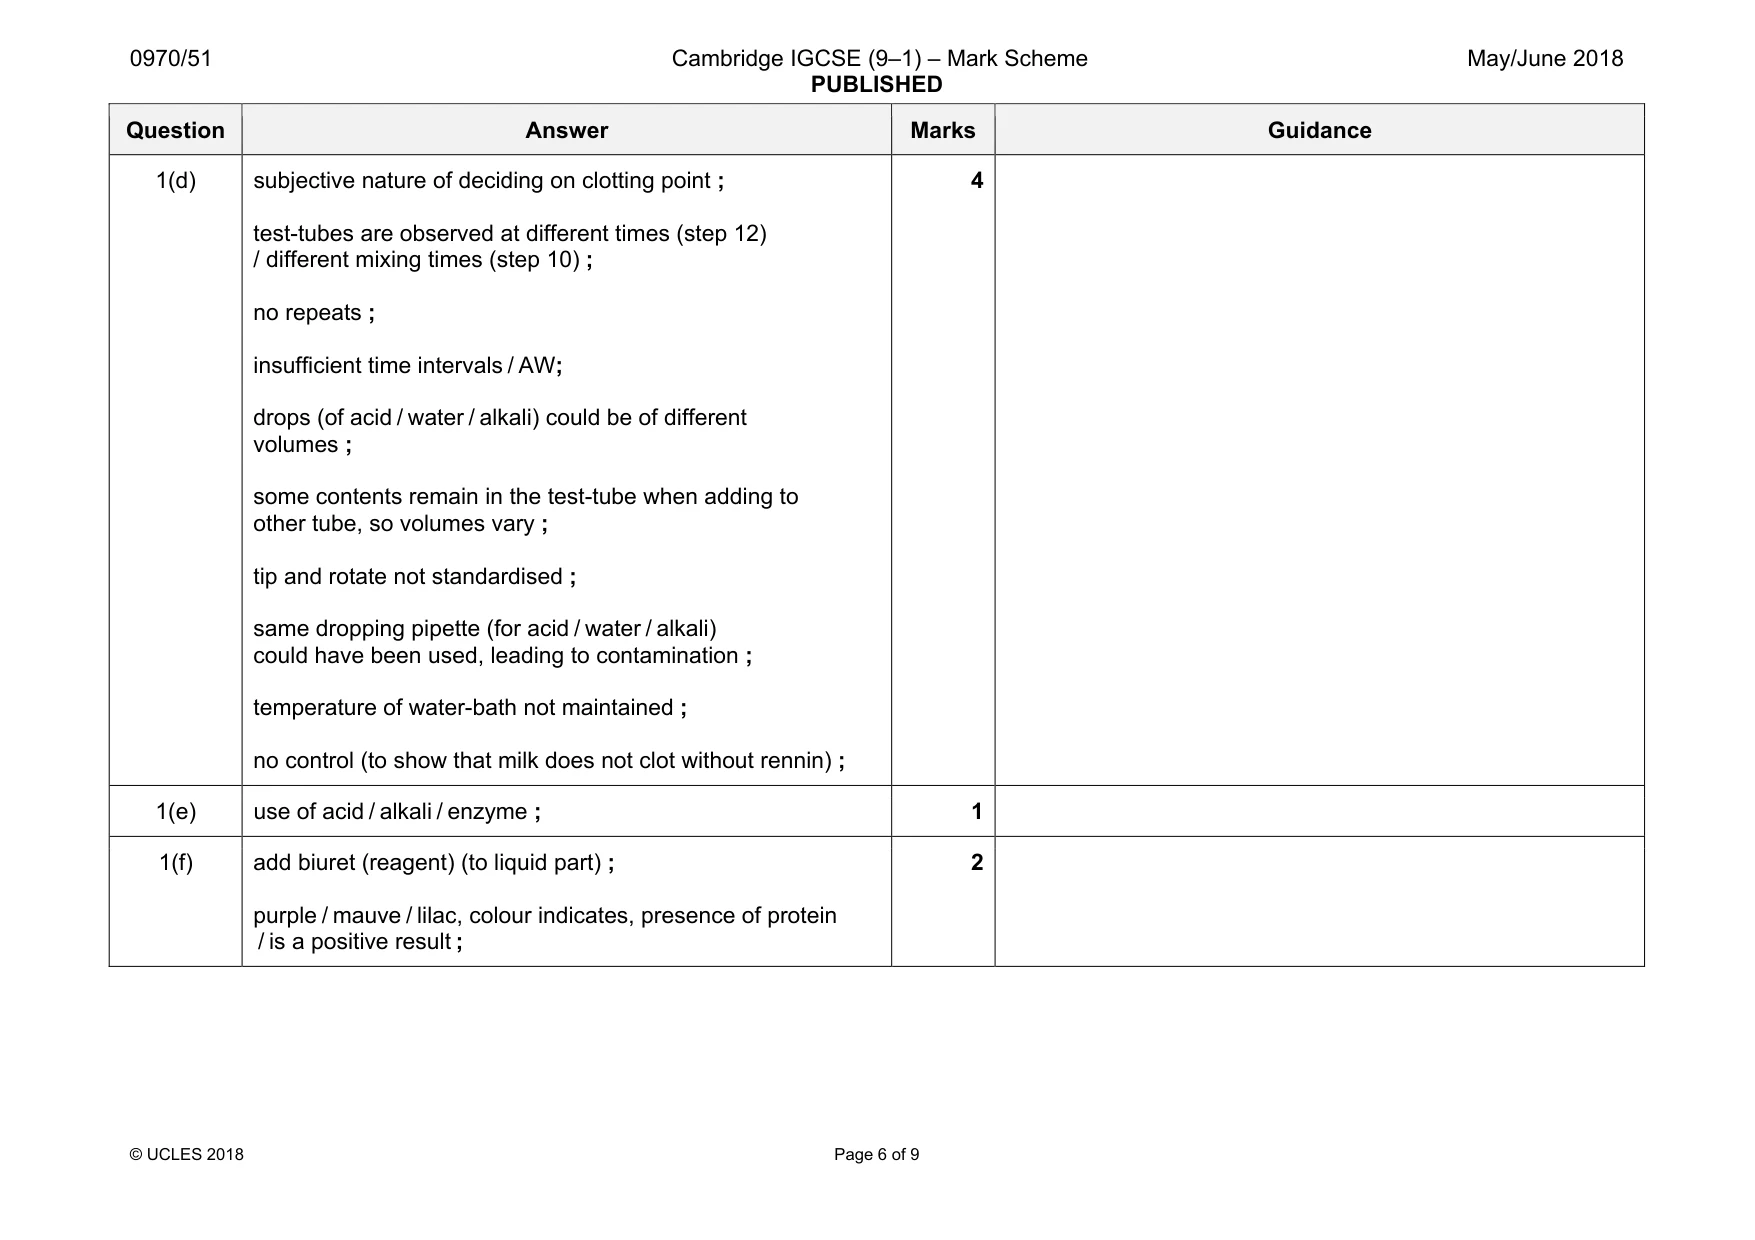
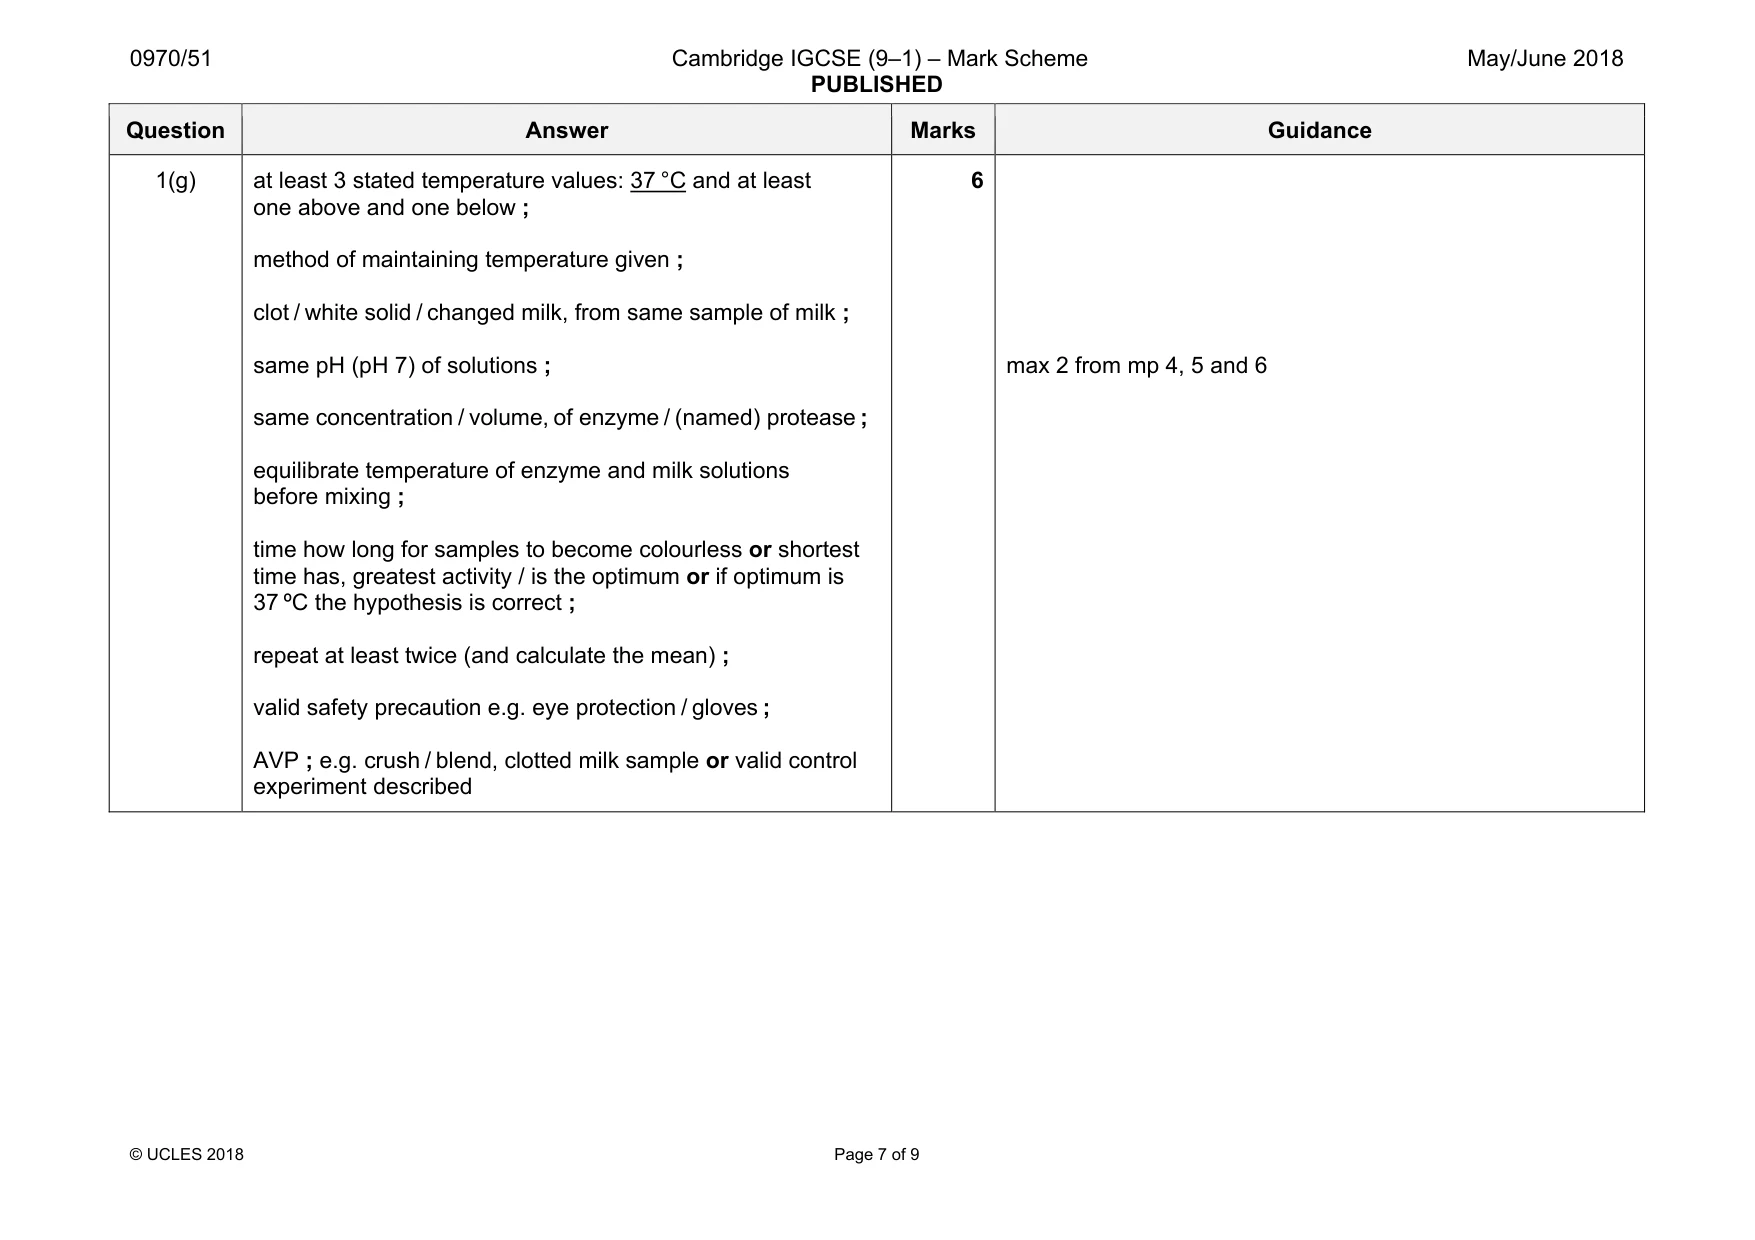
Mark scheme: 1(a) one table drawn with at least three columns and a line separating headings from data ; column / row headings with appropriate units for each heading ; five clots records for each of three test-tubes (15 in all) ; correct trend in results ; R if units given in data cells 1(b) idea that rennin or enzyme acts / forms clots quickest AW / is optimum / is best, in acid conditions ; idea that rennin or enzyme acts / forms clots more slowly AW, in water / neutral conditions ; idea that rennin or enzyme does not act / does not form clots in alkaline / basic conditions ; 2 1(c)(i) idea of equilibration / allowing time for test-tube contents to reach the same temperature / all test-tubes at the same temperature ; 1 1(c)(ii) volume / 5 cm3 / mass of milk ; volume / 1 cm3, of enzyme / rennin ; concentration / 0.1%, of enzyme / rennin ; temperature / 40 °C ; volume / 2 drops, of acid / alkali / distilled water ; equilibration time / 3 minutes or total time / 5 minutes (for investigation) ; 2 I time unqualified Question Answer Marks Guidance 1(d) subjective nature of deciding on clotting point ; test-tubes are observed at different times (step 12) / different mixing times (step 10) ; no repeats ; insufficient time intervals / AW; drops (of acid / water / alkali) could be of different volumes ; some contents remain in the test-tube when adding to other tube, so volumes vary ; tip and rotate not standardised ; same dropping pipette (for acid / water / alkali) could have been used, leading to contamination ; temperature of water-bath not maintained ; no control (to show that milk does not clot without rennin) ; 4 1(e) use of acid / alkali / enzyme ; 1 1(f) add biuret (reagent) (to liquid part) ; purple / mauve / lilac, colour indicates, presence of protein / is a positive result ; 2 Question Answer Marks Guidance 1(g) at least 3 stated temperature values: 37 °C and at least one above and one below ; method of maintaining temperature given ; clot / white solid / changed milk, from same sample of milk ; same pH (pH 7) of solutions ; same concentration / volume, of enzyme / (named) protease ; equilibrate temperature of enzyme and milk solutions before mixing ; time how long for samples to become colourless or shortest time has, greatest activity / is the optimum or if optimum is 37 ºC the hypothesis is correct ; repeat at least twice (and calculate the mean) ; valid safety precaution e.g. eye protection / gloves ; AVP ; e.g. crush / blend, clotted milk sample or valid control experiment described 6 max 2 from mp 4, 5 and 6
Q2 · A student wanted to investigate a garden ecosystem
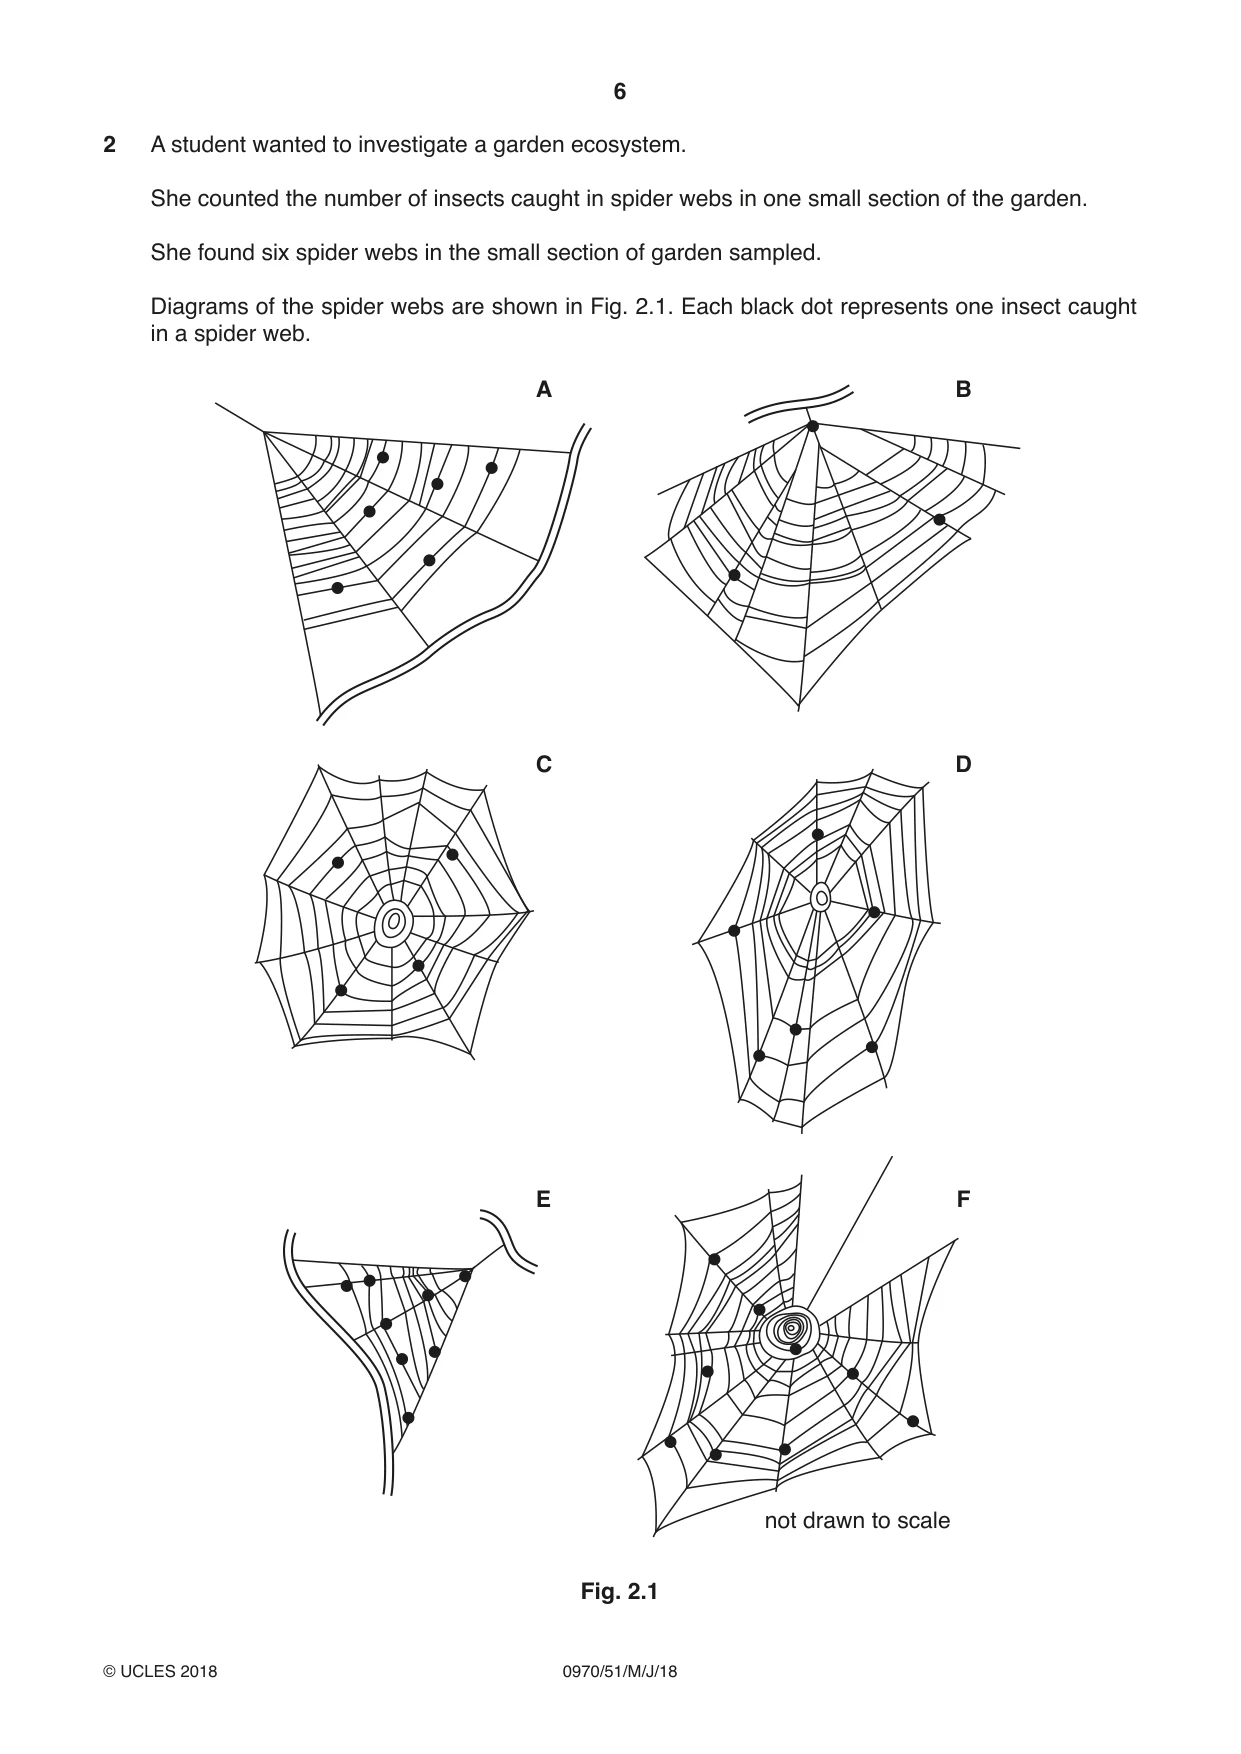
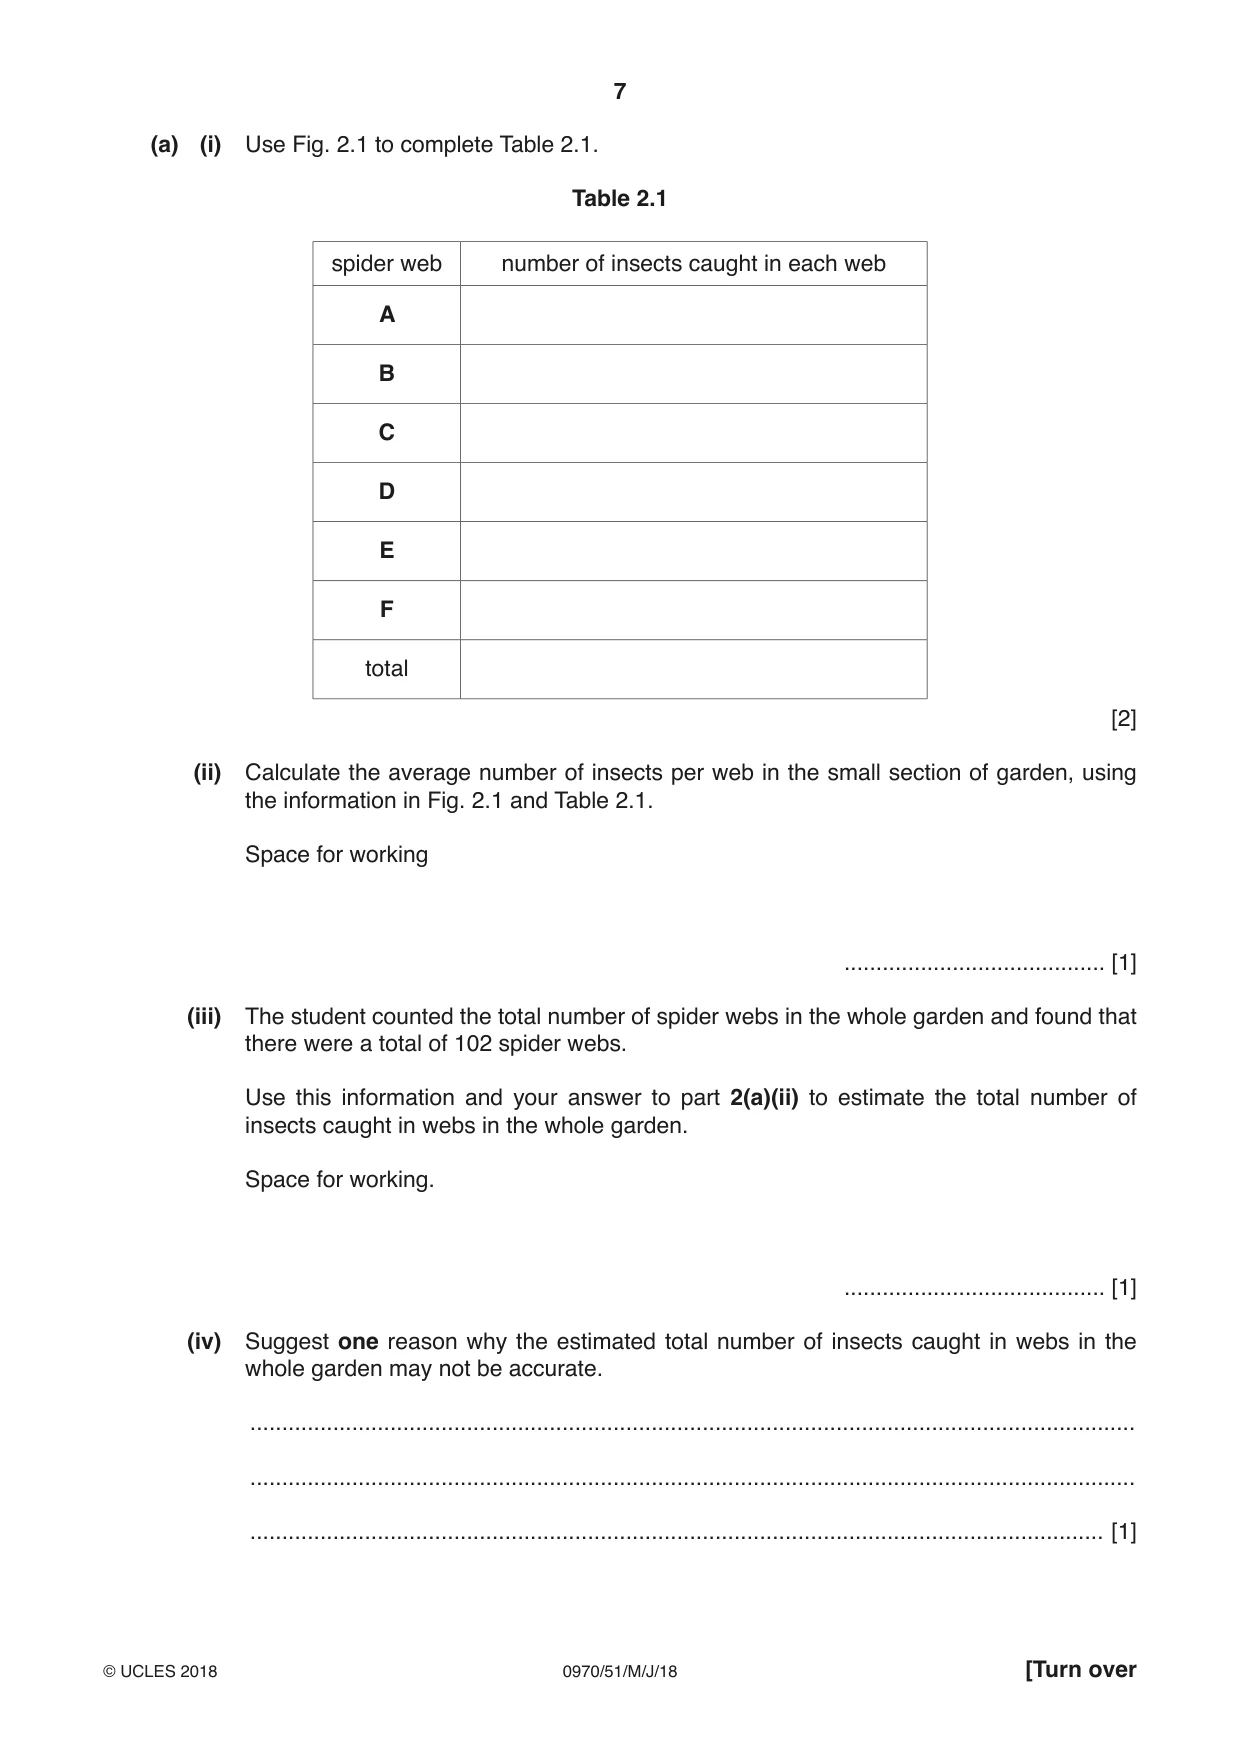
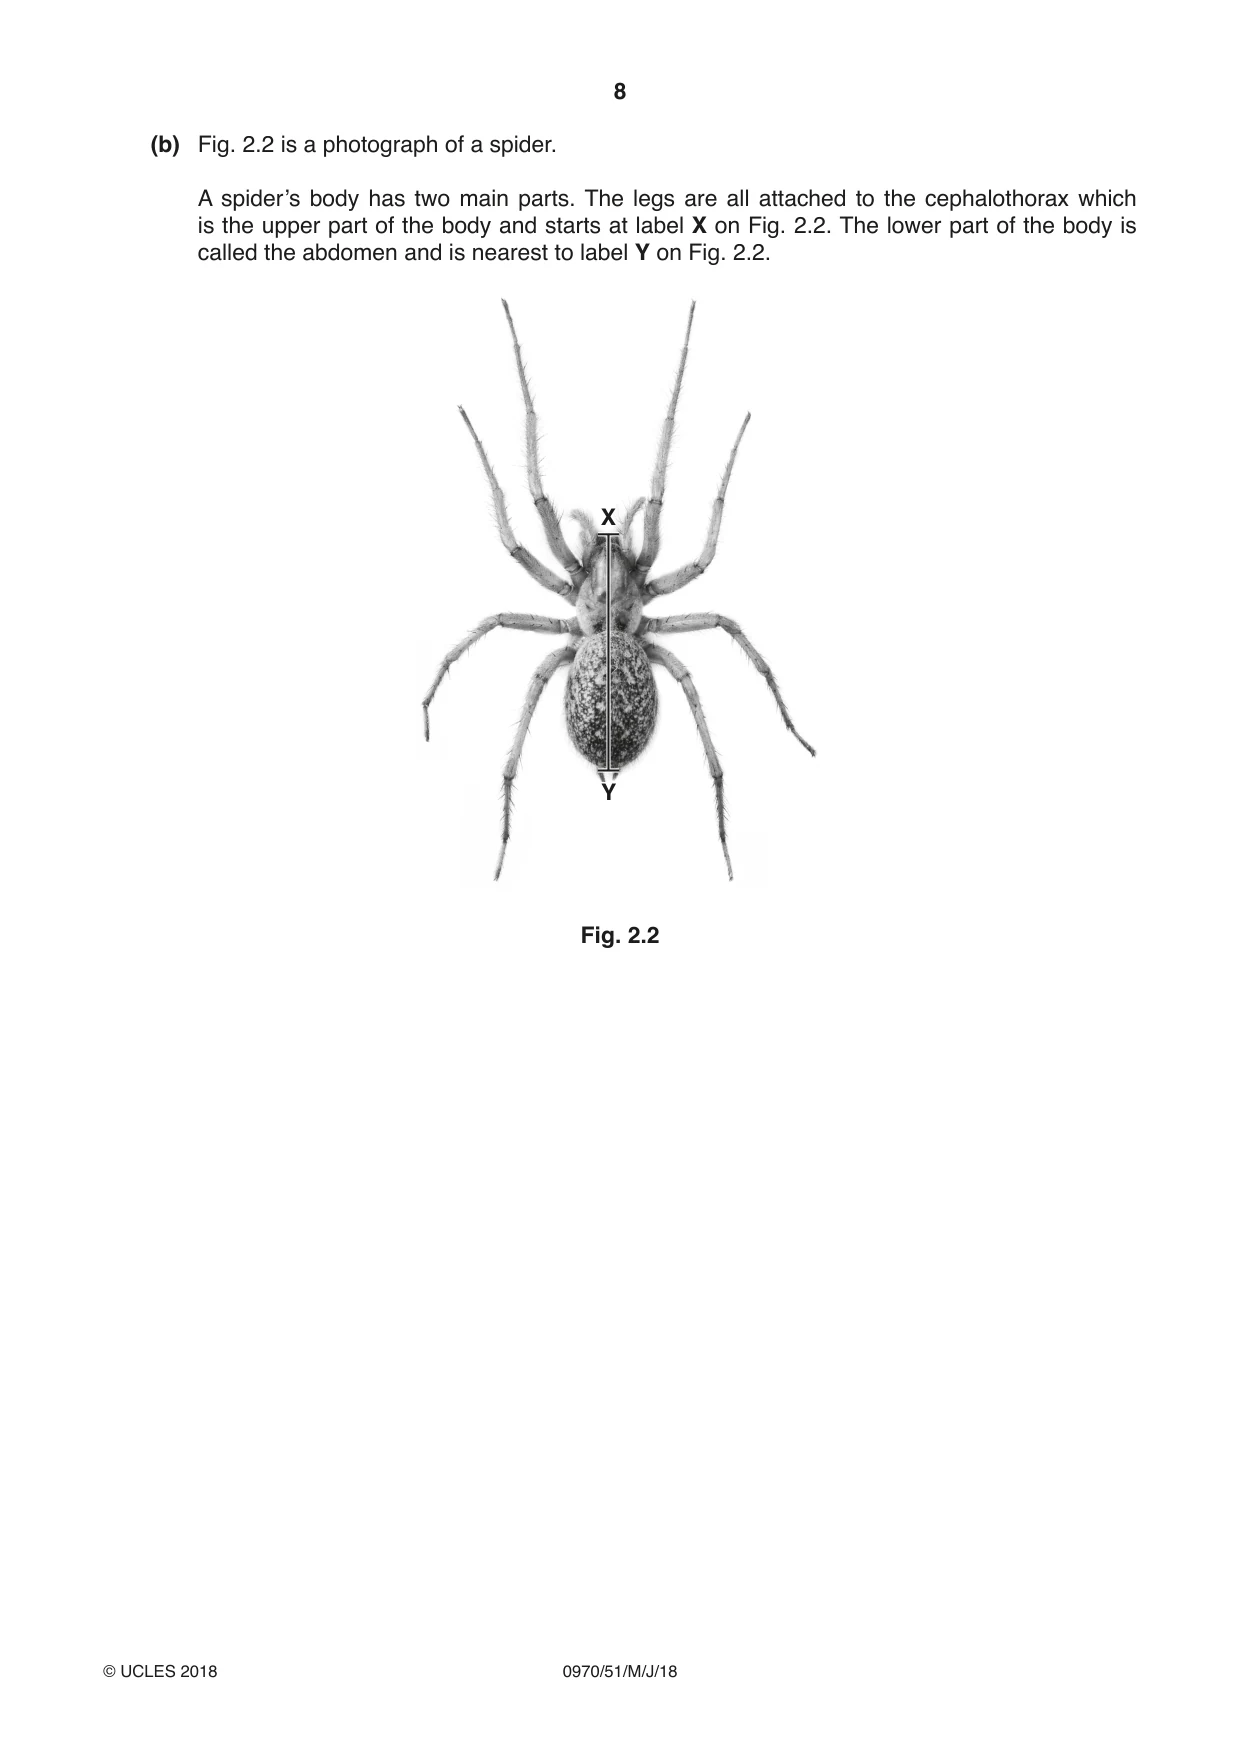
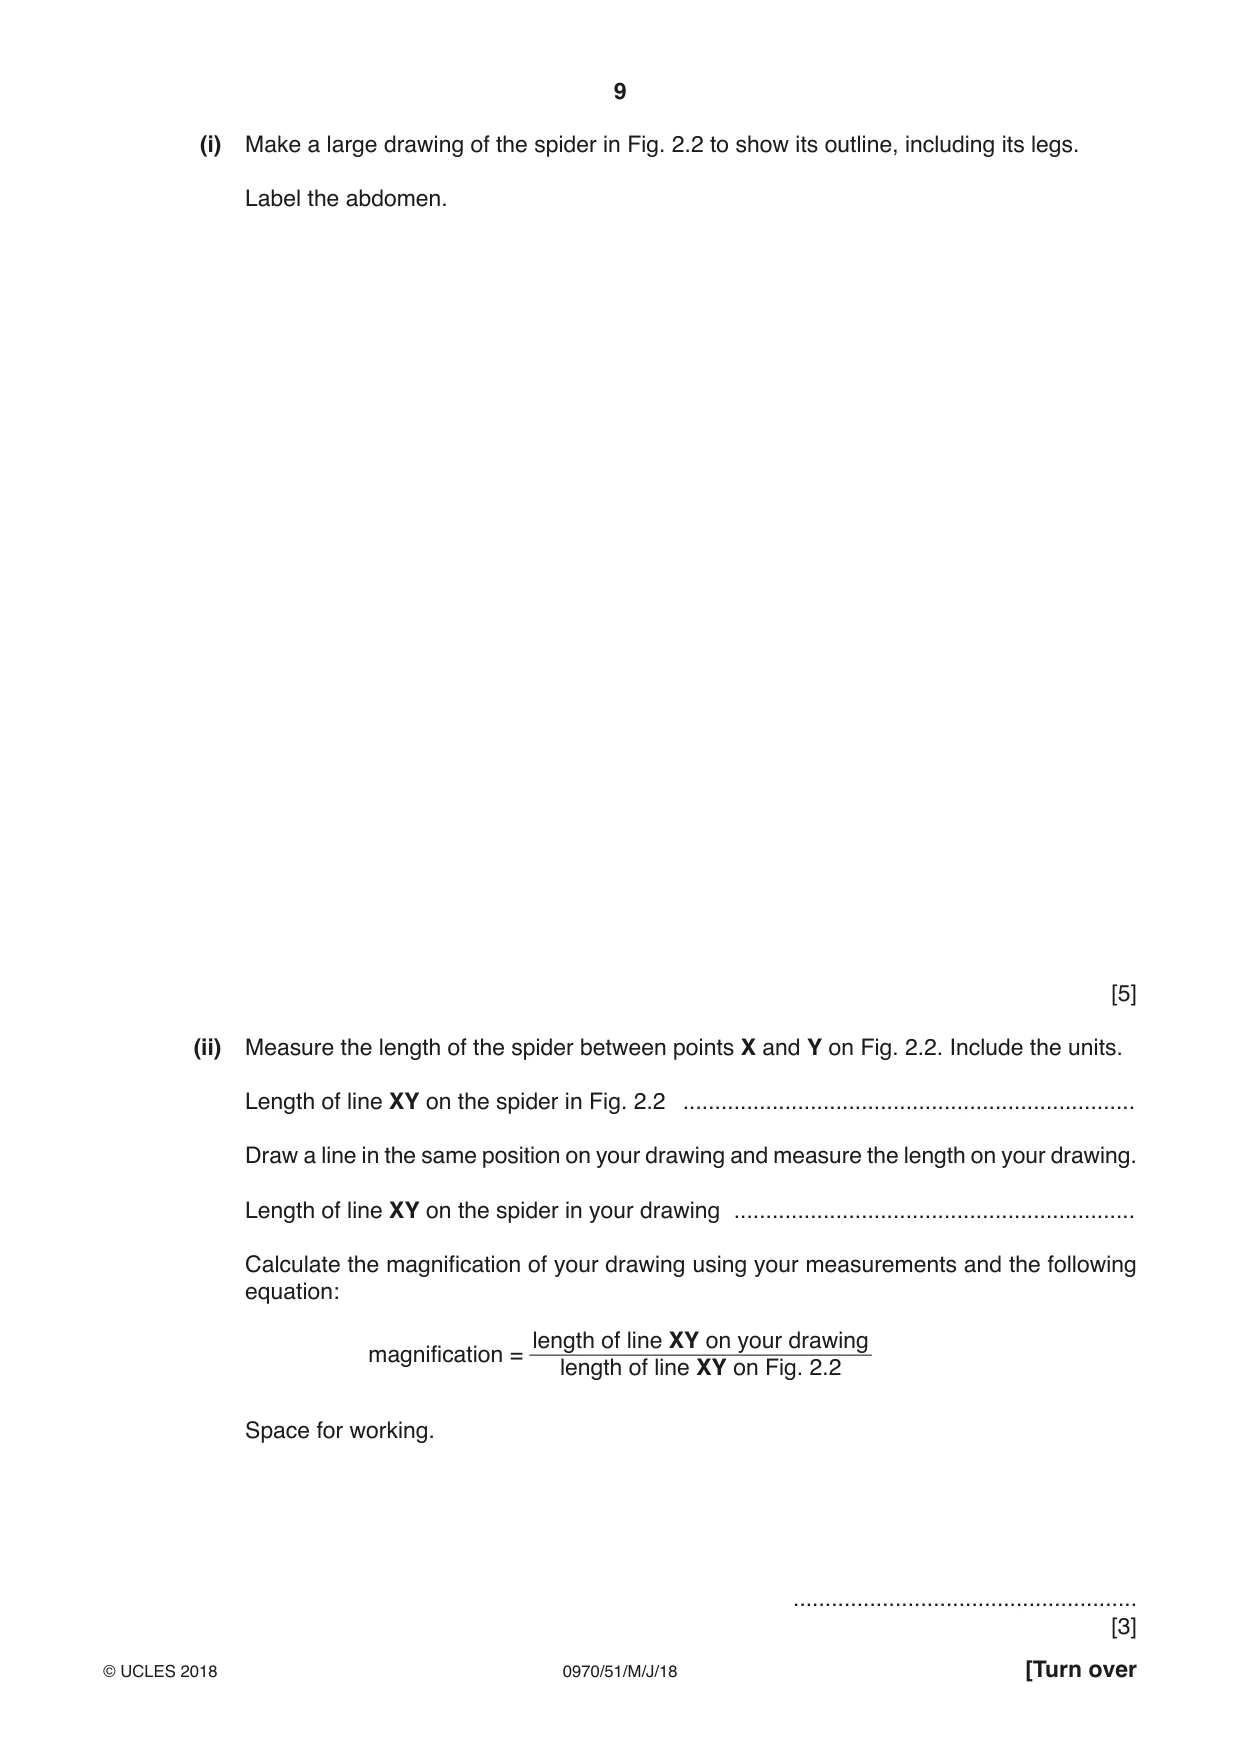
2 A student wanted to investigate a garden ecosystem. She counted the number of insects caught in spider webs in one small section of the garden. She found six spider webs in the small section of garden sampled. Diagrams of the spider webs are shown in Fig. 2.1. Each black dot represents one insect caught in a spider web. A B C D E F not drawn to scale Fig. 2.1 (a) (i) Use Fig. 2.1 to complete Table 2.1. Table 2.1 spider web number of insects caught in each web A B C D E F total [2] (ii) Calculate the average number of insects per web in the small section of garden, using the information in Fig. 2.1 and Table 2.1. Space for working ......................................... [1] (iii) The student counted the total number of spider webs in the whole garden and found that there were a total of 102 spider webs. Use this information and your answer to part 2(a)(ii) to estimate the total number of insects caught in webs in the whole garden. Space for working. ......................................... [1] (iv) Suggest one reason why the estimated total number of insects caught in webs in the whole garden may not be accurate. ........................................................................................................................................... ........................................................................................................................................... ...................................................................................................................................... [1] (b) Fig. 2.2 is a photograph of a spider. A spider’s body has two main parts. The legs are all attached to the cephalothorax which is the upper part of the body and starts at label X on Fig. 2.2. The lower part of the body is called the abdomen and is nearest to label Y on Fig. 2.2. X Y Fig. 2.2
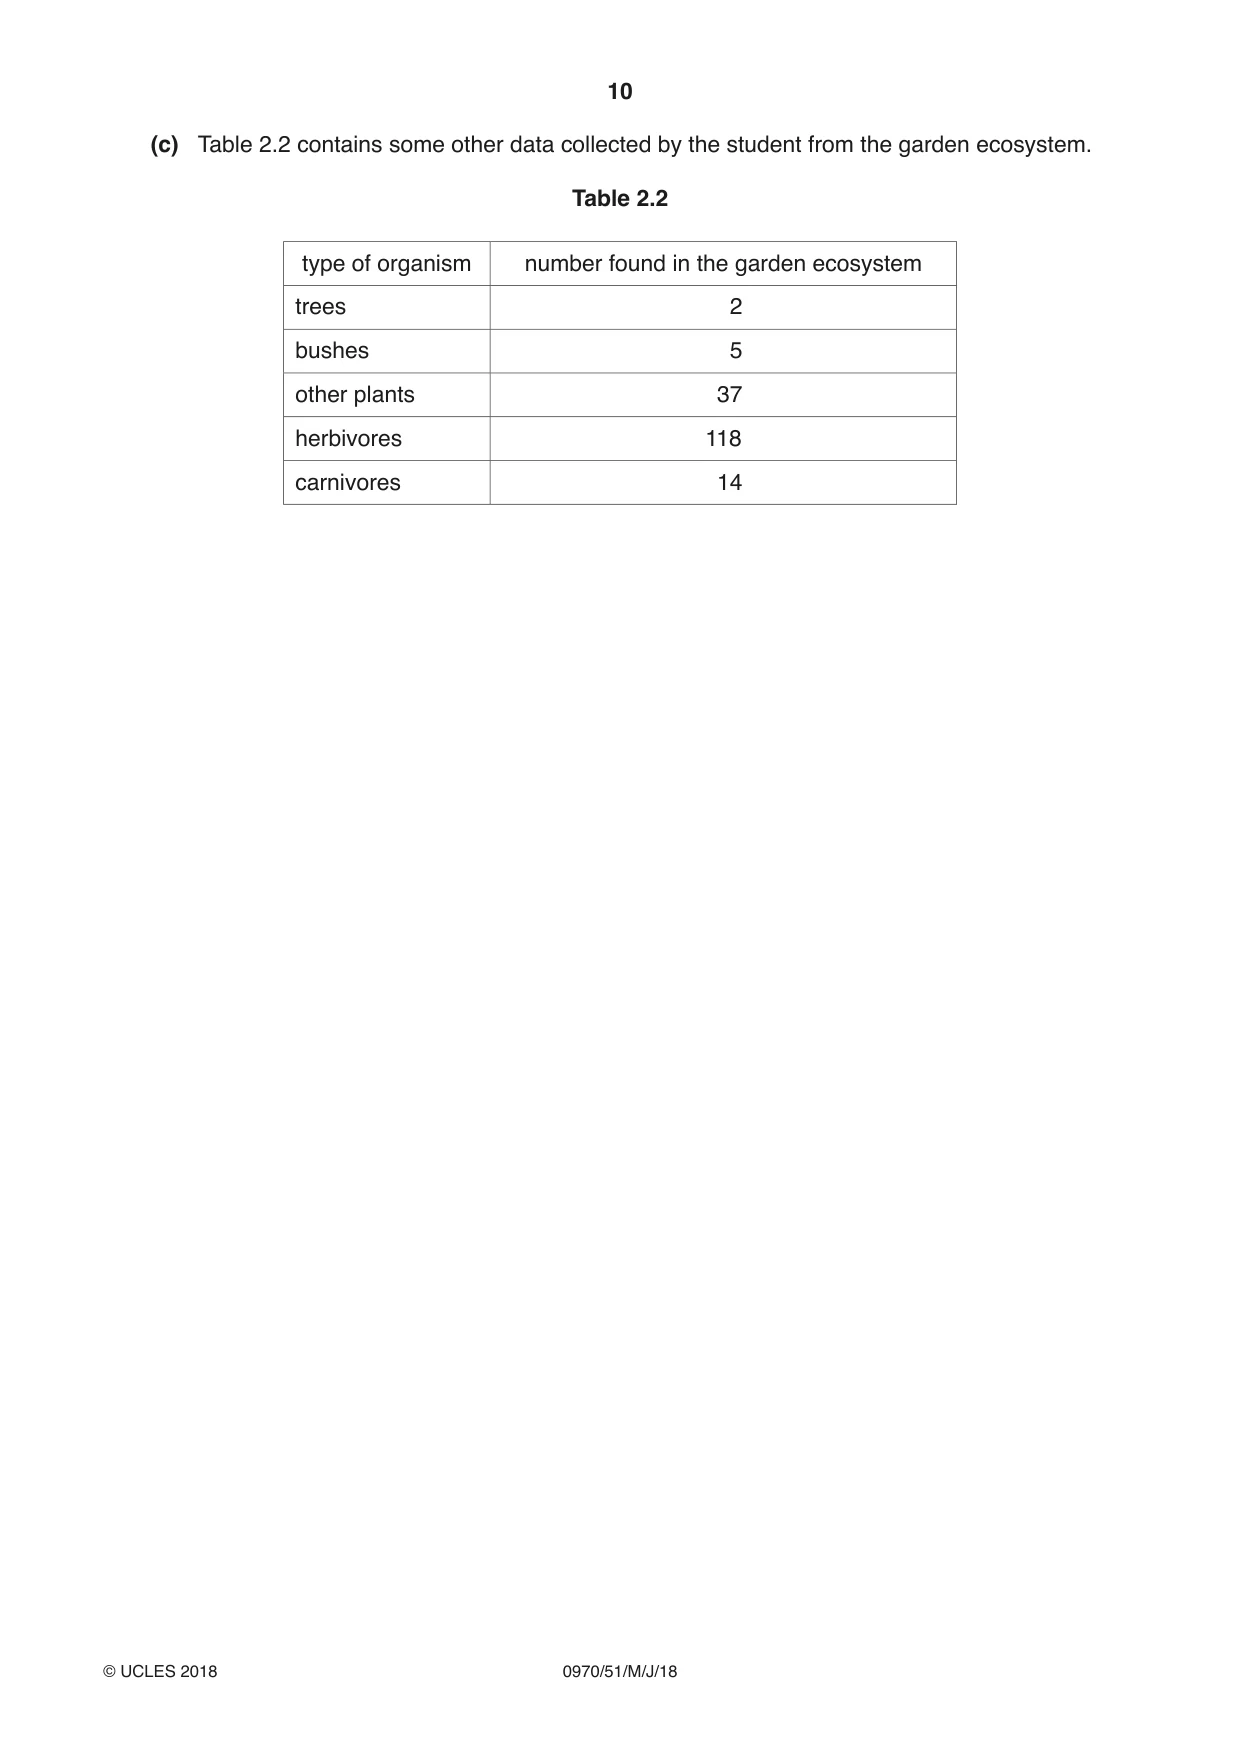
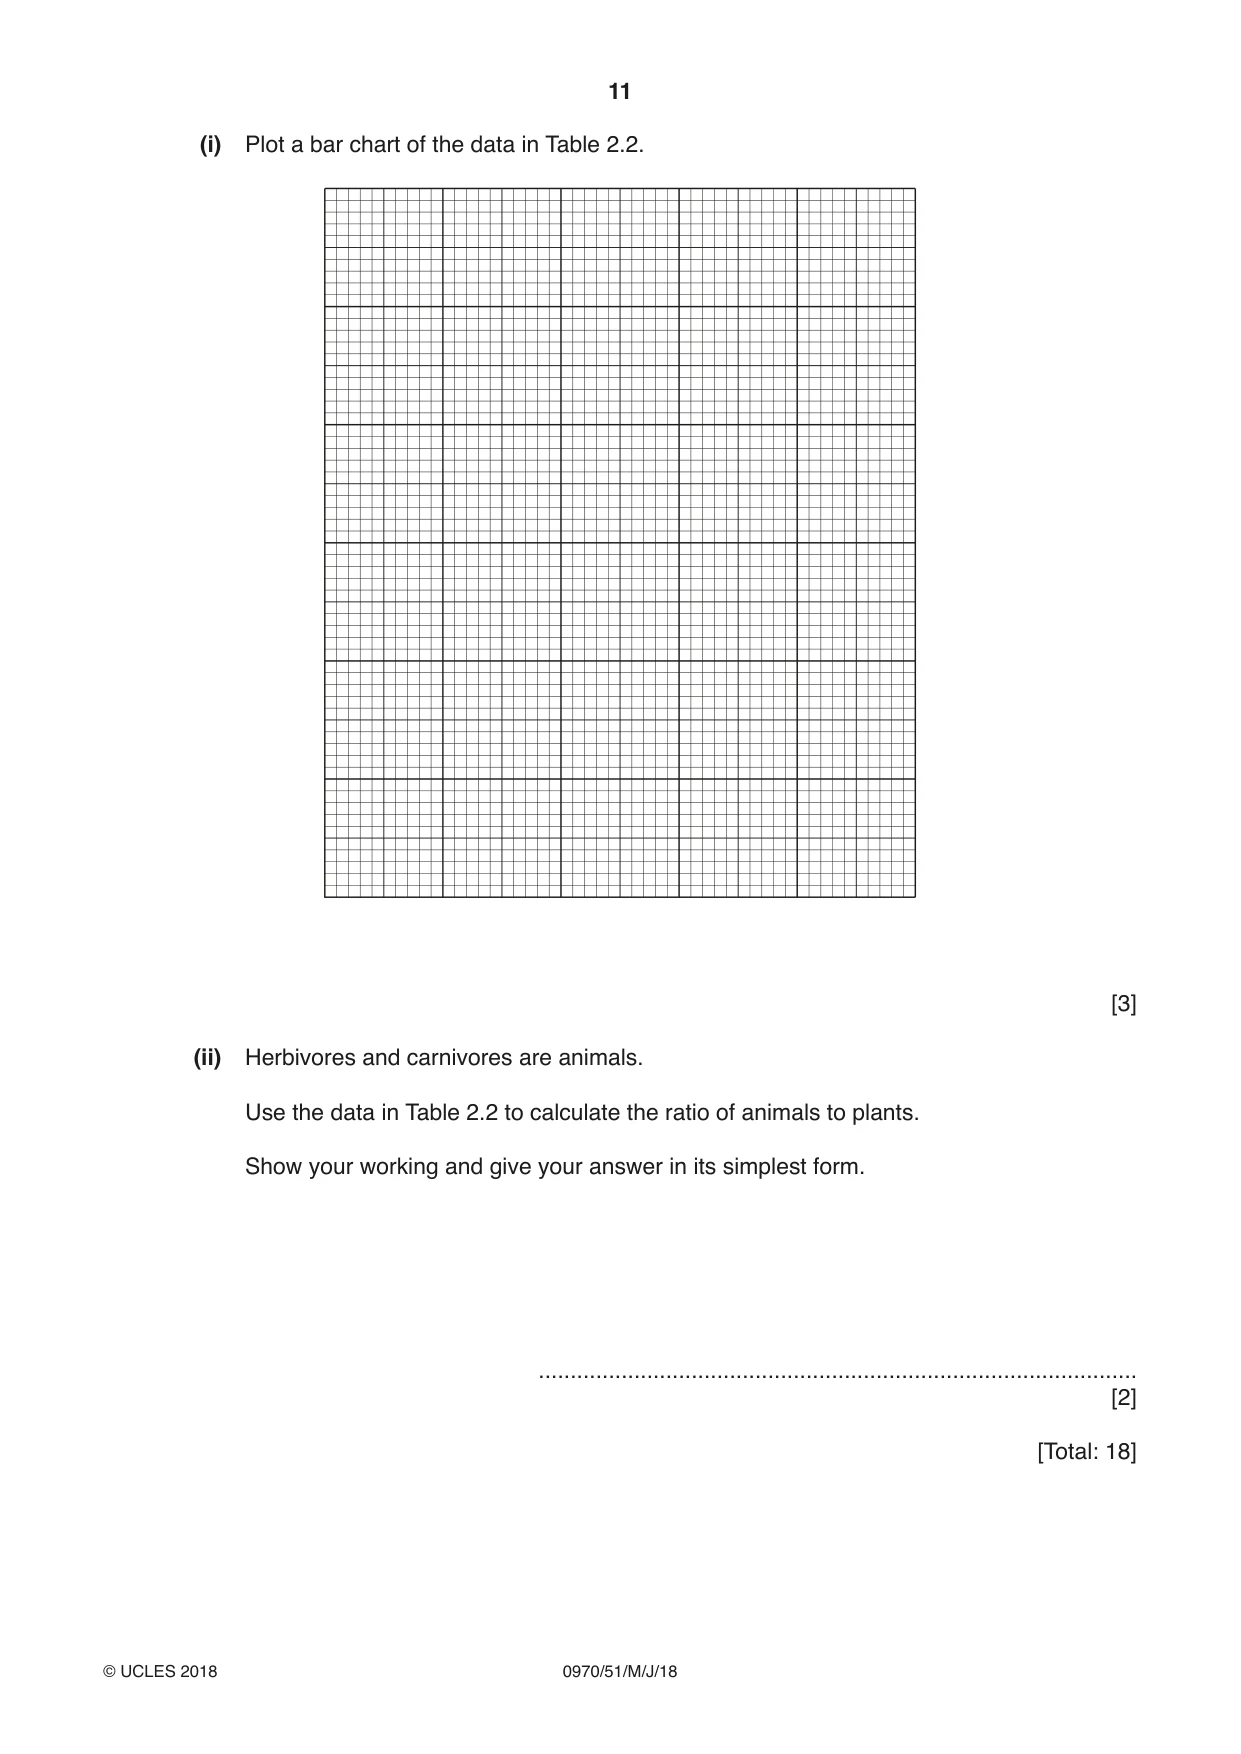
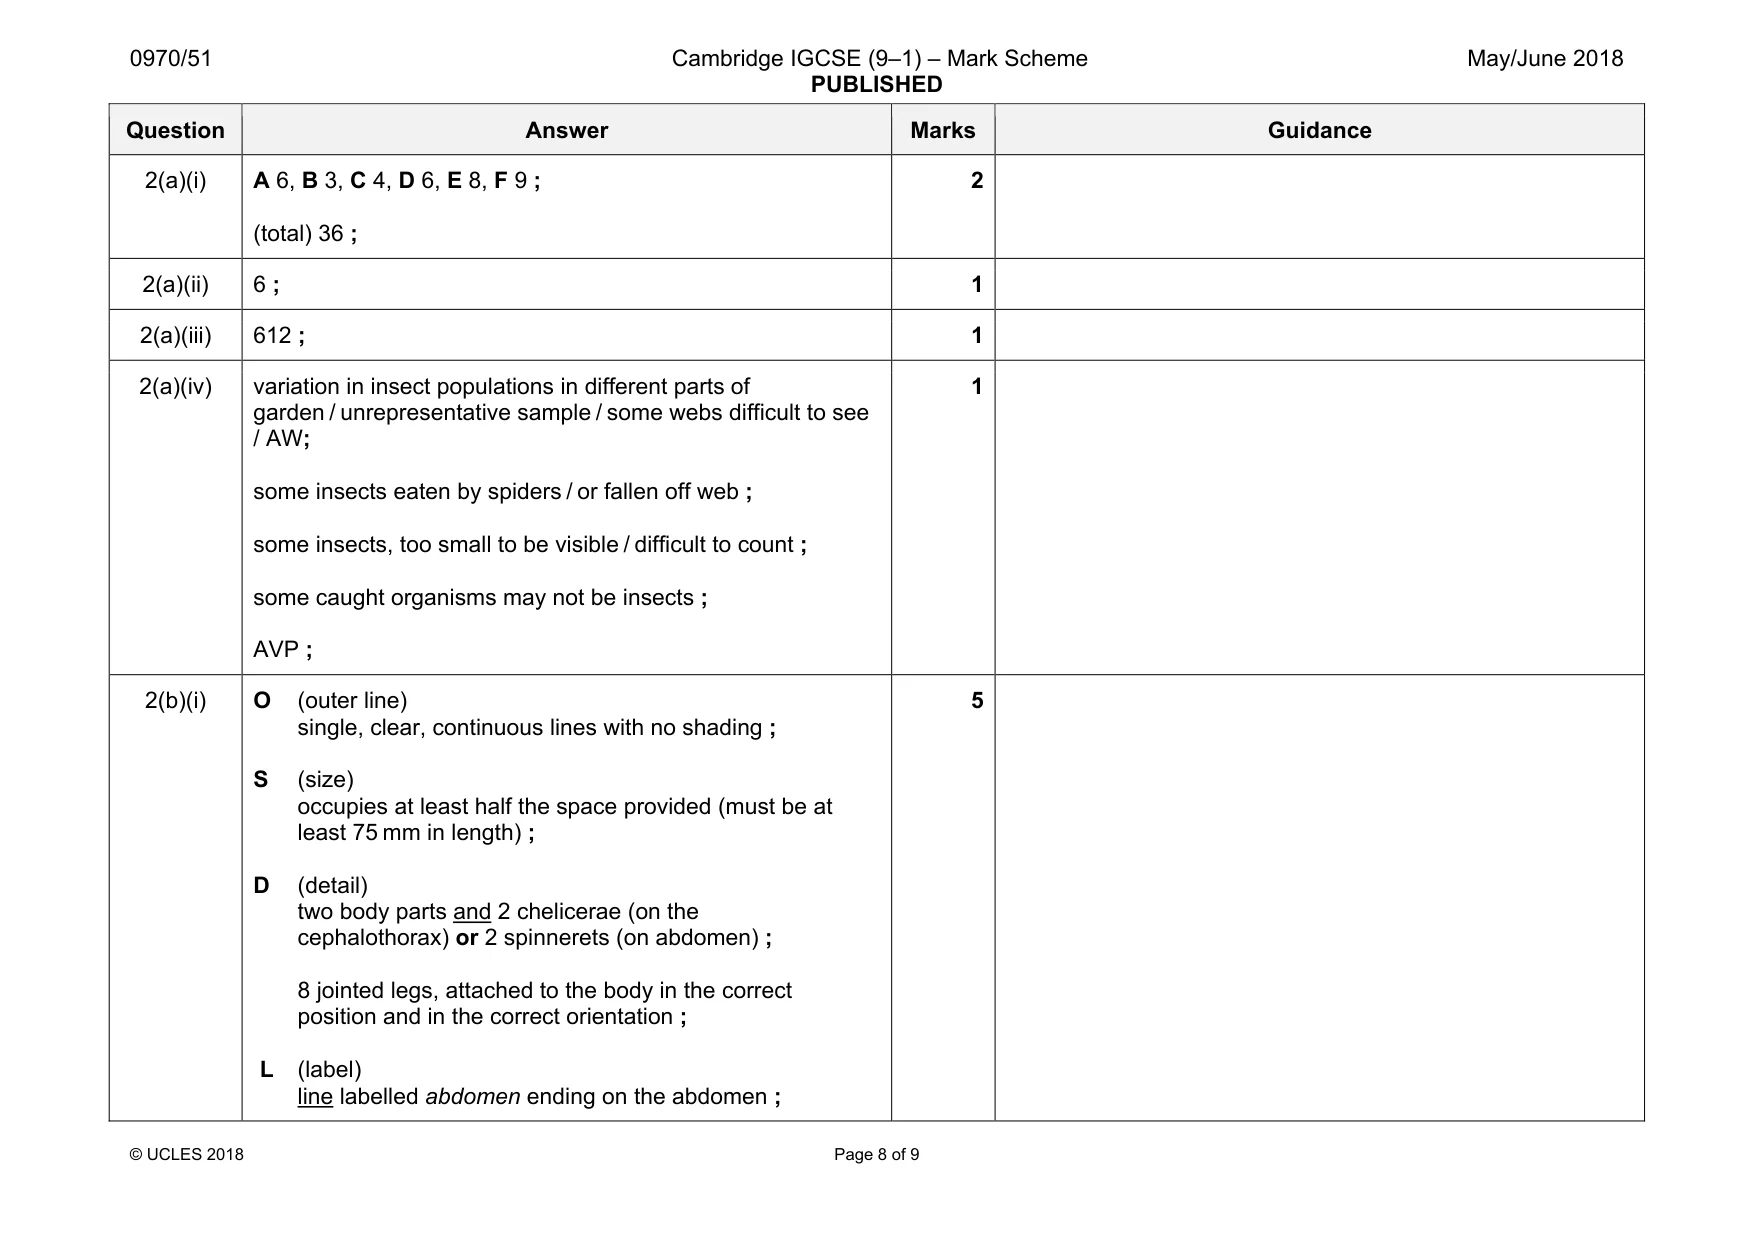
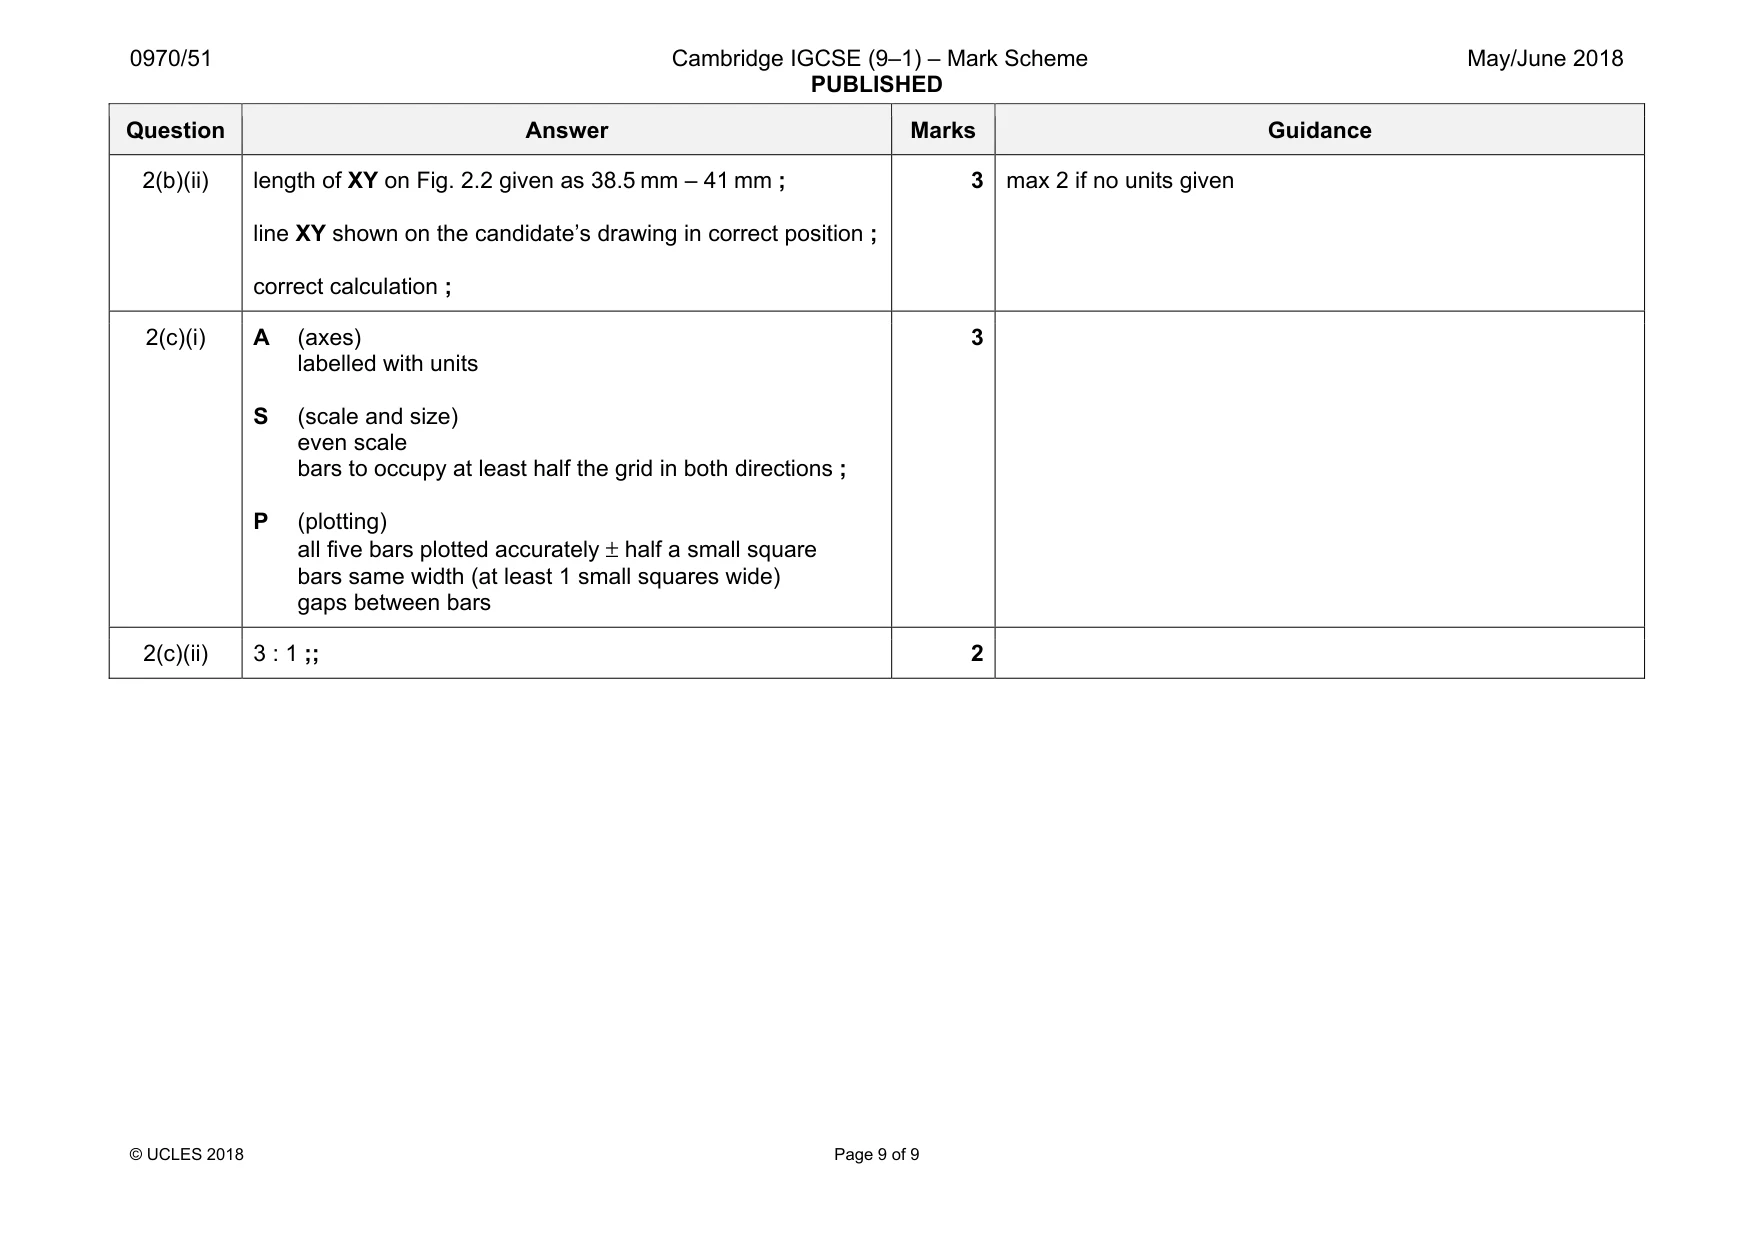
Mark scheme: 2(a)(i) A 6, B 3, C 4, D 6, E 8, F 9 ; (total) 36 ; 2(a)(ii) 6 ; 1 2(a)(iii) 612 ; 1 2(a)(iv) variation in insect populations in different parts of garden / unrepresentative sample / some webs difficult to see / AW; some insects eaten by spiders / or fallen off web ; some insects, too small to be visible / difficult to count ; some caught organisms may not be insects ; AVP ; 1 2(b)(i) O (outer line) single, clear, continuous lines with no shading ; S (size) occupies at least half the space provided (must be at least 75 mm in length) ; D (detail) two body parts and 2 chelicerae (on the cephalothorax) or 2 spinnerets (on abdomen) ; 8 jointed legs, attached to the body in the correct position and in the correct orientation ; L (label) line labelled abdomen ending on the abdomen ; 5 Question Answer Marks Guidance 2(b)(ii) length of XY on Fig. 2.2 given as 38.5 mm – 41 mm ; line XY shown on the candidate’s drawing in correct position ; correct calculation ; 3 max 2 if no units given 2(c)(i) A (axes) labelled with units S (scale and size) even scale bars to occupy at least half the grid in both directions ; P (plotting) all five bars plotted accurately ± half a small square bars same width (at least 1 small squares wide) gaps between bars 3 2(c)(ii) 3 : 1 ;; 2
What was in this paper
The subtopics covered by these 2 questions, and how many questions each got. Open one in a new tab to see every Cambridge question on it.
What you needed in this session
Cambridge’s own grade thresholds for 2018 May/June, Paper 5 · Variant 1. A higher threshold means an easier paper — the bar moves with how the cohort did.