Cambridge IGCSE Bangladesh Studies 0449 — 2017 May/June Paper 2 · Variant 1
0449/21/M/J/17 · 5 questions · 75 marks · ≈84 min
The question paper and its mark scheme, free to read here and free to download. This is Cambridge’s own paper, exactly as it was sat.
Question paper24 pages










Mark scheme14 pages
Answers below. Sit the paper first if you are practising.
Questions as text
Question 1
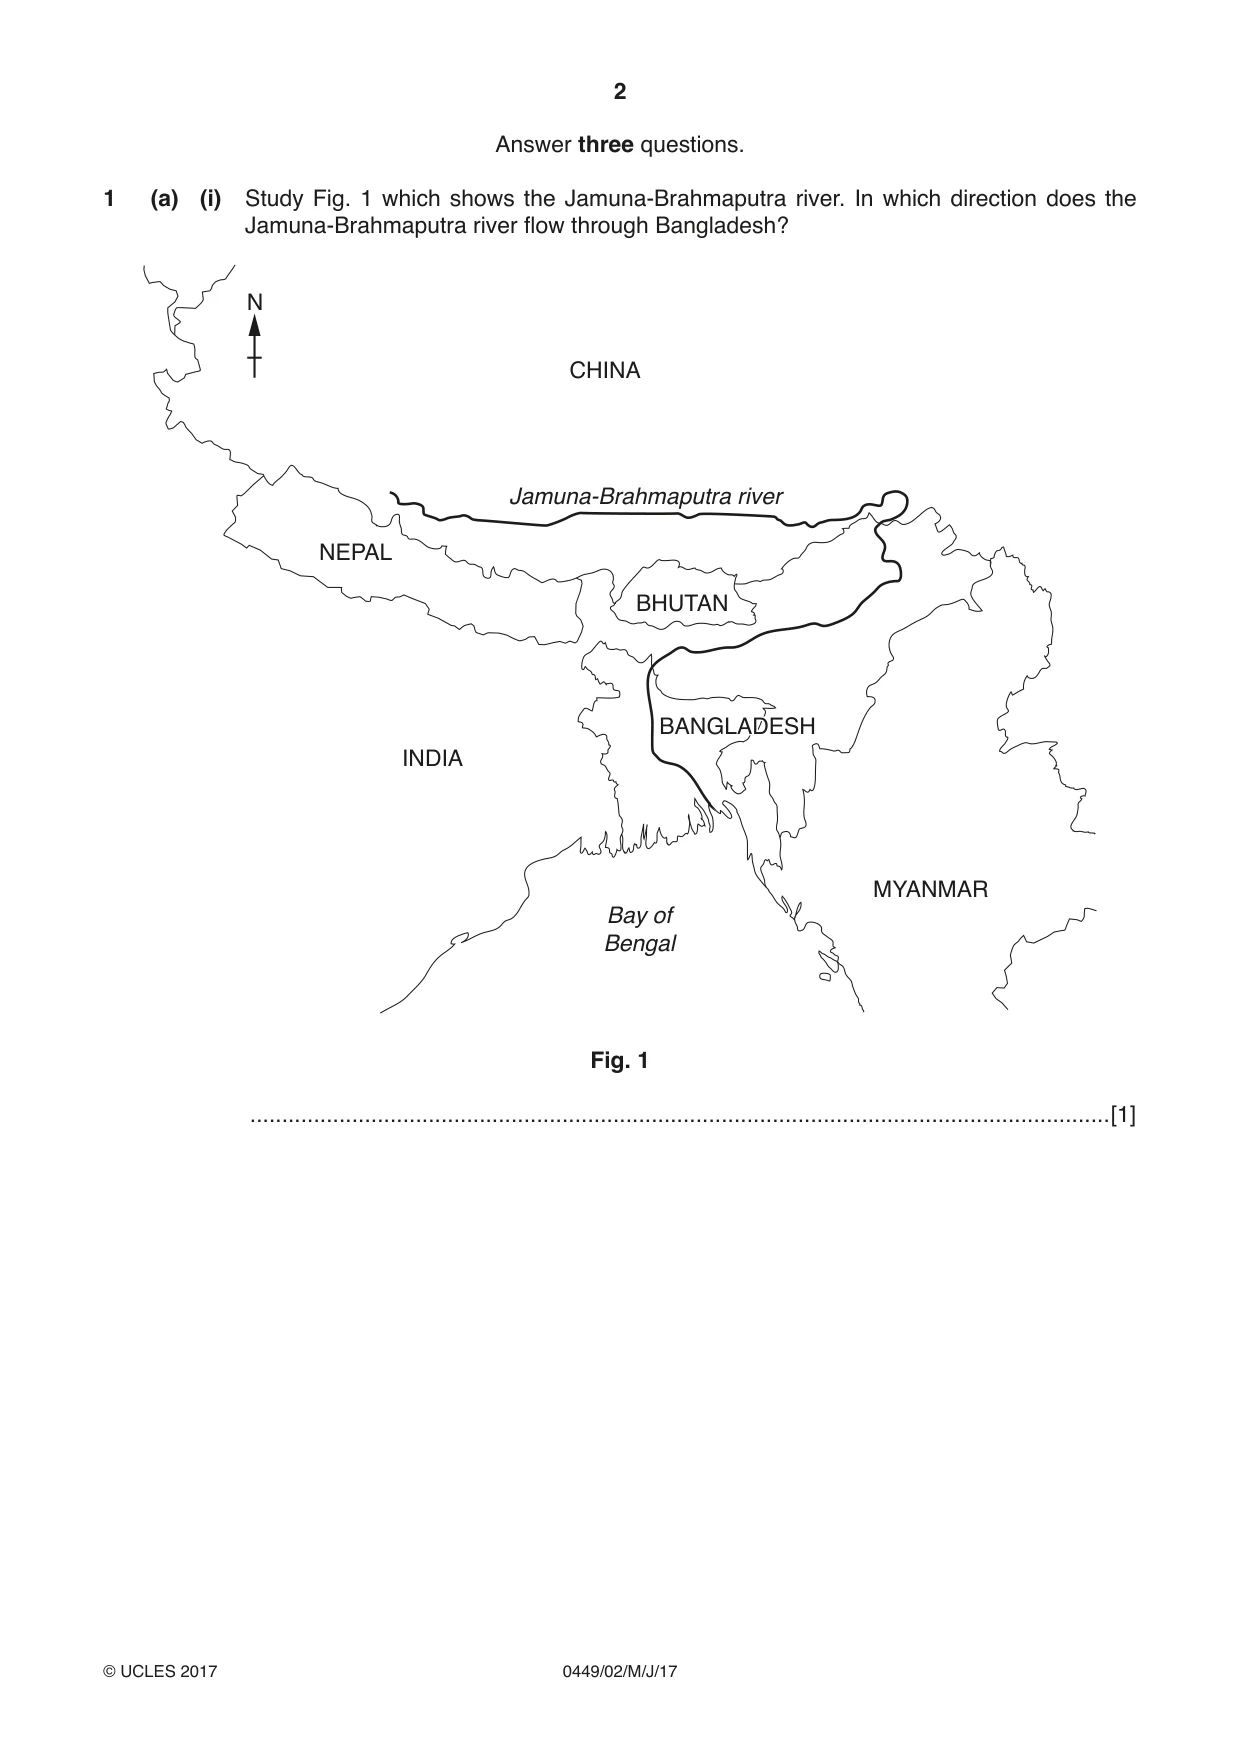
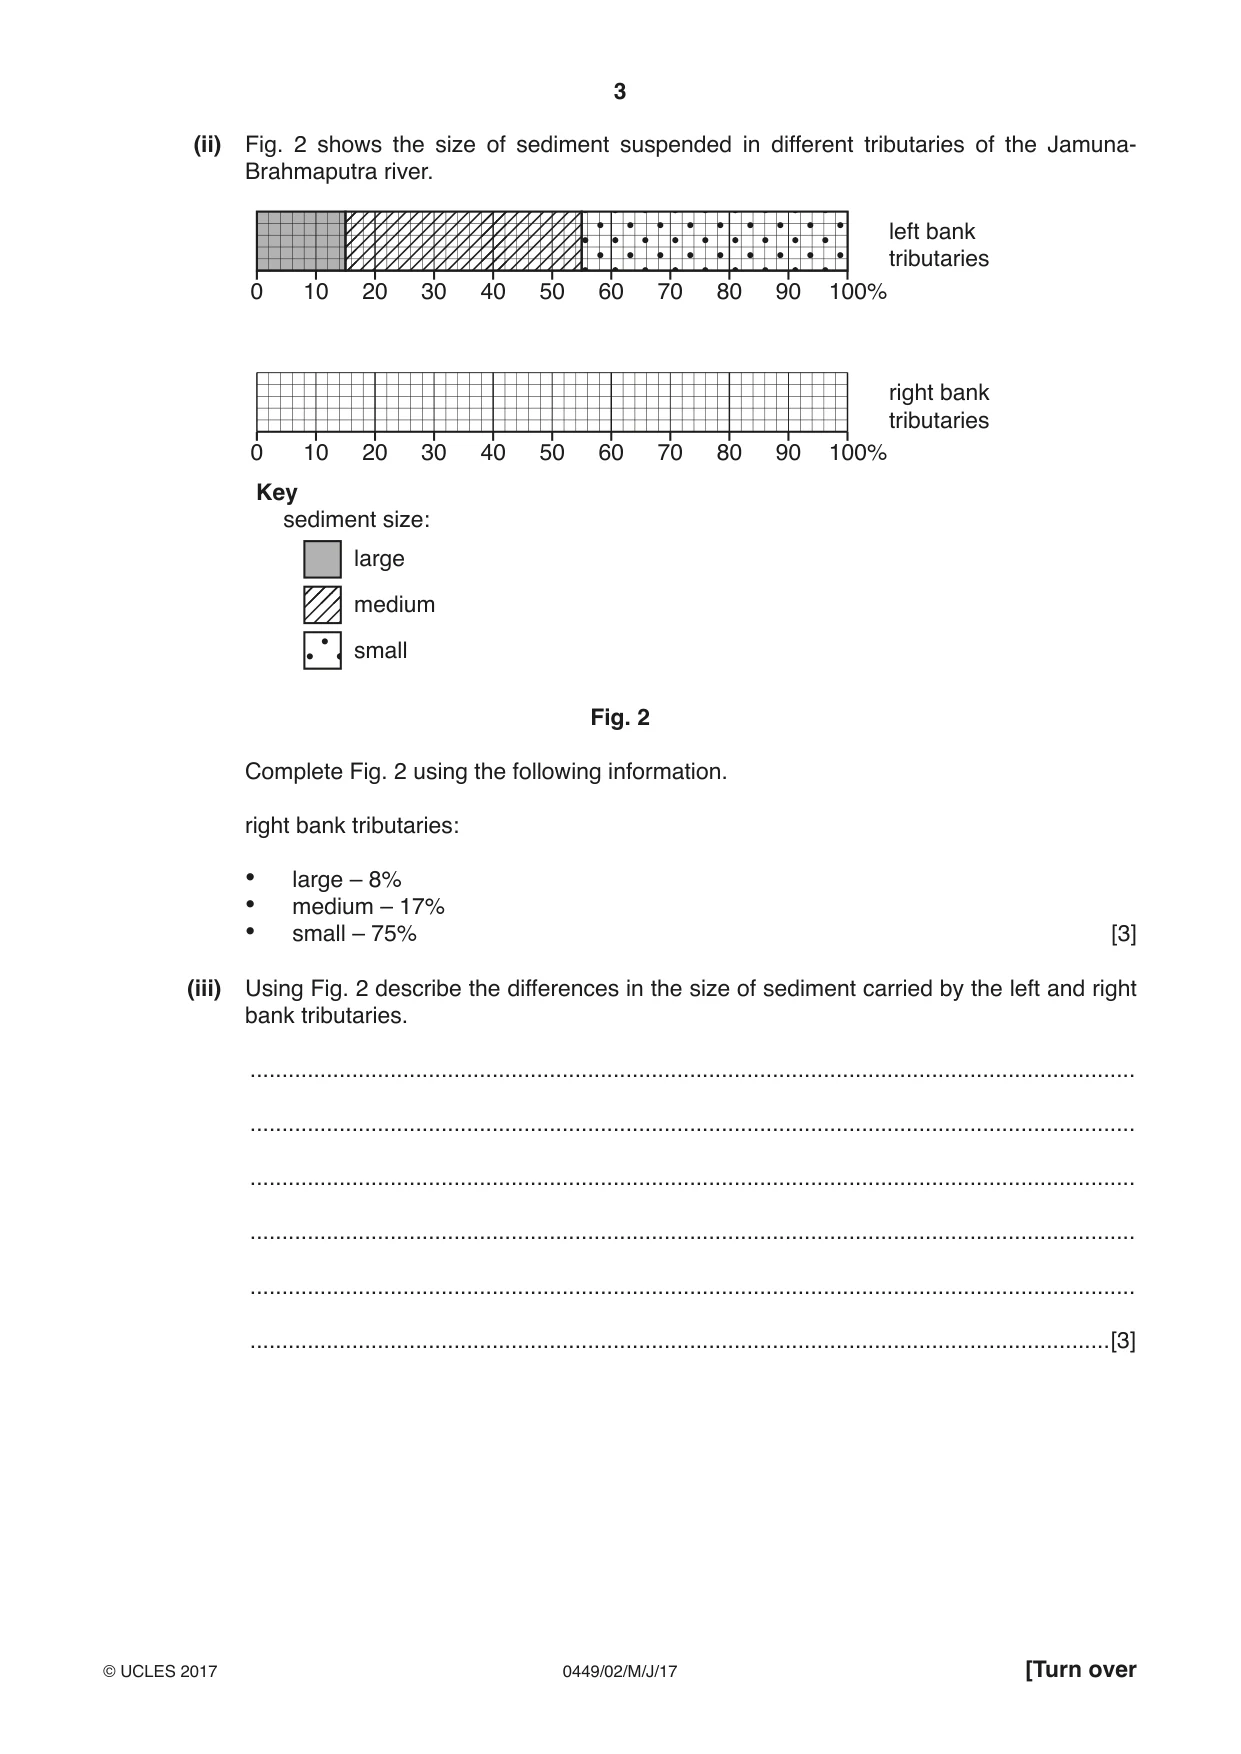
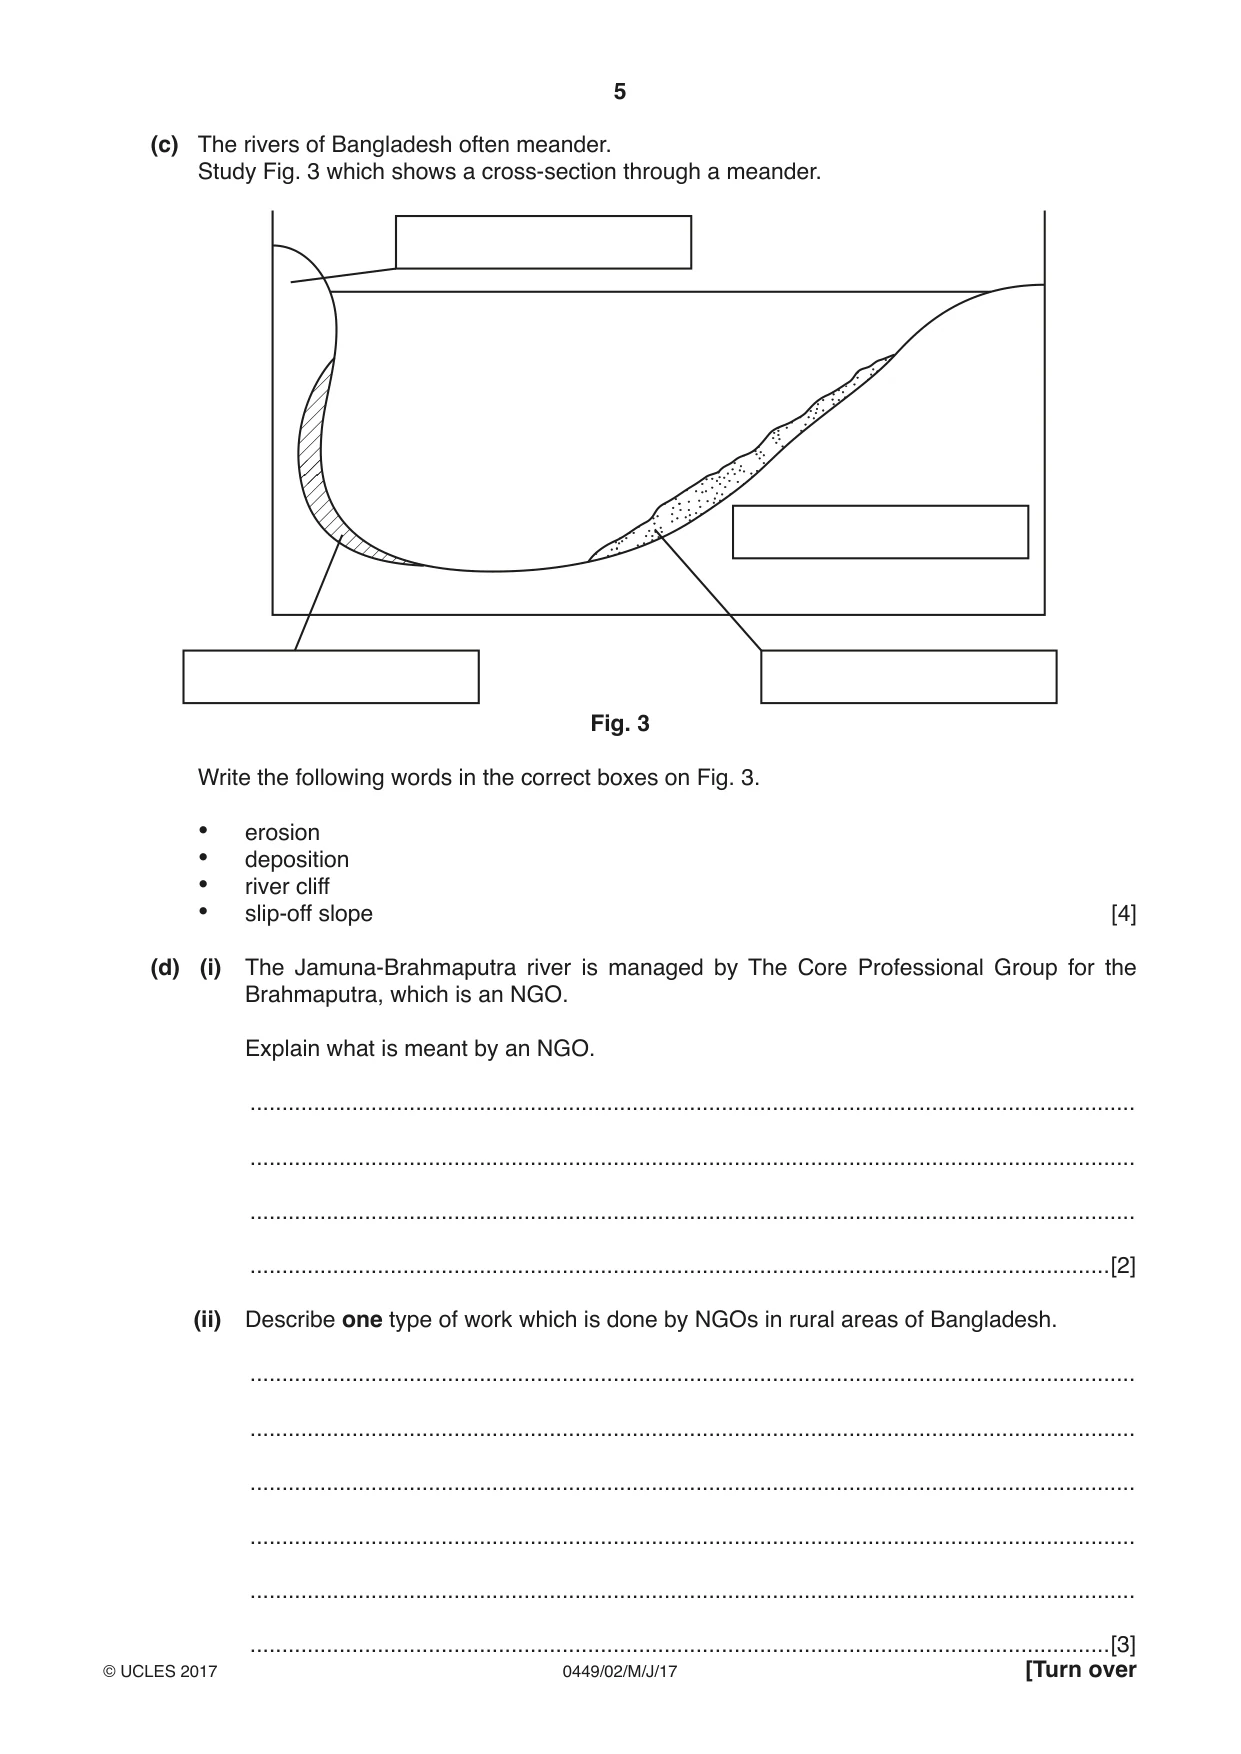
1 (a) (i) Study Fig. 1 which shows the Jamuna-Brahmaputra river. In which direction does the Jamuna-Brahmaputra river flow through Bangladesh? N CHINA Jamuna-Brahmaputra river NEPAL BHUTAN BANGLADESH INDIA MYANMAR Bay of Bengal Fig. 1 .......................................................................................................................................[1] (ii) Fig. 2 shows the size of sediment suspended in different tributaries of the Jamuna- Brahmaputra river. left bank tributaries 0 10 20 30 40 50 60 70 80 90 100% right bank tributaries 0 10 20 30 40 50 60 70 80 90 100% Key sediment size: large medium small Fig. 2 Complete Fig. 2 using the following information. right bank tributaries: • large – 8% • medium – 17% • small – 75% [3] (iii) Using Fig. 2 describe the differences in the size of sediment carried by the left and right bank tributaries. ........................................................................................................................................... ........................................................................................................................................... ........................................................................................................................................... ........................................................................................................................................... ........................................................................................................................................... .......................................................................................................................................[3] (b) The deposition of sediment can lead to the formation of several river features. Describe and explain the formation of a braided channel. You may use a diagram to illustrate your answer. ................................................................................................................................................... ................................................................................................................................................... ................................................................................................................................................... ................................................................................................................................................... ................................................................................................................................................... ................................................................................................................................................... ................................................................................................................................................... ................................................................................................................................................... Space for diagram [4] (c) The rivers of Bangladesh often meander. Study Fig. 3 which shows a cross-section through a meander. Fig. 3 Write the following words in the correct boxes on Fig. 3. • erosion • deposition • river cliff • slip-off slope [4] (d) (i) The Jamuna-Brahmaputra river is managed by The Core Professional Group for the Brahmaputra, which is an NGO. Explain what is meant by an NGO. ........................................................................................................................................... ........................................................................................................................................... ........................................................................................................................................... .......................................................................................................................................[2] (ii) Describe one type of work which is done by NGOs in rural areas of Bangladesh. ........................................................................................................................................... ........................................................................................................................................... ........................................................................................................................................... ........................................................................................................................................... ........................................................................................................................................... (e) Study the two statements below. A ‘Controlling the flow of the Jamuna-Brahmaputra river is not possible.’ B ‘It is important to control the flow and erosion of the Jamuna-Brahmaputra river.’ (i) Give one piece of evidence which supports statement A. ........................................................................................................................................... .......................................................................................................................................[1] (ii) Give one piece of evidence which supports statement B. ........................................................................................................................................... .......................................................................................................................................[1] (iii) Which statement do you agree with most? Give reasons for your answer. ........................................................................................................................................... ........................................................................................................................................... ........................................................................................................................................... ........................................................................................................................................... ........................................................................................................................................... .......................................................................................................................................[3] [Total: 25 marks]
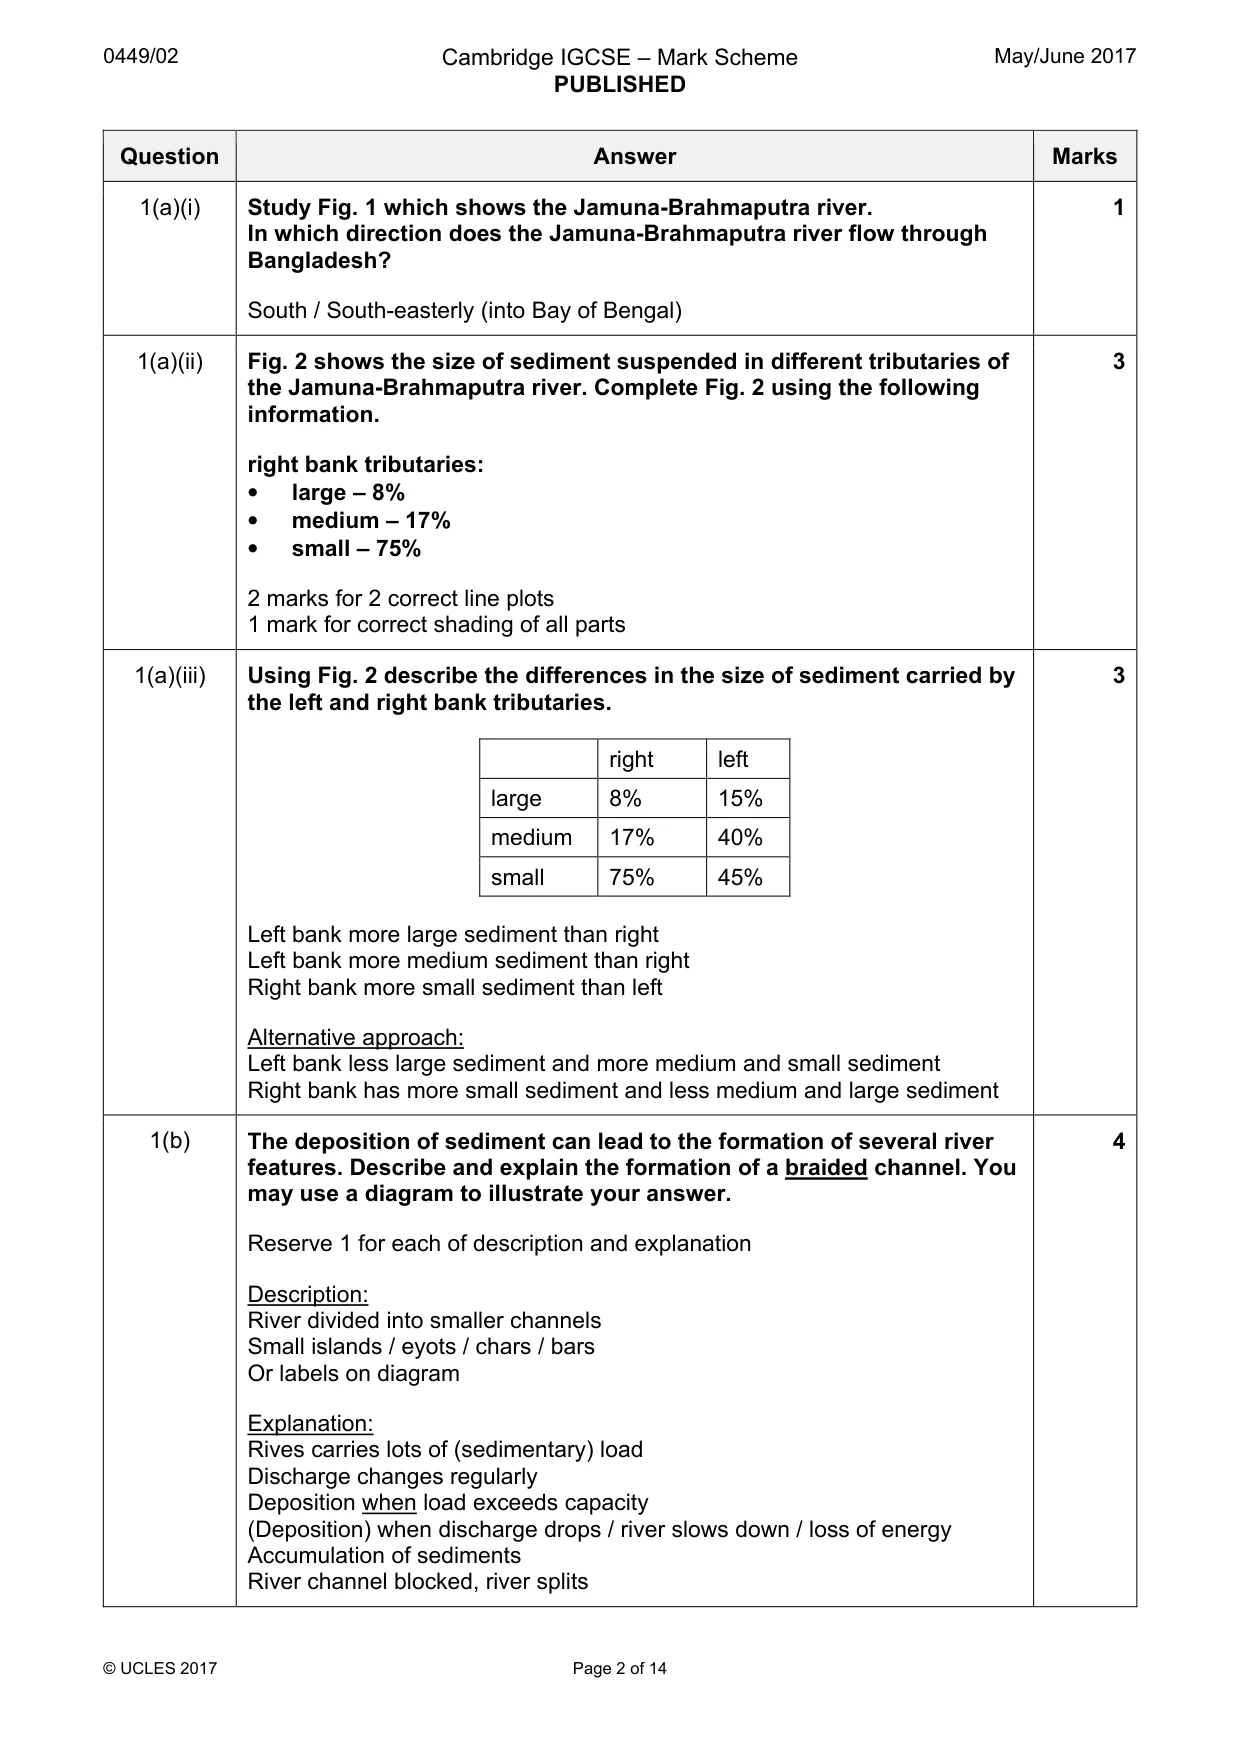
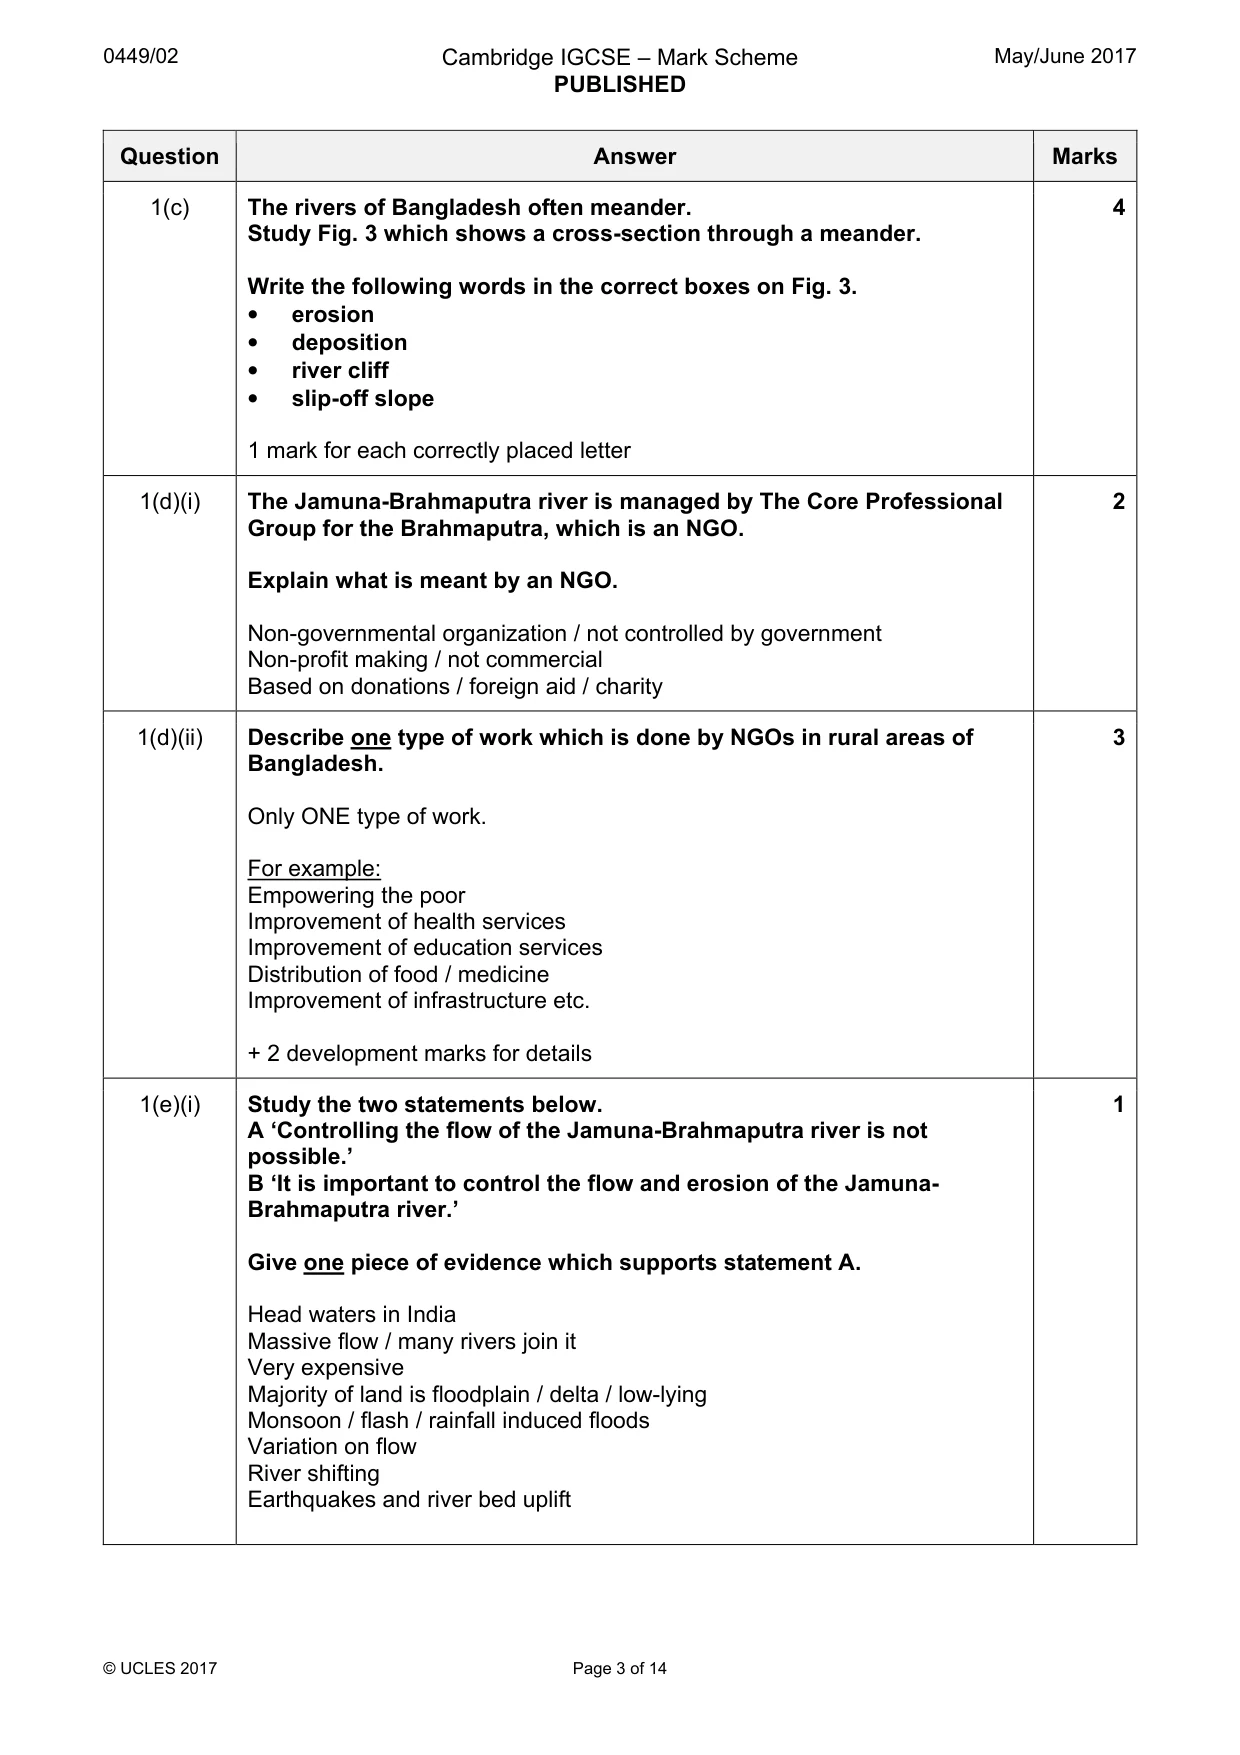
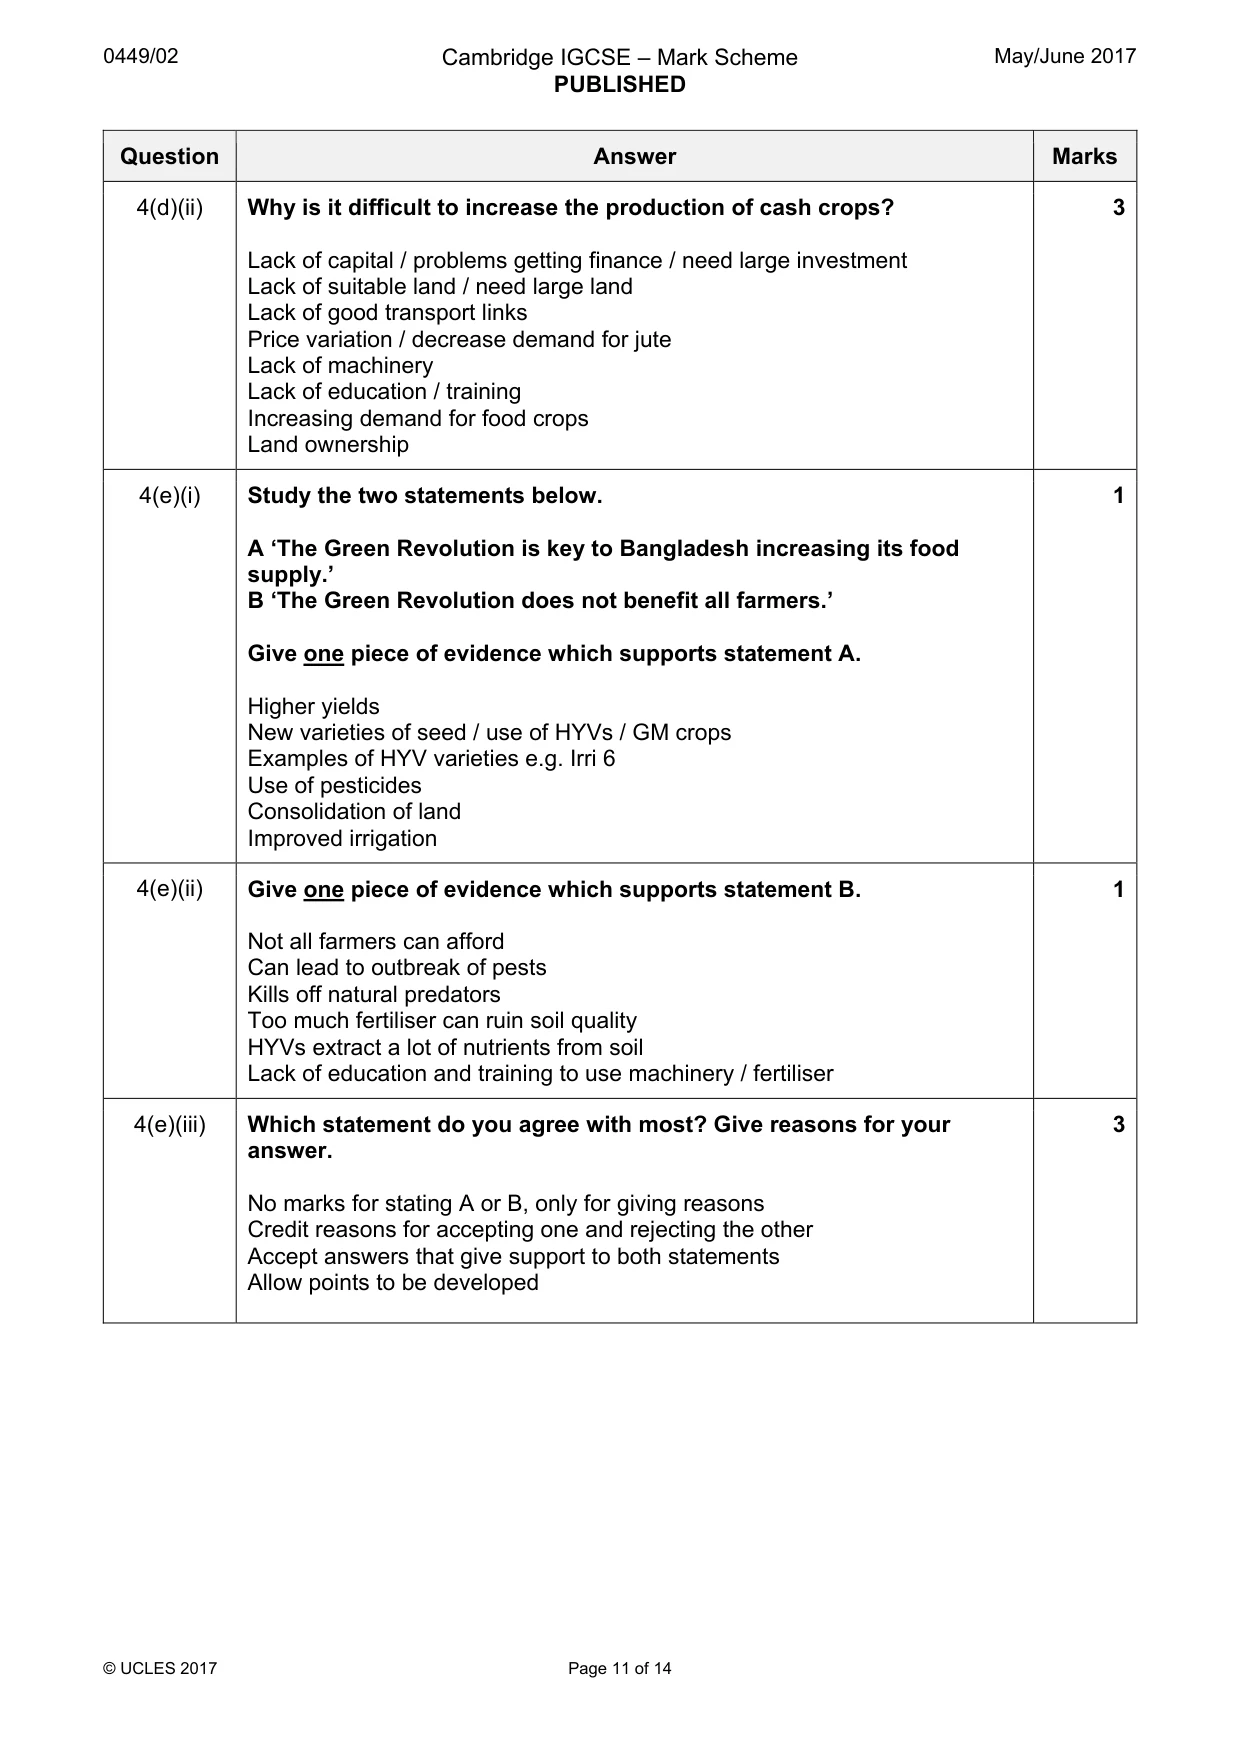
Mark scheme: Question Answer Marks 1(a)(i) Study Fig. 1 which shows the Jamuna-Brahmaputra river. 1 In which direction does the Jamuna-Brahmaputra river flow through Bangladesh? South / South-easterly (into Bay of Bengal) 1(a)(ii) Fig. 2 shows the size of sediment suspended in different tributaries of 3 the Jamuna-Brahmaputra river. Complete Fig. 2 using the following information. right bank tributaries: • large – 8% • medium – 17% • small – 75% 2 marks for 2 correct line plots 1 mark for correct shading of all parts 1(a)(iii) Using Fig. 2 describe the differences in the size of sediment carried by 3 the left and right bank tributaries. right left large 8% 15% medium 17% 40% small 75% 45% Left bank more large sediment than right Left bank more medium sediment than right Right bank more small sediment than left Alternative approach: Left bank less large sediment and more medium and small sediment Right bank has more small sediment and less medium and large sediment 1(b) The deposition of sediment can lead to the formation of several river 4 features. Describe and explain the formation of a braided channel. You may use a diagram to illustrate your answer. Reserve 1 for each of description and explanation Description: River divided into smaller channels Small islands / eyots / chars / bars Or labels on diagram Explanation: Rives carries lots of (sedimentary) load Discharge changes regularly Deposition when load exceeds capacity (Deposition) when discharge drops / river slows down / loss of energy Accumulation of sediments River channel blocked, river splits 1(c) The rivers of Bangladesh often meander. 4 Study Fig. 3 which shows a cross-section through a meander. Write the following words in the correct boxes on Fig. 3. • erosion • deposition • river cliff • slip-off slope 1 mark for each correctly placed letter 1(d)(i) The Jamuna-Brahmaputra river is managed by The Core Professional 2 Group for the Brahmaputra, which is an NGO. Explain what is meant by an NGO. Non-governmental organization / not controlled by government Non-profit making / not commercial Based on donations / foreign aid / charity 1(d)(ii) Describe one type of work which is done by NGOs in rural areas of 3 Bangladesh. Only ONE type of work. For example: Empowering the poor Improvement of health services Improvement of education services Distribution of food / medicine Improvement of infrastructure etc. + 2 development marks for details 1(e)(i) Study the two statements below. 1 A ‘Controlling the flow of the Jamuna-Brahmaputra river is not possible.’ B ‘It is important to control the flow and erosion of the Jamuna- Brahmaputra river.’ Give one piece of evidence which supports statement A. Head waters in India Massive flow / many rivers join it Very expensive Majority of land is floodplain / delta / low-lying Monsoon / flash / rainfall induced floods Variation on flow River shifting Earthquakes and river bed uplift 1(e)(ii) Give one piece of evidence which supports statement B. 1 Causes floods Loss of cash crops Loss of basic food supply Loss of infrastructure Loss of life Increases poverty 1(e)(iii) Which statement do you agree with most? Give reasons for your 3 answer. No marks for stating A or B, only for giving reasons Credit reasons for accepting one and rejecting the other Accept answers that give support to both statements Allow points to be developed
Question 2
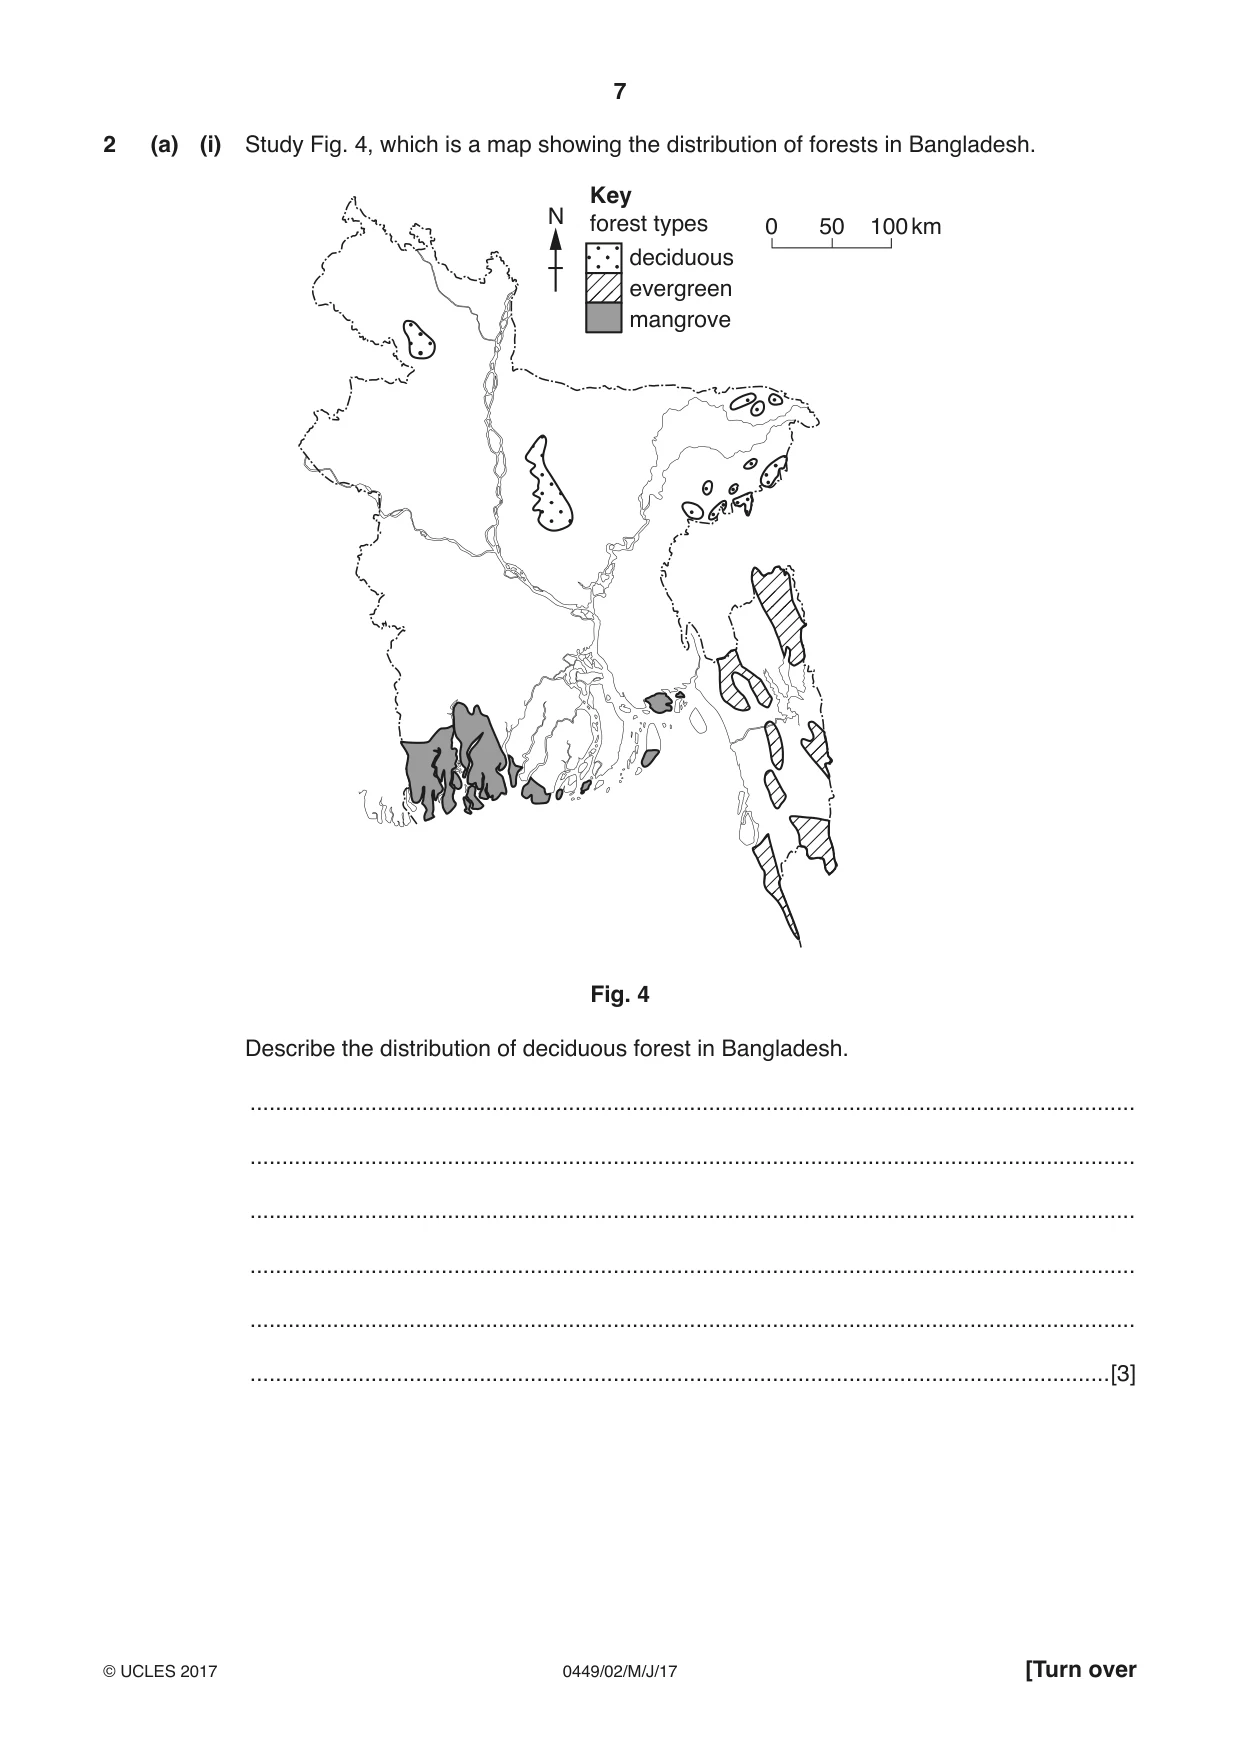
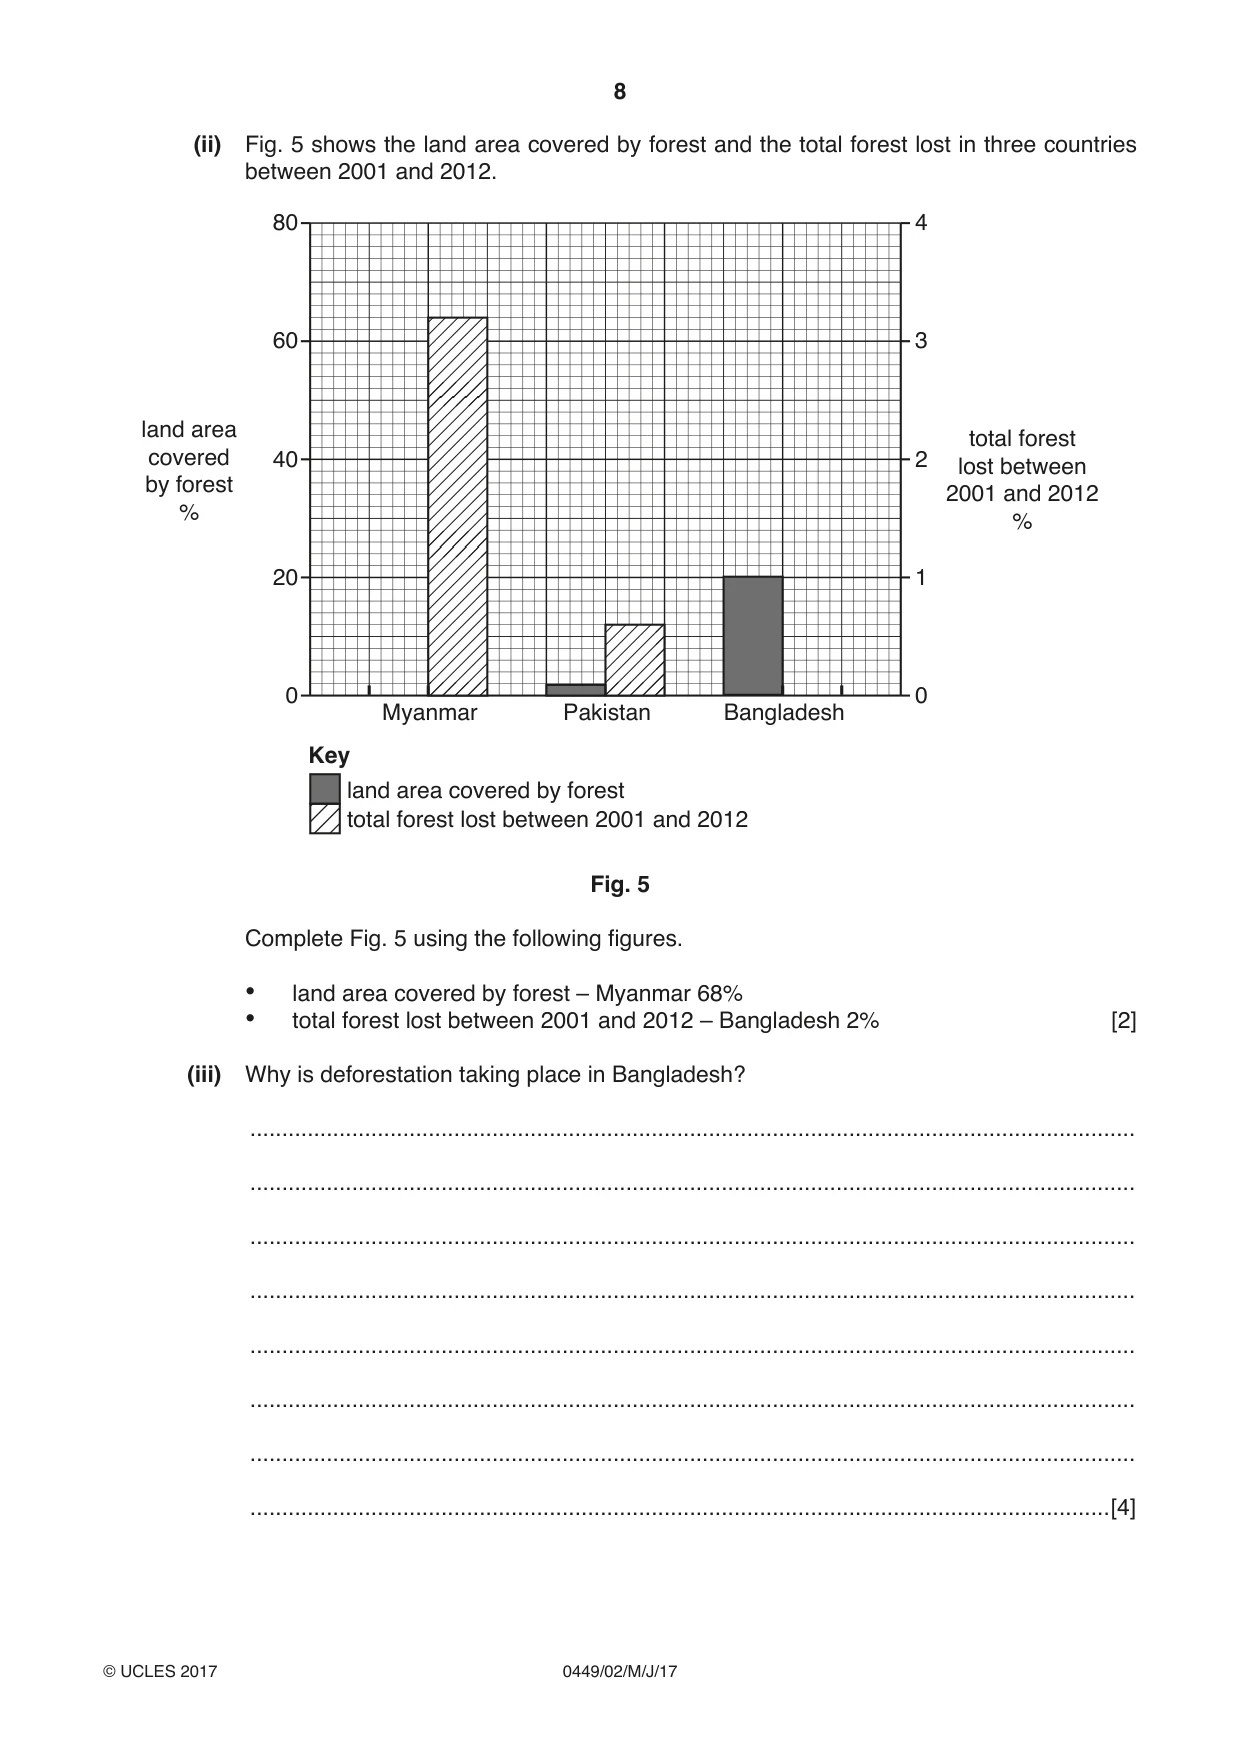
2 (a) (i) Study Fig. 4, which is a map showing the distribution of forests in Bangladesh. Key N forest types 0 50 100 km deciduous evergreen mangrove Fig. 4 Describe the distribution of deciduous forest in Bangladesh. ........................................................................................................................................... ........................................................................................................................................... ........................................................................................................................................... ........................................................................................................................................... ........................................................................................................................................... .......................................................................................................................................[3] (ii) Fig. 5 shows the land area covered by forest and the total forest lost in three countries between 2001 and 2012. 80 4 60 3 land area total forest covered 40 2 lost between by forest 2001 and 2012 % % 20 1 0 0 Myanmar Pakistan Bangladesh Key land area covered by forest total forest lost between 2001 and 2012 Fig. 5 Complete Fig. 5 using the following figures. • land area covered by forest – Myanmar 68% • total forest lost between 2001 and 2012 – Bangladesh 2% [2] (iii) Why is deforestation taking place in Bangladesh? ........................................................................................................................................... ........................................................................................................................................... ........................................................................................................................................... ........................................................................................................................................... ........................................................................................................................................... ........................................................................................................................................... ........................................................................................................................................... .......................................................................................................................................[4] (b) Describe the challenges created by deforestation for: (i) farming ........................................................................................................................................... ........................................................................................................................................... ........................................................................................................................................... .......................................................................................................................................[2] (ii) climate ........................................................................................................................................... ........................................................................................................................................... ........................................................................................................................................... .......................................................................................................................................[2] (iii) urban areas ........................................................................................................................................... ........................................................................................................................................... ........................................................................................................................................... .......................................................................................................................................[2] (c) (i) Why are mangrove forests found in coastal areas? ........................................................................................................................................... ........................................................................................................................................... ........................................................................................................................................... .......................................................................................................................................[2] (ii) Using examples explain how forests are important to the wildlife in Bangladesh. ........................................................................................................................................... ........................................................................................................................................... ........................................................................................................................................... ........................................................................................................................................... ........................................................................................................................................... .......................................................................................................................................[3] (d) Air pollution and water pollution are two growing challenges in Bangladesh and also globally. Study the two statements below. A ‘Environmental laws are the only way to control pollution.’ B ‘Education and monitoring are the only sustainable ways to control pollution.’ (i) Give one piece of evidence which supports statement A. ........................................................................................................................................... .......................................................................................................................................[1] (ii) Give one piece of evidence which supports statement B. ........................................................................................................................................... .......................................................................................................................................[1] (iii) Which statement do you agree with most? Give reasons for your answer. ........................................................................................................................................... ........................................................................................................................................... ........................................................................................................................................... ........................................................................................................................................... ........................................................................................................................................... .......................................................................................................................................[3] [Total: 25 marks]
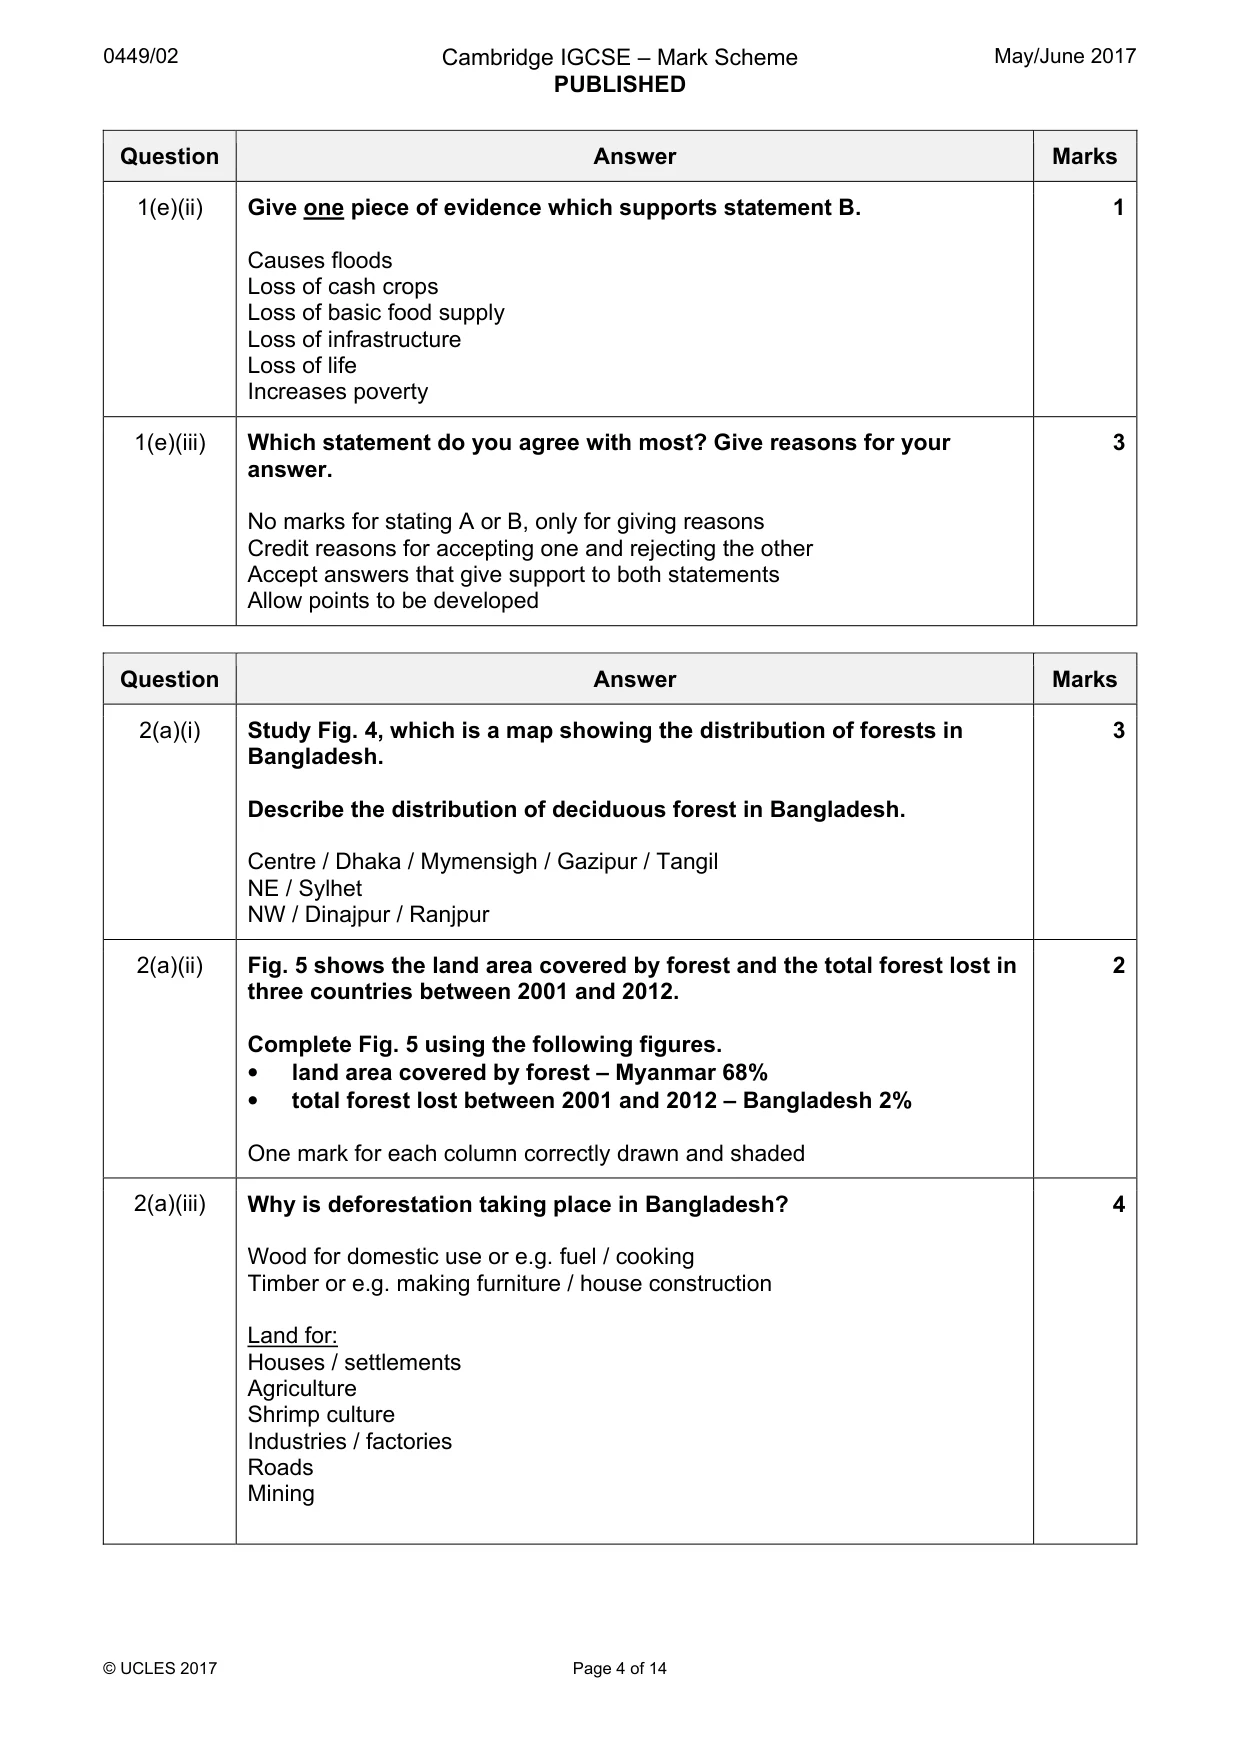
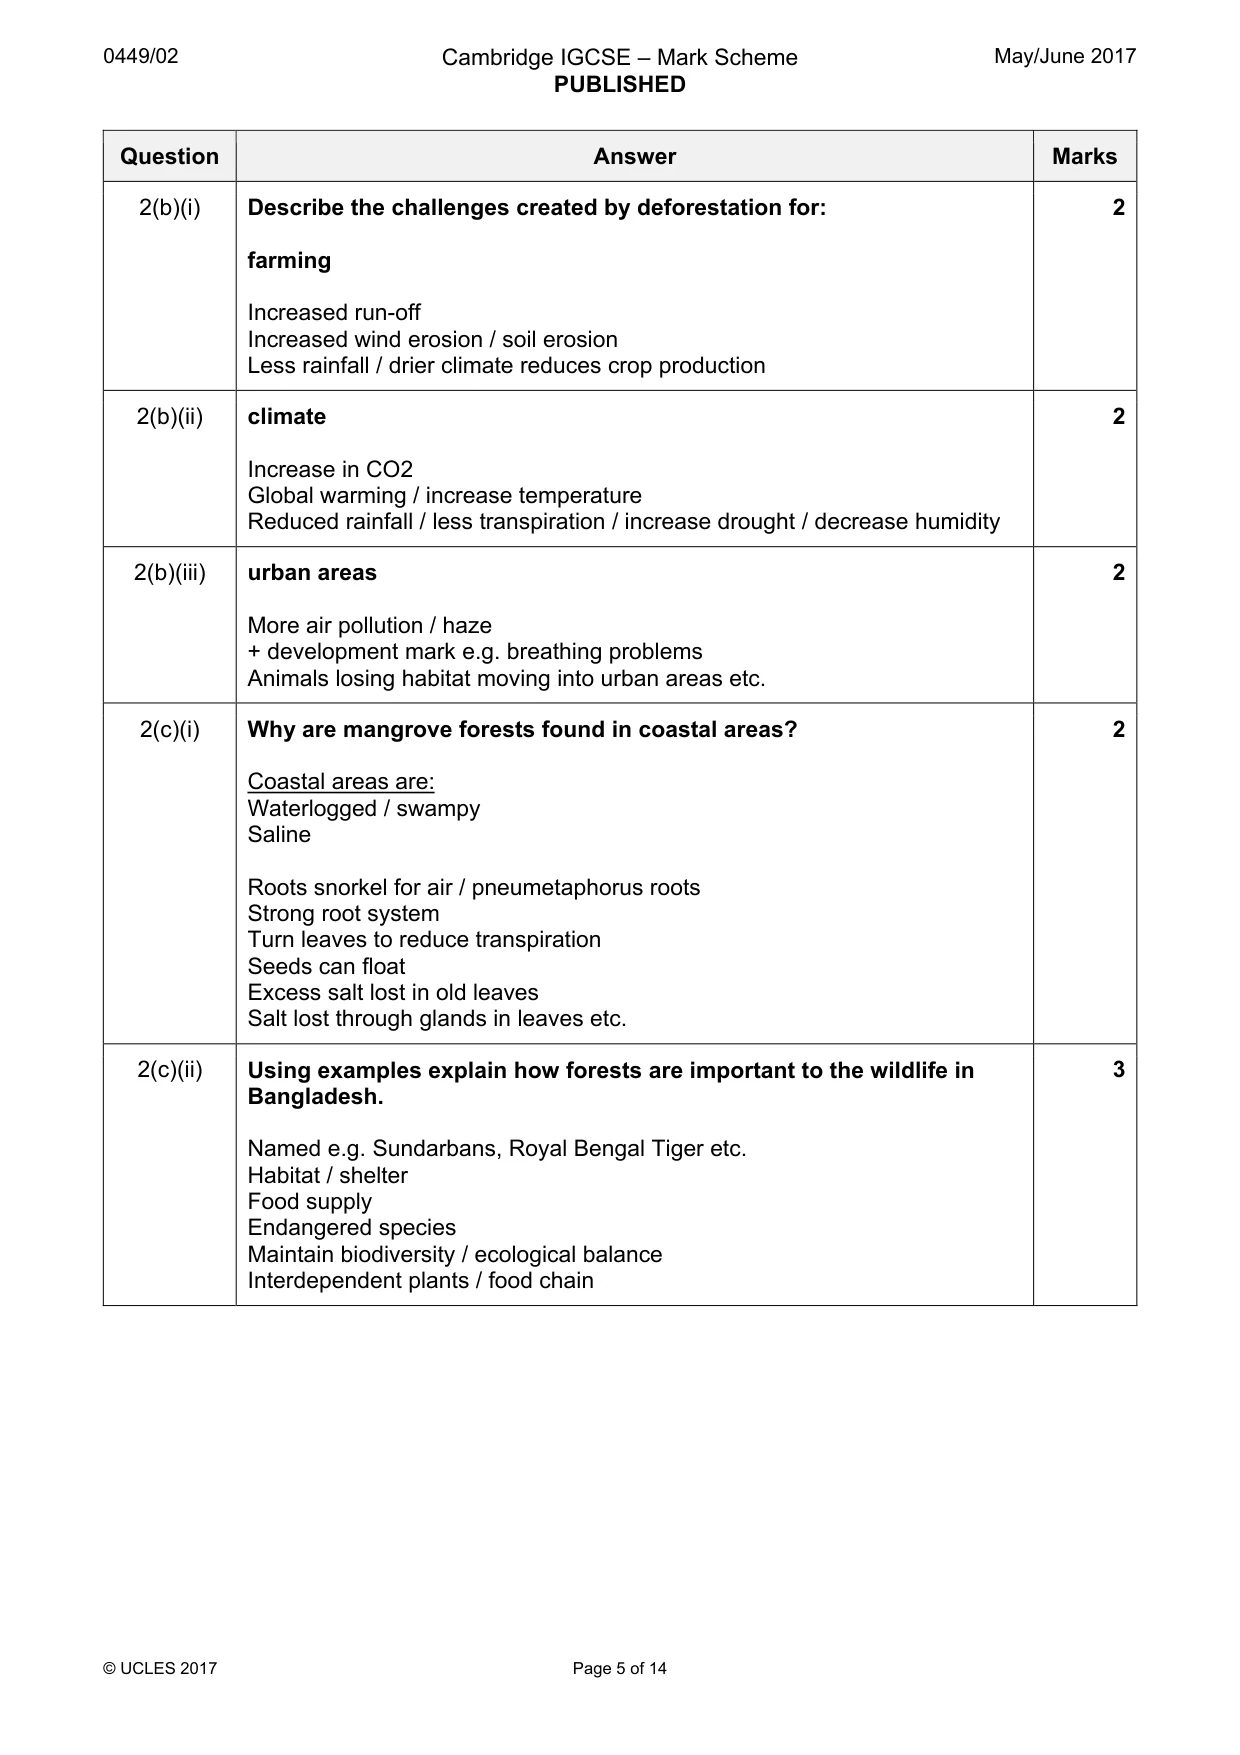
Mark scheme: 2(a)(i) Study Fig. 4, which is a map showing the distribution of forests in 3 Bangladesh. Describe the distribution of deciduous forest in Bangladesh. Centre / Dhaka / Mymensigh / Gazipur / Tangil NE / Sylhet NW / Dinajpur / Ranjpur 2(a)(ii) Fig. 5 shows the land area covered by forest and the total forest lost in 2 three countries between 2001 and 2012. Complete Fig. 5 using the following figures. • land area covered by forest – Myanmar 68% • total forest lost between 2001 and 2012 – Bangladesh 2% One mark for each column correctly drawn and shaded 2(a)(iii) Why is deforestation taking place in Bangladesh? 4 Wood for domestic use or e.g. fuel / cooking Timber or e.g. making furniture / house construction Land for: Houses / settlements Agriculture Shrimp culture Industries / factories Roads Mining 2(b)(i) Describe the challenges created by deforestation for: 2 farming Increased run-off Increased wind erosion / soil erosion Less rainfall / drier climate reduces crop production 2(b)(ii) climate 2 Increase in CO2 Global warming / increase temperature Reduced rainfall / less transpiration / increase drought / decrease humidity 2(b)(iii) urban areas 2 More air pollution / haze + development mark e.g. breathing problems Animals losing habitat moving into urban areas etc. 2(c)(i) Why are mangrove forests found in coastal areas? 2 Coastal areas are: Waterlogged / swampy Saline Roots snorkel for air / pneumetaphorus roots Strong root system Turn leaves to reduce transpiration Seeds can float Excess salt lost in old leaves Salt lost through glands in leaves etc. 2(c)(ii) Using examples explain how forests are important to the wildlife in 3 Bangladesh. Named e.g. Sundarbans, Royal Bengal Tiger etc. Habitat / shelter Food supply Endangered species Maintain biodiversity / ecological balance Interdependent plants / food chain 2(d)(i) Air pollution and water pollution are two growing challenges in 1 Bangladesh and also globally. Study the two statements below. A ‘Environmental laws are the only way to control pollution.’ B ‘Education and monitoring are the only sustainable ways to control pollution.’ Give one piece of evidence which supports statement A. Strict control / laws will directly influence people’s behavior Need fines for ignoring guidelines Extreme consequences on the natural environment 2(d)(ii) Give one piece of evidence which supports statement B. 1 Sustainable approach alters behaviour Ensures people understand consequences Leads to correct use of fertilisers / pesticides Ensures correct use of existing waste disposal facilities 2(d)(iii) Which statement do you agree with most? Give reasons for your 3 answer. No marks for stating A or B, only for giving reasons Credit reasons for accepting one and rejecting the other Accept answers that give support to both statements Allow points to be developed
Question 3
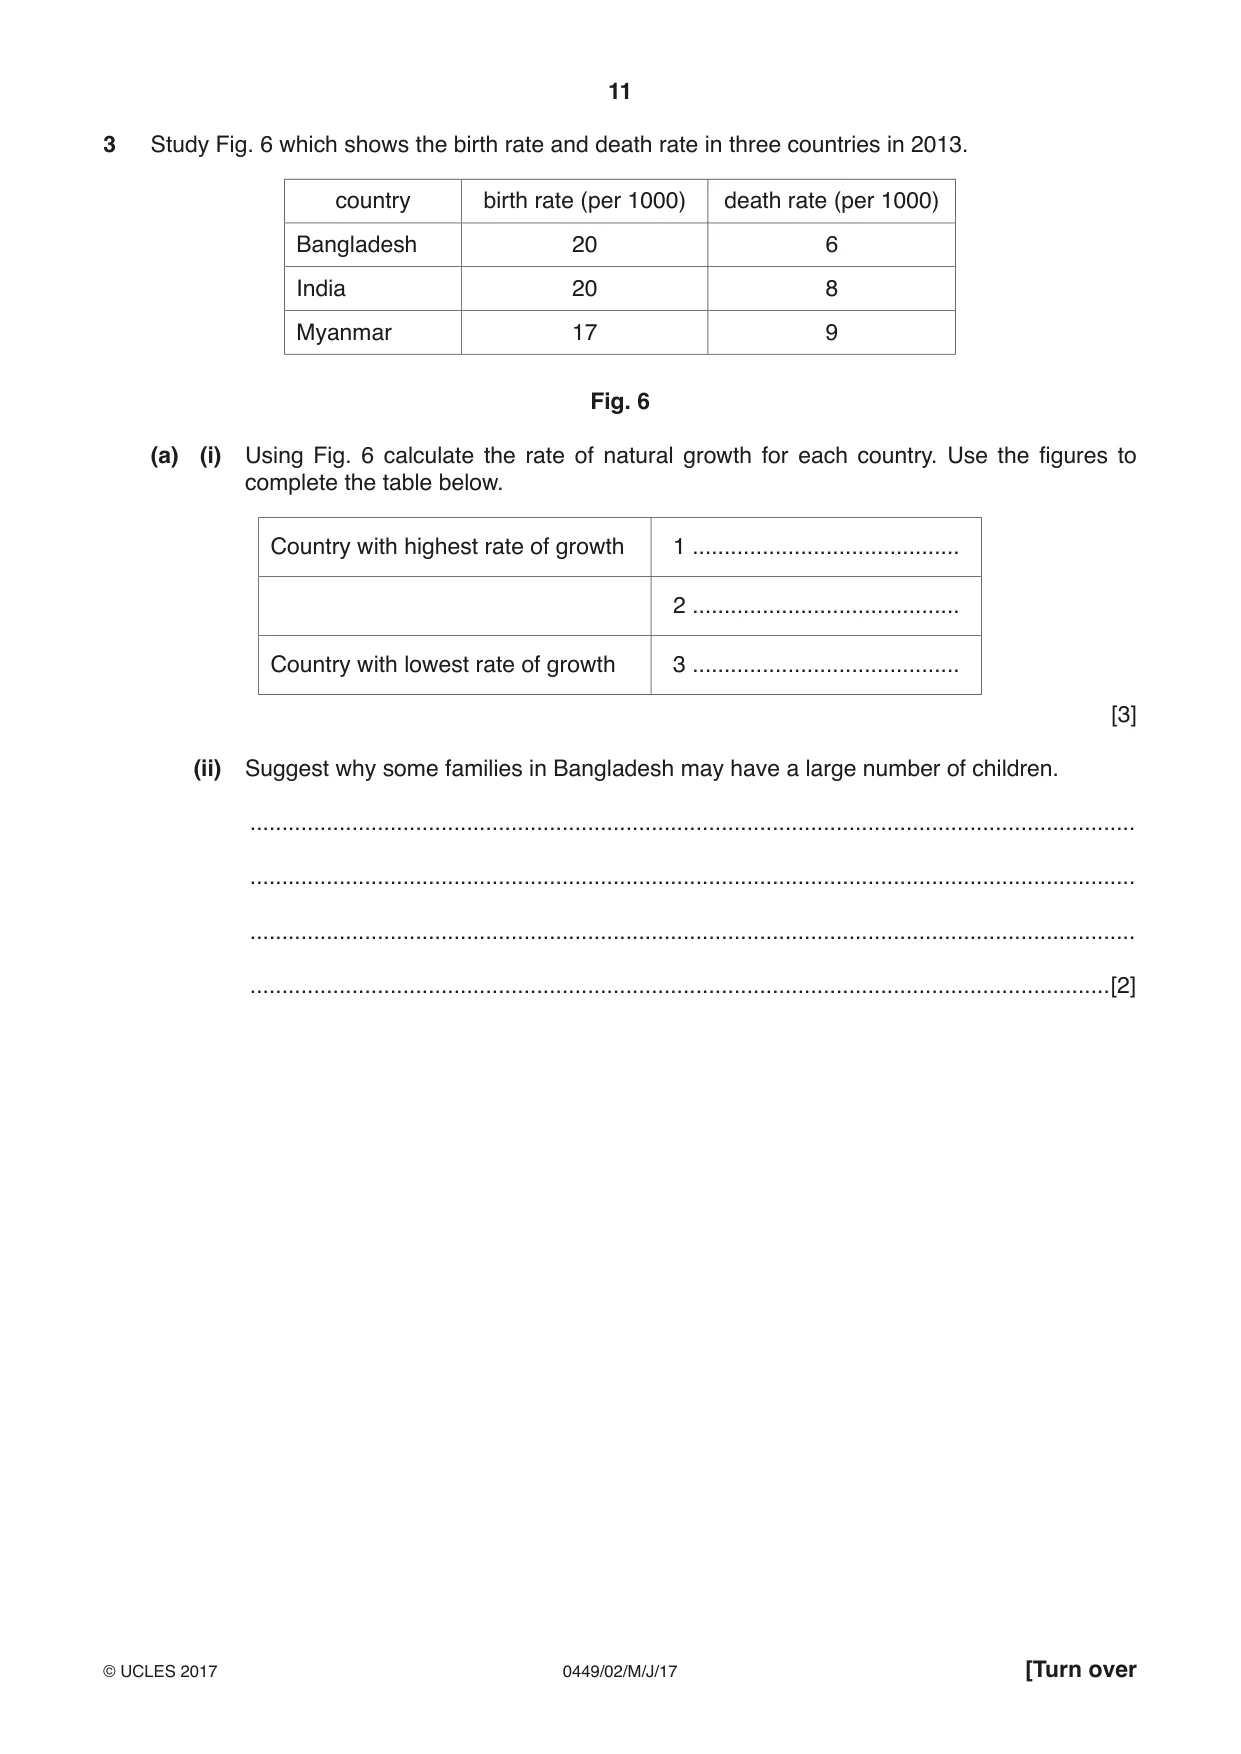
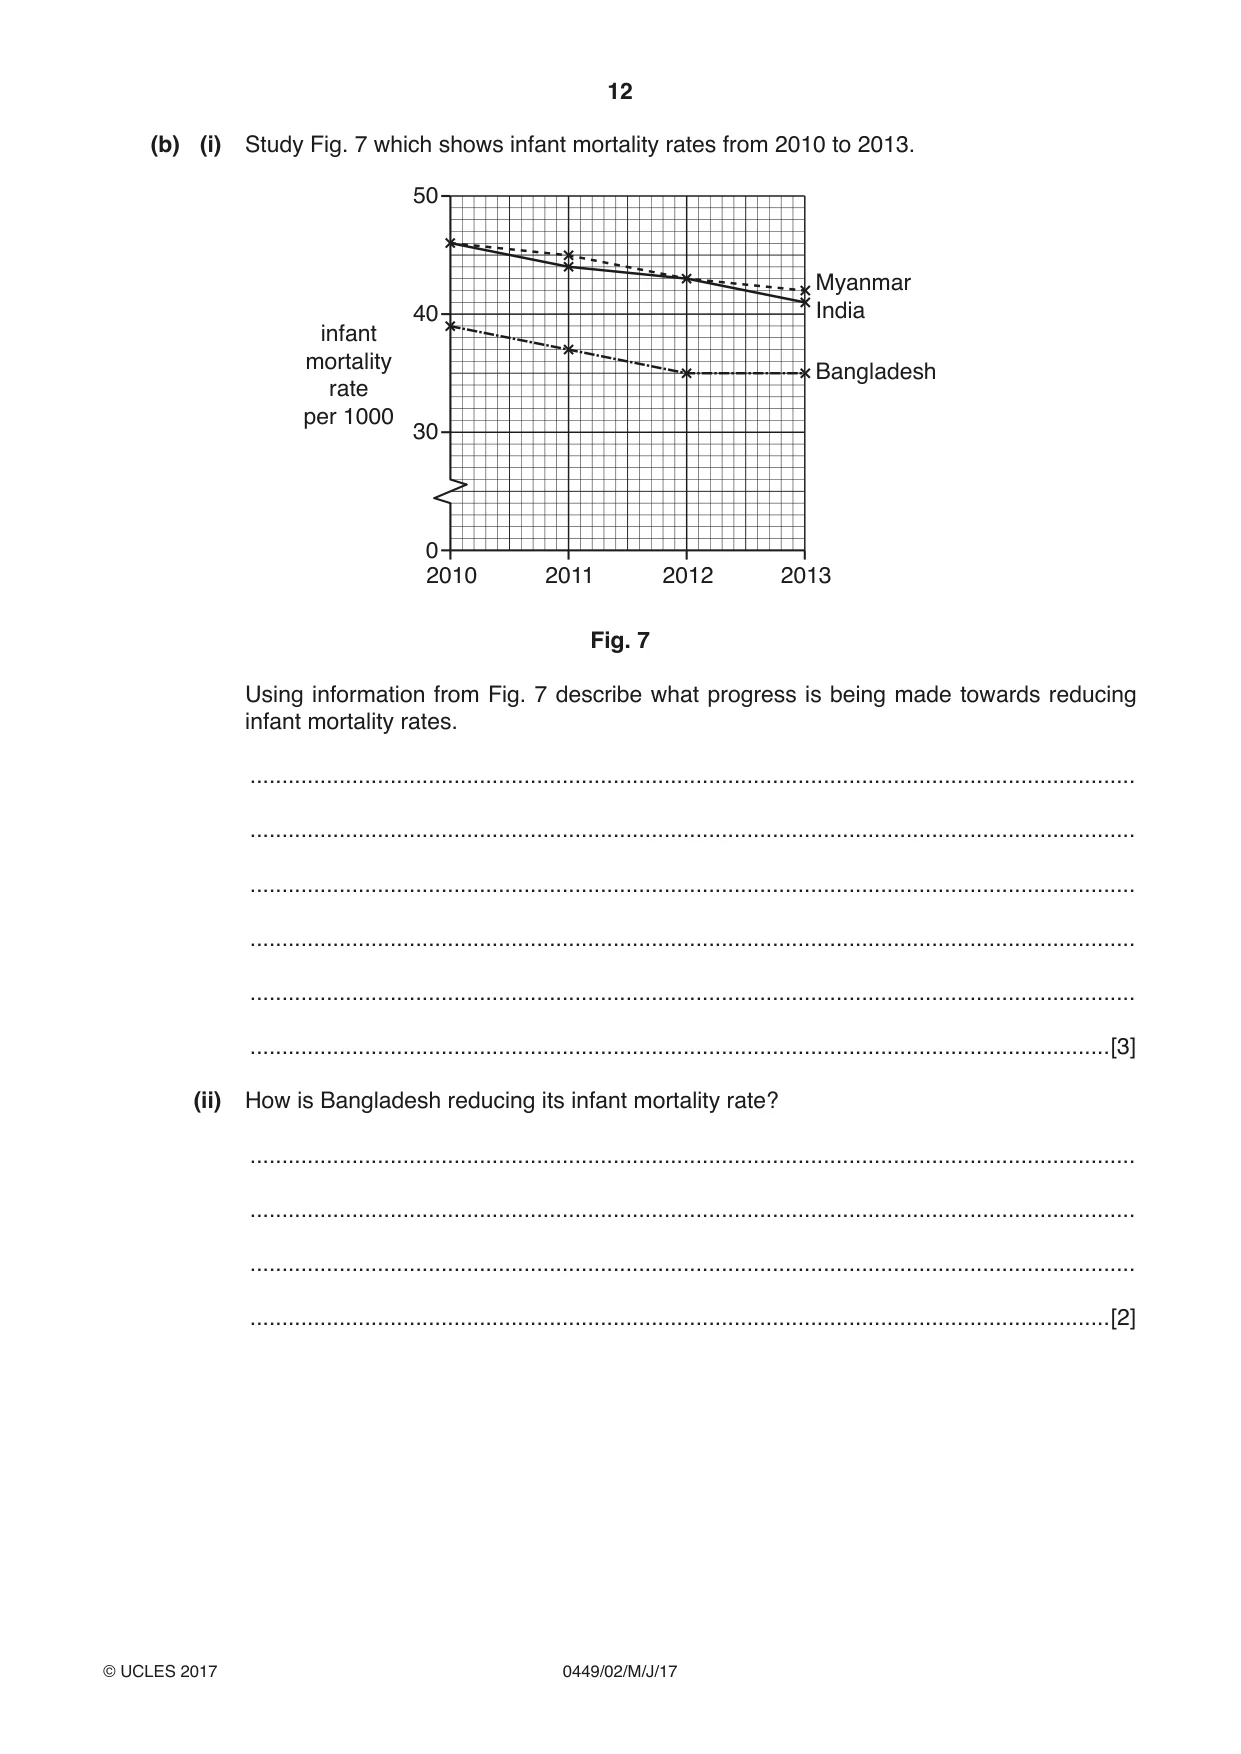
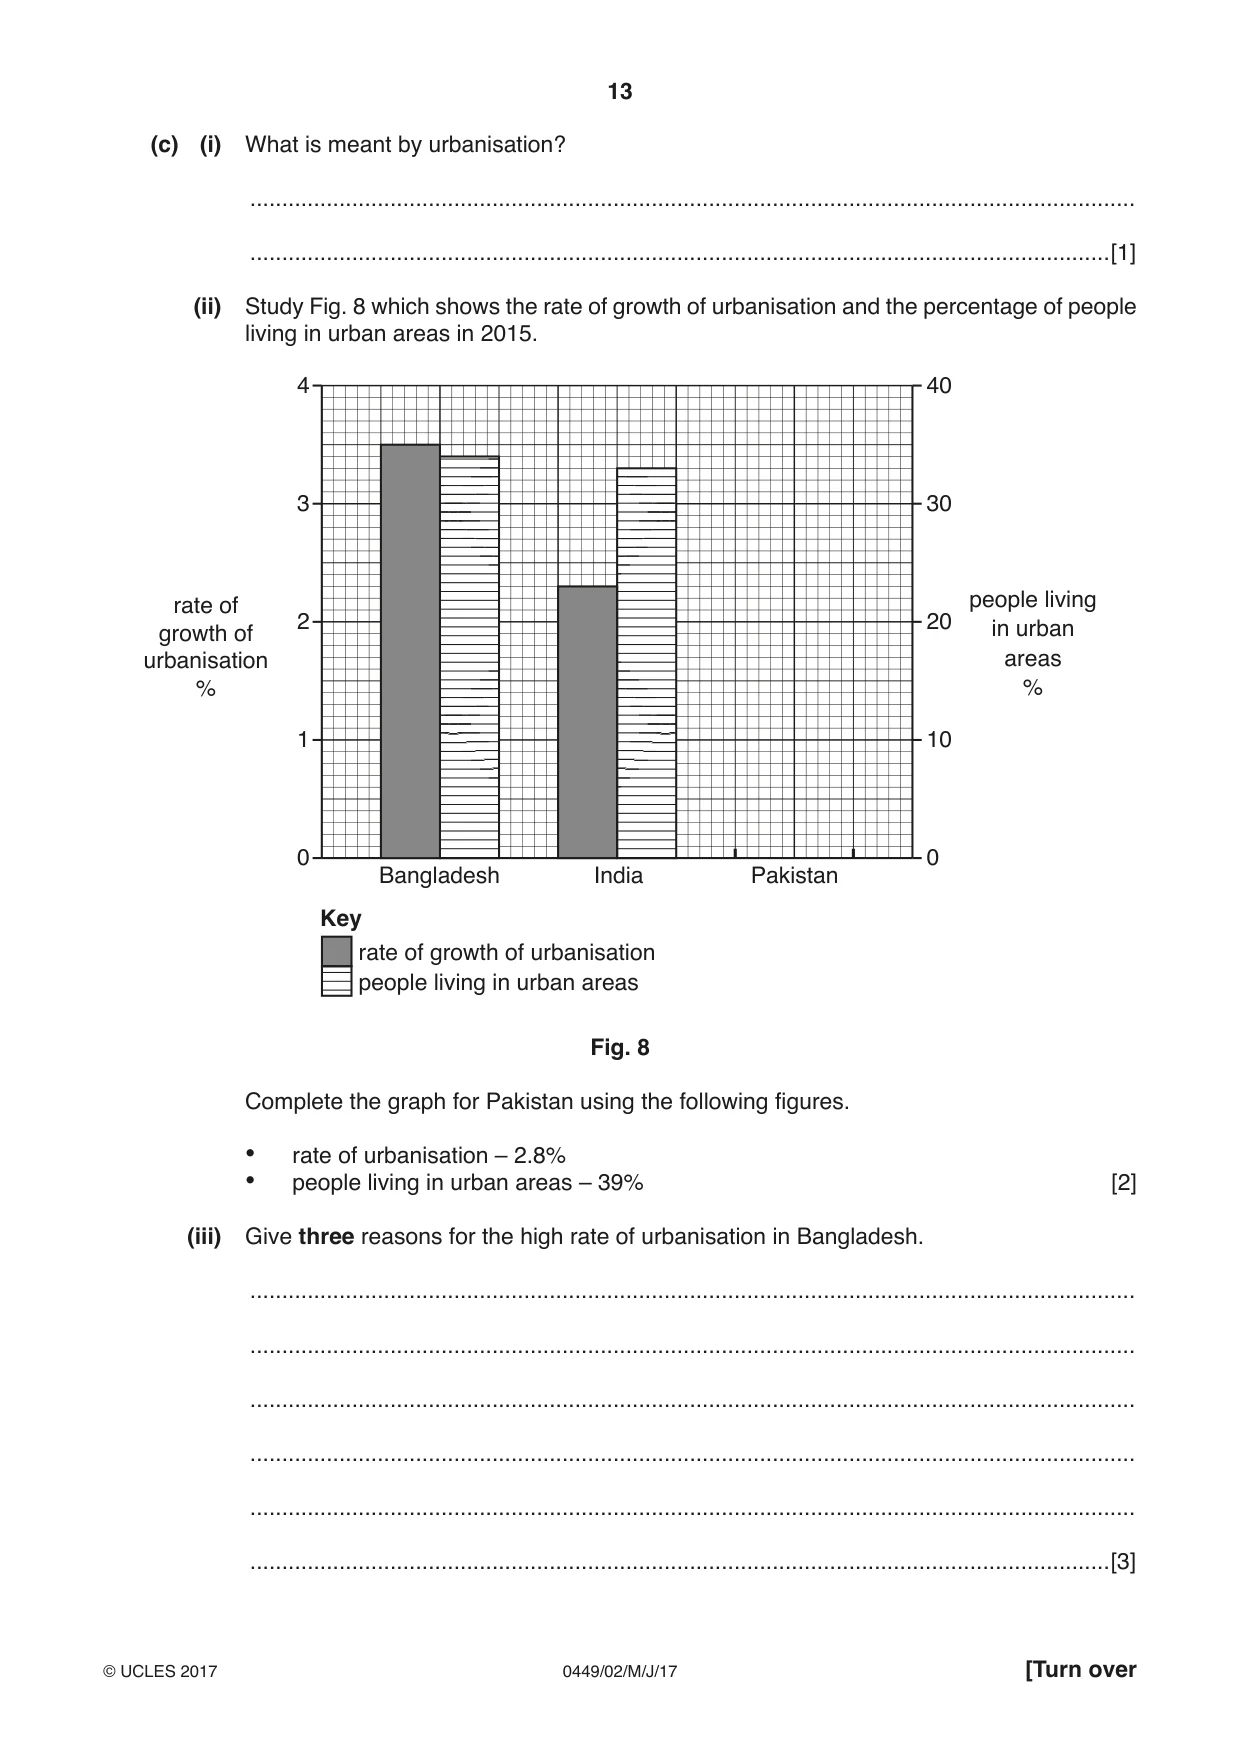
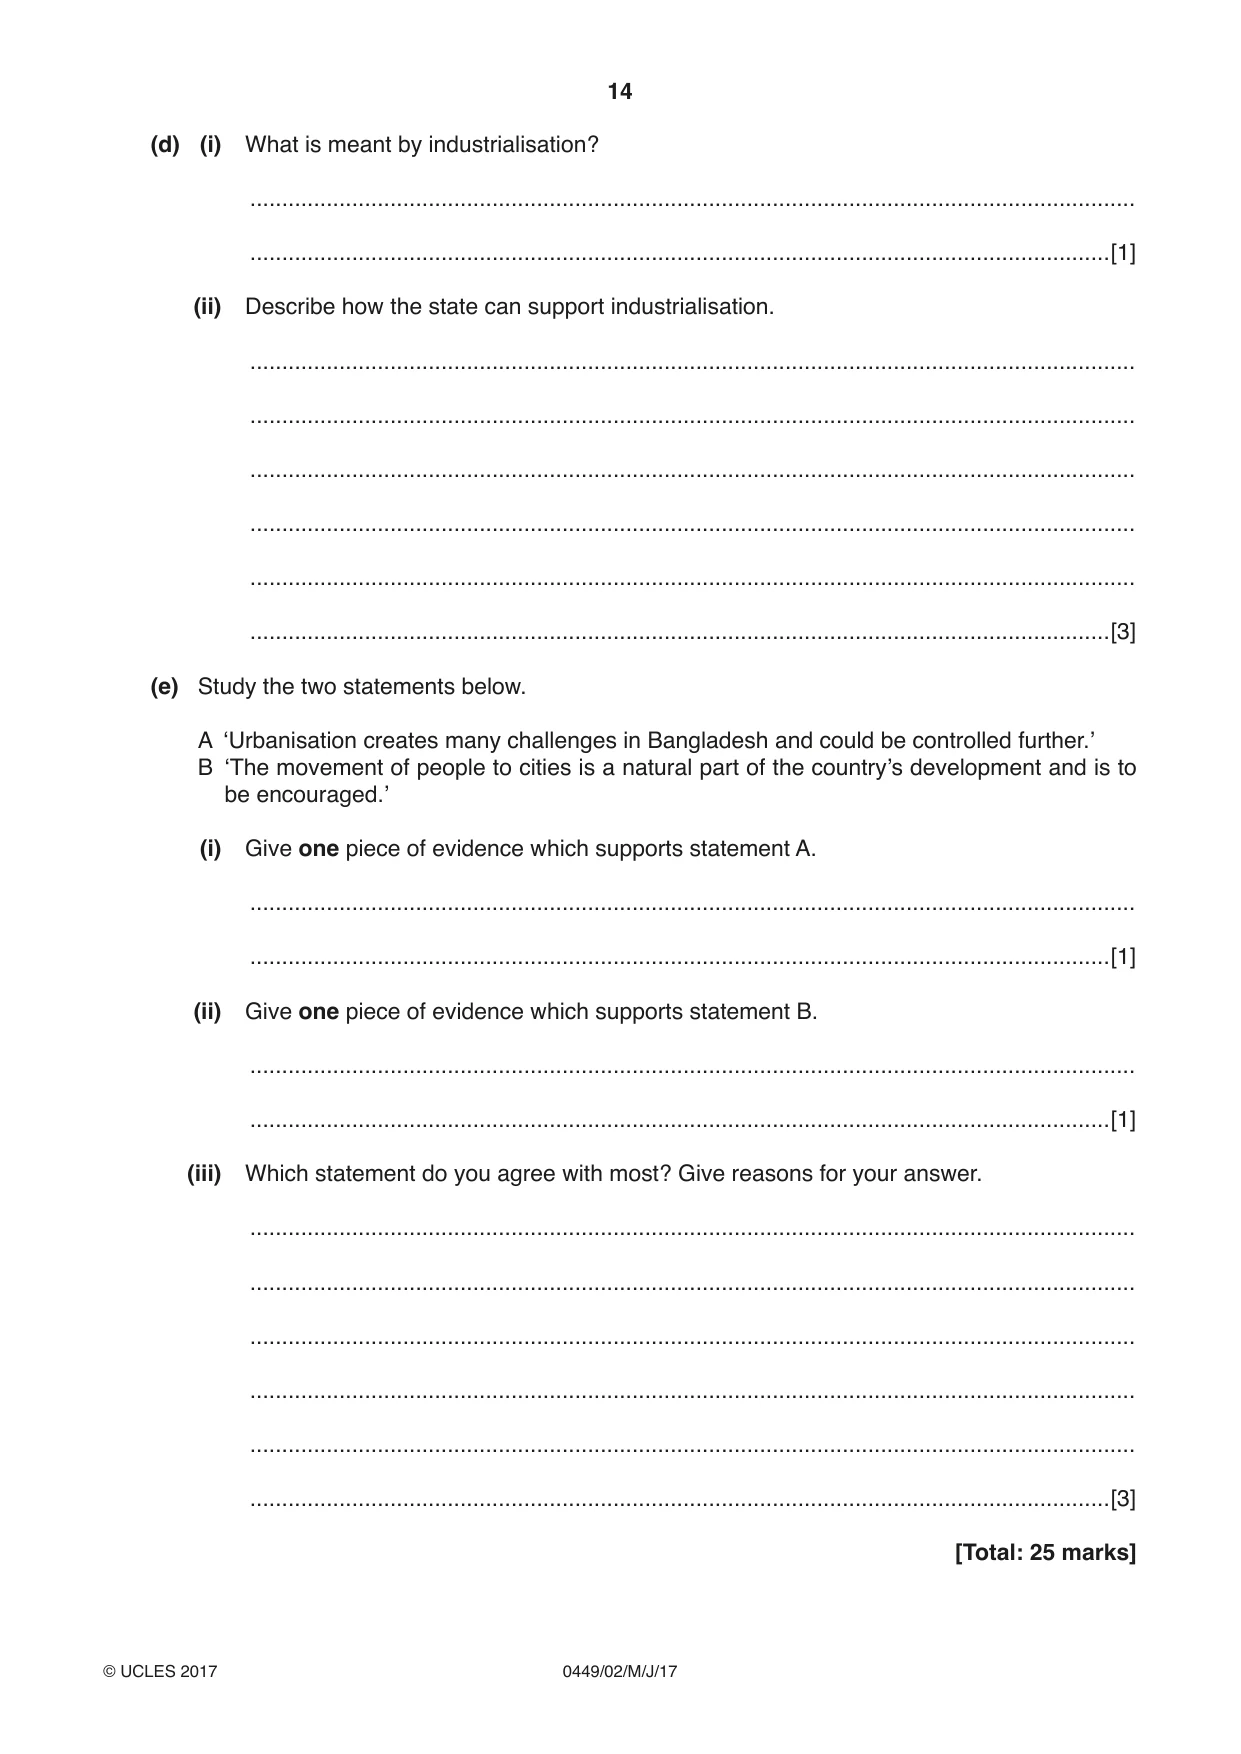
3 Study Fig. 6 which shows the birth rate and death rate in three countries in 2013. country birth rate (per 1000) death rate (per 1000) Bangladesh 20 6 India 20 8 Myanmar 17 9 Fig. 6 (a) (i) Using Fig. 6 calculate the rate of natural growth for each country. Use the figures to complete the table below. Country with highest rate of growth 1 .......................................... 2 .......................................... Country with lowest rate of growth 3 .......................................... [3] (ii) Suggest why some families in Bangladesh may have a large number of children. ........................................................................................................................................... ........................................................................................................................................... ........................................................................................................................................... .......................................................................................................................................[2] (b) (i) Study Fig. 7 which shows infant mortality rates from 2010 to 2013. 50 Myanmar 40 India infant mortality Bangladesh rate per 1000 30 0 2010 2011 2012 2013 Fig. 7 Using information from Fig. 7 describe what progress is being made towards reducing infant mortality rates. ........................................................................................................................................... ........................................................................................................................................... ........................................................................................................................................... ........................................................................................................................................... ........................................................................................................................................... .......................................................................................................................................[3] (ii) How is Bangladesh reducing its infant mortality rate? ........................................................................................................................................... ........................................................................................................................................... ........................................................................................................................................... .......................................................................................................................................[2] (c) (i) What is meant by urbanisation? ........................................................................................................................................... .......................................................................................................................................[1] (ii) Study Fig. 8 which shows the rate of growth of urbanisation and the percentage of people living in urban areas in 2015. 4 40 3 30 rate of people living 2 20 growth of in urban urbanisation areas % % 1 10 0 0 Bangladesh India Pakistan Key rate of growth of urbanisation people living in urban areas Fig. 8 Complete the graph for Pakistan using the following figures. • rate of urbanisation – 2.8% • people living in urban areas – 39% [2] (iii) Give three reasons for the high rate of urbanisation in Bangladesh. ........................................................................................................................................... ........................................................................................................................................... ........................................................................................................................................... ........................................................................................................................................... ........................................................................................................................................... .......................................................................................................................................[3] (d) (i) What is meant by industrialisation? ........................................................................................................................................... .......................................................................................................................................[1] (ii) Describe how the state can support industrialisation. ........................................................................................................................................... ........................................................................................................................................... ........................................................................................................................................... ........................................................................................................................................... ........................................................................................................................................... .......................................................................................................................................[3] (e) Study the two statements below. A ‘Urbanisation creates many challenges in Bangladesh and could be controlled further.’ B ‘The movement of people to cities is a natural part of the country’s development and is to be encouraged.’ (i) Give one piece of evidence which supports statement A. ........................................................................................................................................... .......................................................................................................................................[1] (ii) Give one piece of evidence which supports statement B. ........................................................................................................................................... .......................................................................................................................................[1] (iii) Which statement do you agree with most? Give reasons for your answer. ........................................................................................................................................... ........................................................................................................................................... ........................................................................................................................................... ........................................................................................................................................... ........................................................................................................................................... .......................................................................................................................................[3] [Total: 25 marks]
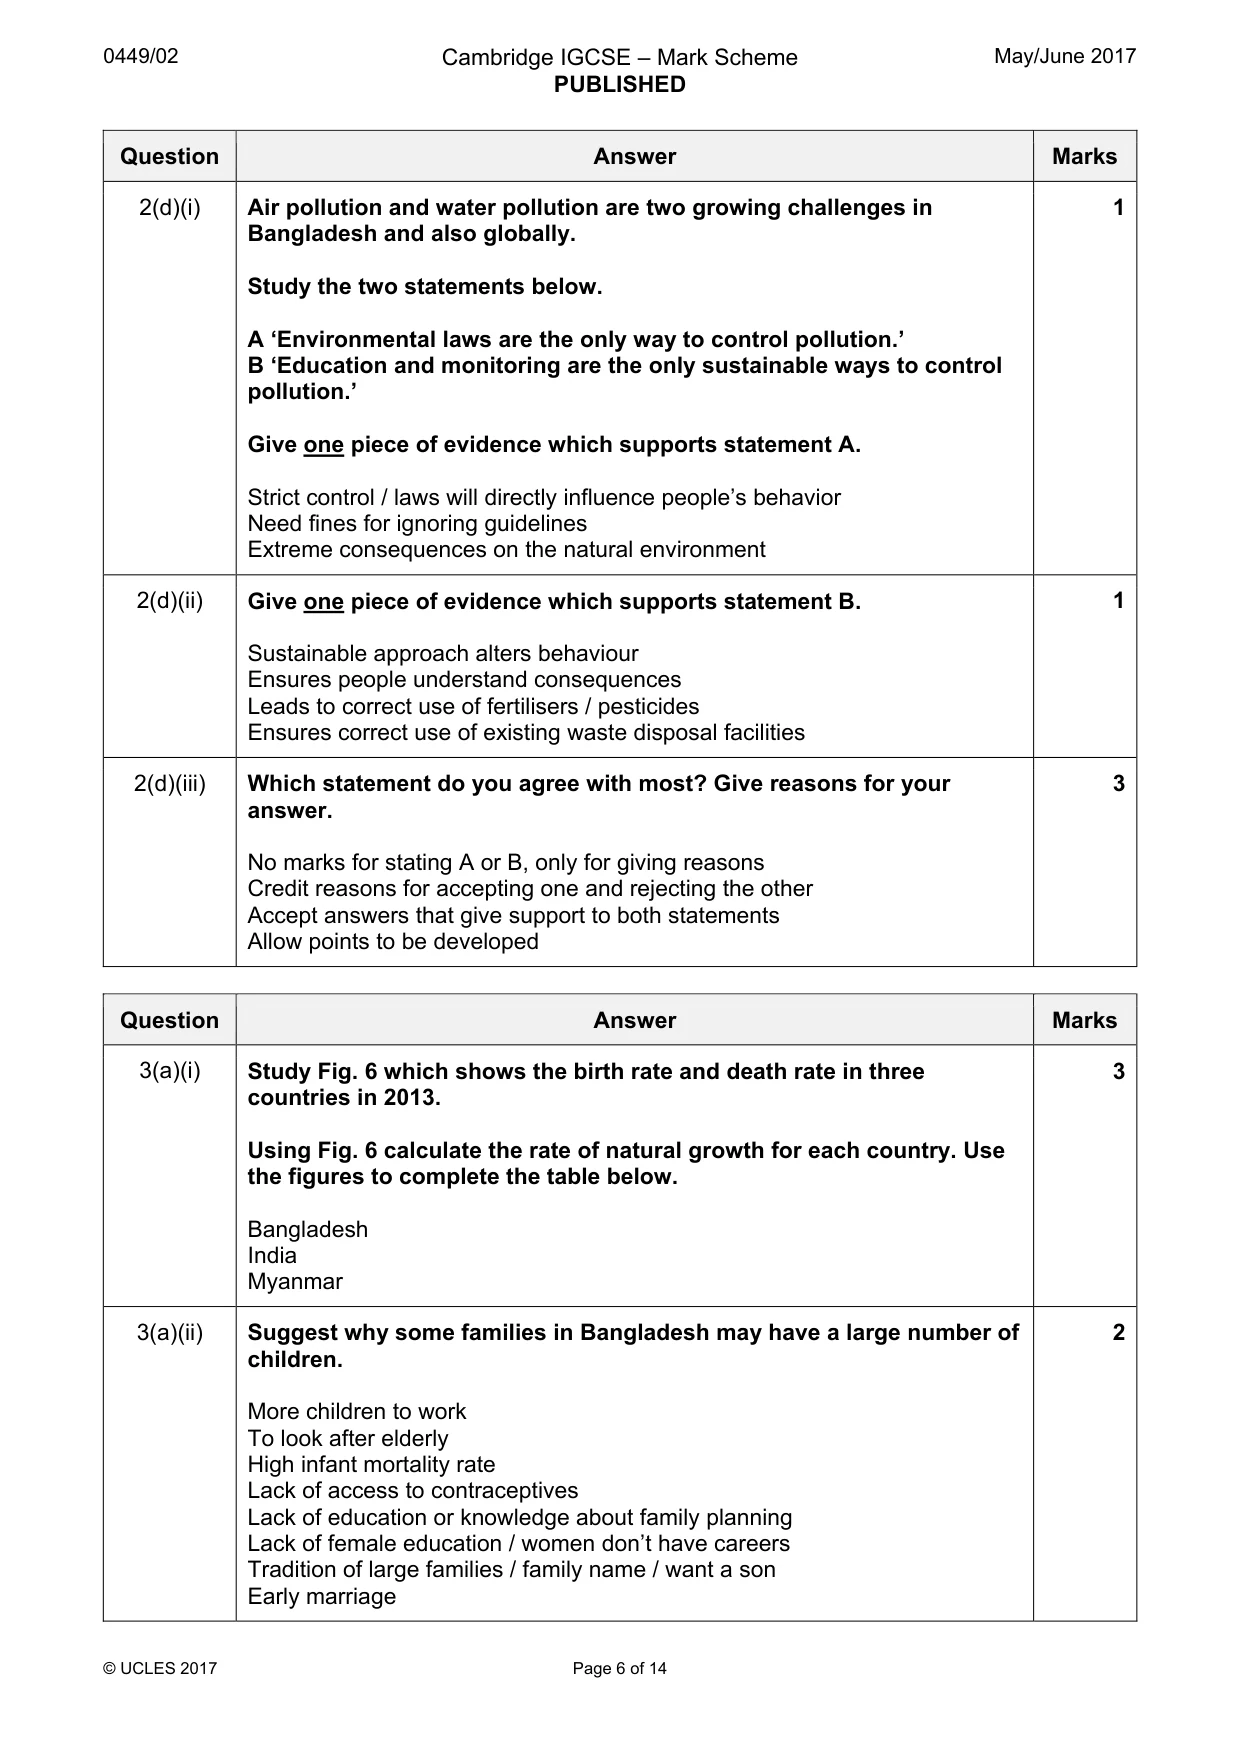
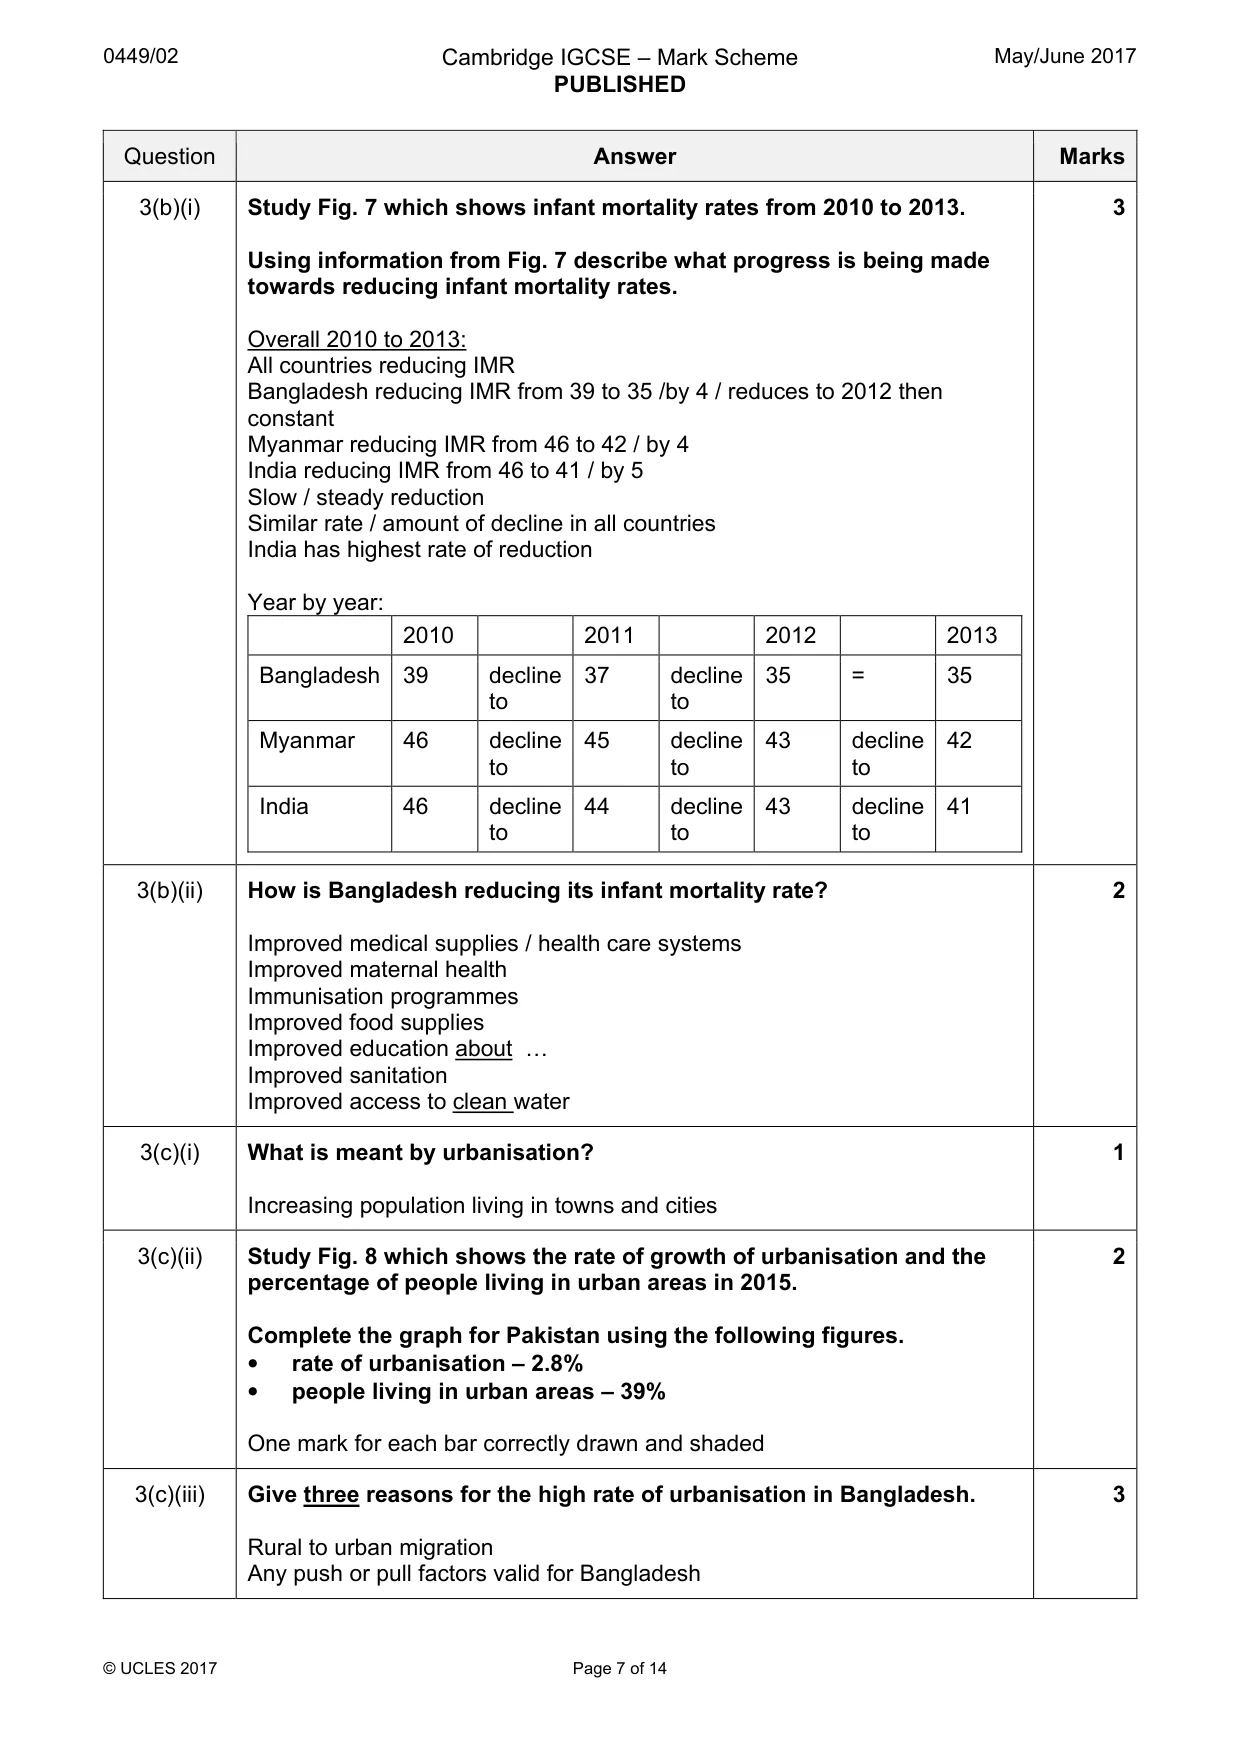
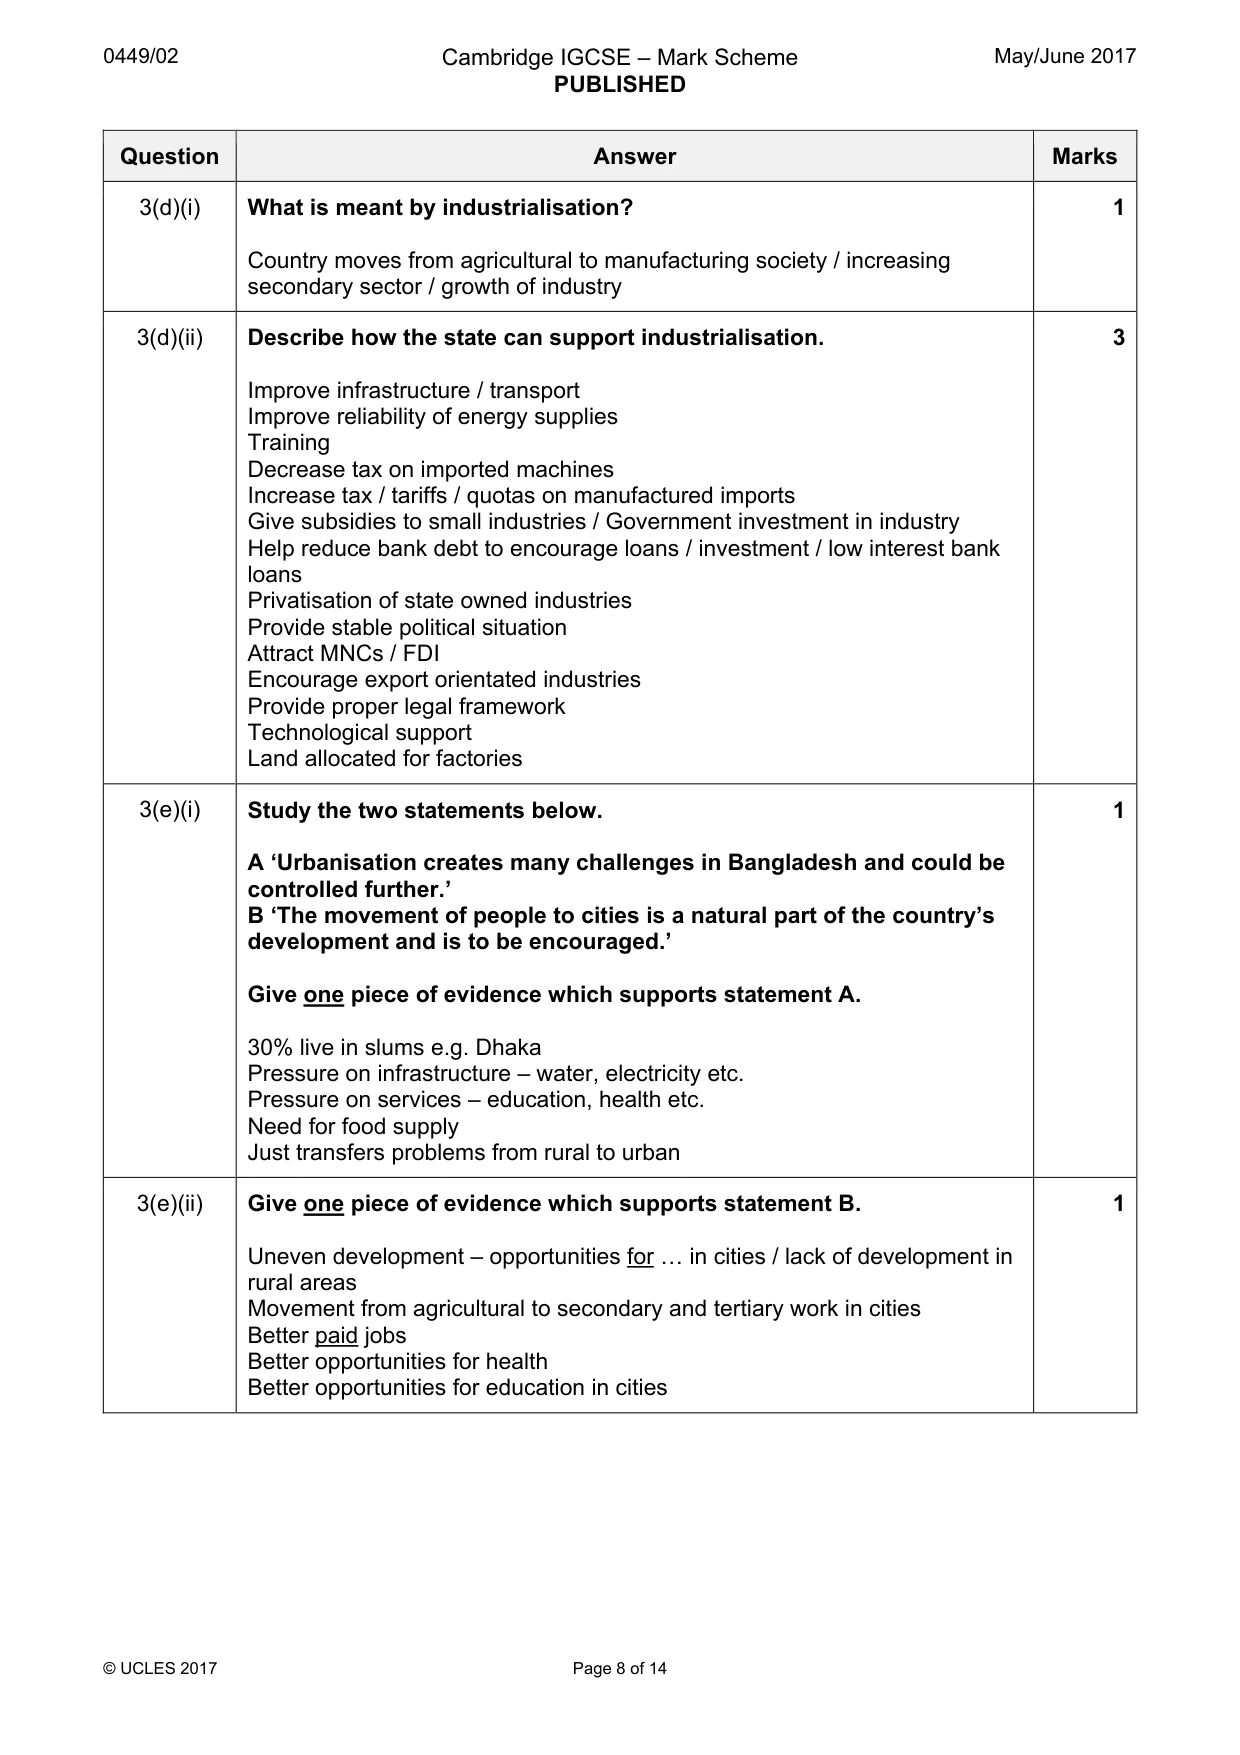
Mark scheme: 3(a)(i) Study Fig. 6 which shows the birth rate and death rate in three 3 countries in 2013. Using Fig. 6 calculate the rate of natural growth for each country. Use the figures to complete the table below. Bangladesh India Myanmar 3(a)(ii) Suggest why some families in Bangladesh may have a large number of 2 children. More children to work To look after elderly High infant mortality rate Lack of access to contraceptives Lack of education or knowledge about family planning Lack of female education / women don’t have careers Tradition of large families / family name / want a son Early marriage 3(b)(i) Study Fig. 7 which shows infant mortality rates from 2010 to 2013. 3 Using information from Fig. 7 describe what progress is being made towards reducing infant mortality rates. Overall 2010 to 2013: All countries reducing IMR Bangladesh reducing IMR from 39 to 35 /by 4 / reduces to 2012 then constant Myanmar reducing IMR from 46 to 42 / by 4 India reducing IMR from 46 to 41 / by 5 Slow / steady reduction Similar rate / amount of decline in all countries India has highest rate of reduction Year by year: 2010 2011 2012 2013 Bangladesh 39 decline 37 decline 35 = 35 to to Myanmar 46 decline 45 decline 43 decline 42 to to to India 46 decline 44 decline 43 decline 41 to to to 3(b)(ii) How is Bangladesh reducing its infant mortality rate? 2 Improved medical supplies / health care systems Improved maternal health Immunisation programmes Improved food supplies Improved education about « Improved sanitation Improved access to clean water 3(c)(i) What is meant by urbanisation? 1 Increasing population living in towns and cities 3(c)(ii) Study Fig. 8 which shows the rate of growth of urbanisation and the 2 percentage of people living in urban areas in 2015. Complete the graph for Pakistan using the following figures. • rate of urbanisation – 2.8% • people living in urban areas – 39% One mark for each bar correctly drawn and shaded 3(c)(iii) Give three reasons for the high rate of urbanisation in Bangladesh. 3 Rural to urban migration Any push or pull factors valid for Bangladesh 3(d)(i) What is meant by industrialisation? 1 Country moves from agricultural to manufacturing society / increasing secondary sector / growth of industry 3(d)(ii) Describe how the state can support industrialisation. 3 Improve infrastructure / transport Improve reliability of energy supplies Training Decrease tax on imported machines Increase tax / tariffs / quotas on manufactured imports Give subsidies to small industries / Government investment in industry Help reduce bank debt to encourage loans / investment / low interest bank loans Privatisation of state owned industries Provide stable political situation Attract MNCs / FDI Encourage export orientated industries Provide proper legal framework Technological support Land allocated for factories 3(e)(i) Study the two statements below. 1 A ‘Urbanisation creates many challenges in Bangladesh and could be controlled further.’ B ‘The movement of people to cities is a natural part of the country’s development and is to be encouraged.’ Give one piece of evidence which supports statement A. 30% live in slums e.g. Dhaka Pressure on infrastructure – water, electricity etc. Pressure on services – education, health etc. Need for food supply Just transfers problems from rural to urban 3(e)(ii) Give one piece of evidence which supports statement B. 1 Uneven development – opportunities for « in cities / lack of development in rural areas Movement from agricultural to secondary and tertiary work in cities Better paid jobs Better opportunities for health Better opportunities for education in cities 3(e)(iii) Which statement do you agree with most? Give reasons for your 3 answer. No marks for stating A or B, only for giving reasons Credit reasons for accepting one and rejecting the other Accept answers that give support to both statements Allow points to be developed
Q4 · Study Photograph A (Insert) which shows subsistence farming in Bangladesh
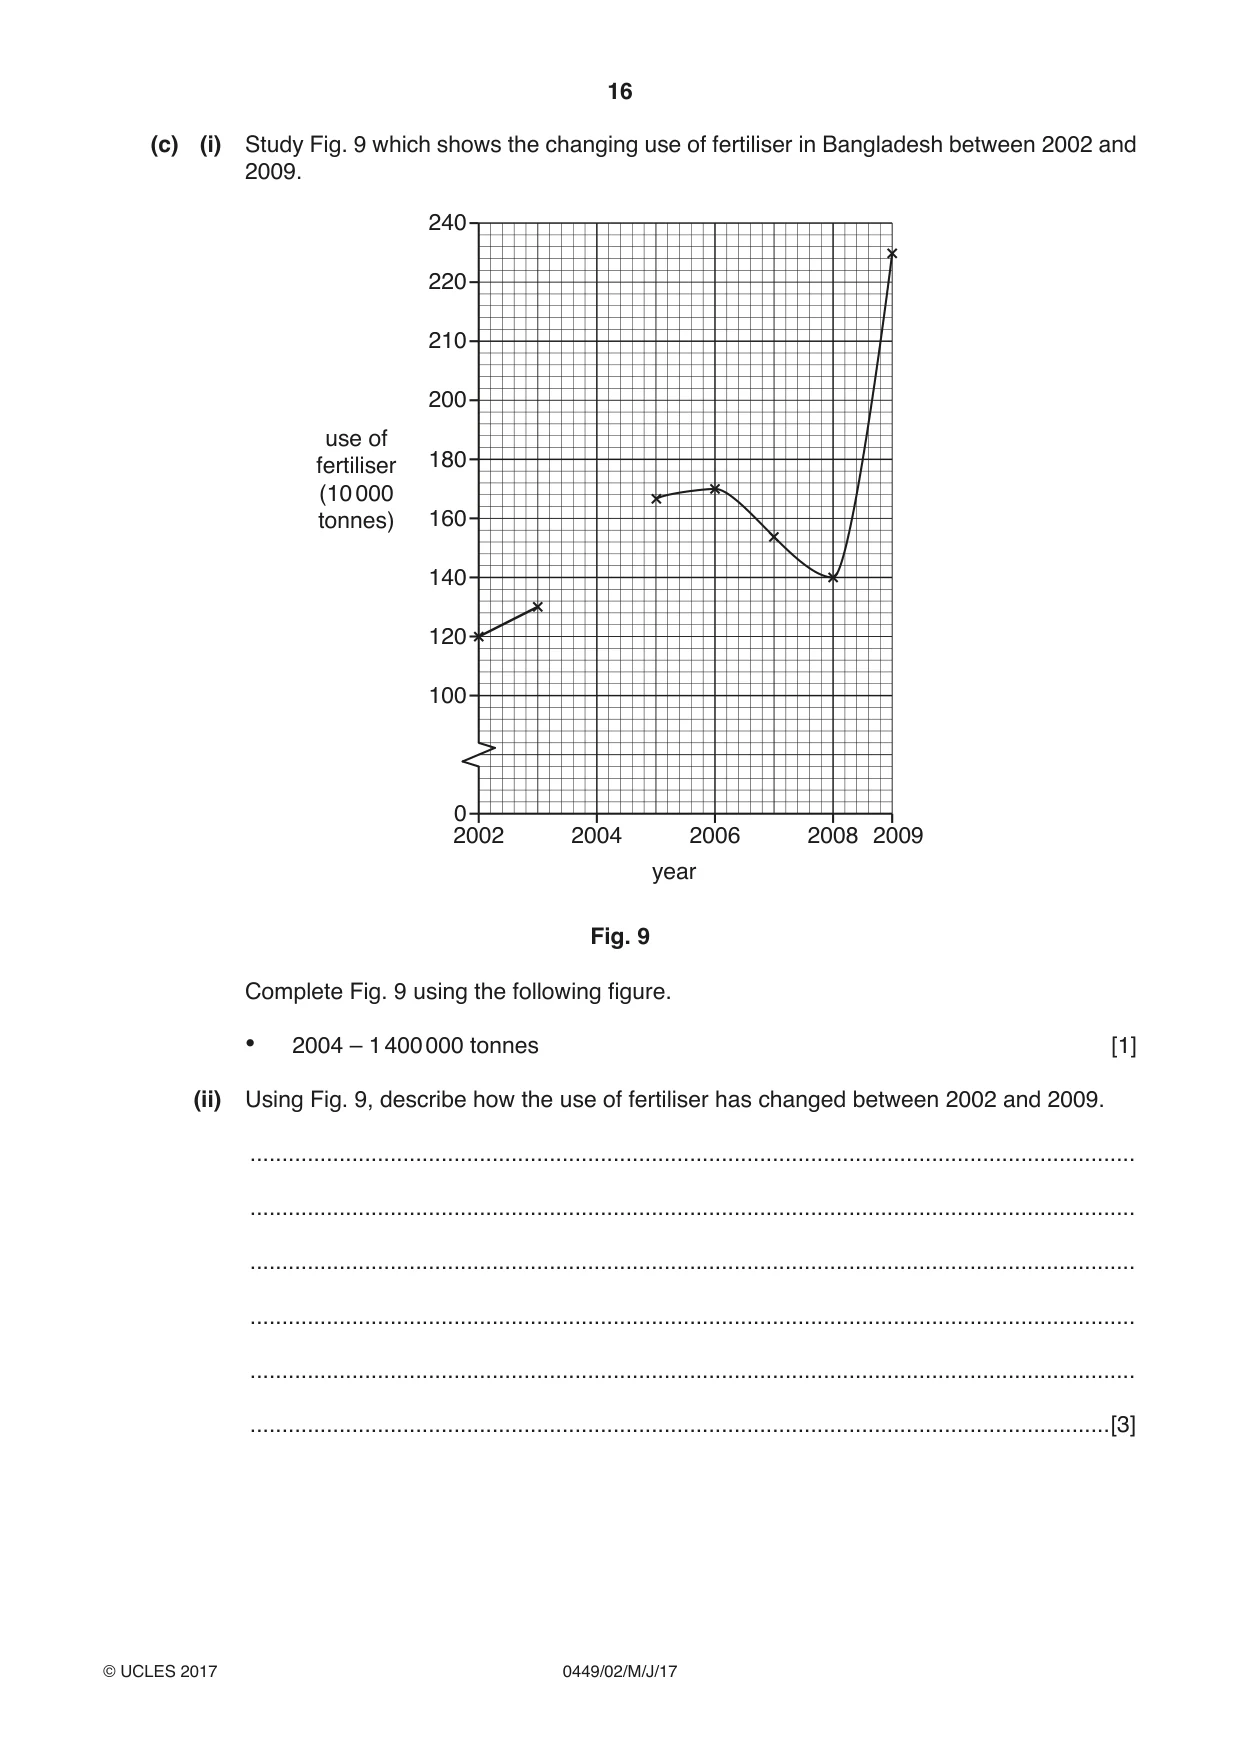
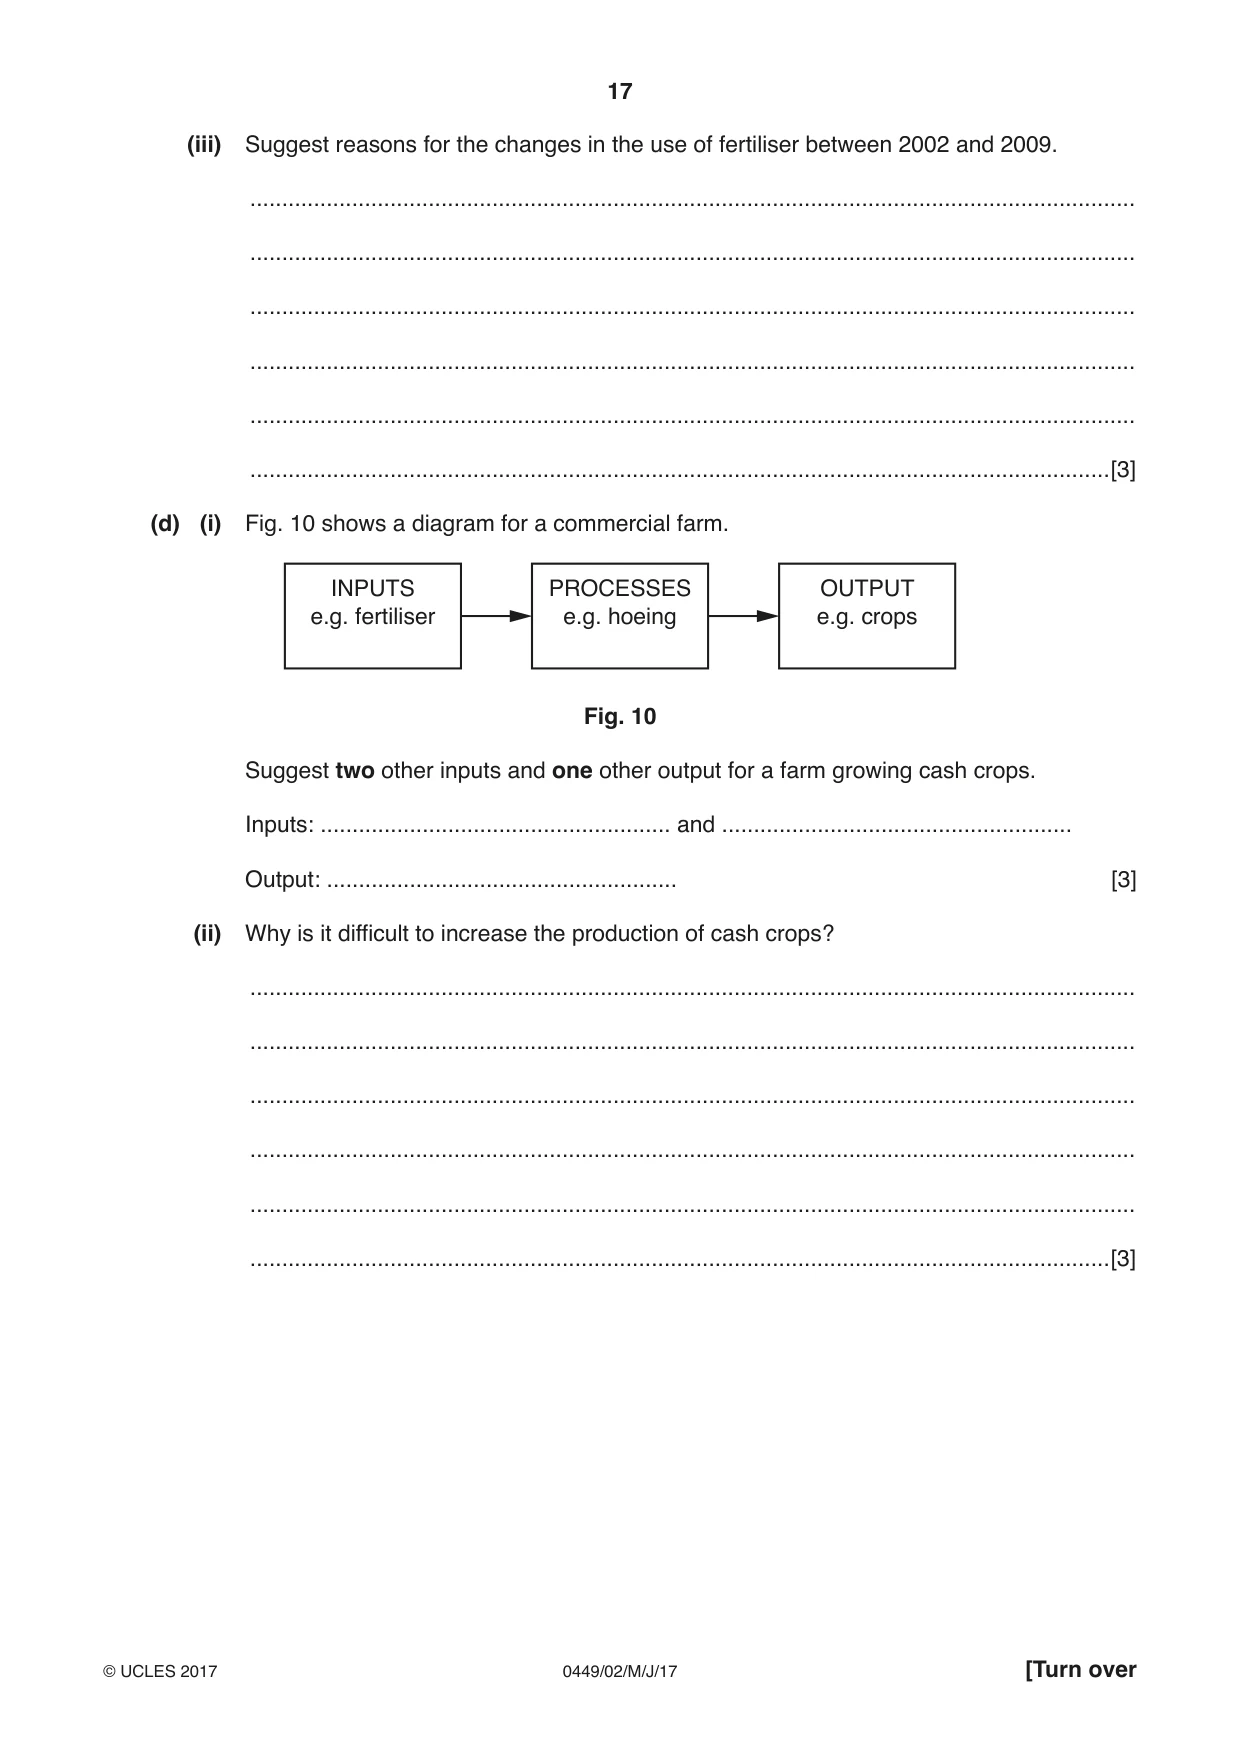
4 (a) Study Photograph A (Insert) which shows subsistence farming in Bangladesh. Describe the types of food production shown in Photograph A. ................................................................................................................................................... ................................................................................................................................................... ................................................................................................................................................... ................................................................................................................................................... ................................................................................................................................................... ................................................................................................................................................... ................................................................................................................................................... ...............................................................................................................................................[4] (b) How can the state help to protect its farmers from the effects of cyclones? ................................................................................................................................................... ................................................................................................................................................... ................................................................................................................................................... ................................................................................................................................................... ................................................................................................................................................... ...............................................................................................................................................[3] (c) (i) Study Fig. 9 which shows the changing use of fertiliser in Bangladesh between 2002 and 2009. 240 220 210 200 use of 180 fertiliser (10 000 tonnes) 160 140 120 100 0 2002 2004 2006 2008 2009 year Fig. 9 Complete Fig. 9 using the following figure. • 2004 – 1 400 000 tonnes [1] (ii) Using Fig. 9, describe how the use of fertiliser has changed between 2002 and 2009. ........................................................................................................................................... ........................................................................................................................................... ........................................................................................................................................... ........................................................................................................................................... ........................................................................................................................................... .......................................................................................................................................[3] (iii) Suggest reasons for the changes in the use of fertiliser between 2002 and 2009. ........................................................................................................................................... ........................................................................................................................................... ........................................................................................................................................... ........................................................................................................................................... ........................................................................................................................................... .......................................................................................................................................[3] (d) (i) Fig. 10 shows a diagram for a commercial farm. INPUTS PROCESSES OUTPUT e.g. fertiliser e.g. hoeing e.g. crops Fig. 10 Suggest two other inputs and one other output for a farm growing cash crops. Inputs: ....................................................... and ....................................................... Output: ....................................................... [3] (ii) Why is it difficult to increase the production of cash crops? ........................................................................................................................................... ........................................................................................................................................... ........................................................................................................................................... ........................................................................................................................................... ........................................................................................................................................... .......................................................................................................................................[3] (e) Study the two statements below. A ‘The Green Revolution is key to Bangladesh increasing its food supply.’ B ‘The Green Revolution does not benefit all farmers.’ (i) Give one piece of evidence which supports statement A. ........................................................................................................................................... .......................................................................................................................................[1] (ii) Give one piece of evidence which supports statement B. ........................................................................................................................................... .......................................................................................................................................[1] (iii) Which statement do you agree with most? Give reasons for your answer. ........................................................................................................................................... ........................................................................................................................................... ........................................................................................................................................... ........................................................................................................................................... ........................................................................................................................................... .......................................................................................................................................[3] [Total: 25 marks]
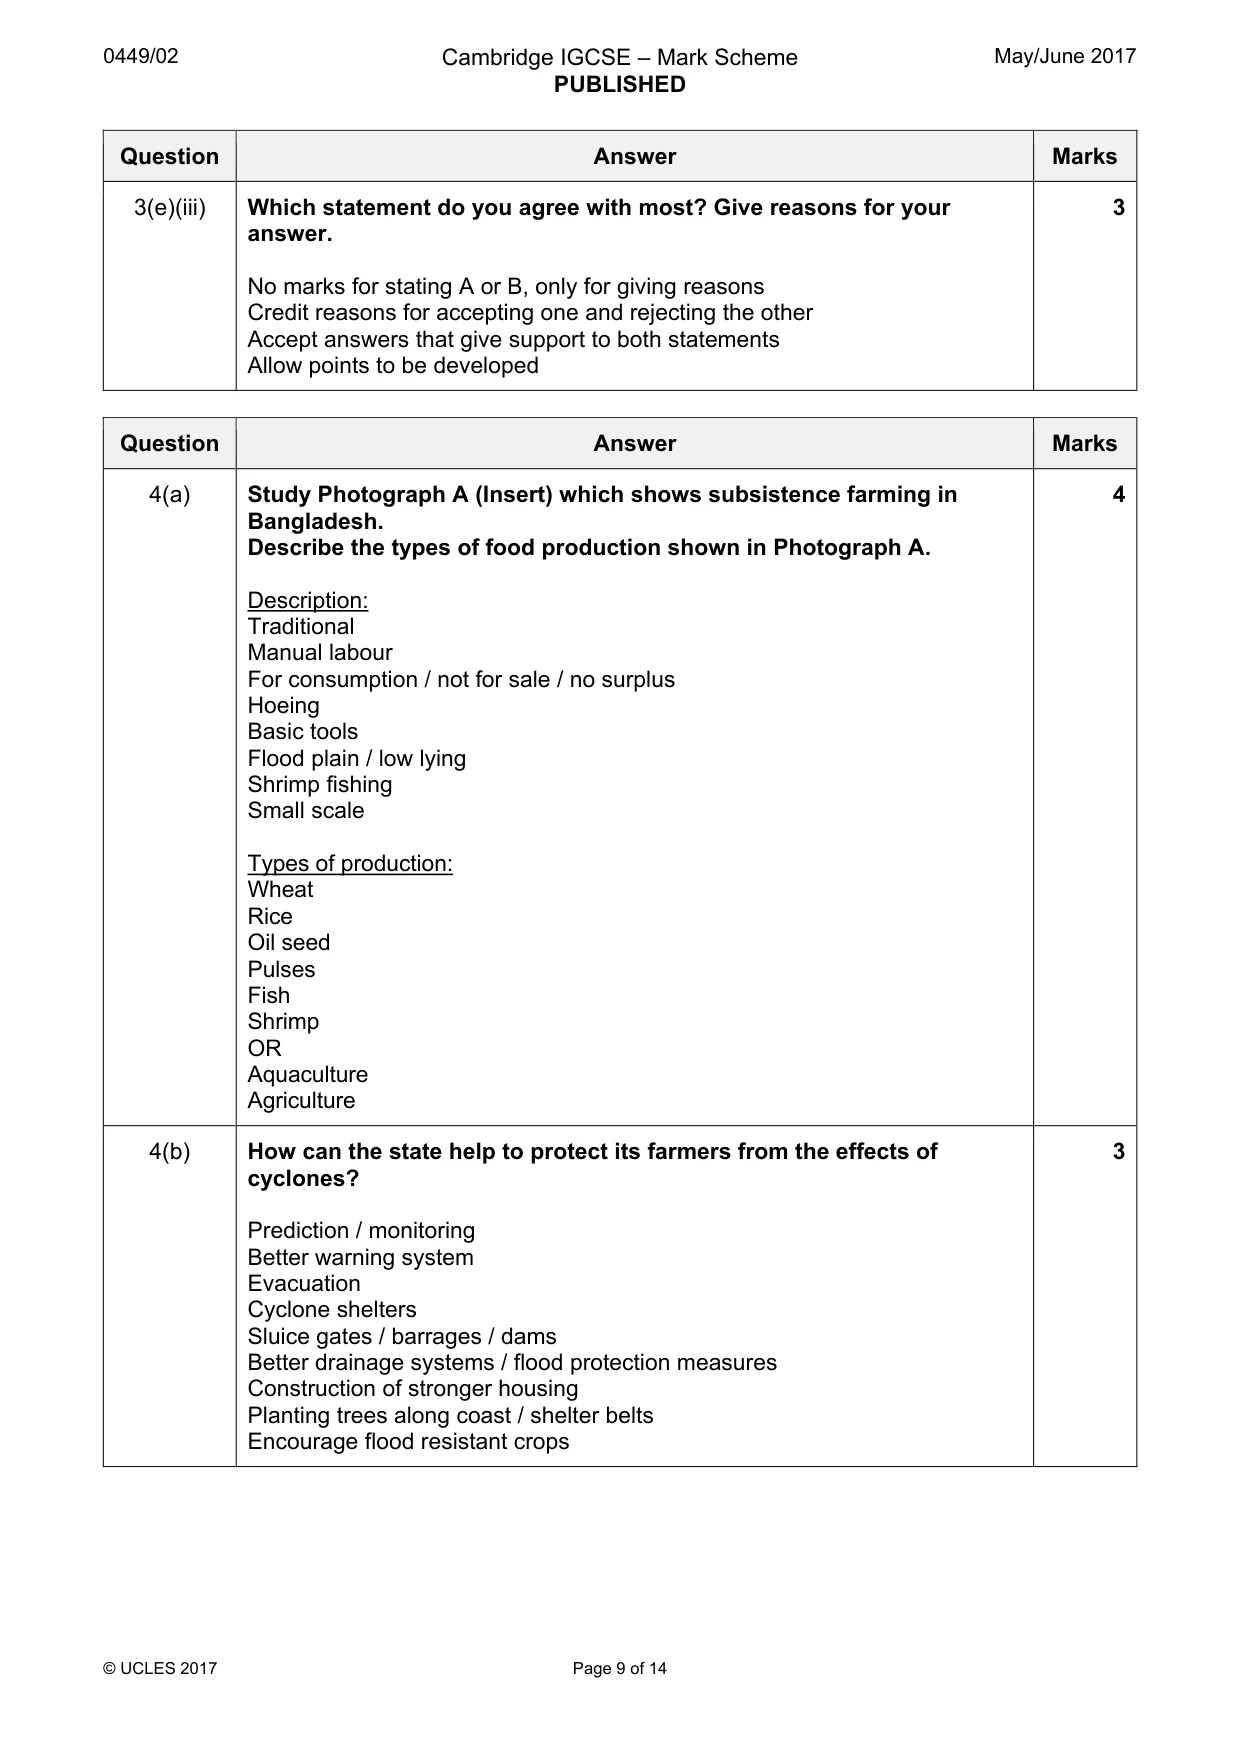
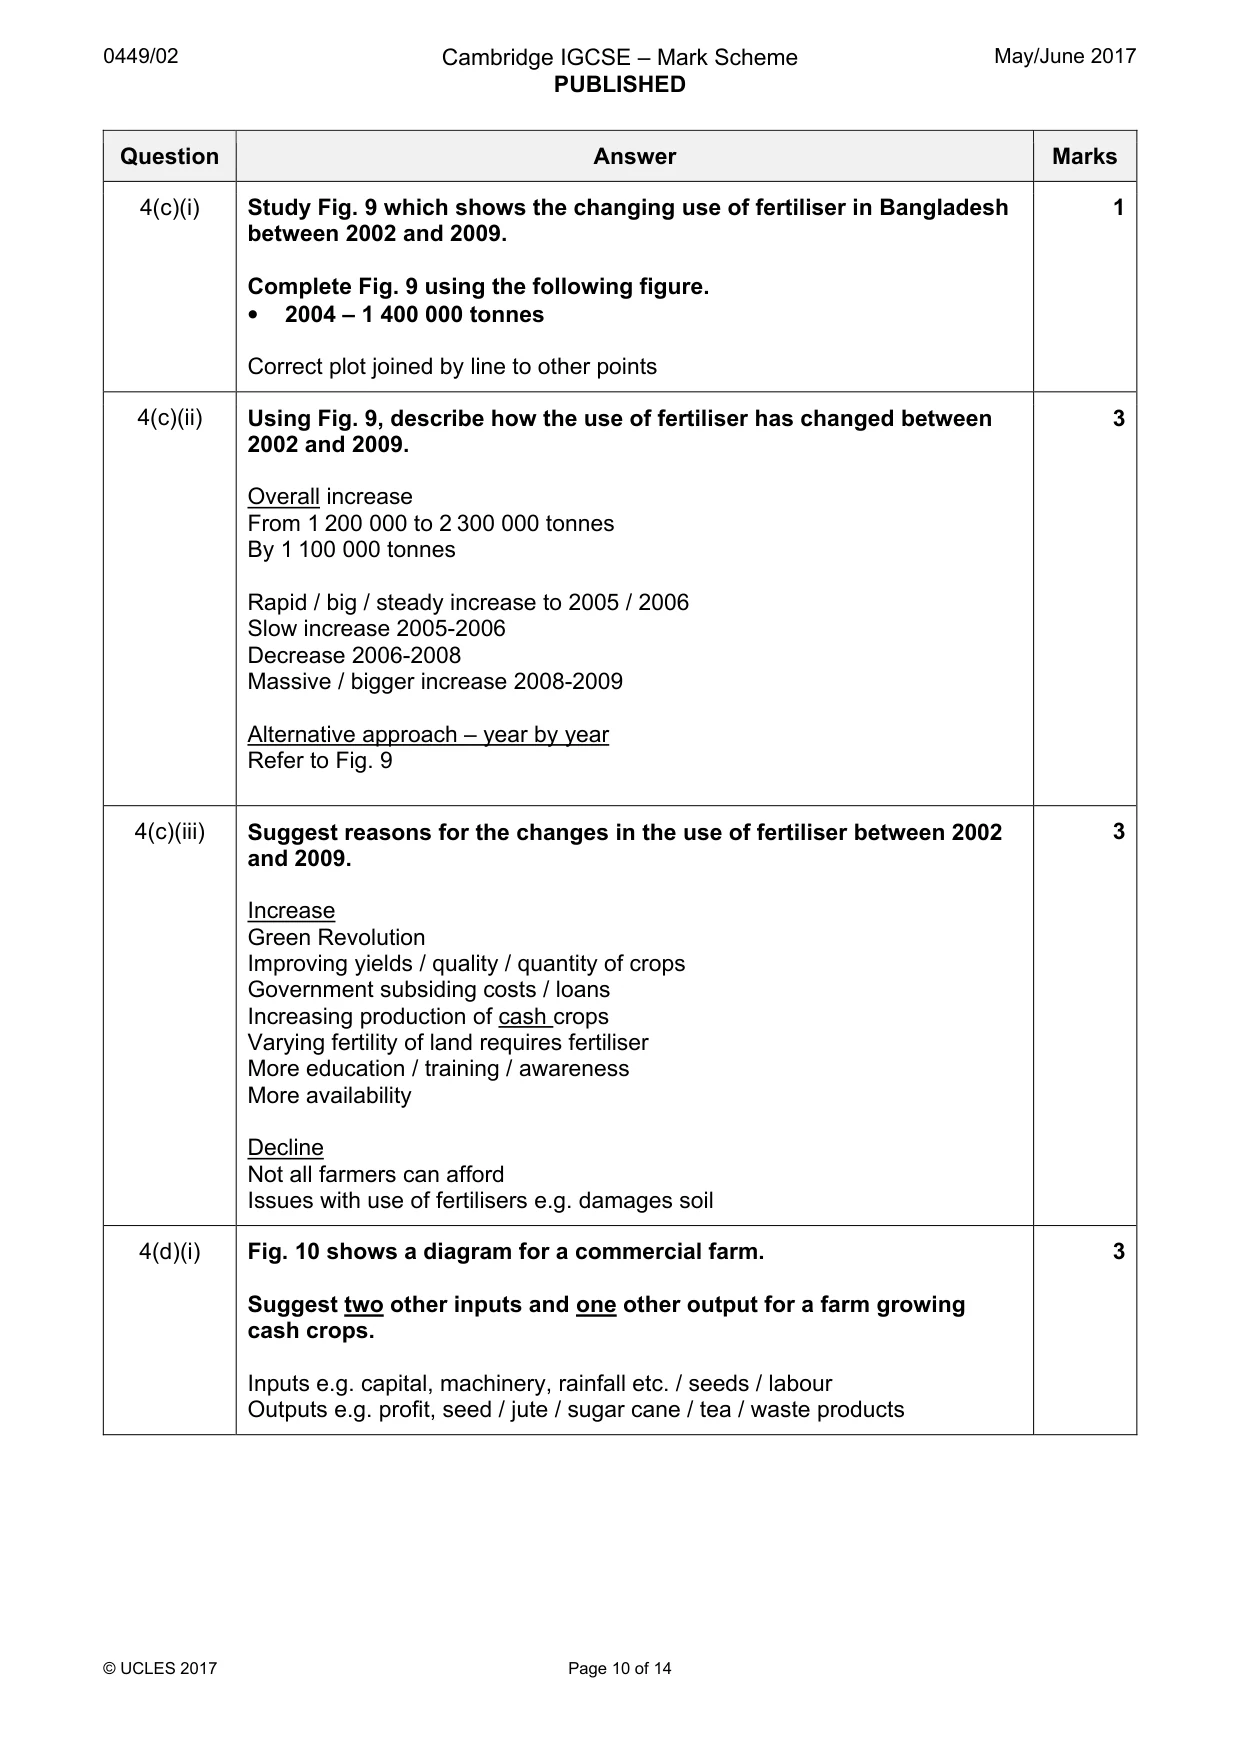
Mark scheme: 4(a) Study Photograph A (Insert) which shows subsistence farming in 4 Bangladesh. Describe the types of food production shown in Photograph A. Description: Traditional Manual labour For consumption / not for sale / no surplus Hoeing Basic tools Flood plain / low lying Shrimp fishing Small scale Types of production: Wheat Rice Oil seed Pulses Fish Shrimp OR Aquaculture Agriculture 4(b) How can the state help to protect its farmers from the effects of 3 cyclones? Prediction / monitoring Better warning system Evacuation Cyclone shelters Sluice gates / barrages / dams Better drainage systems / flood protection measures Construction of stronger housing Planting trees along coast / shelter belts Encourage flood resistant crops 4(c)(i) Study Fig. 9 which shows the changing use of fertiliser in Bangladesh 1 between 2002 and 2009. Complete Fig. 9 using the following figure. • 2004 – 1 400 000 tonnes Correct plot joined by line to other points 4(c)(ii) Using Fig. 9, describe how the use of fertiliser has changed between 3 2002 and 2009. Overall increase From 1 200 000 to 2 300 000 tonnes By 1 100 000 tonnes Rapid / big / steady increase to 2005 / 2006 Slow increase 2005-2006 Decrease 2006-2008 Massive / bigger increase 2008-2009 Alternative approach – year by year Refer to Fig. 9 4(c)(iii) Suggest reasons for the changes in the use of fertiliser between 2002 3 and 2009. Increase Green Revolution Improving yields / quality / quantity of crops Government subsiding costs / loans Increasing production of cash crops Varying fertility of land requires fertiliser More education / training / awareness More availability Decline Not all farmers can afford Issues with use of fertilisers e.g. damages soil 4(d)(i) Fig. 10 shows a diagram for a commercial farm. 3 Suggest two other inputs and one other output for a farm growing cash crops. Inputs e.g. capital, machinery, rainfall etc. / seeds / labour Outputs e.g. profit, seed / jute / sugar cane / tea / waste products 4(d)(ii) Why is it difficult to increase the production of cash crops? 3 Lack of capital / problems getting finance / need large investment Lack of suitable land / need large land Lack of good transport links Price variation / decrease demand for jute Lack of machinery Lack of education / training Increasing demand for food crops Land ownership 4(e)(i) Study the two statements below. 1 A ‘The Green Revolution is key to Bangladesh increasing its food supply.’ B ‘The Green Revolution does not benefit all farmers.’ Give one piece of evidence which supports statement A. Higher yields New varieties of seed / use of HYVs / GM crops Examples of HYV varieties e.g. Irri 6 Use of pesticides Consolidation of land Improved irrigation 4(e)(ii) Give one piece of evidence which supports statement B. 1 Not all farmers can afford Can lead to outbreak of pests Kills off natural predators Too much fertiliser can ruin soil quality HYVs extract a lot of nutrients from soil Lack of education and training to use machinery / fertiliser 4(e)(iii) Which statement do you agree with most? Give reasons for your 3 answer. No marks for stating A or B, only for giving reasons Credit reasons for accepting one and rejecting the other Accept answers that give support to both statements Allow points to be developed
Q5 · The population pyramid for Bangladesh in 2015
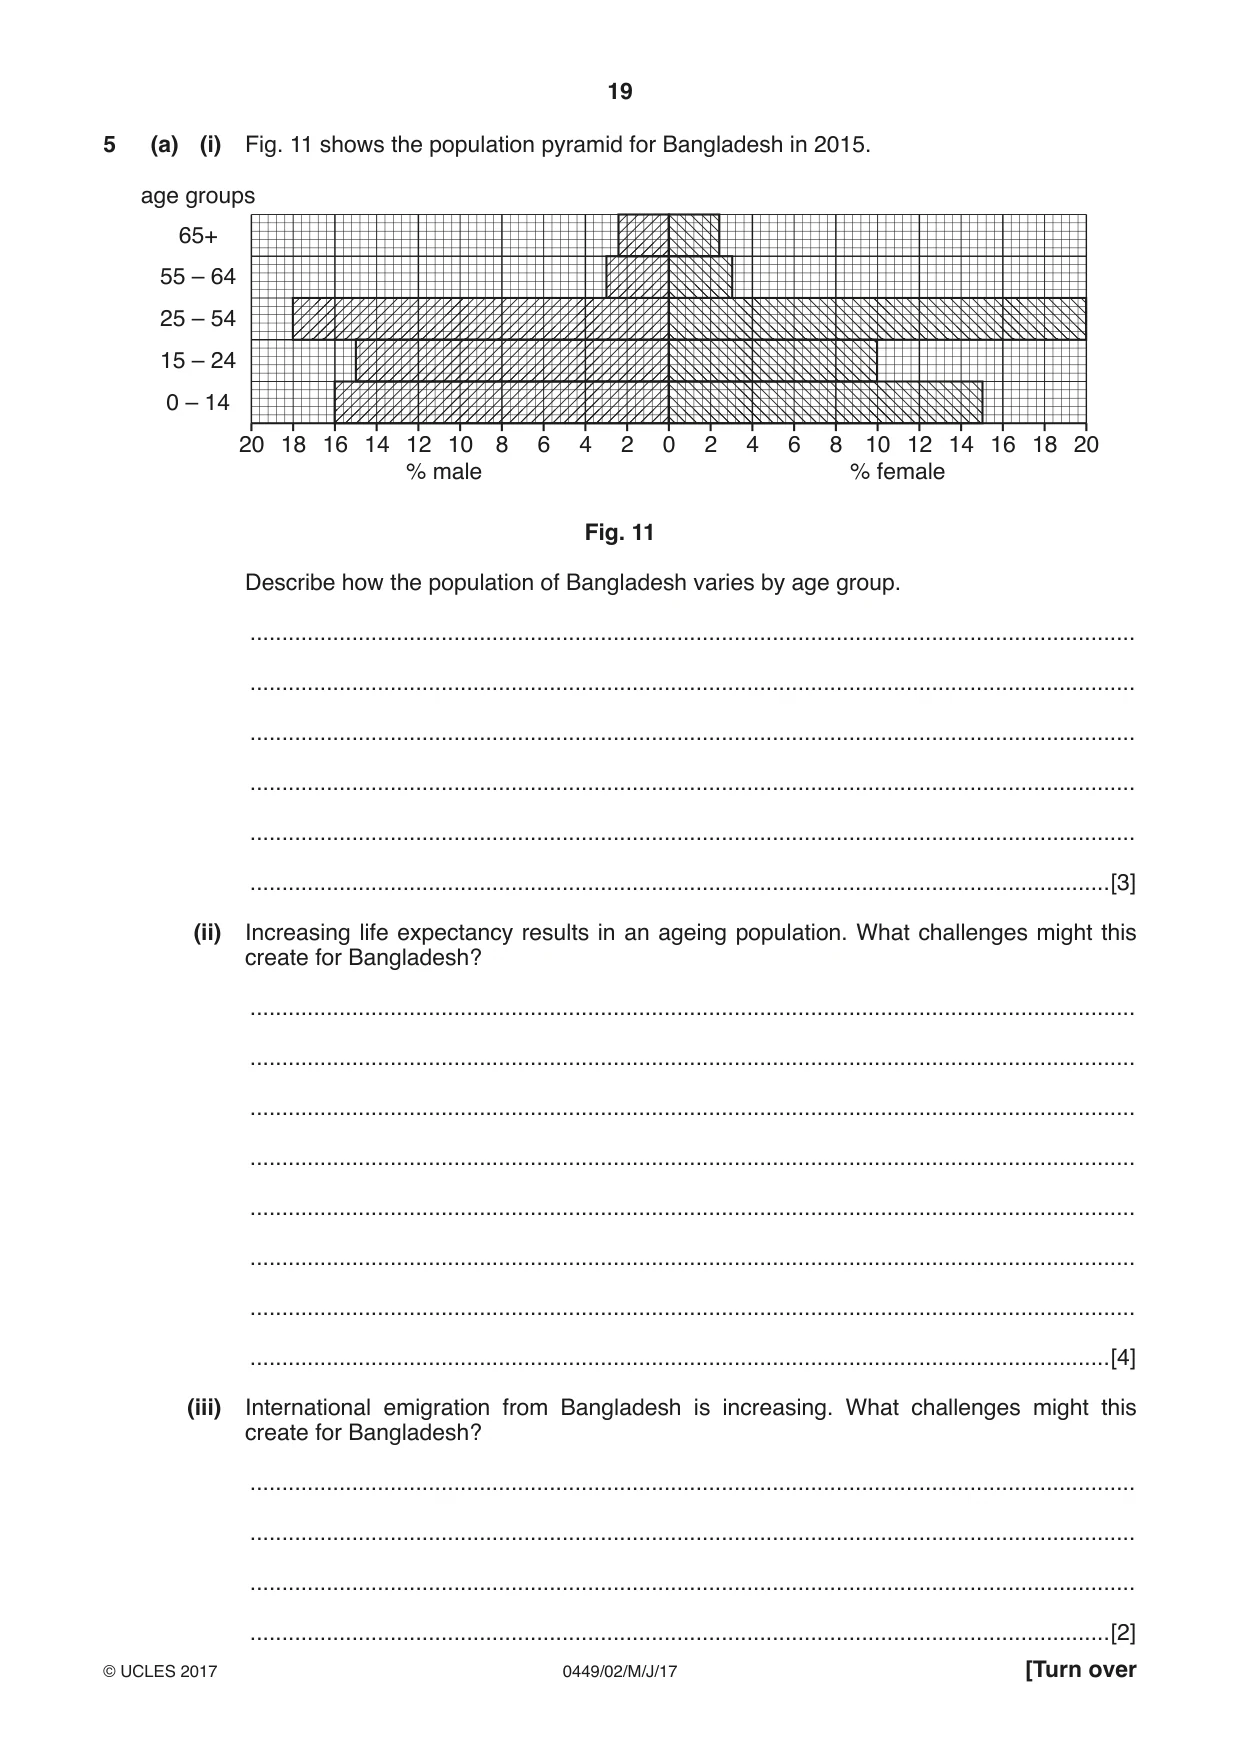
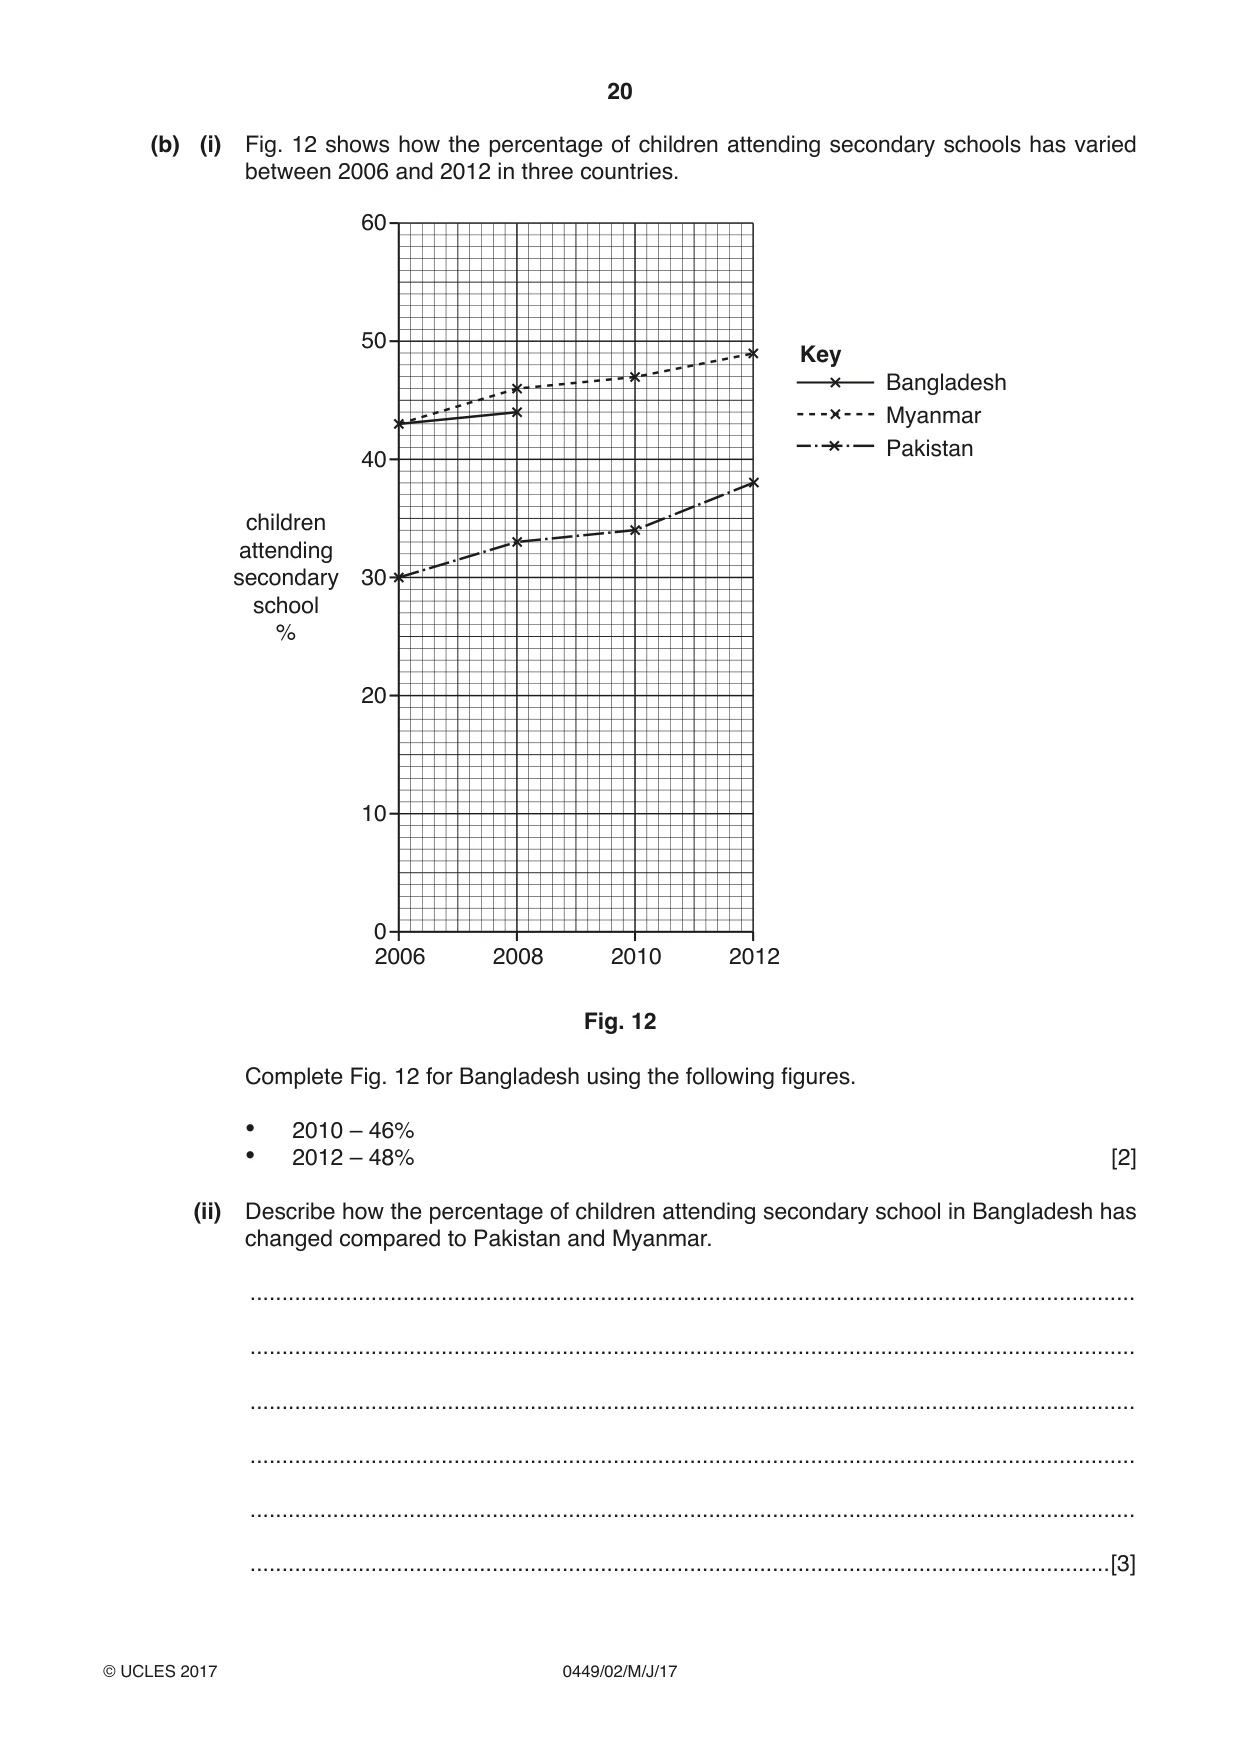
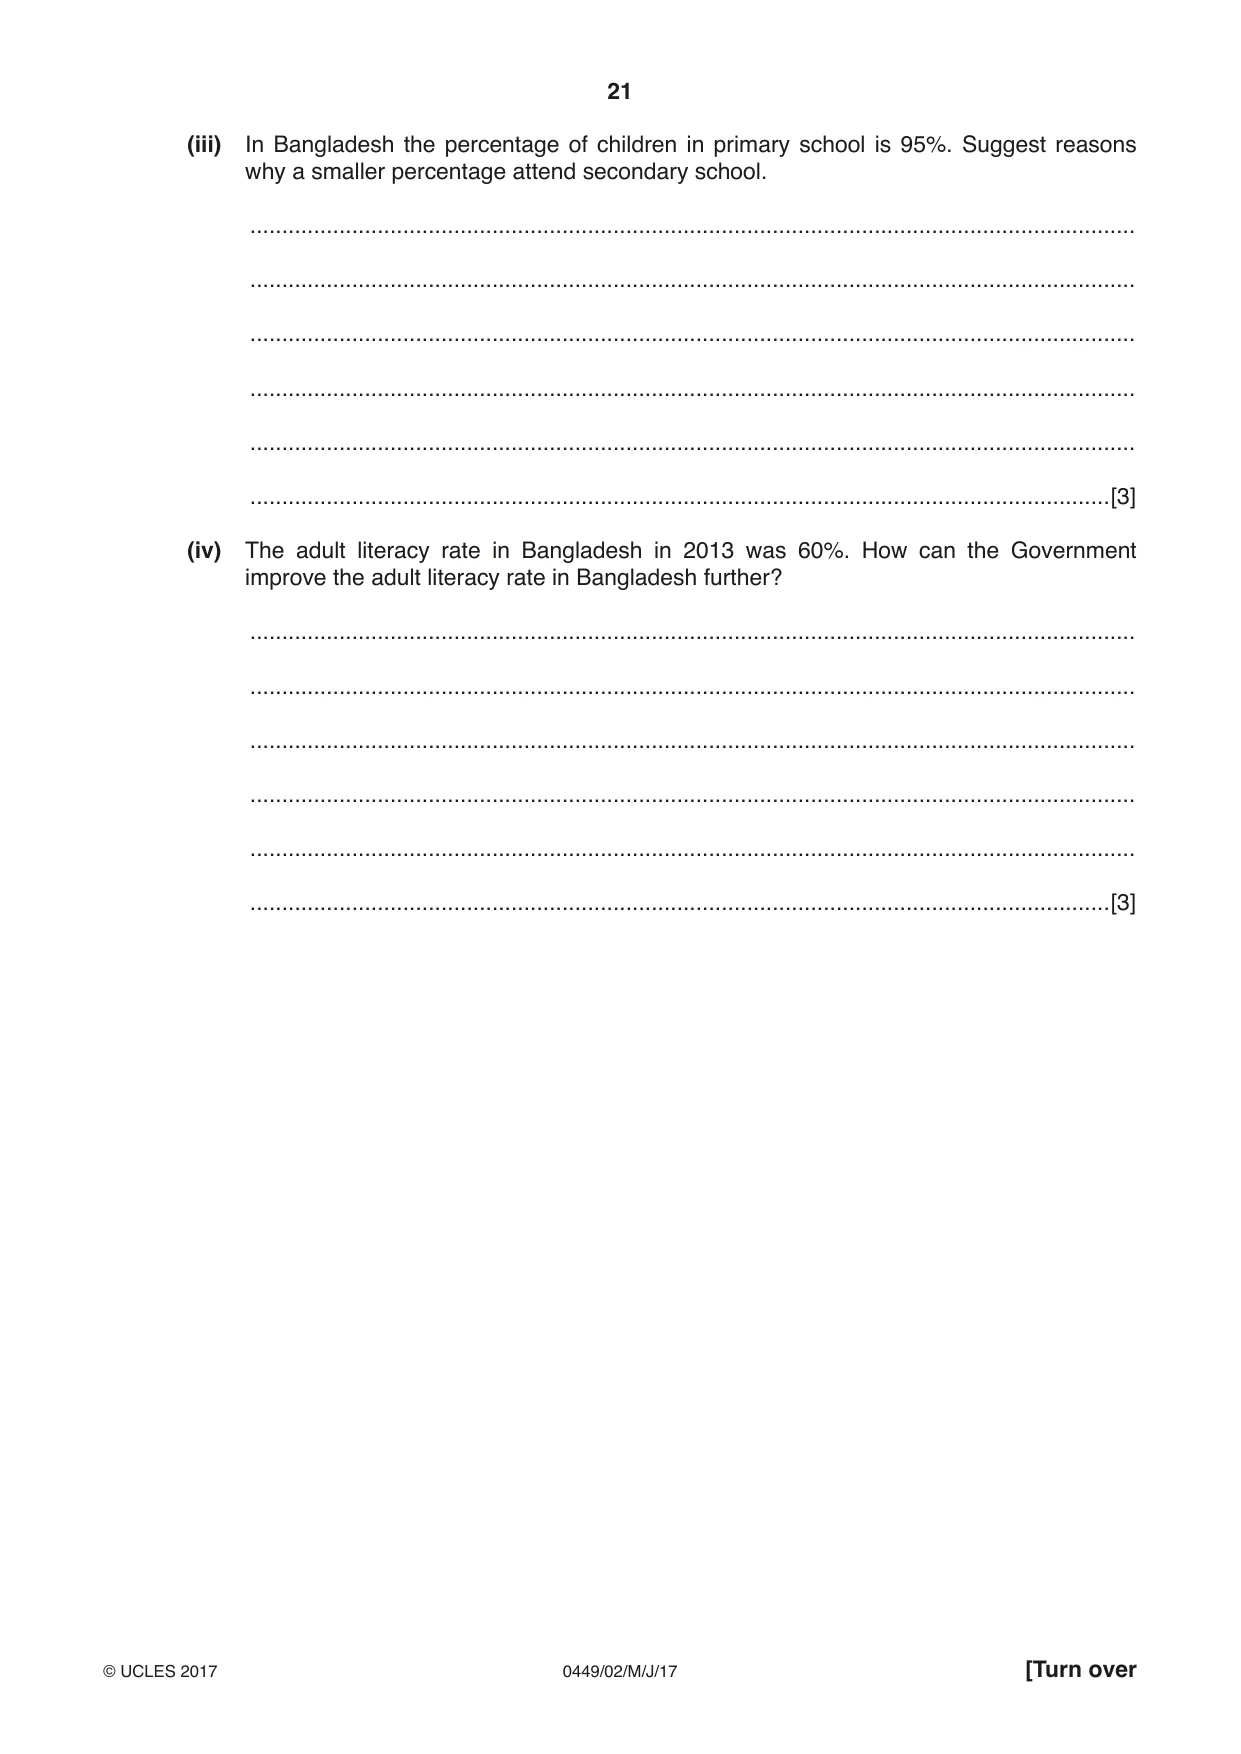
5 (a) (i) Fig. 11 shows the population pyramid for Bangladesh in 2015. age groups 65+ 55 – 64 25 – 54 15 – 24 0 – 14 20 18 16 14 12 10 8 6 4 2 0 2 4 6 8 10 12 14 16 18 20 % male % female Fig. 11 Describe how the population of Bangladesh varies by age group. ........................................................................................................................................... ........................................................................................................................................... ........................................................................................................................................... ........................................................................................................................................... ........................................................................................................................................... .......................................................................................................................................[3] (ii) Increasing life expectancy results in an ageing population. What challenges might this create for Bangladesh? ........................................................................................................................................... ........................................................................................................................................... ........................................................................................................................................... ........................................................................................................................................... ........................................................................................................................................... ........................................................................................................................................... ........................................................................................................................................... .......................................................................................................................................[4] (iii) International emigration from Bangladesh is increasing. What challenges might this create for Bangladesh? ........................................................................................................................................... ........................................................................................................................................... ........................................................................................................................................... .......................................................................................................................................[2] (b) (i) Fig. 12 shows how the percentage of children attending secondary schools has varied between 2006 and 2012 in three countries. 60 50 Key Bangladesh Myanmar Pakistan 40 children attending secondary 30 school % 20 10 0 2006 2008 2010 2012 Fig. 12 Complete Fig. 12 for Bangladesh using the following figures. • 2010 – 46% • 2012 – 48% [2] (ii) Describe how the percentage of children attending secondary school in Bangladesh has changed compared to Pakistan and Myanmar. ........................................................................................................................................... ........................................................................................................................................... ........................................................................................................................................... ........................................................................................................................................... ........................................................................................................................................... .......................................................................................................................................[3] (iii) In Bangladesh the percentage of children in primary school is 95%. Suggest reasons why a smaller percentage attend secondary school. ........................................................................................................................................... ........................................................................................................................................... ........................................................................................................................................... ........................................................................................................................................... ........................................................................................................................................... .......................................................................................................................................[3] (iv) The adult literacy rate in Bangladesh in 2013 was 60%. How can the Government improve the adult literacy rate in Bangladesh further? ........................................................................................................................................... ........................................................................................................................................... ........................................................................................................................................... ........................................................................................................................................... ........................................................................................................................................... .......................................................................................................................................[3]
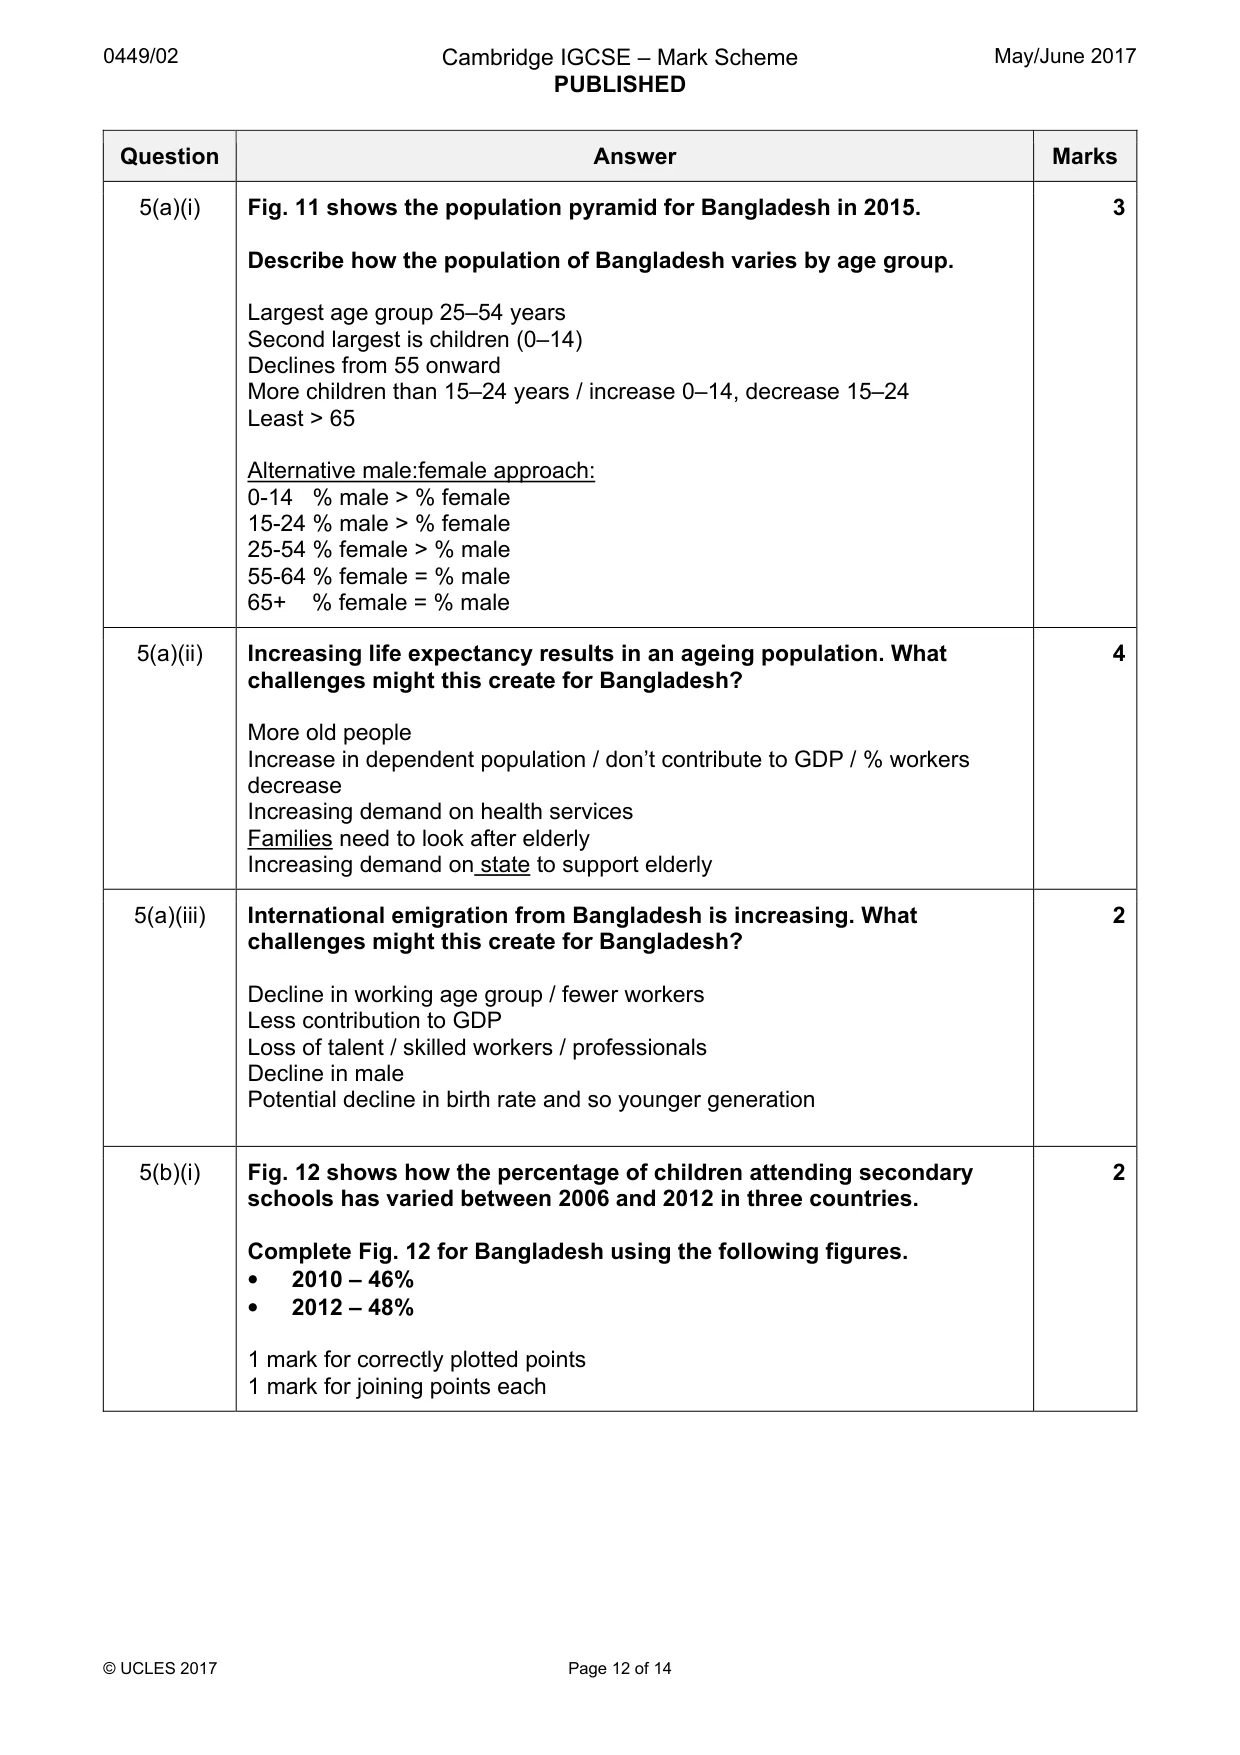
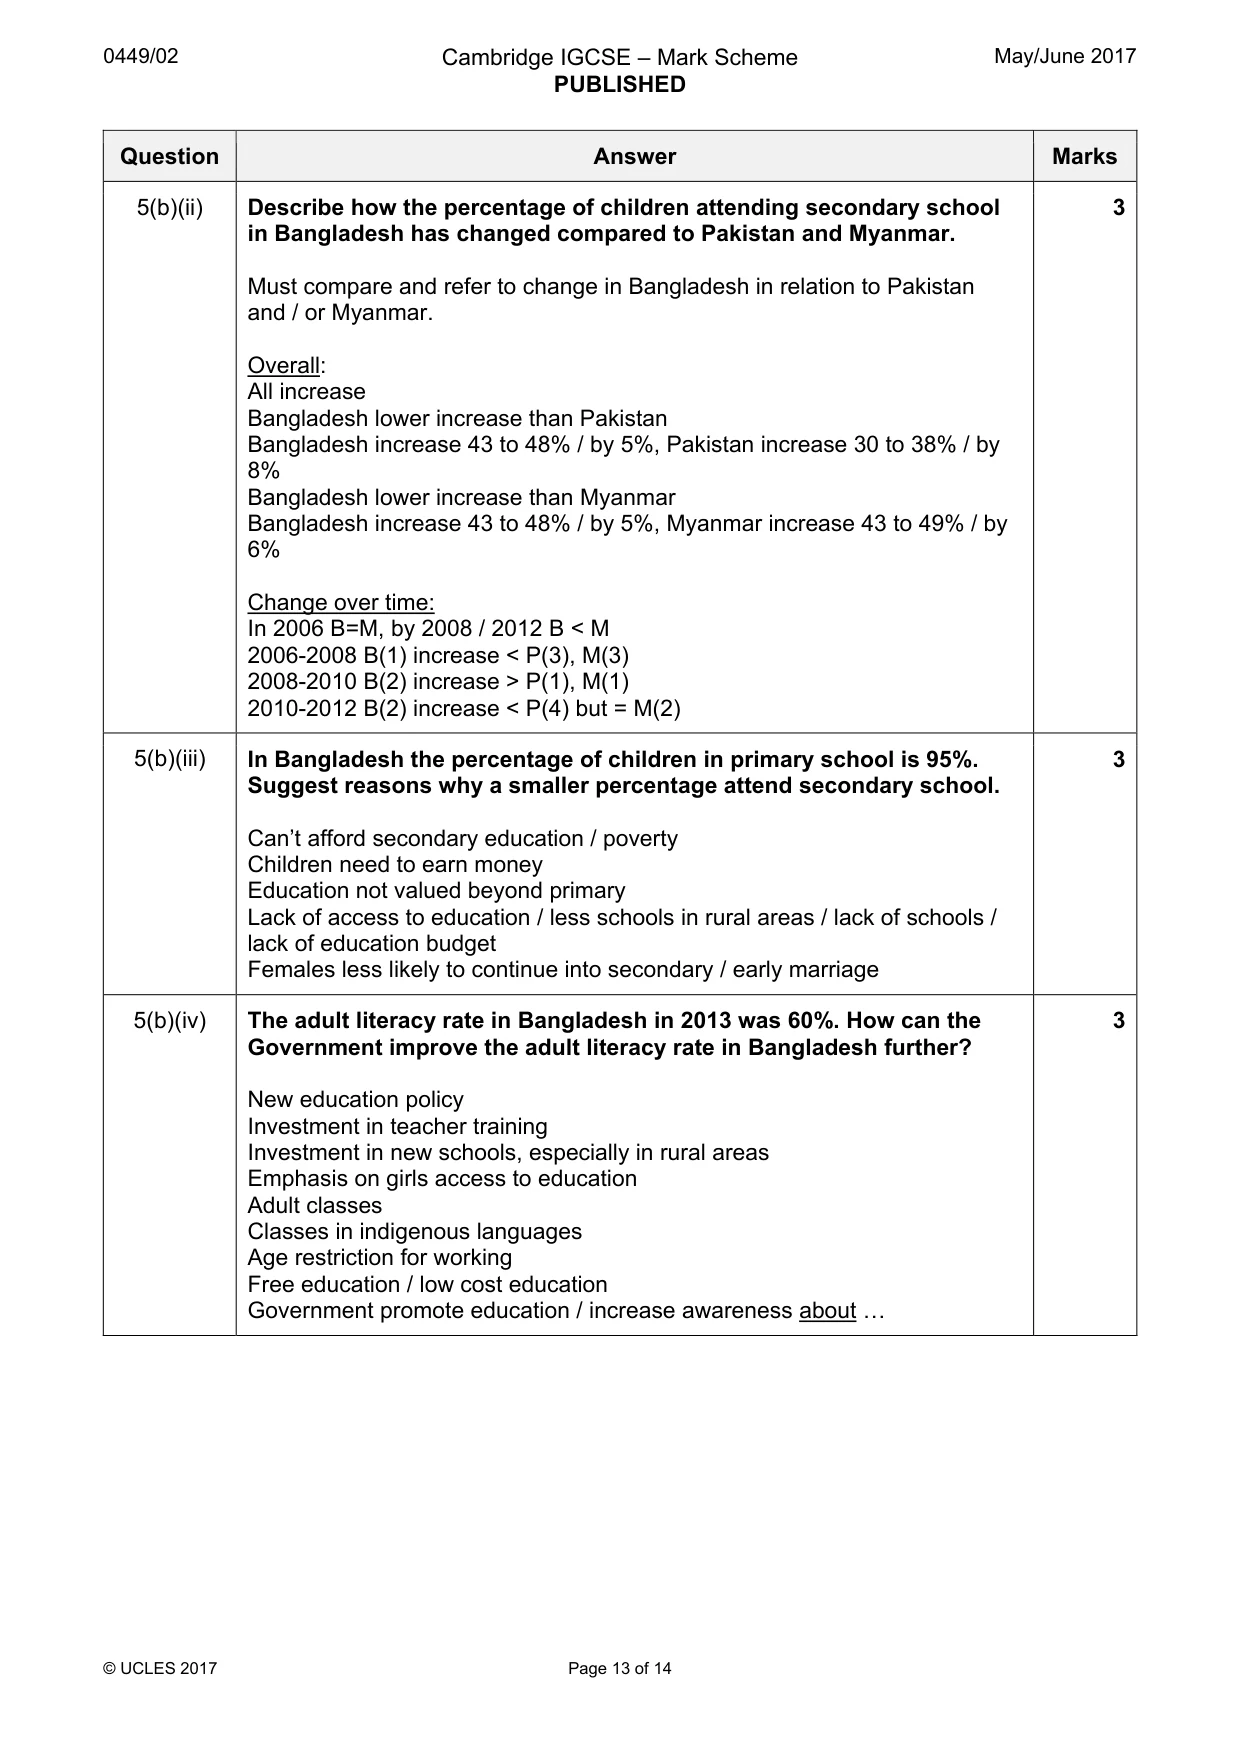
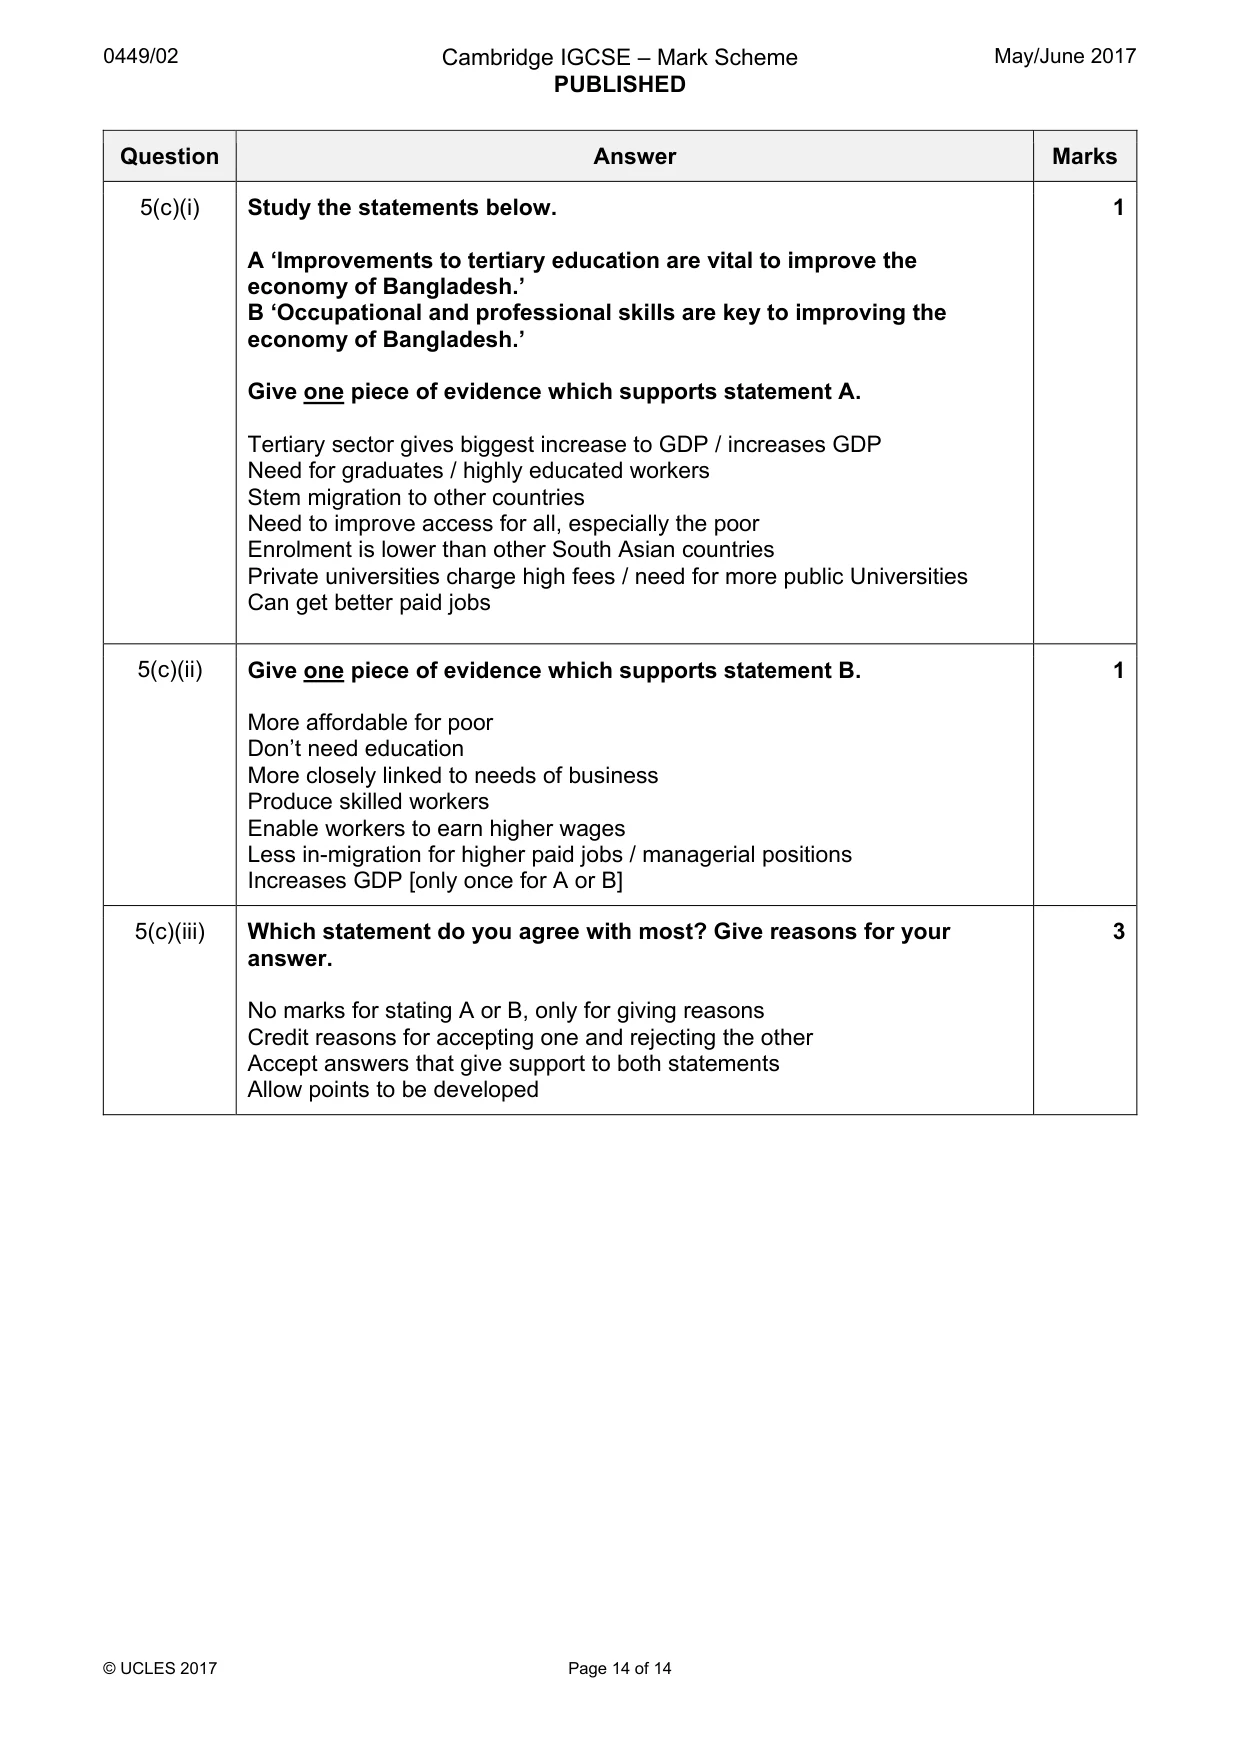
Mark scheme: 5(a)(i) Fig. 11 shows the population pyramid for Bangladesh in 2015. 3 Describe how the population of Bangladesh varies by age group. Largest age group 25–54 years Second largest is children (0–14) Declines from 55 onward More children than 15–24 years / increase 0–14, decrease 15–24 Least > 65 Alternative male:female approach: 0-14 % male > % female 15-24 % male > % female 25-54 % female > % male 55-64 % female = % male 65+ % female = % male 5(a)(ii) Increasing life expectancy results in an ageing population. What 4 challenges might this create for Bangladesh? More old people Increase in dependent population / don’t contribute to GDP / % workers decrease Increasing demand on health services Families need to look after elderly Increasing demand on state to support elderly 5(a)(iii) International emigration from Bangladesh is increasing. What 2 challenges might this create for Bangladesh? Decline in working age group / fewer workers Less contribution to GDP Loss of talent / skilled workers / professionals Decline in male Potential decline in birth rate and so younger generation 5(b)(i) Fig. 12 shows how the percentage of children attending secondary 2 schools has varied between 2006 and 2012 in three countries. Complete Fig. 12 for Bangladesh using the following figures. • 2010 – 46% • 2012 – 48% 1 mark for correctly plotted points 1 mark for joining points each 5(b)(ii) Describe how the percentage of children attending secondary school 3 in Bangladesh has changed compared to Pakistan and Myanmar. Must compare and refer to change in Bangladesh in relation to Pakistan and / or Myanmar. Overall: All increase Bangladesh lower increase than Pakistan Bangladesh increase 43 to 48% / by 5%, Pakistan increase 30 to 38% / by 8% Bangladesh lower increase than Myanmar Bangladesh increase 43 to 48% / by 5%, Myanmar increase 43 to 49% / by 6% Change over time: In 2006 B=M, by 2008 / 2012 B < M 2006-2008 B(1) increase < P(3), M(3) 2008-2010 B(2) increase > P(1), M(1) 2010-2012 B(2) increase < P(4) but = M(2) 5(b)(iii) In Bangladesh the percentage of children in primary school is 95%. 3 Suggest reasons why a smaller percentage attend secondary school. Can’t afford secondary education / poverty Children need to earn money Education not valued beyond primary Lack of access to education / less schools in rural areas / lack of schools / lack of education budget Females less likely to continue into secondary / early marriage 5(b)(iv) The adult literacy rate in Bangladesh in 2013 was 60%. How can the 3 Government improve the adult literacy rate in Bangladesh further? New education policy Investment in teacher training Investment in new schools, especially in rural areas Emphasis on girls access to education Adult classes Classes in indigenous languages Age restriction for working Free education / low cost education Government promote education / increase awareness about « 5(c)(i) Study the statements below. 1 A ‘Improvements to tertiary education are vital to improve the economy of Bangladesh.’ B ‘Occupational and professional skills are key to improving the economy of Bangladesh.’ Give one piece of evidence which supports statement A. Tertiary sector gives biggest increase to GDP / increases GDP Need for graduates / highly educated workers Stem migration to other countries Need to improve access for all, especially the poor Enrolment is lower than other South Asian countries Private universities charge high fees / need for more public Universities Can get better paid jobs 5(c)(ii) Give one piece of evidence which supports statement B. 1 More affordable for poor Don’t need education More closely linked to needs of business Produce skilled workers Enable workers to earn higher wages Less in-migration for higher paid jobs / managerial positions Increases GDP [only once for A or B] 5(c)(iii) Which statement do you agree with most? Give reasons for your 3 answer. No marks for stating A or B, only for giving reasons Credit reasons for accepting one and rejecting the other Accept answers that give support to both statements Allow points to be developed
What you needed in this session
Cambridge’s own grade thresholds for 2017 May/June, Paper 2 · Variant 1. A higher threshold means an easier paper — the bar moves with how the cohort did.