Cambridge IGCSE Bangladesh Studies 0449 — 2014 May/June Paper 2 · Variant 1
0449/21/M/J/14 · 5 questions · 75 marks · ≈84 min
The question paper and its mark scheme, free to read here and free to download. This is Cambridge’s own paper, exactly as it was sat.
Question paper24 pages









Mark scheme11 pages
Answers below. Sit the paper first if you are practising.
Questions as text
Q1 · The rivers of Bangladesh change course often
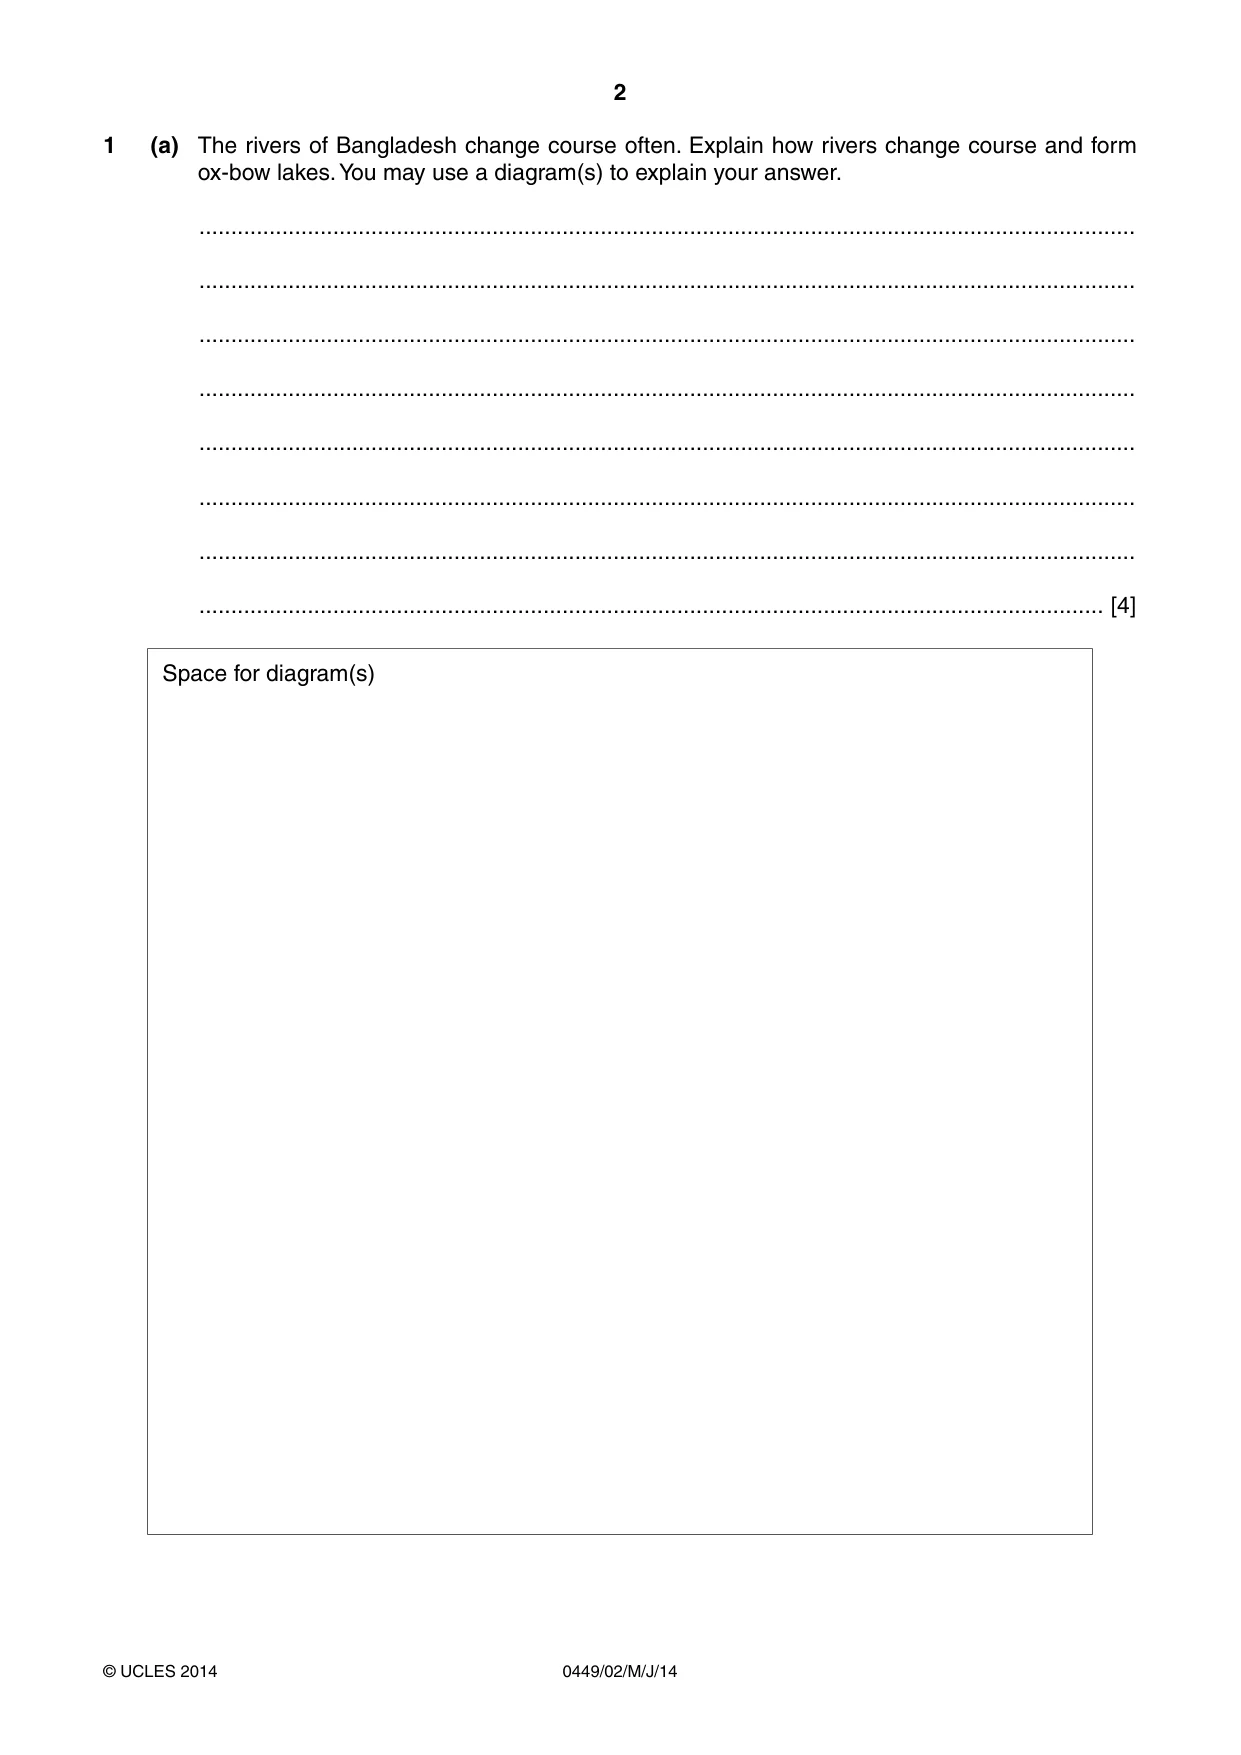
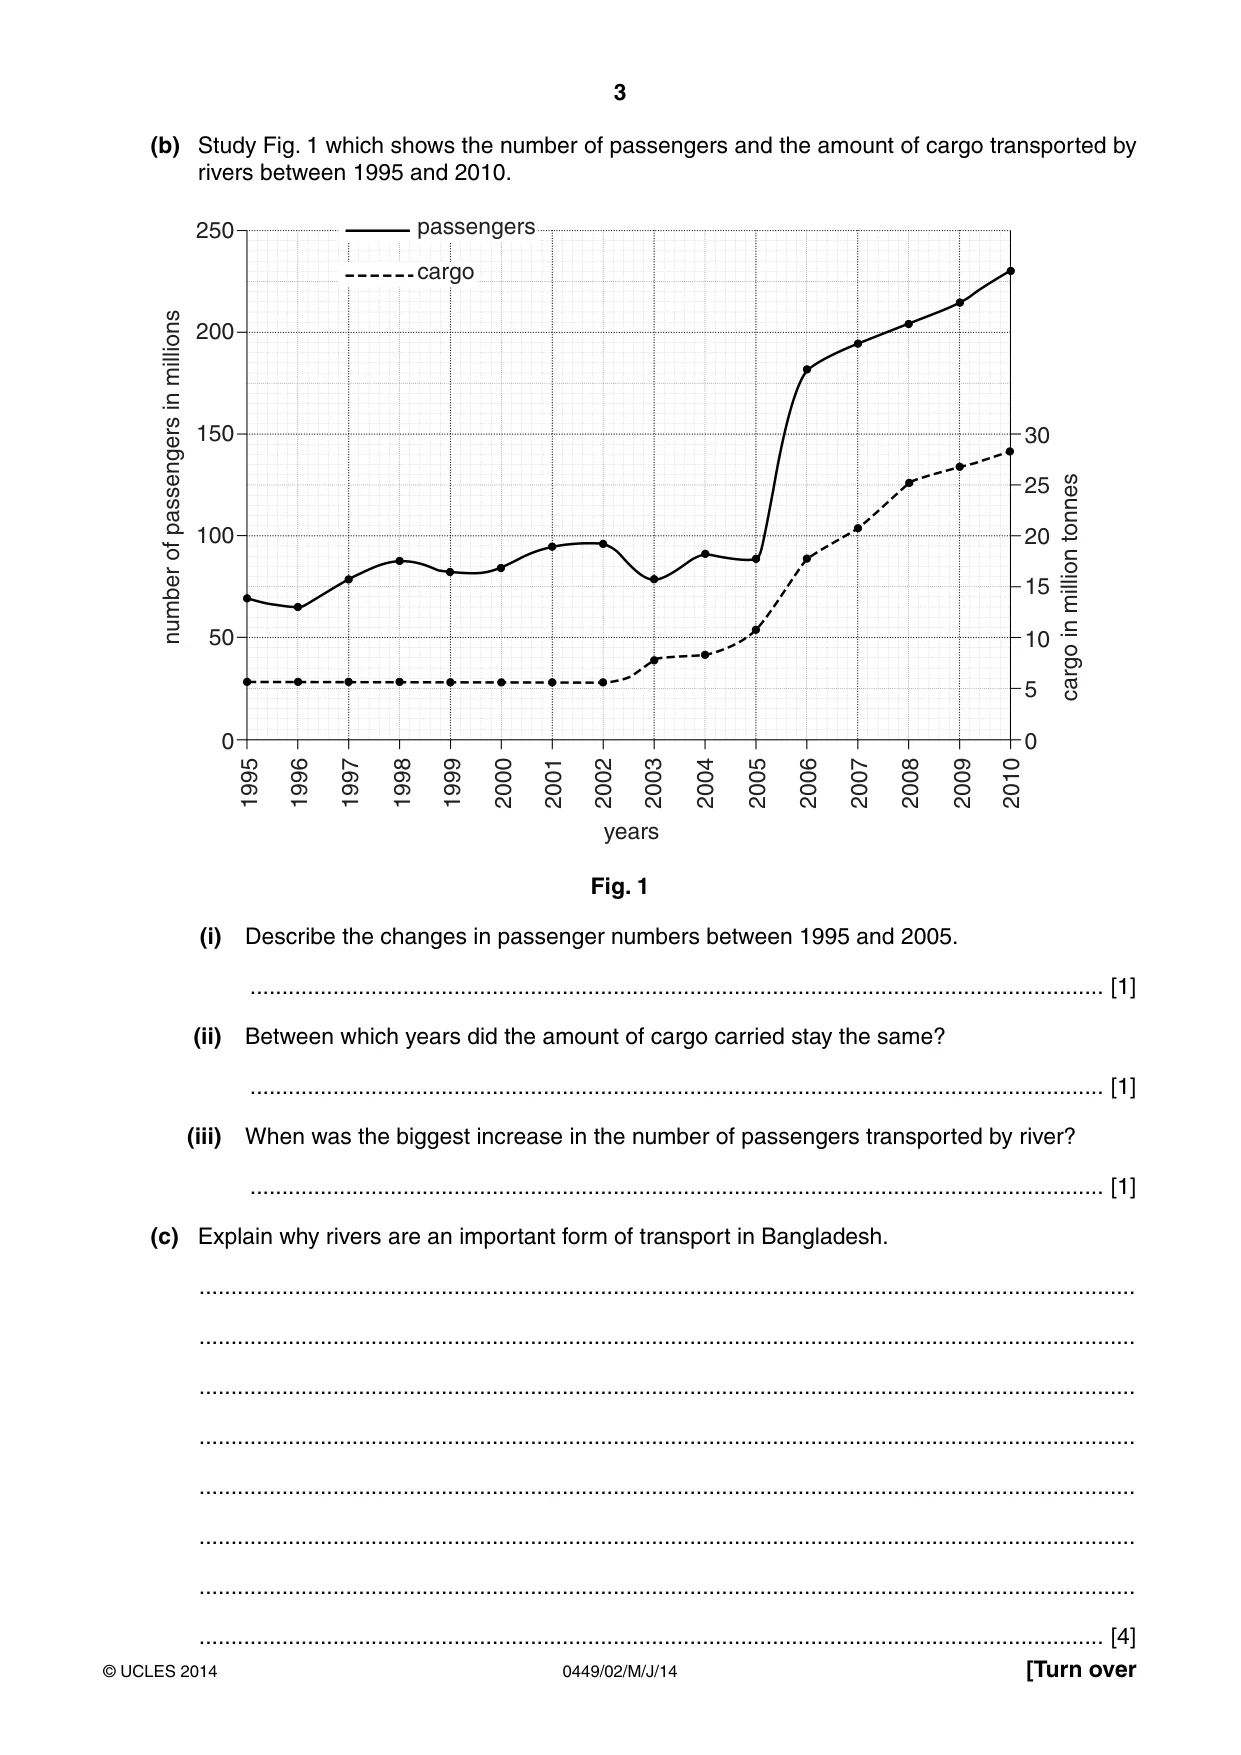
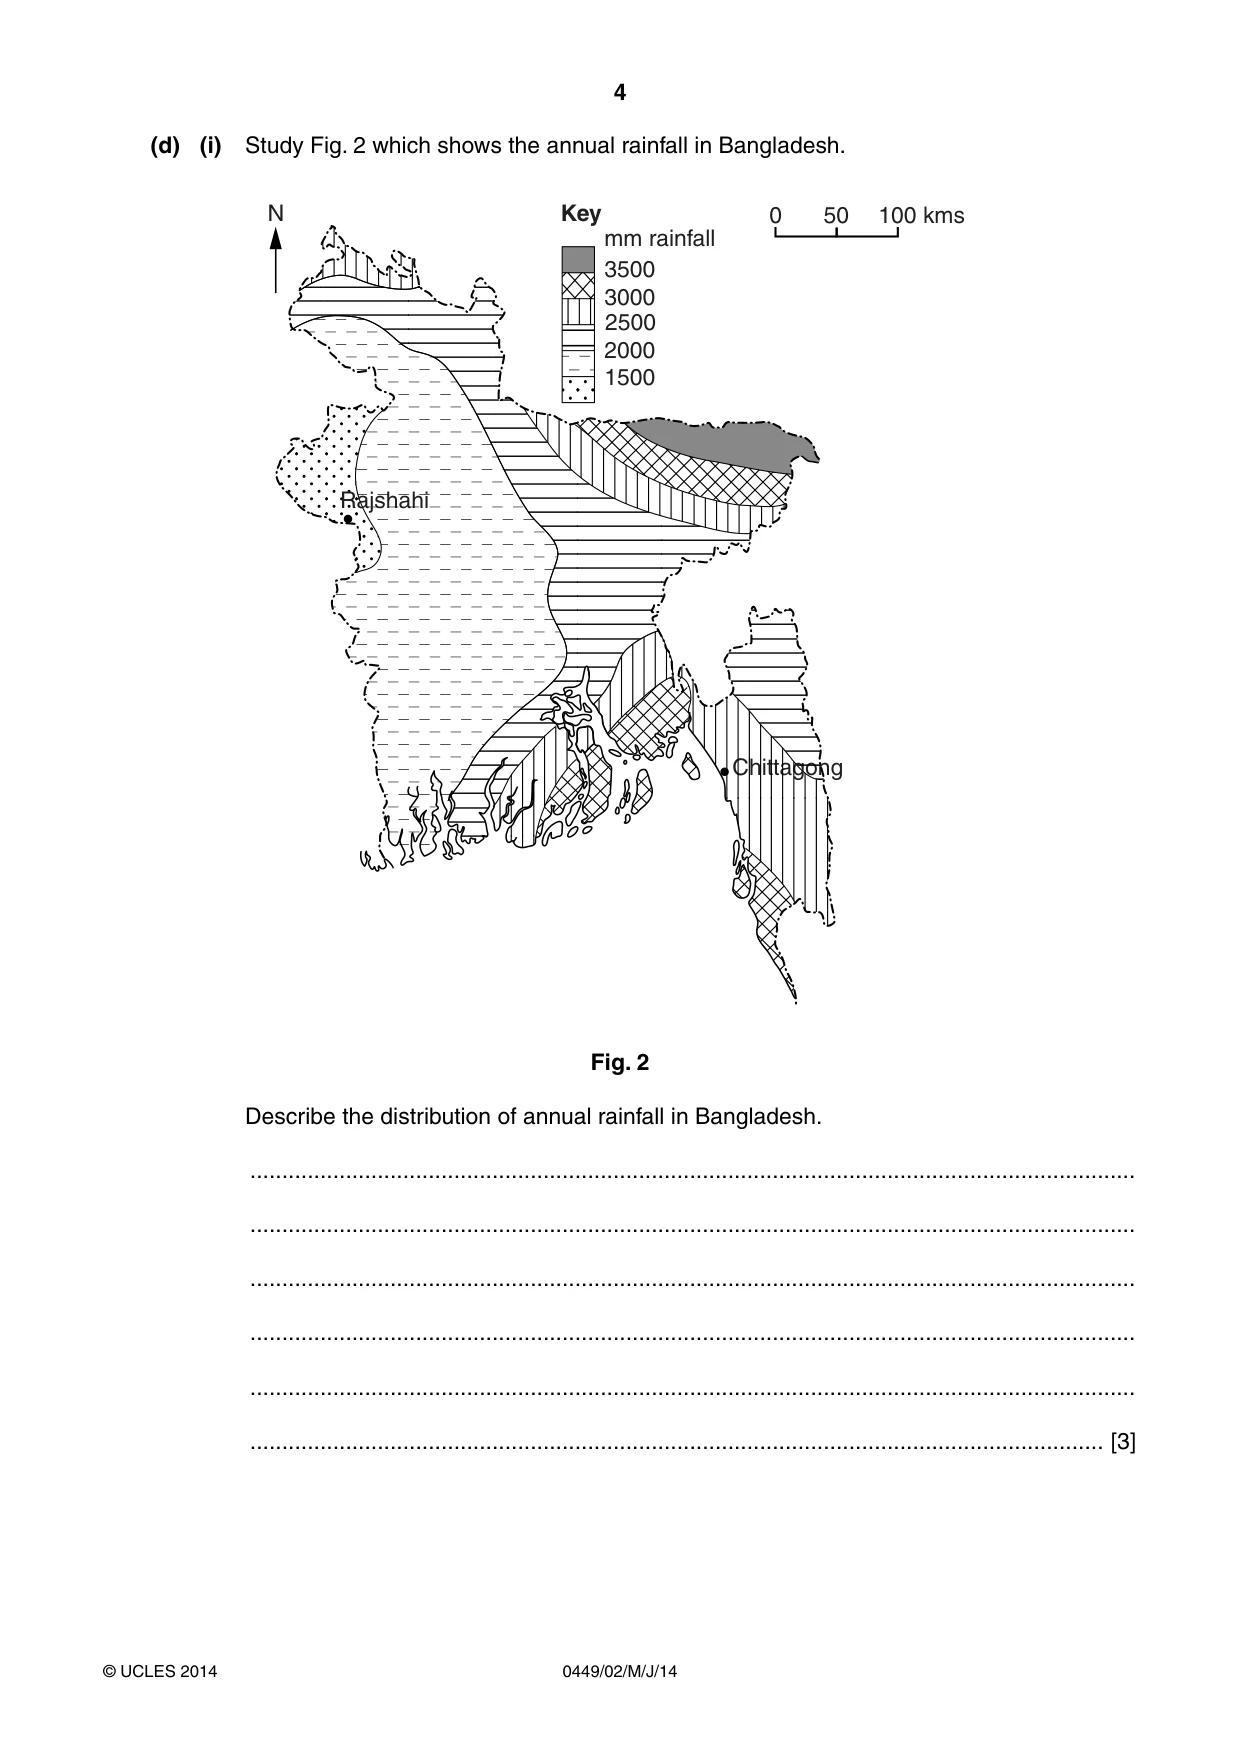
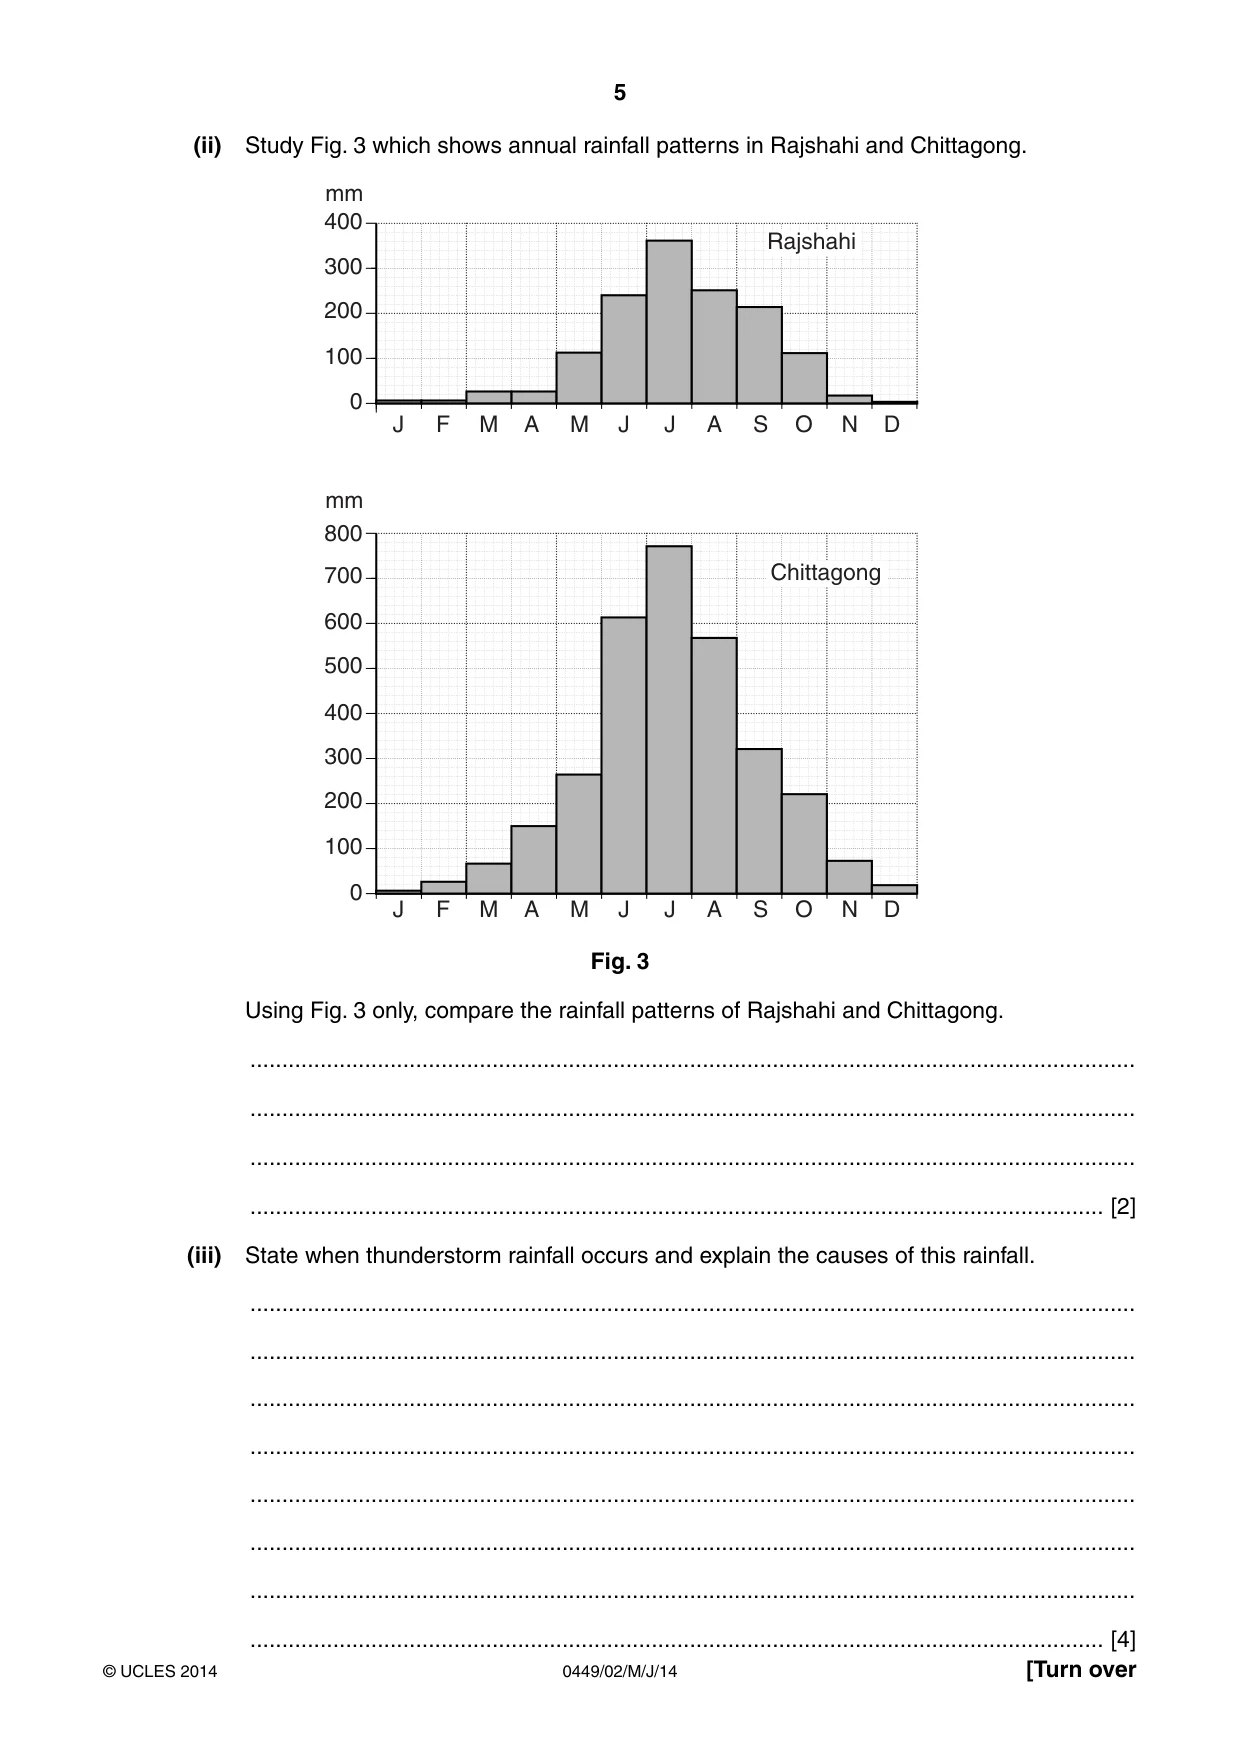
1 (a) The rivers of Bangladesh change course often. Explain how rivers change course and form ox-bow lakes. You may use a diagram(s) to explain your answer. ................................................................................................................................................... ................................................................................................................................................... ................................................................................................................................................... ................................................................................................................................................... ................................................................................................................................................... ................................................................................................................................................... ................................................................................................................................................... .............................................................................................................................................. [4] Space for diagram(s) (b) Study Fig. 1 which shows the number of passengers and the amount of cargo transported by rivers between 1995 and 2010. 250 passengers cargo 200 millions in 150 30 25 passengers tonnes 100 20 of 15 million in number 50 10 5 cargo 0 0 1995 1996 1997 1998 1999 2000 2001 2002 2003 2004 2005 2006 2007 2008 2009 2010 years Fig. 1 (i) Describe the changes in passenger numbers between 1995 and 2005. ...................................................................................................................................... [1] (ii) Between which years did the amount of cargo carried stay the same? ...................................................................................................................................... [1] (iii) When was the biggest increase in the number of passengers transported by river? ...................................................................................................................................... [1] (c) Explain why rivers are an important form of transport in Bangladesh. ................................................................................................................................................... ................................................................................................................................................... ................................................................................................................................................... ................................................................................................................................................... ................................................................................................................................................... ................................................................................................................................................... ................................................................................................................................................... .............................................................................................................................................. [4] (d) (i) Study Fig. 2 which shows the annual rainfall in Bangladesh. N Key 0 50 100 kms mm rainfall 3500 3000 2500 2000 1500 Rajshahi Chittagong Fig. 2 Describe the distribution of annual rainfall in Bangladesh. ........................................................................................................................................... ........................................................................................................................................... ........................................................................................................................................... ........................................................................................................................................... ........................................................................................................................................... ...................................................................................................................................... [3] (ii) Study Fig. 3 which shows annual rainfall patterns in Rajshahi and Chittagong. mm 400 Rajshahi 300 200 100 0 J F M A M J J A S O N D mm 800 700 Chittagong 600 500 400 300 200 100 0 J F M A M J J A S O N D Fig. 3 Using Fig. 3 only, compare the rainfall patterns of Rajshahi and Chittagong. ........................................................................................................................................... ........................................................................................................................................... ........................................................................................................................................... ...................................................................................................................................... [2] (iii) State when thunderstorm rainfall occurs and explain the causes of this rainfall. ........................................................................................................................................... ........................................................................................................................................... ........................................................................................................................................... ........................................................................................................................................... ........................................................................................................................................... ........................................................................................................................................... ........................................................................................................................................... ...................................................................................................................................... [4] (e) Study the two statements below. A ‘Hydro-electric power could greatly improve Bangladesh’s electricity supply.’ B ‘The scope for increasing the generation of hydro-electric power is very limited in Bangladesh.’ (i) Give one piece of evidence which supports statement A. ........................................................................................................................................... ...................................................................................................................................... [1] (ii) Give one piece of evidence which supports statement B. ........................................................................................................................................... ...................................................................................................................................... [1] (iii) Which statement do you agree with the most? Give reasons for your answer. ........................................................................................................................................... ........................................................................................................................................... ........................................................................................................................................... ........................................................................................................................................... ........................................................................................................................................... ...................................................................................................................................... [3] [Total: 25 marks]
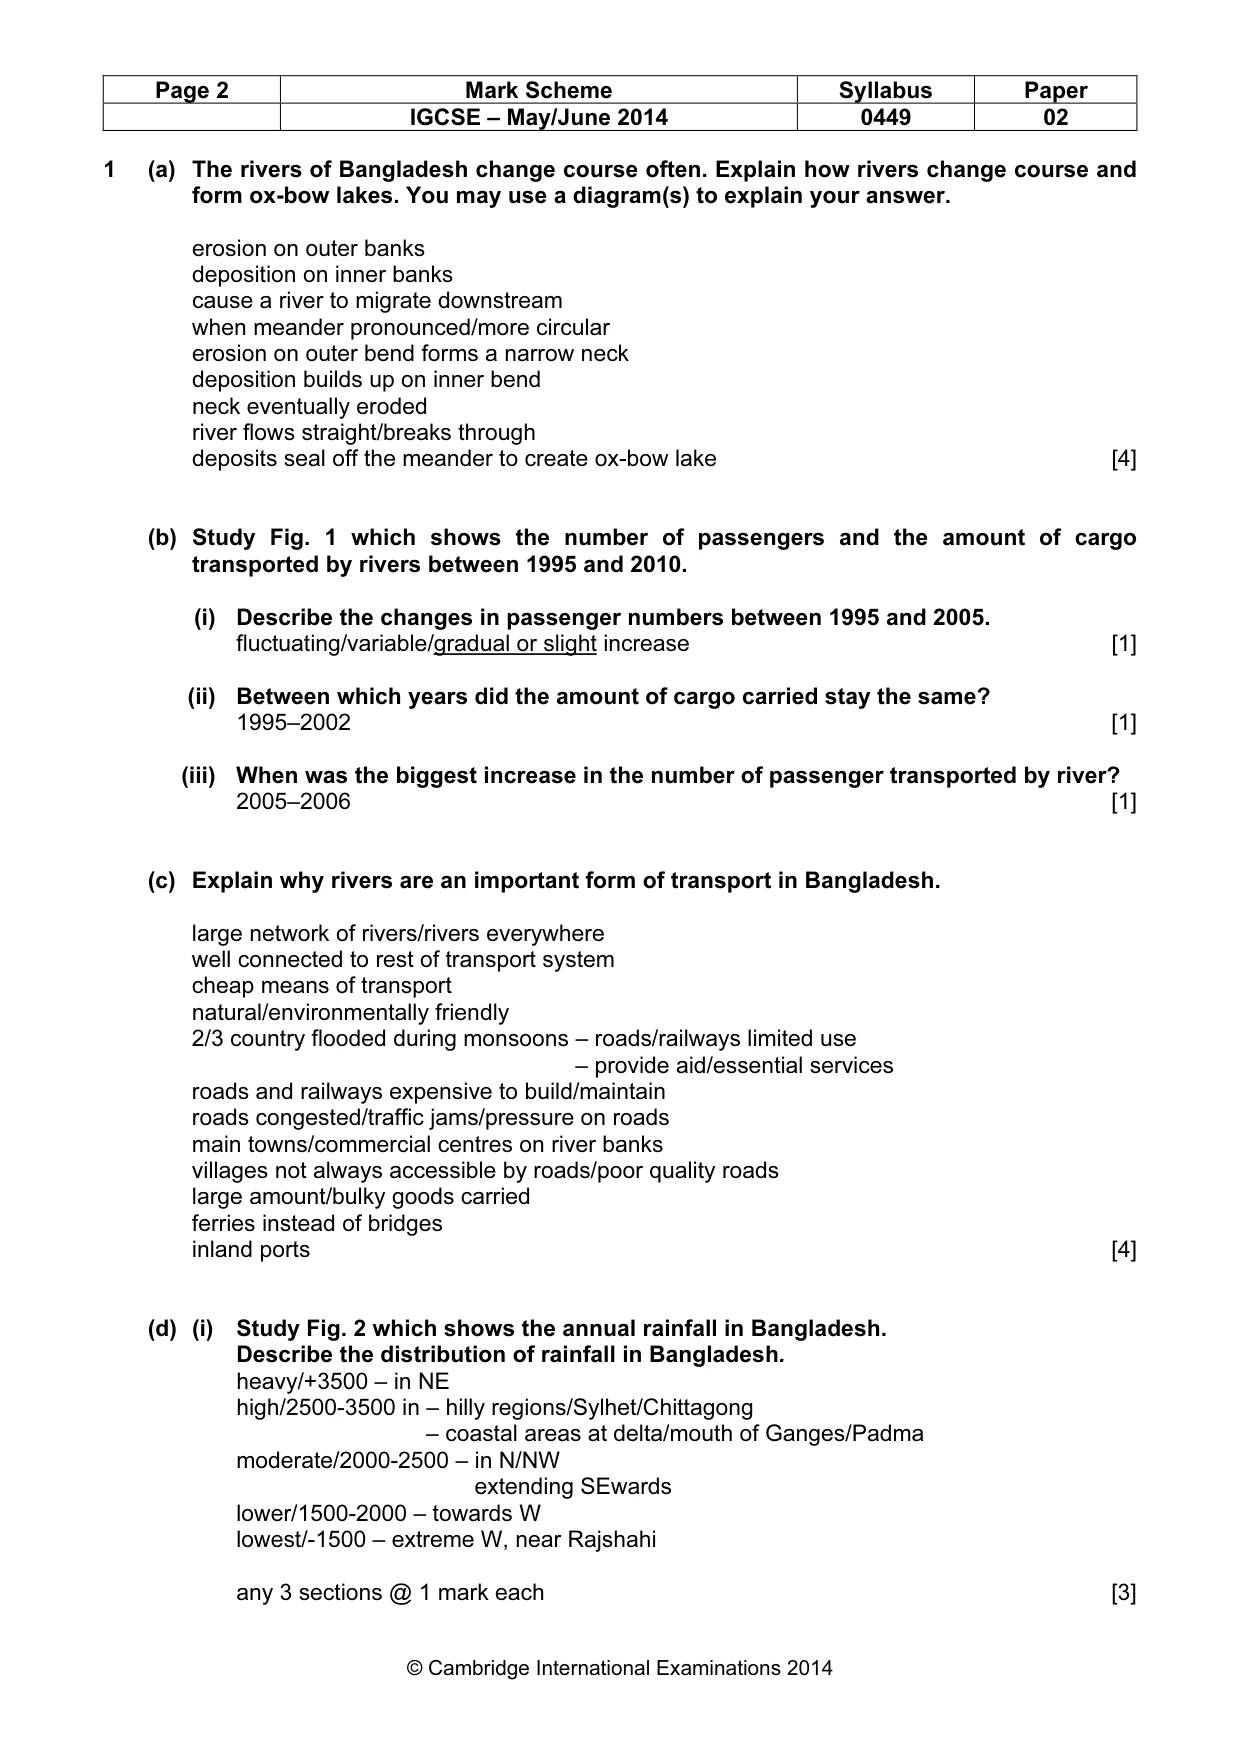
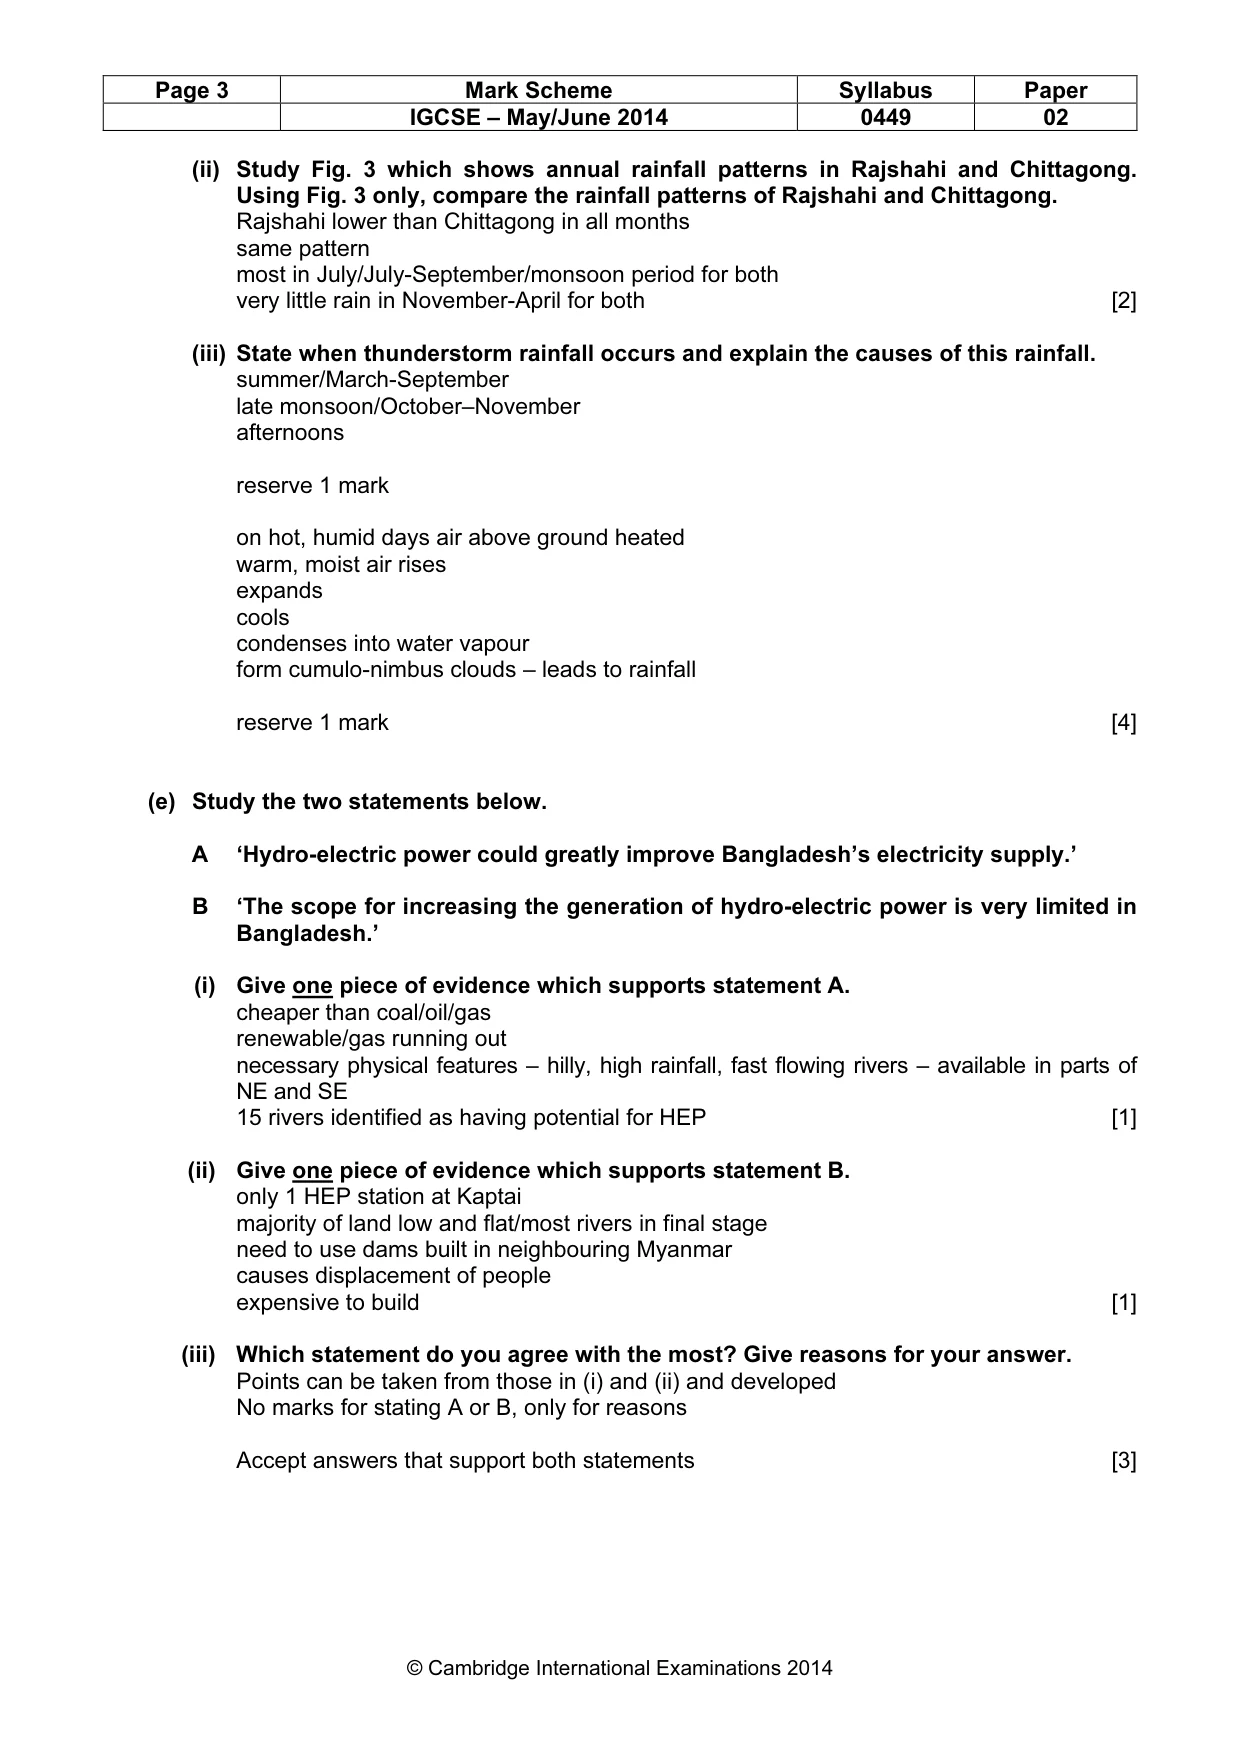
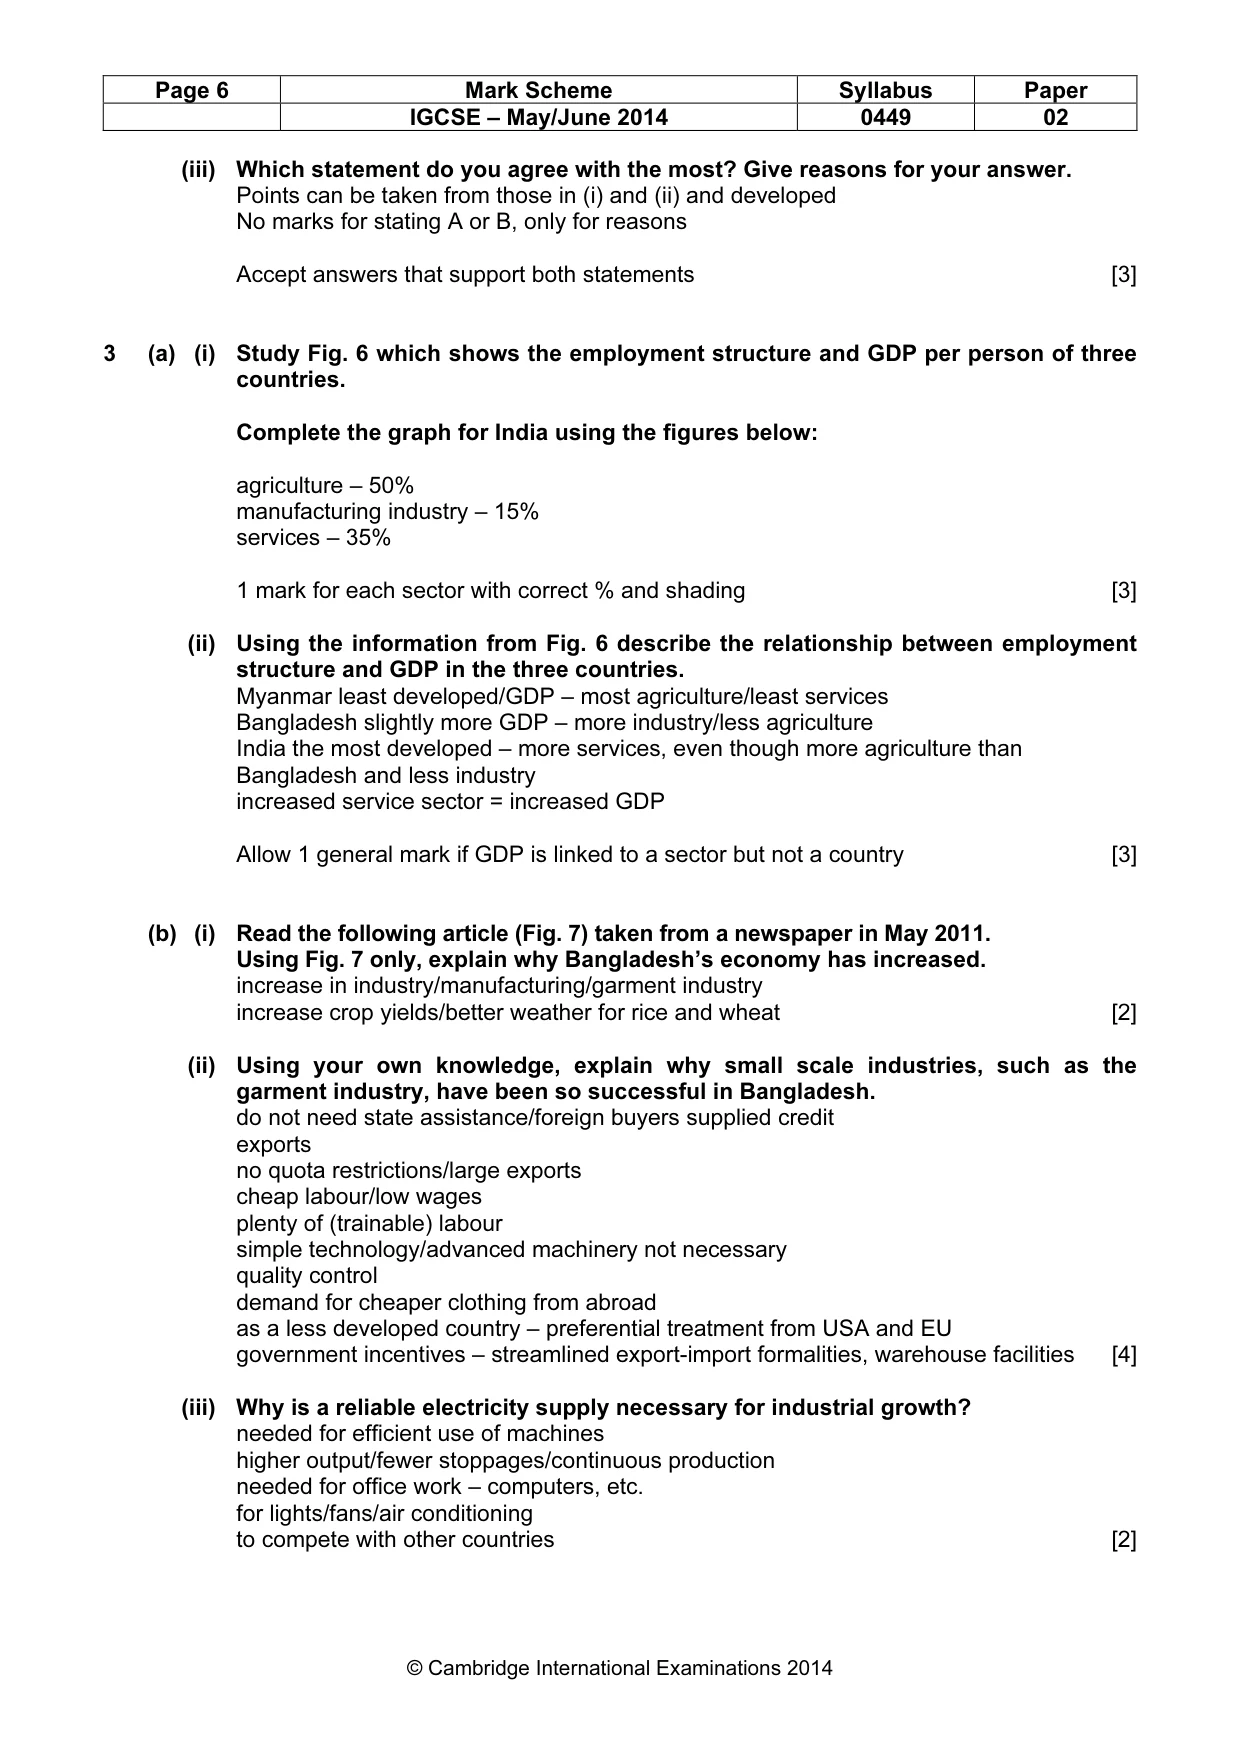
Mark scheme: 1 (a) The rivers of Bangladesh change course often. Explain how rivers change course and form ox-bow lakes. You may use a diagram(s) to explain your answer. erosion on outer banks deposition on inner banks cause a river to migrate downstream when meander pronounced/more circular erosion on outer bend forms a narrow neck deposition builds up on inner bend neck eventually eroded river flows straight/breaks through deposits seal off the meander to create ox-bow lake [4] (b) Study Fig. 1 which shows the number of passengers and the amount of cargo transported by rivers between 1995 and 2010. (i) Describe the changes in passenger numbers between 1995 and 2005. fluctuating/variable/gradual or slight increase [1] (ii) Between which years did the amount of cargo carried stay the same? 1995–2002 [1] (iii) When was the biggest increase in the number of passenger transported by river? 2005–2006 [1] (c) Explain why rivers are an important form of transport in Bangladesh. large network of rivers/rivers everywhere well connected to rest of transport system cheap means of transport natural/environmentally friendly 2/3 country flooded during monsoons – roads/railways limited use 2/3 country flooded during monsoons – provide aid/essential services roads and railways expensive to build/maintain roads congested/traffic jams/pressure on roads main towns/commercial centres on river banks villages not always accessible by roads/poor quality roads large amount/bulky goods carried ferries instead of bridges inland ports [4] (d) (i) Study Fig. 2 which shows the annual rainfall in Bangladesh. Describe the distribution of rainfall in Bangladesh. heavy/+3500 – in NE high/2500-3500 in – hilly regions/Sylhet/Chittagong high/2500-3500 in – coastal areas at delta/mouth of Ganges/Padma moderate/2000-2500 – in N/NW moderate/2000-2500 – extending SEwards lower/1500-2000 – towards W lowest/-1500 – extreme W, near Rajshahi any 3 sections @ 1 mark each [3] IGCSE – May/June 2014 0449 02 (ii) Study Fig. 3 which shows annual rainfall patterns in Rajshahi and Chittagong. Using Fig. 3 only, compare the rainfall patterns of Rajshahi and Chittagong. Rajshahi lower than Chittagong in all months same pattern most in July/July-September/monsoon period for both very little rain in November-April for both [2] (iii) State when thunderstorm rainfall occurs and explain the causes of this rainfall. summer/March-September late monsoon/October–November afternoons reserve 1 mark on hot, humid days air above ground heated warm, moist air rises expands cools condenses into water vapour form cumulo-nimbus clouds – leads to rainfall reserve 1 mark [4] (e) Study the two statements below. A ‘Hydro-electric power could greatly improve Bangladesh’s electricity supply.’ B ‘The scope for increasing the generation of hydro-electric power is very limited in Bangladesh.’ (i) Give one piece of evidence which supports statement A. cheaper than coal/oil/gas renewable/gas running out necessary physical features – hilly, high rainfall, fast flowing rivers – available in parts of NE and SE 15 rivers identified as having potential for HEP [1] (ii) Give one piece of evidence which supports statement B. only 1 HEP station at Kaptai majority of land low and flat/most rivers in final stage need to use dams built in neighbouring Myanmar causes displacement of people expensive to build [1] (iii) Which statement do you agree with the most? Give reasons for your answer. Points can be taken from those in (i) and (ii) and developed No marks for stating A or B, only for reasons Accept answers that support both statements [3] IGCSE – May/June 2014 0449 02
Question 2
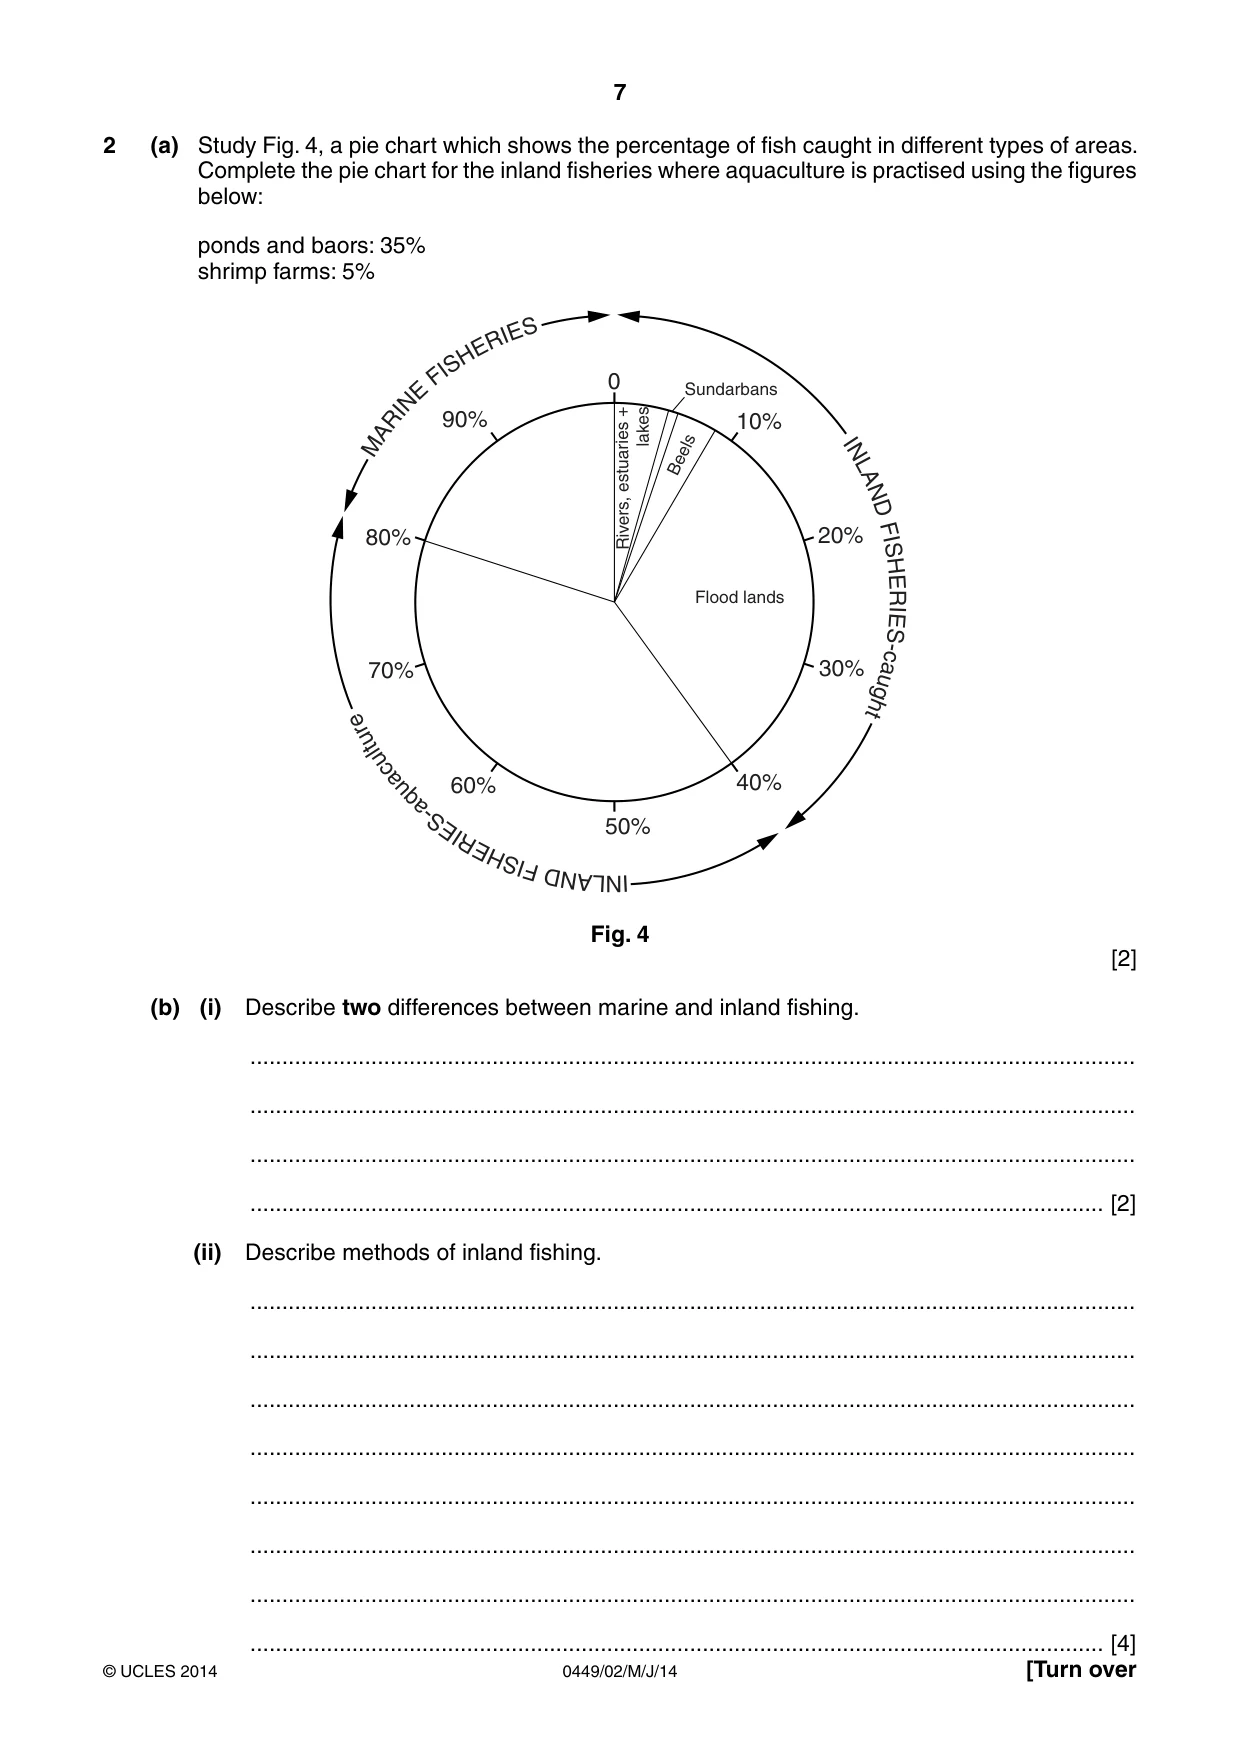
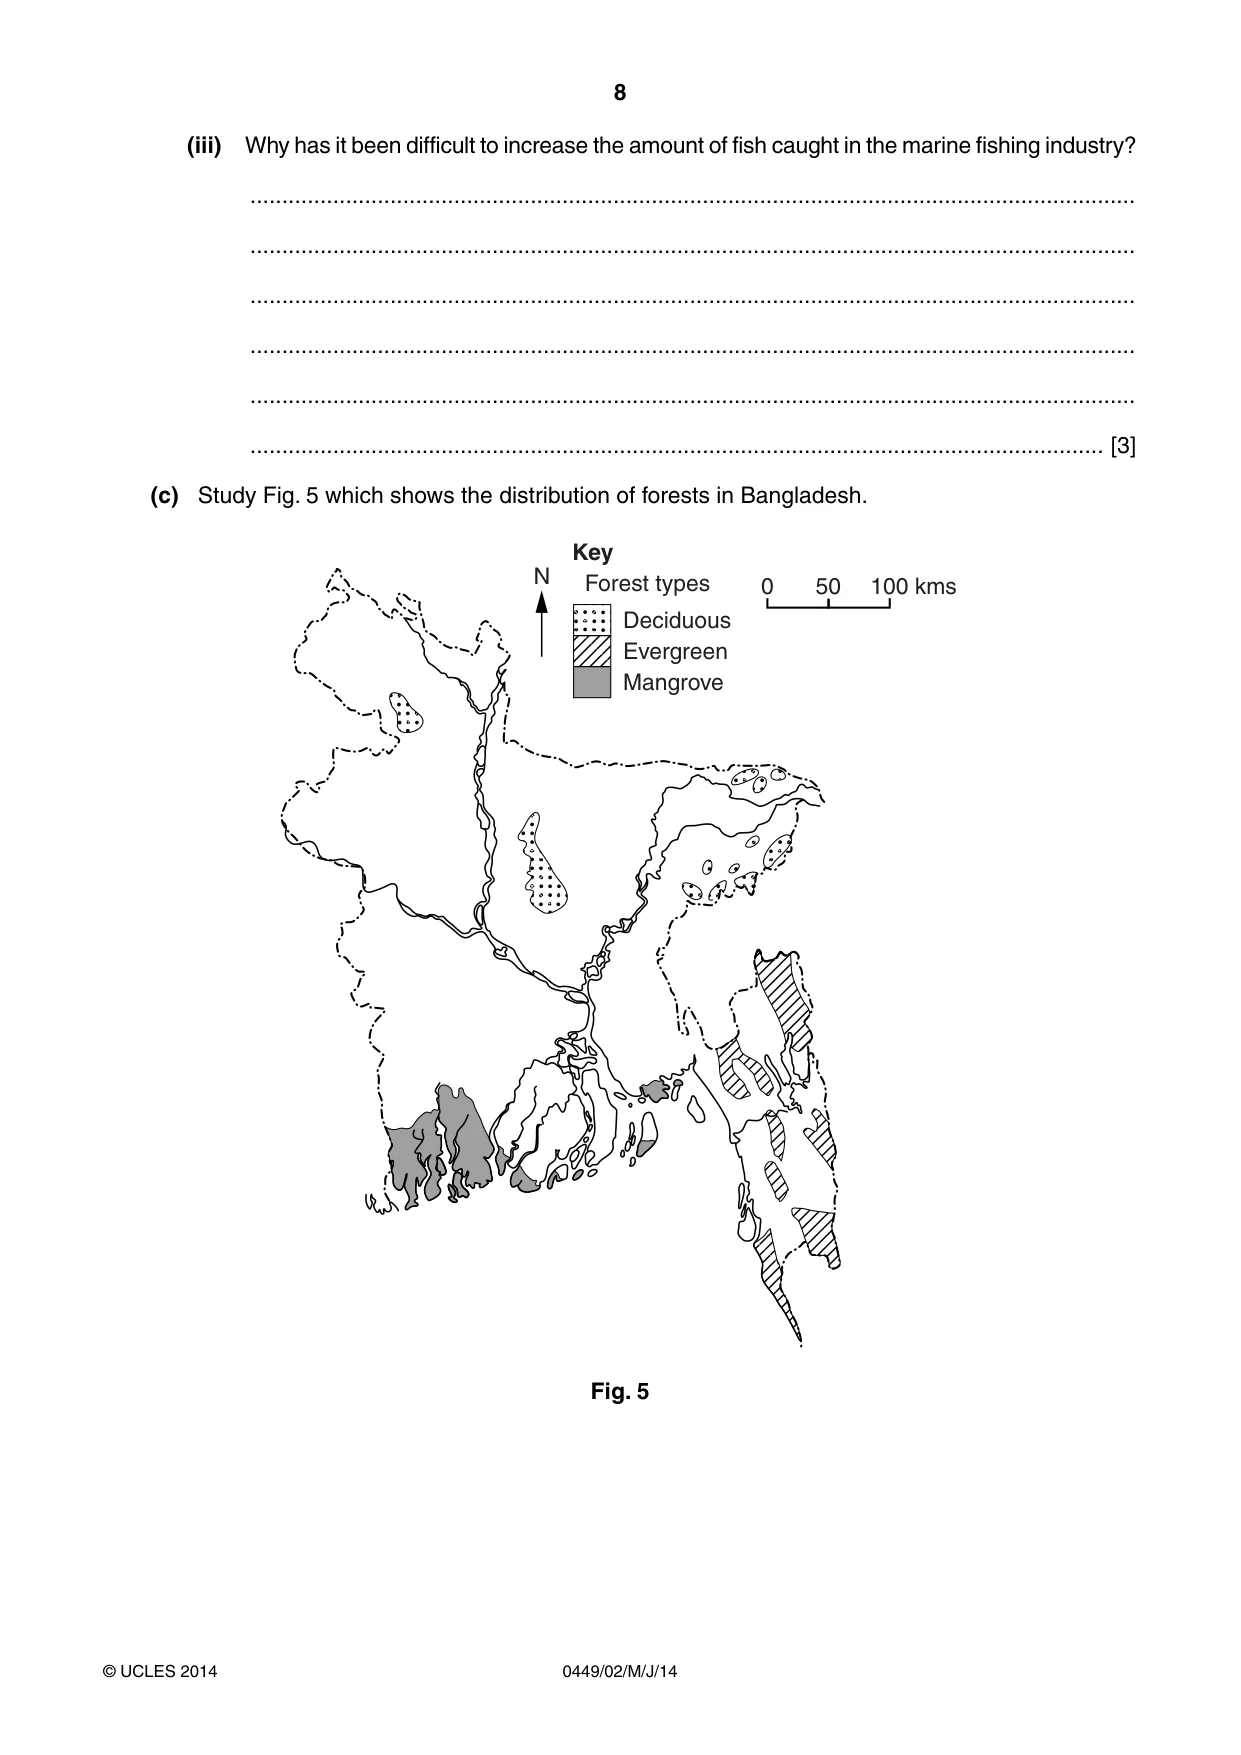
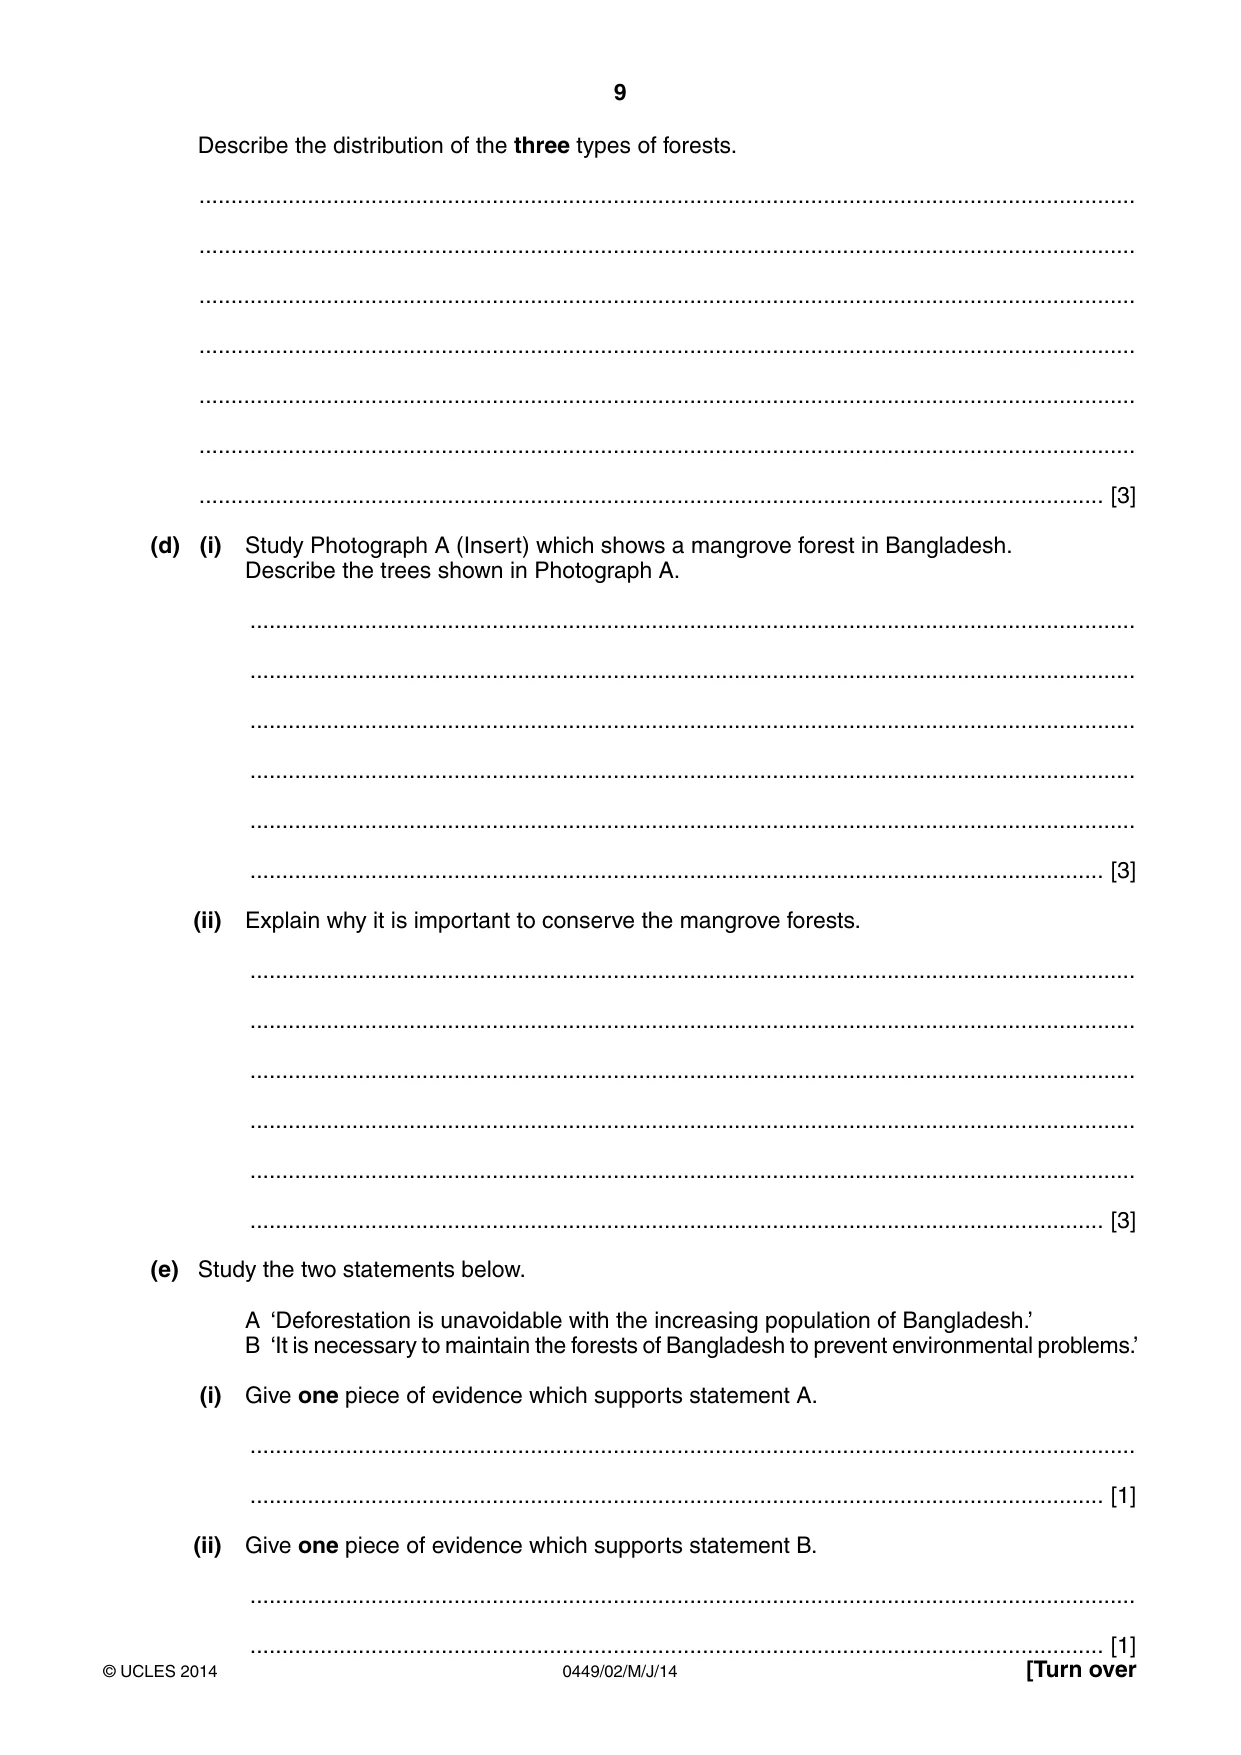
2 (a) Study Fig. 4, a pie chart which shows the percentage of fish caught in different types of areas. Complete the pie chart for the inland fisheries where aquaculture is practised using the figures below: ponds and baors: 35% shrimp farms: 5% ES RI E H S FI 0 Sundarbans E N + RI 90% 10% A lakes M Beels INL estuaries A N D 80% Rivers, 20% FI S H E Flood lands RI E S- 70% 30% ca u g ht re tu ul ac u 60% 40% aq S- E 50% RI E HS FI DNALIN Fig. 4 [2] (b) (i) Describe two differences between marine and inland fishing. ........................................................................................................................................... ........................................................................................................................................... ........................................................................................................................................... ...................................................................................................................................... [2] (ii) Describe methods of inland fishing. ........................................................................................................................................... ........................................................................................................................................... ........................................................................................................................................... ........................................................................................................................................... ........................................................................................................................................... ........................................................................................................................................... ........................................................................................................................................... ...................................................................................................................................... [4] (iii) Why has it been difficult to increase the amount of fish caught in the marine fishing industry? ........................................................................................................................................... ........................................................................................................................................... ........................................................................................................................................... ........................................................................................................................................... ........................................................................................................................................... ...................................................................................................................................... [3] (c) Study Fig. 5 which shows the distribution of forests in Bangladesh. Key N Forest types 0 50 100 kms Deciduous Evergreen Mangrove Fig. 5 Describe the distribution of the three types of forests. ................................................................................................................................................... ................................................................................................................................................... ................................................................................................................................................... ................................................................................................................................................... ................................................................................................................................................... ................................................................................................................................................... .............................................................................................................................................. [3] (d) (i) Study Photograph A (Insert) which shows a mangrove forest in Bangladesh. Describe the trees shown in Photograph A. ........................................................................................................................................... ........................................................................................................................................... ........................................................................................................................................... ........................................................................................................................................... ........................................................................................................................................... ...................................................................................................................................... [3] (ii) Explain why it is important to conserve the mangrove forests. ........................................................................................................................................... ........................................................................................................................................... ........................................................................................................................................... ........................................................................................................................................... ........................................................................................................................................... ...................................................................................................................................... [3] (e) Study the two statements below. A ‘Deforestation is unavoidable with the increasing population of Bangladesh.’ B ‘It is necessary to maintain the forests of Bangladesh to prevent environmental problems.’ (i) Give one piece of evidence which supports statement A. ........................................................................................................................................... ...................................................................................................................................... [1] (ii) Give one piece of evidence which supports statement B. ........................................................................................................................................... ...................................................................................................................................... [1] (iii) Which statement do you agree with the most? Give reasons for your answer. ........................................................................................................................................... ........................................................................................................................................... ........................................................................................................................................... ........................................................................................................................................... ........................................................................................................................................... ...................................................................................................................................... [3] [Total: 25 marks]
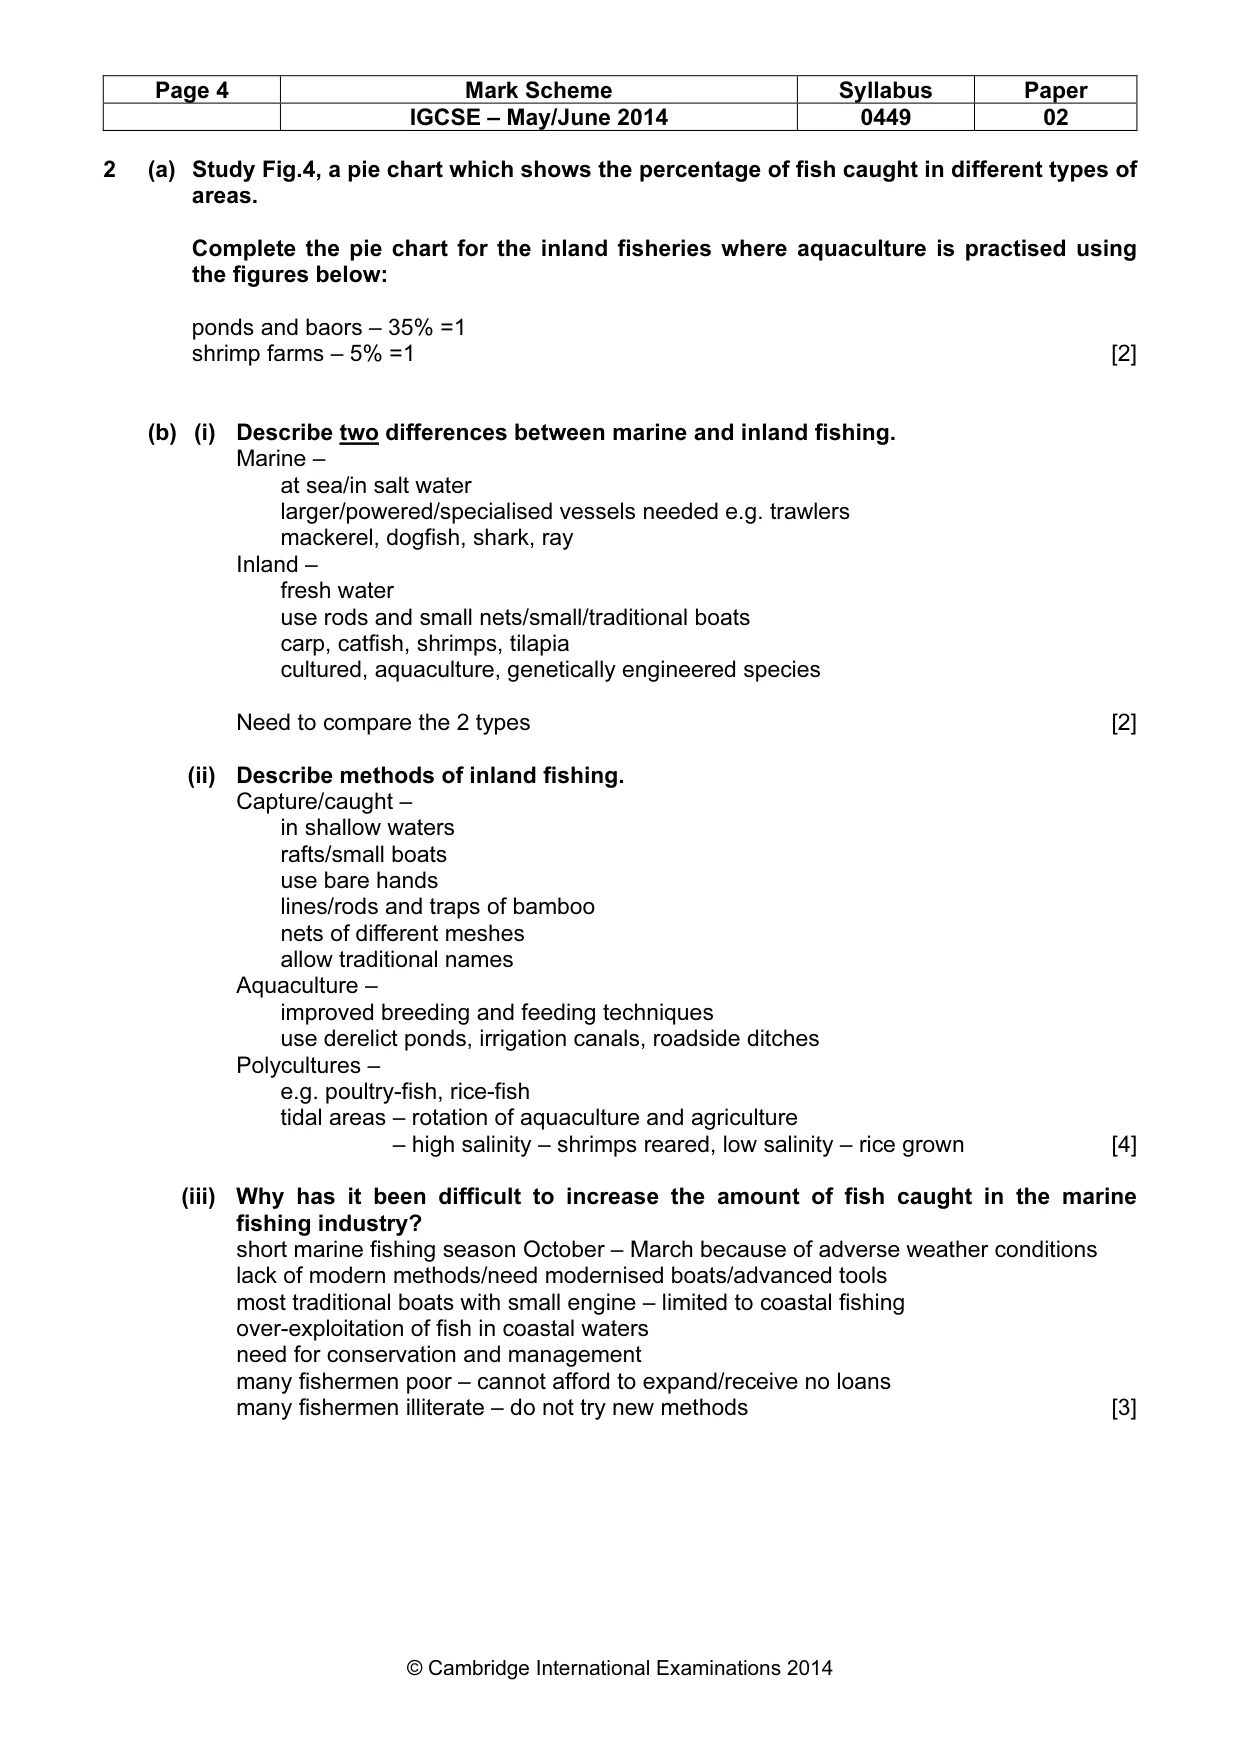
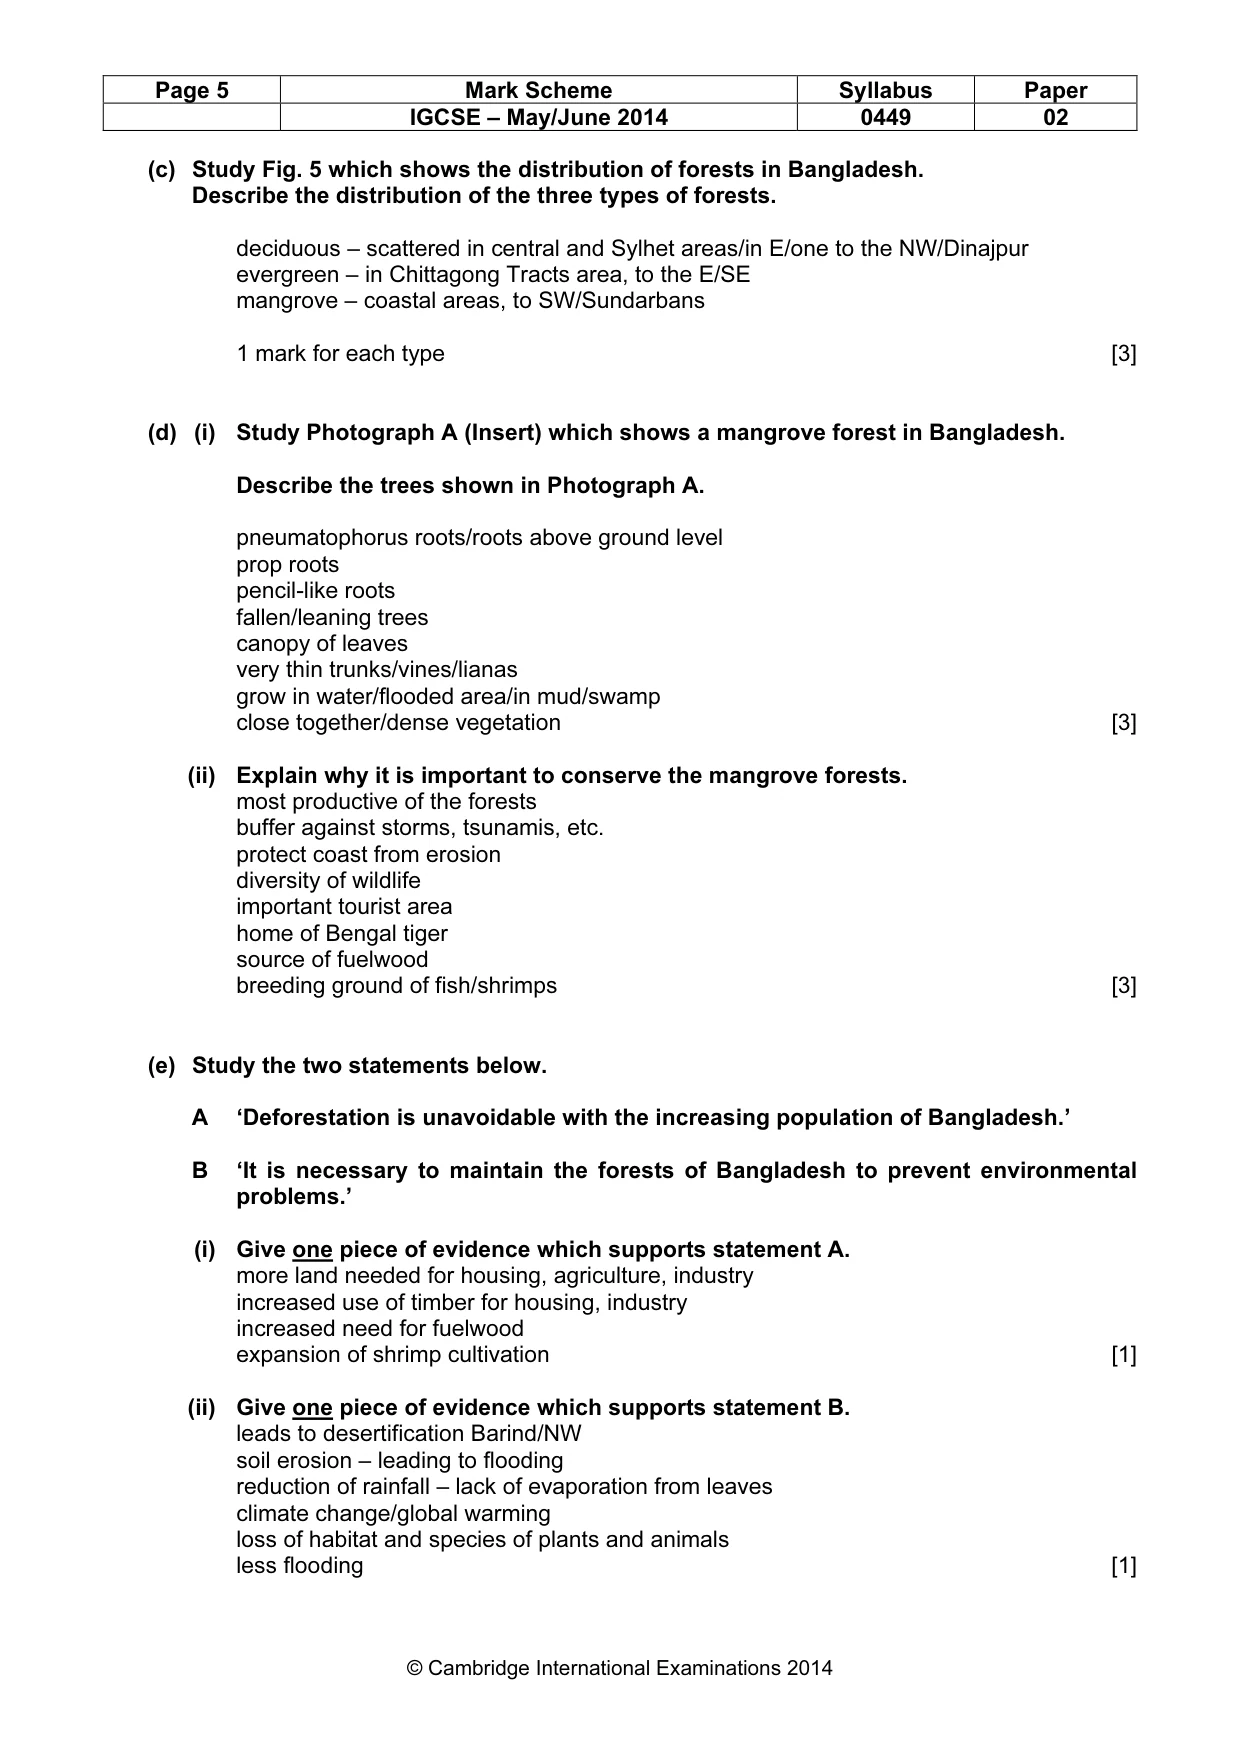
Mark scheme: 2 (a) Study Fig.4, a pie chart which shows the percentage of fish caught in different types of areas. Complete the pie chart for the inland fisheries where aquaculture is practised using the figures below: ponds and baors – 35% =1 shrimp farms – 5% =1 [2] (b) (i) Describe two differences between marine and inland fishing. Marine – at sea/in salt water larger/powered/specialised vessels needed e.g. trawlers mackerel, dogfish, shark, ray Inland – fresh water use rods and small nets/small/traditional boats carp, catfish, shrimps, tilapia cultured, aquaculture, genetically engineered species Need to compare the 2 types [2] (ii) Describe methods of inland fishing. Capture/caught – in shallow waters rafts/small boats use bare hands lines/rods and traps of bamboo nets of different meshes allow traditional names Aquaculture – improved breeding and feeding techniques use derelict ponds, irrigation canals, roadside ditches Polycultures – e.g. poultry-fish, rice-fish tidal areas – rotation of aquaculture and agriculture tidal areas – high salinity – shrimps reared, low salinity – rice grown [4] (iii) Why has it been difficult to increase the amount of fish caught in the marine fishing industry? short marine fishing season October – March because of adverse weather conditions lack of modern methods/need modernised boats/advanced tools most traditional boats with small engine – limited to coastal fishing over-exploitation of fish in coastal waters need for conservation and management many fishermen poor – cannot afford to expand/receive no loans many fishermen illiterate – do not try new methods [3] IGCSE – May/June 2014 0449 02 (c) Study Fig. 5 which shows the distribution of forests in Bangladesh. Describe the distribution of the three types of forests. deciduous – scattered in central and Sylhet areas/in E/one to the NW/Dinajpur evergreen – in Chittagong Tracts area, to the E/SE mangrove – coastal areas, to SW/Sundarbans 1 mark for each type [3] (d) (i) Study Photograph A (Insert) which shows a mangrove forest in Bangladesh. Describe the trees shown in Photograph A. pneumatophorus roots/roots above ground level prop roots pencil-like roots fallen/leaning trees canopy of leaves very thin trunks/vines/lianas grow in water/flooded area/in mud/swamp close together/dense vegetation [3] (ii) Explain why it is important to conserve the mangrove forests. most productive of the forests buffer against storms, tsunamis, etc. protect coast from erosion diversity of wildlife important tourist area home of Bengal tiger source of fuelwood breeding ground of fish/shrimps [3] (e) Study the two statements below. A ‘Deforestation is unavoidable with the increasing population of Bangladesh.’ B ‘It is necessary to maintain the forests of Bangladesh to prevent environmental problems.’ (i) Give one piece of evidence which supports statement A. more land needed for housing, agriculture, industry increased use of timber for housing, industry increased need for fuelwood expansion of shrimp cultivation [1] (ii) Give one piece of evidence which supports statement B. leads to desertification Barind/NW soil erosion – leading to flooding reduction of rainfall – lack of evaporation from leaves climate change/global warming loss of habitat and species of plants and animals less flooding [1] IGCSE – May/June 2014 0449 02 (iii) Which statement do you agree with the most? Give reasons for your answer. Points can be taken from those in (i) and (ii) and developed No marks for stating A or B, only for reasons Accept answers that support both statements [3]
Question 3
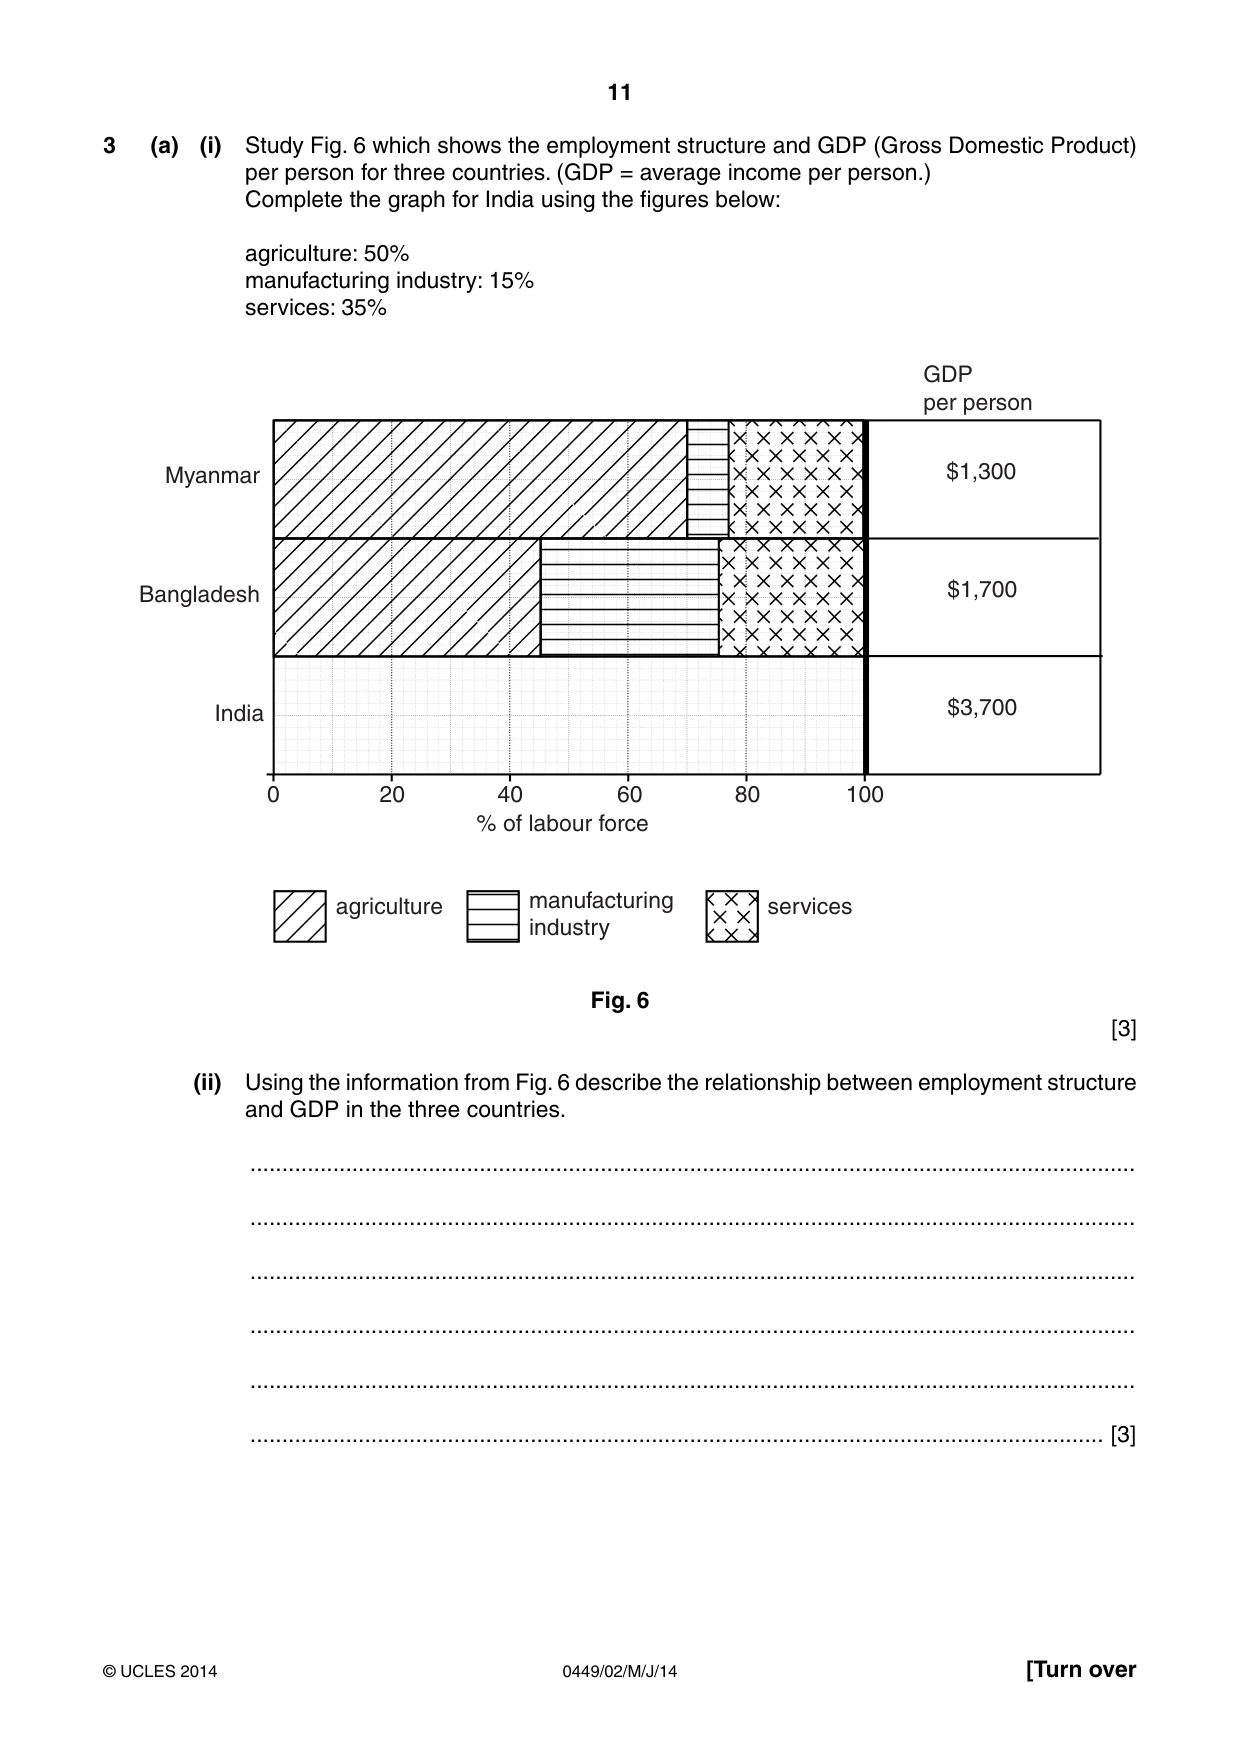
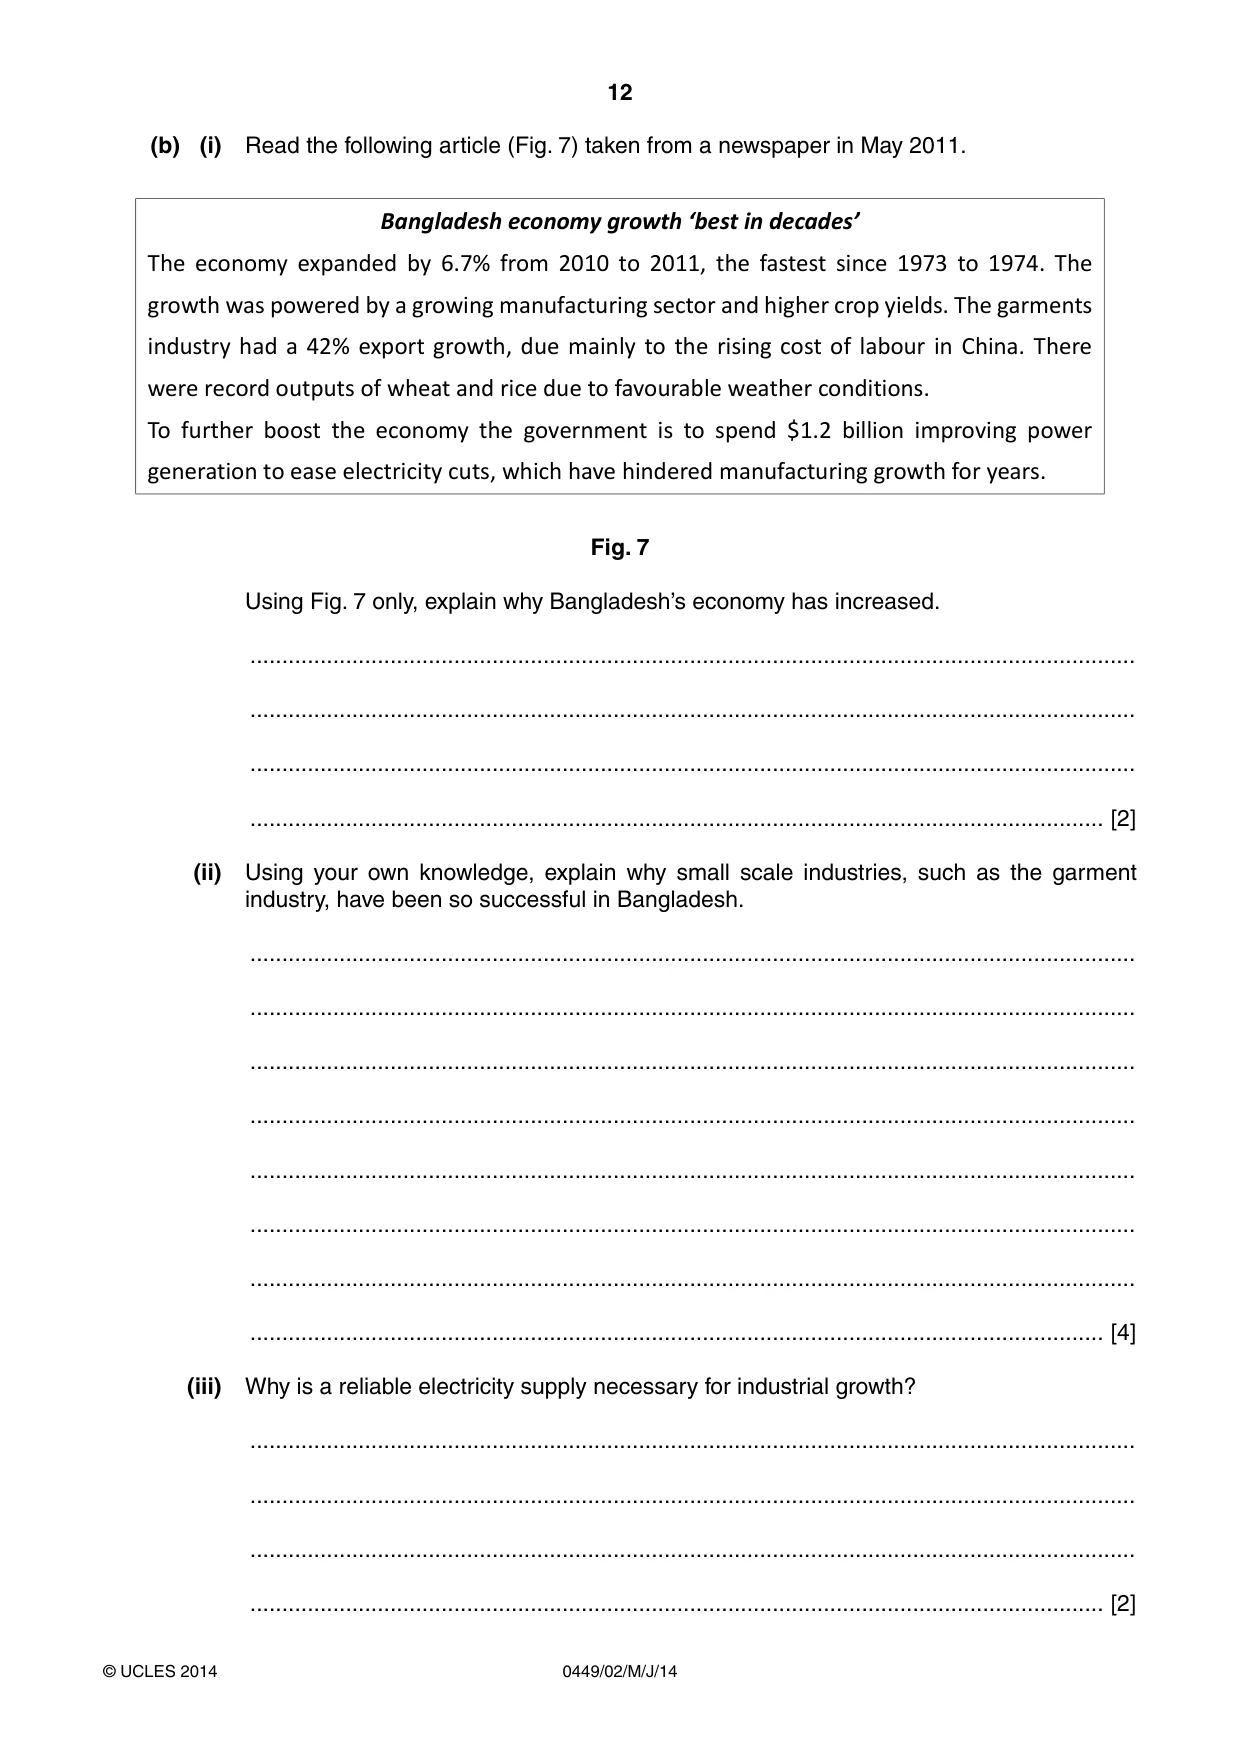
3 (a) (i) Study Fig. 6 which shows the employment structure and GDP (Gross Domestic Product) per person for three countries. (GDP = average income per person.) Complete the graph for India using the figures below: agriculture: 50% manufacturing industry: 15% services: 35% GDP per person Myanmar $1,300 Bangladesh $1,700 India $3,700 0 20 40 60 80 100 % of labour force agriculture manufacturing services industry Fig. 6 [3] (ii) Using the information from Fig. 6 describe the relationship between employment structure and GDP in the three countries. ........................................................................................................................................... ........................................................................................................................................... ........................................................................................................................................... ........................................................................................................................................... ........................................................................................................................................... ...................................................................................................................................... [3] (b) (i) Read the following article (Fig. 7) taken from a newspaper in May 2011. Bangladesh economy growth ‘best in decades’ The economy expanded by 6.7% from 2010 to 2011, the fastest since 1973 to 1974. The growth was powered by a growing manufacturing sector and higher crop yields. The garments industry had a 42% export growth, due mainly to the rising cost of labour in China. There were record outputs of wheat and rice due to favourable weather conditions. To further boost the economy the government is to spend $1.2 billion improving power generation to ease electricity cuts, which have hindered manufacturing growth for years. Fig. 7 Using Fig. 7 only, explain why Bangladesh’s economy has increased. ........................................................................................................................................... ........................................................................................................................................... ........................................................................................................................................... ...................................................................................................................................... [2] (ii) Using your own knowledge, explain why small scale industries, such as the garment industry, have been so successful in Bangladesh. ........................................................................................................................................... ........................................................................................................................................... ........................................................................................................................................... ........................................................................................................................................... ........................................................................................................................................... ........................................................................................................................................... ........................................................................................................................................... ...................................................................................................................................... [4] (iii) Why is a reliable electricity supply necessary for industrial growth? ........................................................................................................................................... ........................................................................................................................................... ........................................................................................................................................... ...................................................................................................................................... [2] (c) (i) The money sent back to Bangladesh by international migrants is another reason for the economic growth. Which countries are the most popular destinations for international migrants from Bangladesh? ........................................................................................................................................... ........................................................................................................................................... ........................................................................................................................................... ...................................................................................................................................... [2] (ii) Explain why people migrate to other countries. ........................................................................................................................................... ........................................................................................................................................... ........................................................................................................................................... ........................................................................................................................................... ........................................................................................................................................... ........................................................................................................................................... ........................................................................................................................................... ...................................................................................................................................... [4] (d) Study the two statements below. A ‘More manufacturing industries are needed to improve the economy.’ B ‘Increasing the service sector is the best way to improve the economy.’ (i) Give one piece of evidence which supports statement A. ........................................................................................................................................... ...................................................................................................................................... [1] (ii) Give one piece of evidence which supports statement B. ........................................................................................................................................... ...................................................................................................................................... [1] (iii) Which opinion do you agree with the most? Give reasons for your answer. ........................................................................................................................................... ........................................................................................................................................... ........................................................................................................................................... ........................................................................................................................................... ........................................................................................................................................... ...................................................................................................................................... [3] [Total: 25 marks]
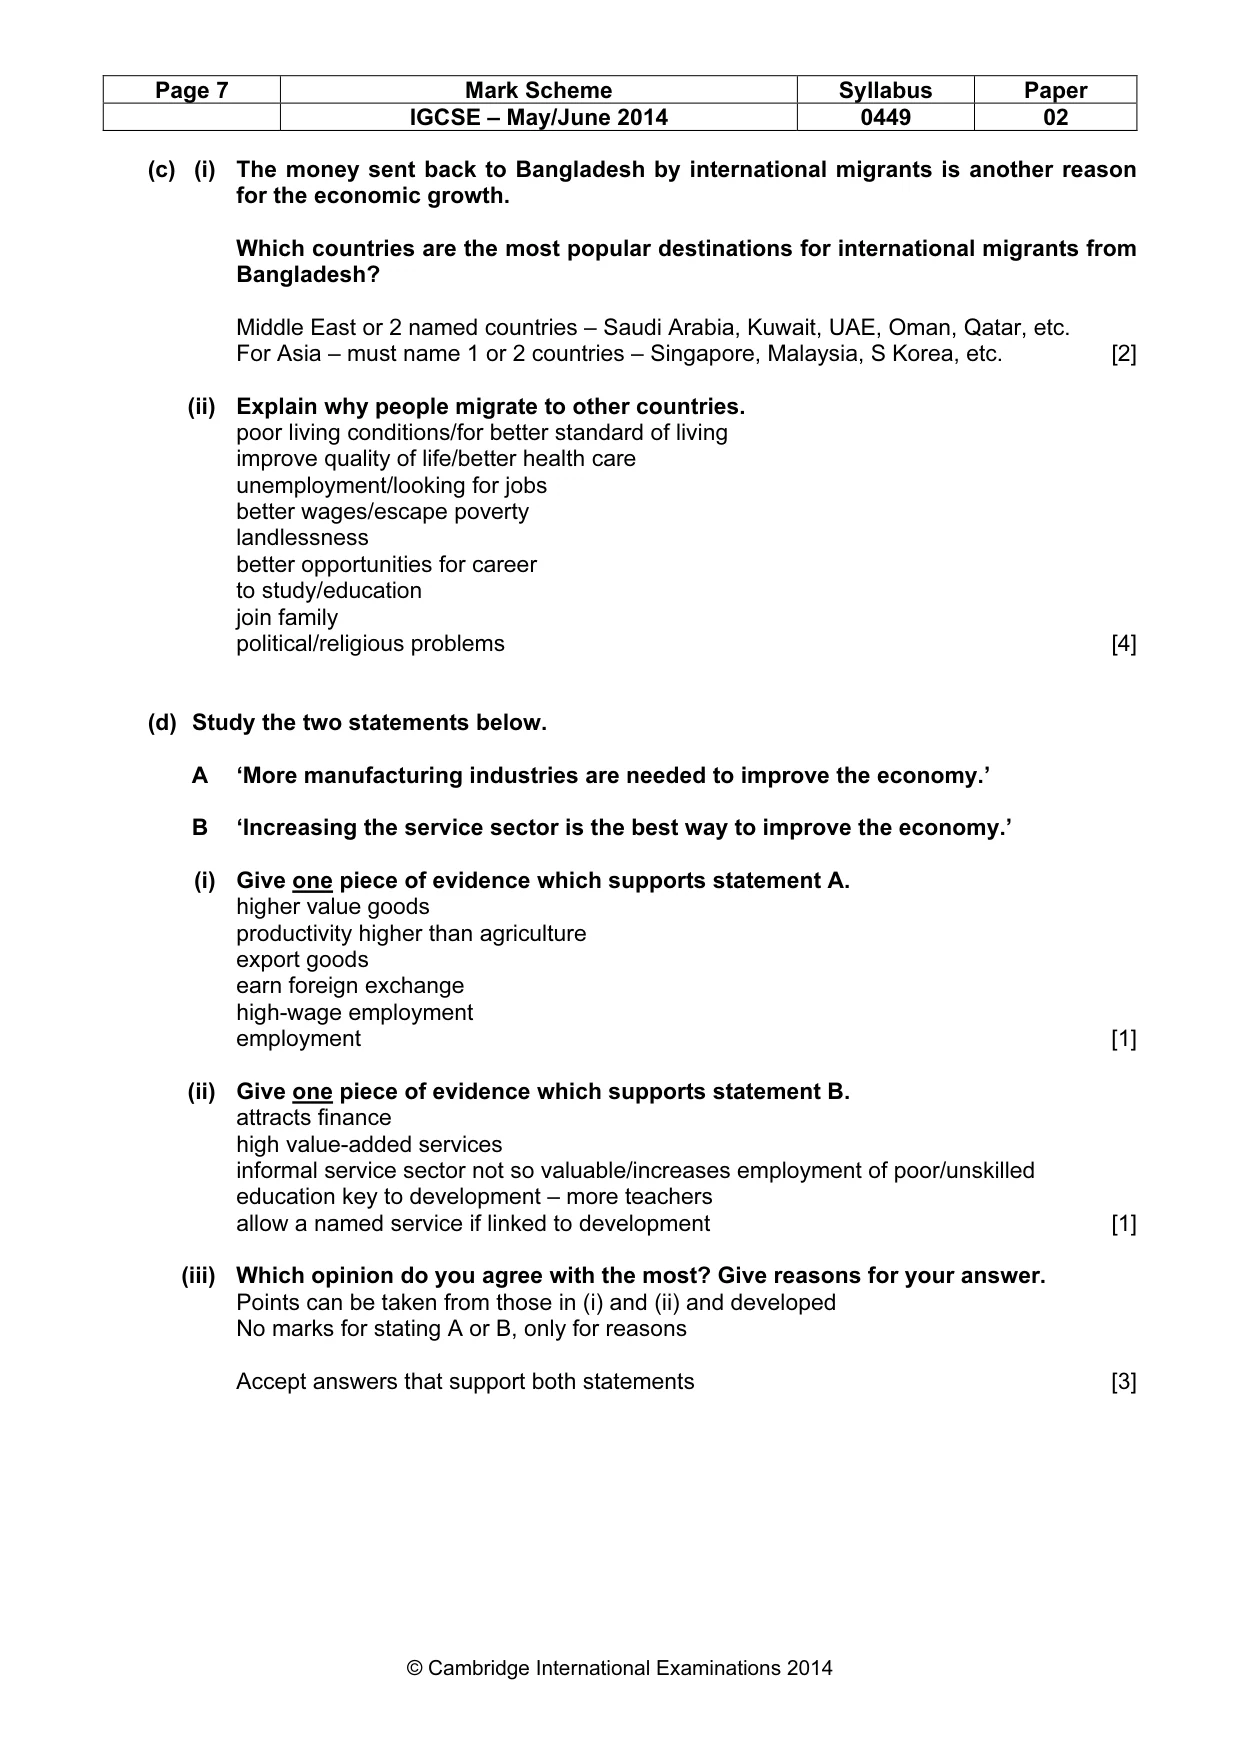
Mark scheme: 3 (a) (i) Study Fig. 6 which shows the employment structure and GDP per person of three countries. Complete the graph for India using the figures below: agriculture – 50% manufacturing industry – 15% services – 35% 1 mark for each sector with correct % and shading [3] (ii) Using the information from Fig. 6 describe the relationship between employment structure and GDP in the three countries. Myanmar least developed/GDP – most agriculture/least services Bangladesh slightly more GDP – more industry/less agriculture India the most developed – more services, even though more agriculture than Bangladesh and less industry increased service sector = increased GDP Allow 1 general mark if GDP is linked to a sector but not a country [3] (b) (i) Read the following article (Fig. 7) taken from a newspaper in May 2011. Using Fig. 7 only, explain why Bangladesh’s economy has increased. increase in industry/manufacturing/garment industry increase crop yields/better weather for rice and wheat [2] (ii) Using your own knowledge, explain why small scale industries, such as the garment industry, have been so successful in Bangladesh. do not need state assistance/foreign buyers supplied credit exports no quota restrictions/large exports cheap labour/low wages plenty of (trainable) labour simple technology/advanced machinery not necessary quality control demand for cheaper clothing from abroad as a less developed country – preferential treatment from USA and EU government incentives – streamlined export-import formalities, warehouse facilities [4] (iii) Why is a reliable electricity supply necessary for industrial growth? needed for efficient use of machines higher output/fewer stoppages/continuous production needed for office work – computers, etc. for lights/fans/air conditioning to compete with other countries [2] IGCSE – May/June 2014 0449 02 (c) (i) The money sent back to Bangladesh by international migrants is another reason for the economic growth. Which countries are the most popular destinations for international migrants from Bangladesh? Middle East or 2 named countries – Saudi Arabia, Kuwait, UAE, Oman, Qatar, etc. For Asia – must name 1 or 2 countries – Singapore, Malaysia, S Korea, etc. [2] (ii) Explain why people migrate to other countries. poor living conditions/for better standard of living improve quality of life/better health care unemployment/looking for jobs better wages/escape poverty landlessness better opportunities for career to study/education join family political/religious problems [4] (d) Study the two statements below. A ‘More manufacturing industries are needed to improve the economy.’ B ‘Increasing the service sector is the best way to improve the economy.’ (i) Give one piece of evidence which supports statement A. higher value goods productivity higher than agriculture export goods earn foreign exchange high-wage employment employment [1] (ii) Give one piece of evidence which supports statement B. attracts finance high value-added services informal service sector not so valuable/increases employment of poor/unskilled education key to development – more teachers allow a named service if linked to development [1] (iii) Which opinion do you agree with the most? Give reasons for your answer. Points can be taken from those in (i) and (ii) and developed No marks for stating A or B, only for reasons Accept answers that support both statements [3] IGCSE – May/June 2014 0449 02
Question 4
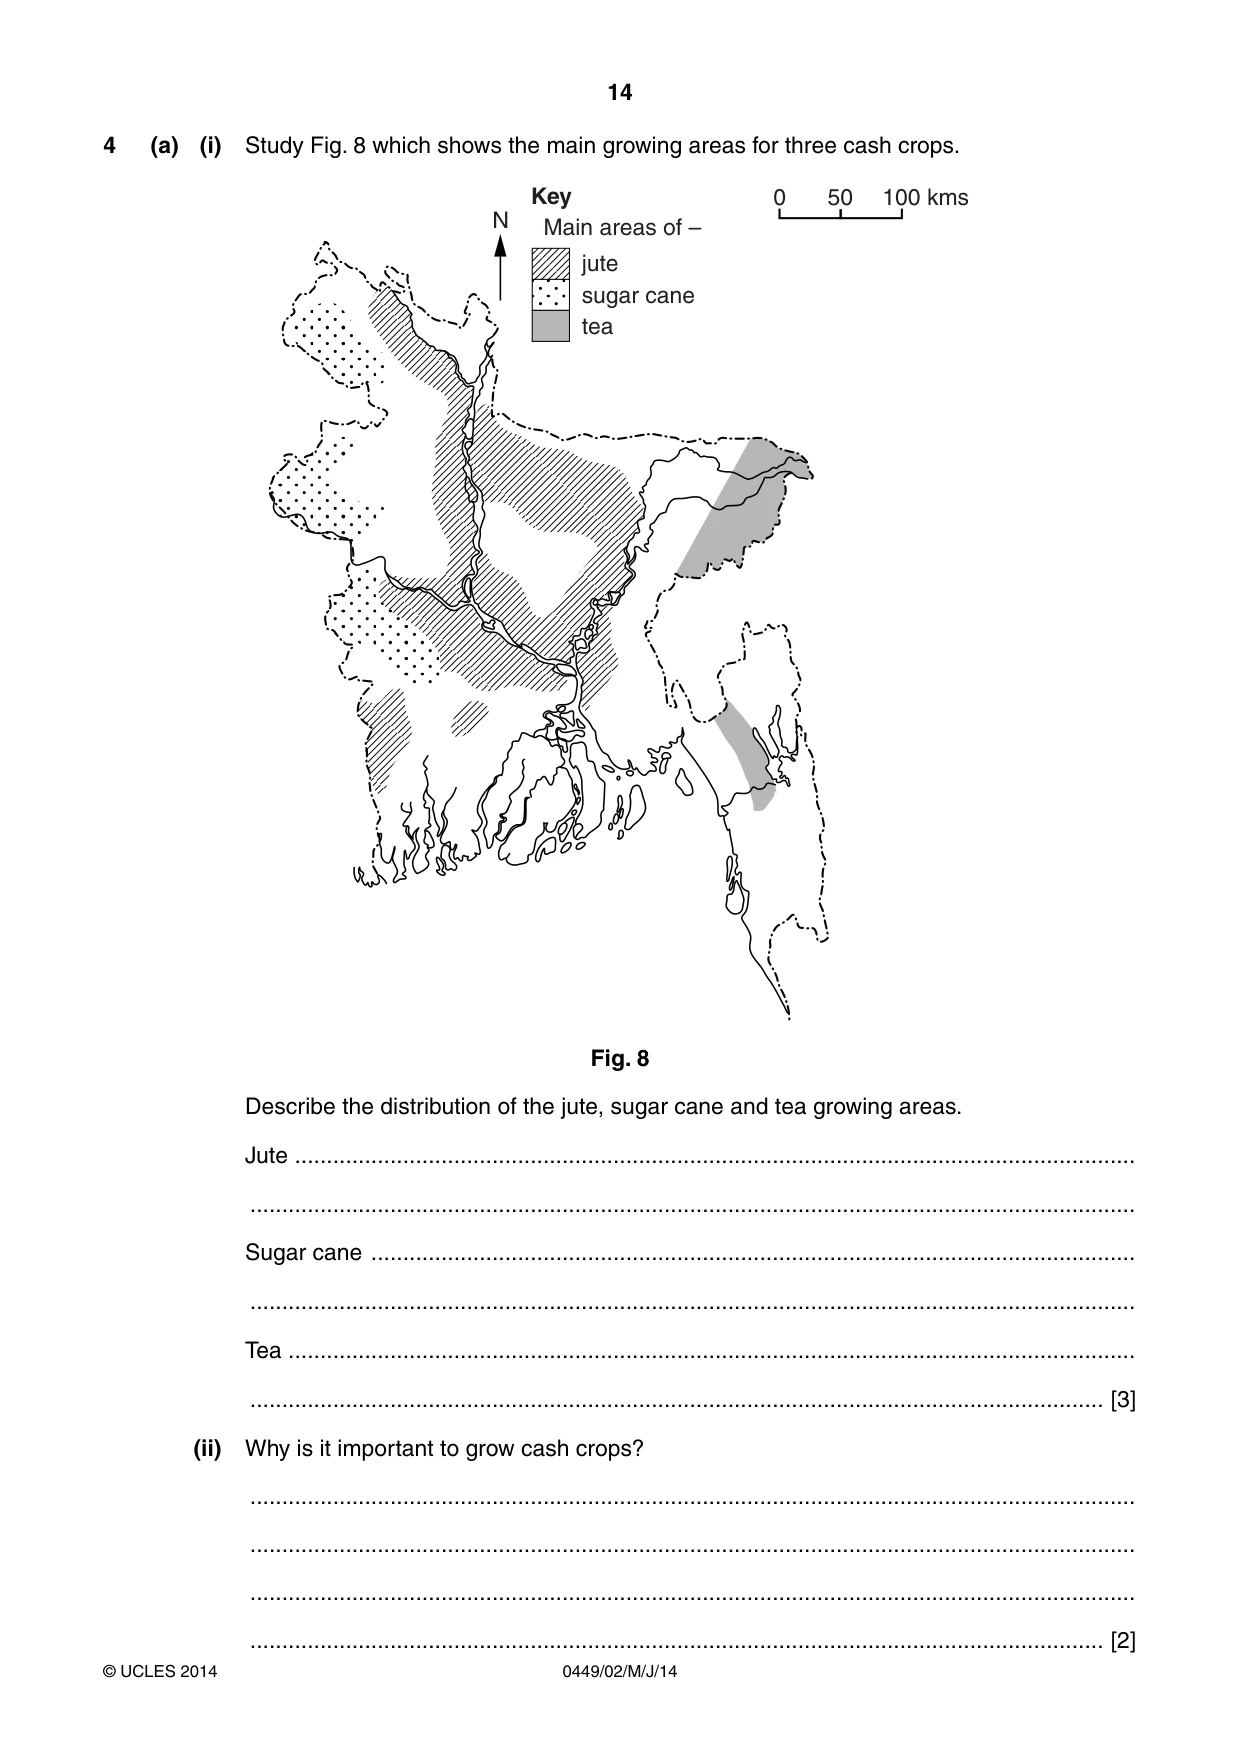
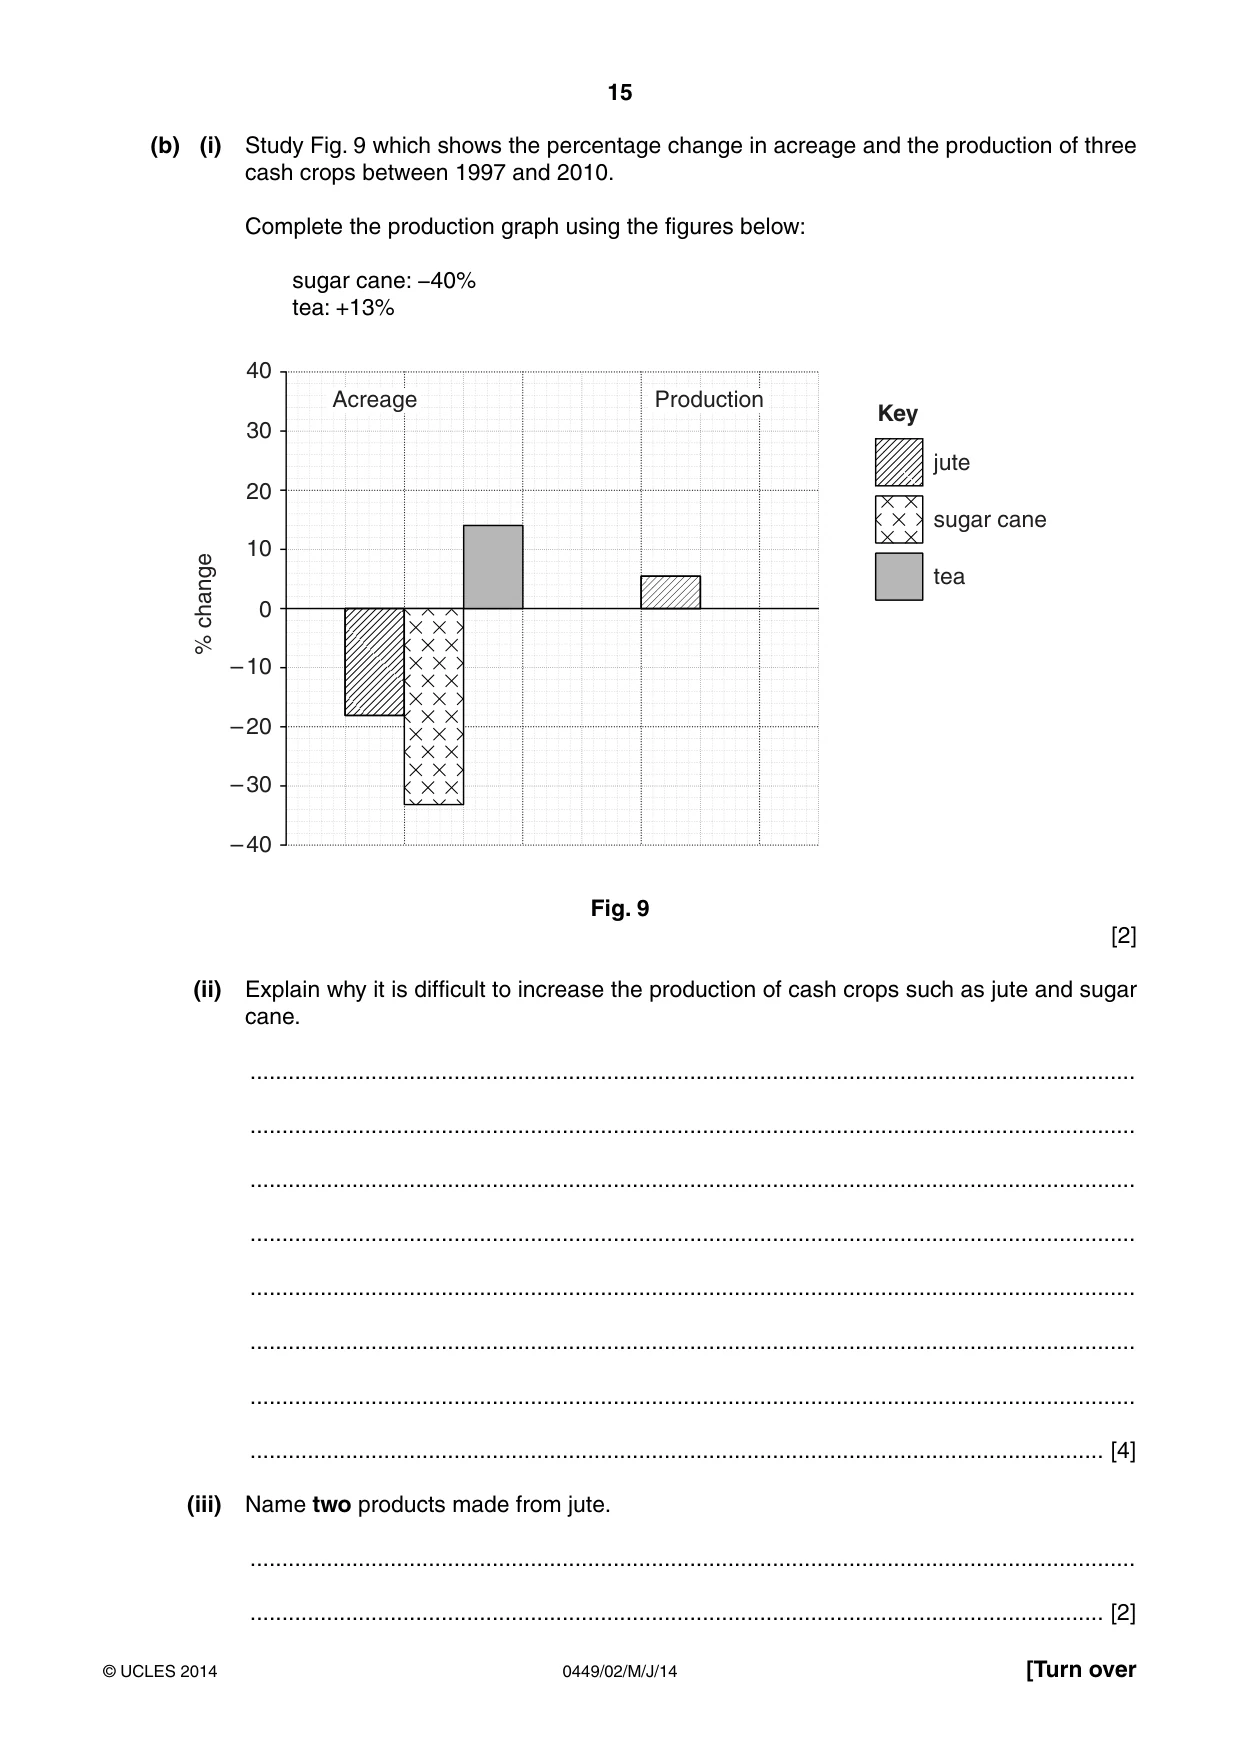
4 (a) (i) Study Fig. 8 which shows the main growing areas for three cash crops. Key 0 50 100 kms N Main areas of – jute sugar cane tea Fig. 8 Describe the distribution of the jute, sugar cane and tea growing areas. Jute .................................................................................................................................... ........................................................................................................................................... Sugar cane ........................................................................................................................ ........................................................................................................................................... Tea ..................................................................................................................................... ...................................................................................................................................... [3] (ii) Why is it important to grow cash crops? ........................................................................................................................................... ........................................................................................................................................... ........................................................................................................................................... ...................................................................................................................................... [2] (b) (i) Study Fig. 9 which shows the percentage change in acreage and the production of three cash crops between 1997 and 2010. Complete the production graph using the figures below: sugar cane: −40% tea: +13% 40 Acreage Production Key 30 jute 20 sugar cane 10 tea change 0 % – 10 – 20 – 30 – 40 Fig. 9 [2] (ii) Explain why it is difficult to increase the production of cash crops such as jute and sugar cane. ........................................................................................................................................... ........................................................................................................................................... ........................................................................................................................................... ........................................................................................................................................... ........................................................................................................................................... ........................................................................................................................................... ........................................................................................................................................... ...................................................................................................................................... [4] (iii) Name two products made from jute. ........................................................................................................................................... ...................................................................................................................................... [2] (c) Read the article, Fig. 10, on Bangladesh’s glass industry. Bangladesh’s glass industry Bangladesh has four glass manufacturing factories. An increase in the construction industry has led to a growth in glass production. Silica sand comes from Bangladesh and a trade agreement with Bhutan allows the import of limestone at a cheap rate. There is a large amount of natural gas available in Bangladesh for the industry. After meeting domestic demand, glass is now exported to a number of South Asian countries. However there are still some obstacles to overcome, such as a weak transport system. Fig. 10 (i) Why has the glass industry in Bangladesh grown? ...................................................................................................................................... [1] (ii) Name two raw materials needed for the glass industry. ...................................................................................................................................... [1] (iii) What provides the power for the glass industry? ...................................................................................................................................... [1] (d) What can the State do to encourage industrialisation in Bangladesh? ................................................................................................................................................... ................................................................................................................................................... ................................................................................................................................................... ................................................................................................................................................... ................................................................................................................................................... ................................................................................................................................................... ................................................................................................................................................... .............................................................................................................................................. [4] (e) Study the two statements below. A ‘Modern techniques are needed in agriculture to increase food production.’ B ‘Modern techniques in agriculture cause too many problems.’ (i) Give one piece of evidence which supports statement A. ........................................................................................................................................... ...................................................................................................................................... [1] (ii) Give one piece of evidence which supports statement B. ........................................................................................................................................... ...................................................................................................................................... [1] (iii) Which opinion do you agree with the most? Give reasons for your answer. ........................................................................................................................................... ........................................................................................................................................... ........................................................................................................................................... ........................................................................................................................................... ........................................................................................................................................... ...................................................................................................................................... [3] [Total: 25 marks]
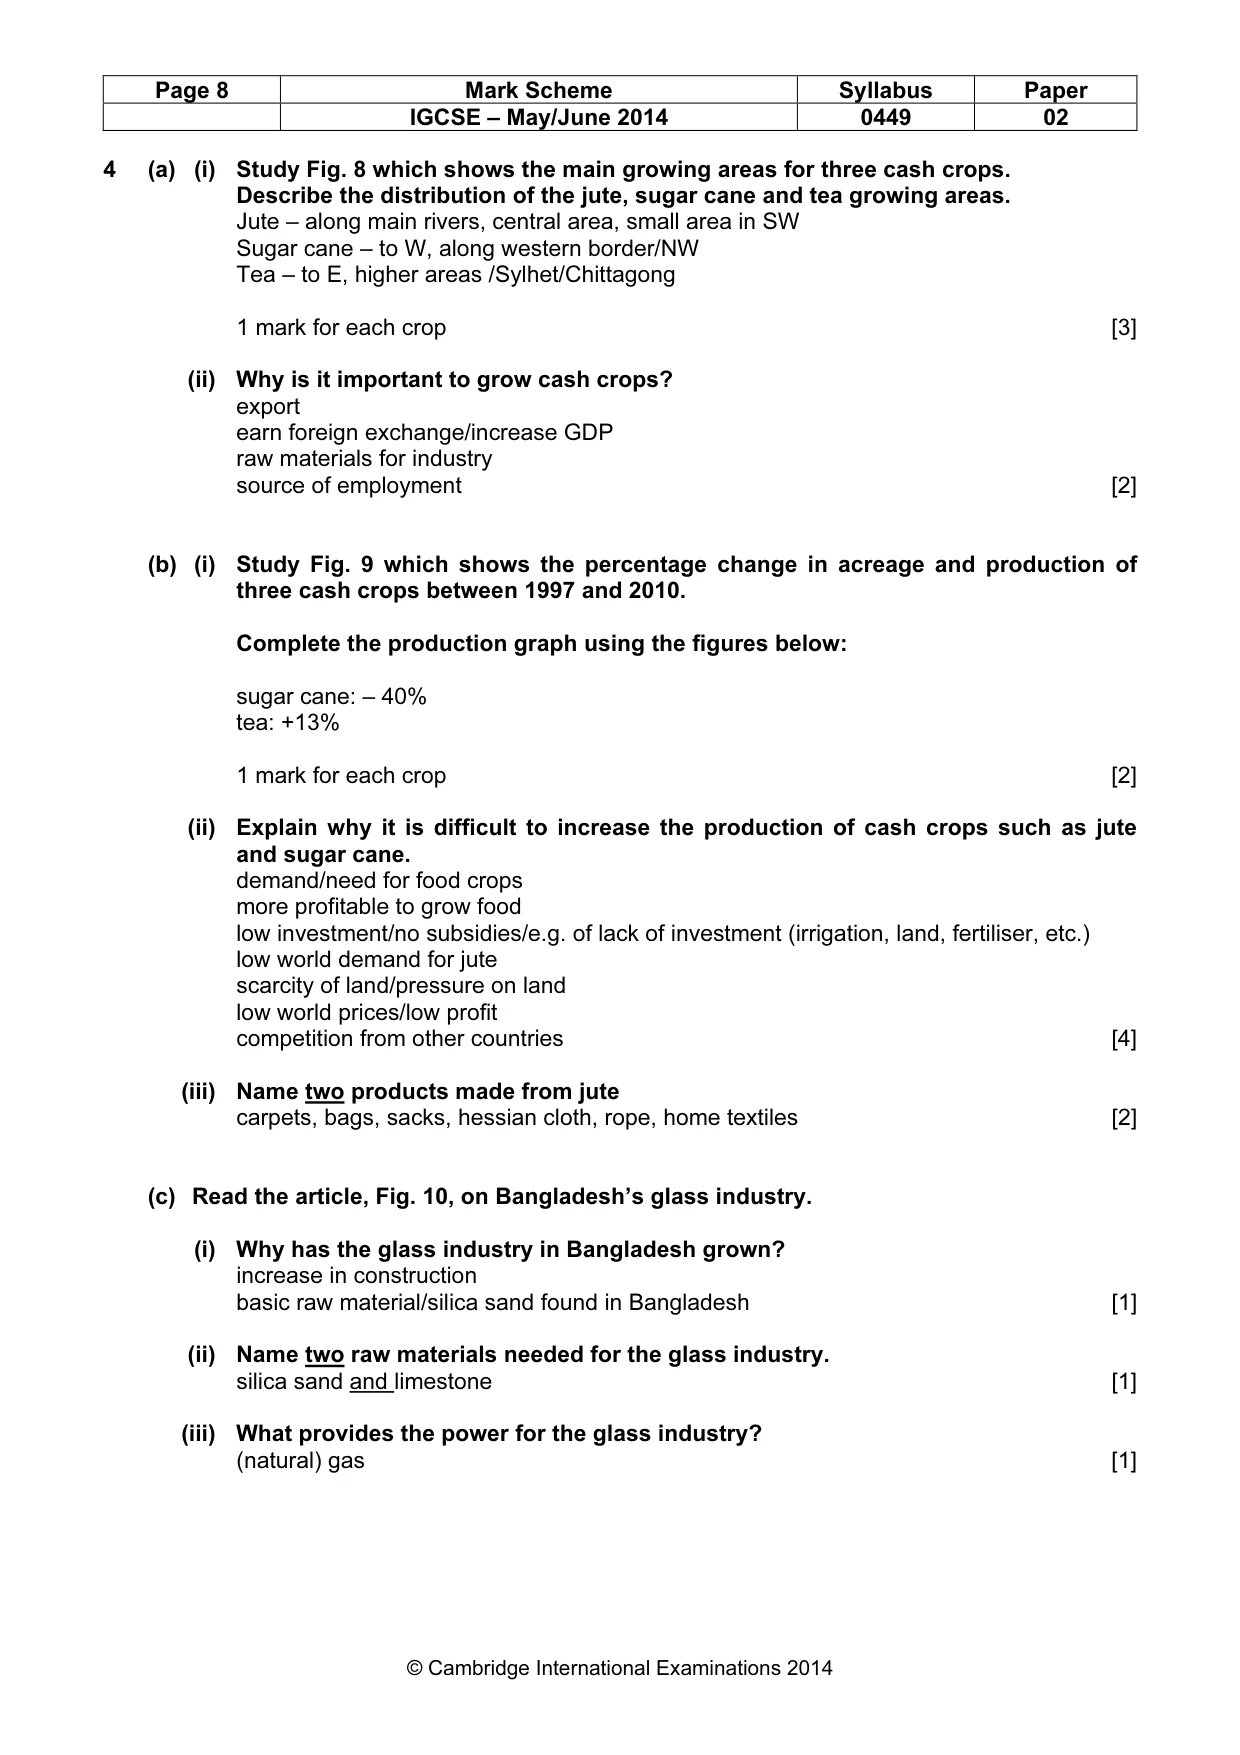
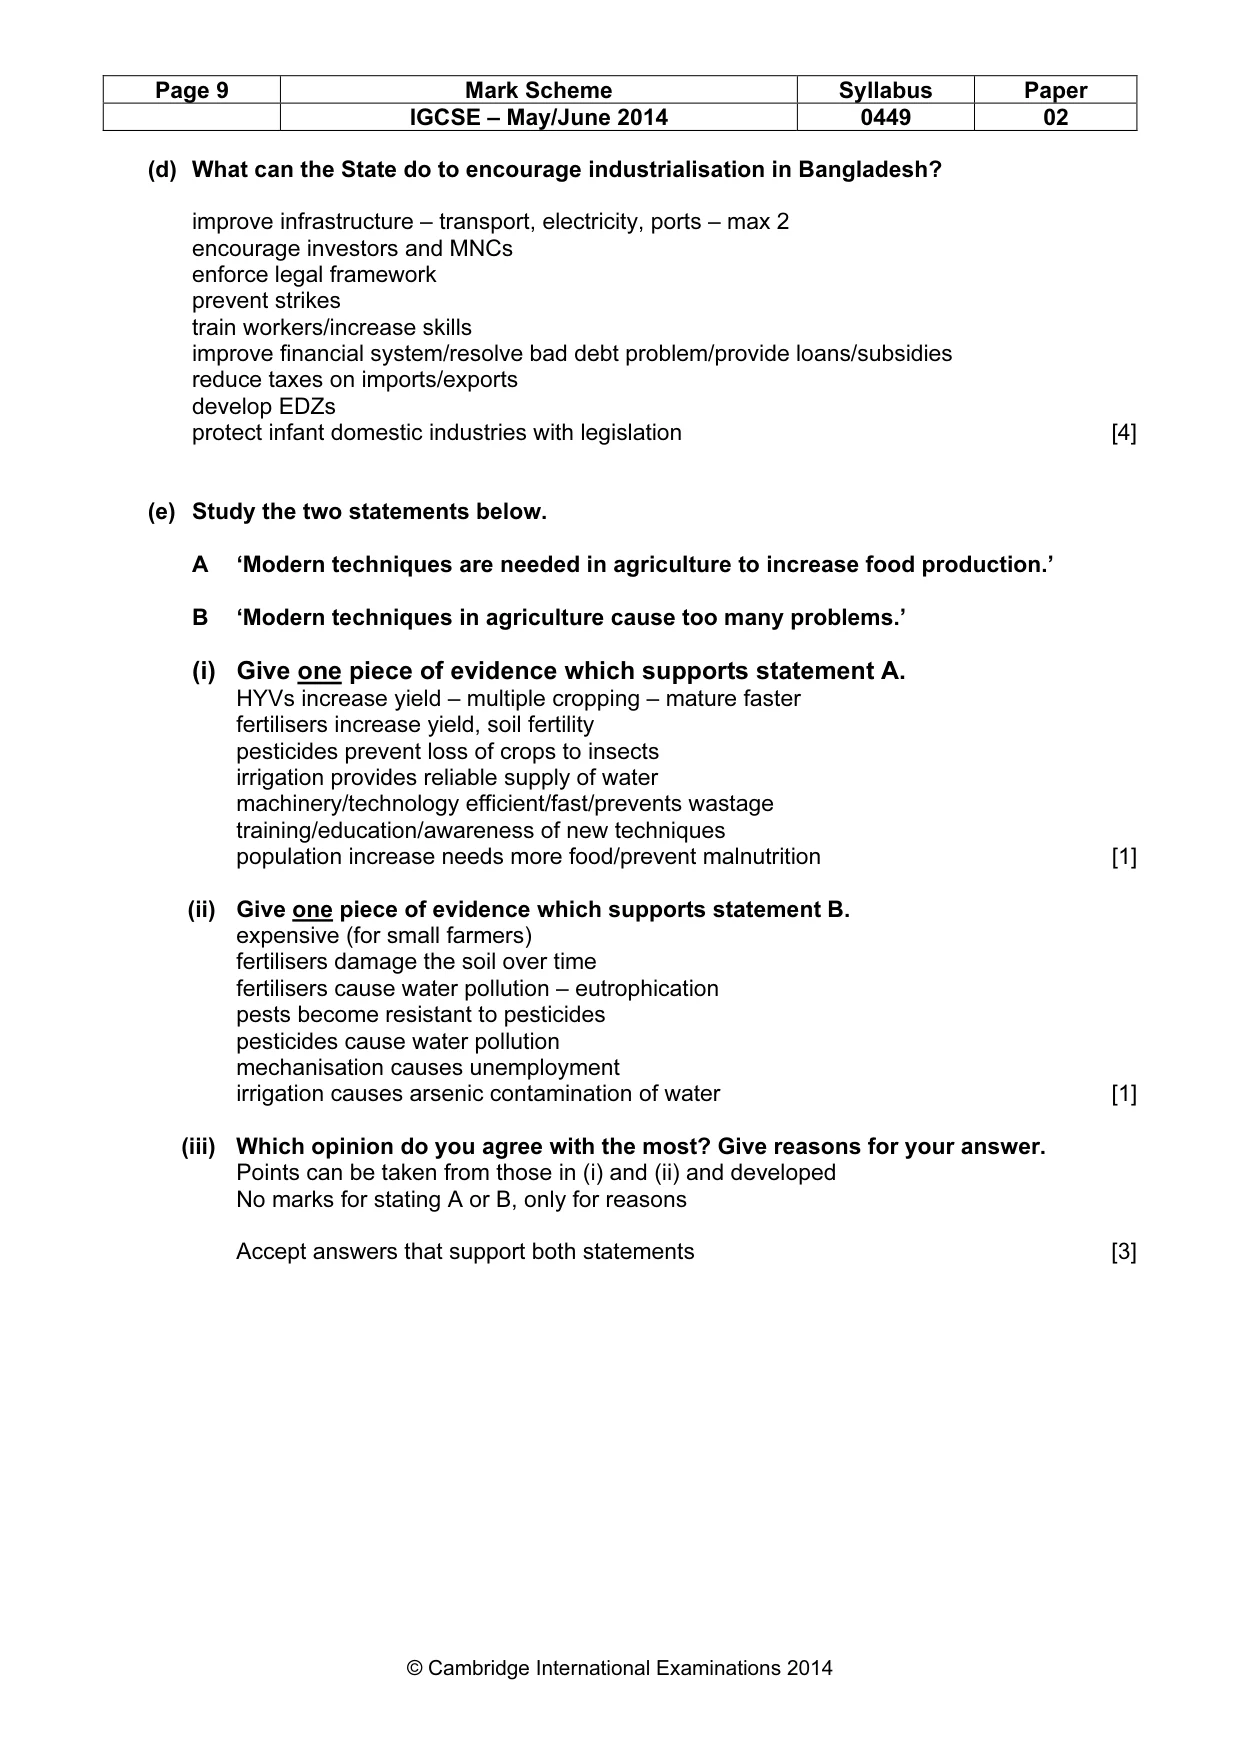
Mark scheme: 4 (a) (i) Study Fig. 8 which shows the main growing areas for three cash crops. Describe the distribution of the jute, sugar cane and tea growing areas. Jute – along main rivers, central area, small area in SW Sugar cane – to W, along western border/NW Tea – to E, higher areas /Sylhet/Chittagong 1 mark for each crop [3] (ii) Why is it important to grow cash crops? export earn foreign exchange/increase GDP raw materials for industry source of employment [2] (b) (i) Study Fig. 9 which shows the percentage change in acreage and production of three cash crops between 1997 and 2010. Complete the production graph using the figures below: sugar cane: – 40% tea: +13% 1 mark for each crop [2] (ii) Explain why it is difficult to increase the production of cash crops such as jute and sugar cane. demand/need for food crops more profitable to grow food low investment/no subsidies/e.g. of lack of investment (irrigation, land, fertiliser, etc.) low world demand for jute scarcity of land/pressure on land low world prices/low profit competition from other countries [4] (iii) Name two products made from jute carpets, bags, sacks, hessian cloth, rope, home textiles [2] (c) Read the article, Fig. 10, on Bangladesh’s glass industry. (i) Why has the glass industry in Bangladesh grown? increase in construction basic raw material/silica sand found in Bangladesh [1] (ii) Name two raw materials needed for the glass industry. silica sand and limestone [1] (iii) What provides the power for the glass industry? (natural) gas [1] IGCSE – May/June 2014 0449 02 (d) What can the State do to encourage industrialisation in Bangladesh? improve infrastructure – transport, electricity, ports – max 2 encourage investors and MNCs enforce legal framework prevent strikes train workers/increase skills improve financial system/resolve bad debt problem/provide loans/subsidies reduce taxes on imports/exports develop EDZs protect infant domestic industries with legislation [4] (e) Study the two statements below. A ‘Modern techniques are needed in agriculture to increase food production.’ B ‘Modern techniques in agriculture cause too many problems.’ (i) Give one piece of evidence which supports statement A. HYVs increase yield – multiple cropping – mature faster fertilisers increase yield, soil fertility pesticides prevent loss of crops to insects irrigation provides reliable supply of water machinery/technology efficient/fast/prevents wastage training/education/awareness of new techniques population increase needs more food/prevent malnutrition [1] (ii) Give one piece of evidence which supports statement B. expensive (for small farmers) fertilisers damage the soil over time fertilisers cause water pollution – eutrophication pests become resistant to pesticides pesticides cause water pollution mechanisation causes unemployment irrigation causes arsenic contamination of water [1] (iii) Which opinion do you agree with the most? Give reasons for your answer. Points can be taken from those in (i) and (ii) and developed No marks for stating A or B, only for reasons Accept answers that support both statements [3] IGCSE – May/June 2014 0449 02
Question 5
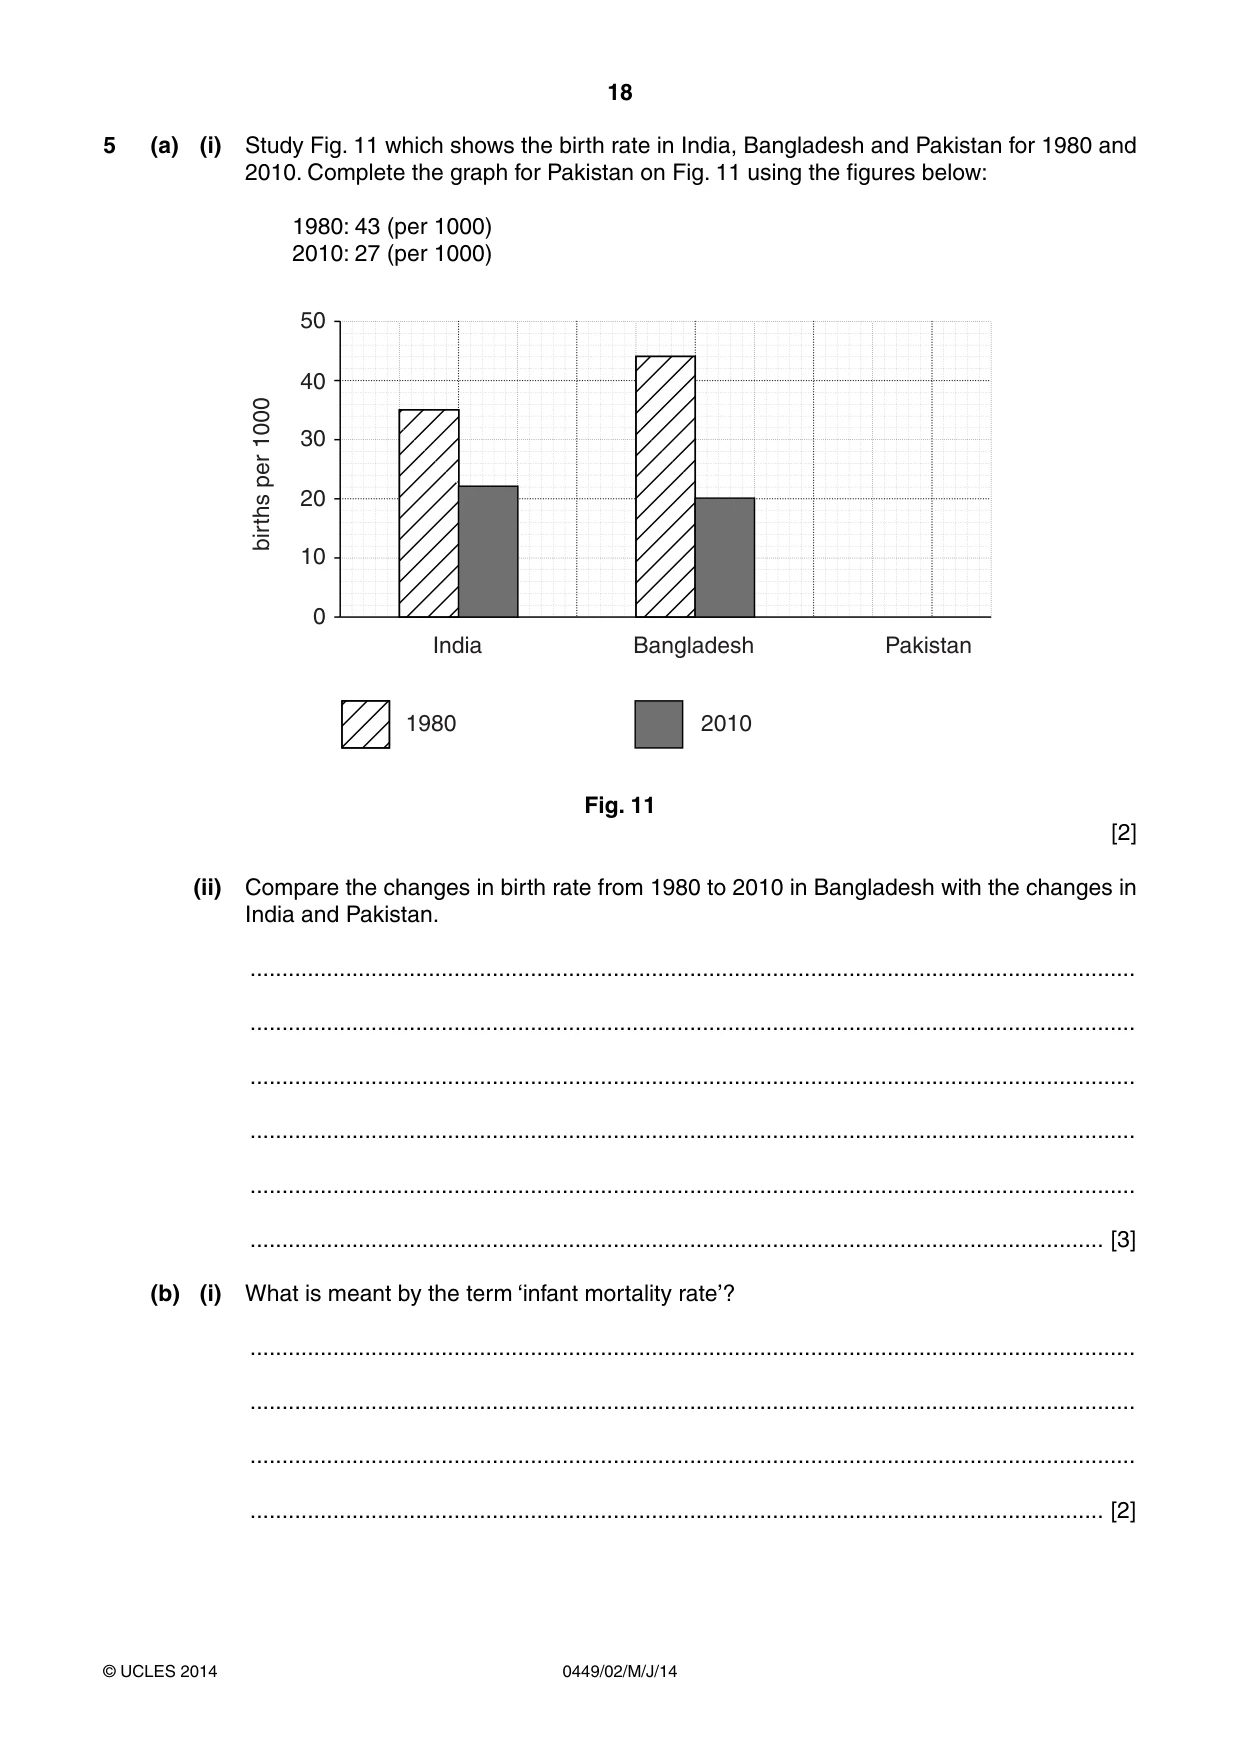
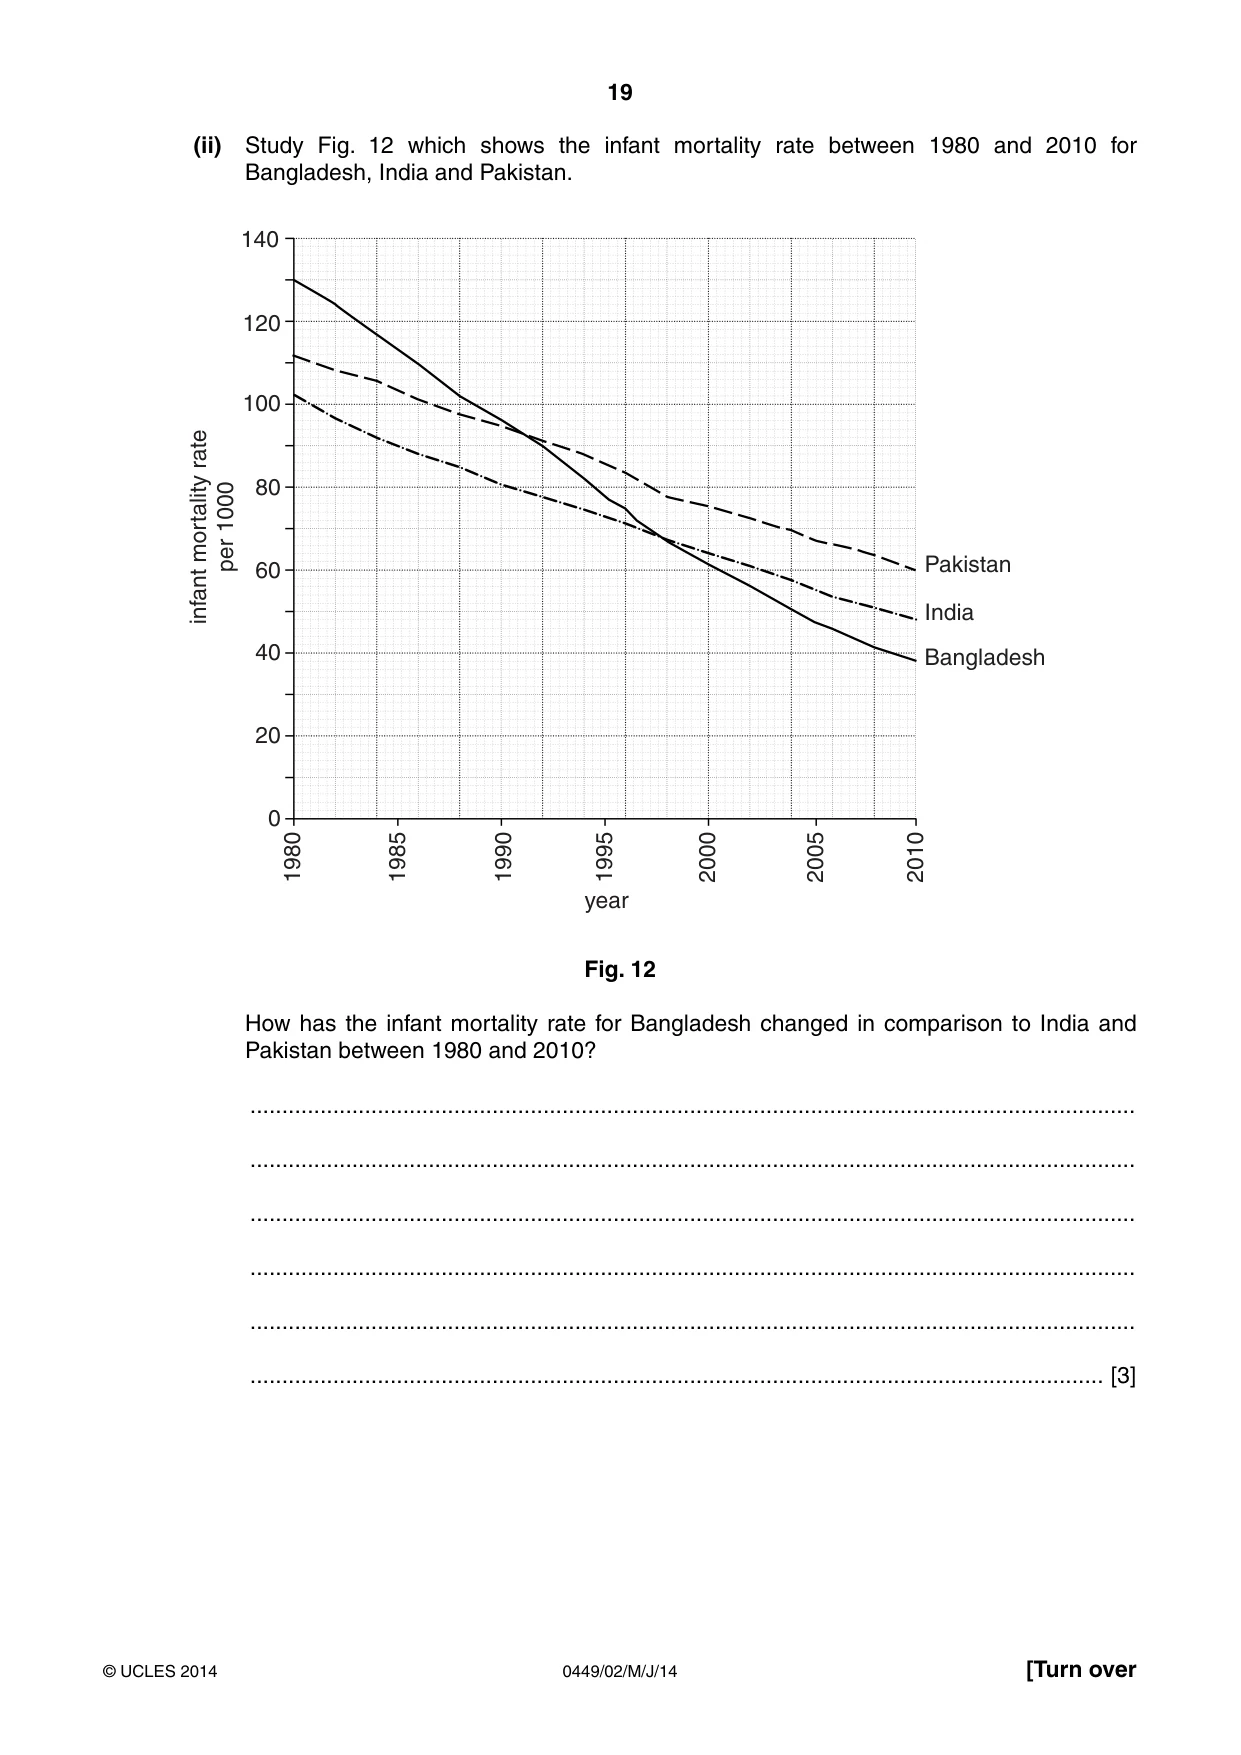
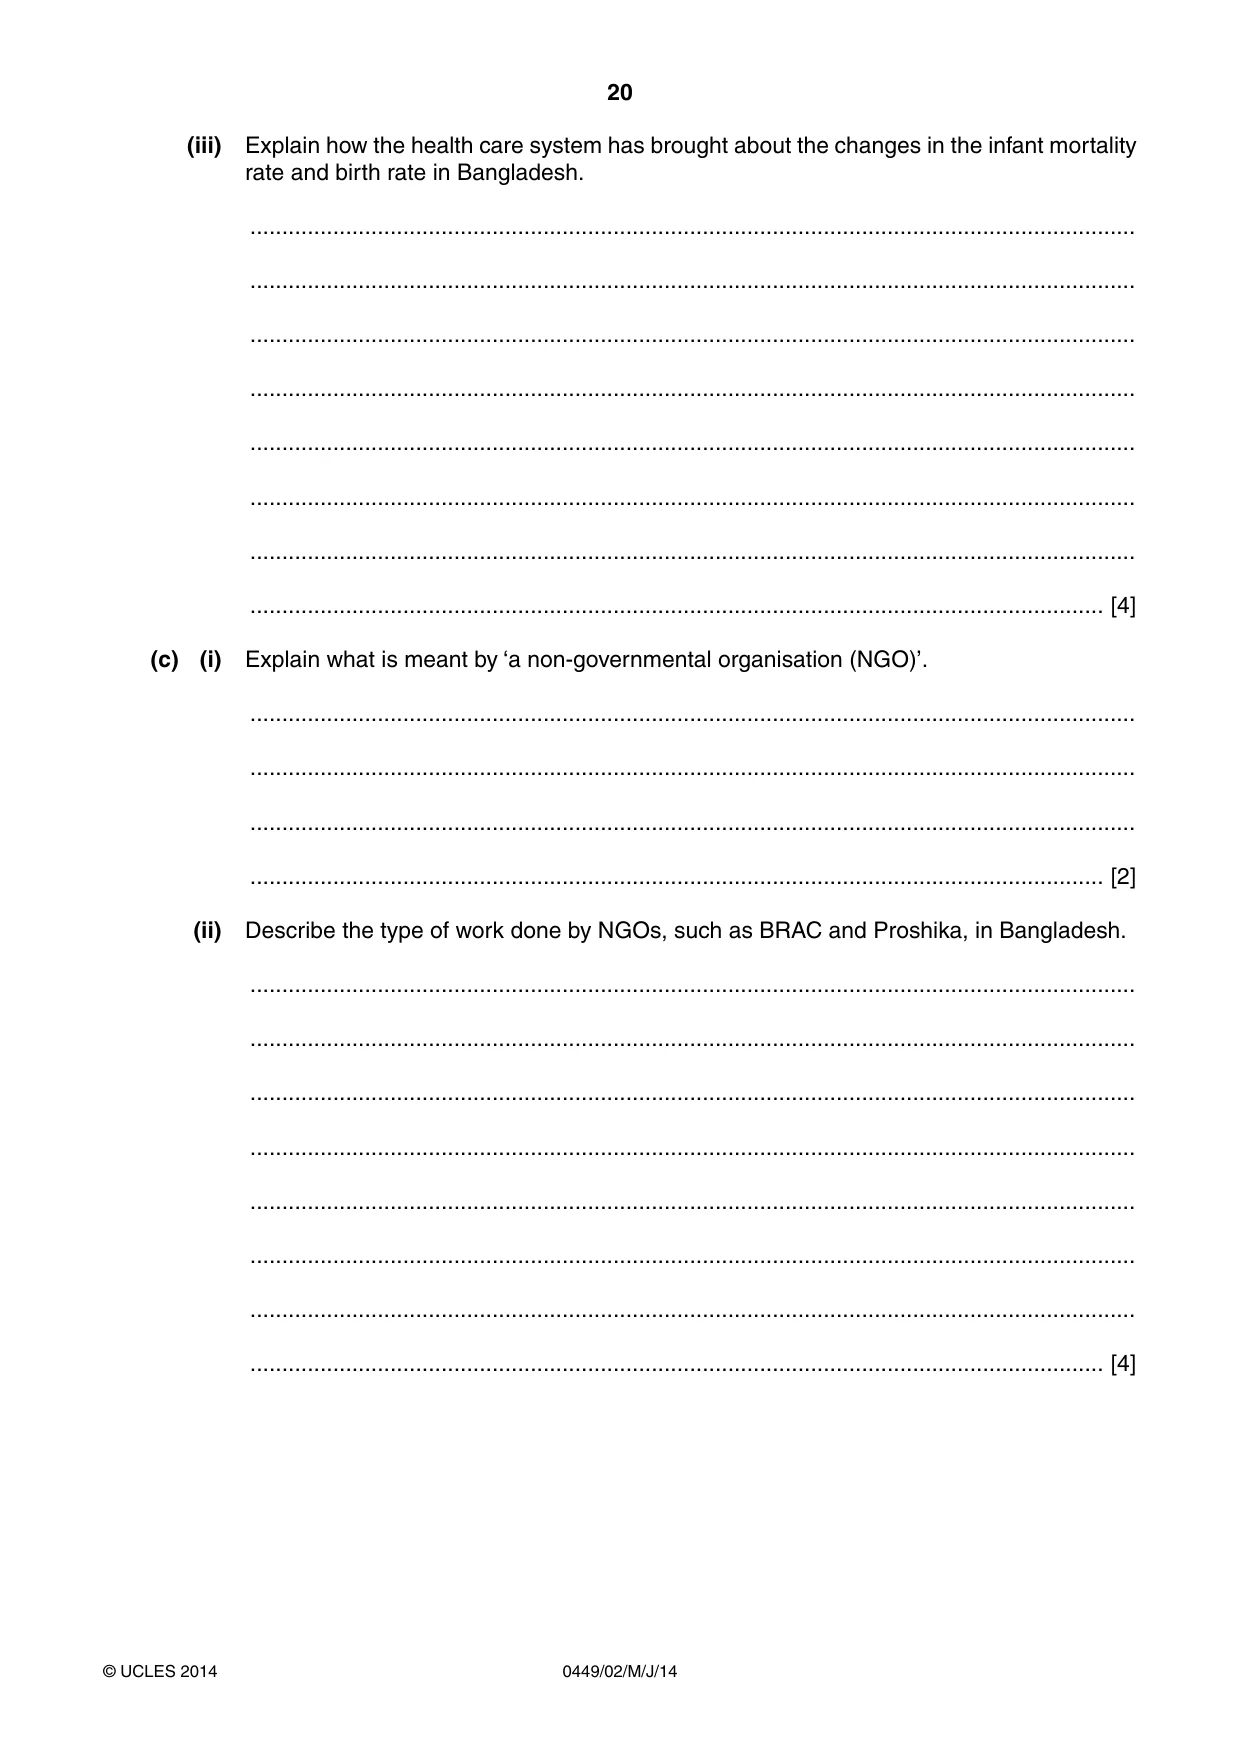
5 (a) (i) Study Fig. 11 which shows the birth rate in India, Bangladesh and Pakistan for 1980 and 2010. Complete the graph for Pakistan on Fig. 11 using the figures below: 1980: 43 (per 1000) 2010: 27 (per 1000) 50 40 1000 30 per births 20 10 0 India Bangladesh Pakistan 1980 2010 Fig. 11 [2] (ii) Compare the changes in birth rate from 1980 to 2010 in Bangladesh with the changes in India and Pakistan. ........................................................................................................................................... ........................................................................................................................................... ........................................................................................................................................... ........................................................................................................................................... ........................................................................................................................................... ...................................................................................................................................... [3] (b) (i) What is meant by the term ‘infant mortality rate’? ........................................................................................................................................... ........................................................................................................................................... ........................................................................................................................................... ...................................................................................................................................... [2] (ii) Study Fig. 12 which shows the infant mortality rate between 1980 and 2010 for Bangladesh, India and Pakistan. 140 120 100 rate 1000 80mortality per 60 Pakistan infant India 40 Bangladesh 20 0 1980 1985 1990 1995 2000 2005 2010 year Fig. 12 How has the infant mortality rate for Bangladesh changed in comparison to India and Pakistan between 1980 and 2010? ........................................................................................................................................... ........................................................................................................................................... ........................................................................................................................................... ........................................................................................................................................... ........................................................................................................................................... ...................................................................................................................................... [3] (iii) Explain how the health care system has brought about the changes in the infant mortality rate and birth rate in Bangladesh. ........................................................................................................................................... ........................................................................................................................................... ........................................................................................................................................... ........................................................................................................................................... ........................................................................................................................................... ........................................................................................................................................... ........................................................................................................................................... ...................................................................................................................................... [4] (c) (i) Explain what is meant by ‘a non-governmental organisation (NGO)’. ........................................................................................................................................... ........................................................................................................................................... ........................................................................................................................................... ...................................................................................................................................... [2] (ii) Describe the type of work done by NGOs, such as BRAC and Proshika, in Bangladesh. ........................................................................................................................................... ........................................................................................................................................... ........................................................................................................................................... ........................................................................................................................................... ........................................................................................................................................... ........................................................................................................................................... ........................................................................................................................................... ...................................................................................................................................... [4]
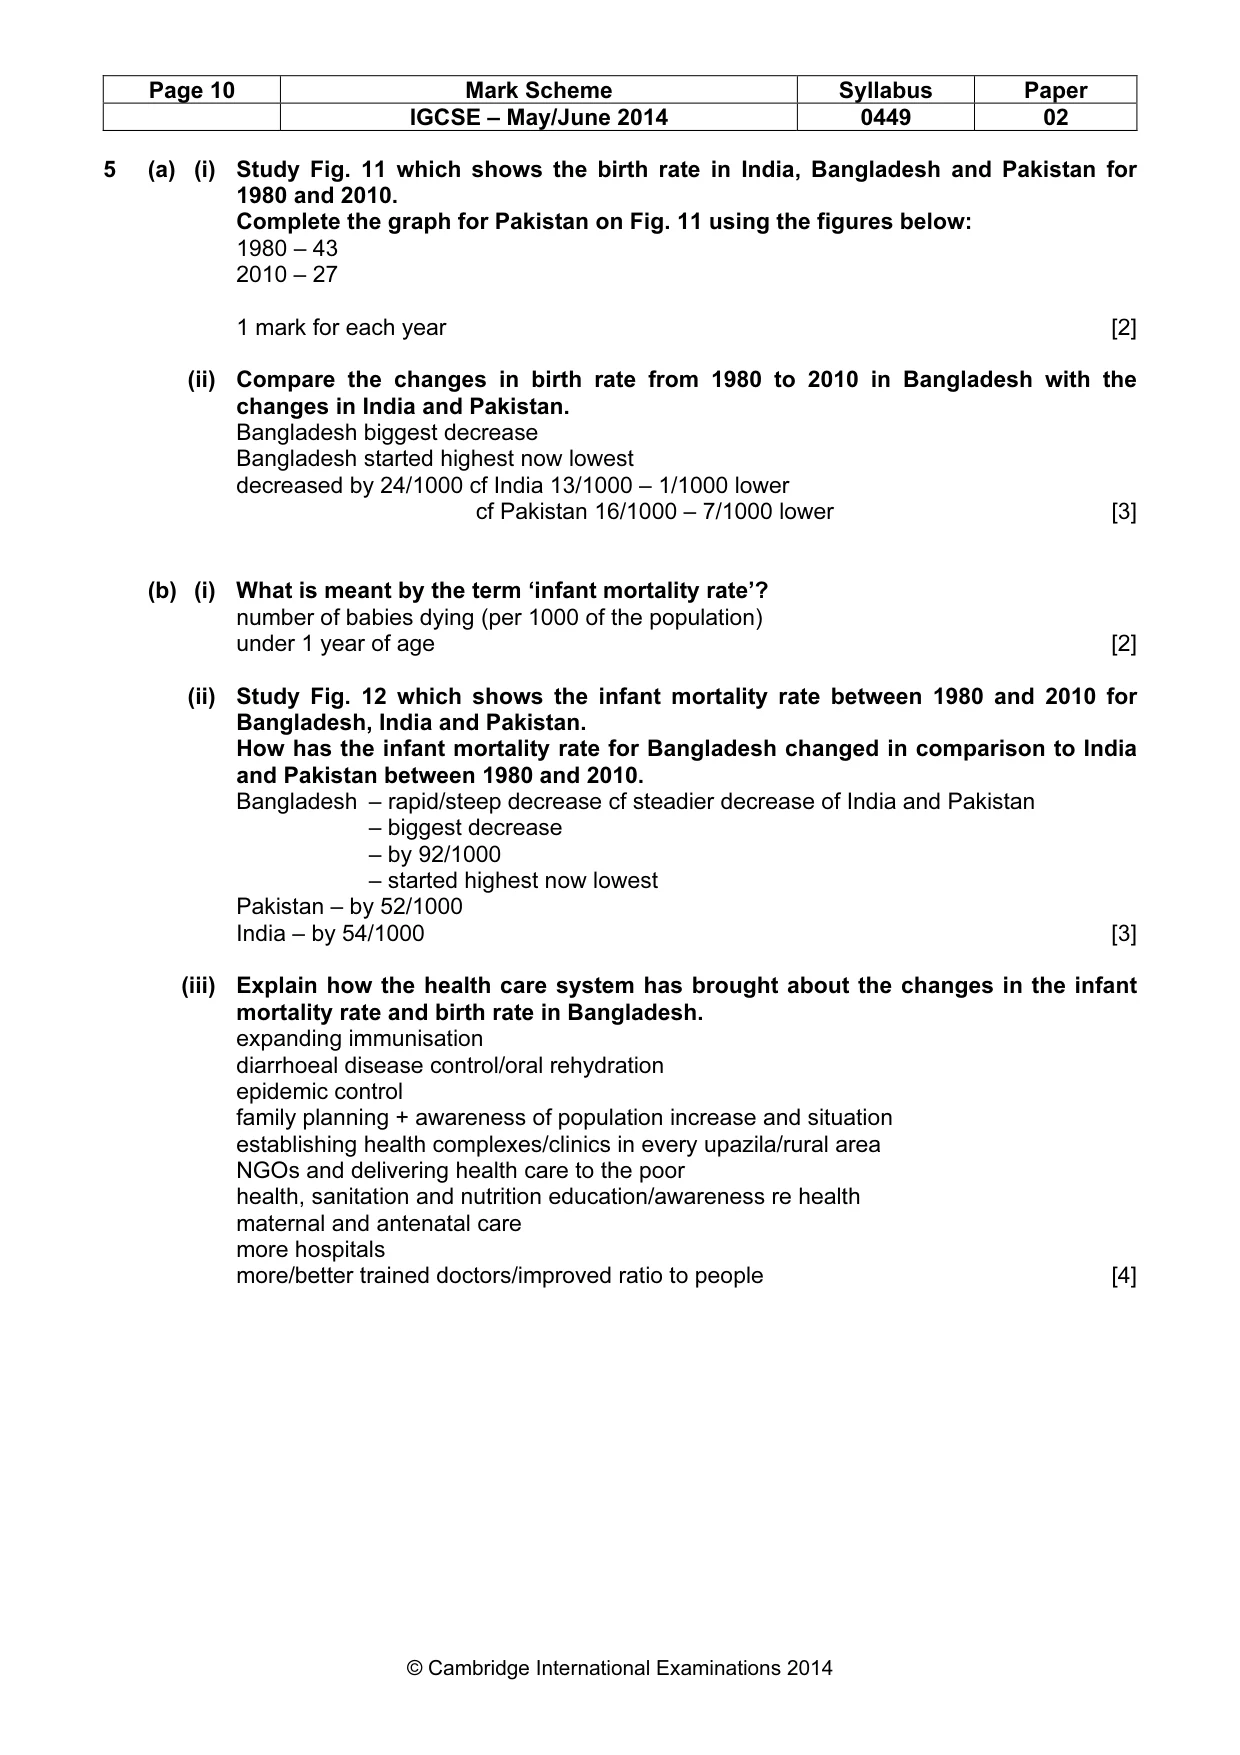
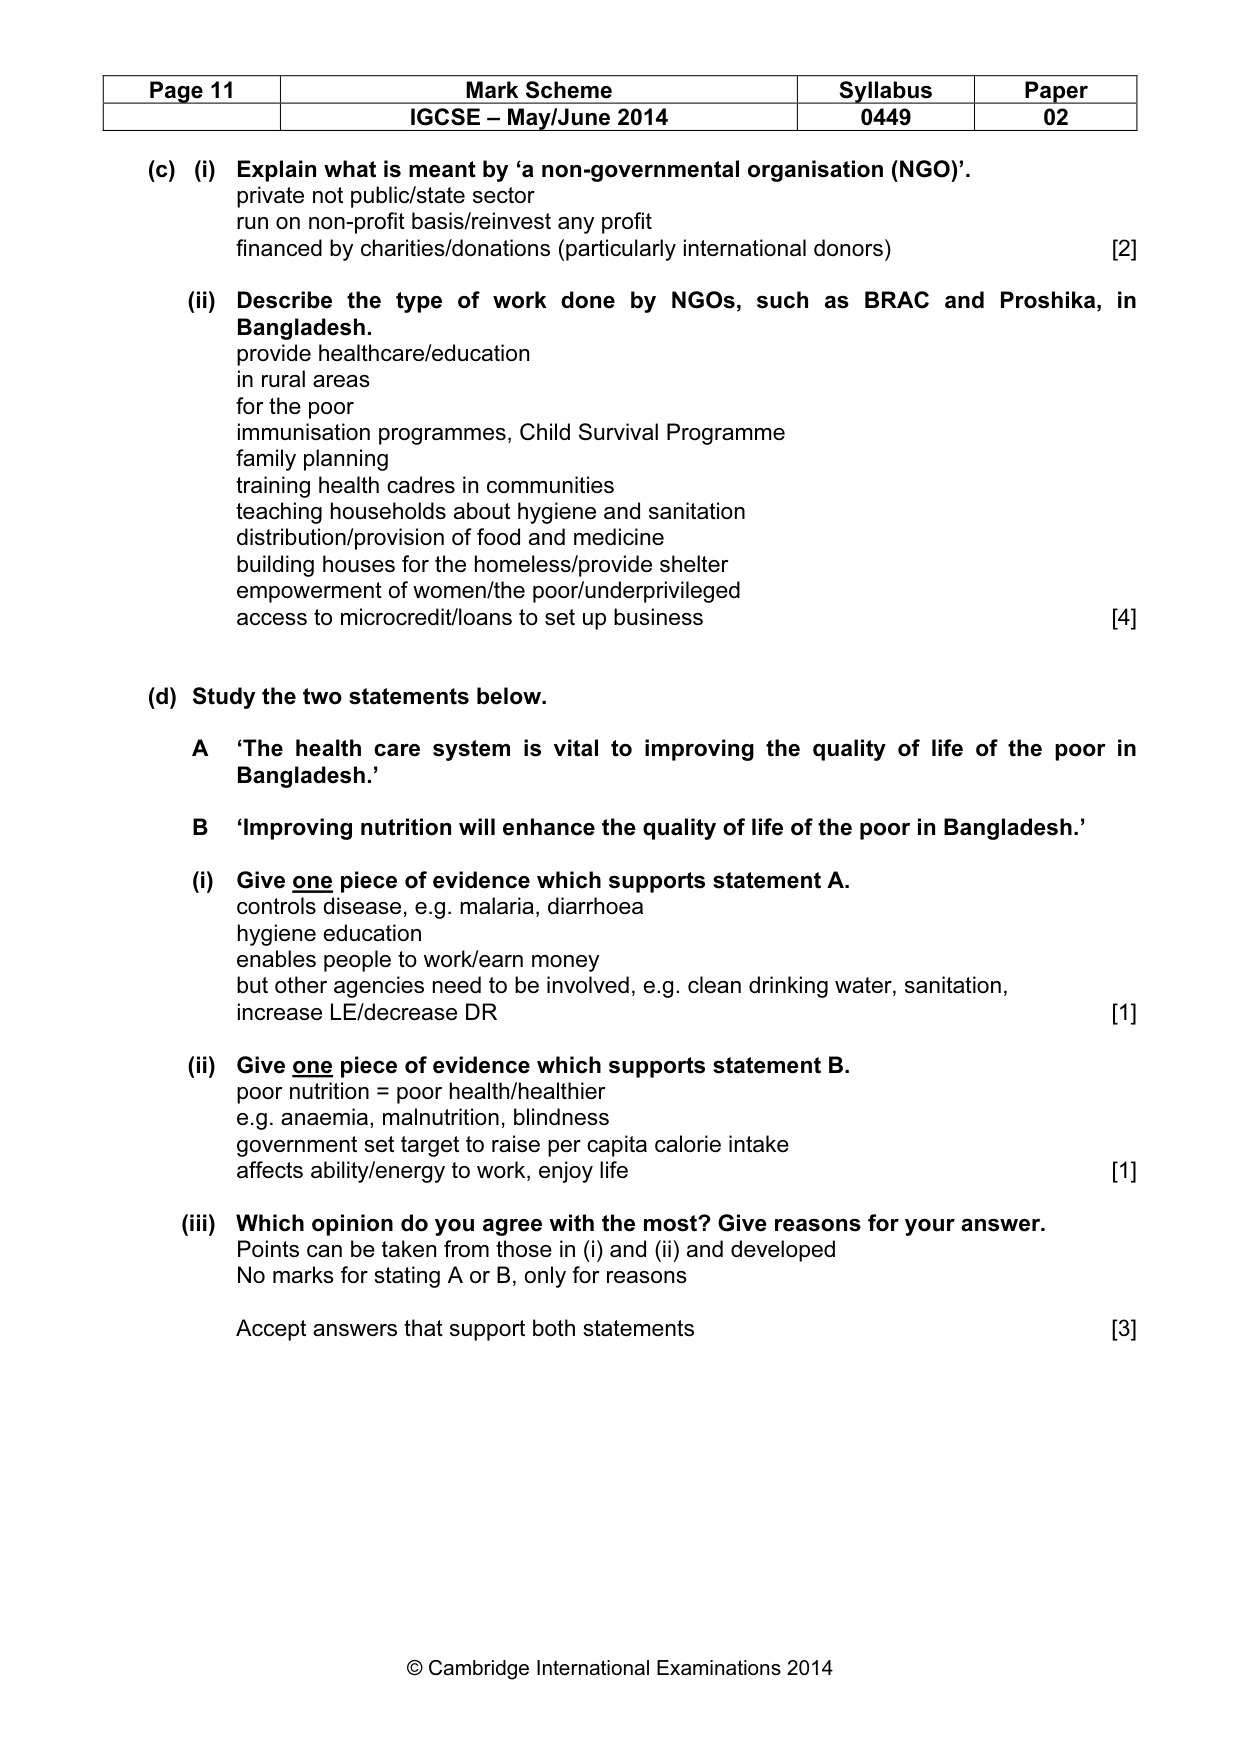
Mark scheme: 5 (a) (i) Study Fig. 11 which shows the birth rate in India, Bangladesh and Pakistan for 1980 and 2010. Complete the graph for Pakistan on Fig. 11 using the figures below: 1980 – 43 2010 – 27 1 mark for each year [2] (ii) Compare the changes in birth rate from 1980 to 2010 in Bangladesh with the changes in India and Pakistan. Bangladesh biggest decrease Bangladesh started highest now lowest decreased by 24/1000 cf India 13/1000 – 1/1000 lower decreased by 24/1000 cf Pakistan 16/1000 – 7/1000 lower [3] (b) (i) What is meant by the term ‘infant mortality rate’? number of babies dying (per 1000 of the population) under 1 year of age [2] (ii) Study Fig. 12 which shows the infant mortality rate between 1980 and 2010 for Bangladesh, India and Pakistan. How has the infant mortality rate for Bangladesh changed in comparison to India and Pakistan between 1980 and 2010. Bangladesh – rapid/steep decrease cf steadier decrease of India and Pakistan – biggest decrease h – by 92/1000 – started highest now lowest Pakistan – by 52/1000 India – by 54/1000 [3] (iii) Explain how the health care system has brought about the changes in the infant mortality rate and birth rate in Bangladesh. expanding immunisation diarrhoeal disease control/oral rehydration epidemic control family planning + awareness of population increase and situation establishing health complexes/clinics in every upazila/rural area NGOs and delivering health care to the poor health, sanitation and nutrition education/awareness re health maternal and antenatal care more hospitals more/better trained doctors/improved ratio to people [4] IGCSE – May/June 2014 0449 02 (c) (i) Explain what is meant by ‘a non-governmental organisation (NGO)’. private not public/state sector run on non-profit basis/reinvest any profit financed by charities/donations (particularly international donors) [2] (ii) Describe the type of work done by NGOs, such as BRAC and Proshika, in Bangladesh. provide healthcare/education in rural areas for the poor immunisation programmes, Child Survival Programme family planning training health cadres in communities teaching households about hygiene and sanitation distribution/provision of food and medicine building houses for the homeless/provide shelter empowerment of women/the poor/underprivileged access to microcredit/loans to set up business [4] (d) Study the two statements below. A ‘The health care system is vital to improving the quality of life of the poor in Bangladesh.’ B ‘Improving nutrition will enhance the quality of life of the poor in Bangladesh.’ (i) Give one piece of evidence which supports statement A. controls disease, e.g. malaria, diarrhoea hygiene education enables people to work/earn money but other agencies need to be involved, e.g. clean drinking water, sanitation, increase LE/decrease DR [1] (ii) Give one piece of evidence which supports statement B. poor nutrition = poor health/healthier e.g. anaemia, malnutrition, blindness government set target to raise per capita calorie intake affects ability/energy to work, enjoy life [1] (iii) Which opinion do you agree with the most? Give reasons for your answer. Points can be taken from those in (i) and (ii) and developed No marks for stating A or B, only for reasons Accept answers that support both statements [3]
What you needed in this session
Cambridge’s own grade thresholds for 2014 May/June, Paper 2 · Variant 1. A higher threshold means an easier paper — the bar moves with how the cohort did.