Cambridge IGCSE Bangladesh Studies 0449 — 2013 May/June Paper 2 · Variant 1
0449/21/M/J/13 · 5 questions · 75 marks · ≈84 min
The question paper and its mark scheme, free to read here and free to download. This is Cambridge’s own paper, exactly as it was sat.
Question paper24 pages












Mark scheme11 pages
Answers below. Sit the paper first if you are practising.

Questions as text
Q1 · Study the map of Bangladesh (Fig
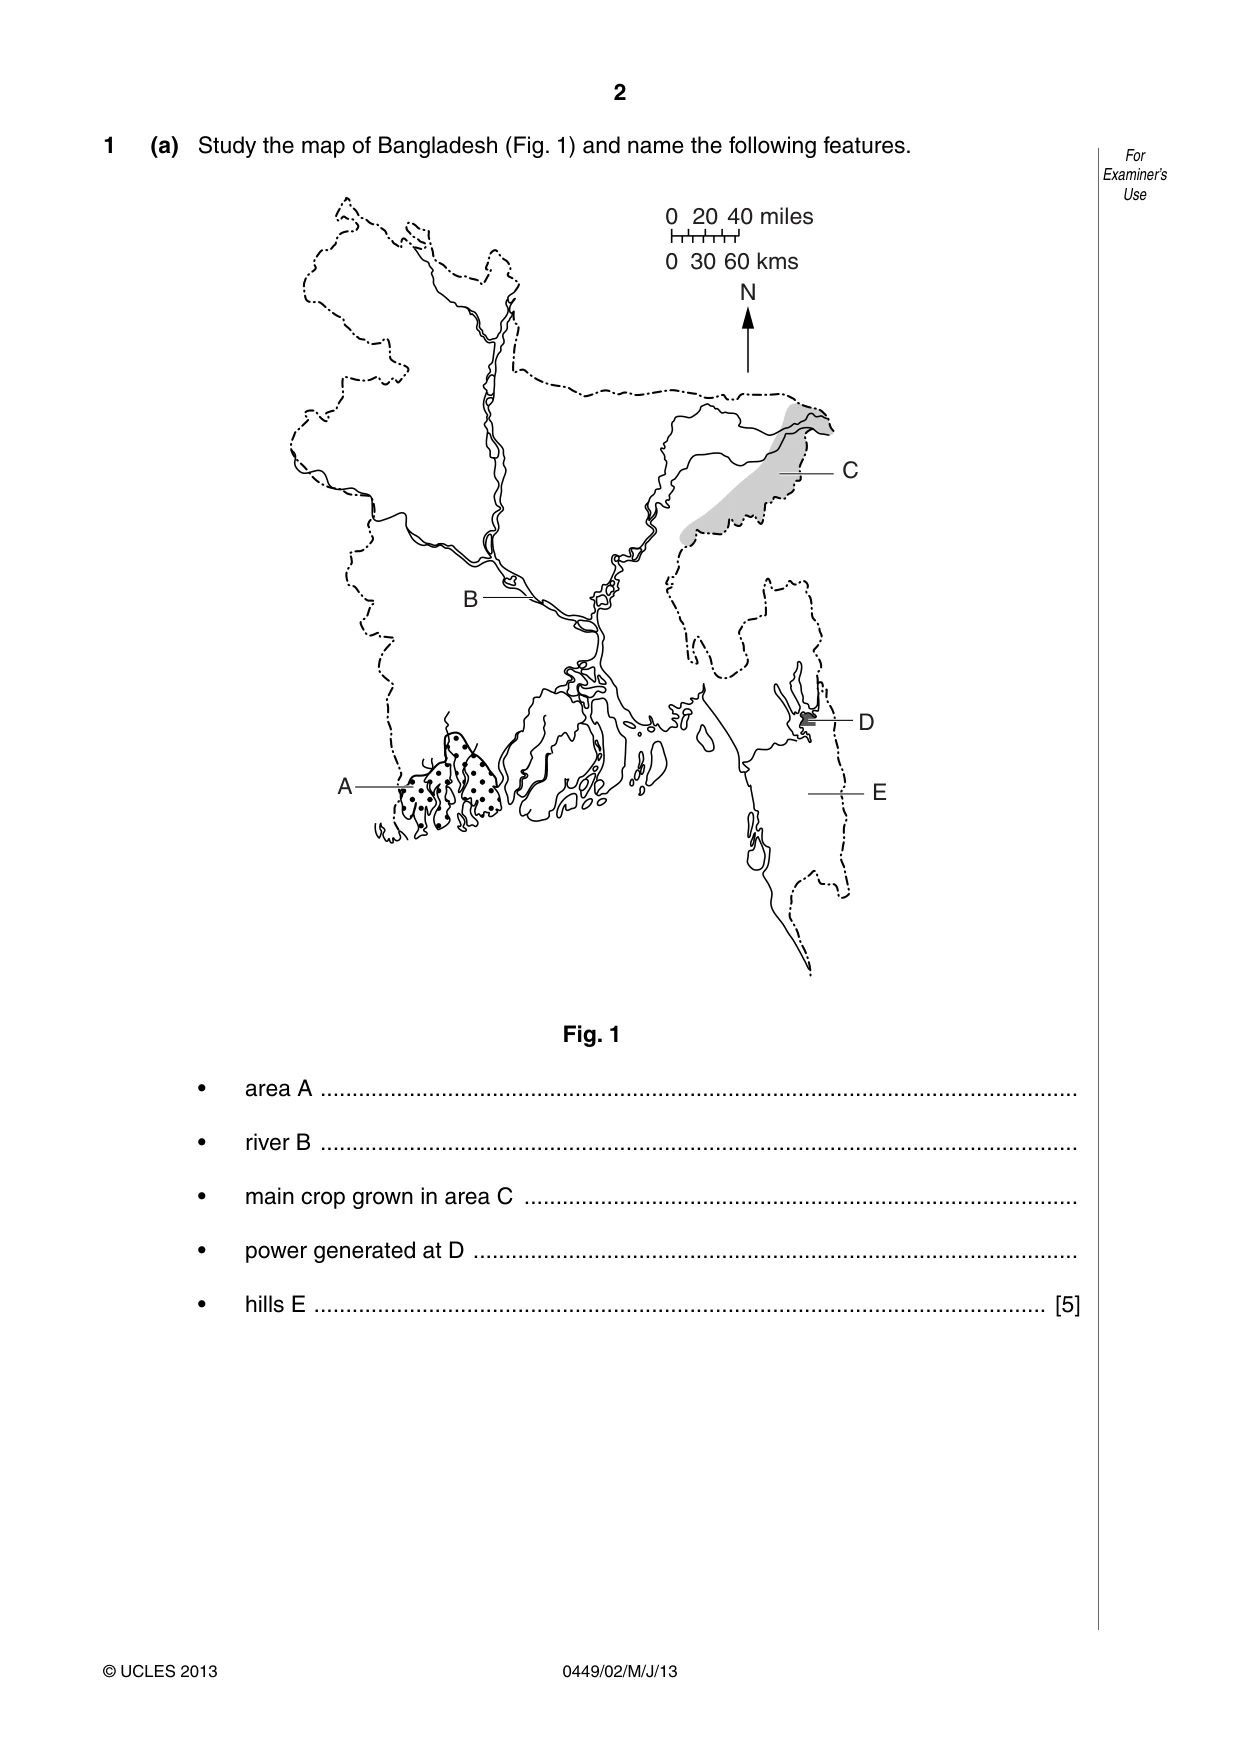
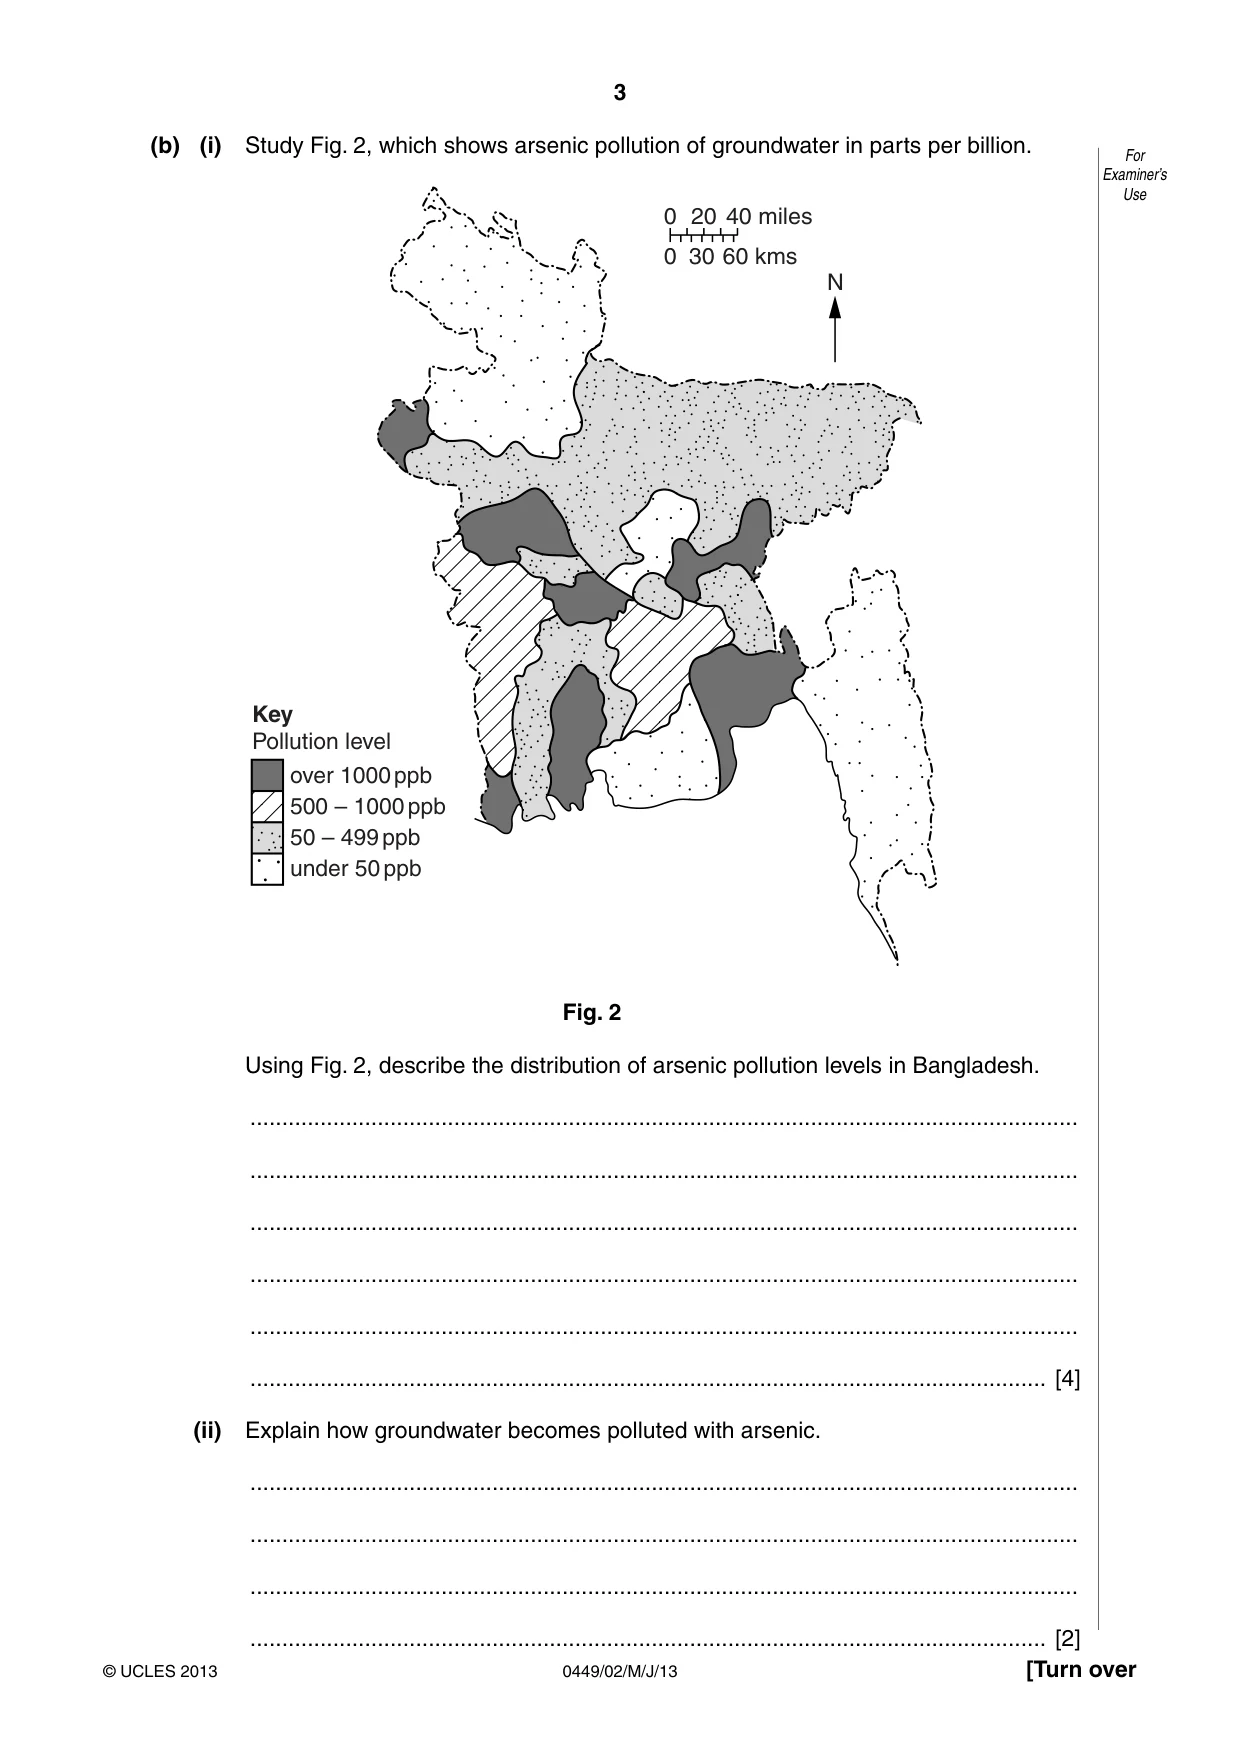
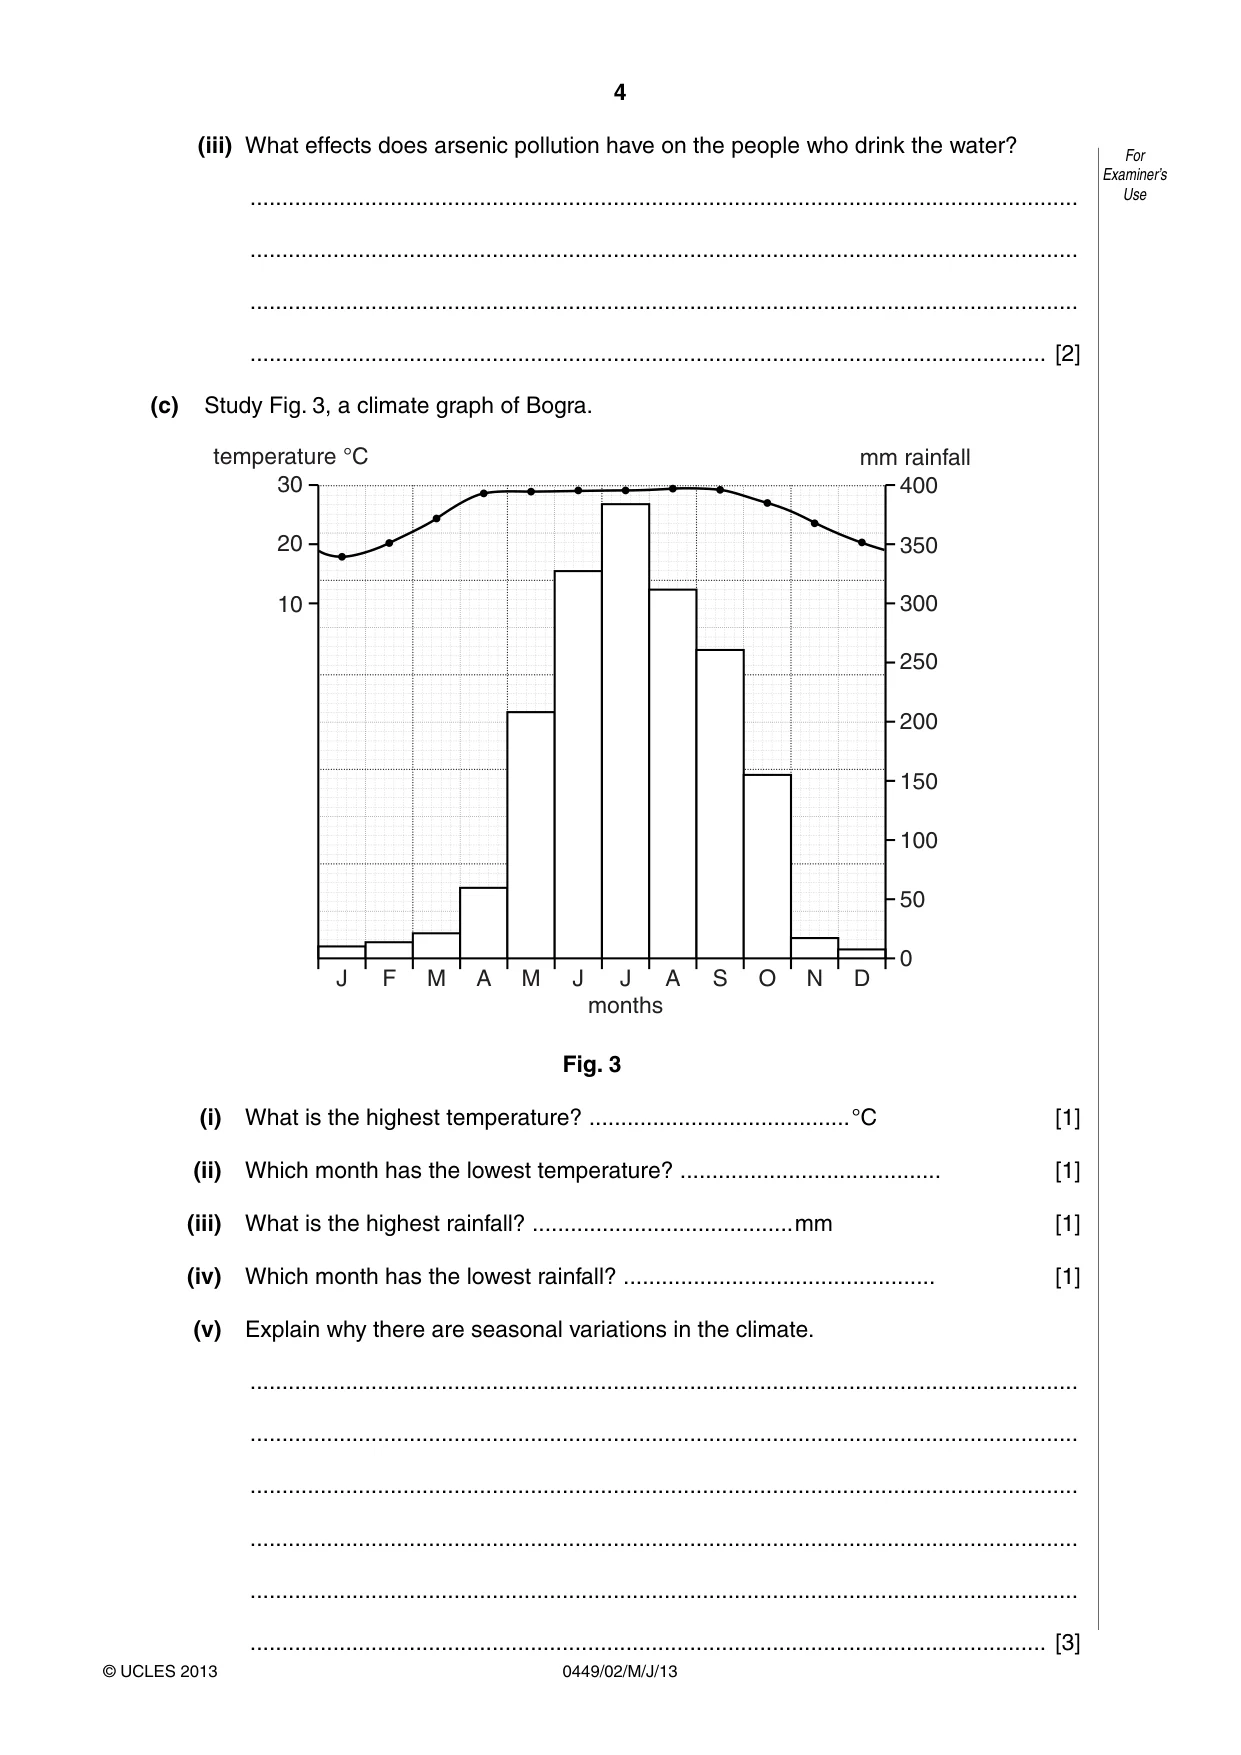
1 (a) Study the map of Bangladesh (Fig. 1) and name the following features. 0 20 40 miles 0 30 60 kms N C B D A E Fig. 1 • area A ....................................................................................................................... • river B ....................................................................................................................... • main crop grown in area C ....................................................................................... • power generated at D ............................................................................................... • hills E ................................................................................................................... [5] (b) (i) Study Fig. 2, which shows arsenic pollution of groundwater in parts per billion. 0 20 40 miles 0 30 60 kms N Key Pollution level over 1000 ppb 500 – 1000 ppb 50 – 499 ppb under 50 ppb Fig. 2 Using Fig. 2, describe the distribution of arsenic pollution levels in Bangladesh. .................................................................................................................................. .................................................................................................................................. .................................................................................................................................. .................................................................................................................................. .................................................................................................................................. ............................................................................................................................. [4] (ii) Explain how groundwater becomes polluted with arsenic. .................................................................................................................................. .................................................................................................................................. .................................................................................................................................. ............................................................................................................................. [2] (iii) What effects does arsenic pollution have on the people who drink the water? .................................................................................................................................. .................................................................................................................................. .................................................................................................................................. ............................................................................................................................. [2] (c) Study Fig. 3, a climate graph of Bogra. temperature °C mm rainfall 30 400 20 350 10 300 250 200 150 100 50 0 J F M A M J J A S O N D months Fig. 3 (i) What is the highest temperature? ......................................... °C [1] (ii) Which month has the lowest temperature? ......................................... [1] (iii) What is the highest rainfall? ......................................... mm [1] (iv) Which month has the lowest rainfall? ................................................. [1] (v) Explain why there are seasonal variations in the climate. .................................................................................................................................. .................................................................................................................................. .................................................................................................................................. .................................................................................................................................. .................................................................................................................................. ............................................................................................................................. [3] (d) Study the two statements below. A ‘The climate of Bangladesh is ideal for growing crops.’ B ‘Many problems are caused for farmers by Bangladesh’s climate.’ (i) Give one piece of evidence which supports statement A. .................................................................................................................................. ............................................................................................................................. [1] (ii) Give one piece of evidence which supports statement B. .................................................................................................................................. ............................................................................................................................. [1] (iii) Which statement do you agree with the most? Give reasons for your answer. .................................................................................................................................. .................................................................................................................................. .................................................................................................................................. .................................................................................................................................. .................................................................................................................................. ............................................................................................................................. [3] [Total: 25]
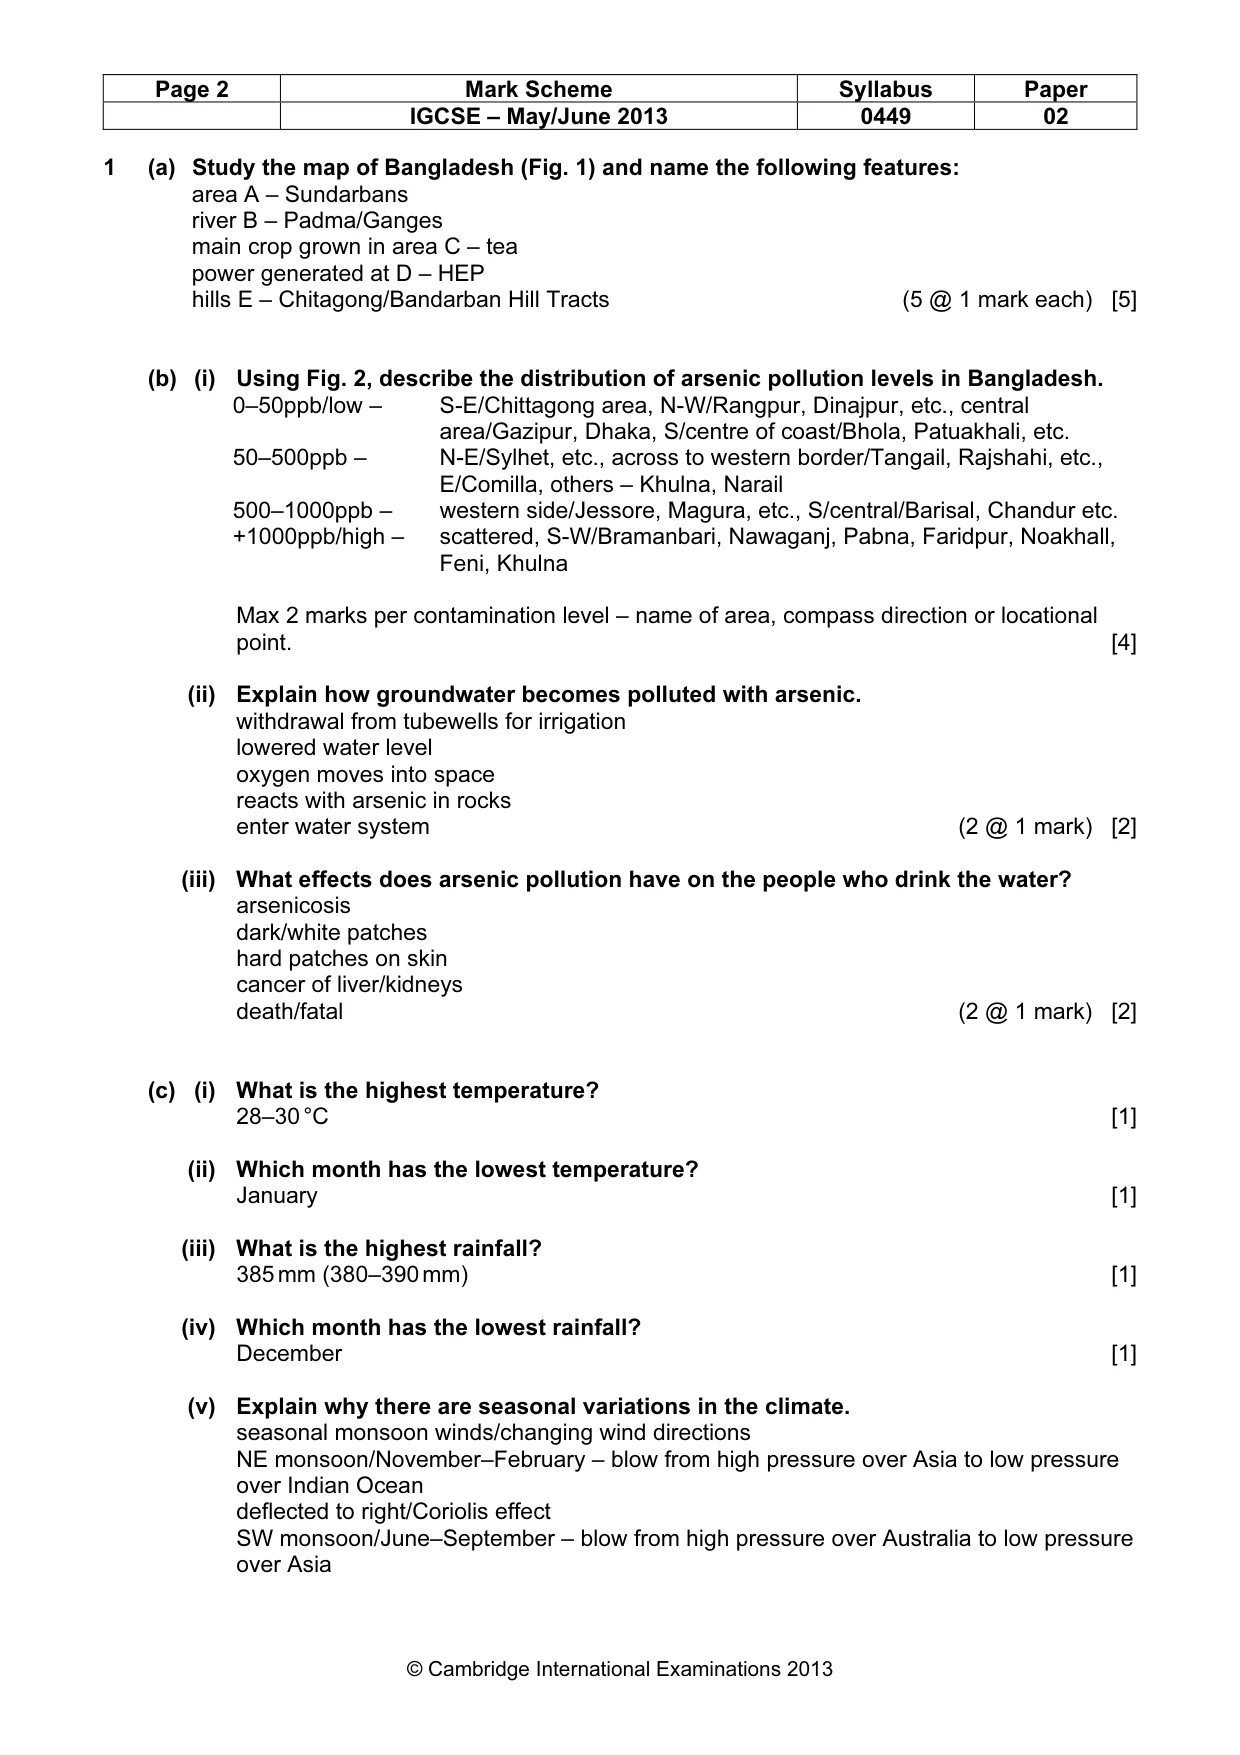
Mark scheme: 1 (a) Study the map of Bangladesh (Fig. 1) and name the following features: area A – Sundarbans river B – Padma/Ganges main crop grown in area C – tea power generated at D – HEP hills E – Chitagong/Bandarban Hill Tracts (5 @ 1 mark each) [5] (b) (i) Using Fig. 2, describe the distribution of arsenic pollution levels in Bangladesh. 0–50ppb/low – S-E/Chittagong area, N-W/Rangpur, Dinajpur, etc., central area/Gazipur, Dhaka, S/centre of coast/Bhola, Patuakhali, etc. 50–500ppb – N-E/Sylhet, etc., across to western border/Tangail, Rajshahi, etc., E/Comilla, others – Khulna, Narail 500–1000ppb – western side/Jessore, Magura, etc., S/central/Barisal, Chandur etc. +1000ppb/high – scattered, S-W/Bramanbari, Nawaganj, Pabna, Faridpur, Noakhall, Feni, Khulna Max 2 marks per contamination level – name of area, compass direction or locational point. [4] (ii) Explain how groundwater becomes polluted with arsenic. withdrawal from tubewells for irrigation lowered water level oxygen moves into space reacts with arsenic in rocks enter water system (2 @ 1 mark) [2] (iii) What effects does arsenic pollution have on the people who drink the water? arsenicosis dark/white patches hard patches on skin cancer of liver/kidneys death/fatal (2 @ 1 mark) [2] (c) (i) What is the highest temperature? 28–30 °C [1] (ii) Which month has the lowest temperature? January [1] (iii) What is the highest rainfall? 385 mm (380–390 mm) [1] (iv) Which month has the lowest rainfall? December [1] (v) Explain why there are seasonal variations in the climate. seasonal monsoon winds/changing wind directions NE monsoon/November–February – blow from high pressure over Asia to low pressure over Indian Ocean deflected to right/Coriolis effect SW monsoon/June–September – blow from high pressure over Australia to low pressure over Asia IGCSE – May/June 2013 0449 02 pick up moisture from sea/onshore winds (3 @ 1 mark) [3] (d) (i) A ‘The climate of Bangladesh is ideal for growing crops.’ B ‘Many problems are caused for farmers by Bangladesh’s climate.’ Give one piece of evidence which supports statement A. Must have a link to the growing of crops warm temperatures for sowing length of growing season monsoon rain/plentiful rainfall for germination/growing sunny spells for ripening dry spell for harvesting very productive/list of crops that grow well [1] (ii) Give one piece of evidence which supports statement B. flooding caused by heavy monsoon rains/excessive rainfall damages crop washes away fertile soil drought/dry period scarcity of surfaced water high temperatures – melts snows in mountains = flooding [1] (iii) Which statement do you agree with the most? Give reasons for your answer. Points can be taken from those in (i) and (ii) and developed. No marks for stating A or B, only for reasons Accept answers that support both statements [3] [Total: 25] IGCSE – May/June 2013 0449 02
Q2 · Study Photograph A on the Insert, which is a satellite image of part of the Padma…
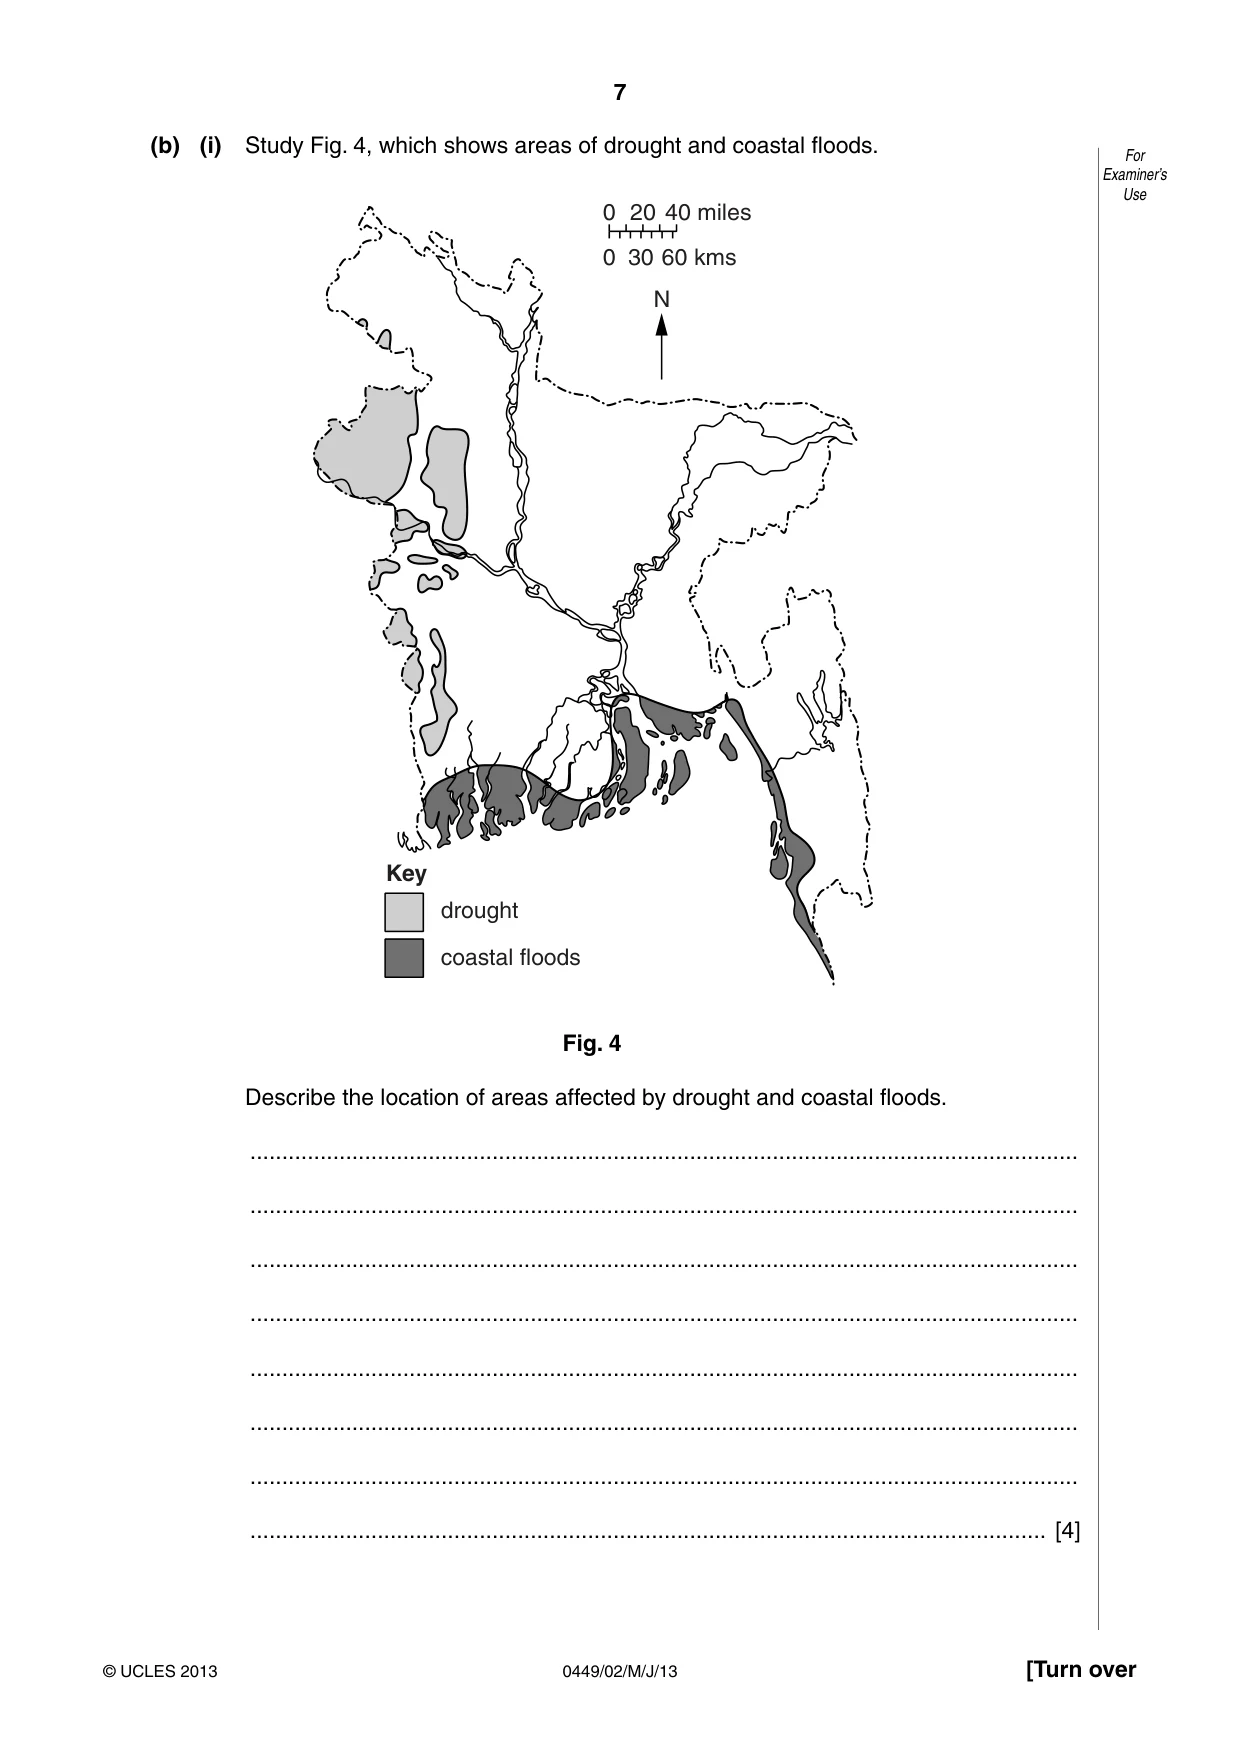
2 (a) (i) Study Photograph A on the Insert, which is a satellite image of part of the Padma (Ganges) delta. Describe the river features seen in the photograph. .................................................................................................................................. .................................................................................................................................. .................................................................................................................................. .................................................................................................................................. .................................................................................................................................. .................................................................................................................................. .................................................................................................................................. ............................................................................................................................. [4] (ii) Explain how a delta, such as the Padma (Ganges), is formed. .................................................................................................................................. .................................................................................................................................. .................................................................................................................................. .................................................................................................................................. .................................................................................................................................. .................................................................................................................................. .................................................................................................................................. ............................................................................................................................. [4] (b) (i) Study Fig. 4, which shows areas of drought and coastal floods. 0 20 40 miles 0 30 60 kms N Key drought coastal floods Fig. 4 Describe the location of areas affected by drought and coastal floods. .................................................................................................................................. .................................................................................................................................. .................................................................................................................................. .................................................................................................................................. .................................................................................................................................. .................................................................................................................................. .................................................................................................................................. ............................................................................................................................. [4] (ii) Explain how coastal floods are caused. .................................................................................................................................. .................................................................................................................................. .................................................................................................................................. .................................................................................................................................. .................................................................................................................................. .................................................................................................................................. .................................................................................................................................. ............................................................................................................................. [4] (iii) What can people and organisations do to limit the damage caused by coastal floods? .................................................................................................................................. .................................................................................................................................. .................................................................................................................................. .................................................................................................................................. .................................................................................................................................. .................................................................................................................................. .................................................................................................................................. ............................................................................................................................. [4] (c) Study the two statements below. A ‘Climate change is causing heavier and less reliable rainfall.’ B ‘Climate change is causing less rainfall.’ (i) Give one piece of evidence which supports statement A. .................................................................................................................................. ............................................................................................................................. [1] (ii) Give one piece of evidence which supports statement B. .................................................................................................................................. ............................................................................................................................. [1] (iii) In your opinion, which pattern of climate change poses the greater threat to Bangladesh, A or B? Give reasons for your answer. .................................................................................................................................. .................................................................................................................................. .................................................................................................................................. .................................................................................................................................. .................................................................................................................................. ............................................................................................................................. [3] [Total: 25]
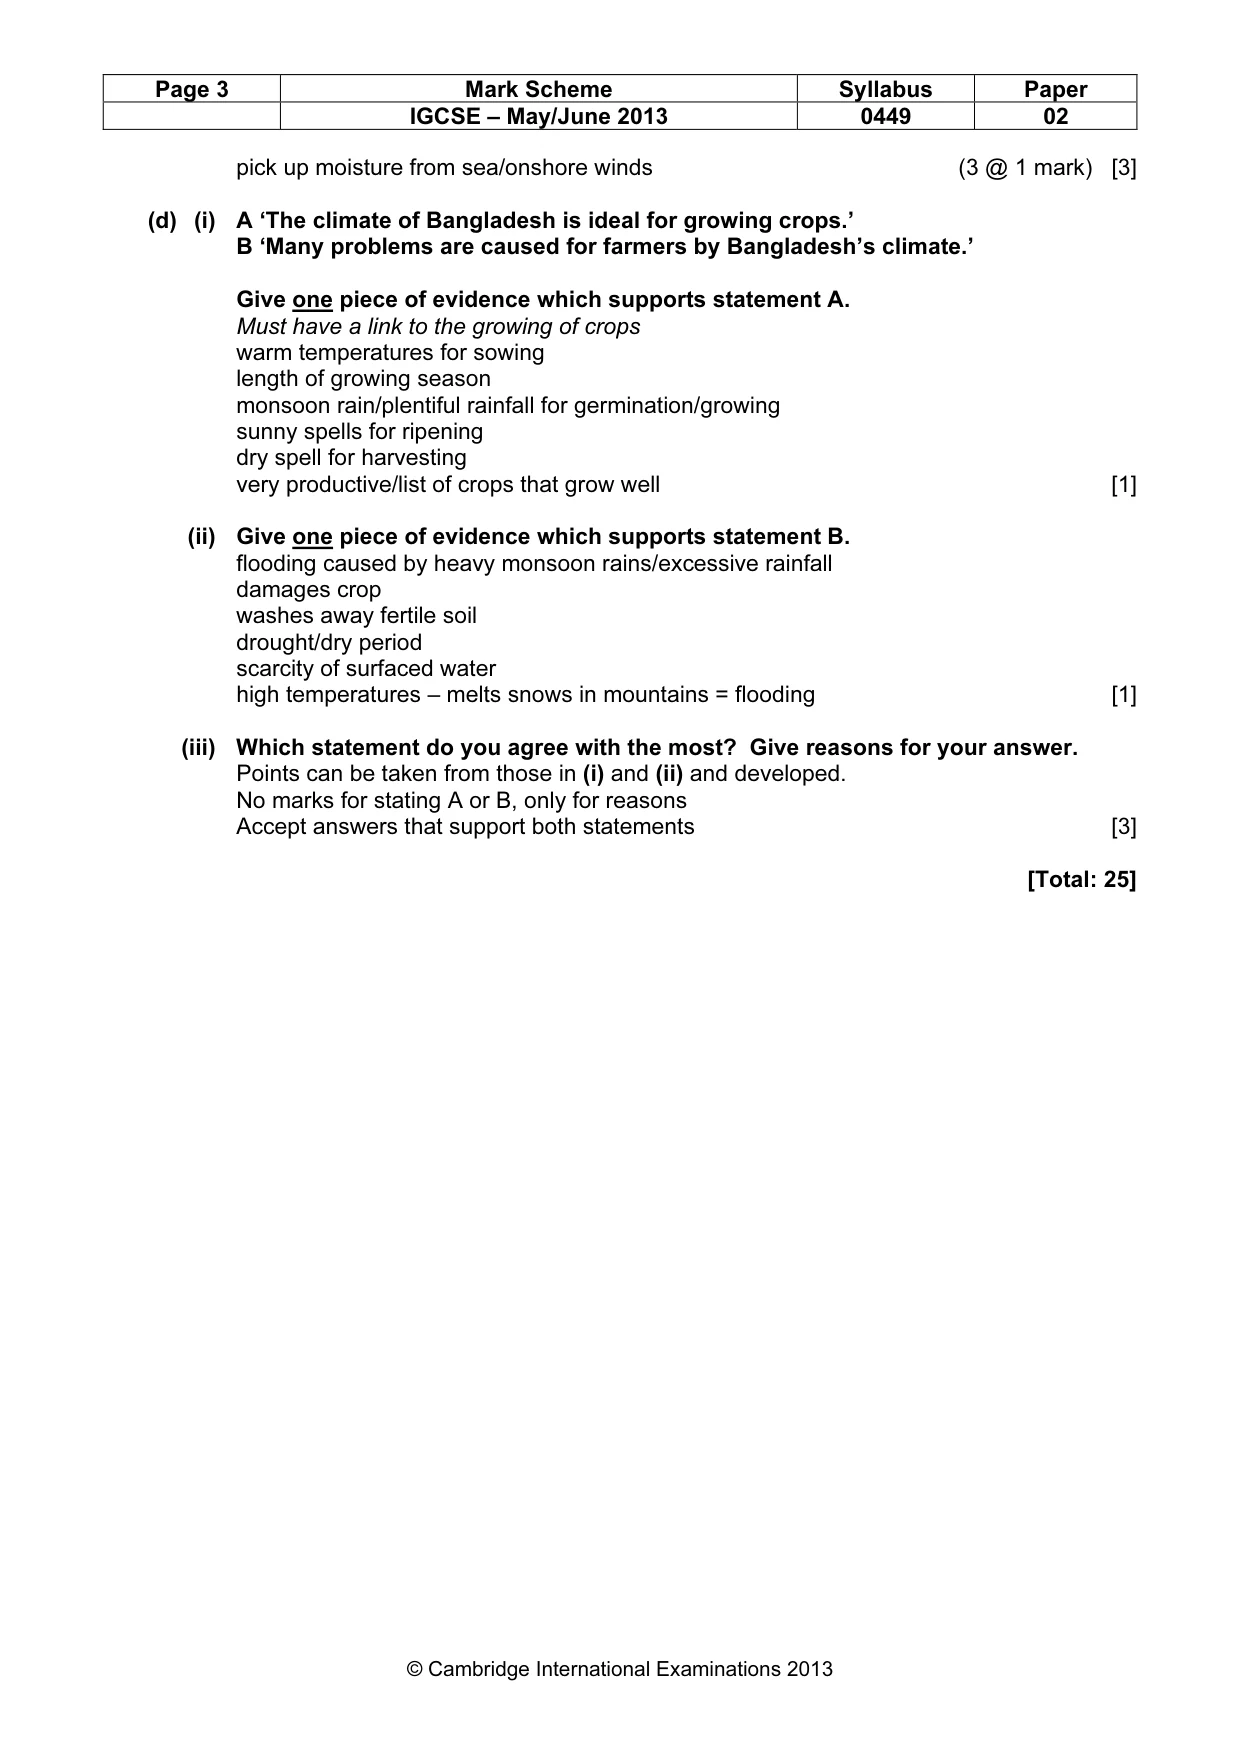
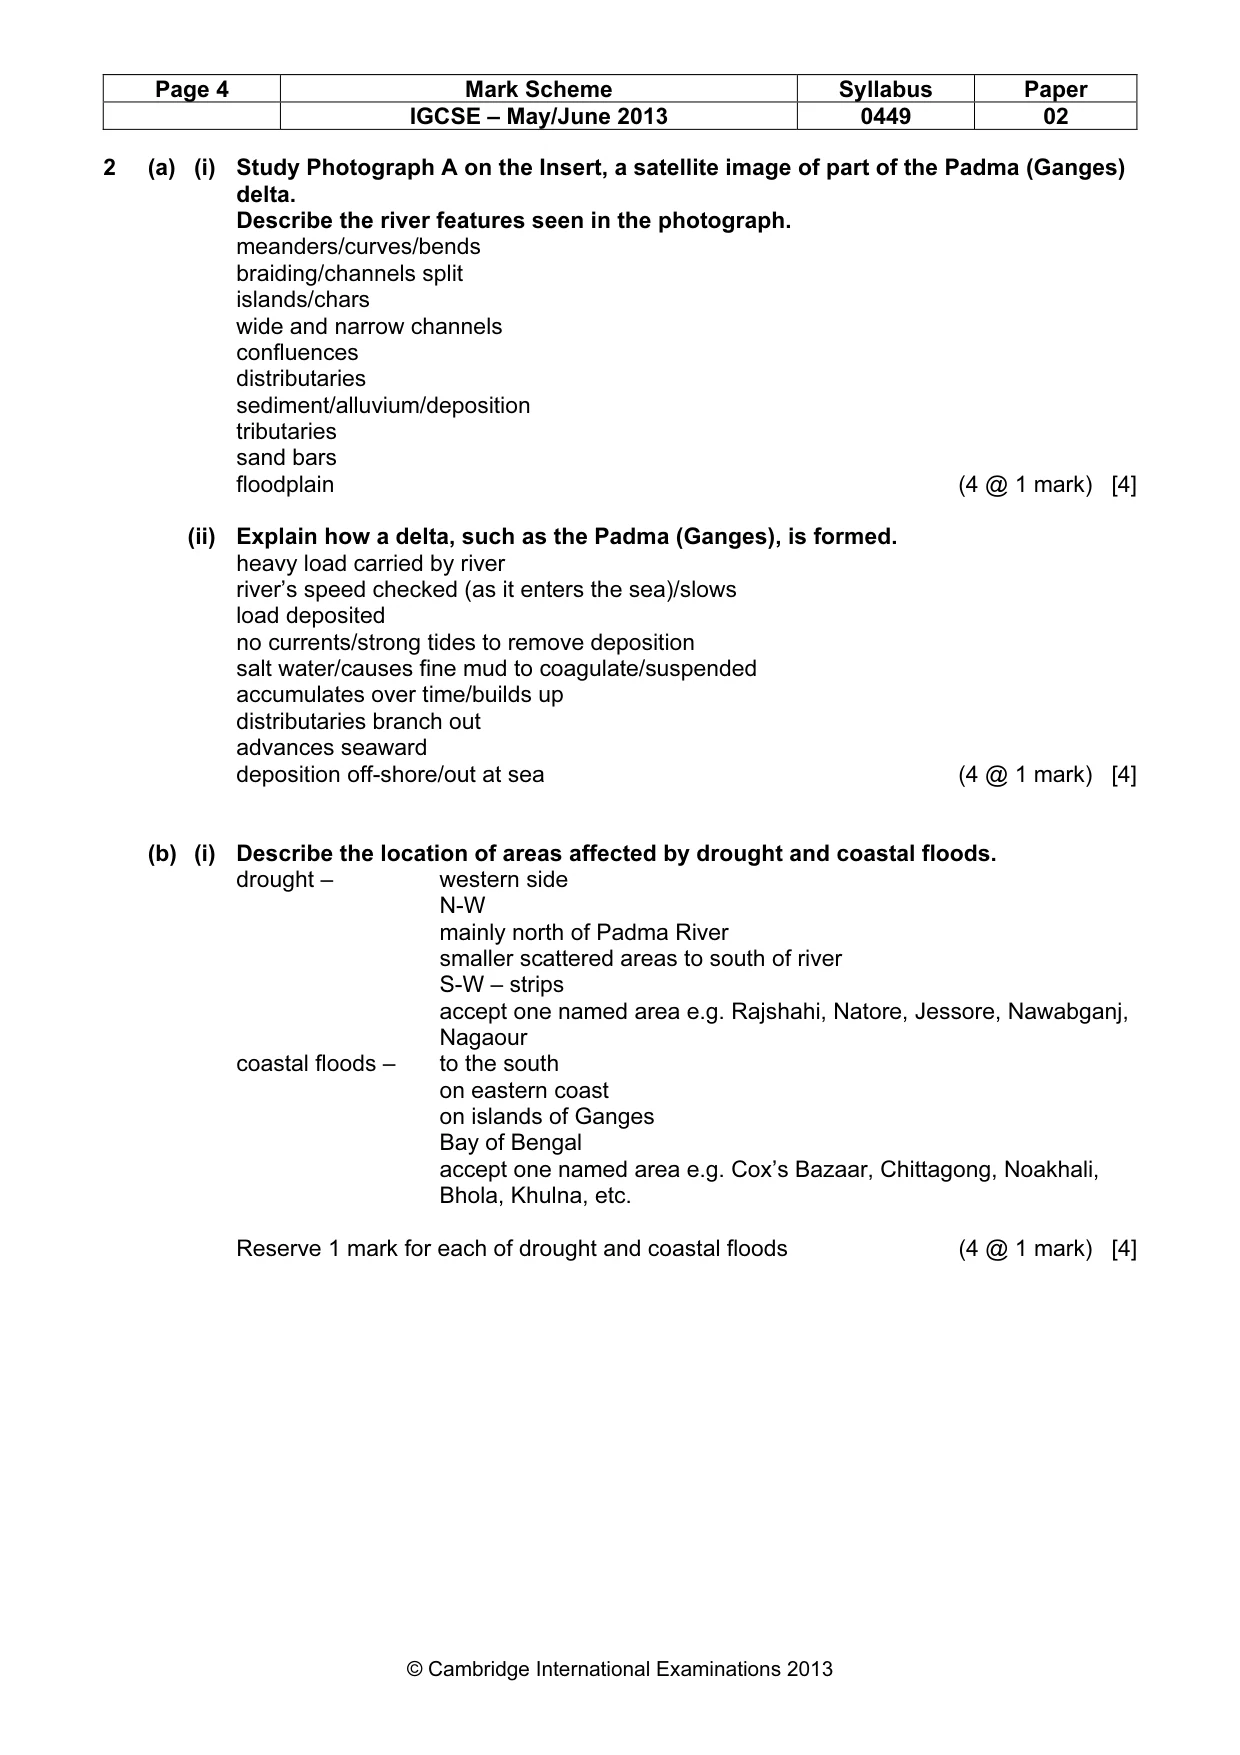
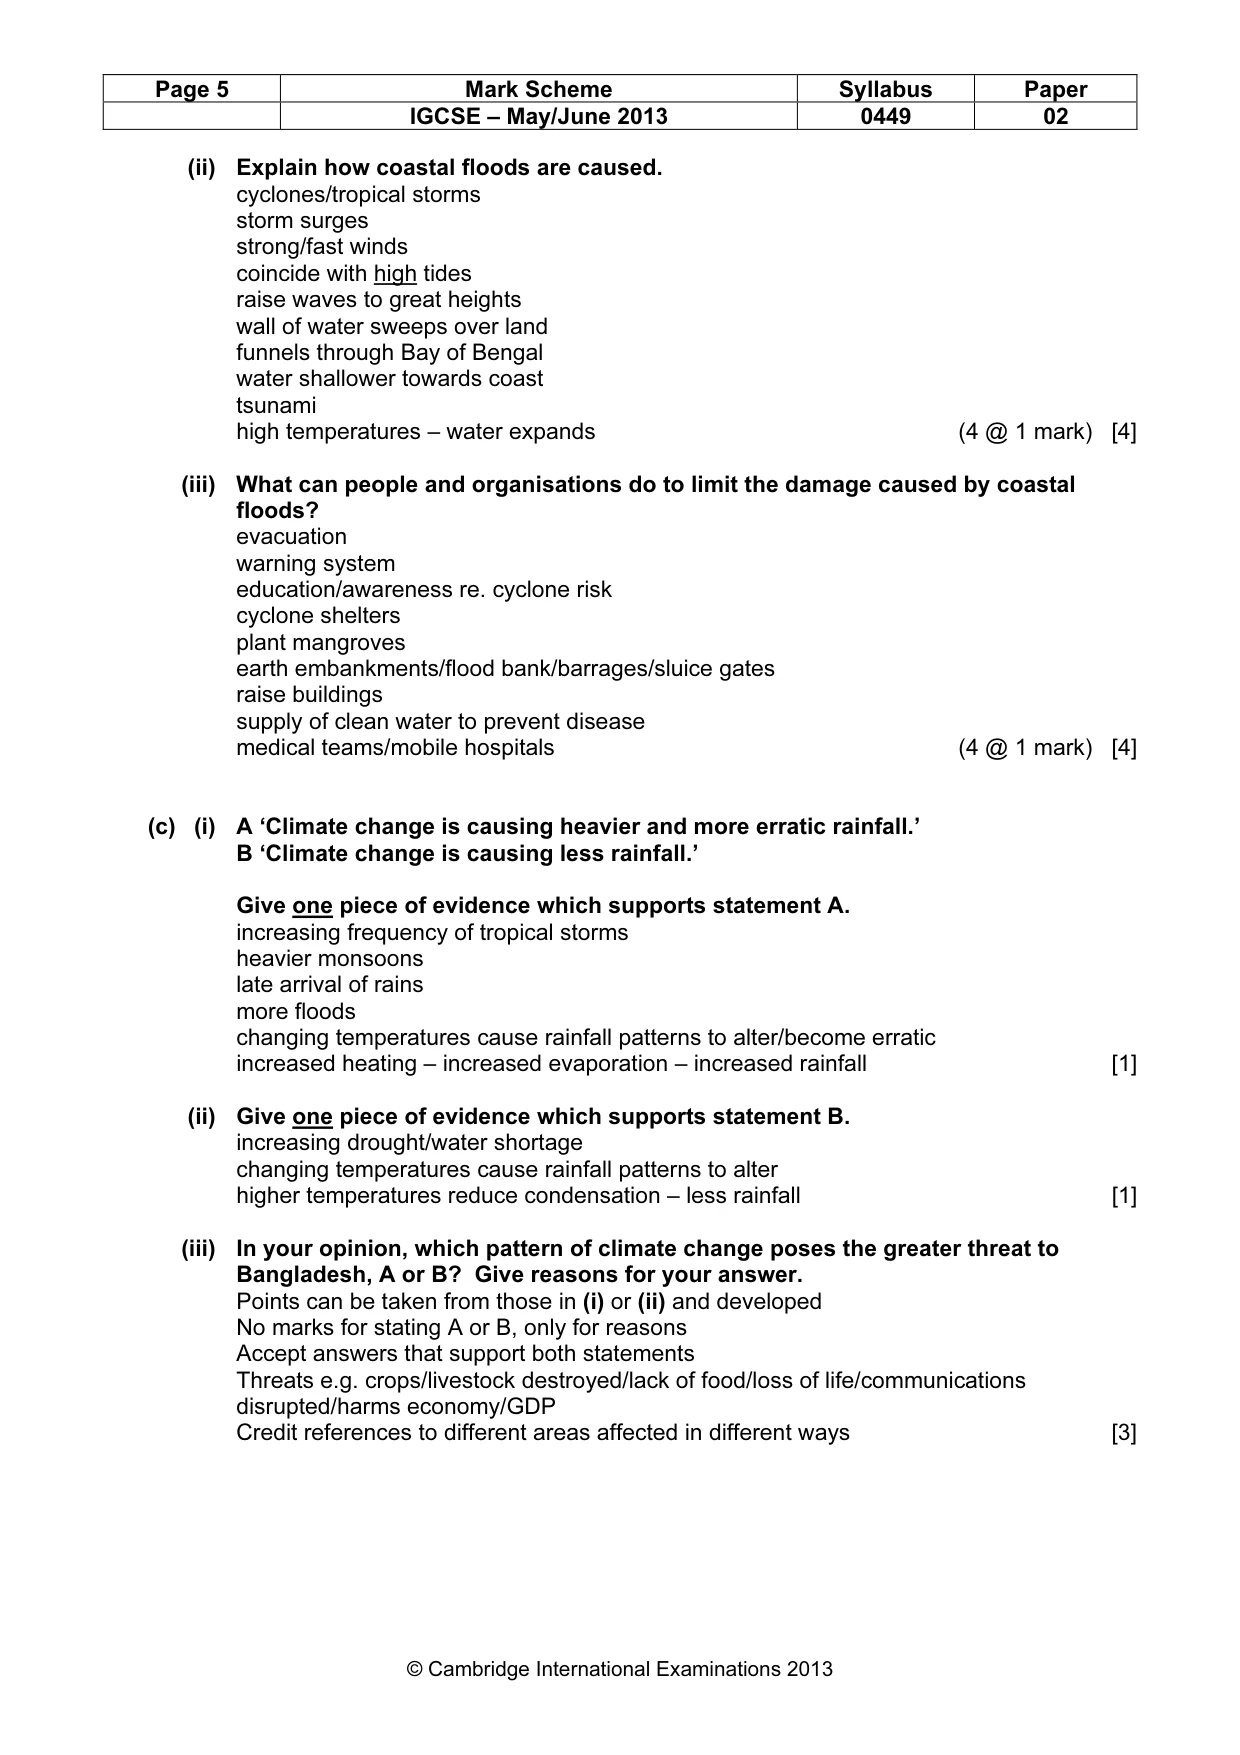
Mark scheme: 2 (a) (i) Study Photograph A on the Insert, a satellite image of part of the Padma (Ganges) delta. Describe the river features seen in the photograph. meanders/curves/bends braiding/channels split islands/chars wide and narrow channels confluences distributaries sediment/alluvium/deposition tributaries sand bars floodplain (4 @ 1 mark) [4] (ii) Explain how a delta, such as the Padma (Ganges), is formed. heavy load carried by river river’s speed checked (as it enters the sea)/slows load deposited no currents/strong tides to remove deposition salt water/causes fine mud to coagulate/suspended accumulates over time/builds up distributaries branch out advances seaward deposition off-shore/out at sea (4 @ 1 mark) [4] (b) (i) Describe the location of areas affected by drought and coastal floods. drought – western side N-W mainly north of Padma River smaller scattered areas to south of river S-W – strips accept one named area e.g. Rajshahi, Natore, Jessore, Nawabganj, Nagaour coastal floods – to the south on eastern coast on islands of Ganges Bay of Bengal accept one named area e.g. Cox’s Bazaar, Chittagong, Noakhali, Bhola, Khulna, etc. Reserve 1 mark for each of drought and coastal floods (4 @ 1 mark) [4] IGCSE – May/June 2013 0449 02 (ii) Explain how coastal floods are caused. cyclones/tropical storms storm surges strong/fast winds coincide with high tides raise waves to great heights wall of water sweeps over land funnels through Bay of Bengal water shallower towards coast tsunami high temperatures – water expands (4 @ 1 mark) [4] (iii) What can people and organisations do to limit the damage caused by coastal floods? evacuation warning system education/awareness re. cyclone risk cyclone shelters plant mangroves earth embankments/flood bank/barrages/sluice gates raise buildings supply of clean water to prevent disease medical teams/mobile hospitals (4 @ 1 mark) [4] (c) (i) A ‘Climate change is causing heavier and more erratic rainfall.’ B ‘Climate change is causing less rainfall.’ Give one piece of evidence which supports statement A. increasing frequency of tropical storms heavier monsoons late arrival of rains more floods changing temperatures cause rainfall patterns to alter/become erratic increased heating – increased evaporation – increased rainfall [1] (ii) Give one piece of evidence which supports statement B. increasing drought/water shortage changing temperatures cause rainfall patterns to alter higher temperatures reduce condensation – less rainfall [1] (iii) In your opinion, which pattern of climate change poses the greater threat to Bangladesh, A or B? Give reasons for your answer. Points can be taken from those in (i) or (ii) and developed No marks for stating A or B, only for reasons Accept answers that support both statements Threats e.g. crops/livestock destroyed/lack of food/loss of life/communications disrupted/harms economy/GDP Credit references to different areas affected in different ways [3] IGCSE – May/June 2013 0449 02
Q3 · Aquaculture is also known as the Blue Revolution
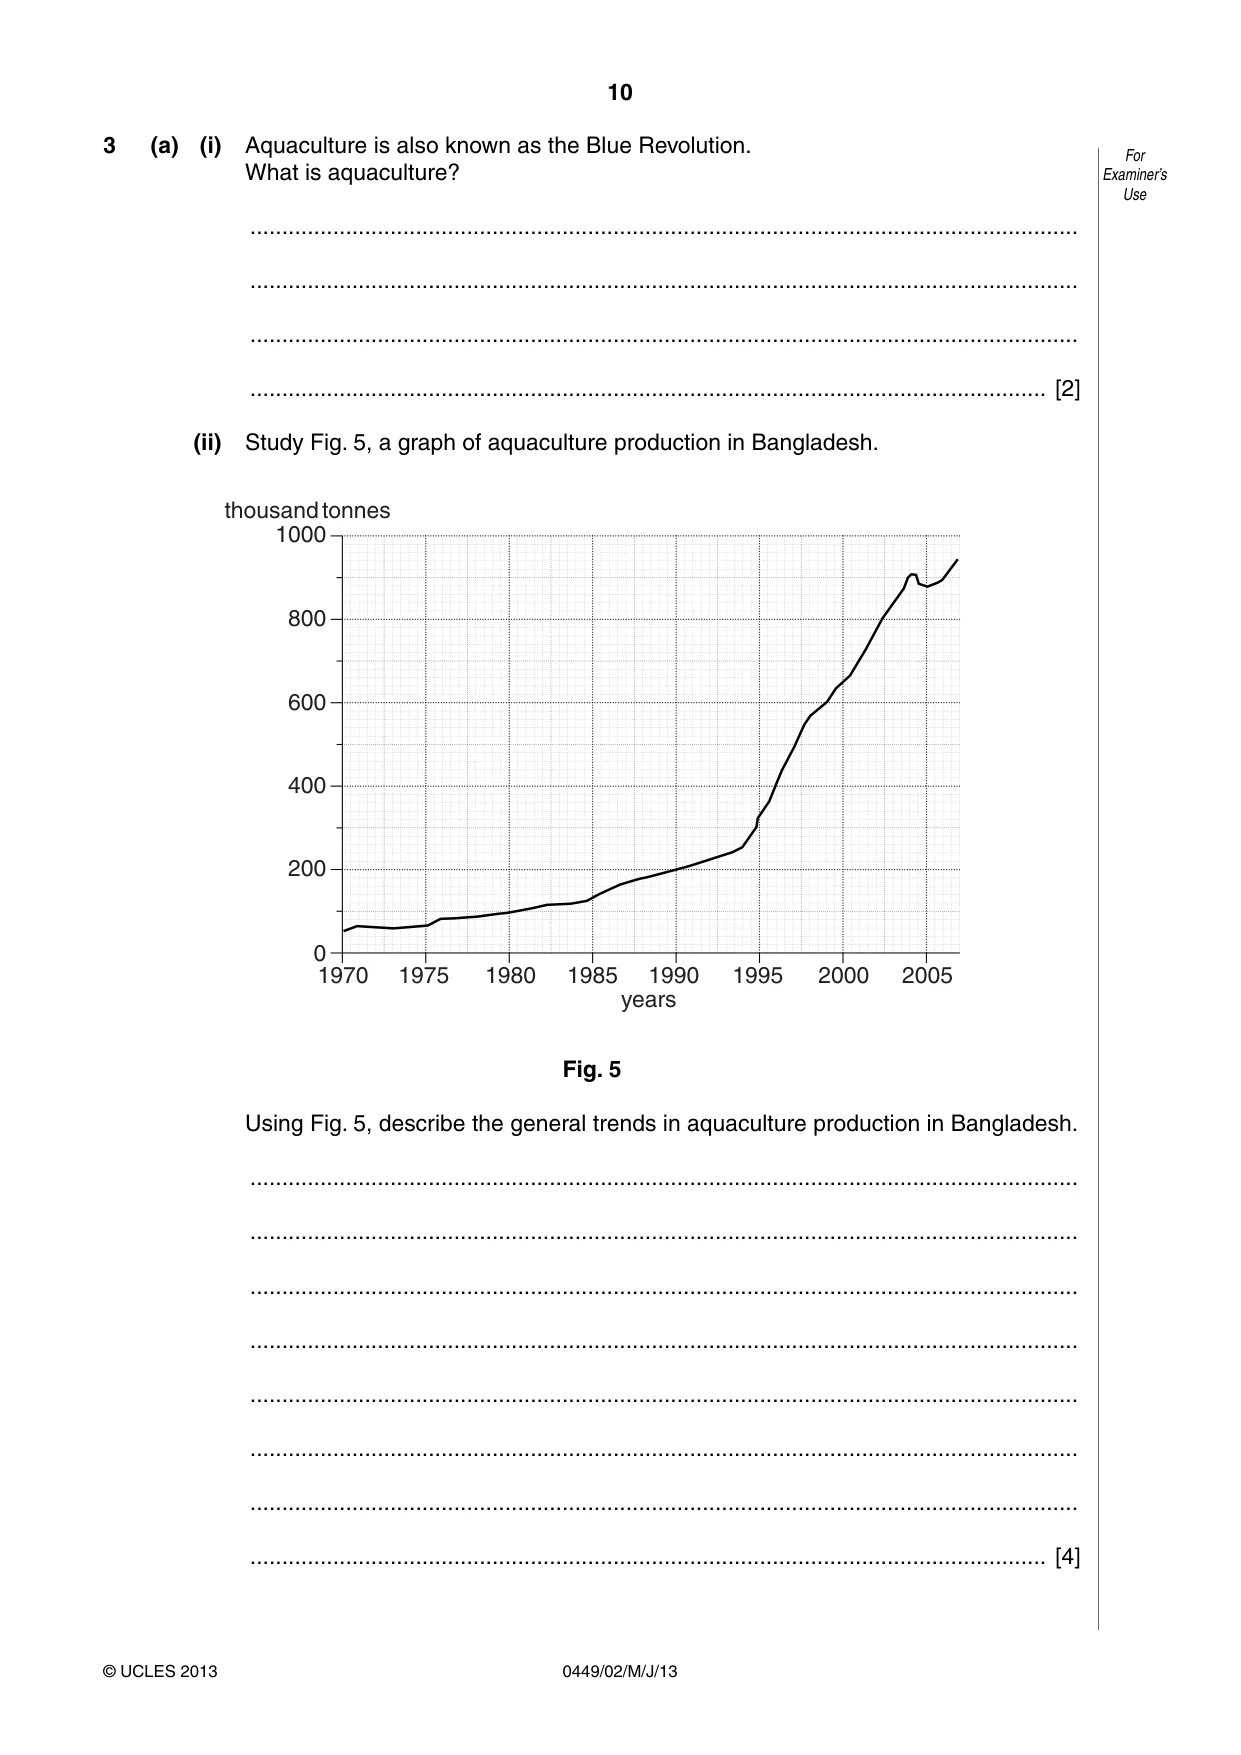
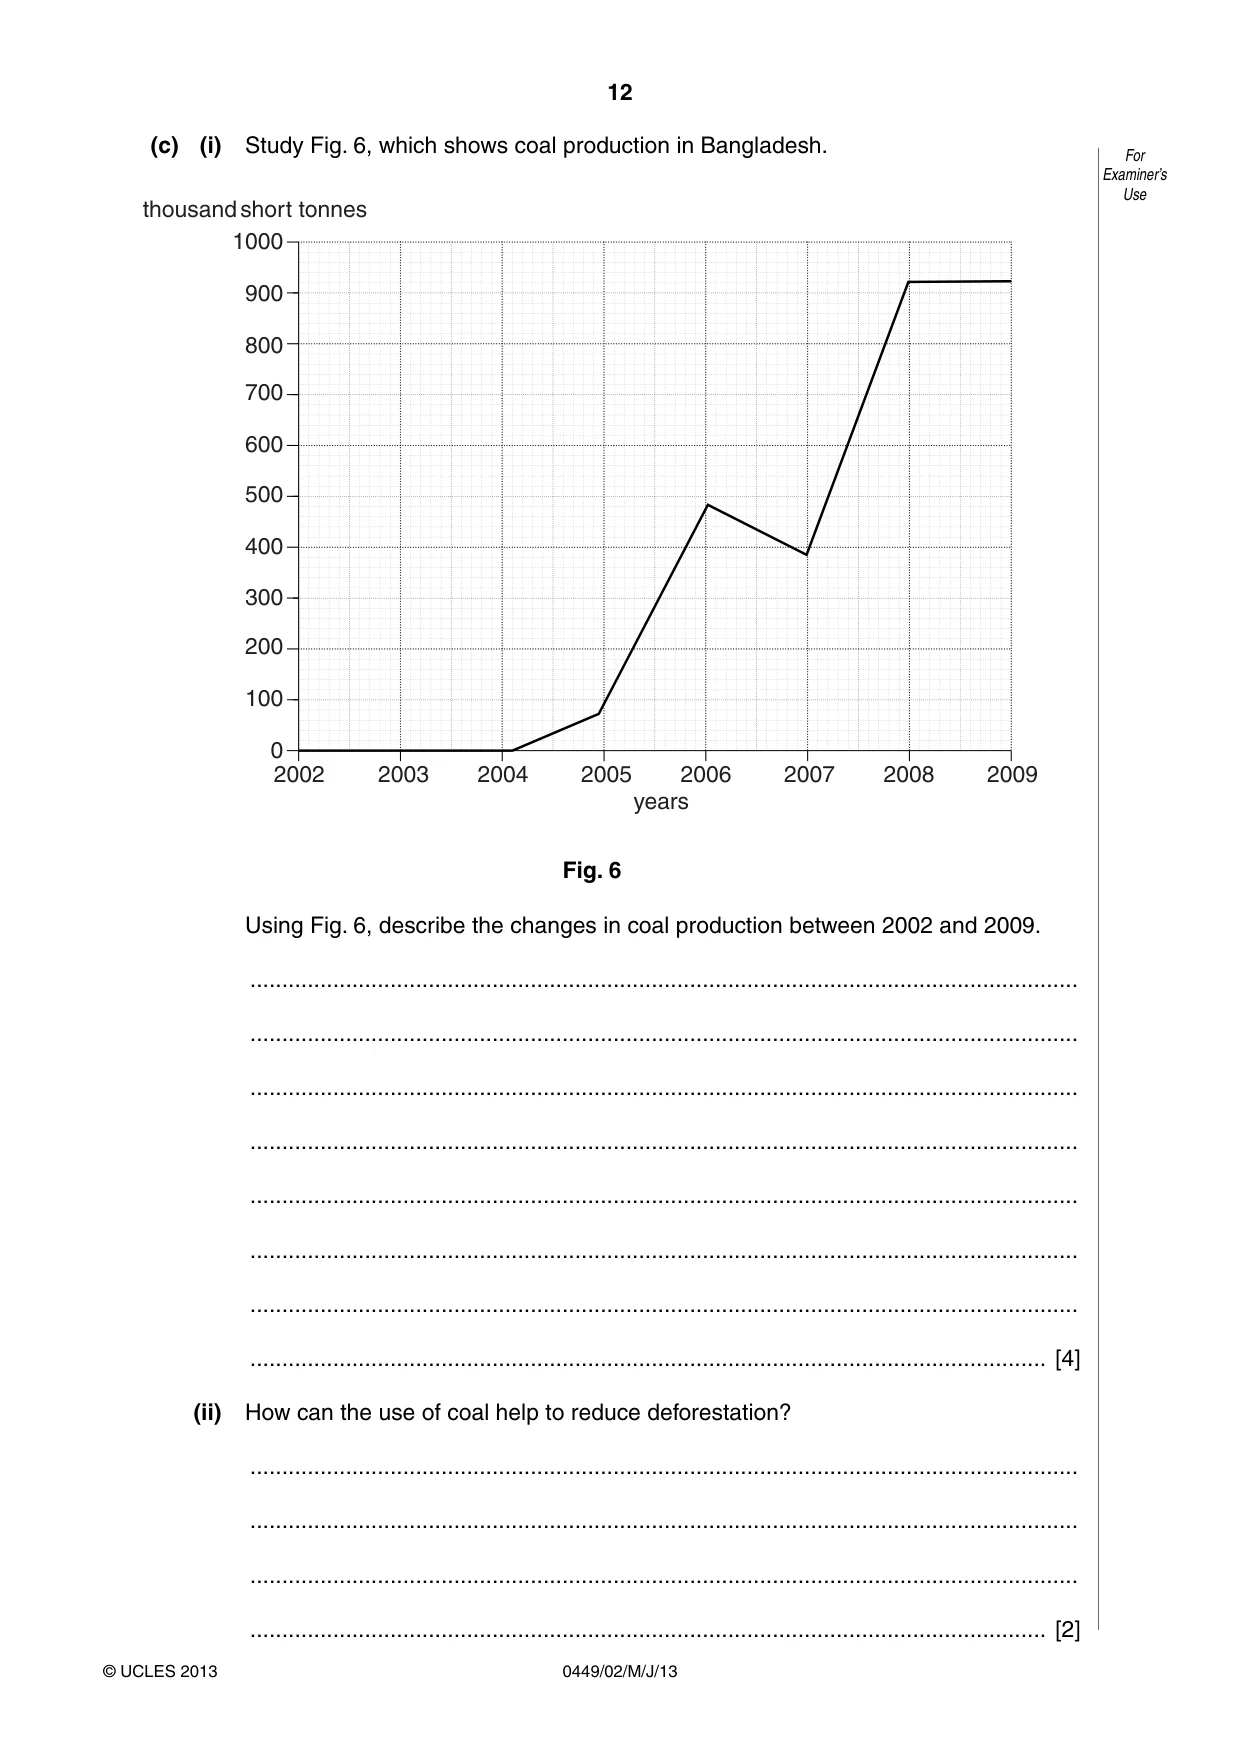
3 (a) (i) Aquaculture is also known as the Blue Revolution. What is aquaculture? .................................................................................................................................. .................................................................................................................................. .................................................................................................................................. ............................................................................................................................. [2] (ii) Study Fig. 5, a graph of aquaculture production in Bangladesh. thousand tonnes 1000 800 600 400 200 0 1970 1975 1980 1985 1990 1995 2000 2005 years Fig. 5 Using Fig. 5, describe the general trends in aquaculture production in Bangladesh. .................................................................................................................................. .................................................................................................................................. .................................................................................................................................. .................................................................................................................................. .................................................................................................................................. .................................................................................................................................. .................................................................................................................................. ............................................................................................................................. [4] (iii) Why is aquaculture important to the people of Bangladesh? .................................................................................................................................. .................................................................................................................................. .................................................................................................................................. .................................................................................................................................. .................................................................................................................................. ............................................................................................................................. [3] (b) (i) What is meant by ‘sustainable development’? .................................................................................................................................. .................................................................................................................................. .................................................................................................................................. ............................................................................................................................. [2] (ii) Explain how the sustainable development of natural resources, such as forests, can be achieved. .................................................................................................................................. .................................................................................................................................. .................................................................................................................................. .................................................................................................................................. .................................................................................................................................. ............................................................................................................................. [3] (c) (i) Study Fig. 6, which shows coal production in Bangladesh. thousand short tonnes 1000 900 800 700 600 500 400 300 200 100 0 2002 2003 2004 2005 2006 2007 2008 2009 years Fig. 6 Using Fig. 6, describe the changes in coal production between 2002 and 2009. .................................................................................................................................. .................................................................................................................................. .................................................................................................................................. .................................................................................................................................. .................................................................................................................................. .................................................................................................................................. .................................................................................................................................. ............................................................................................................................. [4] (ii) How can the use of coal help to reduce deforestation? .................................................................................................................................. .................................................................................................................................. .................................................................................................................................. ............................................................................................................................. [2] (d) There were many differing opinions when it was proposed to open a new coal mine at Phulbari. Below are two different views. Coal under the I do not want to lose ground is worth my home and fields more than growing to a coal mine. rice on the surface. local farmer government official (i) Give one piece of evidence in support of the farmer. .................................................................................................................................. ............................................................................................................................. [1] (ii) Give one piece of evidence in support of the government official. .................................................................................................................................. ............................................................................................................................. [1] (iii) Which opinion do you agree with the most? Give reasons for your answer. .................................................................................................................................. .................................................................................................................................. .................................................................................................................................. .................................................................................................................................. .................................................................................................................................. ............................................................................................................................. [3] [Total: 25]
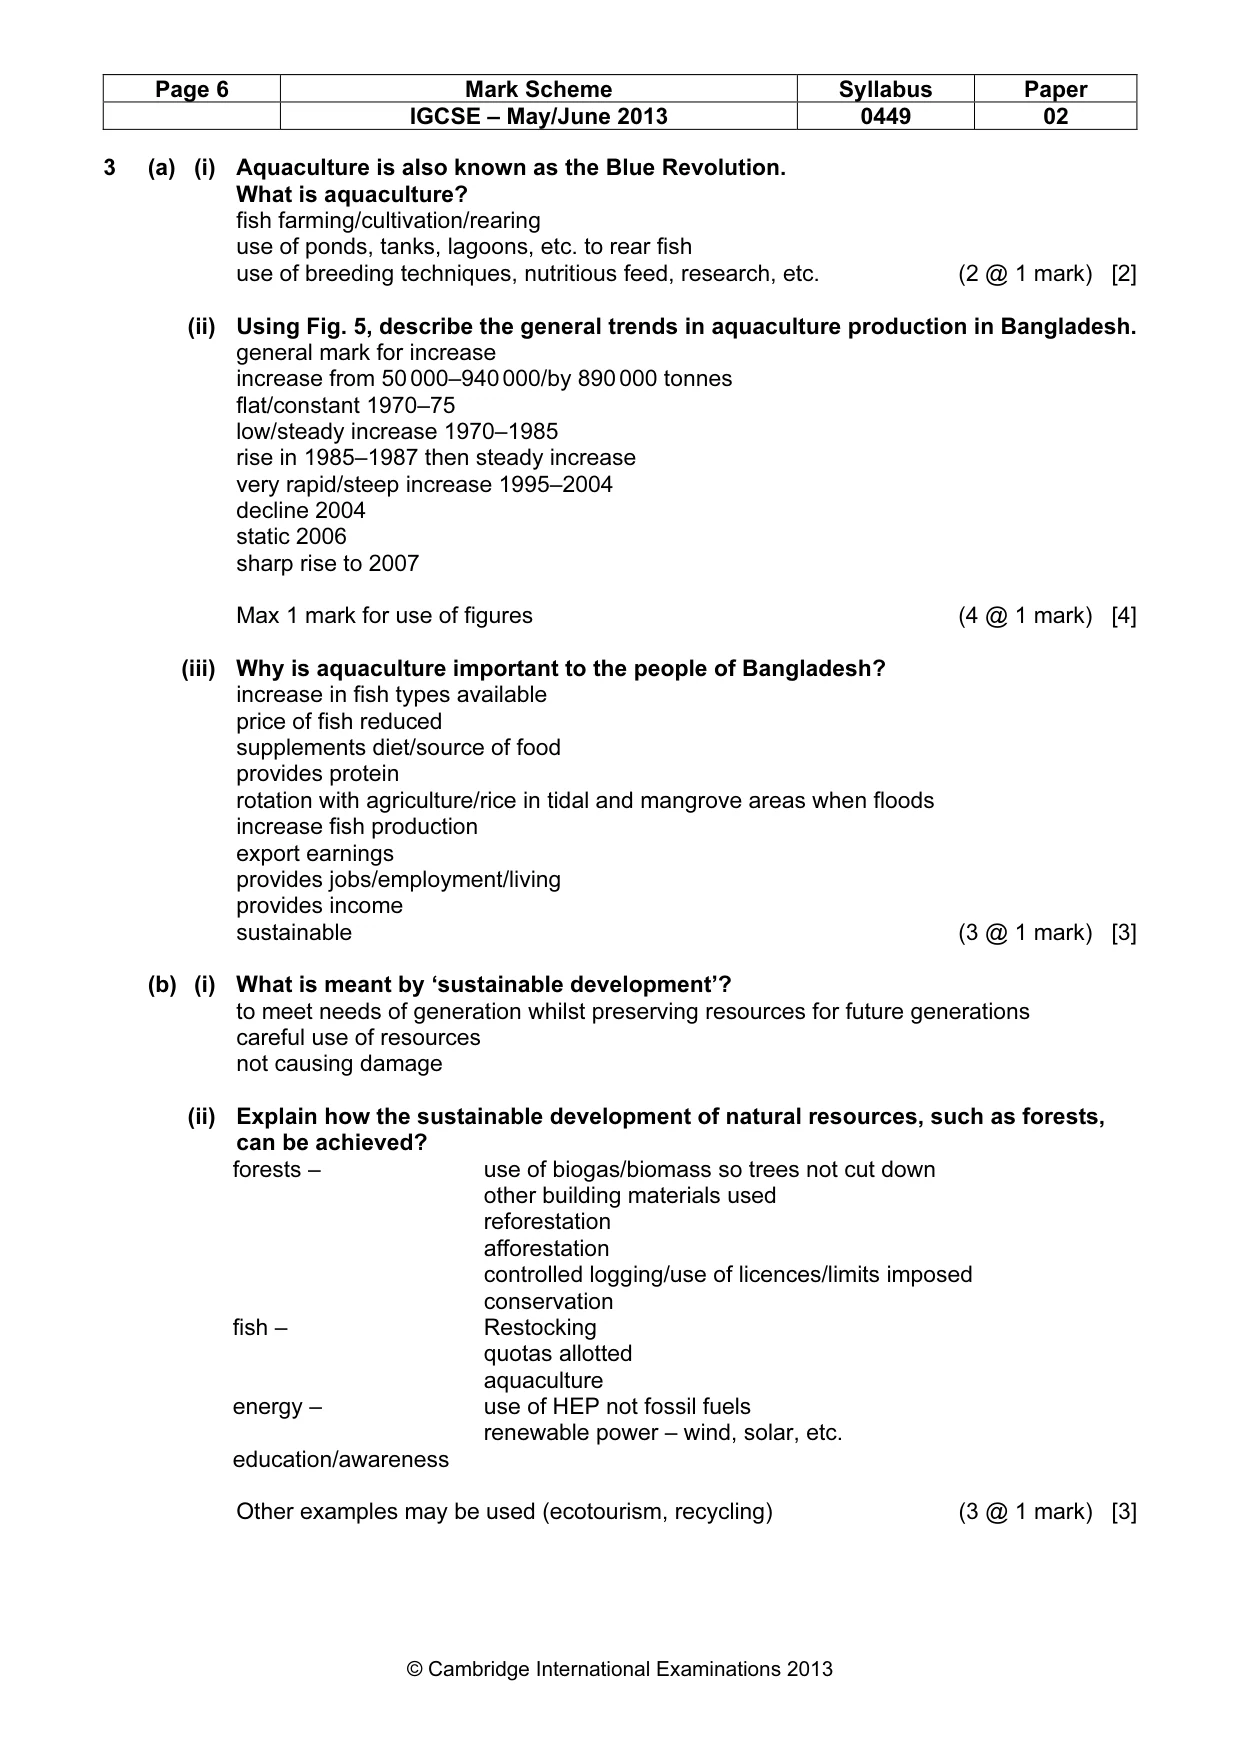
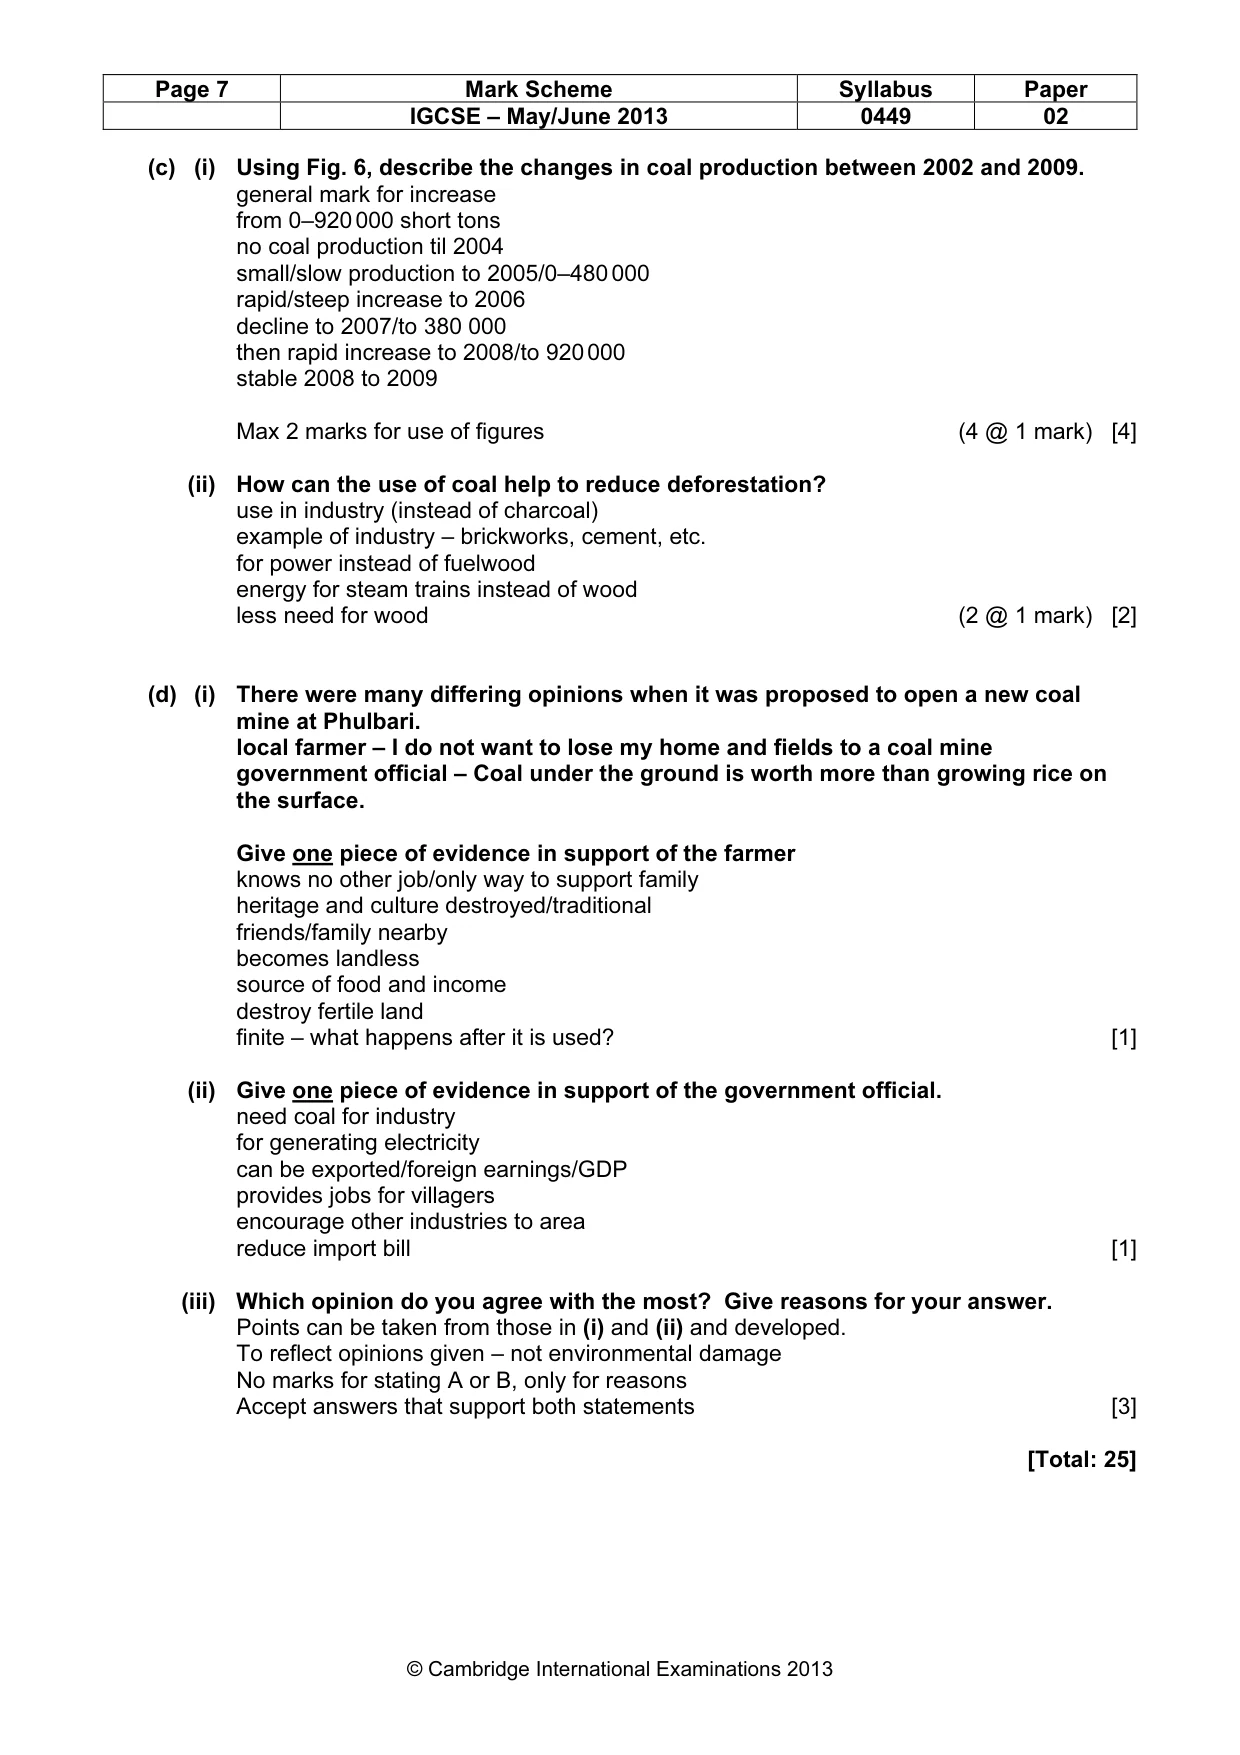
Mark scheme: 3 (a) (i) Aquaculture is also known as the Blue Revolution. What is aquaculture? fish farming/cultivation/rearing use of ponds, tanks, lagoons, etc. to rear fish use of breeding techniques, nutritious feed, research, etc. (2 @ 1 mark) [2] (ii) Using Fig. 5, describe the general trends in aquaculture production in Bangladesh. general mark for increase increase from 50 000–940 000/by 890 000 tonnes flat/constant 1970–75 low/steady increase 1970–1985 rise in 1985–1987 then steady increase very rapid/steep increase 1995–2004 decline 2004 static 2006 sharp rise to 2007 Max 1 mark for use of figures (4 @ 1 mark) [4] (iii) Why is aquaculture important to the people of Bangladesh? increase in fish types available price of fish reduced supplements diet/source of food provides protein rotation with agriculture/rice in tidal and mangrove areas when floods increase fish production export earnings provides jobs/employment/living provides income sustainable (3 @ 1 mark) [3] (b) (i) What is meant by ‘sustainable development’? to meet needs of generation whilst preserving resources for future generations careful use of resources not causing damage (ii) Explain how the sustainable development of natural resources, such as forests, can be achieved? forests – use of biogas/biomass so trees not cut down other building materials used reforestation afforestation controlled logging/use of licences/limits imposed conservation fish – Restocking quotas allotted aquaculture energy – use of HEP not fossil fuels renewable power – wind, solar, etc. education/awareness Other examples may be used (ecotourism, recycling) (3 @ 1 mark) [3] IGCSE – May/June 2013 0449 02 (c) (i) Using Fig. 6, describe the changes in coal production between 2002 and 2009. general mark for increase from 0–920 000 short tons no coal production til 2004 small/slow production to 2005/0–480 000 rapid/steep increase to 2006 decline to 2007/to 380 000 then rapid increase to 2008/to 920 000 stable 2008 to 2009 Max 2 marks for use of figures (4 @ 1 mark) [4] (ii) How can the use of coal help to reduce deforestation? use in industry (instead of charcoal) example of industry – brickworks, cement, etc. for power instead of fuelwood energy for steam trains instead of wood less need for wood (2 @ 1 mark) [2] (d) (i) There were many differing opinions when it was proposed to open a new coal mine at Phulbari. local farmer – I do not want to lose my home and fields to a coal mine government official – Coal under the ground is worth more than growing rice on the surface. Give one piece of evidence in support of the farmer knows no other job/only way to support family heritage and culture destroyed/traditional friends/family nearby becomes landless source of food and income destroy fertile land finite – what happens after it is used? [1] (ii) Give one piece of evidence in support of the government official. need coal for industry for generating electricity can be exported/foreign earnings/GDP provides jobs for villagers encourage other industries to area reduce import bill [1] (iii) Which opinion do you agree with the most? Give reasons for your answer. Points can be taken from those in (i) and (ii) and developed. To reflect opinions given – not environmental damage No marks for stating A or B, only for reasons Accept answers that support both statements [3] [Total: 25] IGCSE – May/June 2013 0449 02
Question 4
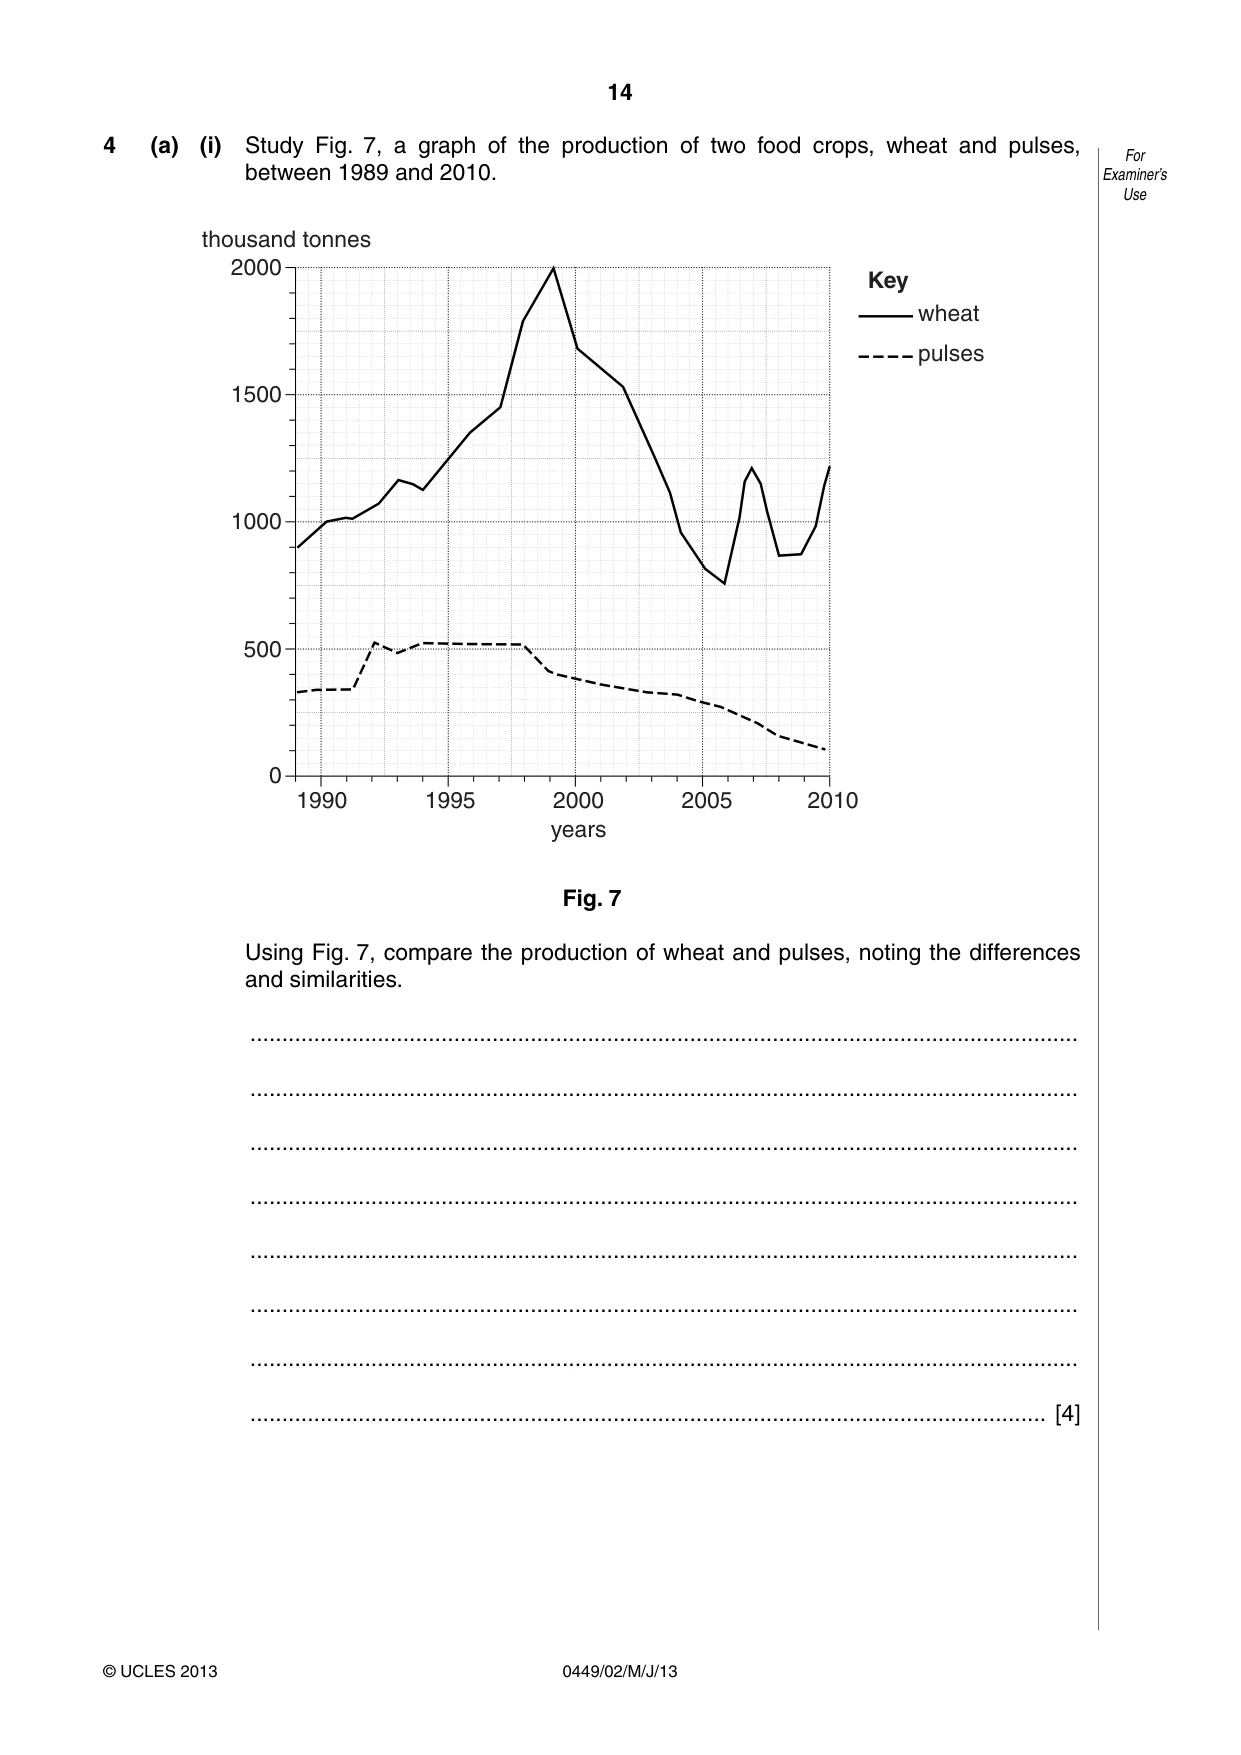
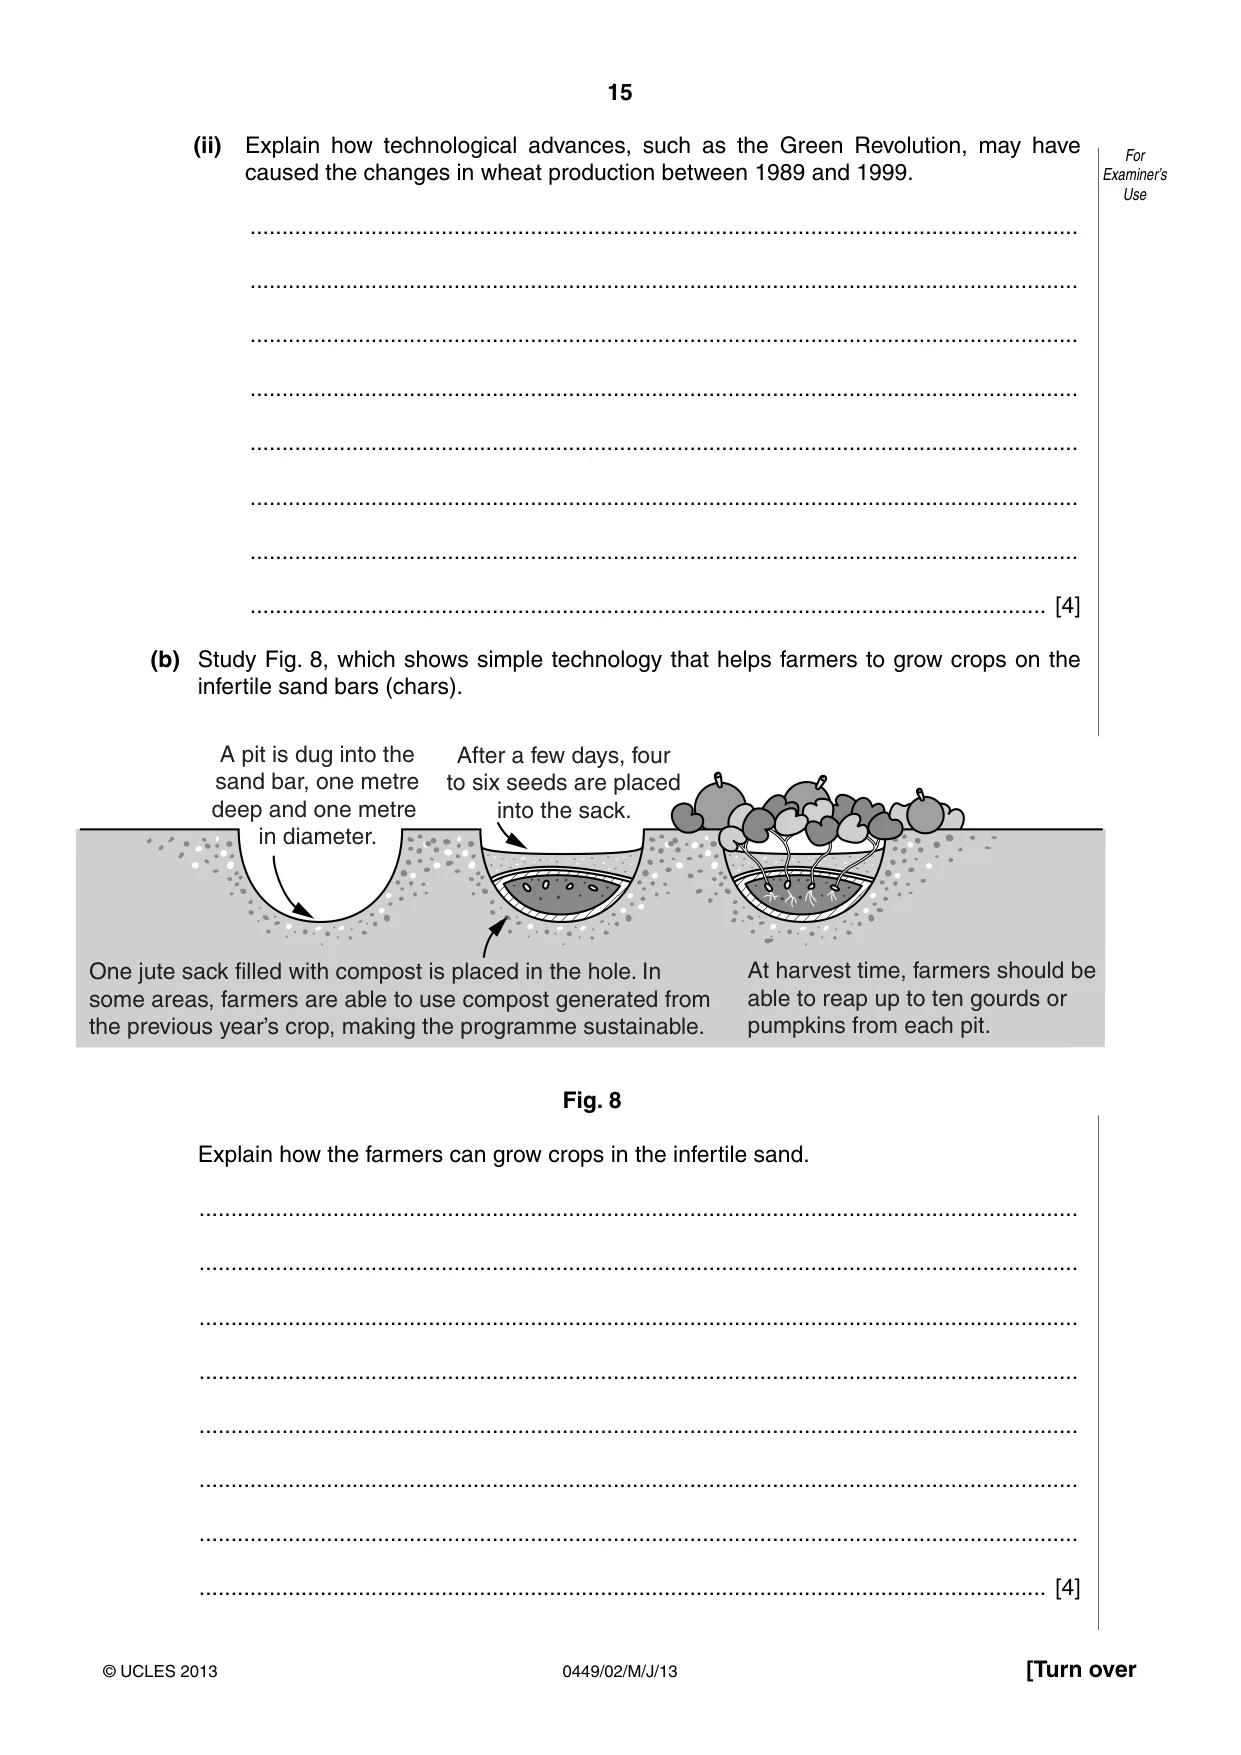
4 (a) (i) Study Fig. 7, a graph of the production of two food crops, wheat and pulses, between 1989 and 2010. thousand tonnes 2000 Key wheat pulses 1500 1000 500 0 1990 1995 2000 2005 2010 years Fig. 7 Using Fig. 7, compare the production of wheat and pulses, noting the differences and similarities. .................................................................................................................................. .................................................................................................................................. .................................................................................................................................. .................................................................................................................................. .................................................................................................................................. .................................................................................................................................. .................................................................................................................................. ............................................................................................................................. [4] (ii) Explain how technological advances, such as the Green Revolution, may have caused the changes in wheat production between 1989 and 1999. .................................................................................................................................. .................................................................................................................................. .................................................................................................................................. .................................................................................................................................. .................................................................................................................................. .................................................................................................................................. .................................................................................................................................. ............................................................................................................................. [4] (b) Study Fig. 8, which shows simple technology that helps farmers to grow crops on the infertile sand bars (chars). A pit is dug into the After a few days, four sand bar, one metre to six seeds are placed deep and one metre into the sack. in diameter. One jute sack filled with compost is placed in the hole. In At harvest time, farmers should b some areas, farmers are able to use compost generated from able to reap up to ten gourds or the previous year’s crop, making the programme sustainable. pumpkins from each pit. Fig. 8 Explain how the farmers can grow crops in the infertile sand. .......................................................................................................................................... .......................................................................................................................................... .......................................................................................................................................... .......................................................................................................................................... .......................................................................................................................................... .......................................................................................................................................... .......................................................................................................................................... ..................................................................................................................................... [4] (c) Complete the table below to compare a cottage industry and a large-scale industry. cottage industry large scale industry example ................................................ ................................................ [2] labour ................................................ ................................................ ................................................ ................................................ [2] ................................................ ................................................ machinery ................................................ ................................................ ................................................ ................................................ ................................................ ................................................ [2] export and earnings ................................................ ................................................ ................................................ ................................................ ................................................ ................................................ [2] (d) Study the two statements below. A ‘It is important to encourage more cottage industries to reduce unemployment.’ B ‘Investment in large-scale industries is necessary for Bangladesh’s continuing development.’ (i) Give one piece of evidence which supports statement A. .................................................................................................................................. ............................................................................................................................. [1] (ii) Give one piece of evidence which supports statement B. .................................................................................................................................. ............................................................................................................................. [1] (iii) In your opinion, which statement will be the more beneficial to Bangladesh? Give reasons for your answer. .................................................................................................................................. .................................................................................................................................. .................................................................................................................................. .................................................................................................................................. .................................................................................................................................. ............................................................................................................................. [3] [Total: 25]
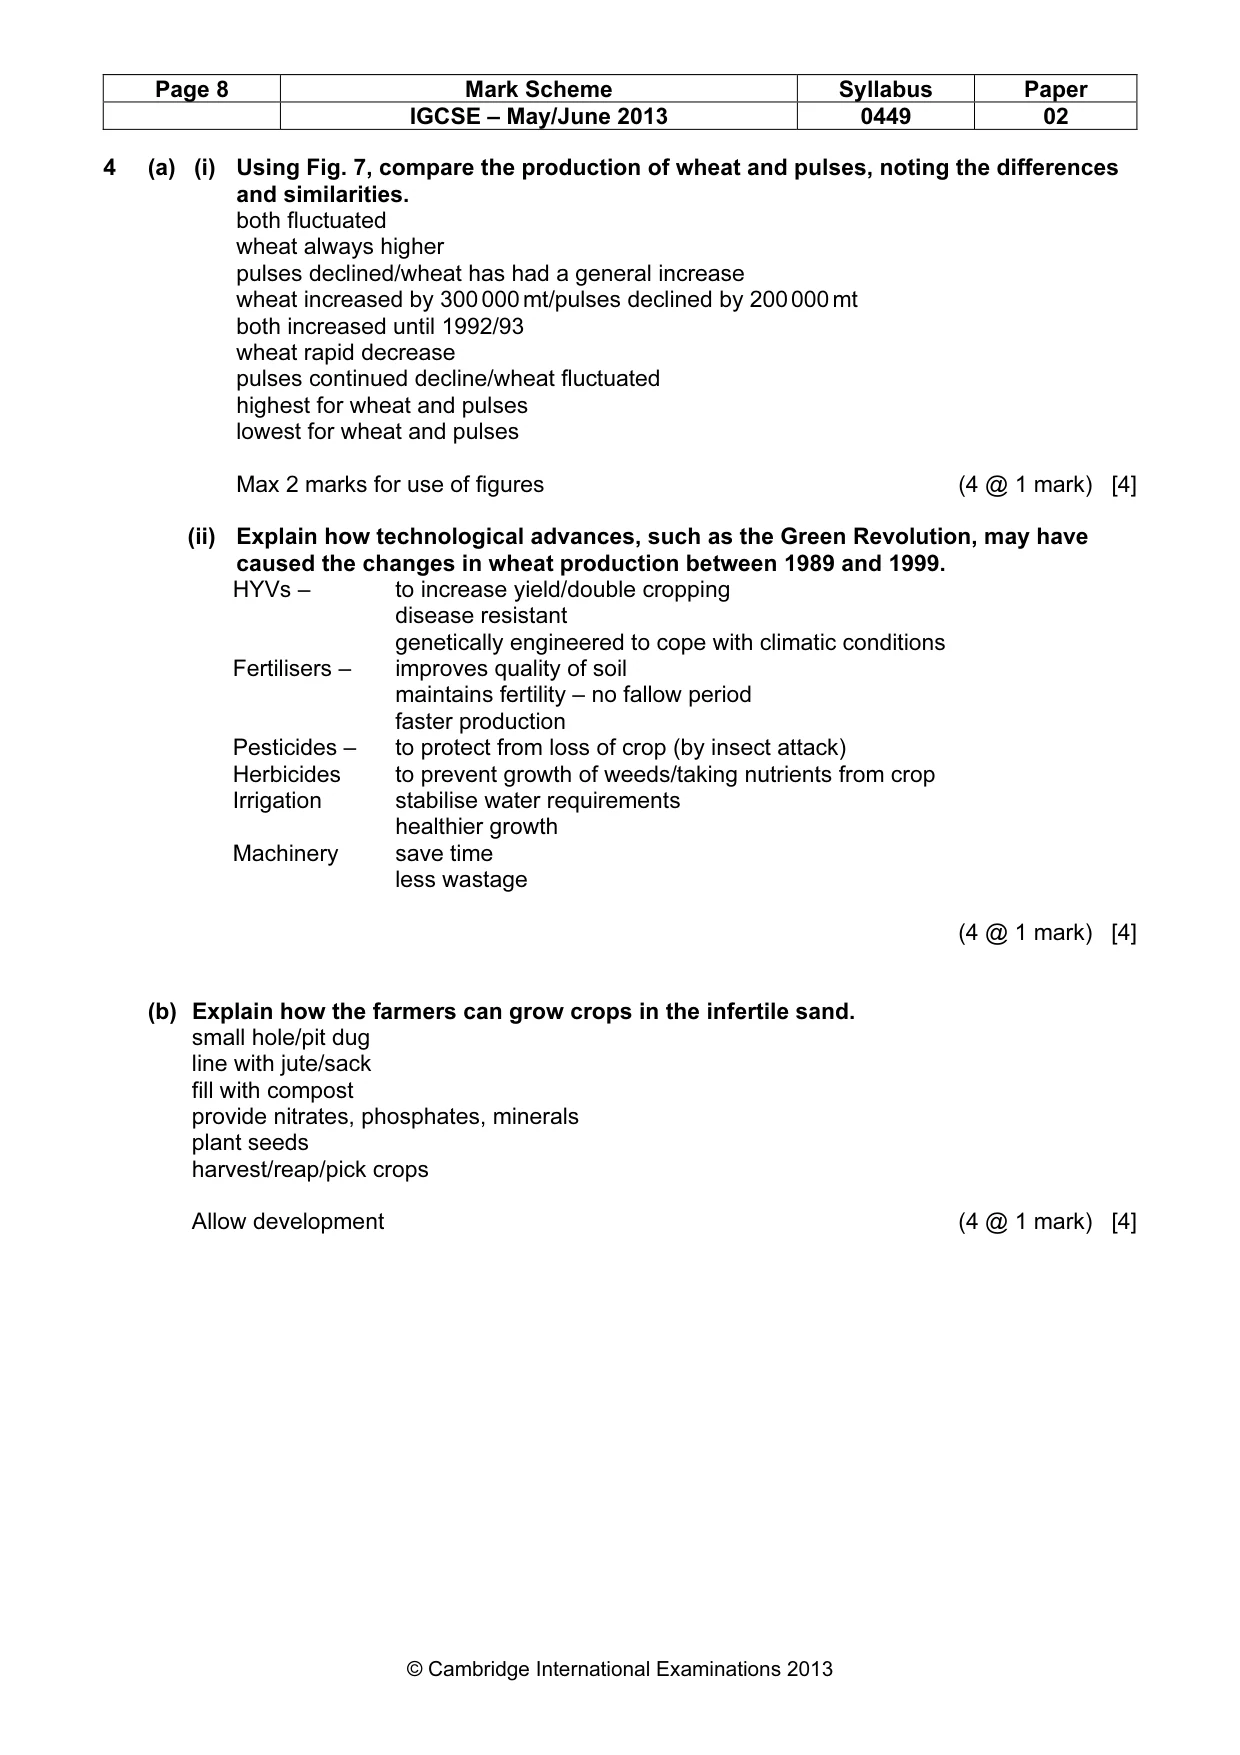
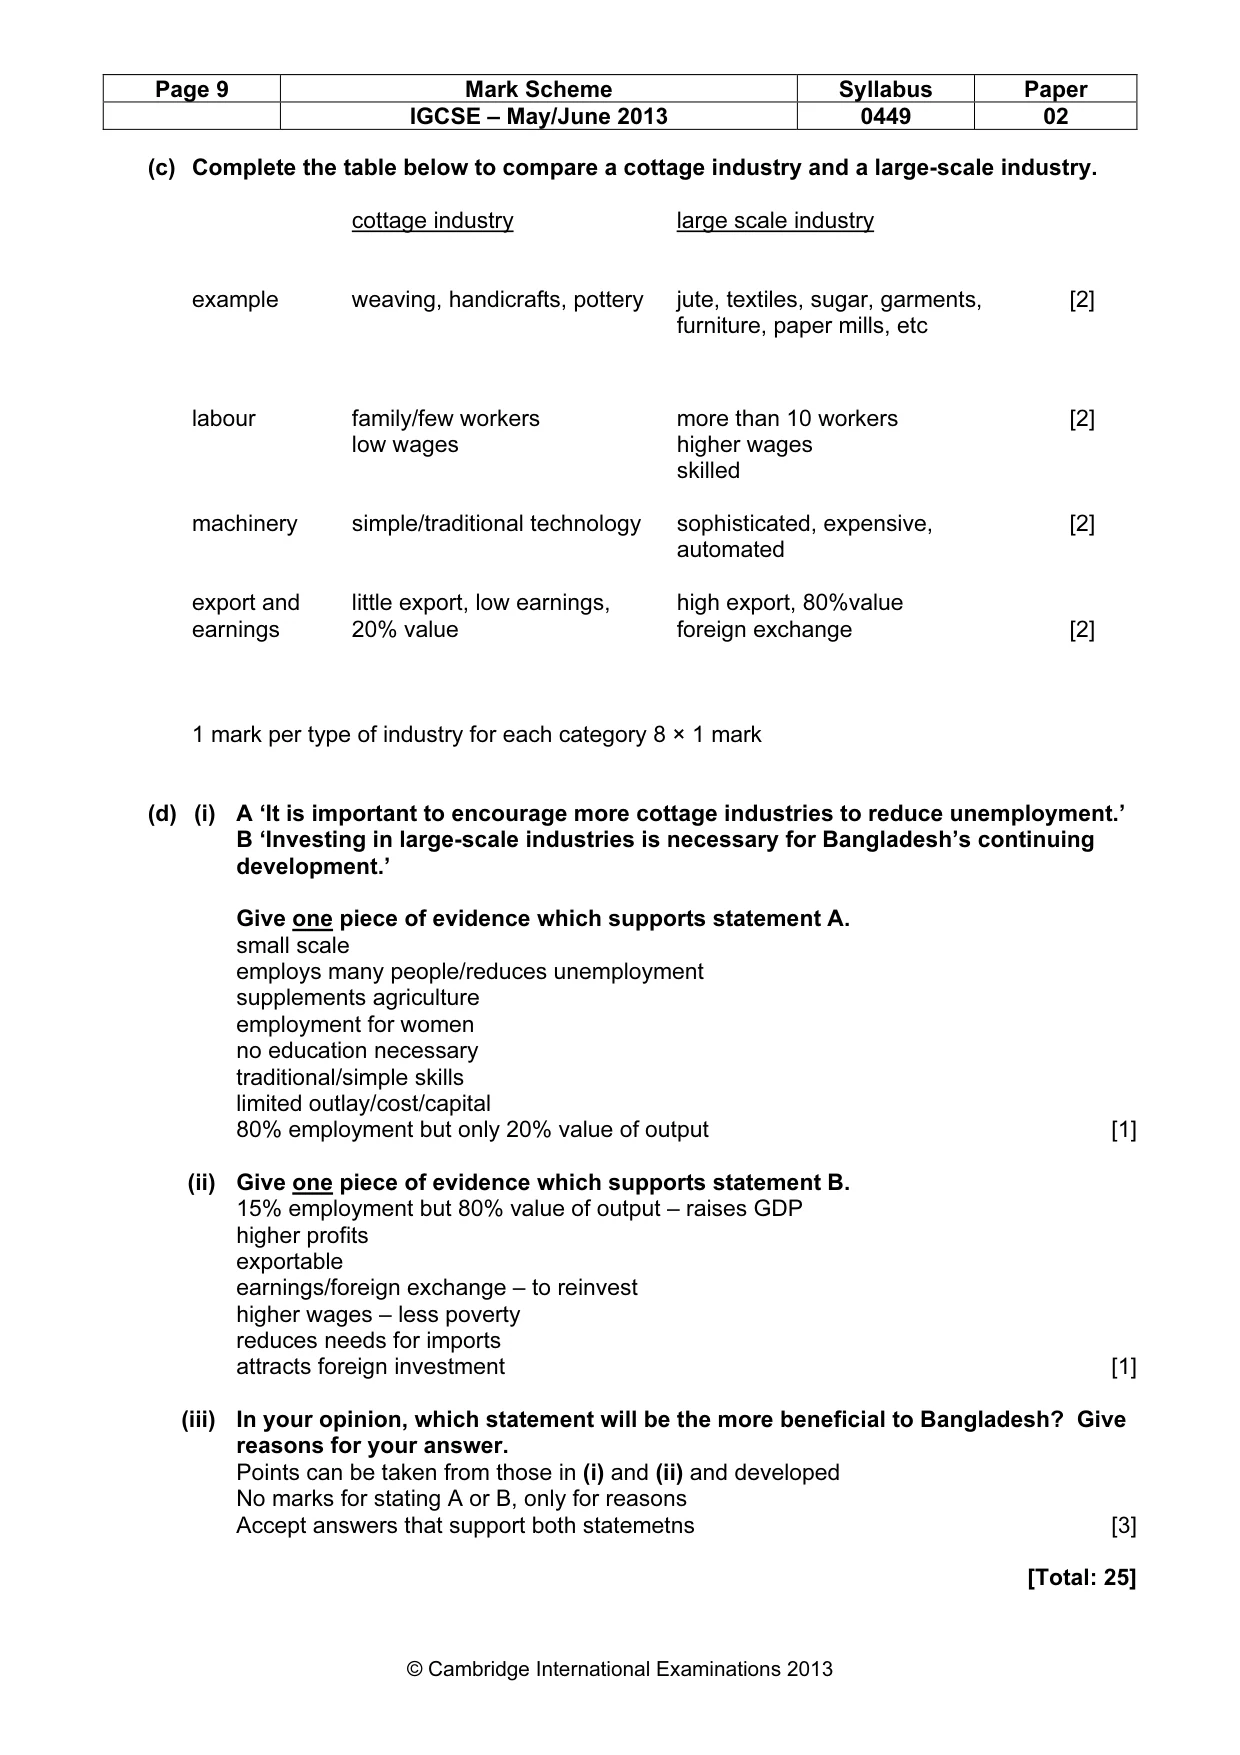
Mark scheme: 4 (a) (i) Using Fig. 7, compare the production of wheat and pulses, noting the differences and similarities. both fluctuated wheat always higher pulses declined/wheat has had a general increase wheat increased by 300 000 mt/pulses declined by 200 000 mt both increased until 1992/93 wheat rapid decrease pulses continued decline/wheat fluctuated highest for wheat and pulses lowest for wheat and pulses Max 2 marks for use of figures (4 @ 1 mark) [4] (ii) Explain how technological advances, such as the Green Revolution, may have caused the changes in wheat production between 1989 and 1999. HYVs – to increase yield/double cropping disease resistant genetically engineered to cope with climatic conditions Fertilisers – improves quality of soil maintains fertility – no fallow period faster production Pesticides – to protect from loss of crop (by insect attack) Herbicides to prevent growth of weeds/taking nutrients from crop Irrigation stabilise water requirements healthier growth Machinery save time less wastage (4 @ 1 mark) [4] (b) Explain how the farmers can grow crops in the infertile sand. small hole/pit dug line with jute/sack fill with compost provide nitrates, phosphates, minerals plant seeds harvest/reap/pick crops Allow development (4 @ 1 mark) [4] IGCSE – May/June 2013 0449 02 (c) Complete the table below to compare a cottage industry and a large-scale industry. cottage industry large scale industry example weaving, handicrafts, pottery jute, textiles, sugar, garments, [2] furniture, paper mills, etc labour family/few workers more than 10 workers [2] low wages higher wages skilled machinery simple/traditional technology sophisticated, expensive, [2] automated export and little export, low earnings, high export, 80%value earnings 20% value foreign exchange [2] 1 mark per type of industry for each category 8 × 1 mark (d) (i) A ‘It is important to encourage more cottage industries to reduce unemployment.’ B ‘Investing in large-scale industries is necessary for Bangladesh’s continuing development.’ Give one piece of evidence which supports statement A. small scale employs many people/reduces unemployment supplements agriculture employment for women no education necessary traditional/simple skills limited outlay/cost/capital 80% employment but only 20% value of output [1] (ii) Give one piece of evidence which supports statement B. 15% employment but 80% value of output – raises GDP higher profits exportable earnings/foreign exchange – to reinvest higher wages – less poverty reduces needs for imports attracts foreign investment [1] (iii) In your opinion, which statement will be the more beneficial to Bangladesh? Give reasons for your answer. Points can be taken from those in (i) and (ii) and developed No marks for stating A or B, only for reasons Accept answers that support both statemetns [3] [Total: 25] IGCSE – May/June 2013 0449 02
Question 5
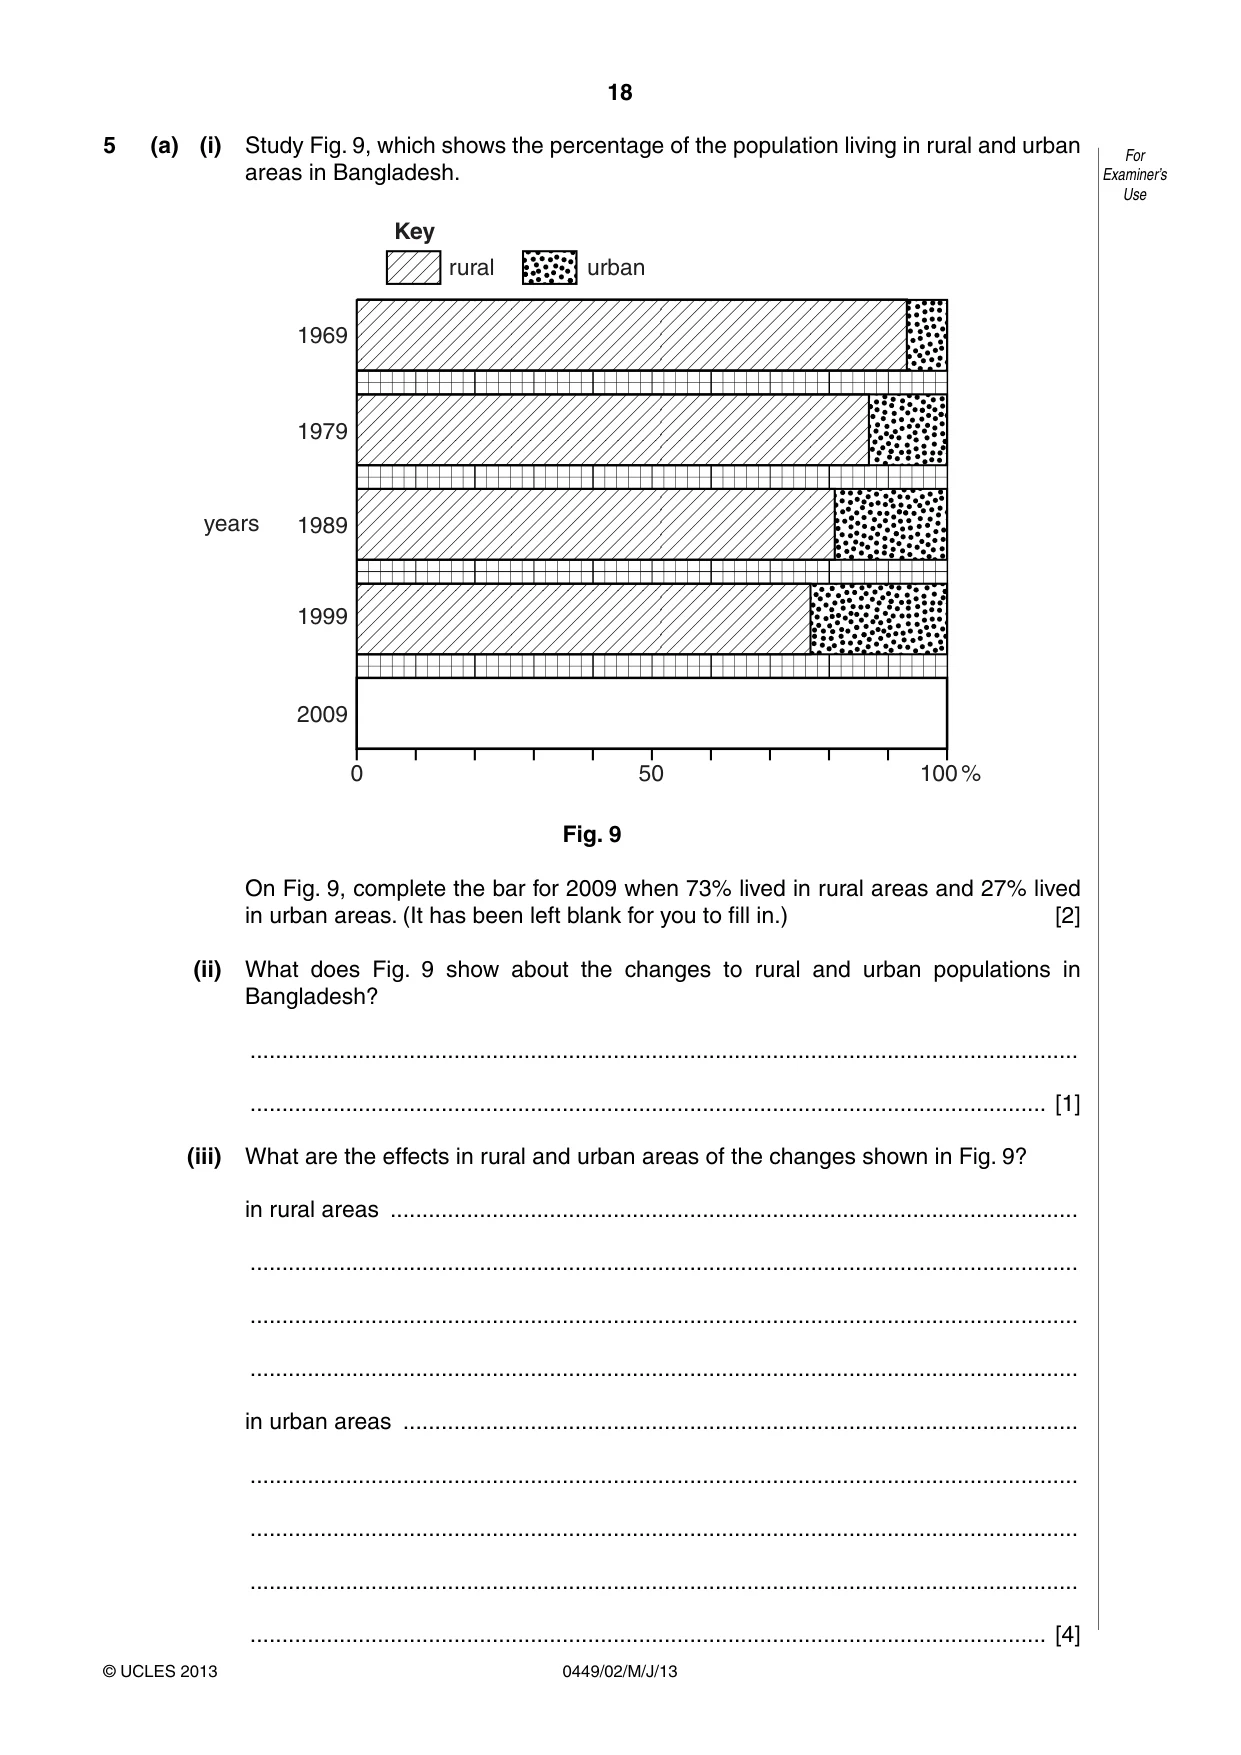
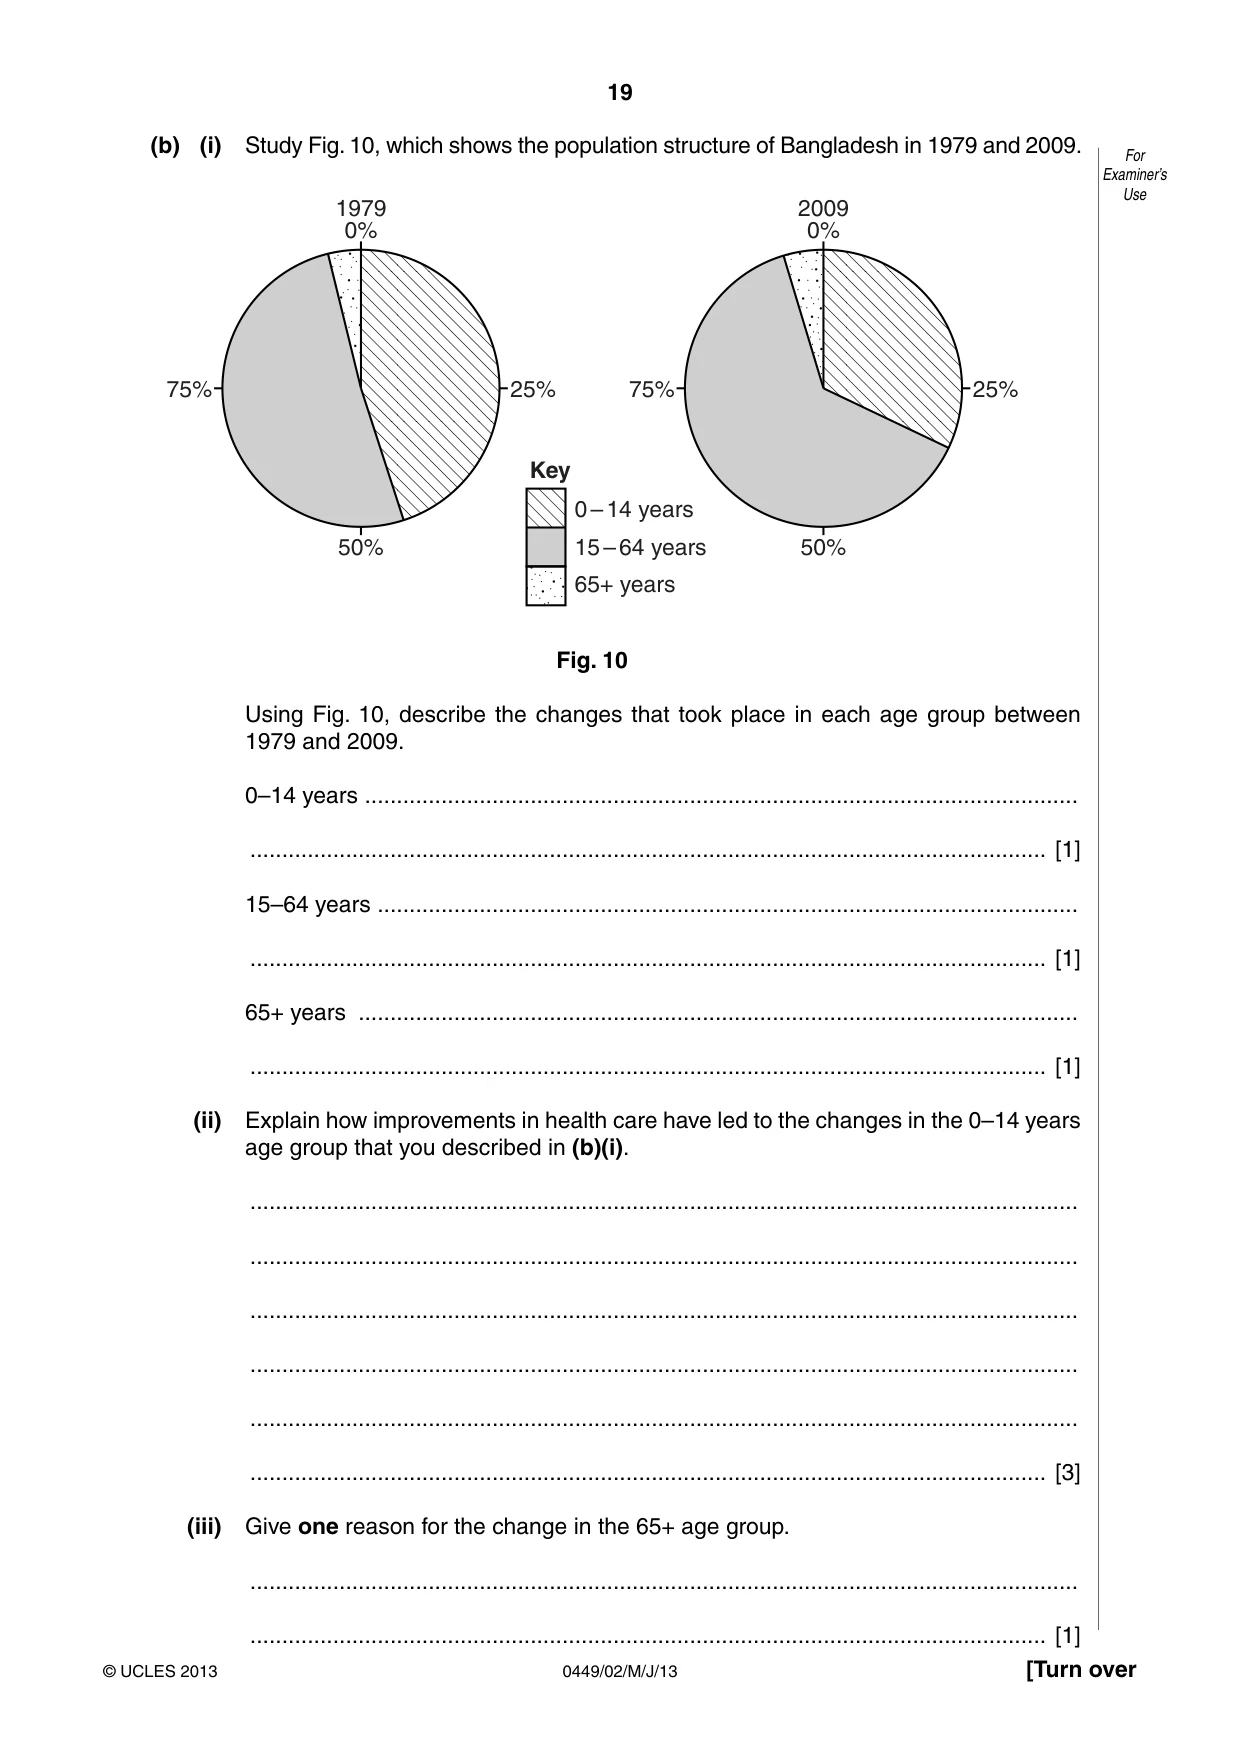
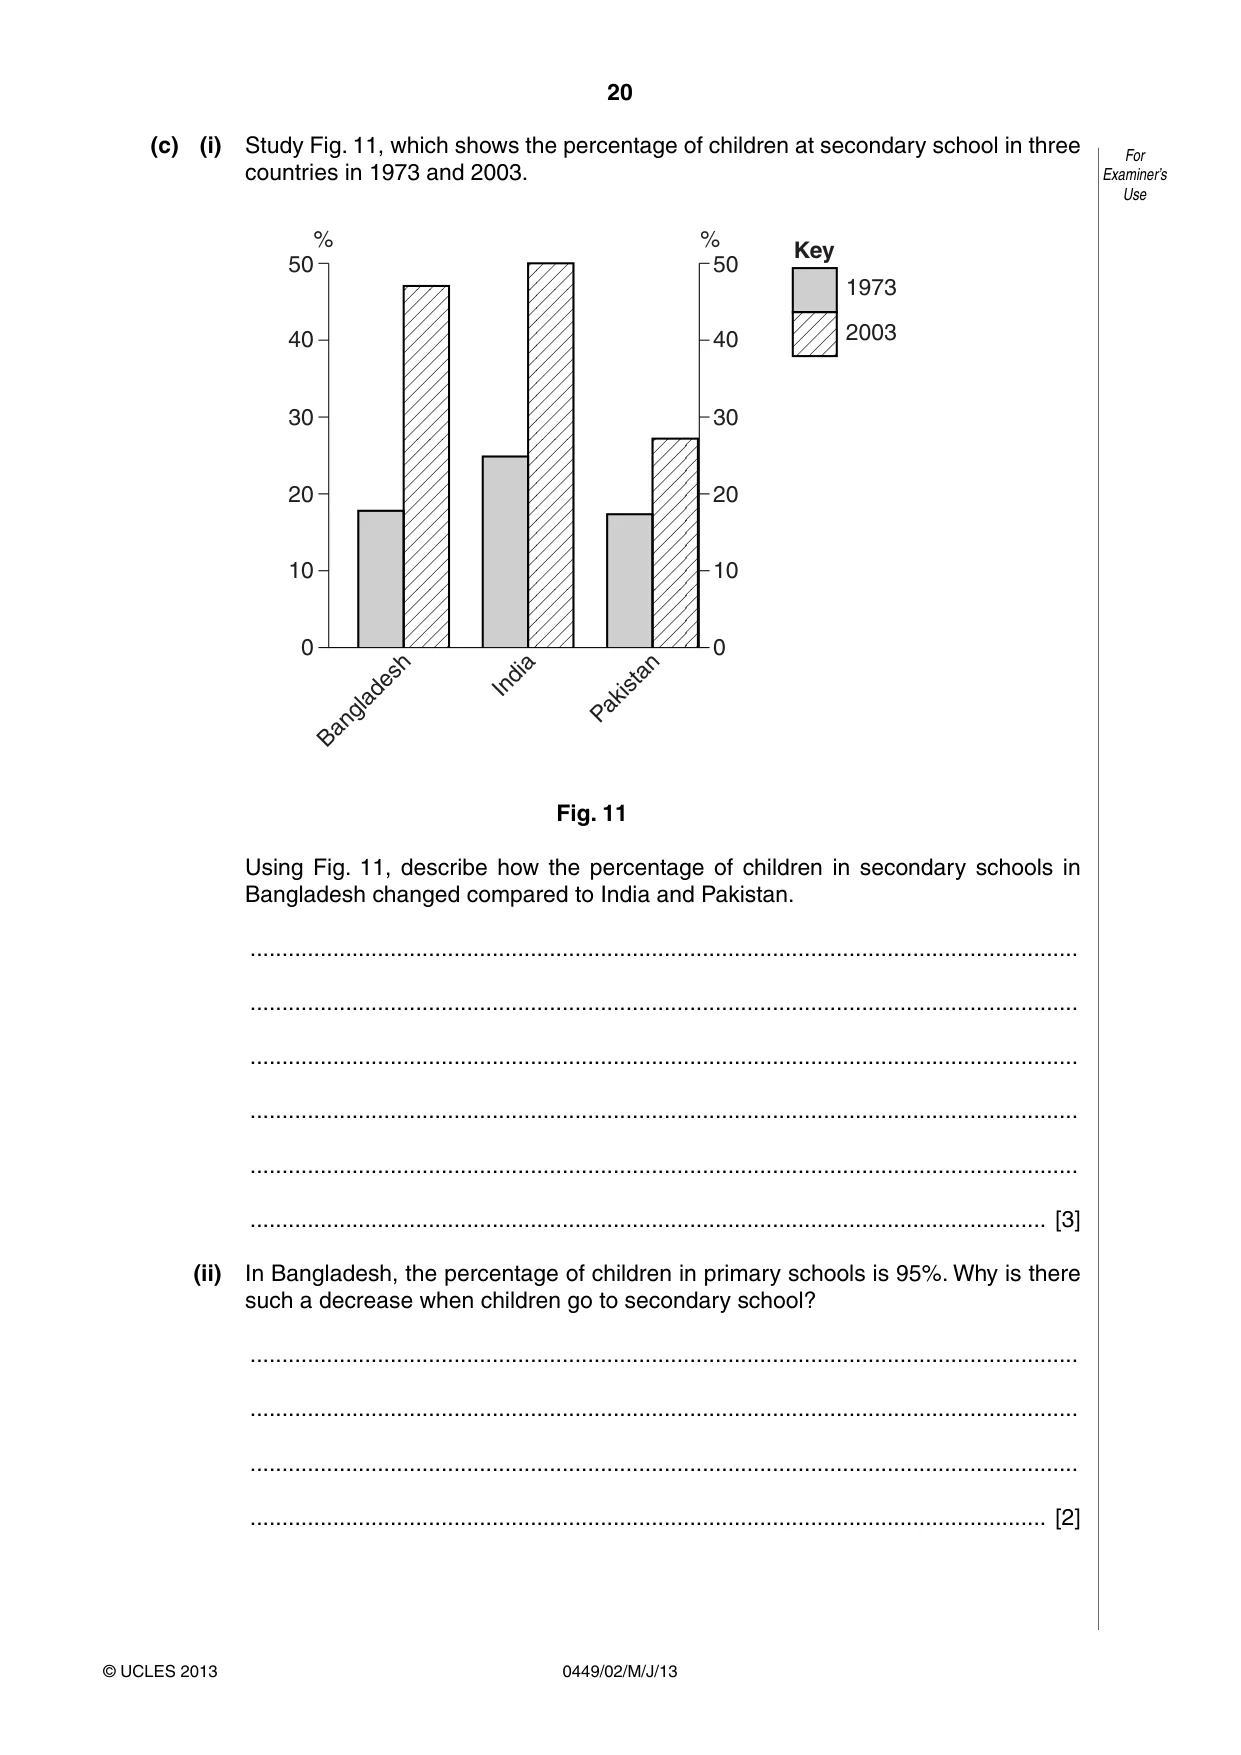
5 (a) (i) Study Fig. 9, which shows the percentage of the population living in rural and urban areas in Bangladesh. Key rural urban 1969 1979 years 1989 1999 2009 0 50 100 % Fig. 9 On Fig. 9, complete the bar for 2009 when 73% lived in rural areas and 27% lived in urban areas. (It has been left blank for you to fill in.) [2] (ii) What does Fig. 9 show about the changes to rural and urban populations in Bangladesh? .................................................................................................................................. ............................................................................................................................. [1] (iii) What are the effects in rural and urban areas of the changes shown in Fig. 9? in rural areas ............................................................................................................ .................................................................................................................................. .................................................................................................................................. .................................................................................................................................. in urban areas .......................................................................................................... .................................................................................................................................. .................................................................................................................................. .................................................................................................................................. ............................................................................................................................. [4] (b) (i) Study Fig. 10, which shows the population structure of Bangladesh in 1979 and 2009. 1979 2009 0% 0% 75% 25% 75% 25% Key 0 – 14 years 50% 15 – 64 years 50% 65+ years Fig. 10 Using Fig. 10, describe the changes that took place in each age group between 1979 and 2009. 0–14 years ................................................................................................................ ............................................................................................................................. [1] 15–64 years .............................................................................................................. ............................................................................................................................. [1] 65+ years ................................................................................................................. ............................................................................................................................. [1] (ii) Explain how improvements in health care have led to the changes in the 0–14 years age group that you described in (b)(i). .................................................................................................................................. .................................................................................................................................. .................................................................................................................................. .................................................................................................................................. .................................................................................................................................. ............................................................................................................................. [3] (iii) Give one reason for the change in the 65+ age group. .................................................................................................................................. ............................................................................................................................. [1] (c) (i) Study Fig. 11, which shows the percentage of children at secondary school in three countries in 1973 and 2003. % % Key 50 50 1973 2003 40 40 30 30 20 20 10 10 0 0 Bangladesh India Pakistan Fig. 11 Using Fig. 11, describe how the percentage of children in secondary schools in Bangladesh changed compared to India and Pakistan. .................................................................................................................................. .................................................................................................................................. .................................................................................................................................. .................................................................................................................................. .................................................................................................................................. ............................................................................................................................. [3] (ii) In Bangladesh, the percentage of children in primary schools is 95%. Why is there such a decrease when children go to secondary school? .................................................................................................................................. .................................................................................................................................. .................................................................................................................................. ............................................................................................................................. [2]
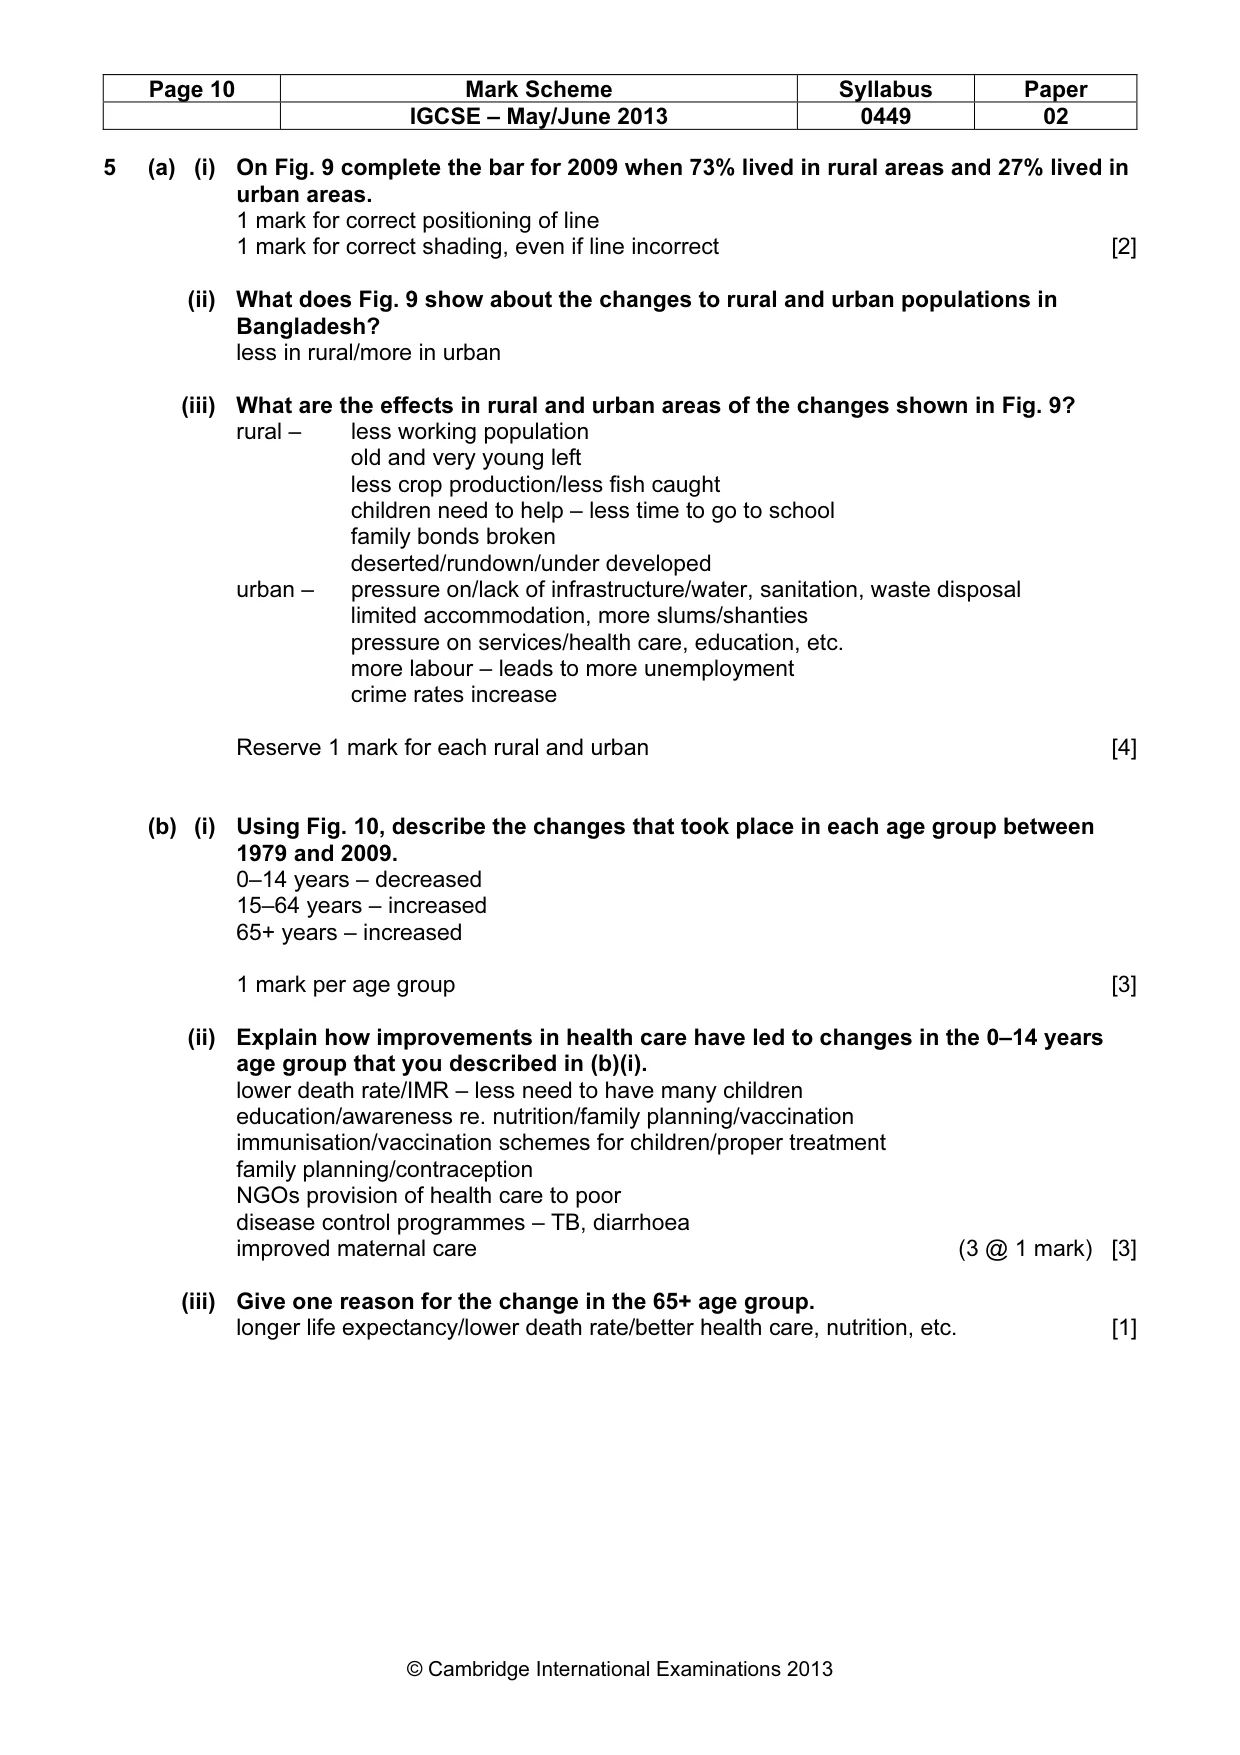
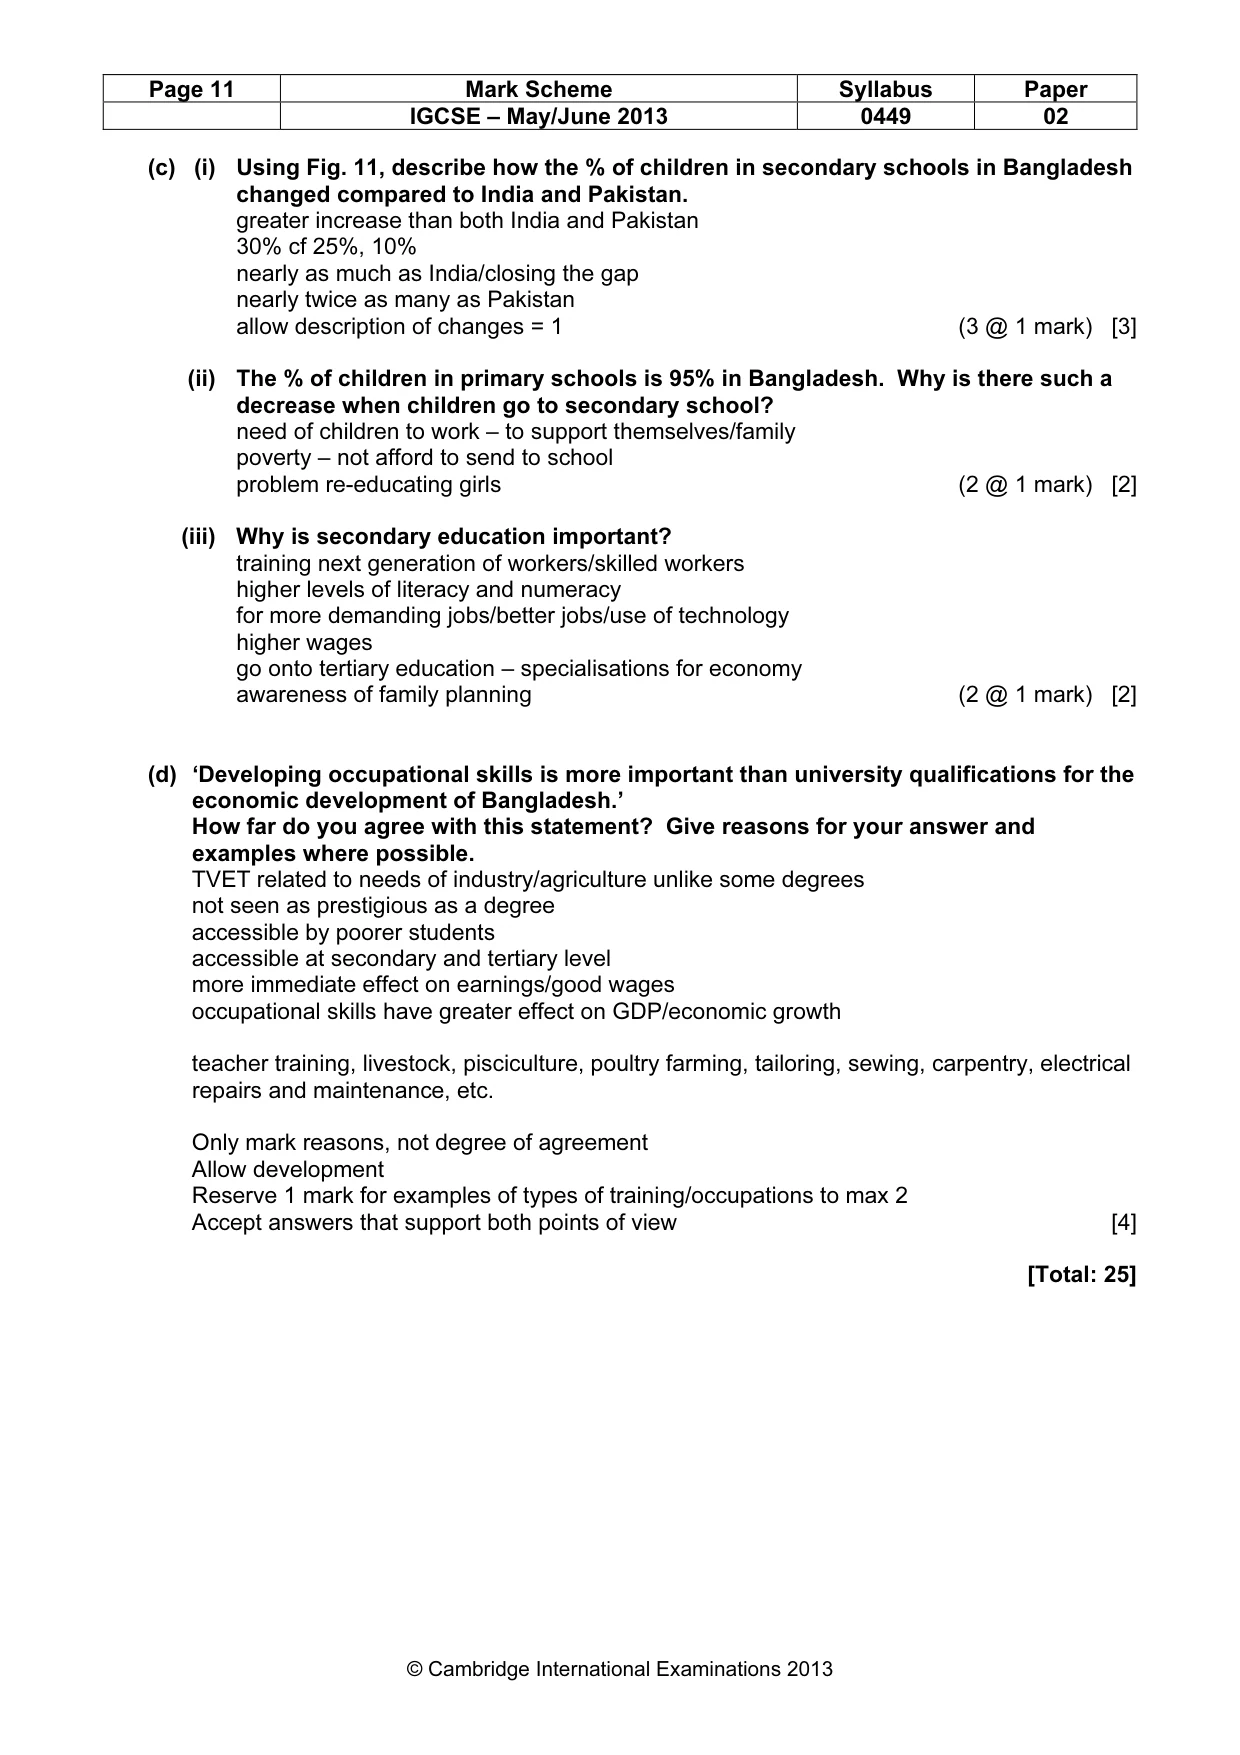
Mark scheme: 5 (a) (i) On Fig. 9 complete the bar for 2009 when 73% lived in rural areas and 27% lived in urban areas. 1 mark for correct positioning of line 1 mark for correct shading, even if line incorrect [2] (ii) What does Fig. 9 show about the changes to rural and urban populations in Bangladesh? less in rural/more in urban (iii) What are the effects in rural and urban areas of the changes shown in Fig. 9? rural – less working population old and very young left less crop production/less fish caught children need to help – less time to go to school family bonds broken deserted/rundown/under developed urban – pressure on/lack of infrastructure/water, sanitation, waste disposal limited accommodation, more slums/shanties pressure on services/health care, education, etc. more labour – leads to more unemployment crime rates increase Reserve 1 mark for each rural and urban [4] (b) (i) Using Fig. 10, describe the changes that took place in each age group between 1979 and 2009. 0–14 years – decreased 15–64 years – increased 65+ years – increased 1 mark per age group [3] (ii) Explain how improvements in health care have led to changes in the 0–14 years age group that you described in (b)(i). lower death rate/IMR – less need to have many children education/awareness re. nutrition/family planning/vaccination immunisation/vaccination schemes for children/proper treatment family planning/contraception NGOs provision of health care to poor disease control programmes – TB, diarrhoea improved maternal care (3 @ 1 mark) [3] (iii) Give one reason for the change in the 65+ age group. longer life expectancy/lower death rate/better health care, nutrition, etc. [1] IGCSE – May/June 2013 0449 02 (c) (i) Using Fig. 11, describe how the % of children in secondary schools in Bangladesh changed compared to India and Pakistan. greater increase than both India and Pakistan 30% cf 25%, 10% nearly as much as India/closing the gap nearly twice as many as Pakistan allow description of changes = 1 (3 @ 1 mark) [3] (ii) The % of children in primary schools is 95% in Bangladesh. Why is there such a decrease when children go to secondary school? need of children to work – to support themselves/family poverty – not afford to send to school problem re-educating girls (2 @ 1 mark) [2] (iii) Why is secondary education important? training next generation of workers/skilled workers higher levels of literacy and numeracy for more demanding jobs/better jobs/use of technology higher wages go onto tertiary education – specialisations for economy awareness of family planning (2 @ 1 mark) [2] (d) ‘Developing occupational skills is more important than university qualifications for the economic development of Bangladesh.’ How far do you agree with this statement? Give reasons for your answer and examples where possible. TVET related to needs of industry/agriculture unlike some degrees not seen as prestigious as a degree accessible by poorer students accessible at secondary and tertiary level more immediate effect on earnings/good wages occupational skills have greater effect on GDP/economic growth teacher training, livestock, pisciculture, poultry farming, tailoring, sewing, carpentry, electrical repairs and maintenance, etc. Only mark reasons, not degree of agreement Allow development Reserve 1 mark for examples of types of training/occupations to max 2 Accept answers that support both points of view [4] [Total: 25]
What you needed in this session
Cambridge’s own grade thresholds for 2013 May/June, Paper 2 · Variant 1. A higher threshold means an easier paper — the bar moves with how the cohort did.