Cambridge A Level Mathematics 9709 — 2016 Oct/Nov Paper 6 · Variant 1
9709/61/O/N/16 · 5 questions · 50 marks · ≈56 min
The question paper and its mark scheme, free to read here and free to download. This is Cambridge’s own paper, exactly as it was sat.
Question paper4 pages
Mark scheme6 pages
Answers below. Sit the paper first if you are practising.
Questions as text
Q2 · Two fair six-sided dice with faces numbered 1, 2, 3, 4, 5, 6 are thrown and the two…
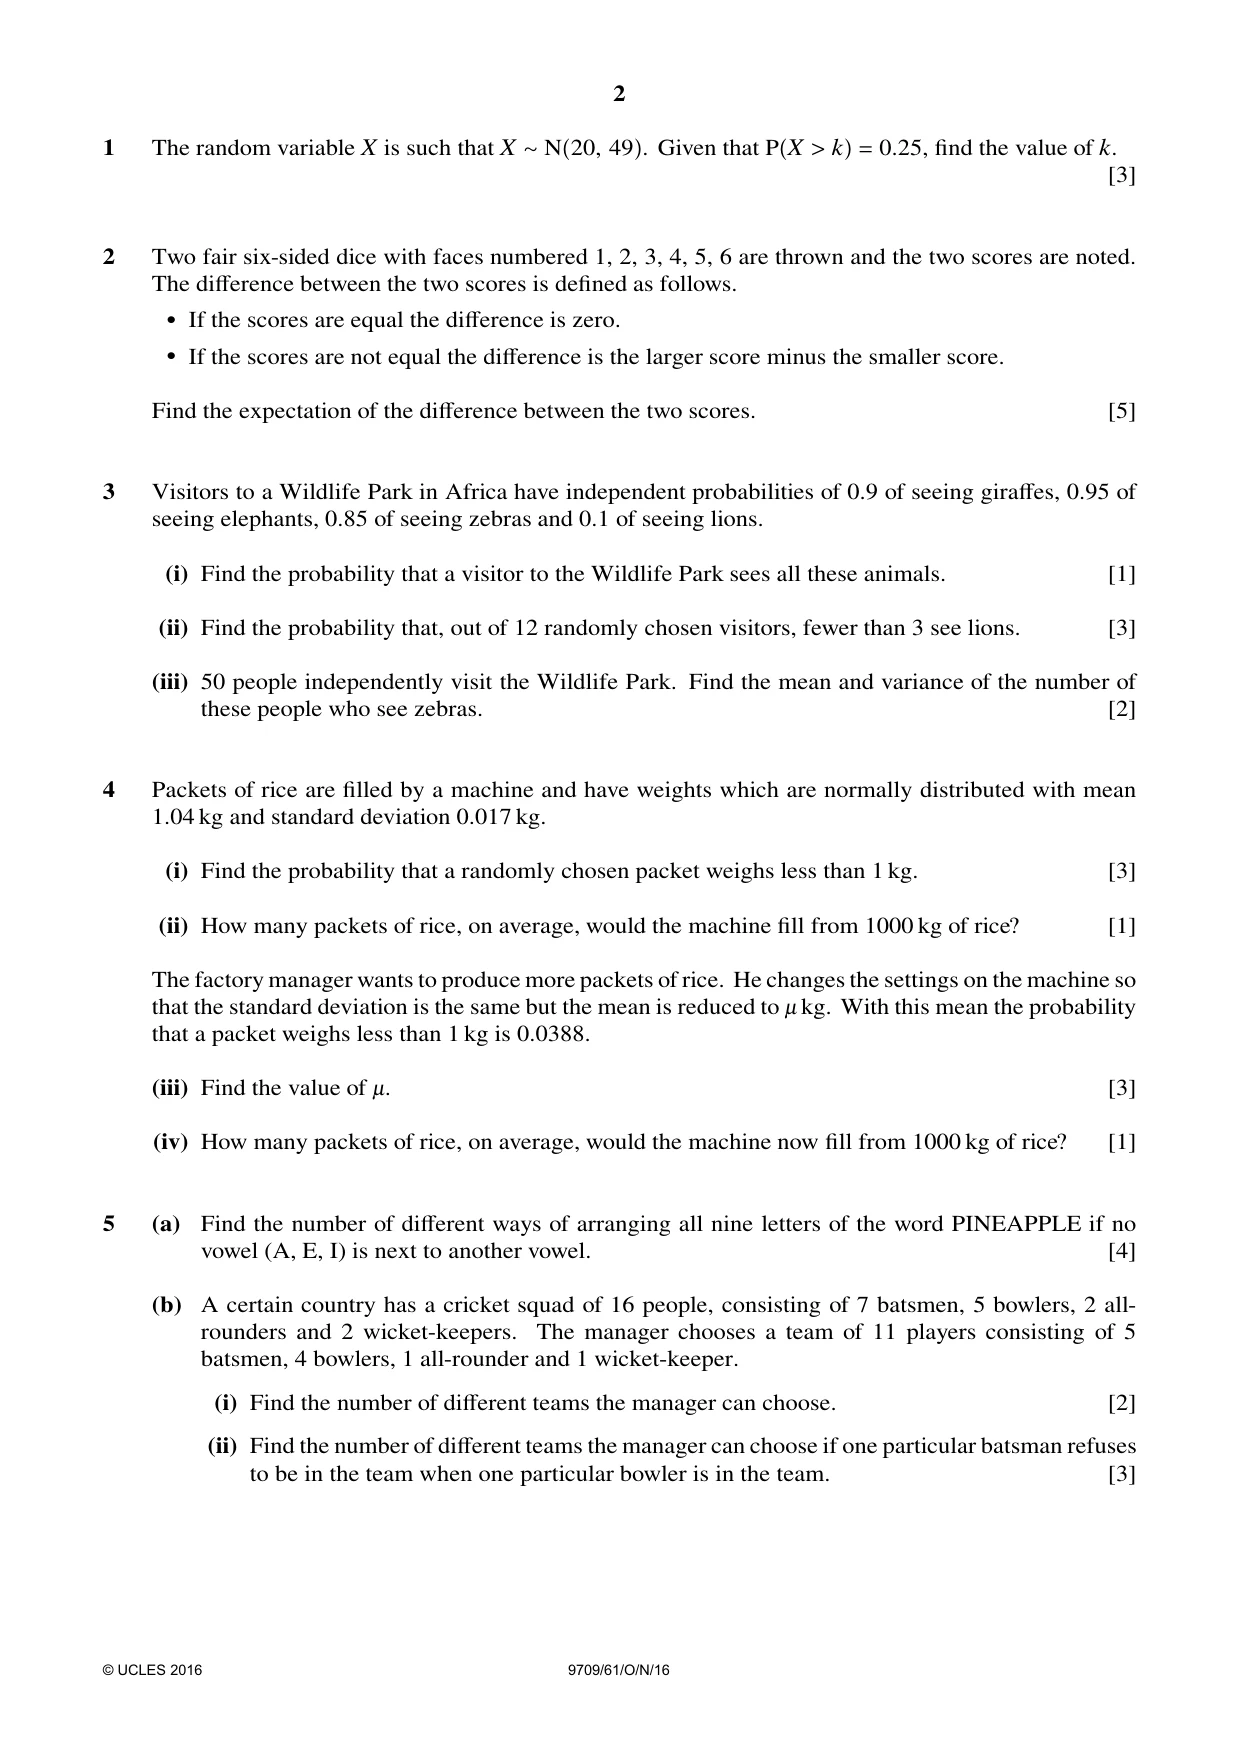
2 Two fair six-sided dice with faces numbered 1, 2, 3, 4, 5, 6 are thrown and the two scores are noted. The difference between the two scores is defined as follows. • If the scores are equal the difference is zero. • If the scores are not equal the difference is the larger score minus the smaller score. Find the expectation of the difference between the two scores. [5]
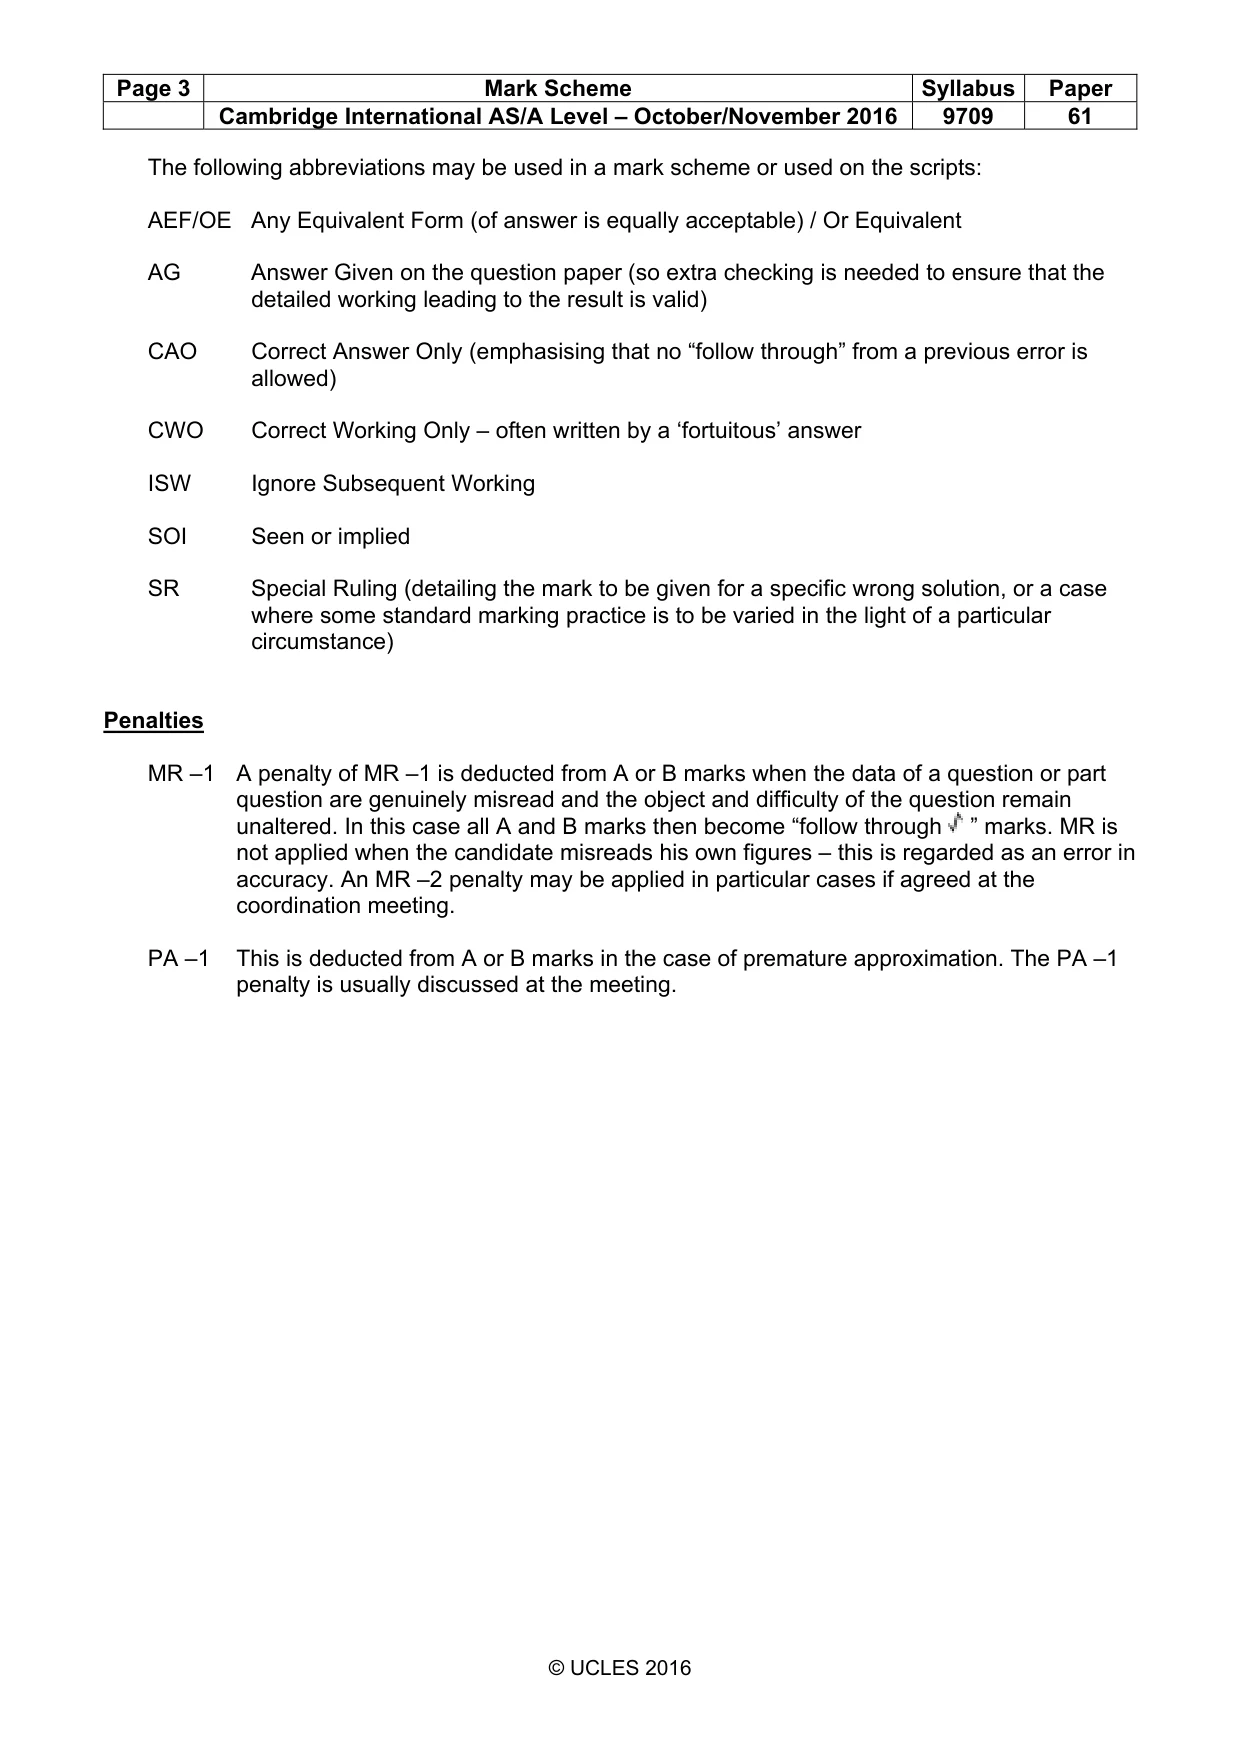
Mark scheme: 2 diff 0 1 2 3 4 5 B1 0, 1, 2, 3, 4, 5 seen in table heading or considering all prob 6/36 10/36 8/36 6/36 4/36 2/36 different differences M1 Attempt at finding prob of any difference A1 1 correct prob Expectation = (0+10+16+18+16+10)/36 M1 Probs summing to 1 = 70/36 = 1.94 A1 [5]
Q3 · Visitors to a Wildlife Park in Africa have independent probabilities of 0.9 of seeing…
3 Visitors to a Wildlife Park in Africa have independent probabilities of 0.9 of seeing giraffes, 0.95 of seeing elephants, 0.85 of seeing zebras and 0.1 of seeing lions. (i) Find the probability that a visitor to the Wildlife Park sees all these animals. [1] (ii) Find the probability that, out of 12 randomly chosen visitors, fewer than 3 see lions. [3] (iii) 50 people independently visit the Wildlife Park. Find the mean and variance of the number of these people who see zebras. [2]
Mark scheme: 3 (i) 0.9 × 0.95 × 0.85 × 0.1= 0.0727 B1 [1] (ii) P(0, 1, 2) M1 Bin term 12Cx (p)x(1 – p)12 – x p < 1, x ≠ 0 = (0.9)12 + 12C1 (0.1)(0.9)11 + 12C2 (0.1)2(0.9)10 M1 Bin expression p = 0.1 or 0.9, n = 12, 2 or 3 terms = 0.889 A1 [3] (iii) X ~ B(50, 0.85) M1 50 × 0.85 seen oe can be implied Expectation = 50 × 0.85 (= 42.5) Correct unsimplified mean and Var = 50 × 0.85 × 0.15 (= 6.375) A1 [2] var 1 − 1 04 √
Q4 · Packets of rice are filled by a machine and have weights which are normally distributed…
4 Packets of rice are filled by a machine and have weights which are normally distributed with mean 1.04 kg and standard deviation 0.017 kg. (i) Find the probability that a randomly chosen packet weighs less than 1 kg. [3] (ii) How many packets of rice, on average, would the machine fill from 1000 kg of rice? [1] The factory manager wants to produce more packets of rice. He changes the settings on the machine so that the standard deviation is the same but the mean is reduced to - kg. With this mean the probability that a packet weighs less than 1 kg is 0.0388. (iii) Find the value of -. [3] (iv) How many packets of rice, on average, would the machine now fill from 1000 kg of rice? [1]
Mark scheme: 1 − 1.04 4 (i) P(< 1) = P z < = P(z < –2.353) M1 Standardising no cc, no √ or sq 0.017 = 1 – 0.9907 M1 1 – Φ (final process) = 0.0093 A1 [3] (ii) expected number 1000 ÷ 1.04 = 961 or 962 B1 [1] Or anything in between (iii) z = –1.765 B1 ± 1.76 to 1.77 1 − µ −1.765 = M1 Standardising must have a z- 0.017 value, allow √ or sq [3] =1.03 A1 (iv) expected number = 1000 ÷ 1.03 = 971 or 970 B1 [1] Or anything in between, ft their (iii)
Q5 · Find the number of different ways of arranging all nine letters of the word PINEAPPLE if…
5 (a) Find the number of different ways of arranging all nine letters of the word PINEAPPLE if no vowel (A, E, I) is next to another vowel. [4] (b) A certain country has a cricket squad of 16 people, consisting of 7 batsmen, 5 bowlers, 2 all- rounders and 2 wicket-keepers. The manager chooses a team of 11 players consisting of 5 batsmen, 4 bowlers, 1 all-rounder and 1 wicket-keeper. (i) Find the number of different teams the manager can choose. [2] (ii) Find the number of different teams the manager can choose if one particular batsman refuses to be in the team when one particular bowler is in the team. [3]
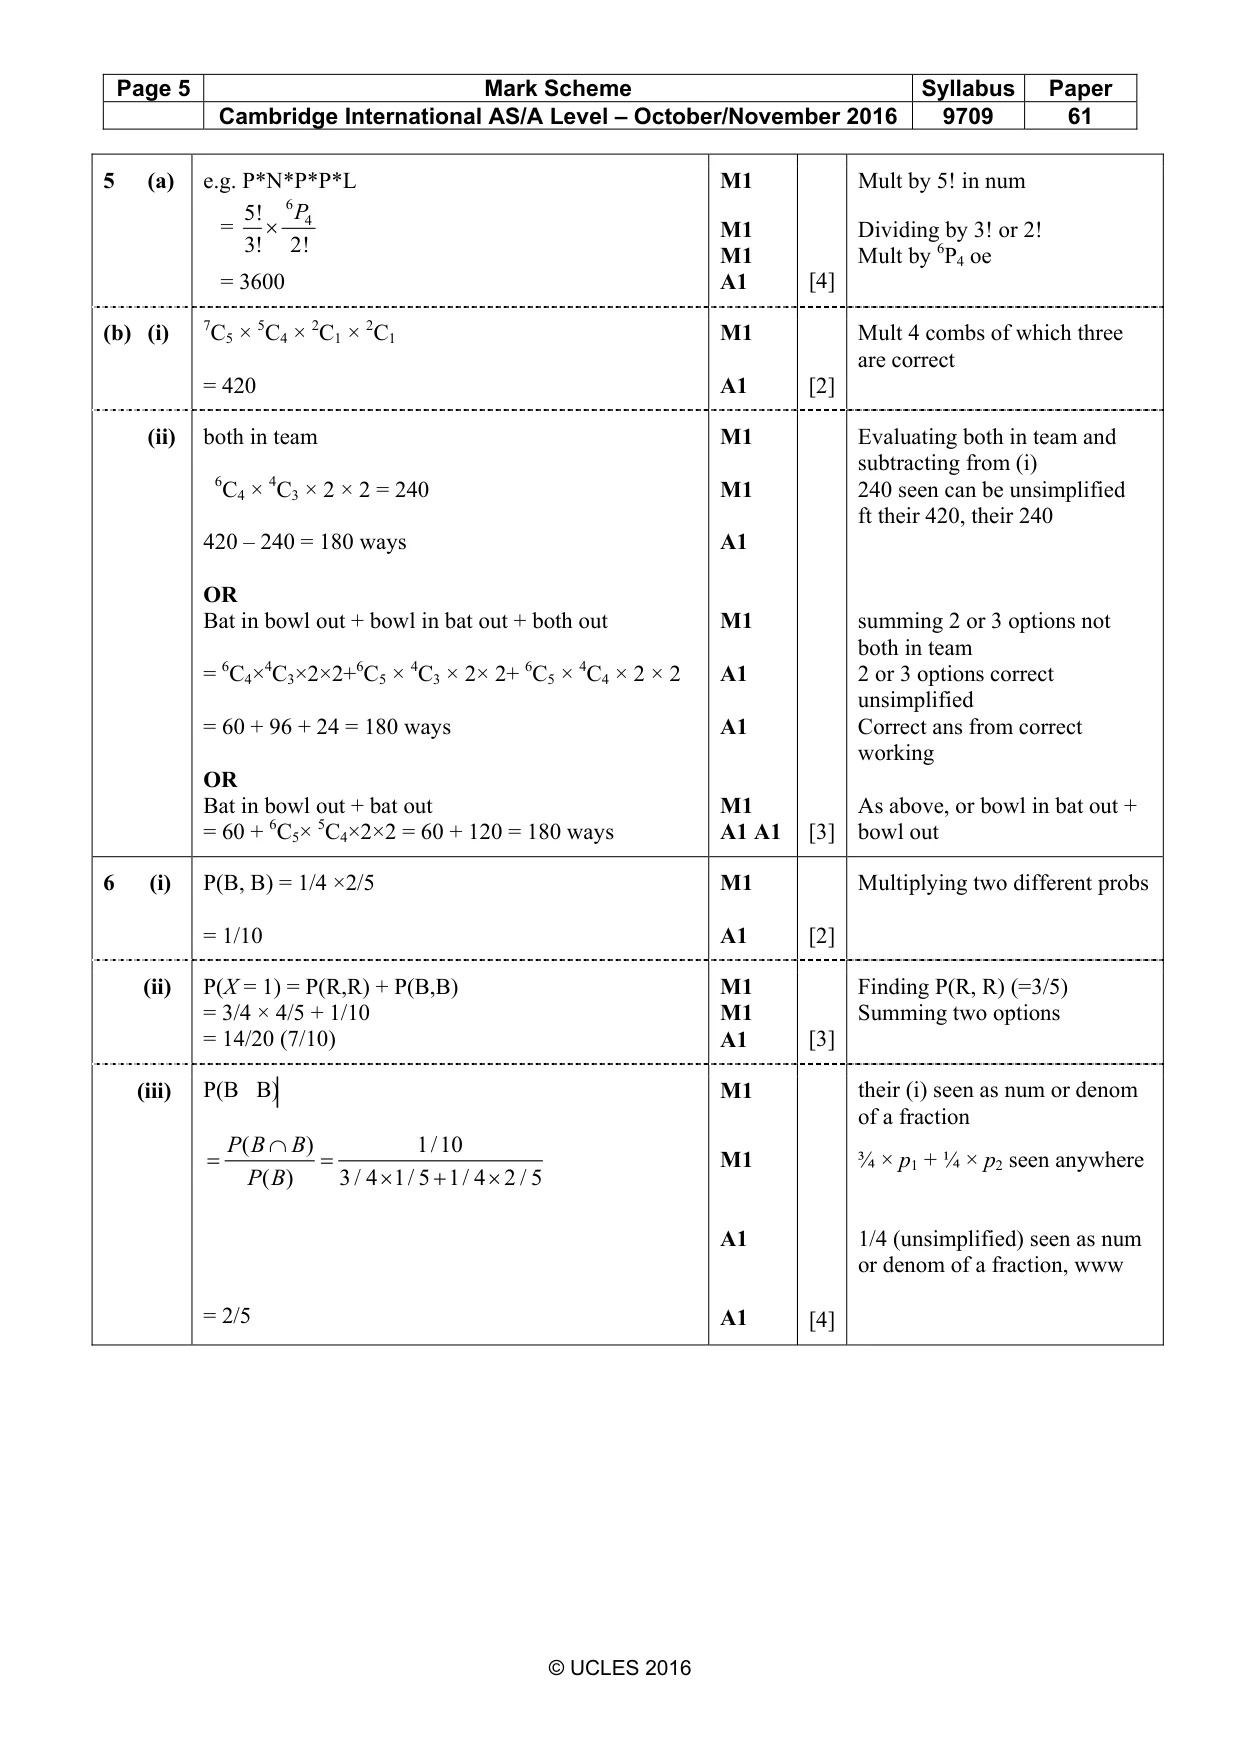
Mark scheme: 5 (a) e.g. P*N*P*P*L M1 Mult by 5! in num 5! 6 P4 = × M1 Dividing by 3! or 2! 3! 2! M1 Mult by 6P4 oe = 3600 A1 [4] (b) (i) 7C5 × 5C4 × 2C1 × 2C1 M1 Mult 4 combs of which three are correct = 420 A1 [2] (ii) both in team M1 Evaluating both in team and subtracting from (i) 6C4 × 4C3 × 2 × 2 = 240 M1 240 seen can be unsimplified ft their 420, their 240 420 – 240 = 180 ways A1 OR Bat in bowl out + bowl in bat out + both out M1 summing 2 or 3 options not both in team = 6C4×4C3×2×2+6C5 × 4C3 × 2× 2+ 6C5 × 4C4 × 2 × 2 A1 2 or 3 options correct unsimplified = 60 + 96 + 24 = 180 ways A1 Correct ans from correct working OR Bat in bowl out + bat out M1 As above, or bowl in bat out + = 60 + 6C5× 5C4×2×2 = 60 + 120 = 180 ways A1 A1 [3] bowl out
Q7 · The masses, in grams, of components made in factory A and components made in factory B…
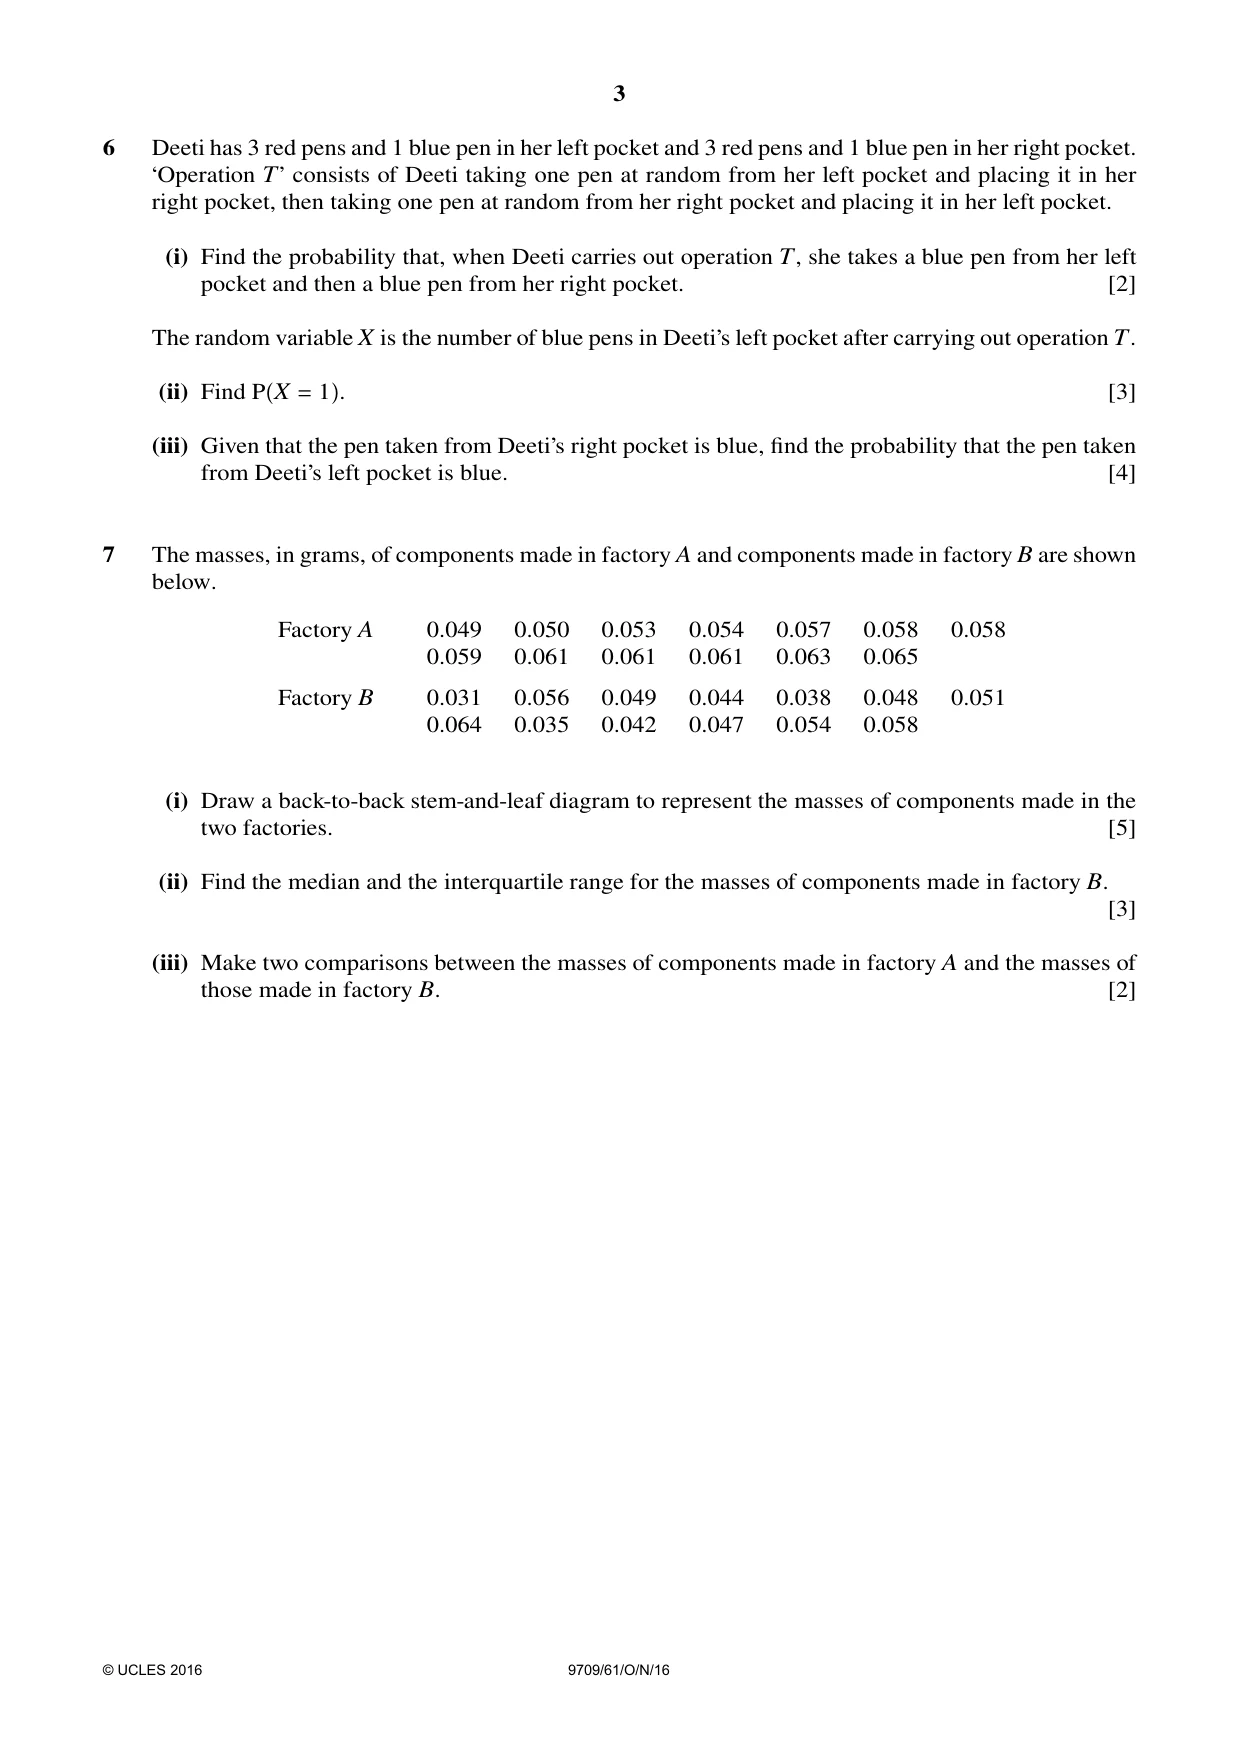
7 The masses, in grams, of components made in factory A and components made in factory B are shown below. Factory A 0.049 0.050 0.053 0.054 0.057 0.058 0.058 0.059 0.061 0.061 0.061 0.063 0.065 Factory B 0.031 0.056 0.049 0.044 0.038 0.048 0.051 0.064 0.035 0.042 0.047 0.054 0.058 (i) Draw a back-to-back stem-and-leaf diagram to represent the masses of components made in the two factories. [5] (ii) Find the median and the interquartile range for the masses of components made in factory B. [3] (iii) Make two comparisons between the masses of components made in factory A and the masses of those made in factory B. [2]
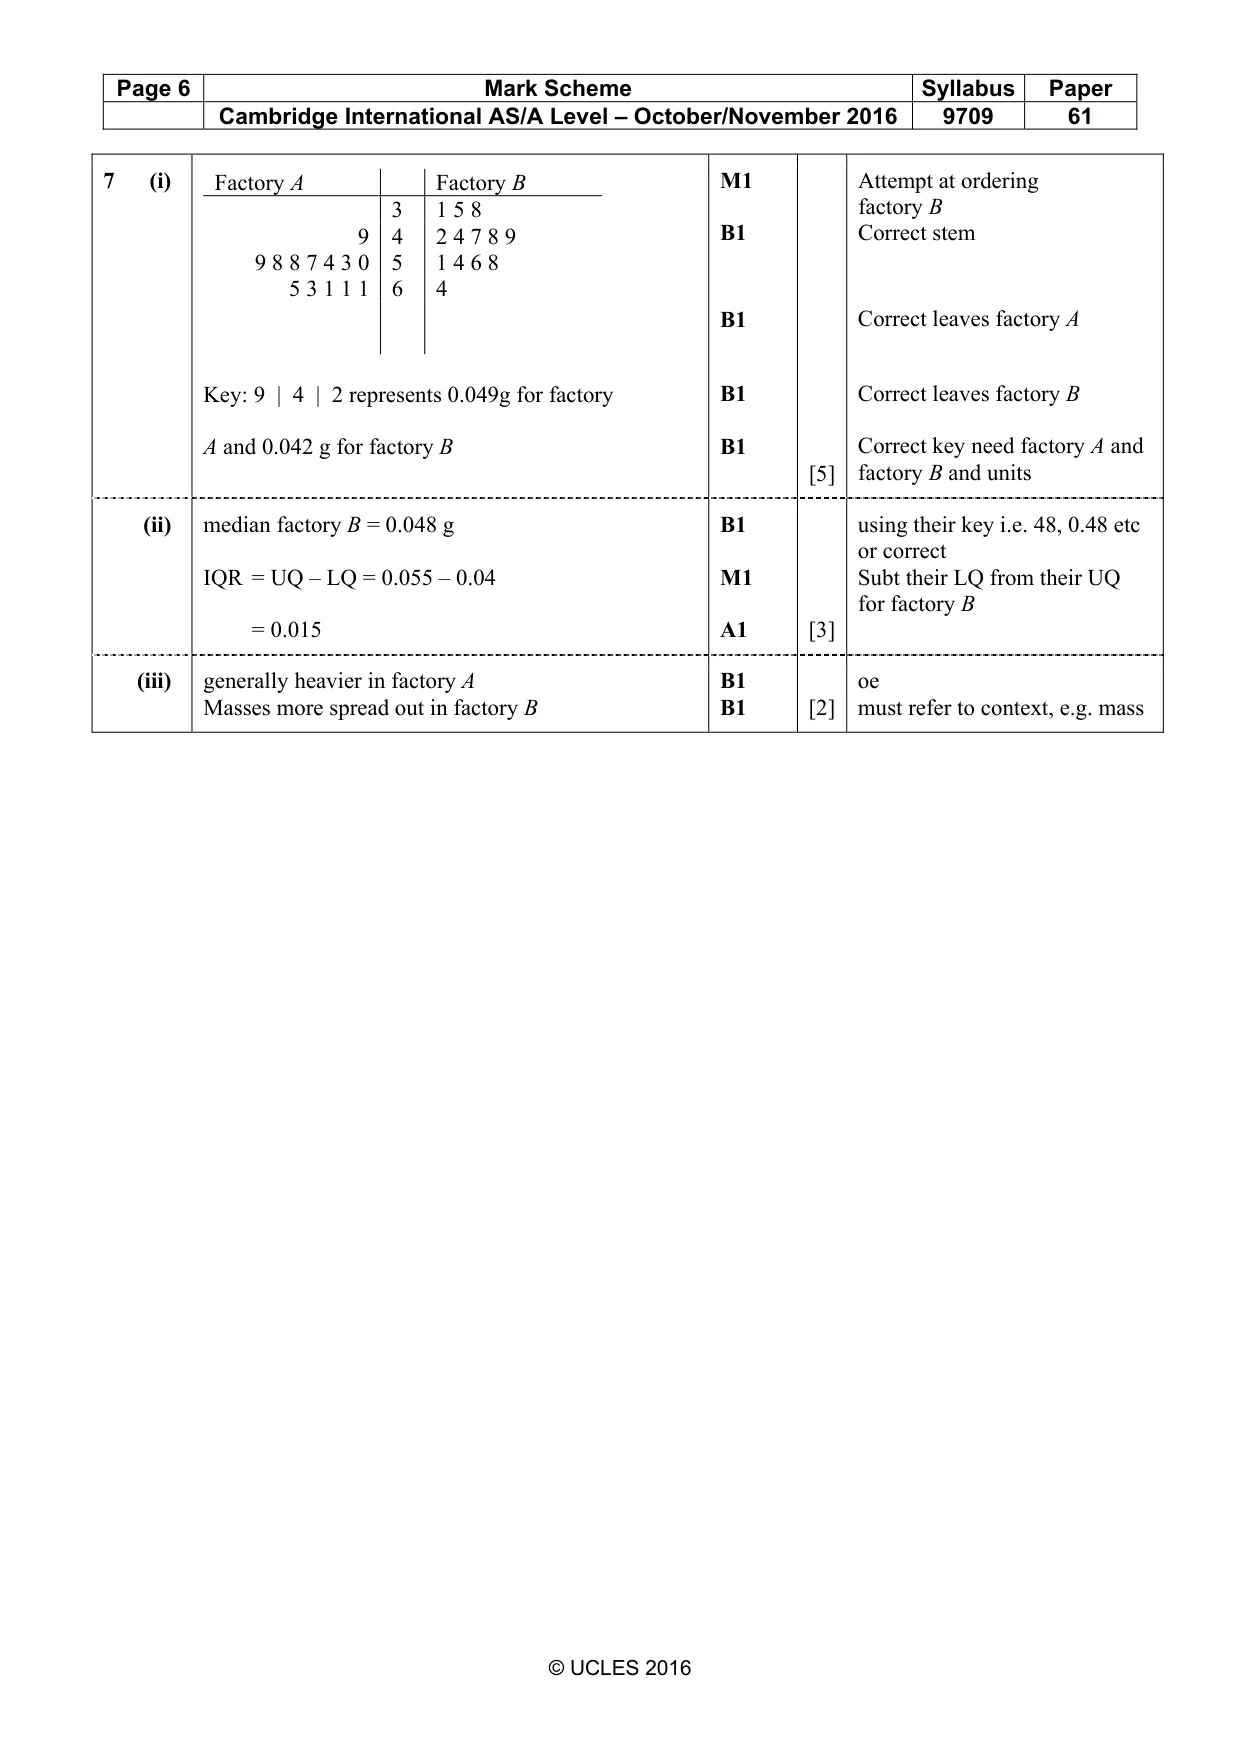
Mark scheme: 7 (i) Factory A Factory B M1 Attempt at ordering 3 1 5 8 factory B 9 4 2 4 7 8 9 B1 Correct stem 9 8 8 7 4 3 0 5 1 4 6 8 5 3 1 1 1 6 4 B1 Correct leaves factory A Key: 9 | 4 | 2 represents 0.049g for factory B1 Correct leaves factory B A and 0.042 g for factory B B1 Correct key need factory A and [5] factory B and units (ii) median factory B = 0.048 g B1 using their key i.e. 48, 0.48 etc or correct IQR = UQ – LQ = 0.055 – 0.04 M1 Subt their LQ from their UQ for factory B = 0.015 A1 [3] (iii) generally heavier in factory A B1 oe Masses more spread out in factory B B1 [2] must refer to context, e.g. mass
What was in this paper
The subtopics covered by these 5 questions, and how many questions each got. Open one in a new tab to see every Cambridge question on it.
What you needed in this session
Cambridge’s own grade thresholds for 2016 Oct/Nov, Paper 6 · Variant 1. A higher threshold means an easier paper — the bar moves with how the cohort did.