Cambridge A Level Marine Science 9693 — 2022 Oct/Nov Paper 4 · Variant 3
9693/43/O/N/22 · 5 questions · 75 marks · ≈84 min
The question paper and its mark scheme, free to read here and free to download. This is Cambridge’s own paper, exactly as it was sat.
Question paper20 pages




Mark scheme12 pages
Answers below. Sit the paper first if you are practising.
Questions as text
Q1 · Outline the light-dependent stage of photosynthesis
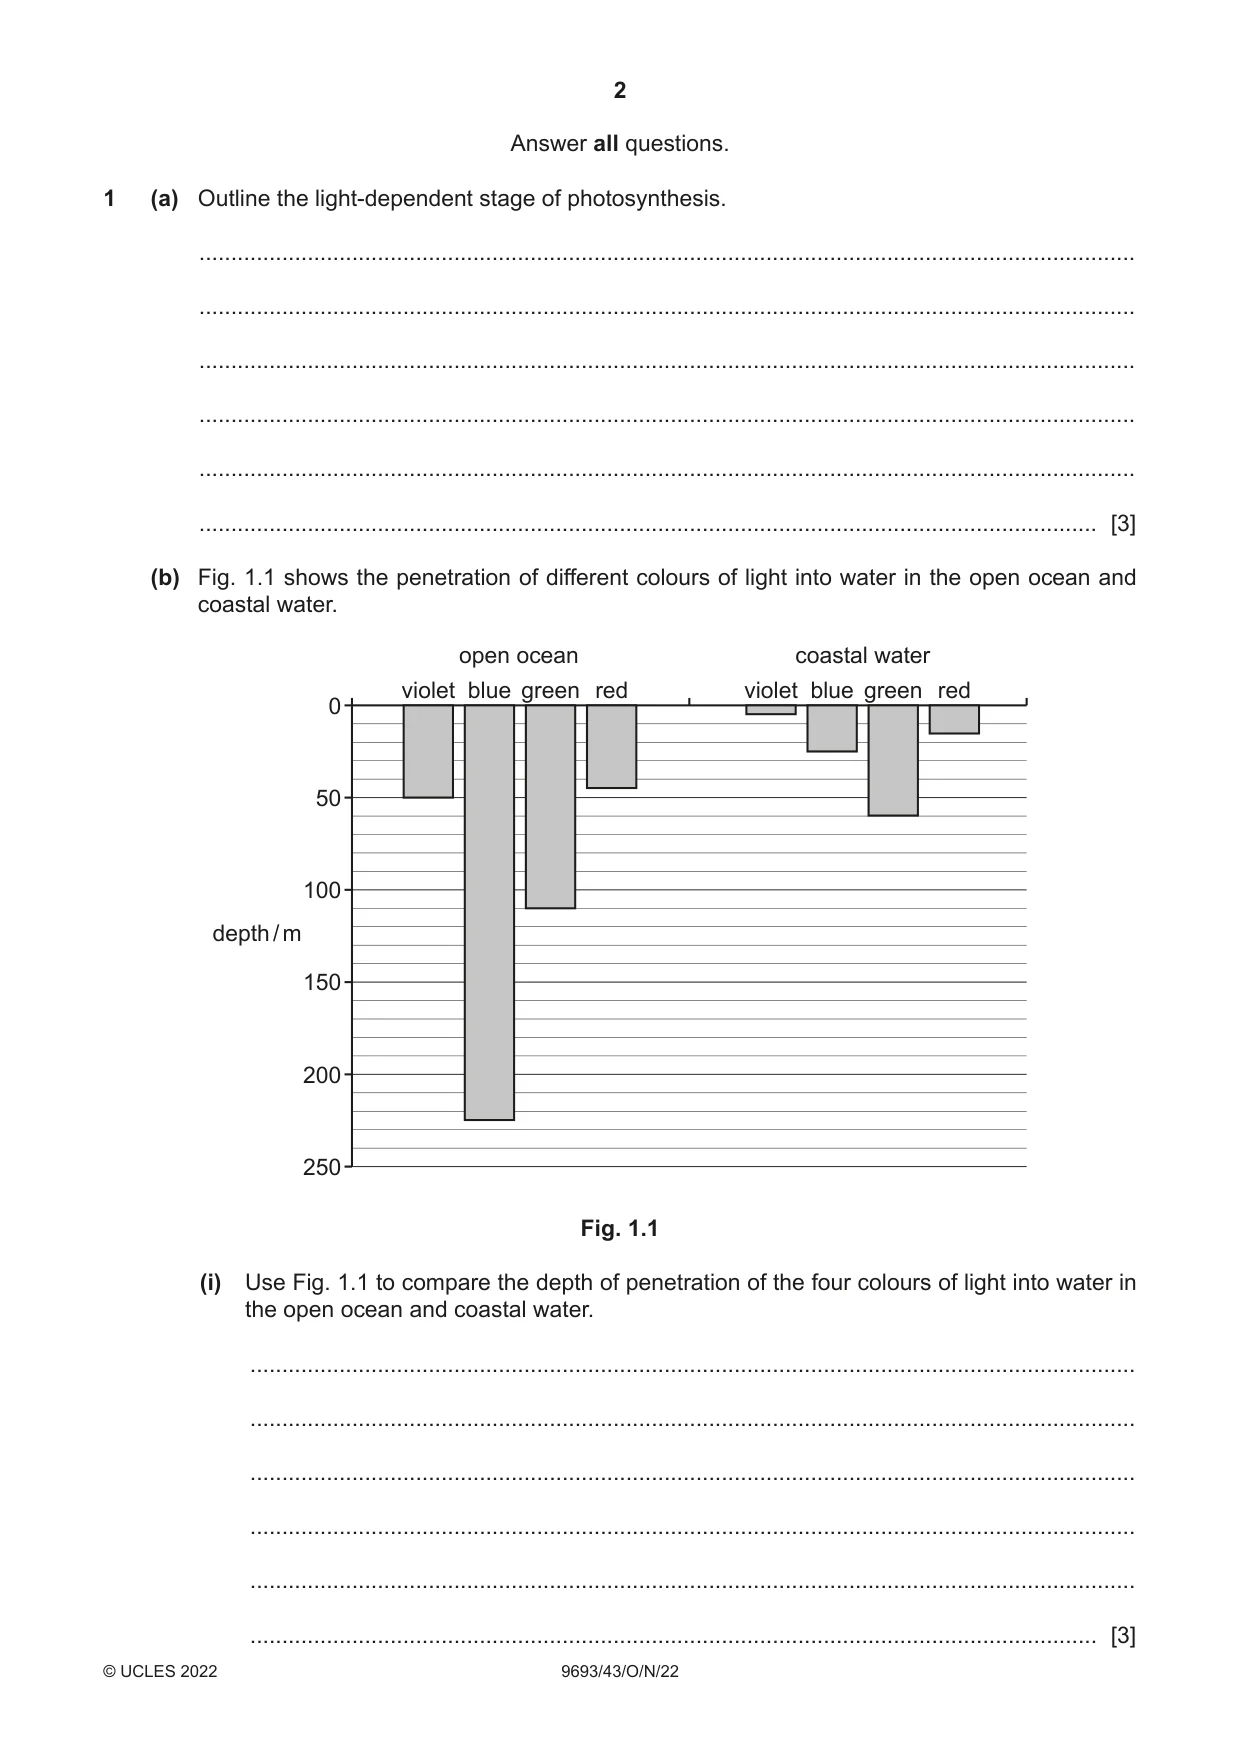
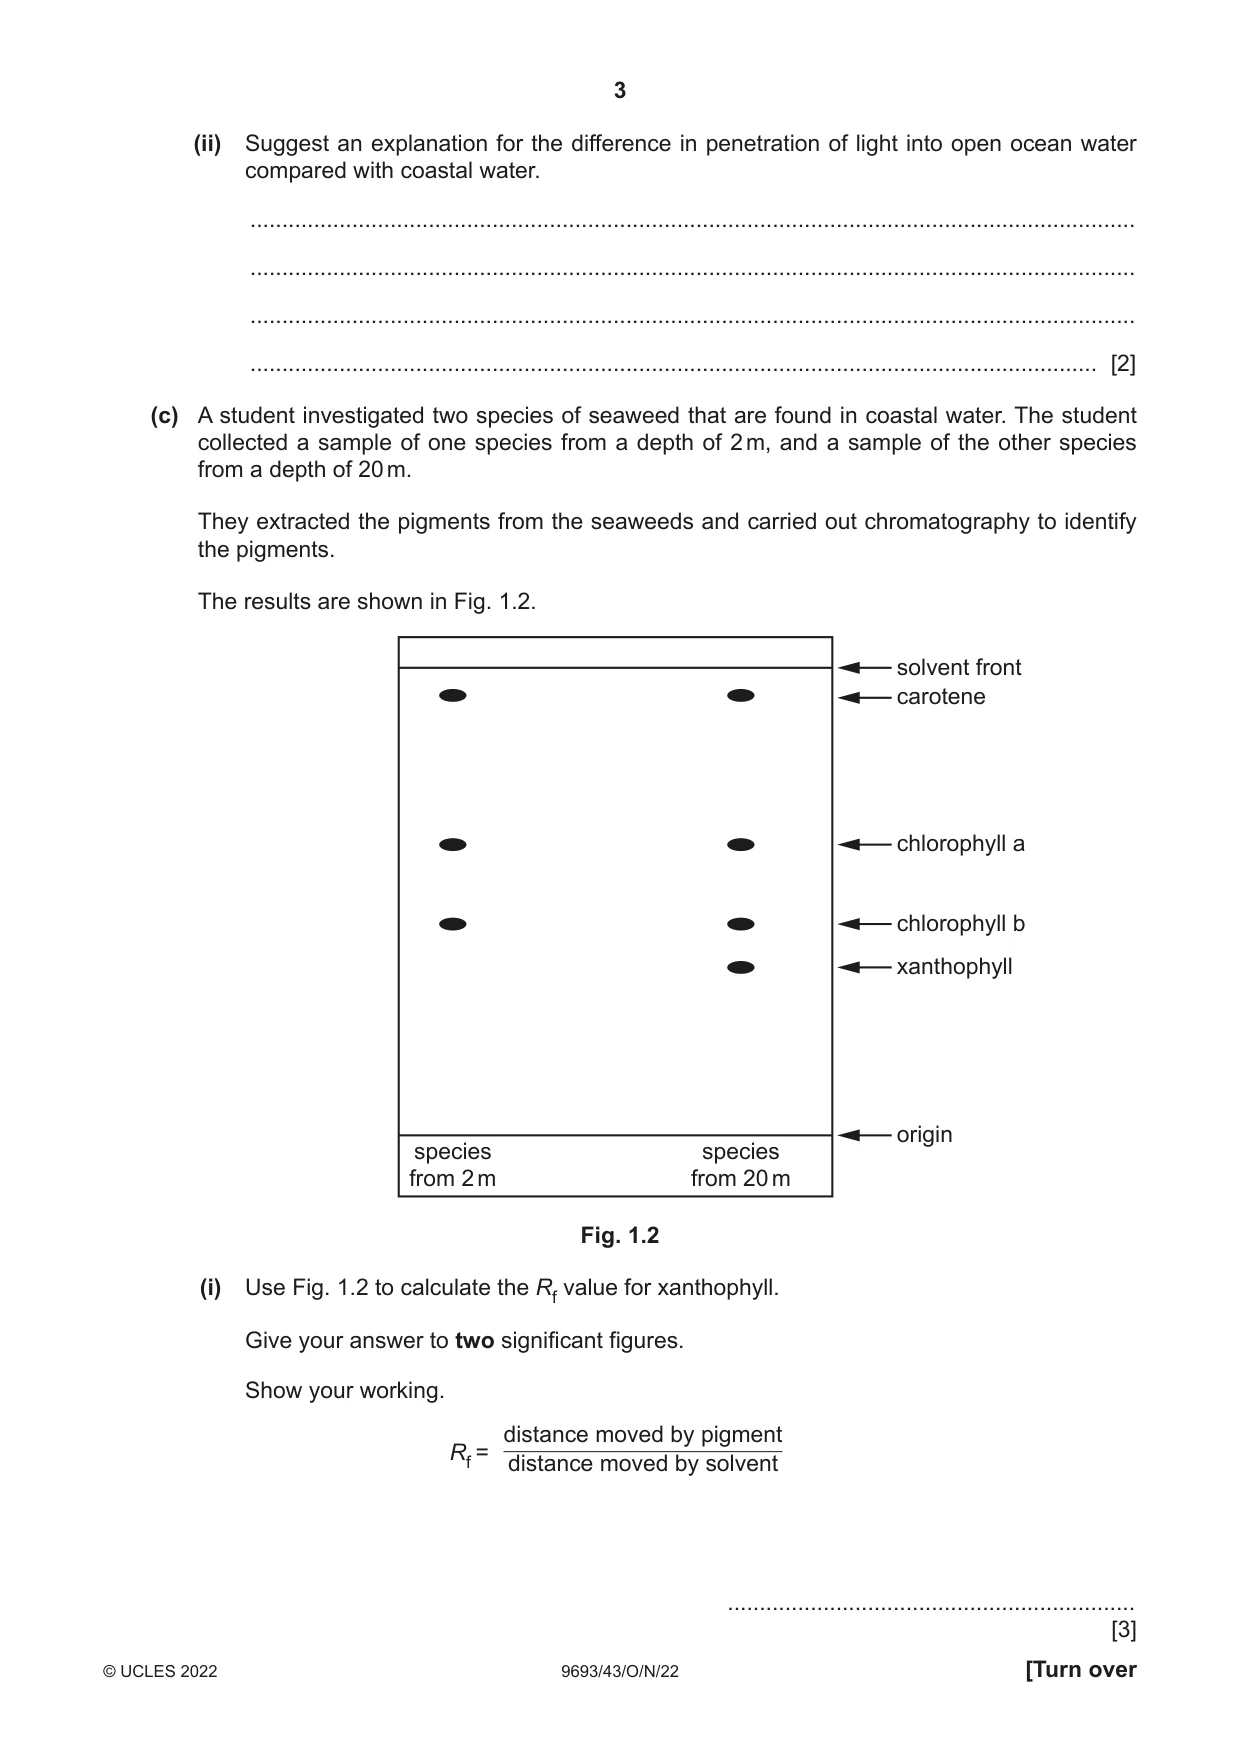
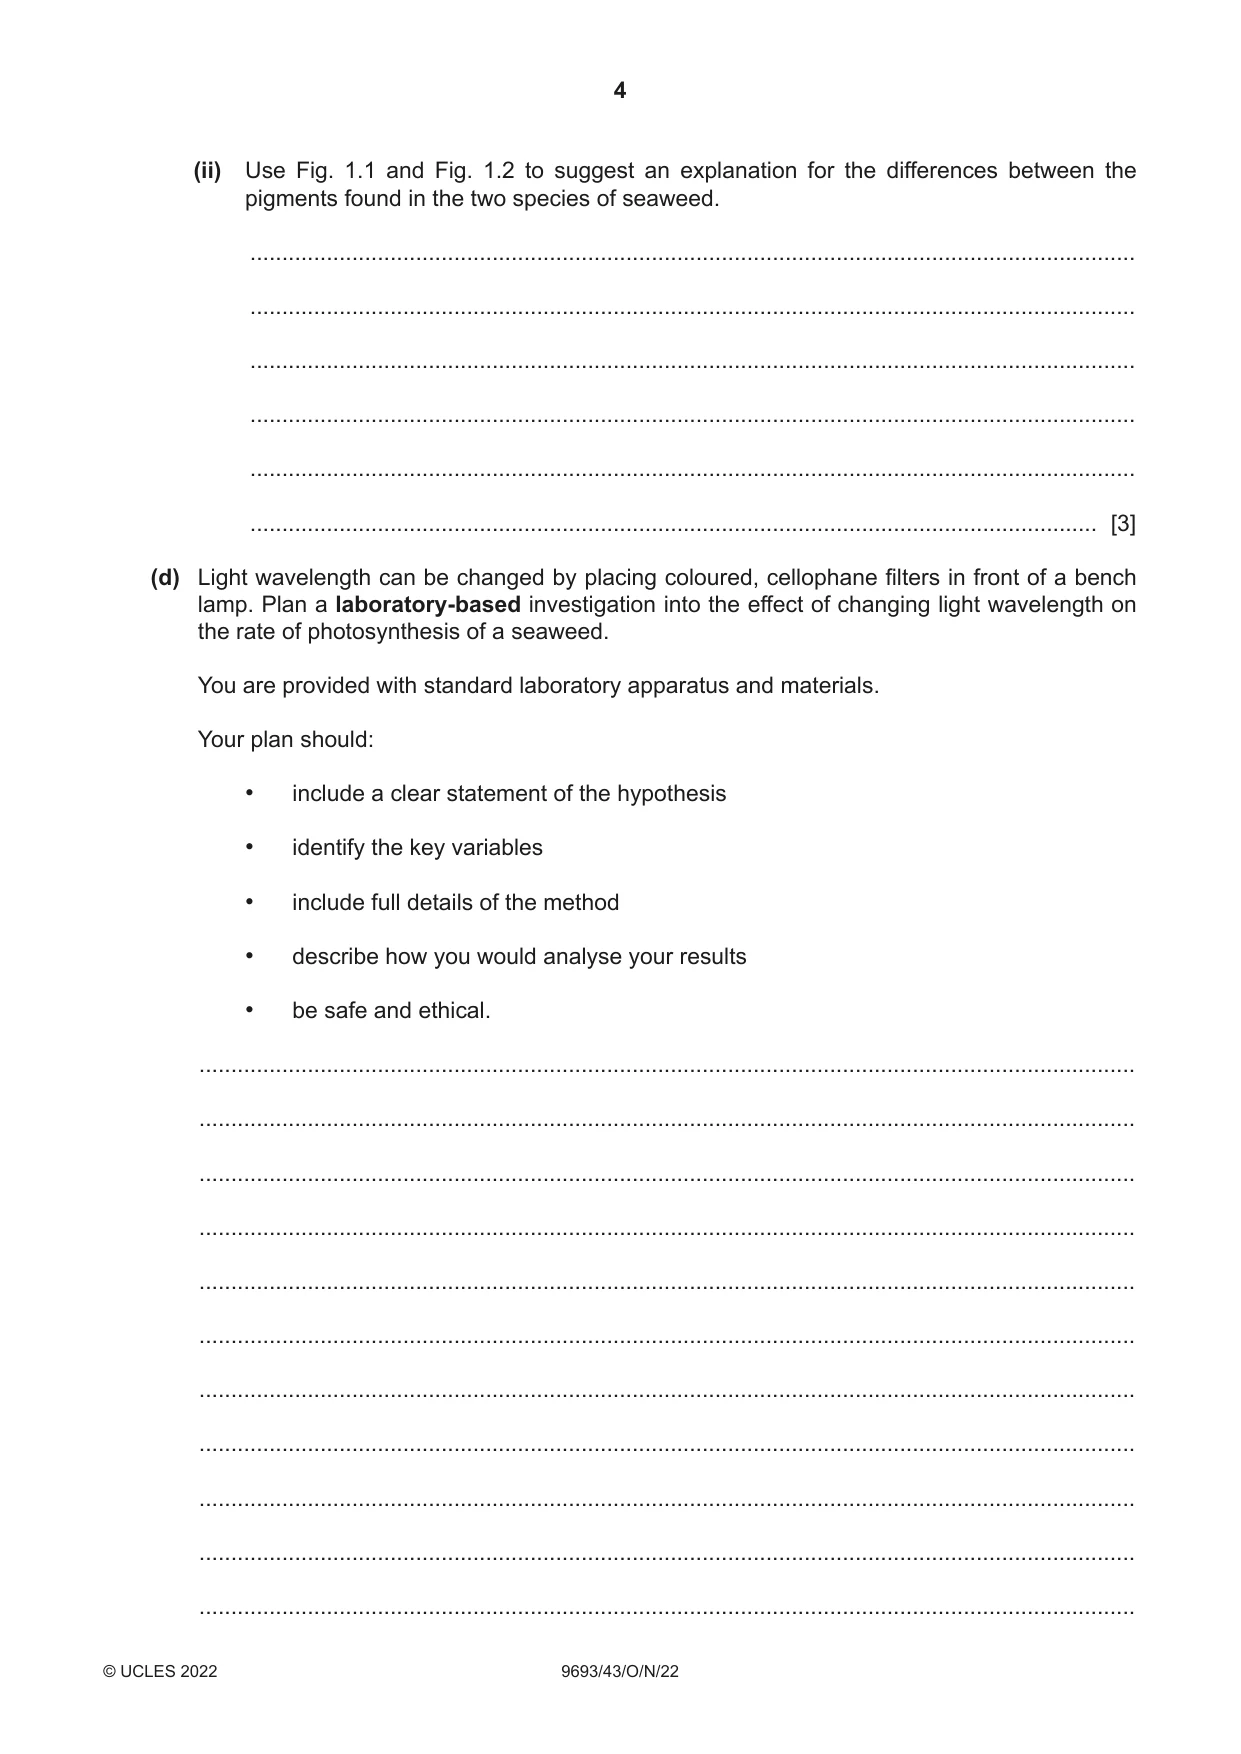
1 (a) Outline the light-dependent stage of photosynthesis. ................................................................................................................................................... ................................................................................................................................................... ................................................................................................................................................... ................................................................................................................................................... ................................................................................................................................................... ............................................................................................................................................. [3] (b) Fig. 1.1 shows the penetration of different colours of light into water in the open ocean and coastal water. open ocean coastal water violet blue green red violet blue green red 0 50 100 depth / m 150 200 250 Fig. 1.1 (i) Use Fig. 1.1 to compare the depth of penetration of the four colours of light into water in the open ocean and coastal water. ........................................................................................................................................... ........................................................................................................................................... ........................................................................................................................................... ........................................................................................................................................... ........................................................................................................................................... ..................................................................................................................................... [3] (ii) Suggest an explanation for the difference in penetration of light into open ocean water compared with coastal water. ........................................................................................................................................... ........................................................................................................................................... ........................................................................................................................................... ..................................................................................................................................... [2] (c) A student investigated two species of seaweed that are found in coastal water. The student collected a sample of one species from a depth of 2 m, and a sample of the other species from a depth of 20 m. They extracted the pigments from the seaweeds and carried out chromatography to identify the pigments. The results are shown in Fig. 1.2. solvent front carotene chlorophyll a chlorophyll b xanthophyll origin species species from 2 m from 20 m Fig. 1.2 (i) Use Fig. 1.2 to calculate the Rf value for xanthophyll. Give your answer to two significant figures. Show your working. distance moved by pigment Rf = distance moved by solvent ................................................................ [3] (ii) Use Fig. 1.1 and Fig. 1.2 to suggest an explanation for the differences between the pigments found in the two species of seaweed. ........................................................................................................................................... ........................................................................................................................................... ........................................................................................................................................... ........................................................................................................................................... ........................................................................................................................................... ..................................................................................................................................... [3] (d) Light wavelength can be changed by placing coloured, cellophane filters in front of a bench lamp. Plan a laboratory-based investigation into the effect of changing light wavelength on the rate of photosynthesis of a seaweed. You are provided with standard laboratory apparatus and materials. Your plan should: • include a clear statement of the hypothesis • identify the key variables • include full details of the method • describe how you would analyse your results • be safe and ethical. ................................................................................................................................................... ................................................................................................................................................... ................................................................................................................................................... ................................................................................................................................................... ................................................................................................................................................... ................................................................................................................................................... ................................................................................................................................................... ................................................................................................................................................... ................................................................................................................................................... ................................................................................................................................................... ................................................................................................................................................... ................................................................................................................................................... ................................................................................................................................................... ................................................................................................................................................... ................................................................................................................................................... ................................................................................................................................................... ................................................................................................................................................... ................................................................................................................................................... ................................................................................................................................................... ................................................................................................................................................... ................................................................................................................................................... ................................................................................................................................................... ................................................................................................................................................... ................................................................................................................................................... ................................................................................................................................................... ................................................................................................................................................... ................................................................................................................................................... ................................................................................................................................................... ................................................................................................................................................... ................................................................................................................................................... ................................................................................................................................................... ................................................................................................................................................... ................................................................................................................................................... ................................................................................................................................................... ................................................................................................................................................... ........................................................................................................................................... [11] [Total: 25]
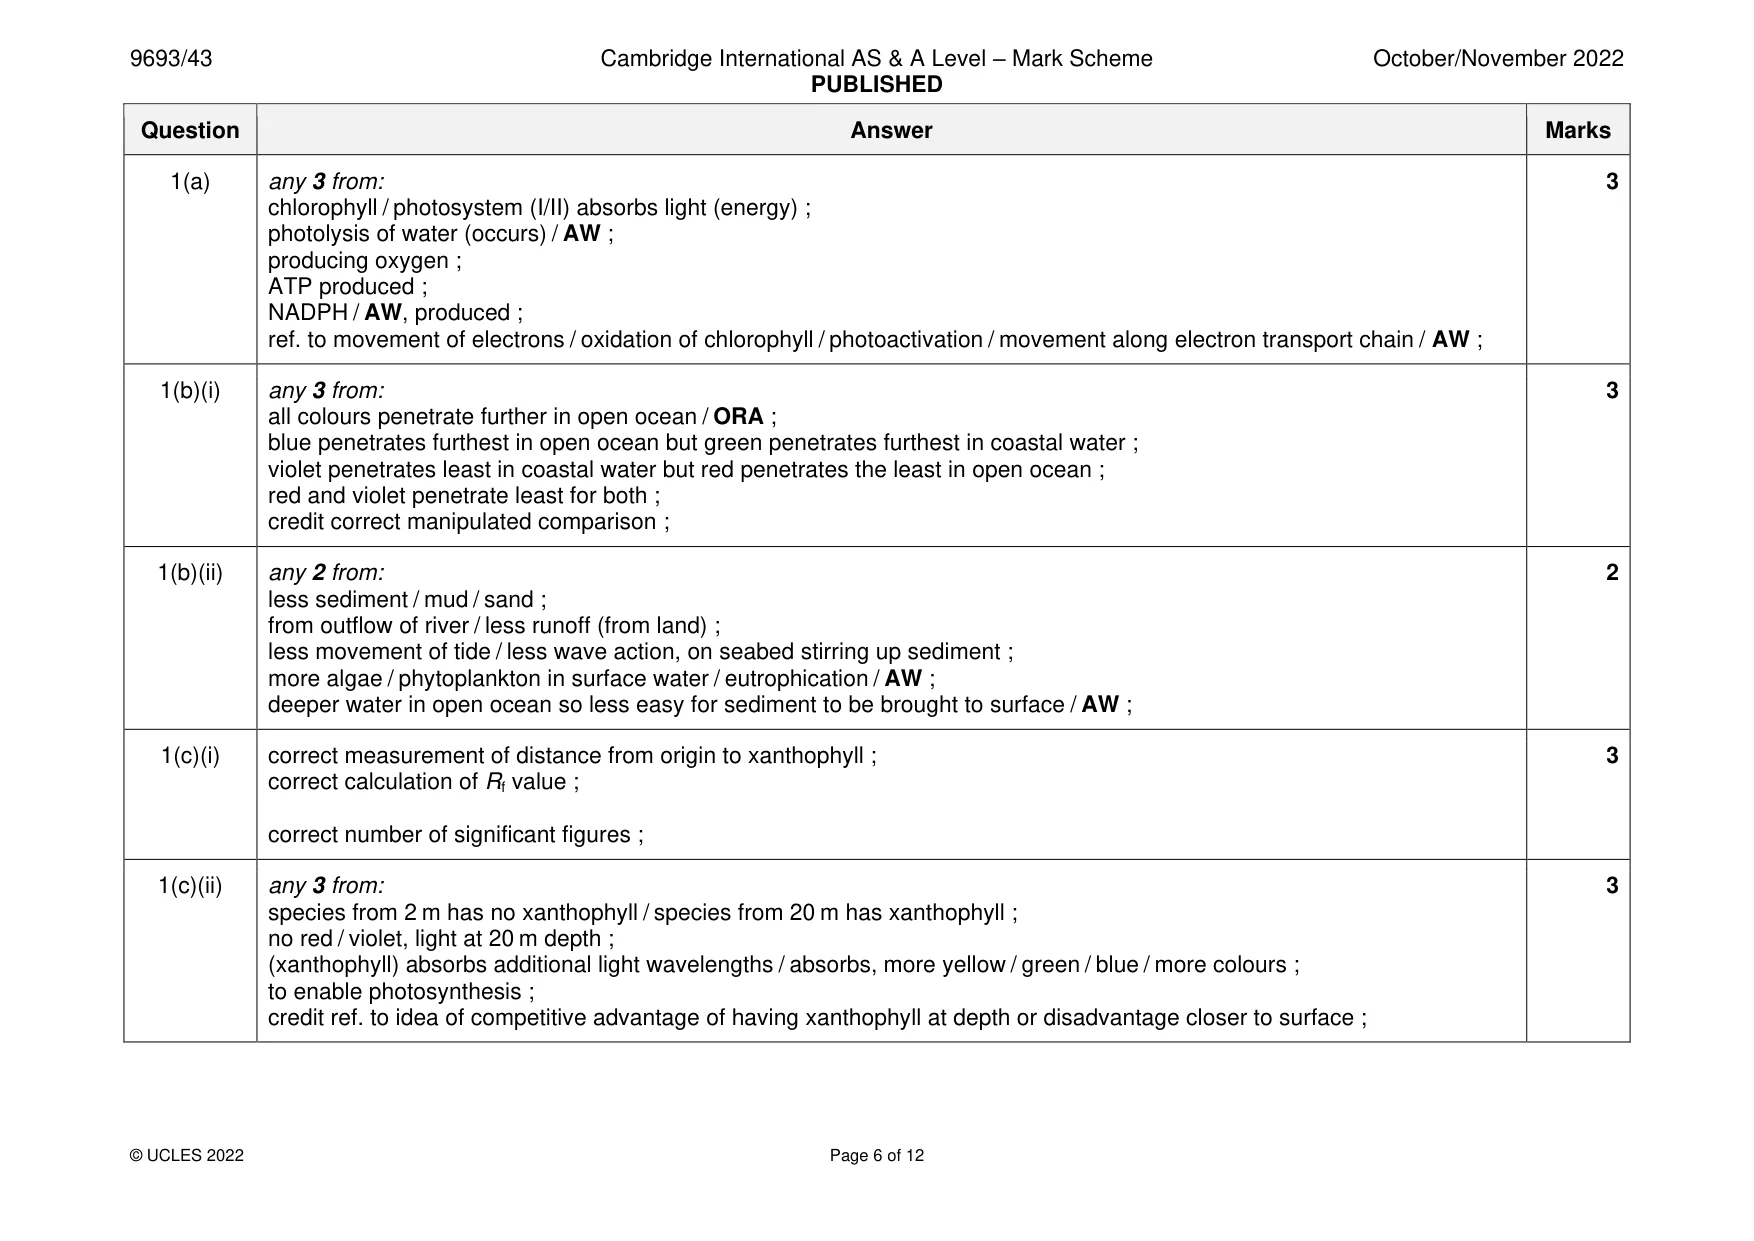
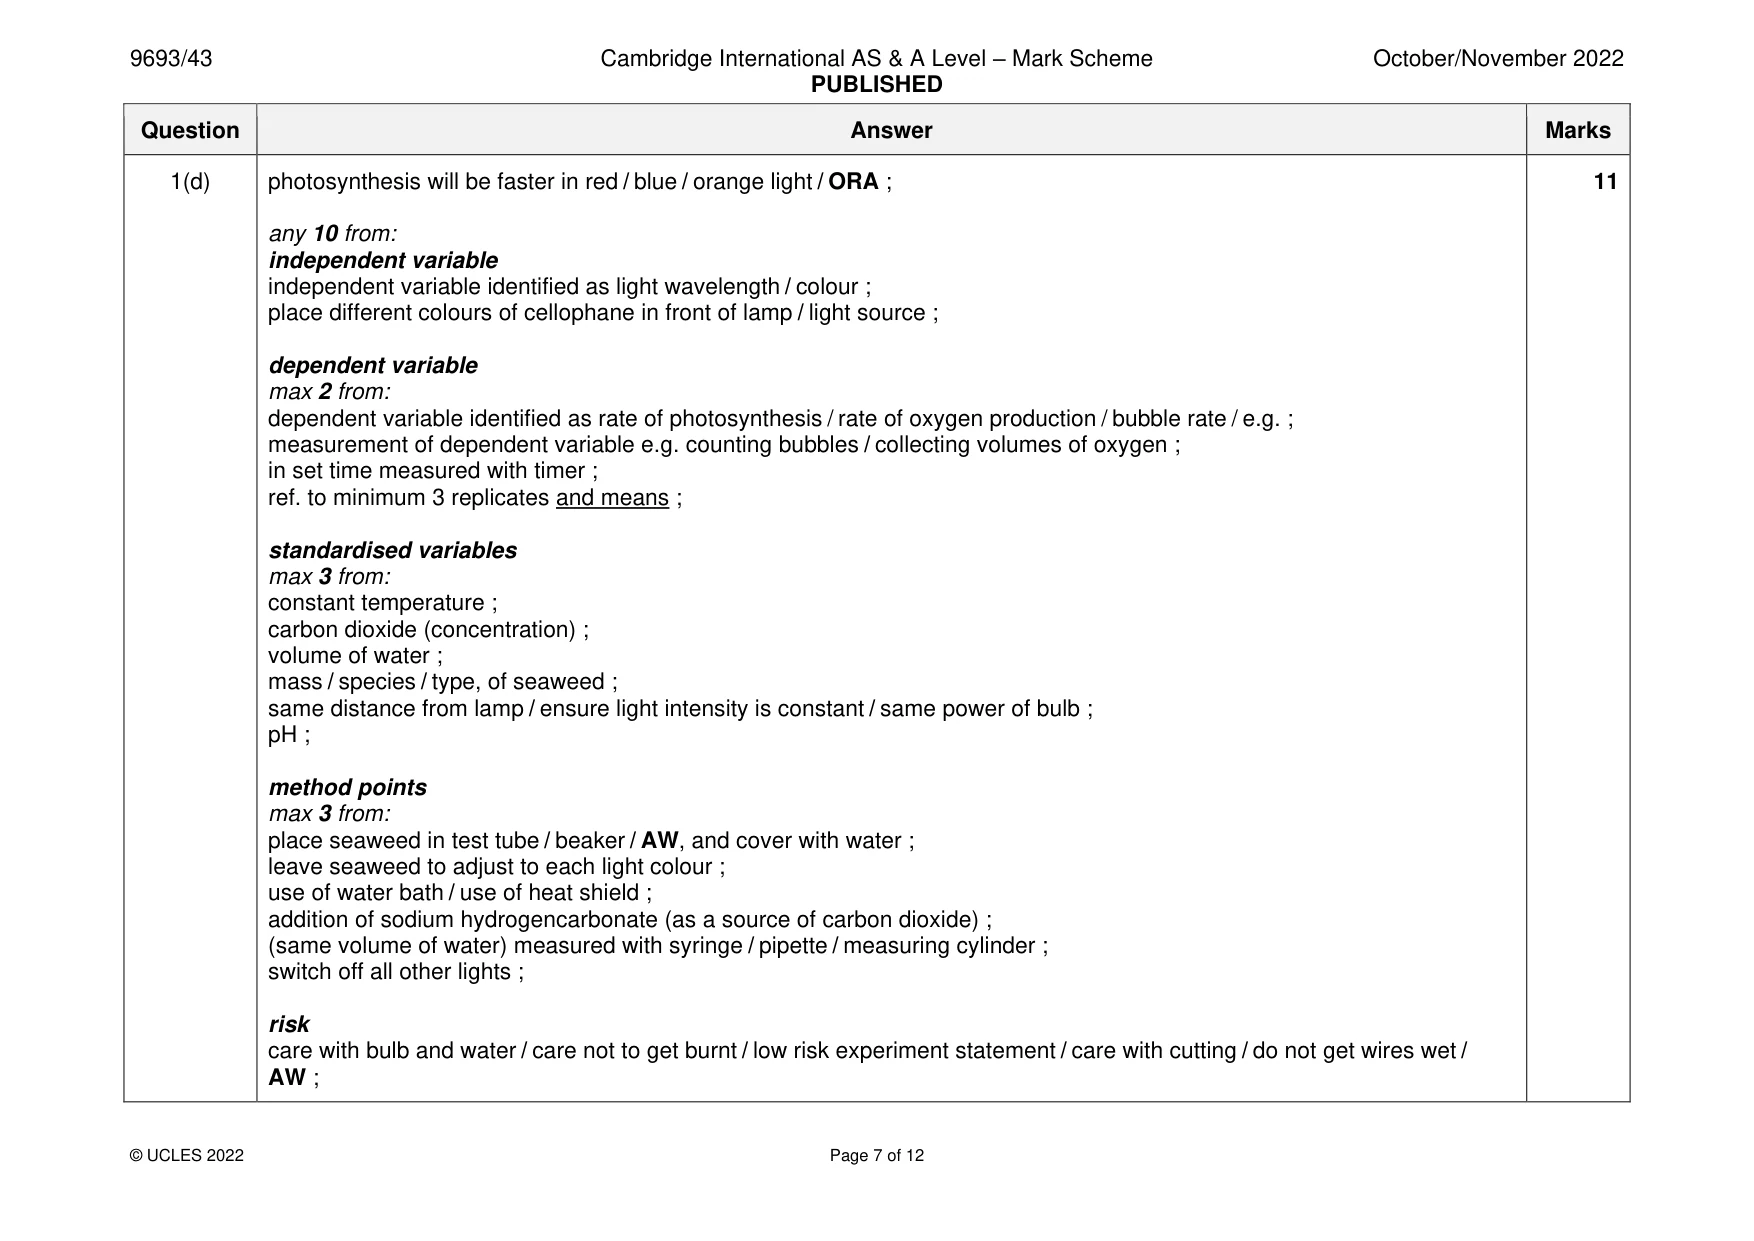
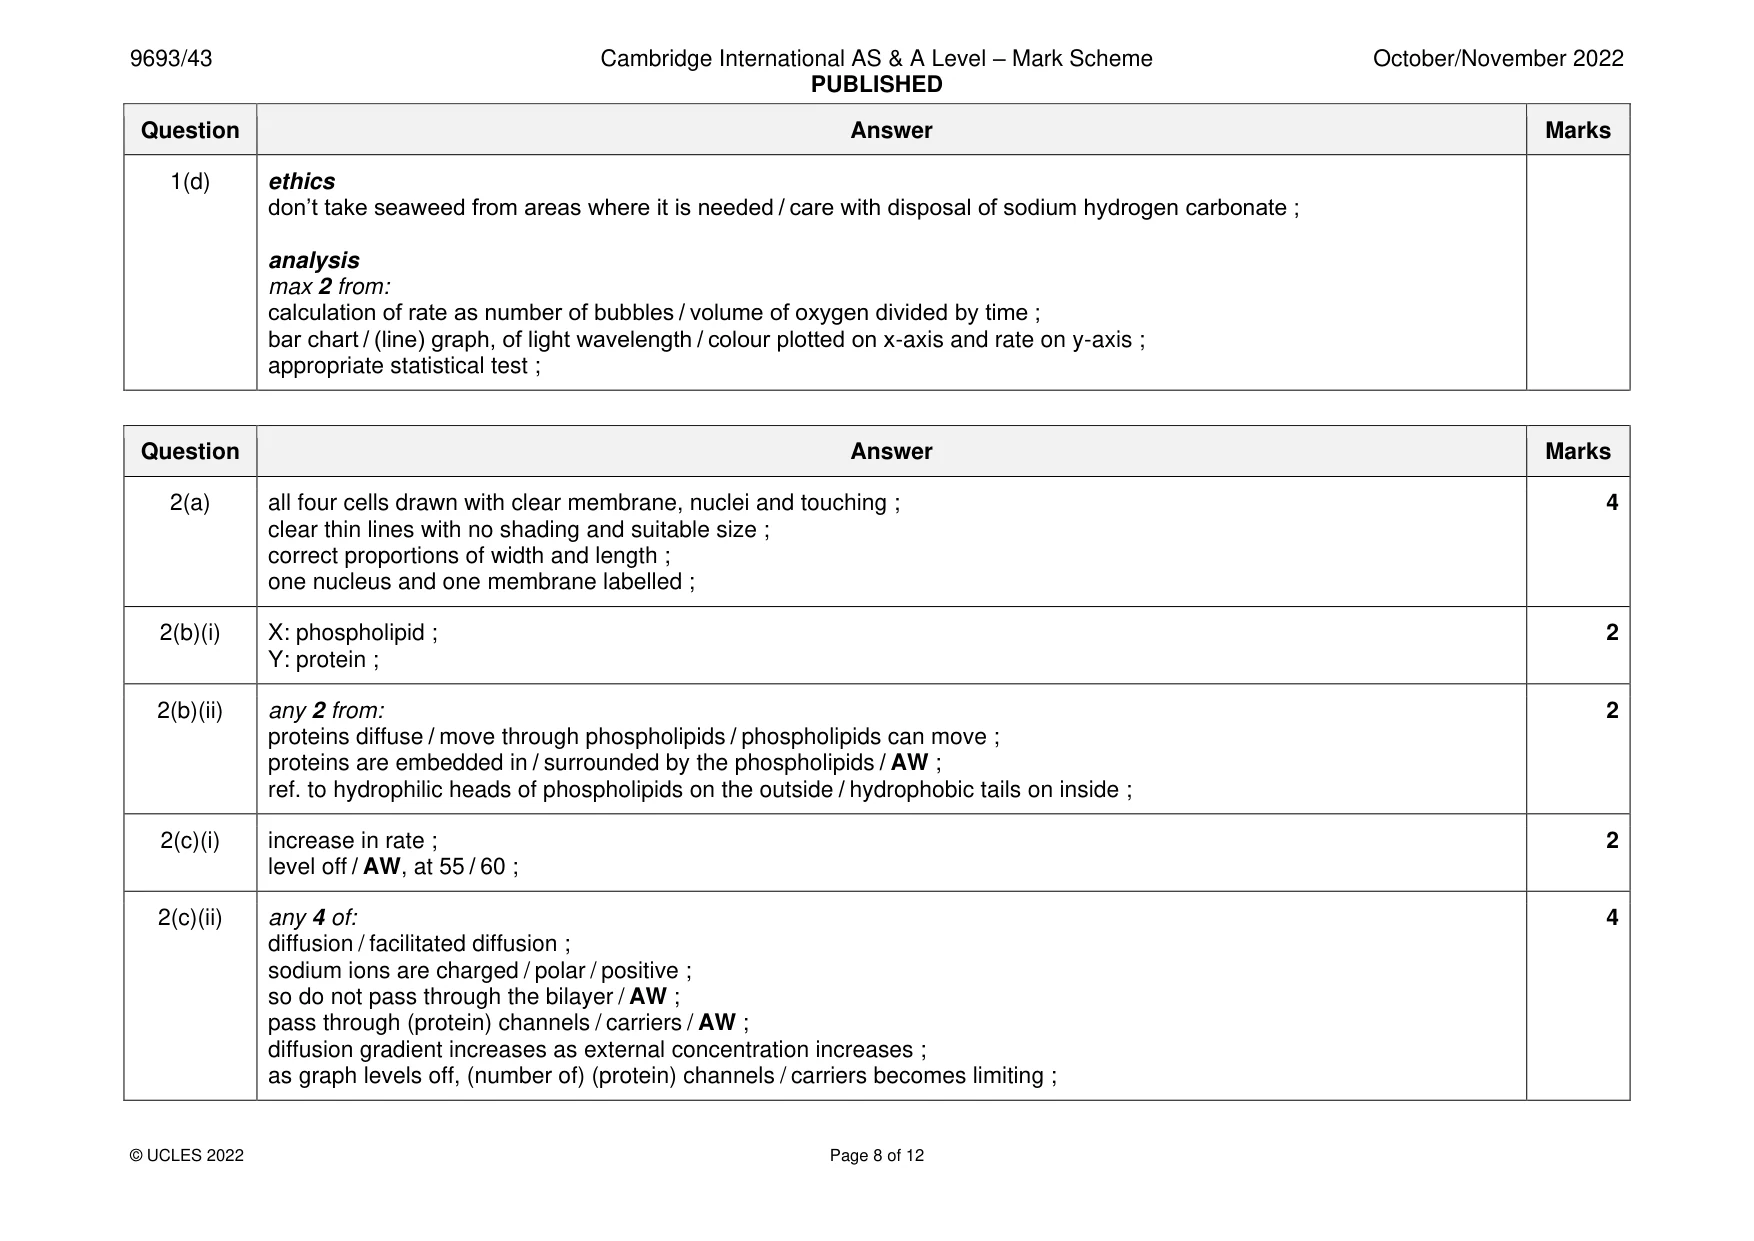
Mark scheme: Question Answer Marks 1(a) any 3 from: 3 chlorophyll / photosystem (I/II) absorbs light (energy) ; photolysis of water (occurs) / AW ; producing oxygen ; ATP produced ; NADPH / AW, produced ; ref. to movement of electrons / oxidation of chlorophyll / photoactivation / movement along electron transport chain / AW ; 1(b)(i) any 3 from: 3 all colours penetrate further in open ocean / ORA ; blue penetrates furthest in open ocean but green penetrates furthest in coastal water ; violet penetrates least in coastal water but red penetrates the least in open ocean ; red and violet penetrate least for both ; credit correct manipulated comparison ; 1(b)(ii) any 2 from: 2 less sediment / mud / sand ; from outflow of river / less runoff (from land) ; less movement of tide / less wave action, on seabed stirring up sediment ; more algae / phytoplankton in surface water / eutrophication / AW ; deeper water in open ocean so less easy for sediment to be brought to surface / AW ; 1(c)(i) correct measurement of distance from origin to xanthophyll ; 3 correct calculation of Rf value ; correct number of significant figures ; 1(c)(ii) any 3 from: 3 species from 2 m has no xanthophyll / species from 20 m has xanthophyll ; no red / violet, light at 20 m depth ; (xanthophyll) absorbs additional light wavelengths / absorbs, more yellow / green / blue / more colours ; to enable photosynthesis ; credit ref. to idea of competitive advantage of having xanthophyll at depth or disadvantage closer to surface ; 1(d) photosynthesis will be faster in red / blue / orange light / ORA ; 11 any 10 from: independent variable independent variable identified as light wavelength / colour ; place different colours of cellophane in front of lamp / light source ; dependent variable max 2 from: dependent variable identified as rate of photosynthesis / rate of oxygen production / bubble rate / e.g. ; measurement of dependent variable e.g. counting bubbles / collecting volumes of oxygen ; in set time measured with timer ; ref. to minimum 3 replicates and means ; standardised variables max 3 from: constant temperature ; carbon dioxide (concentration) ; volume of water ; mass / species / type, of seaweed ; same distance from lamp / ensure light intensity is constant / same power of bulb ; pH ; method points max 3 from: place seaweed in test tube / beaker / AW, and cover with water ; leave seaweed to adjust to each light colour ; use of water bath / use of heat shield ; addition of sodium hydrogencarbonate (as a source of carbon dioxide) ; (same volume of water) measured with syringe / pipette / measuring cylinder ; switch off all other lights ; risk care with bulb and water / care not to get burnt / low risk experiment statement / care with cutting / do not get wires wet / AW ; 1(d) ethics don’t take seaweed from areas where it is needed / care with disposal of sodium hydrogen carbonate ; analysis max 2 from: calculation of rate as number of bubbles / volume of oxygen divided by time ; bar chart / (line) graph, of light wavelength / colour plotted on x-axis and rate on y-axis ; appropriate statistical test ;
Q2 · A light micrograph of some blood cells from a salmon
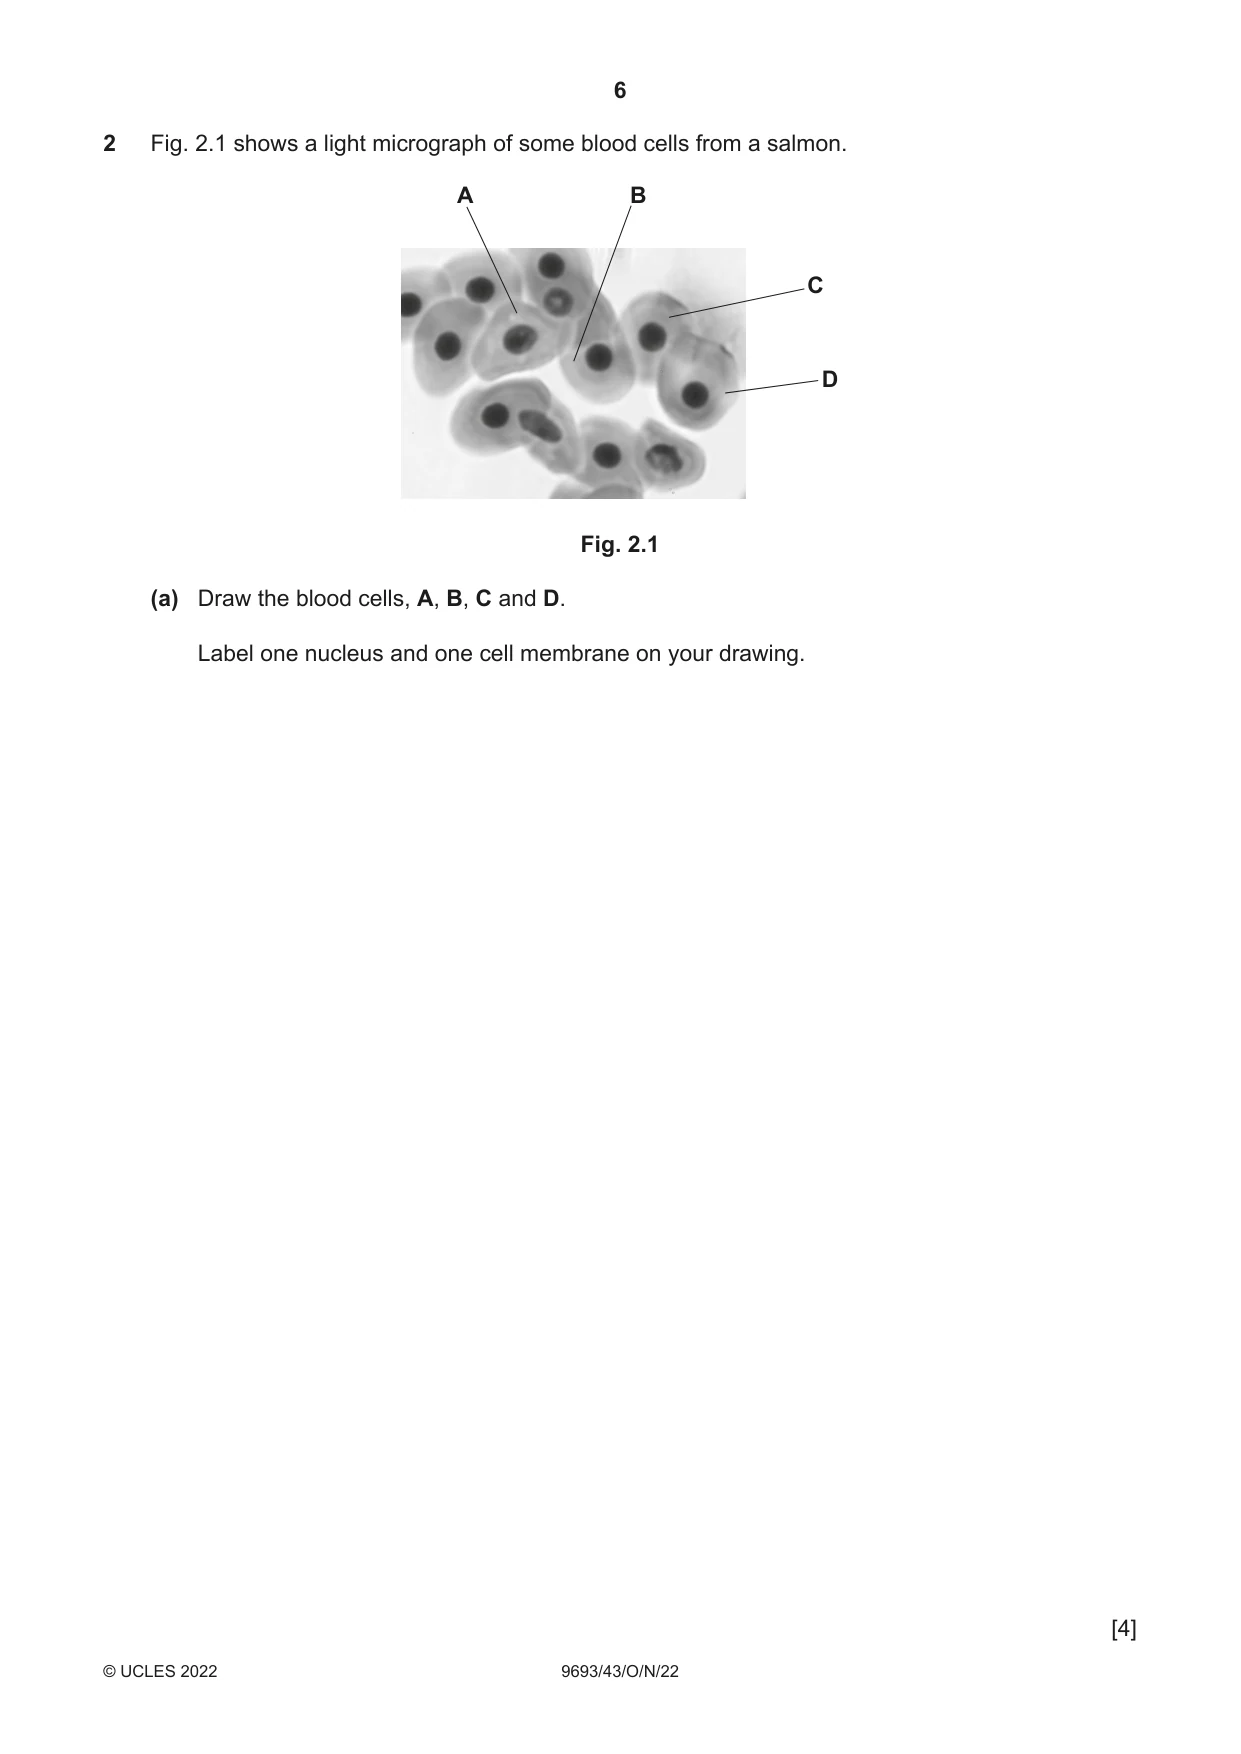
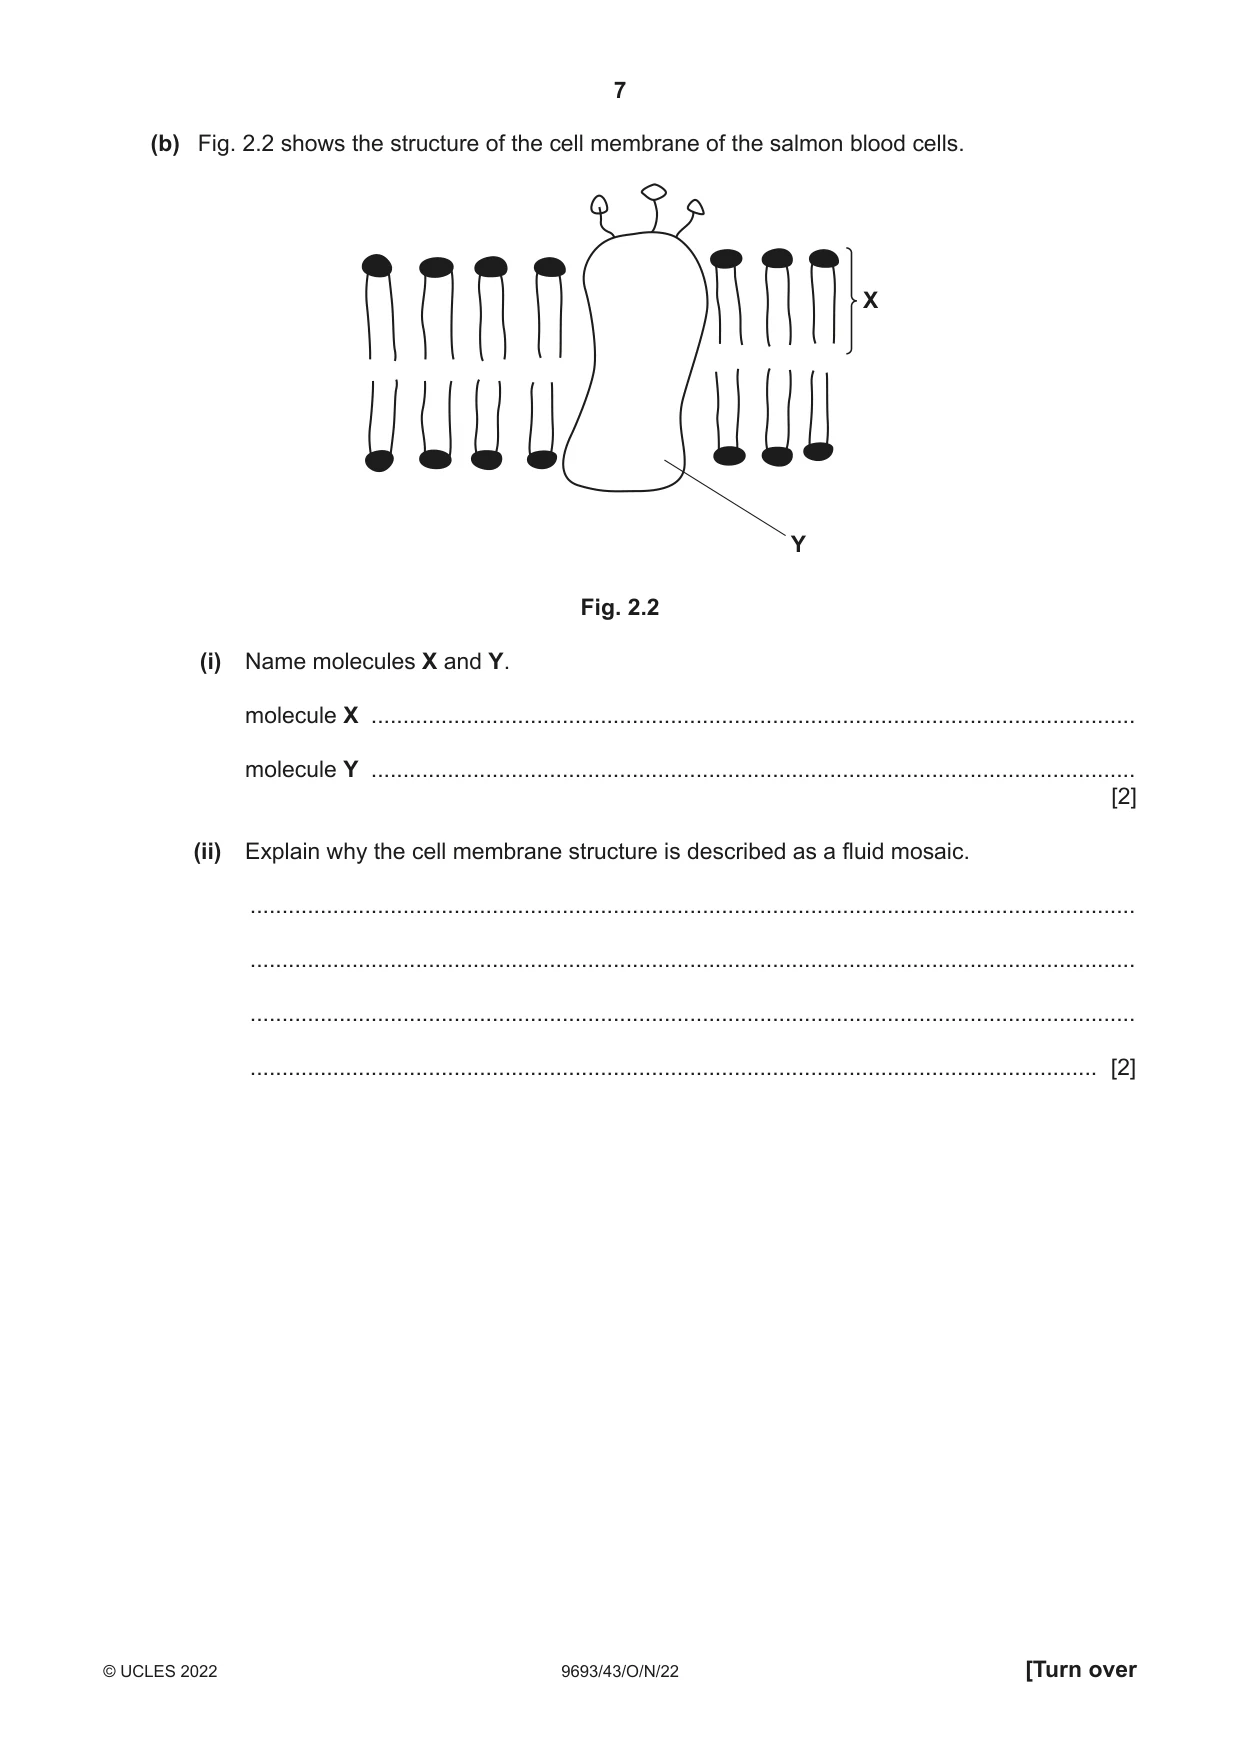
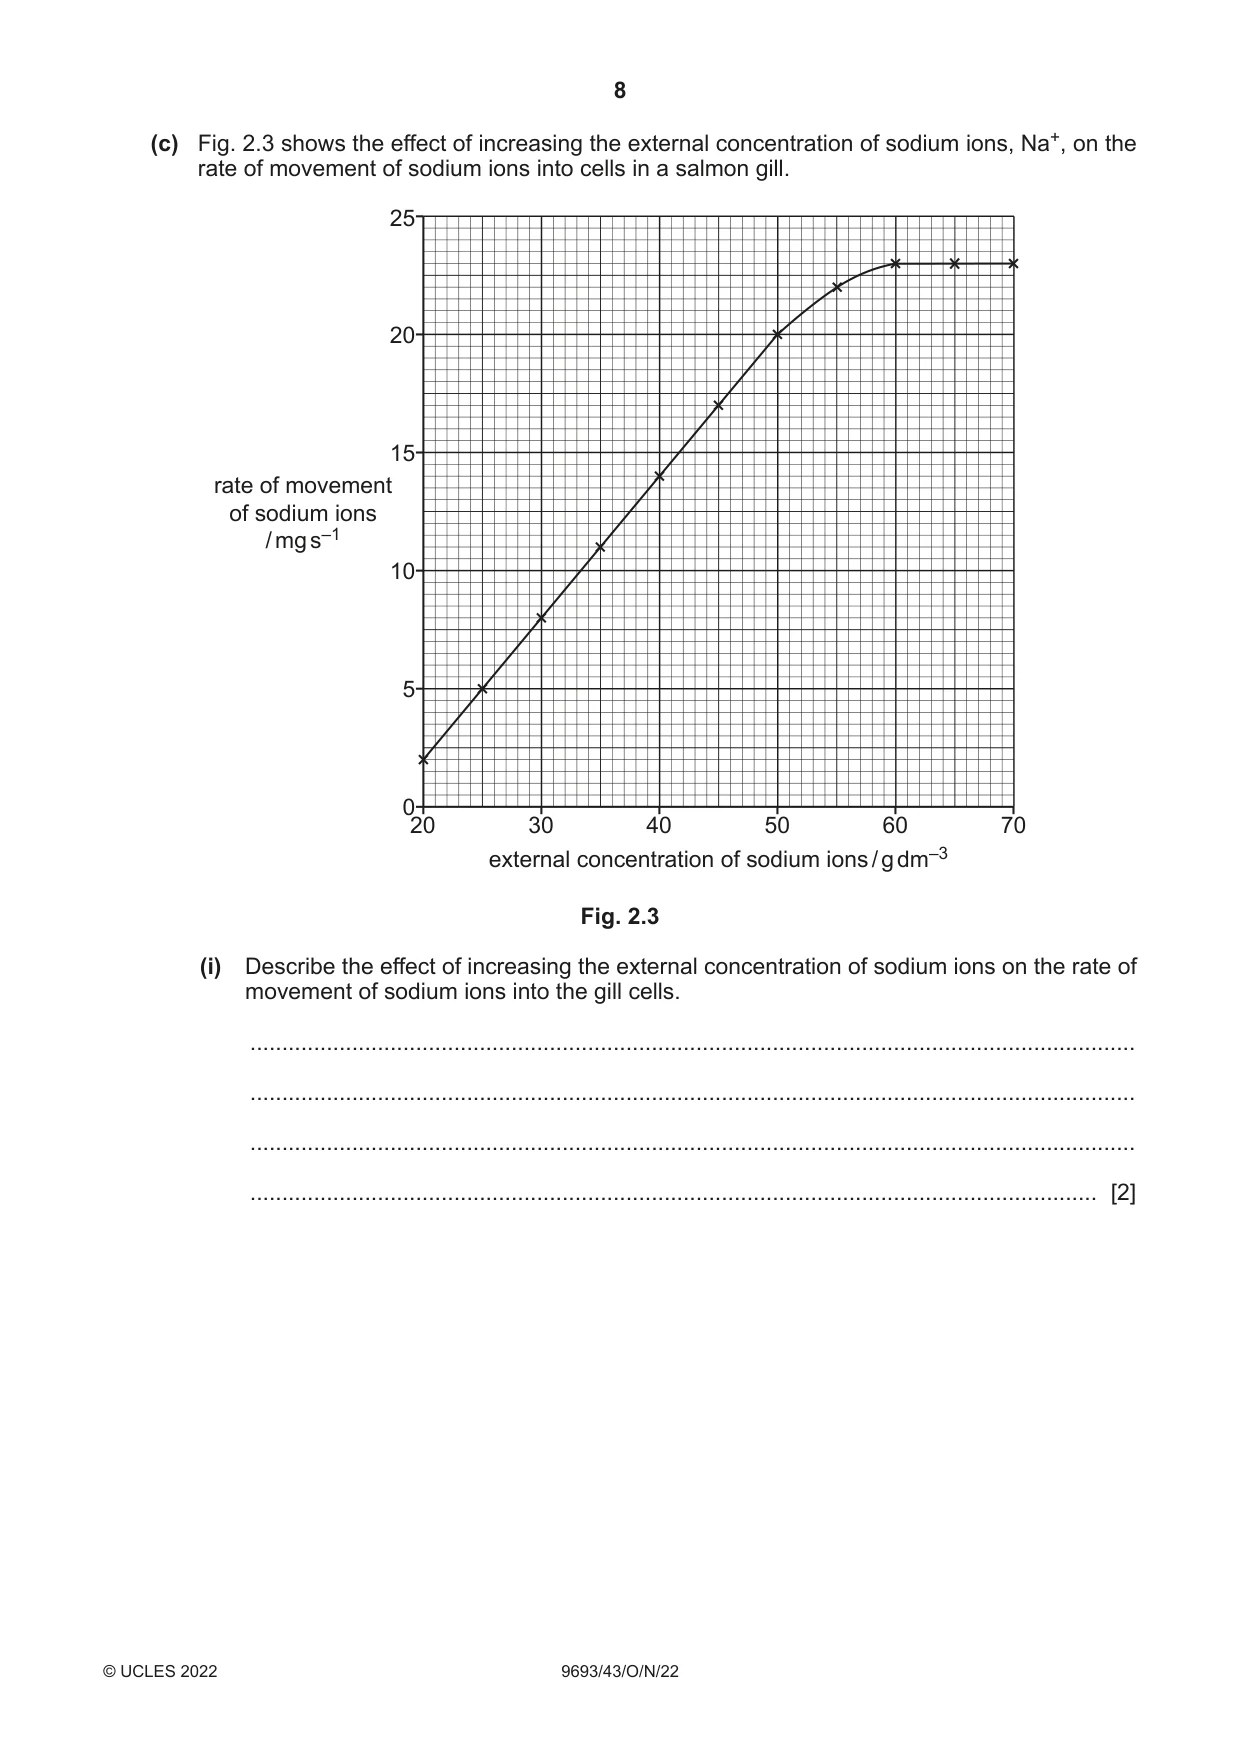
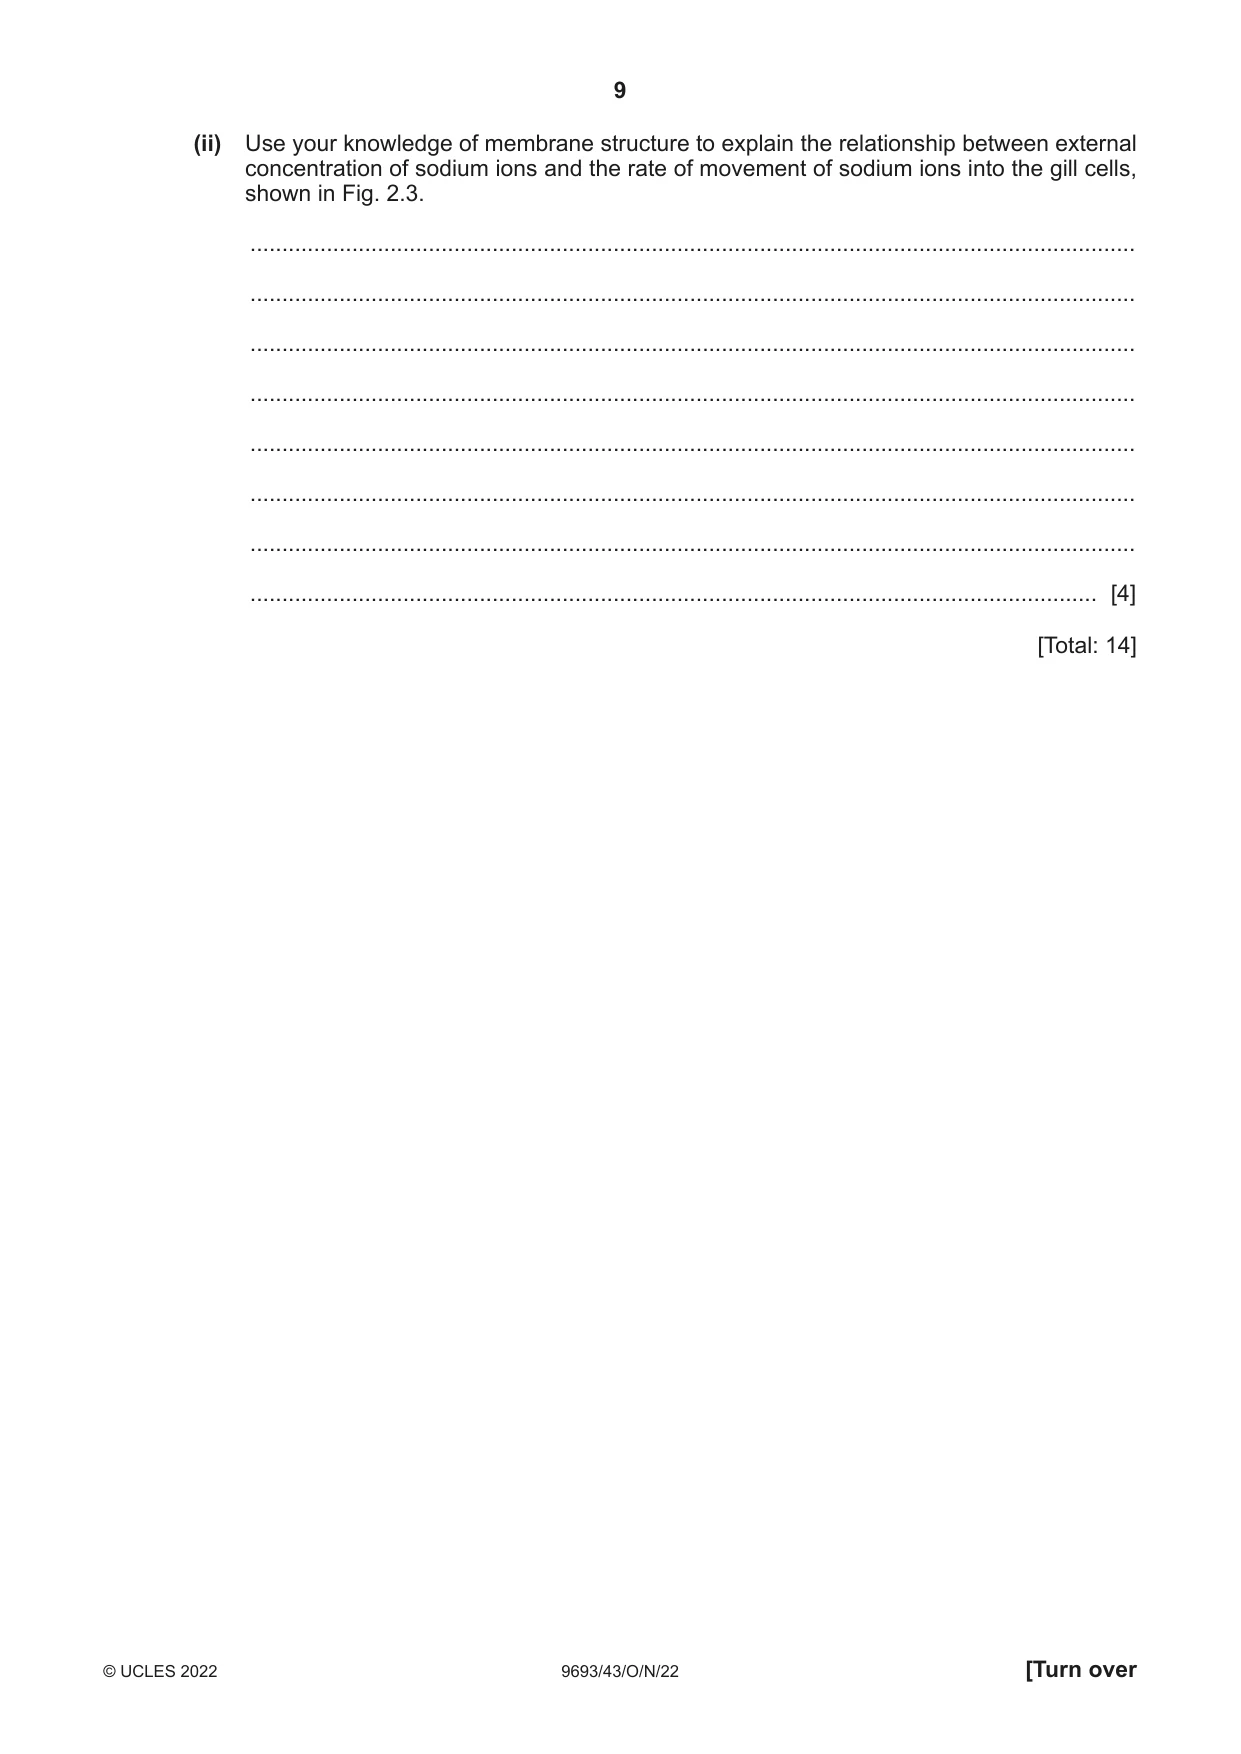
2 Fig. 2.1 shows a light micrograph of some blood cells from a salmon. A B C D Fig. 2.1 (a) Draw the blood cells, A, B, C and D. Label one nucleus and one cell membrane on your drawing. [4] (b) Fig. 2.2 shows the structure of the cell membrane of the salmon blood cells. X Y Fig. 2.2 (i) Name molecules X and Y. molecule X ........................................................................................................................ molecule Y ........................................................................................................................ [2] (ii) Explain why the cell membrane structure is described as a fluid mosaic. ........................................................................................................................................... ........................................................................................................................................... ........................................................................................................................................... ..................................................................................................................................... [2] (c) Fig. 2.3 shows the effect of increasing the external concentration of sodium ions, Na+, on the rate of movement of sodium ions into cells in a salmon gill. 25 20 15 rate of movement of sodium ions / mg s–1 10 5 0 20 30 40 50 60 70 external concentration of sodium ions / g dm–3 Fig. 2.3 (i) Describe the effect of increasing the external concentration of sodium ions on the rate of movement of sodium ions into the gill cells. ........................................................................................................................................... ........................................................................................................................................... ........................................................................................................................................... ..................................................................................................................................... [2] (ii) Use your knowledge of membrane structure to explain the relationship between external concentration of sodium ions and the rate of movement of sodium ions into the gill cells, shown in Fig. 2.3. ........................................................................................................................................... ........................................................................................................................................... ........................................................................................................................................... ........................................................................................................................................... ........................................................................................................................................... ........................................................................................................................................... ........................................................................................................................................... ..................................................................................................................................... [4] [Total: 14]
Mark scheme: 2(a) all four cells drawn with clear membrane, nuclei and touching ; 4 clear thin lines with no shading and suitable size ; correct proportions of width and length ; one nucleus and one membrane labelled ; 2(b)(i) X: phospholipid ; 2 Y: protein ; 2(b)(ii) any 2 from: 2 proteins diffuse / move through phospholipids / phospholipids can move ; proteins are embedded in / surrounded by the phospholipids / AW ; ref. to hydrophilic heads of phospholipids on the outside / hydrophobic tails on inside ; 2(c)(i) increase in rate ; 2 level off / AW, at 55 / 60 ; 2(c)(ii) any 4 of: 4 diffusion / facilitated diffusion ; sodium ions are charged / polar / positive ; so do not pass through the bilayer / AW ; pass through (protein) channels / carriers / AW ; diffusion gradient increases as external concentration increases ; as graph levels off, (number of) (protein) channels / carriers becomes limiting ;
Q3 · Myoglobin is a red protein that is found in the muscles of many vertebrate animals
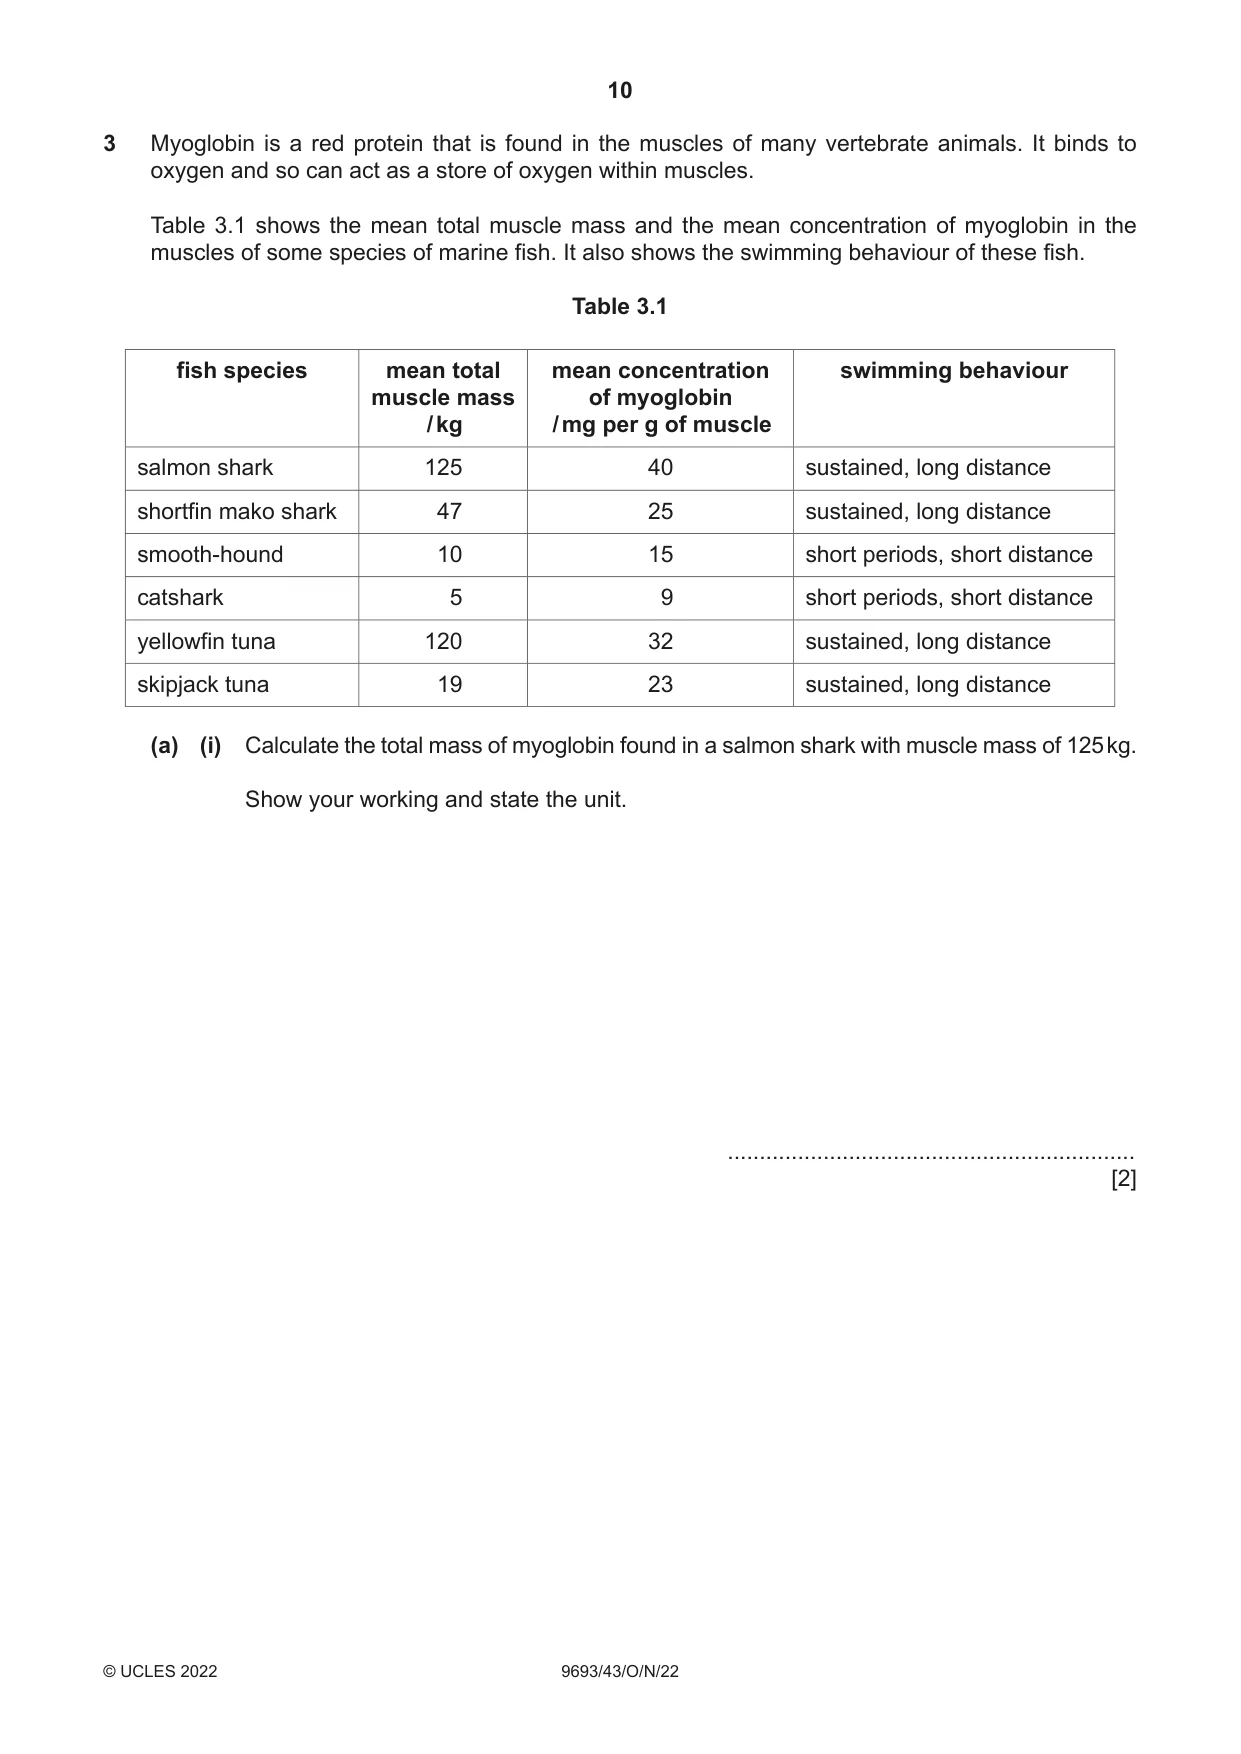
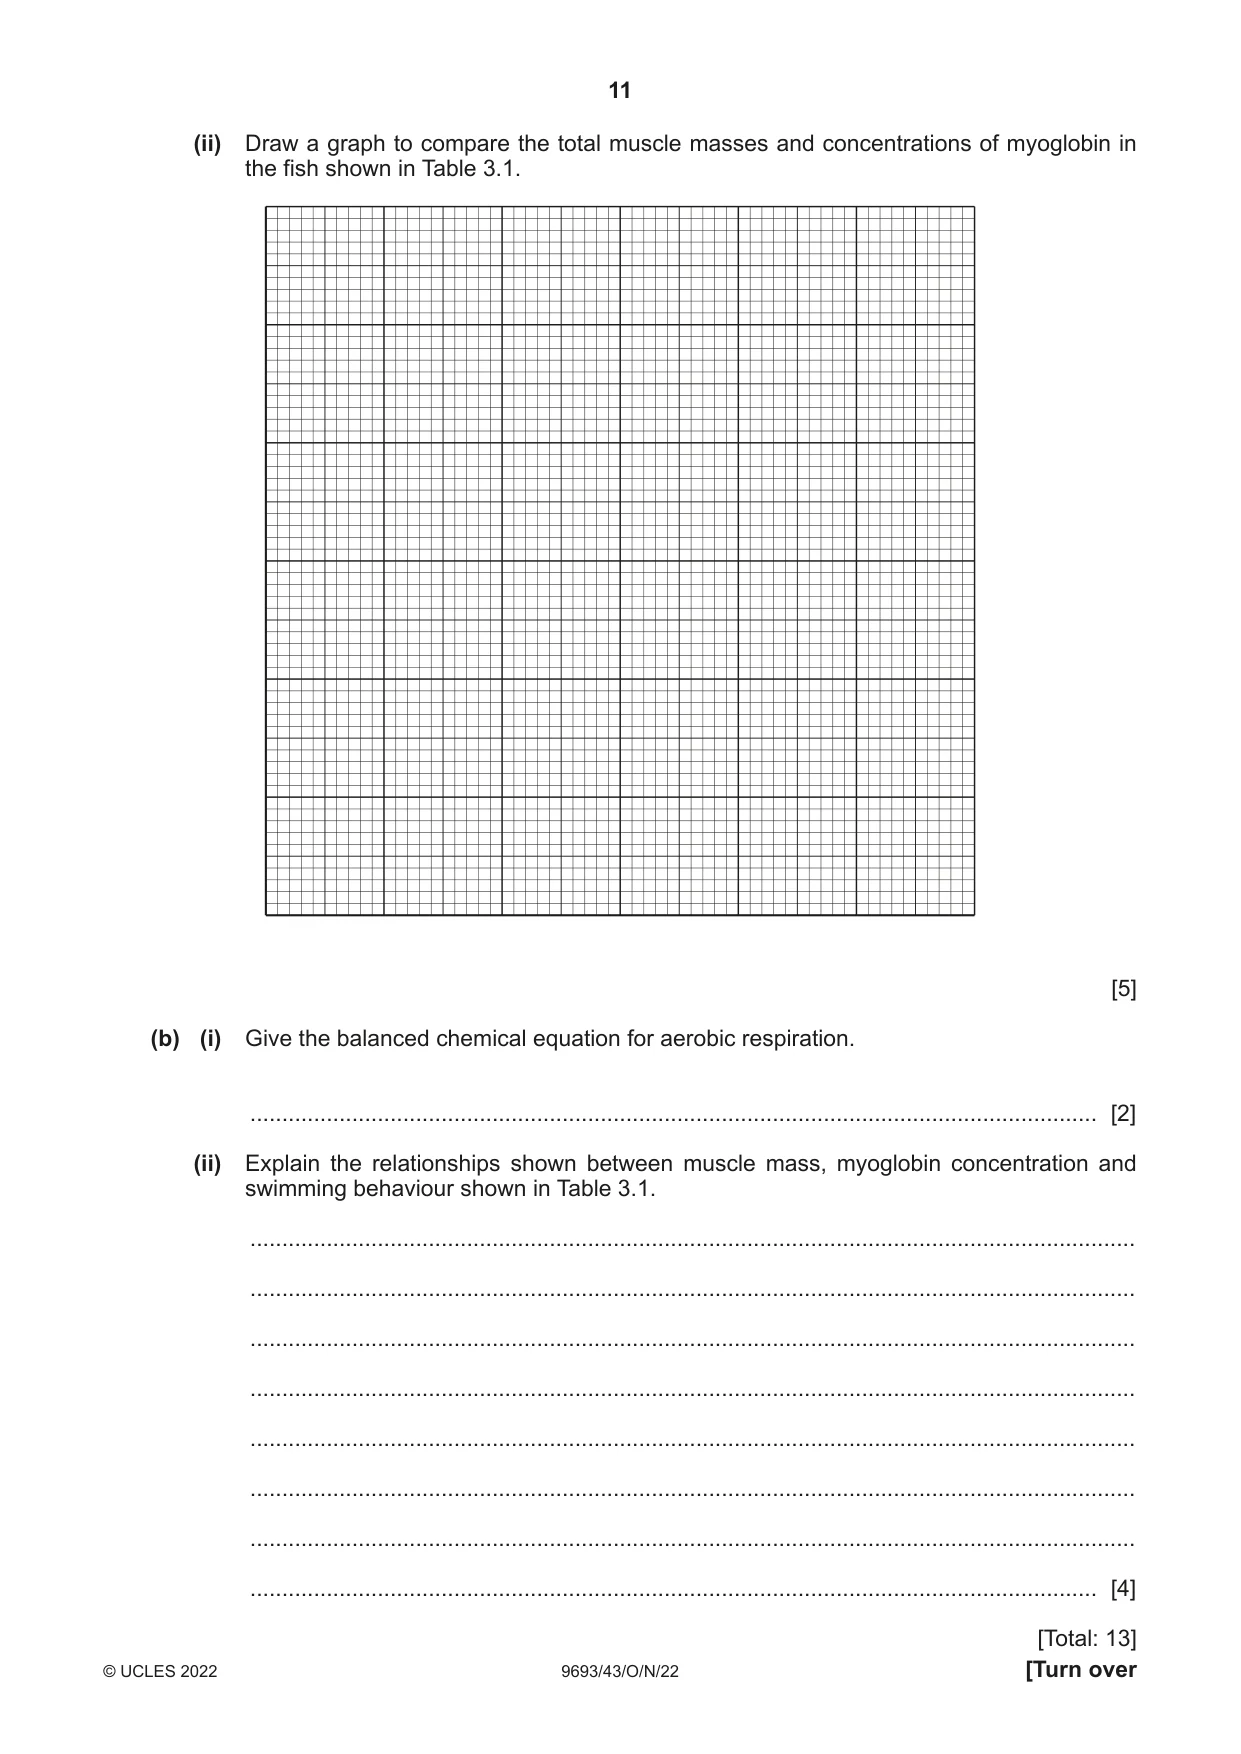
3 Myoglobin is a red protein that is found in the muscles of many vertebrate animals. It binds to oxygen and so can act as a store of oxygen within muscles. Table 3.1 shows the mean total muscle mass and the mean concentration of myoglobin in the muscles of some species of marine fish. It also shows the swimming behaviour of these fish. Table 3.1 fish species mean total mean concentration swimming behaviour muscle mass of myoglobin / kg / mg per g of muscle salmon shark 125 40 sustained, long distance shortfin mako shark 47 25 sustained, long distance smooth-hound 10 15 short periods, short distance catshark 5 9 short periods, short distance yellowfin tuna 120 32 sustained, long distance skipjack tuna 19 23 sustained, long distance (a) (i) Calculate the total mass of myoglobin found in a salmon shark with muscle mass of 125 kg. Show your working and state the unit. ................................................................ [2] (ii) Draw a graph to compare the total muscle masses and concentrations of myoglobin in the fish shown in Table 3.1. [5] (b) (i) Give the balanced chemical equation for aerobic respiration. ..................................................................................................................................... [2] (ii) Explain the relationships shown between muscle mass, myoglobin concentration and swimming behaviour shown in Table 3.1. ........................................................................................................................................... ........................................................................................................................................... ........................................................................................................................................... ........................................................................................................................................... ........................................................................................................................................... ........................................................................................................................................... ........................................................................................................................................... ..................................................................................................................................... [4] [Total: 13]
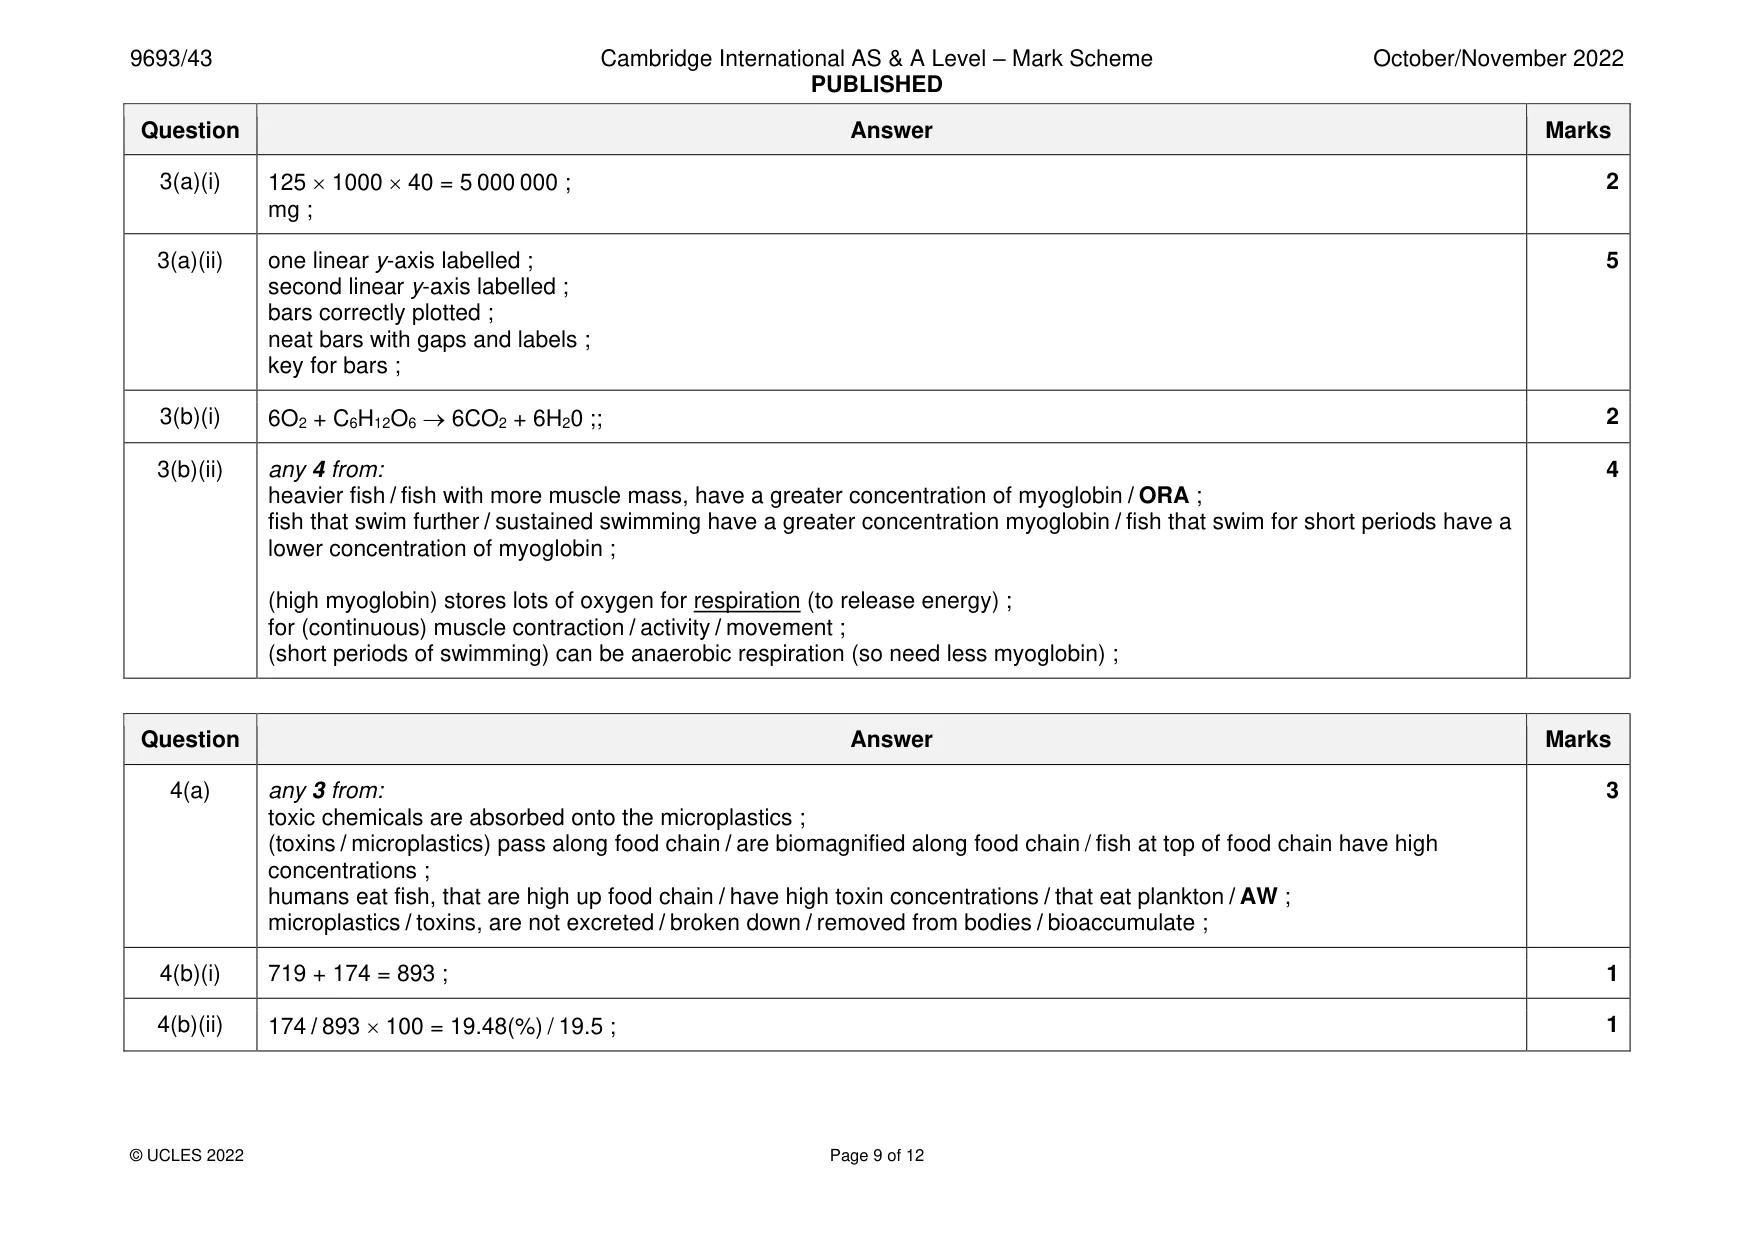
Mark scheme: 3(a)(i) 125 1000 40 = 5 000 000 ; 2 mg ; 3(a)(ii) one linear y-axis labelled ; 5 second linear y-axis labelled ; bars correctly plotted ; neat bars with gaps and labels ; key for bars ; 3(b)(i) 6O2 + C6H12O6 → 6CO2 + 6H20 ;; 2 3(b)(ii) any 4 from: 4 heavier fish / fish with more muscle mass, have a greater concentration of myoglobin / ORA ; fish that swim further / sustained swimming have a greater concentration myoglobin / fish that swim for short periods have a lower concentration of myoglobin ; (high myoglobin) stores lots of oxygen for respiration (to release energy) ; for (continuous) muscle contraction / activity / movement ; (short periods of swimming) can be anaerobic respiration (so need less myoglobin) ;
Q4 · Plastics and microplastics can have a major impact on the marine environment
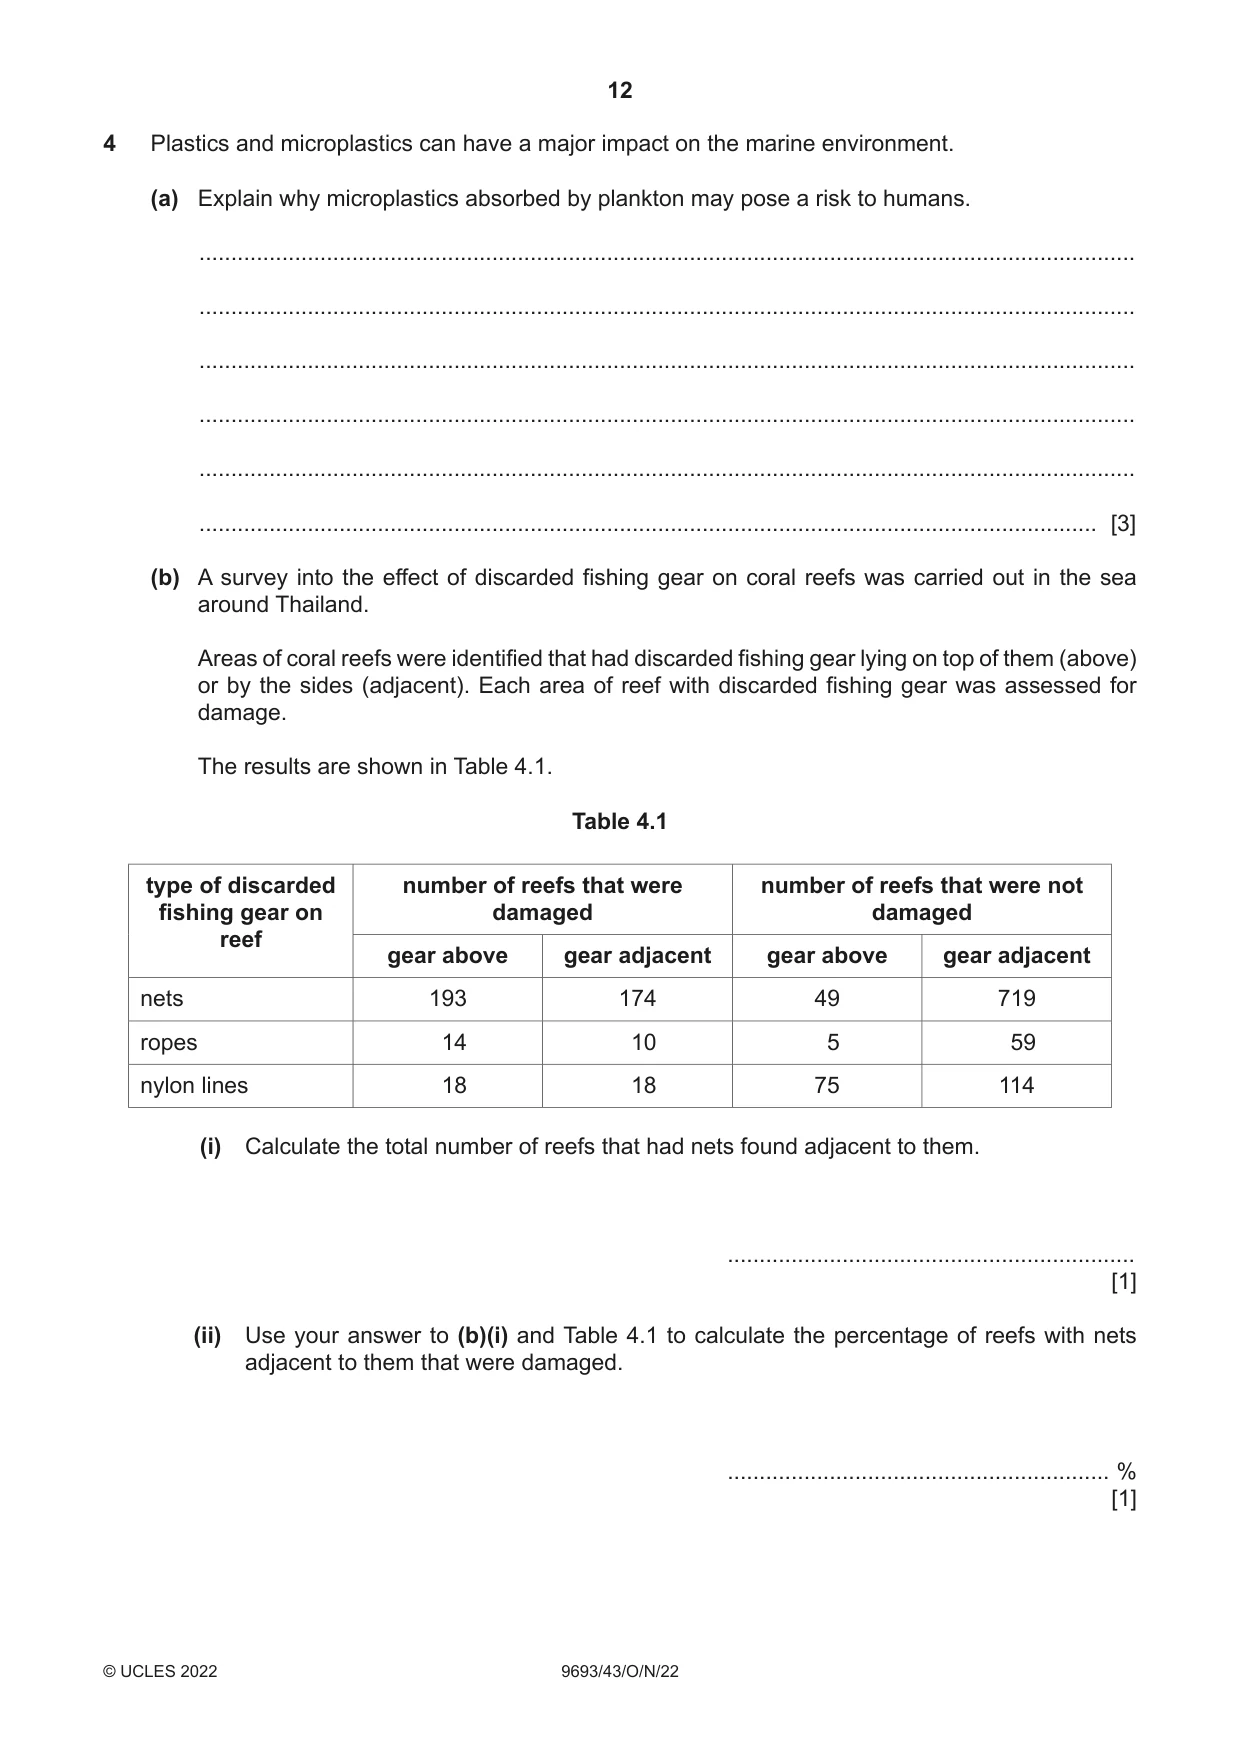
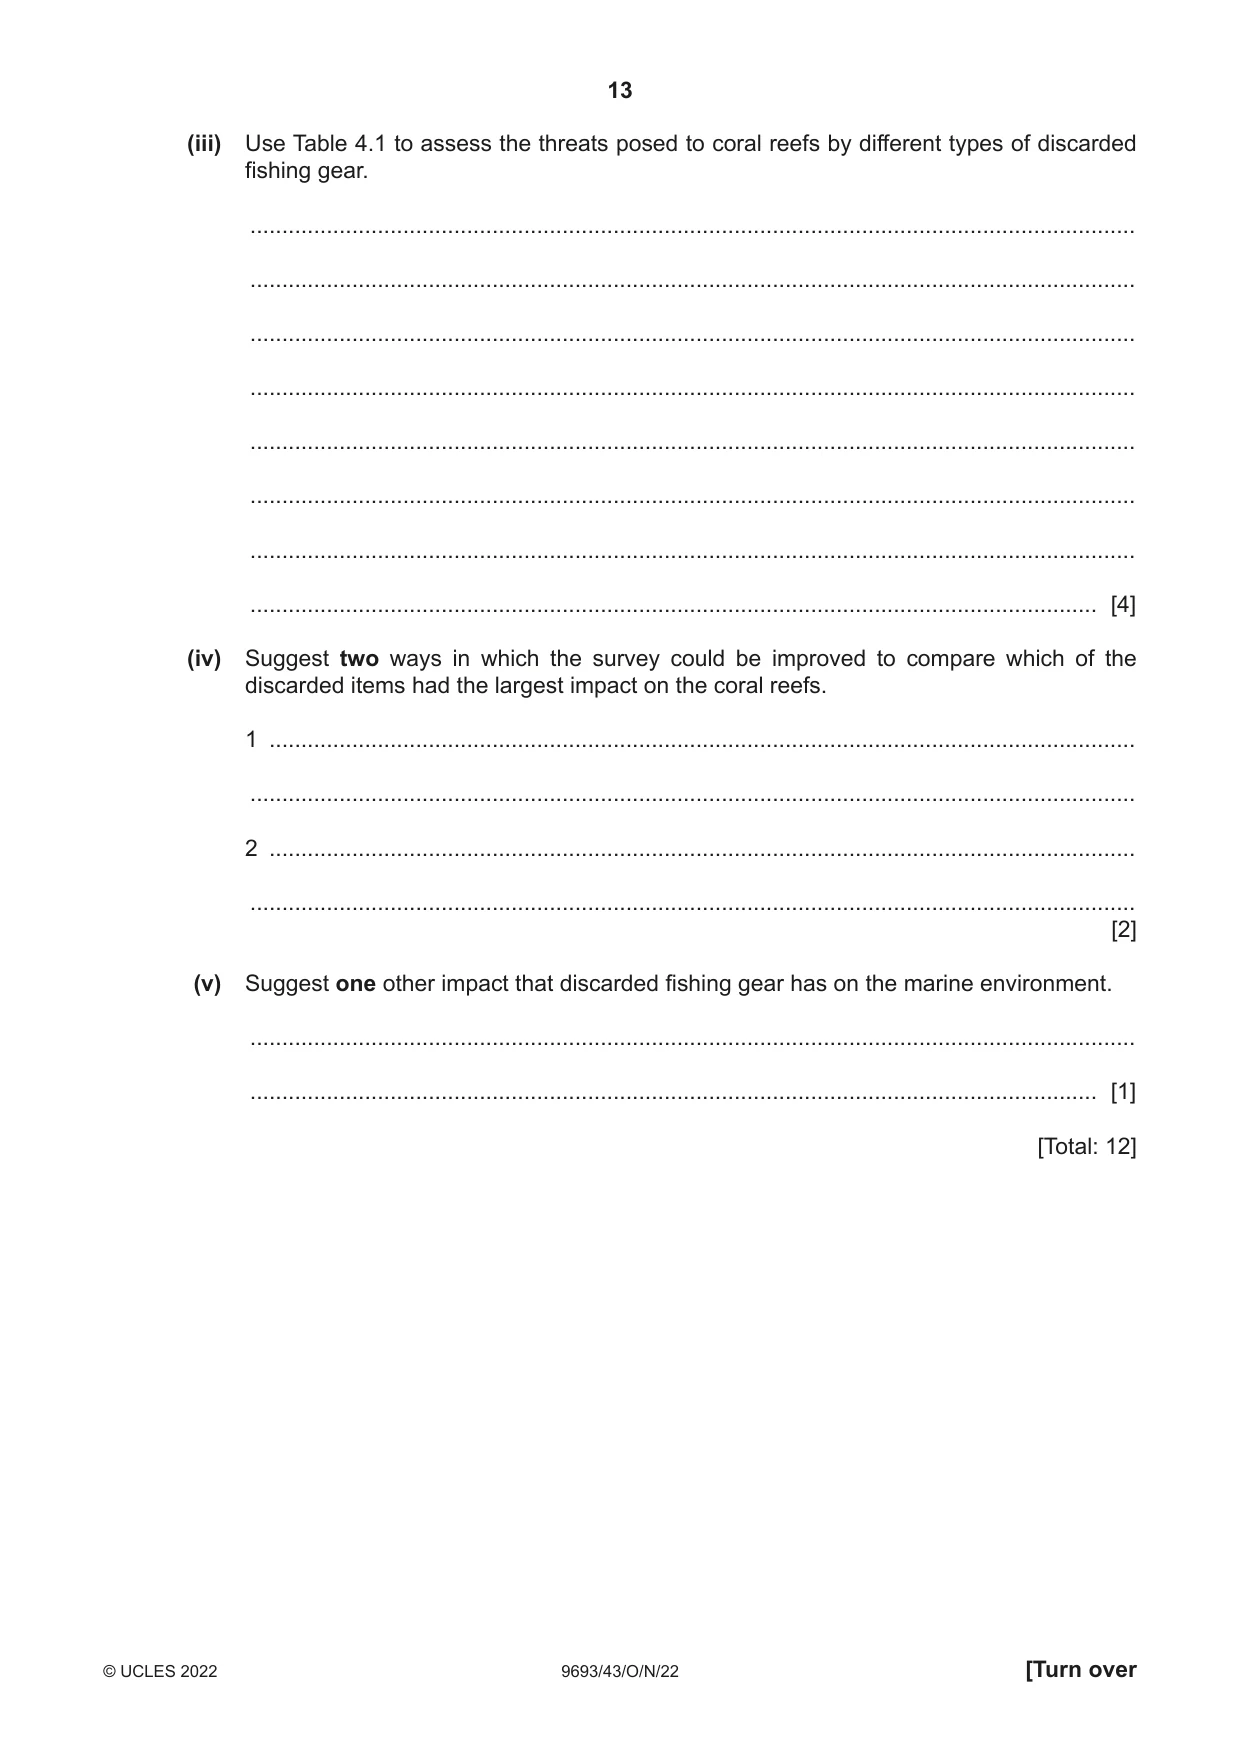
4 Plastics and microplastics can have a major impact on the marine environment. (a) Explain why microplastics absorbed by plankton may pose a risk to humans. ................................................................................................................................................... ................................................................................................................................................... ................................................................................................................................................... ................................................................................................................................................... ................................................................................................................................................... ............................................................................................................................................. [3] (b) A survey into the effect of discarded fishing gear on coral reefs was carried out in the sea around Thailand. Areas of coral reefs were identified that had discarded fishing gear lying on top of them (above) or by the sides (adjacent). Each area of reef with discarded fishing gear was assessed for damage. The results are shown in Table 4.1. Table 4.1 type of discarded number of reefs that were number of reefs that were not fishing gear on damaged damaged reef gear above gear adjacent gear above gear adjacent nets 193 174 49 719 ropes 14 10 5 59 nylon lines 18 18 75 114 (i) Calculate the total number of reefs that had nets found adjacent to them. ................................................................ [1] (ii) Use your answer to (b)(i) and Table 4.1 to calculate the percentage of reefs with nets adjacent to them that were damaged. ............................................................ % [1] (iii) Use Table 4.1 to assess the threats posed to coral reefs by different types of discarded fishing gear. ........................................................................................................................................... ........................................................................................................................................... ........................................................................................................................................... ........................................................................................................................................... ........................................................................................................................................... ........................................................................................................................................... ........................................................................................................................................... ..................................................................................................................................... [4] (iv) Suggest two ways in which the survey could be improved to compare which of the discarded items had the largest impact on the coral reefs. 1 ........................................................................................................................................ ........................................................................................................................................... 2 ........................................................................................................................................ ........................................................................................................................................... [2] (v) Suggest one other impact that discarded fishing gear has on the marine environment. ........................................................................................................................................... ..................................................................................................................................... [1] [Total: 12]
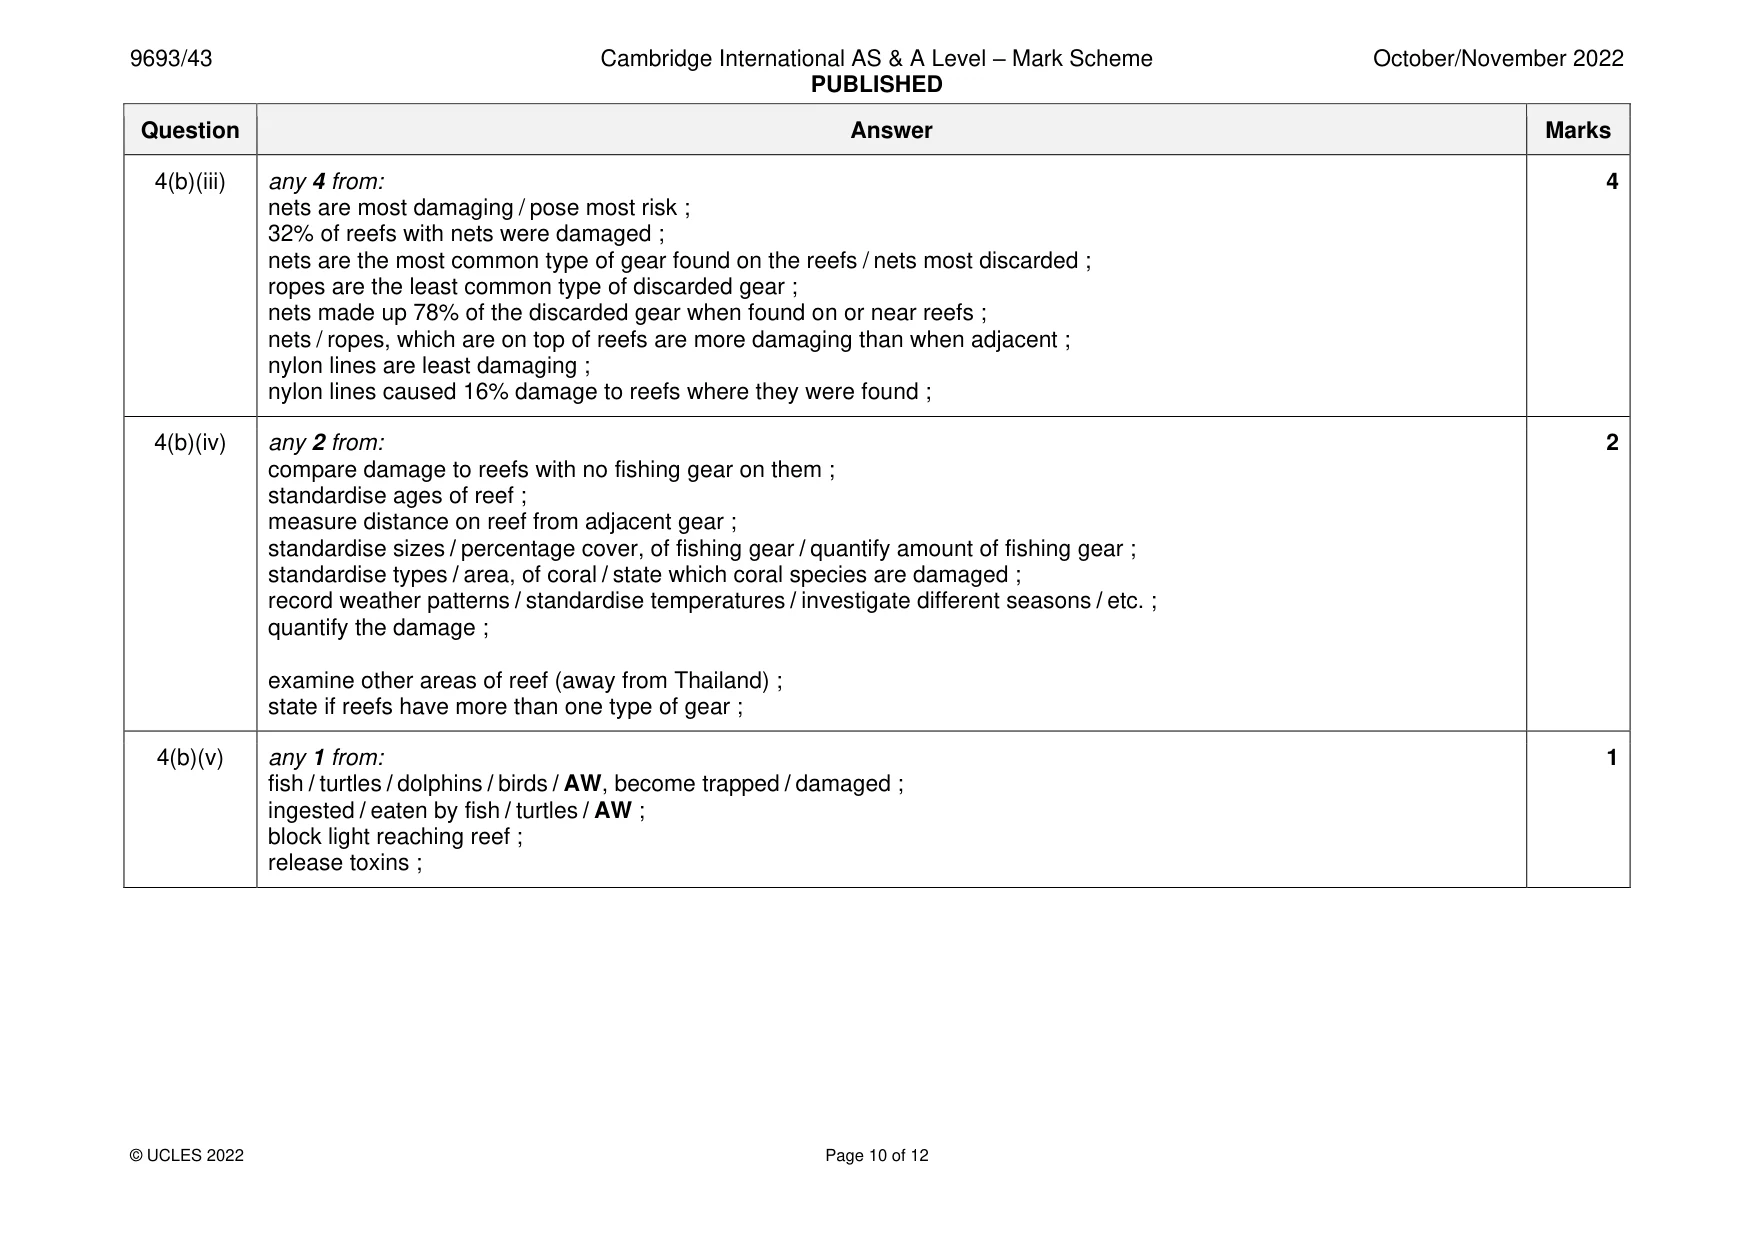
Mark scheme: 4(a) any 3 from: 3 toxic chemicals are absorbed onto the microplastics ; (toxins / microplastics) pass along food chain / are biomagnified along food chain / fish at top of food chain have high concentrations ; humans eat fish, that are high up food chain / have high toxin concentrations / that eat plankton / AW ; microplastics / toxins, are not excreted / broken down / removed from bodies / bioaccumulate ; 4(b)(i) 719 + 174 = 893 ; 1 4(b)(ii) 174 / 893 100 = 19.48(%) / 19.5 ; 1 4(b)(iii) any 4 from: 4 nets are most damaging / pose most risk ; 32% of reefs with nets were damaged ; nets are the most common type of gear found on the reefs / nets most discarded ; ropes are the least common type of discarded gear ; nets made up 78% of the discarded gear when found on or near reefs ; nets / ropes, which are on top of reefs are more damaging than when adjacent ; nylon lines are least damaging ; nylon lines caused 16% damage to reefs where they were found ; 4(b)(iv) any 2 from: 2 compare damage to reefs with no fishing gear on them ; standardise ages of reef ; measure distance on reef from adjacent gear ; standardise sizes / percentage cover, of fishing gear / quantify amount of fishing gear ; standardise types / area, of coral / state which coral species are damaged ; record weather patterns / standardise temperatures / investigate different seasons / etc. ; quantify the damage ; examine other areas of reef (away from Thailand) ; state if reefs have more than one type of gear ; 4(b)(v) any 1 from: 1 fish / turtles / dolphins / birds / AW, become trapped / damaged ; ingested / eaten by fish / turtles / AW ; block light reaching reef ; release toxins ;
Q5 · Gill nets are fishing nets that are often anchored underwater for 24 hours before being…
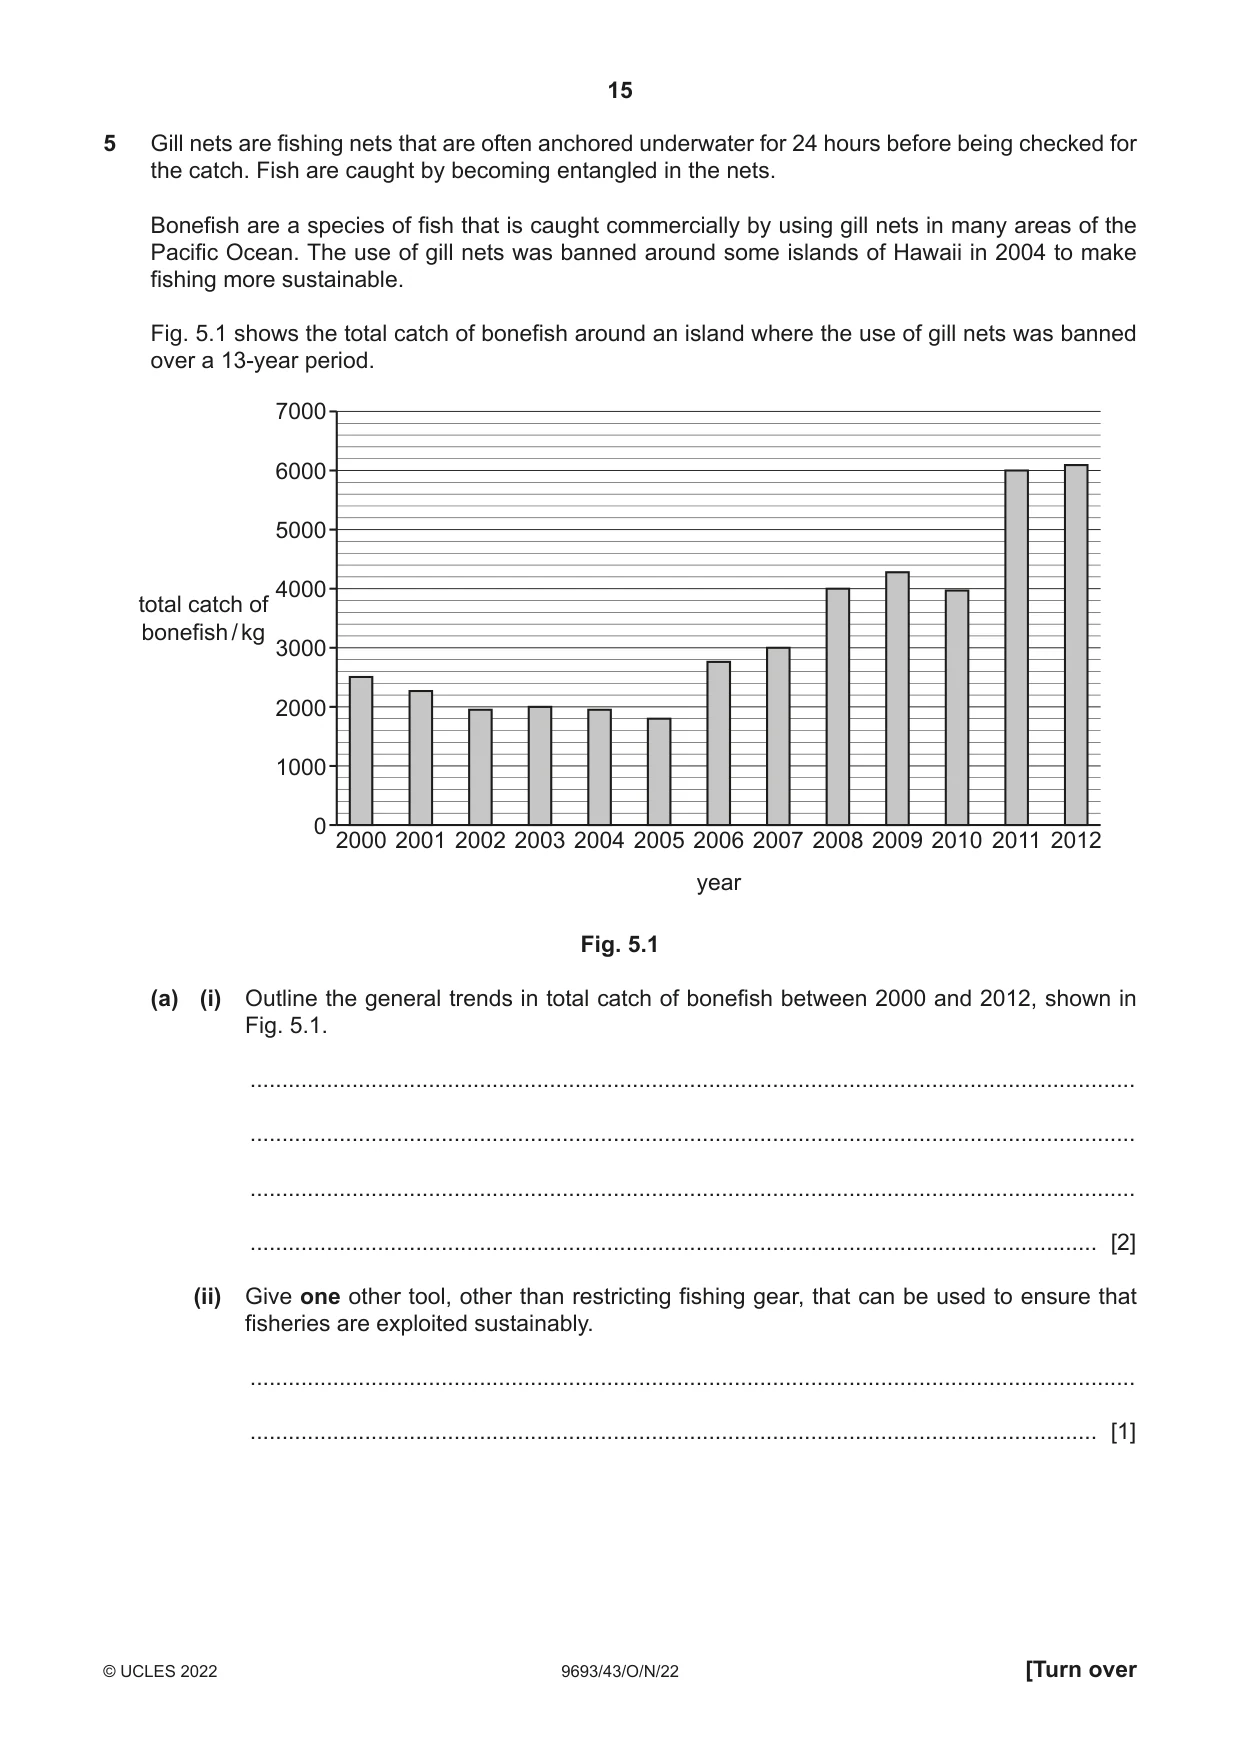
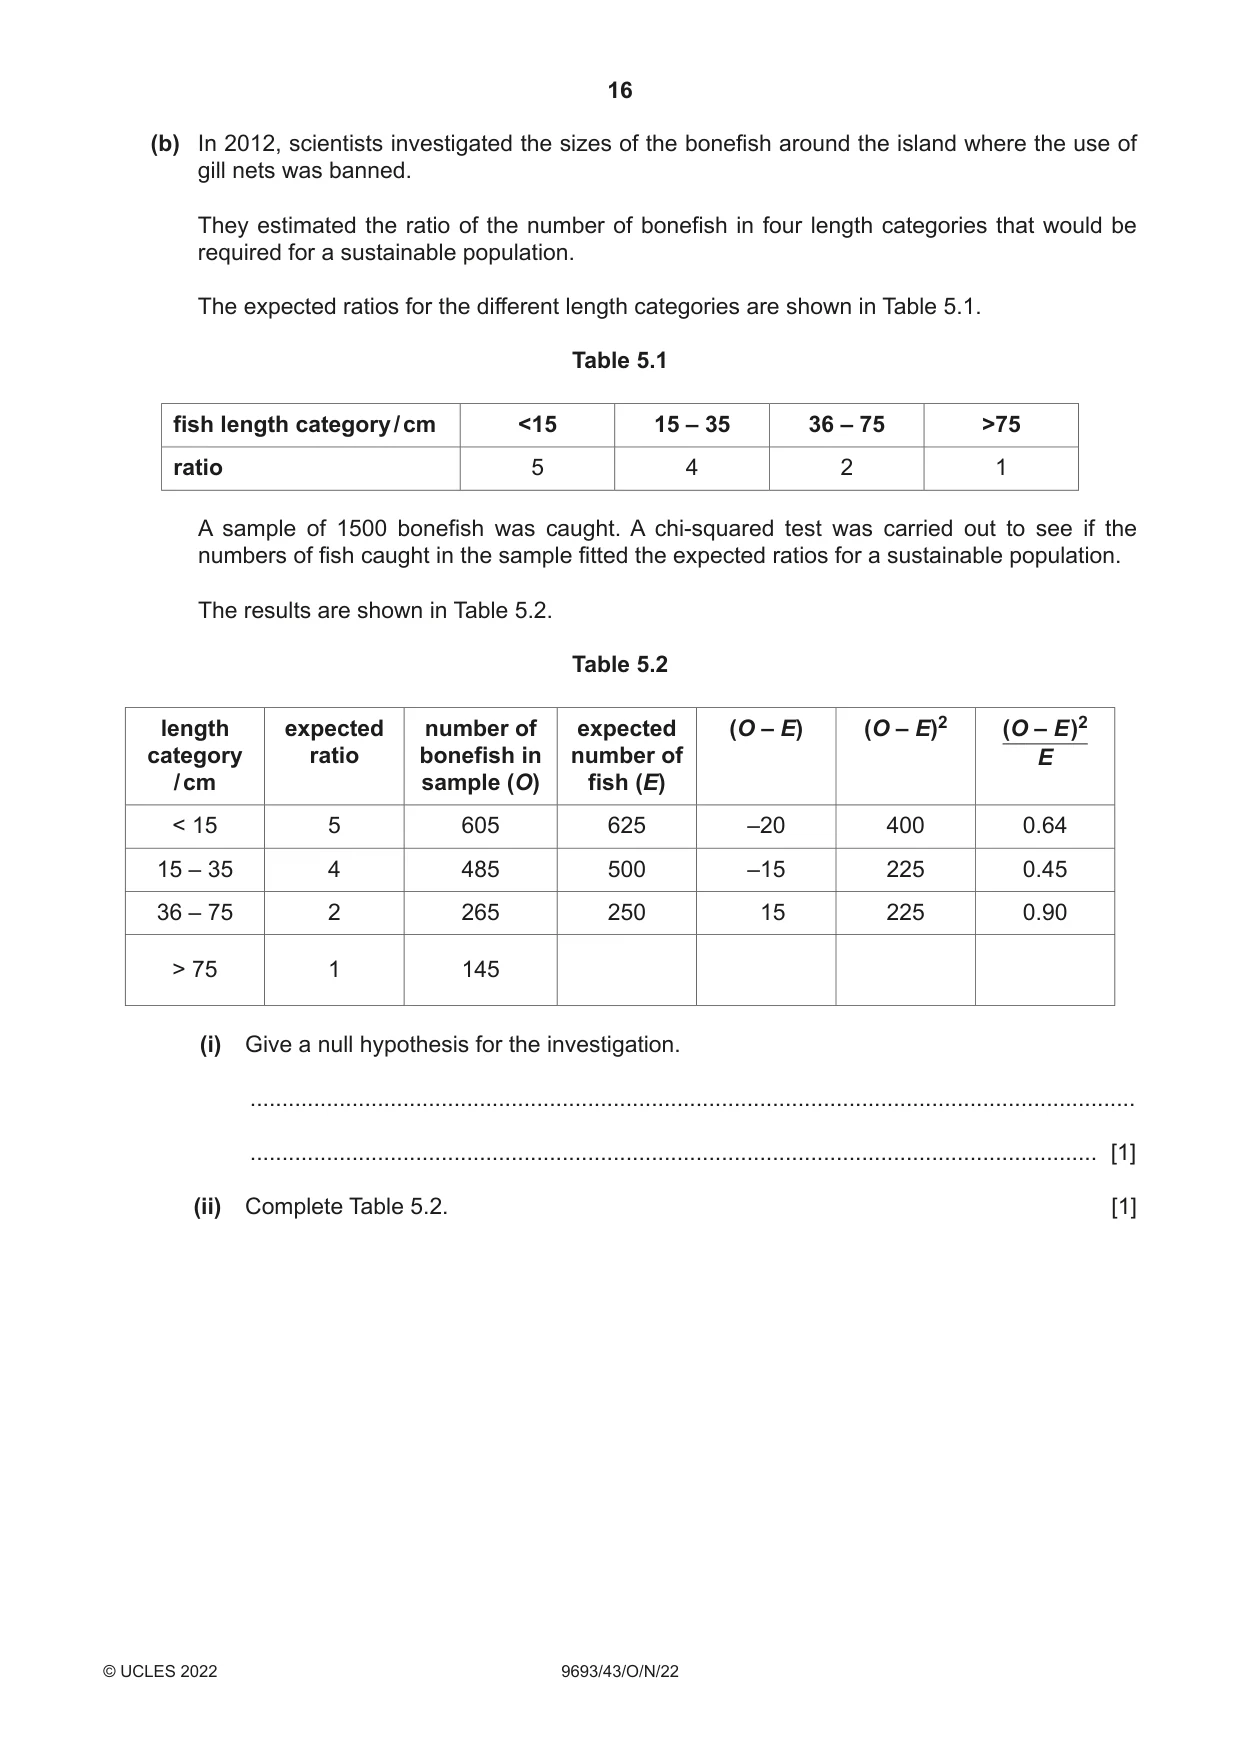
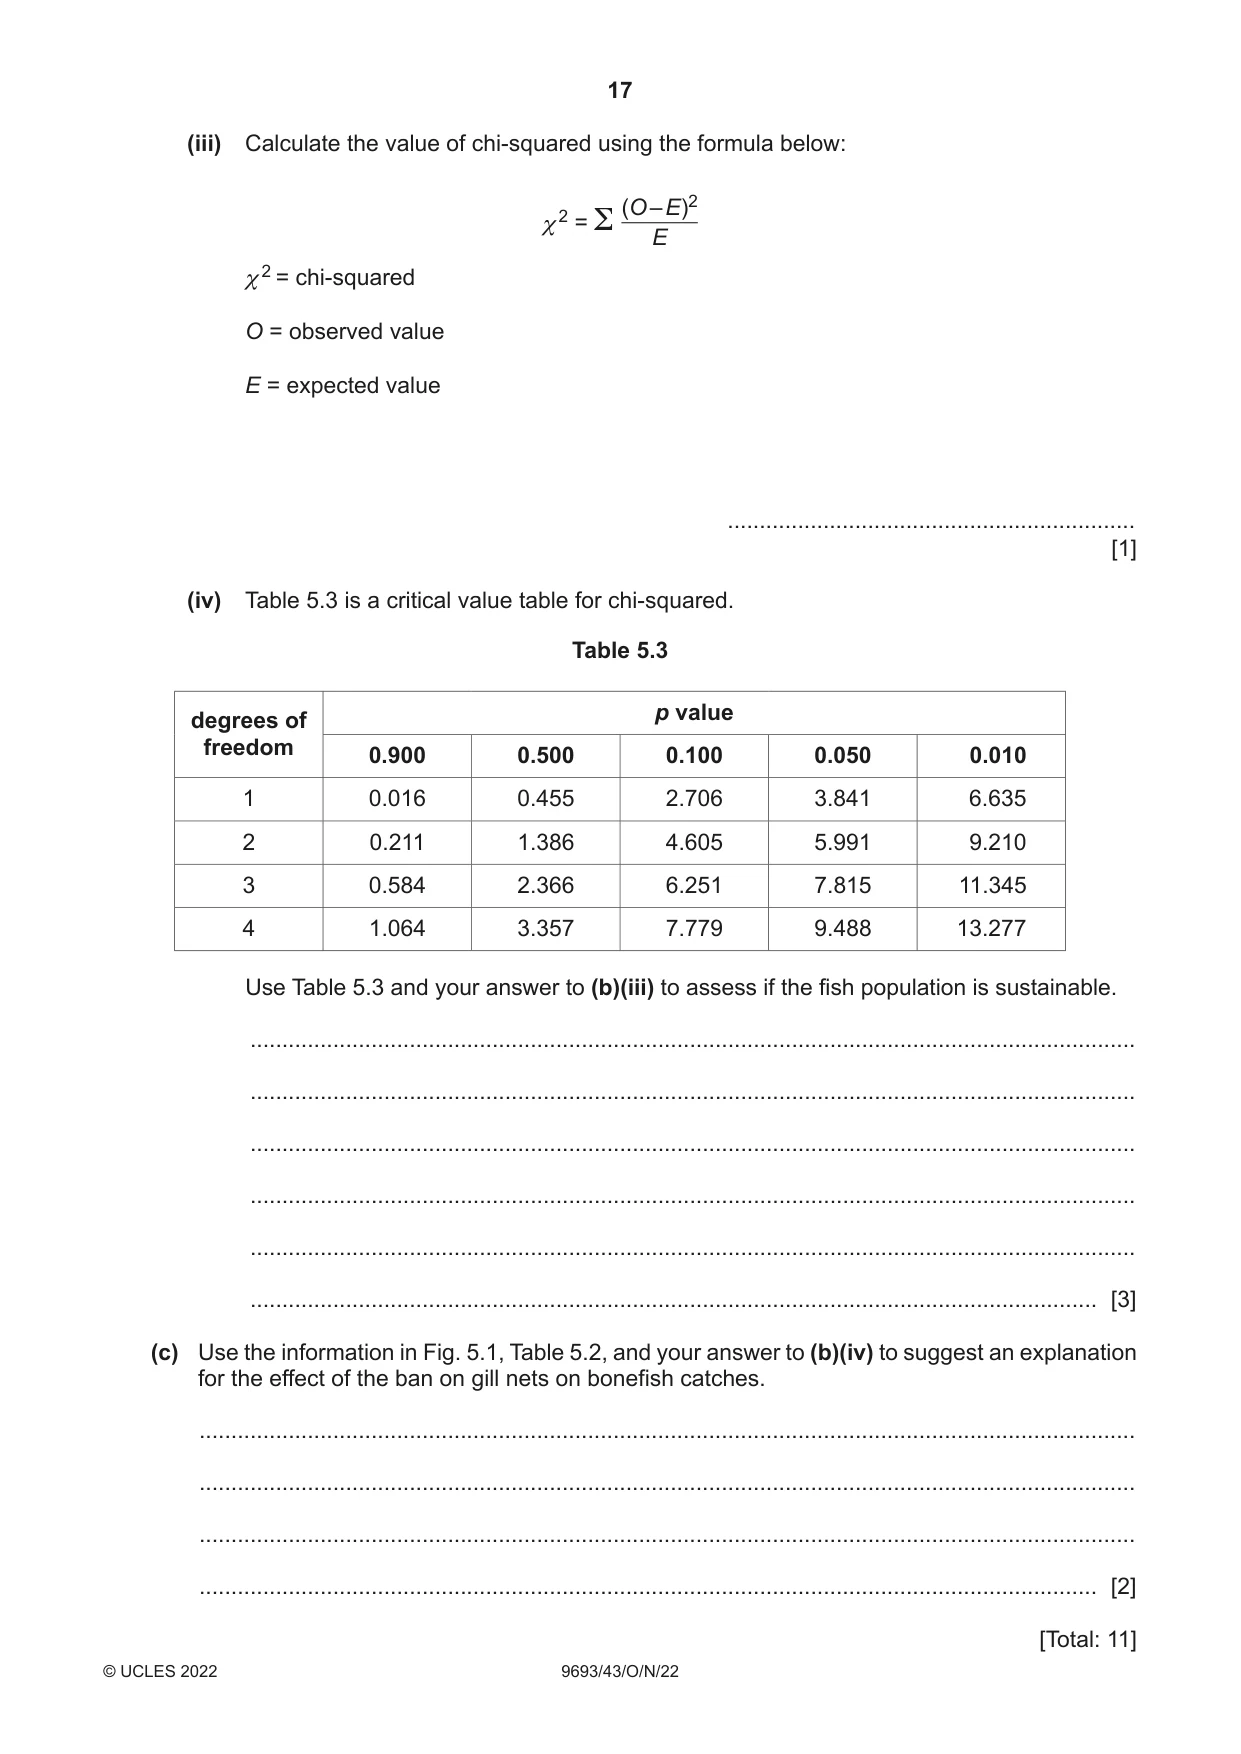
5 Gill nets are fishing nets that are often anchored underwater for 24 hours before being checked for the catch. Fish are caught by becoming entangled in the nets. Bonefish are a species of fish that is caught commercially by using gill nets in many areas of the Pacific Ocean. The use of gill nets was banned around some islands of Hawaii in 2004 to make fishing more sustainable. Fig. 5.1 shows the total catch of bonefish around an island where the use of gill nets was banned over a 13-year period. 7000 6000 5000 4000 total catch of bonefish / kg 3000 2000 1000 0 2000 2001 2002 2003 2004 2005 2006 2007 2008 2009 2010 2011 2012 year Fig. 5.1 (a) (i) Outline the general trends in total catch of bonefish between 2000 and 2012, shown in Fig. 5.1. ........................................................................................................................................... ........................................................................................................................................... ........................................................................................................................................... ..................................................................................................................................... [2] (ii) Give one other tool, other than restricting fishing gear, that can be used to ensure that fisheries are exploited sustainably. ........................................................................................................................................... ..................................................................................................................................... [1] (b) In 2012, scientists investigated the sizes of the bonefish around the island where the use of gill nets was banned. They estimated the ratio of the number of bonefish in four length categories that would be required for a sustainable population. The expected ratios for the different length categories are shown in Table 5.1. Table 5.1 fish length category / cm <15 15 – 35 36 – 75 >75 ratio 5 4 2 1 A sample of 1500 bonefish was caught. A chi-squared test was carried out to see if the numbers of fish caught in the sample fitted the expected ratios for a sustainable population. The results are shown in Table 5.2. Table 5.2 length expected number of expected (O – E) (O – E)2 (O – E)2 category ratio bonefish in number of E / cm sample (O) fish (E) < 15 5 605 625 –20 400 0.64 15 – 35 4 485 500 –15 225 0.45 36 – 75 2 265 250 15 225 0.90 > 75 1 145 (i) Give a null hypothesis for the investigation. ........................................................................................................................................... ..................................................................................................................................... [1] (ii) Complete Table 5.2. [1] (iii) Calculate the value of chi-squared using the formula below: – E)2 χ 2 = Σ (O E χ 2 = chi-squared O = observed value E = expected value ................................................................ [1] (iv) Table 5.3 is a critical value table for chi-squared. Table 5.3 p value degrees of freedom 0.900 0.500 0.100 0.050 0.010 1 0.016 0.455 2.706 3.841 6.635 2 0.211 1.386 4.605 5.991 9.210 3 0.584 2.366 6.251 7.815 11.345 4 1.064 3.357 7.779 9.488 13.277 Use Table 5.3 and your answer to (b)(iii) to assess if the fish population is sustainable. ........................................................................................................................................... ........................................................................................................................................... ........................................................................................................................................... ........................................................................................................................................... ........................................................................................................................................... ..................................................................................................................................... [3] (c) Use the information in Fig. 5.1, Table 5.2, and your answer to (b)(iv) to suggest an explanation for the effect of the ban on gill nets on bonefish catches. ................................................................................................................................................... ................................................................................................................................................... ................................................................................................................................................... ............................................................................................................................................. [2]
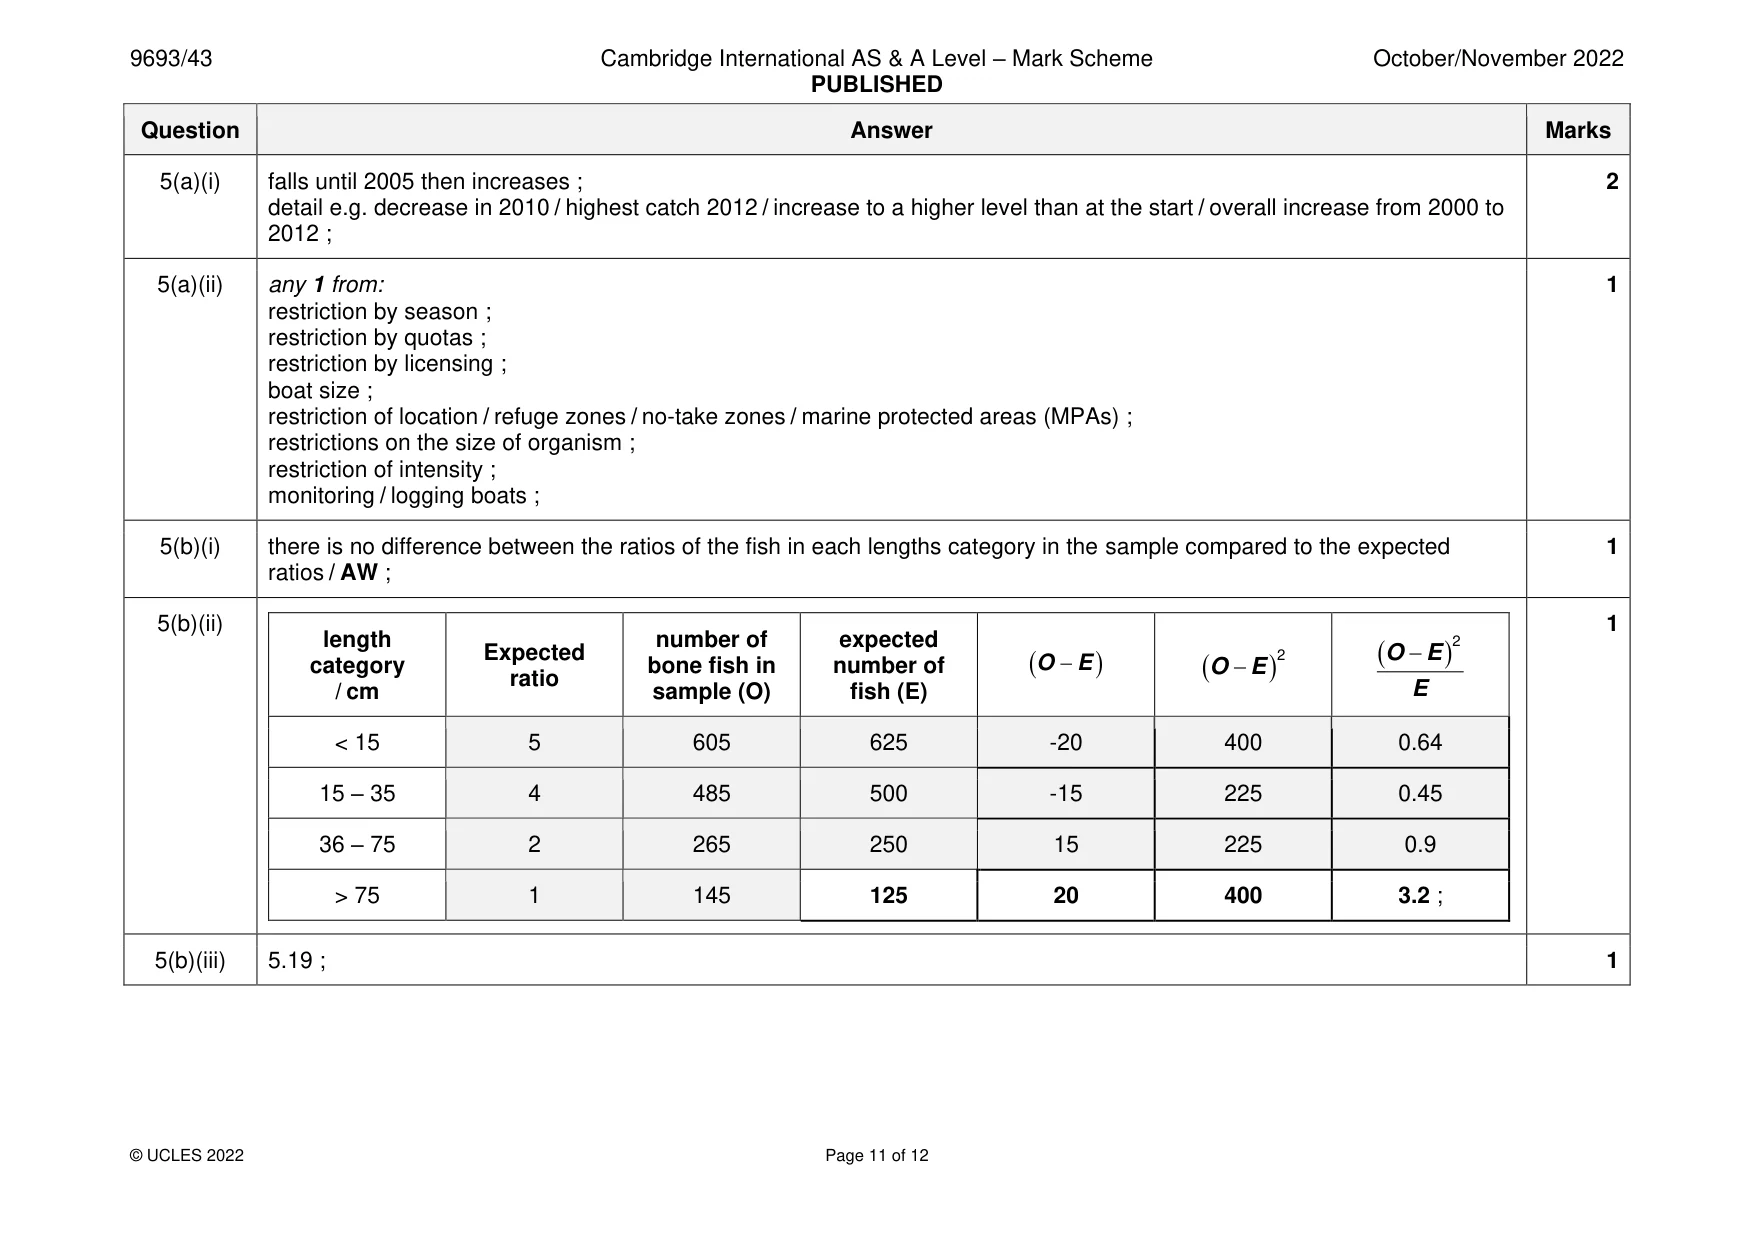
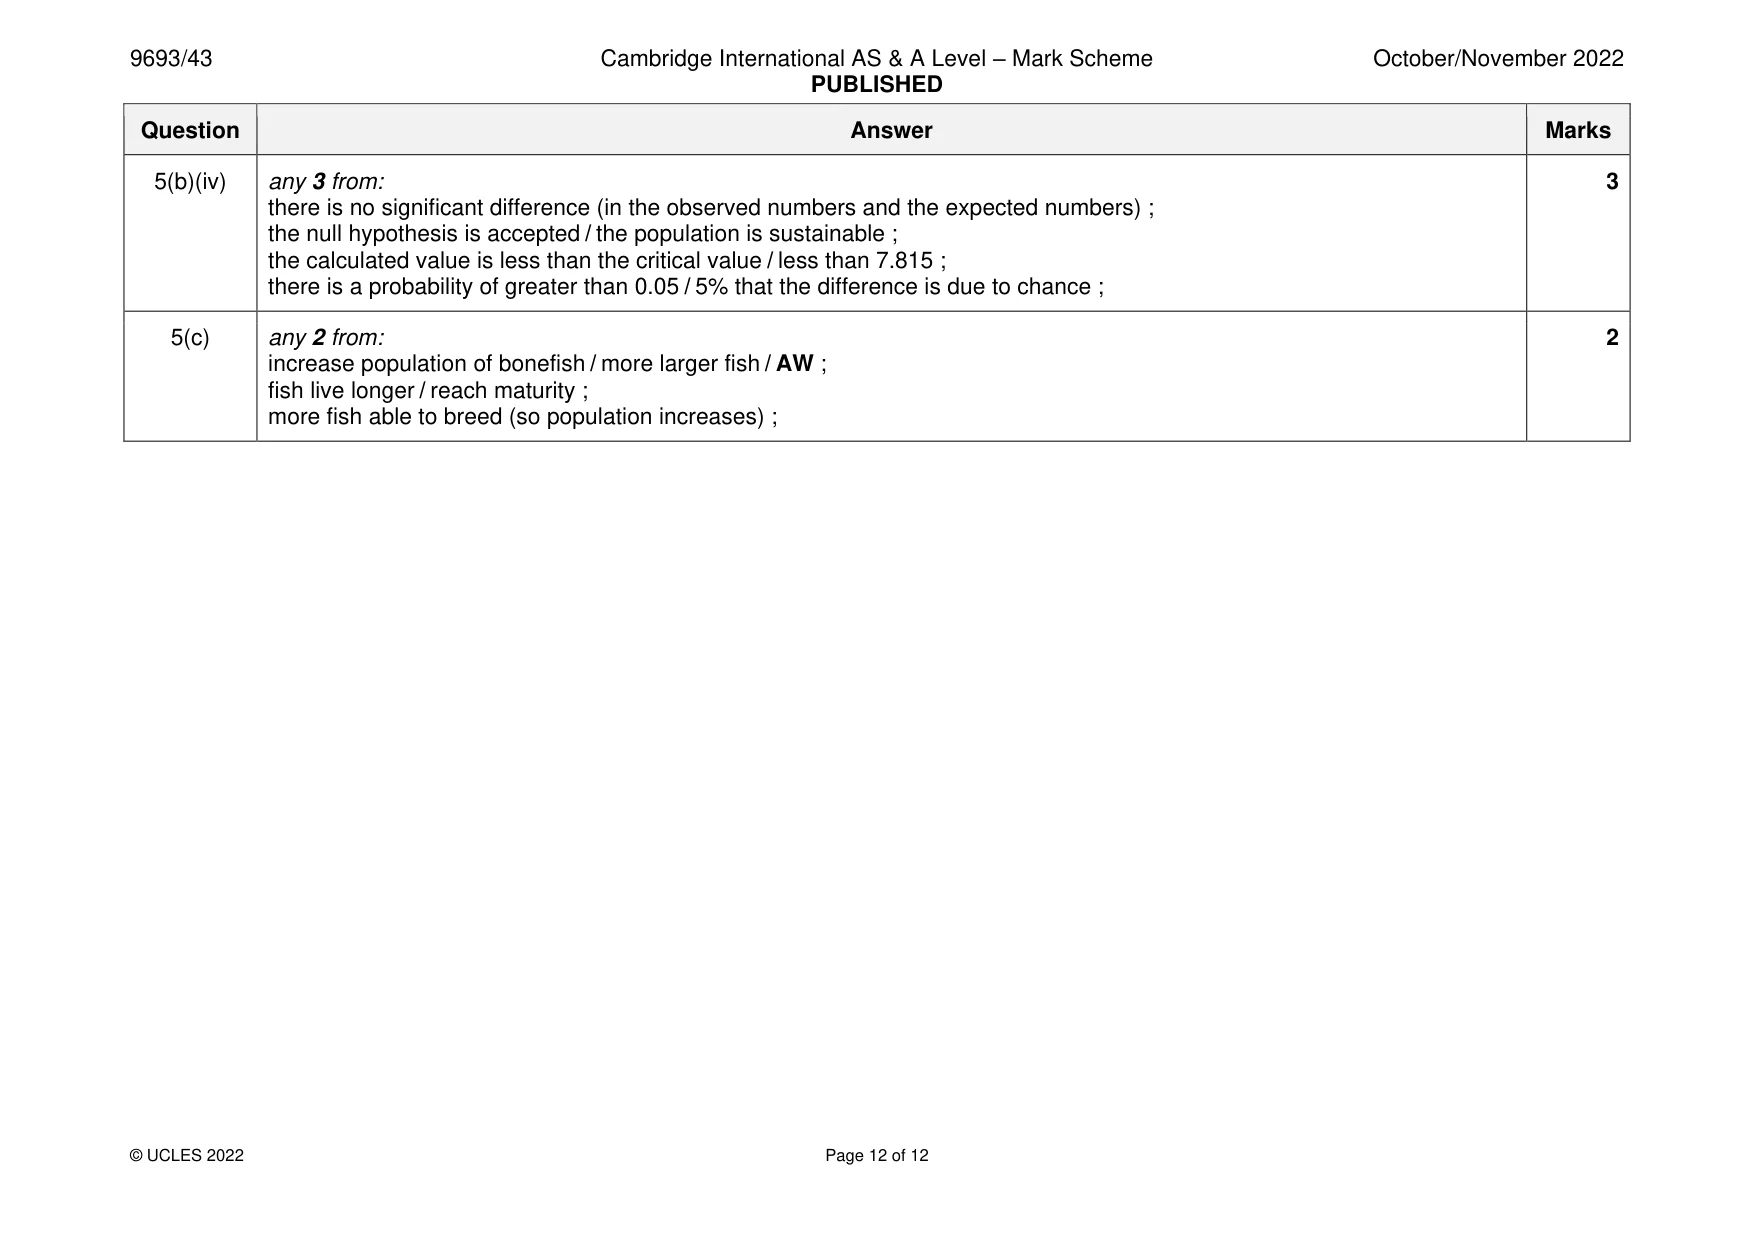
Mark scheme: 5(a)(i) falls until 2005 then increases ; 2 detail e.g. decrease in 2010 / highest catch 2012 / increase to a higher level than at the start / overall increase from 2000 to 2012 ; 5(a)(ii) any 1 from: 1 restriction by season ; restriction by quotas ; restriction by licensing ; boat size ; restriction of location / refuge zones / no-take zones / marine protected areas (MPAs) ; restrictions on the size of organism ; restriction of intensity ; monitoring / logging boats ; 5(b)(i) there is no difference between the ratios of the fish in each lengths category in the sample compared to the expected 1 ratios / AW ; 5(b)(ii) 1 length number of expected 2 Expected (O − E ) category bone fish in number of ( O − E ) (O − E ) 2 ratio / cm sample (O) fish (E) E < 15 5 605 625 -20 400 0.64 15 – 35 4 485 500 -15 225 0.45 36 – 75 2 265 250 15 225 0.9 > 75 1 145 125 20 400 3.2 ; 5(b)(iii) 5.19 ; 1 5(b)(iv) any 3 from: 3 there is no significant difference (in the observed numbers and the expected numbers) ; the null hypothesis is accepted / the population is sustainable ; the calculated value is less than the critical value / less than 7.815 ; there is a probability of greater than 0.05 / 5% that the difference is due to chance ; 5(c) any 2 from: 2 increase population of bonefish / more larger fish / AW ; fish live longer / reach maturity ; more fish able to breed (so population increases) ;
What was in this paper
The subtopics covered by these 5 questions, and how many questions each got. Open one in a new tab to see every Cambridge question on it.
What you needed in this session
Cambridge’s own grade thresholds for 2022 Oct/Nov, Paper 4 · Variant 3. A higher threshold means an easier paper — the bar moves with how the cohort did.