Cambridge A Level Geography 9696 — 2022 May/June Paper 4 · Variant 3
9696/43/M/J/22 · 11 questions · 60 marks · ≈68 min
The question paper and its mark scheme, free to read here and free to download. This is Cambridge’s own paper, exactly as it was sat.
Question paper4 pages

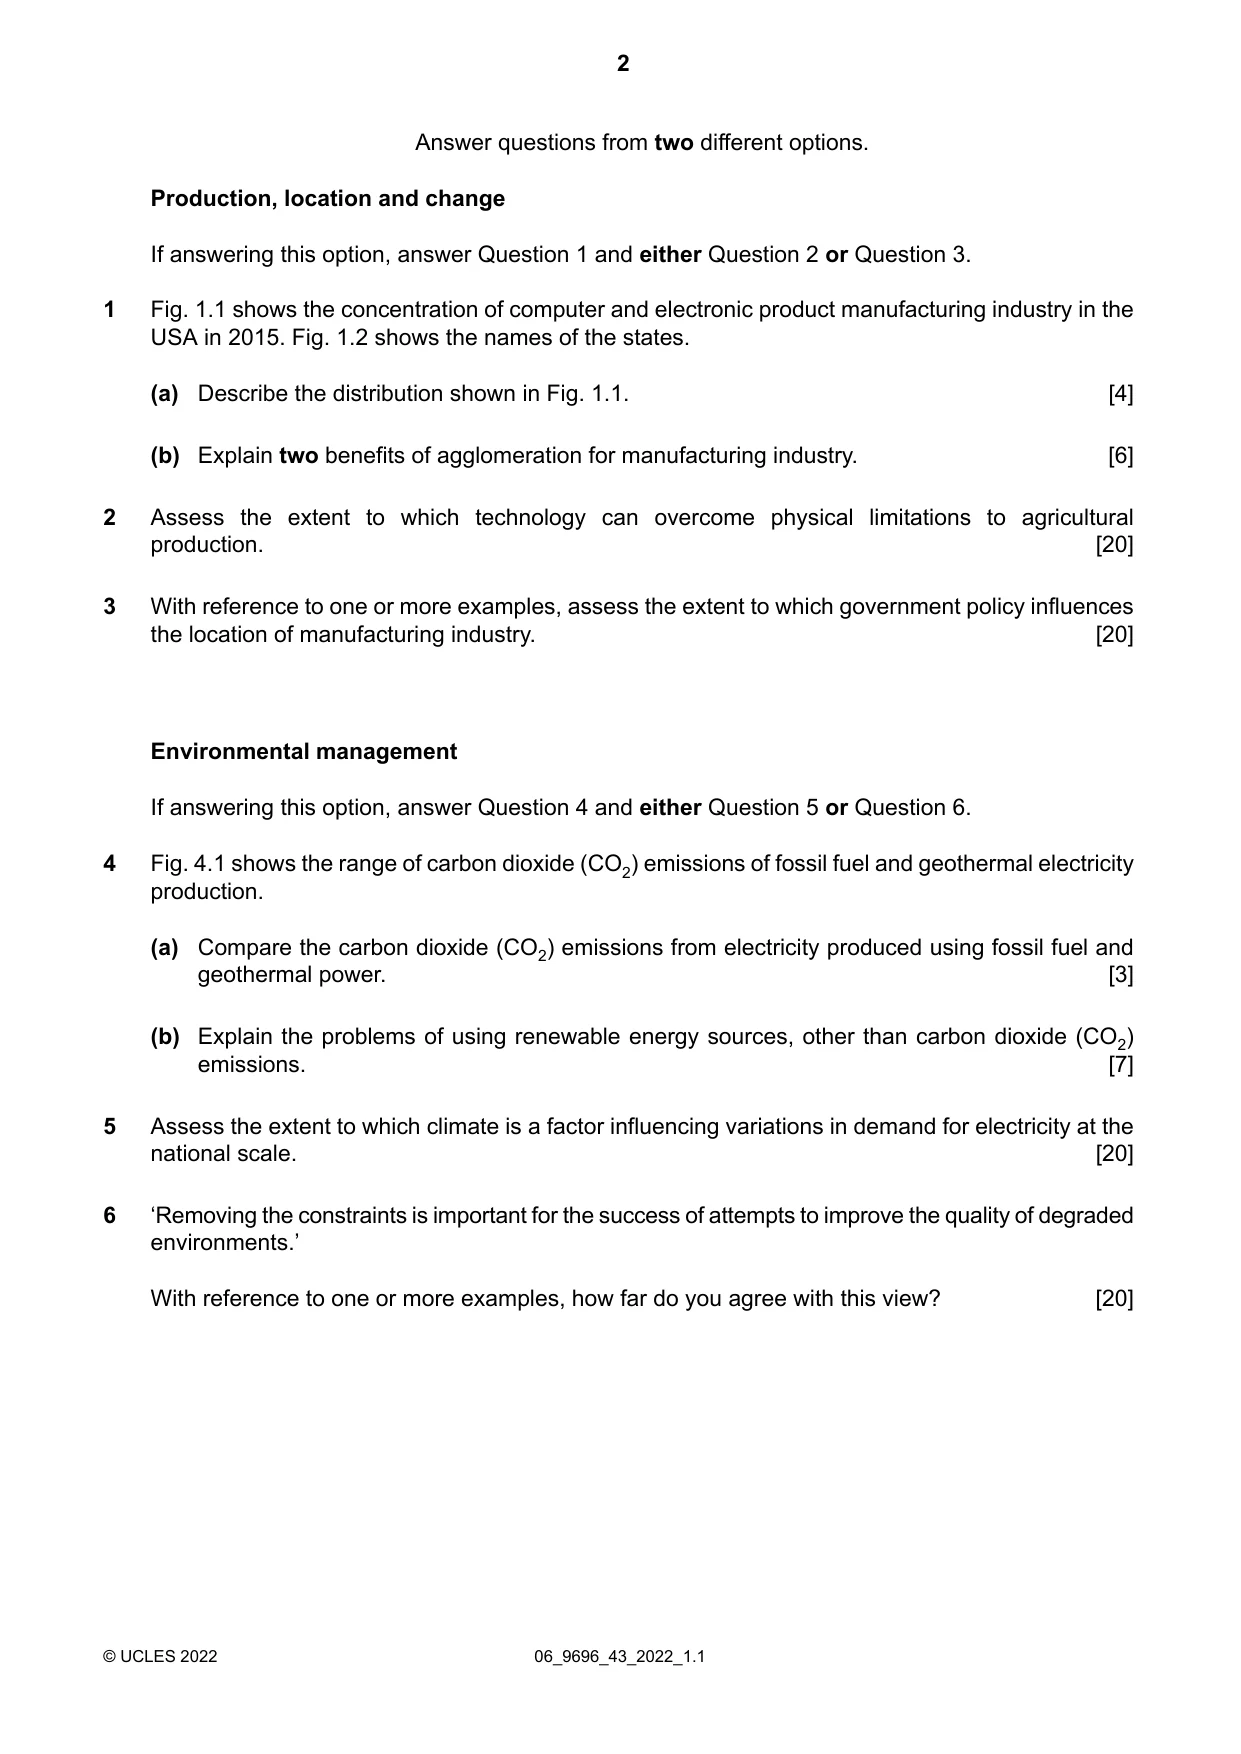
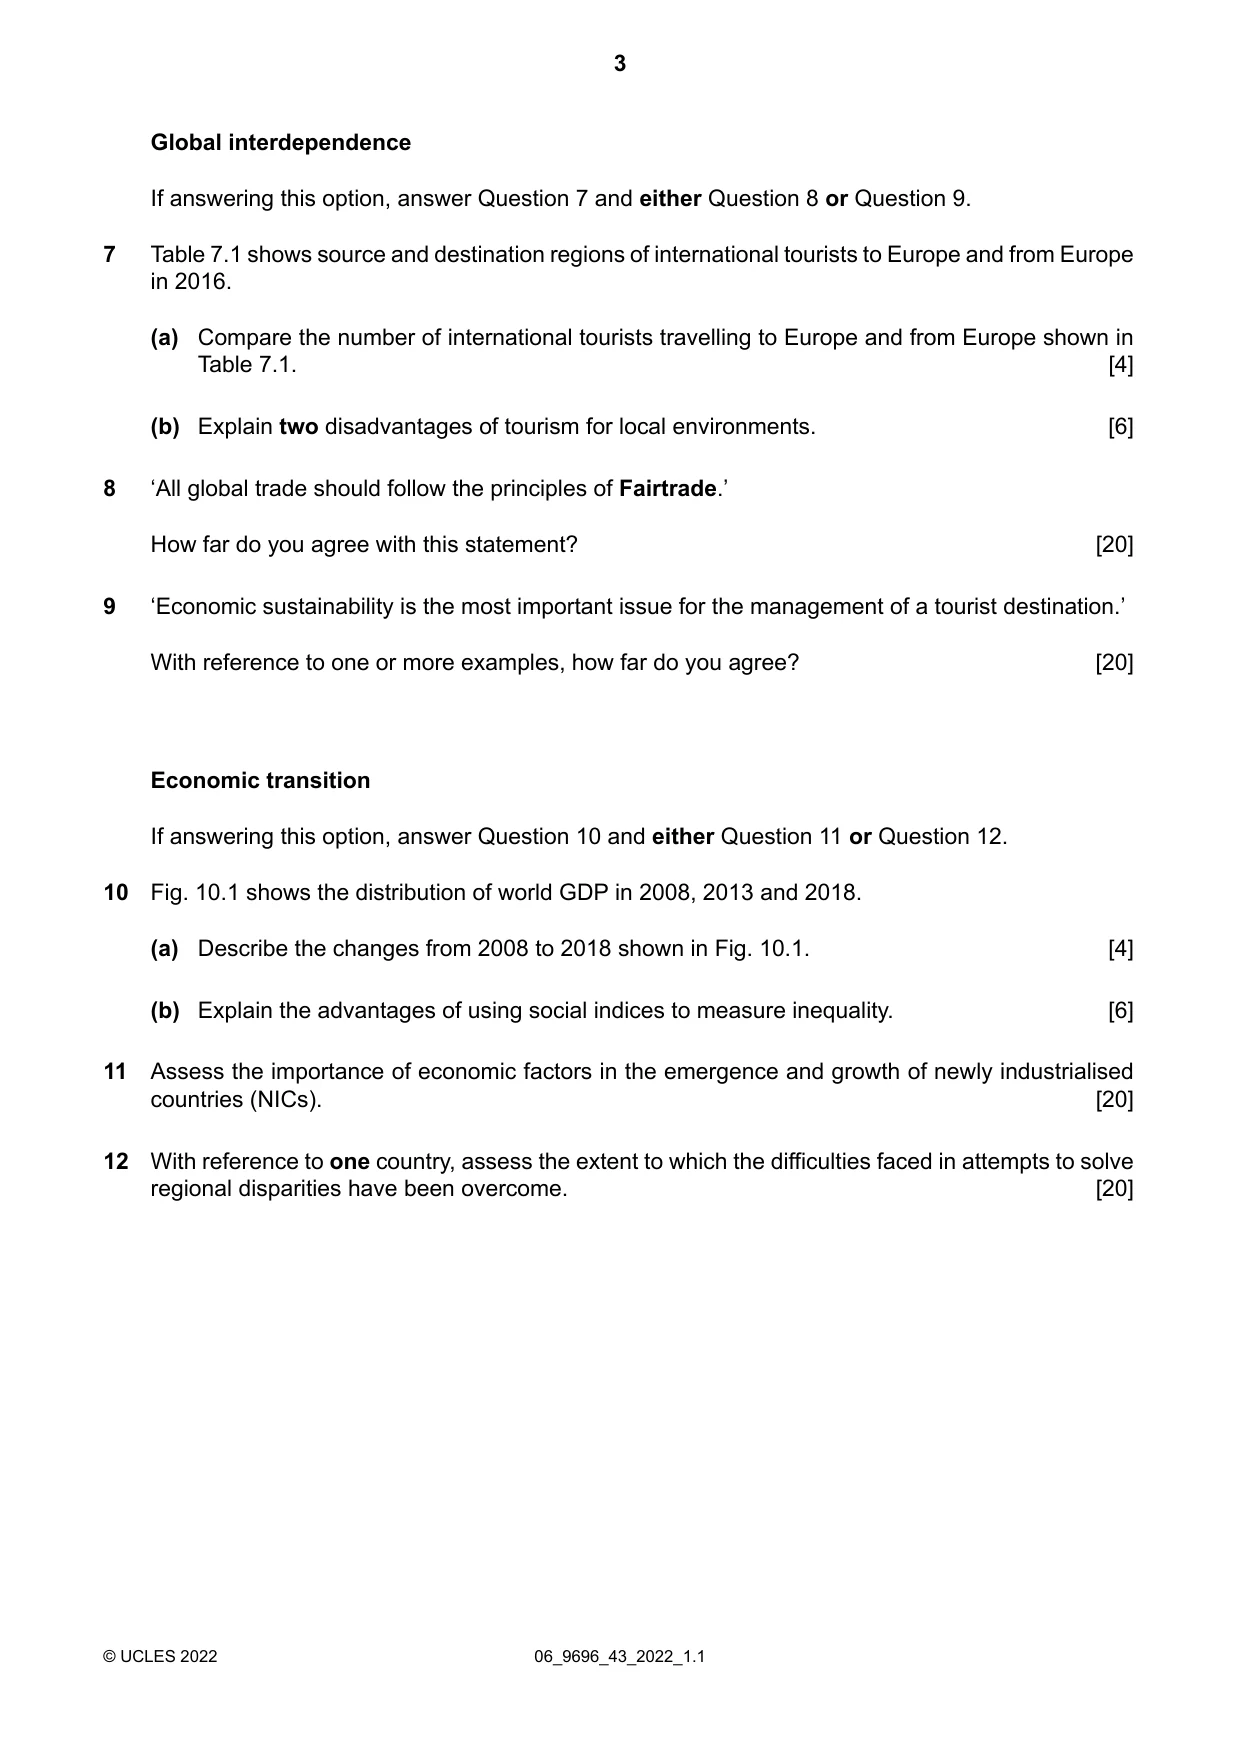

Mark scheme25 pages
Answers below. Sit the paper first if you are practising.














Questions as text
Q1 · The concentration of computer and electronic product manufacturing industry in the USA in…
1 Fig. 1.1 shows the concentration of computer and electronic product manufacturing industry in the USA in 2015. Fig. 1.2 shows the names of the states. (a) Describe the distribution shown in Fig. 1.1. [4] (b) Explain two benefits of agglomeration for manufacturing industry. [6]
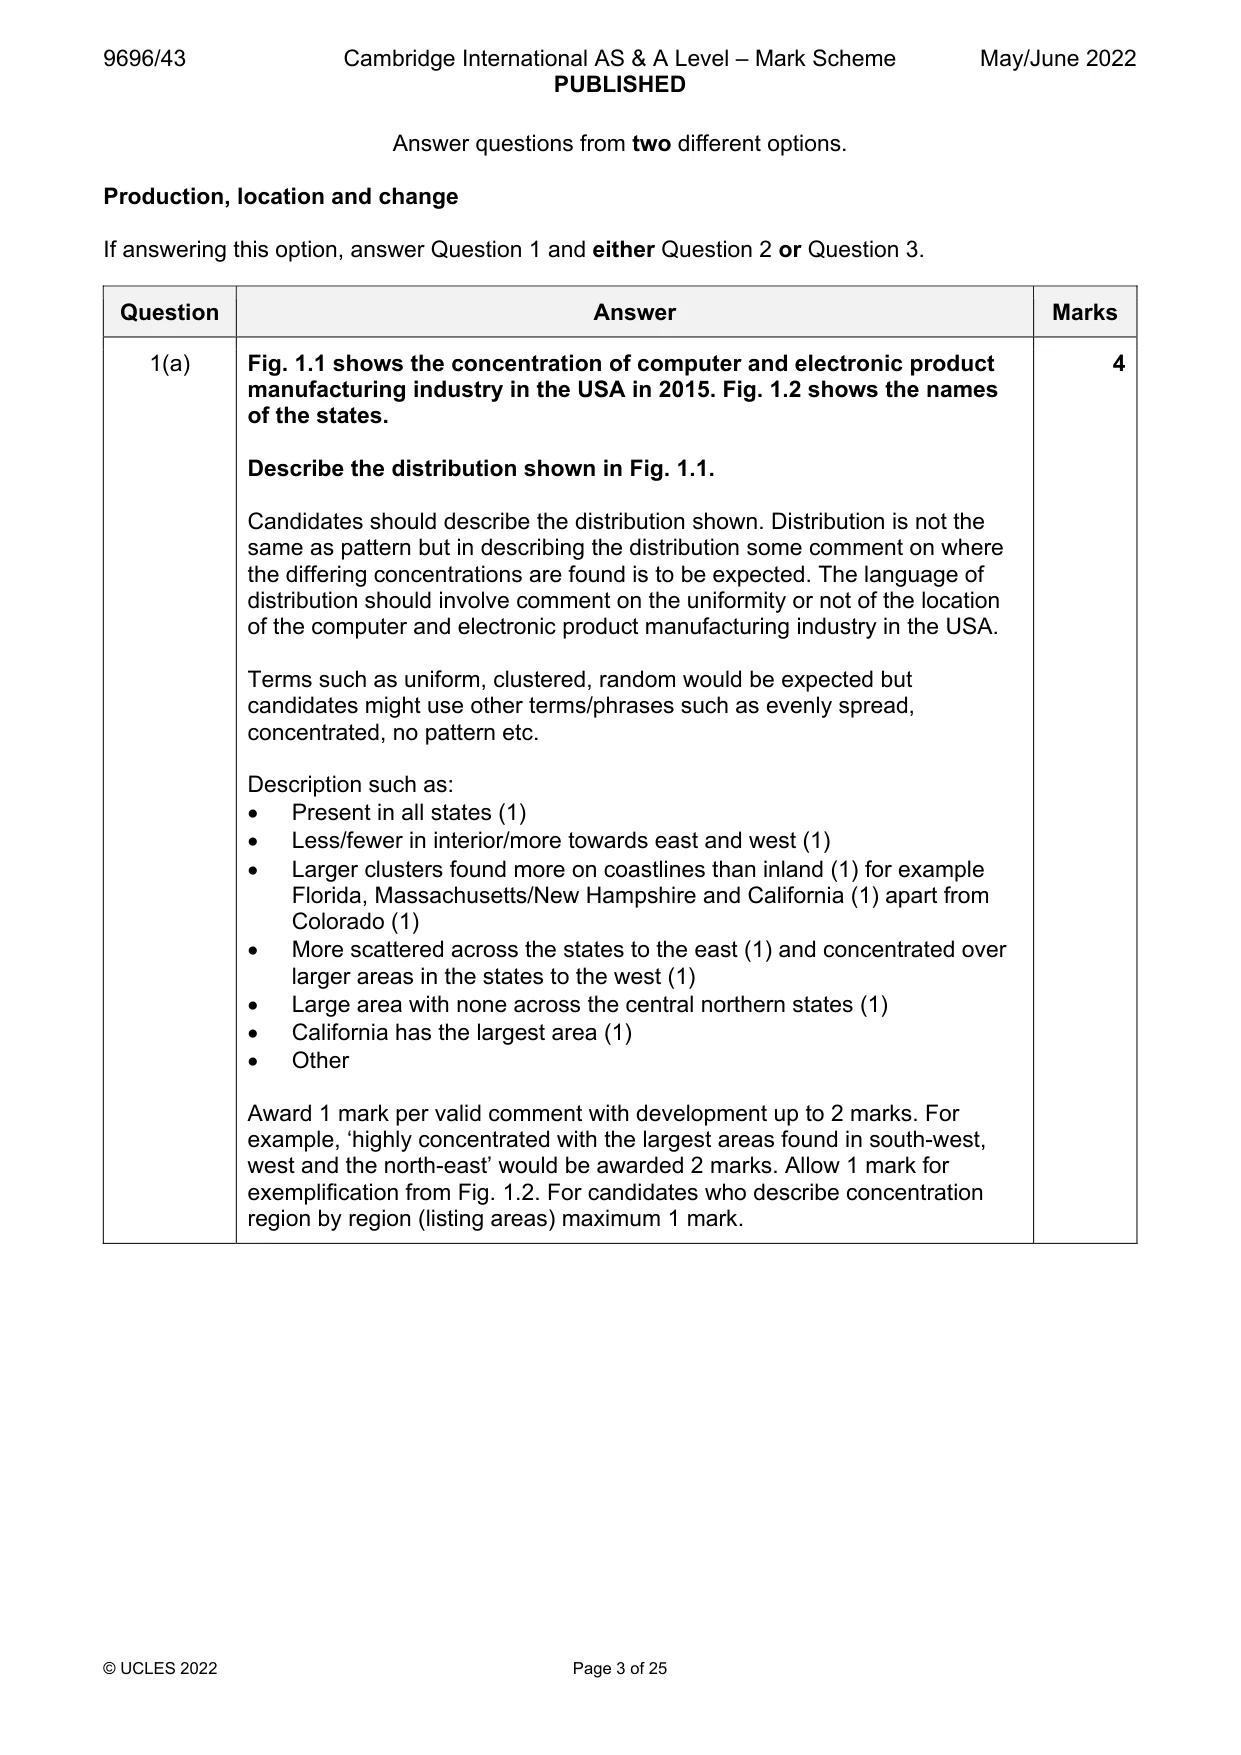
Mark scheme: Question Answer Marks 1(a) Fig. 1.1 shows the concentration of computer and electronic product 4 manufacturing industry in the USA in 2015. Fig. 1.2 shows the names of the states. Describe the distribution shown in Fig. 1.1. Candidates should describe the distribution shown. Distribution is not the same as pattern but in describing the distribution some comment on where the differing concentrations are found is to be expected. The language of distribution should involve comment on the uniformity or not of the location of the computer and electronic product manufacturing industry in the USA. Terms such as uniform, clustered, random would be expected but candidates might use other terms/phrases such as evenly spread, concentrated, no pattern etc. Description such as: Present in all states (1) Less/fewer in interior/more towards east and west (1) Larger clusters found more on coastlines than inland (1) for example Florida, Massachusetts/New Hampshire and California (1) apart from Colorado (1) More scattered across the states to the east (1) and concentrated over larger areas in the states to the west (1) Large area with none across the central northern states (1) California has the largest area (1) Other Award 1 mark per valid comment with development up to 2 marks. For example, ‘highly concentrated with the largest areas found in south-west, west and the north-east’ would be awarded 2 marks. Allow 1 mark for exemplification from Fig. 1.2. For candidates who describe concentration region by region (listing areas) maximum 1 mark. 1(b) Explain two benefits of agglomeration for manufacturing industry. 6 Candidates should explain two benefits of agglomeration for manufacturing industry. They may take a broad approach referring to benefits such as lower costs and higher profits or take a narrower approach based on individual factors such as: Labour supply, skills and training Supply chain factors Research and development Reputation and specialisation Infrastructure and transport Other Award marks based on the quality of explanation and breadth of the response using the marking levels below. Level 3 (5–6) Response clearly explains two benefits of agglomeration for manufacturing industry. Response is well founded in detailed knowledge and strong conceptual understanding of the topic. Examples used are appropriate and integrated effectively into the response. Level 2 (3–4) Response explains one or two benefits of agglomeration for manufacturing industry in a limited manner or focuses more on one benefit. Response develops on a largely secure base of knowledge and understanding. Examples may lack detail or development. Level 1 (1–2) Response comprises one or more descriptive points about agglomeration of manufacturing industry. Knowledge is basic and understanding may be inaccurate. Examples are in name only or lacking entirely. Level 0 (0) No creditable response.
Q2 · Assess the extent to which technology can overcome physical limitations to agricultural…
2 Assess the extent to which technology can overcome physical limitations to agricultural production. [20]
Mark scheme: 2 Assess the extent to which technology can overcome physical 20 limitations to agricultural production. Candidates are free to develop their own approach to the question and responses will vary depending on the example(s) chosen. Whichever approach is chosen, essays which address the question and support their argument with relevant examples will be credited. The direction of the response and evaluation made will depend on the approach chosen, and any evaluation is therefore valid if argued and based on evidence. Candidates should assess the extent to which technology can overcome physical limitations to agricultural production. They may argue that there are spatial variations and have been temporal variations, along with comment on which physical limitations can be overcome or not. A sound response should consider at least two physical limitations such as those associated with climate, water availability, relief, soils or pests and may include physical limitations linked to human factors such as enhanced global warming or soil erosion but in cases such as these the physical limitation should be clear. Examples of technology may vary in scale, level of technology, cost etc. and discussion of appropriateness of the technology could form part of a successful response. Reference to agricultural production could include total production, increased yields, diversification or the ability to start producing where not previously possible. A higher-level response will have clear links between technology, each specific physical limitation and agricultural production with examples in support. Award marks based on the quality of the response using the marking levels below. 2 Level 4 (16–20) Response thoroughly discusses the extent to which technology can overcome physical limitations to agricultural production. An effective and sustained evaluation with a sound conclusion. Response is well founded in detailed exemplar knowledge and strong conceptual understanding of the topic. Examples used are appropriate and integrated effectively into the response. Level 3 (11–15) Response discusses the extent to which technology can overcome physical limitations to agricultural production. Response is broadly evaluative in character, comprising some explanatory or narrative content and a conclusion. Response develops on a largely secure base of knowledge and understanding with the use of example(s). Level 2 (6–10) Response demonstrates some knowledge and understanding of the extent to which technology can overcome physical limitations to agricultural production. Response is mainly descriptive or explanatory in approach and contains a brief or thinly supported evaluation. Responses without the use of example(s) to support the response will not get above the middle of Level 2 (8 marks). Level 1 (1–5) Response makes a few general points about technology in agriculture and/or physical limitations to agricultural production. A descriptive response comprising a few simple points. Knowledge is basic and understanding may be poor and lack relevance to the question set. Level 0 (0) No creditable response.
Q3 · With reference to one or more examples, assess the extent to which government policy…
3 With reference to one or more examples, assess the extent to which government policy influences the location of manufacturing industry. [20] Environmental management If answering this option, answer Question 4 and either Question 5 or Question 6.
Mark scheme: 3 With reference to one or more examples, assess the extent to which 20 government policy influences the location of manufacturing industry. Candidates are free to develop their own approach to the question and responses will vary depending on the example(s) chosen. Whichever approach is chosen, essays which address the question and support their argument with relevant examples will be credited. The direction of the response and evaluation made will depend on the approach chosen, and any evaluation is therefore valid if argued and based on evidence. Candidates should use one or more examples to assess the extent to which government policy influences the location of manufacturing industry. Examples could be of governments, policies, locations and/or manufacturing industries. Assessment of the extent allows candidates to bring in and compare other factors influencing the location of manufacturing industry but a response from mid-Level 3 upwards should have a clear assessment of the government policy aspect of the question. Assessment may also consider spatial and temporal differences and factors such as type of manufacturing industry. Governments may influence the location of manufacturing industry by encouraging or discouraging industries and have a range of direct and/or indirect policies. Location could be viewed as encouraging manufacturing industry to their country, to regions within the country and/or to a specific location. Award marks based on the quality of the response using the marking levels below. Level 4 (16–20) Response thoroughly discusses the extent to which government policy influences the location of manufacturing industry using one or more examples. An effective and sustained evaluation with a sound conclusion. Response is well founded in detailed exemplar knowledge and strong conceptual understanding of the topic. Examples used are appropriate and integrated effectively into the response. Level 3 (11–15) Response discusses the extent to which government policy influences the location of manufacturing industry using one or more examples. Response is broadly evaluative in character, comprising some explanatory or narrative content and a conclusion. Response develops on a largely secure base of knowledge and understanding with the use of example(s). 3 Level 2 (6–10) Response demonstrates some knowledge and understanding of the extent to which government policy influences the location of manufacturing industry. Response is mainly descriptive or explanatory in approach and contains a brief or thinly supported evaluation. Responses without the use of example(s) to support the response will not get above the middle of Level 2 (8 marks). Level 1 (1–5) Response makes a few general points about government policy or the location of manufacturing industry. A descriptive response comprising a few simple points. Knowledge is basic and understanding may be poor and lack relevance to the question set. Level 0 (0) No creditable response. Environmental management If answering this option, answer Question 4 and either Question 5 or Question 6.
Q4 · The range of carbon dioxide (CO2) emissions of fossil fuel and geothermal electricity…
4 Fig. 4.1 shows the range of carbon dioxide (CO2) emissions of fossil fuel and geothermal electricity production. (a) Compare the carbon dioxide (CO2) emissions from electricity produced using fossil fuel and geothermal power. [3] (b) Explain the problems of using renewable energy sources, other than carbon dioxide (CO2) emissions. [7]
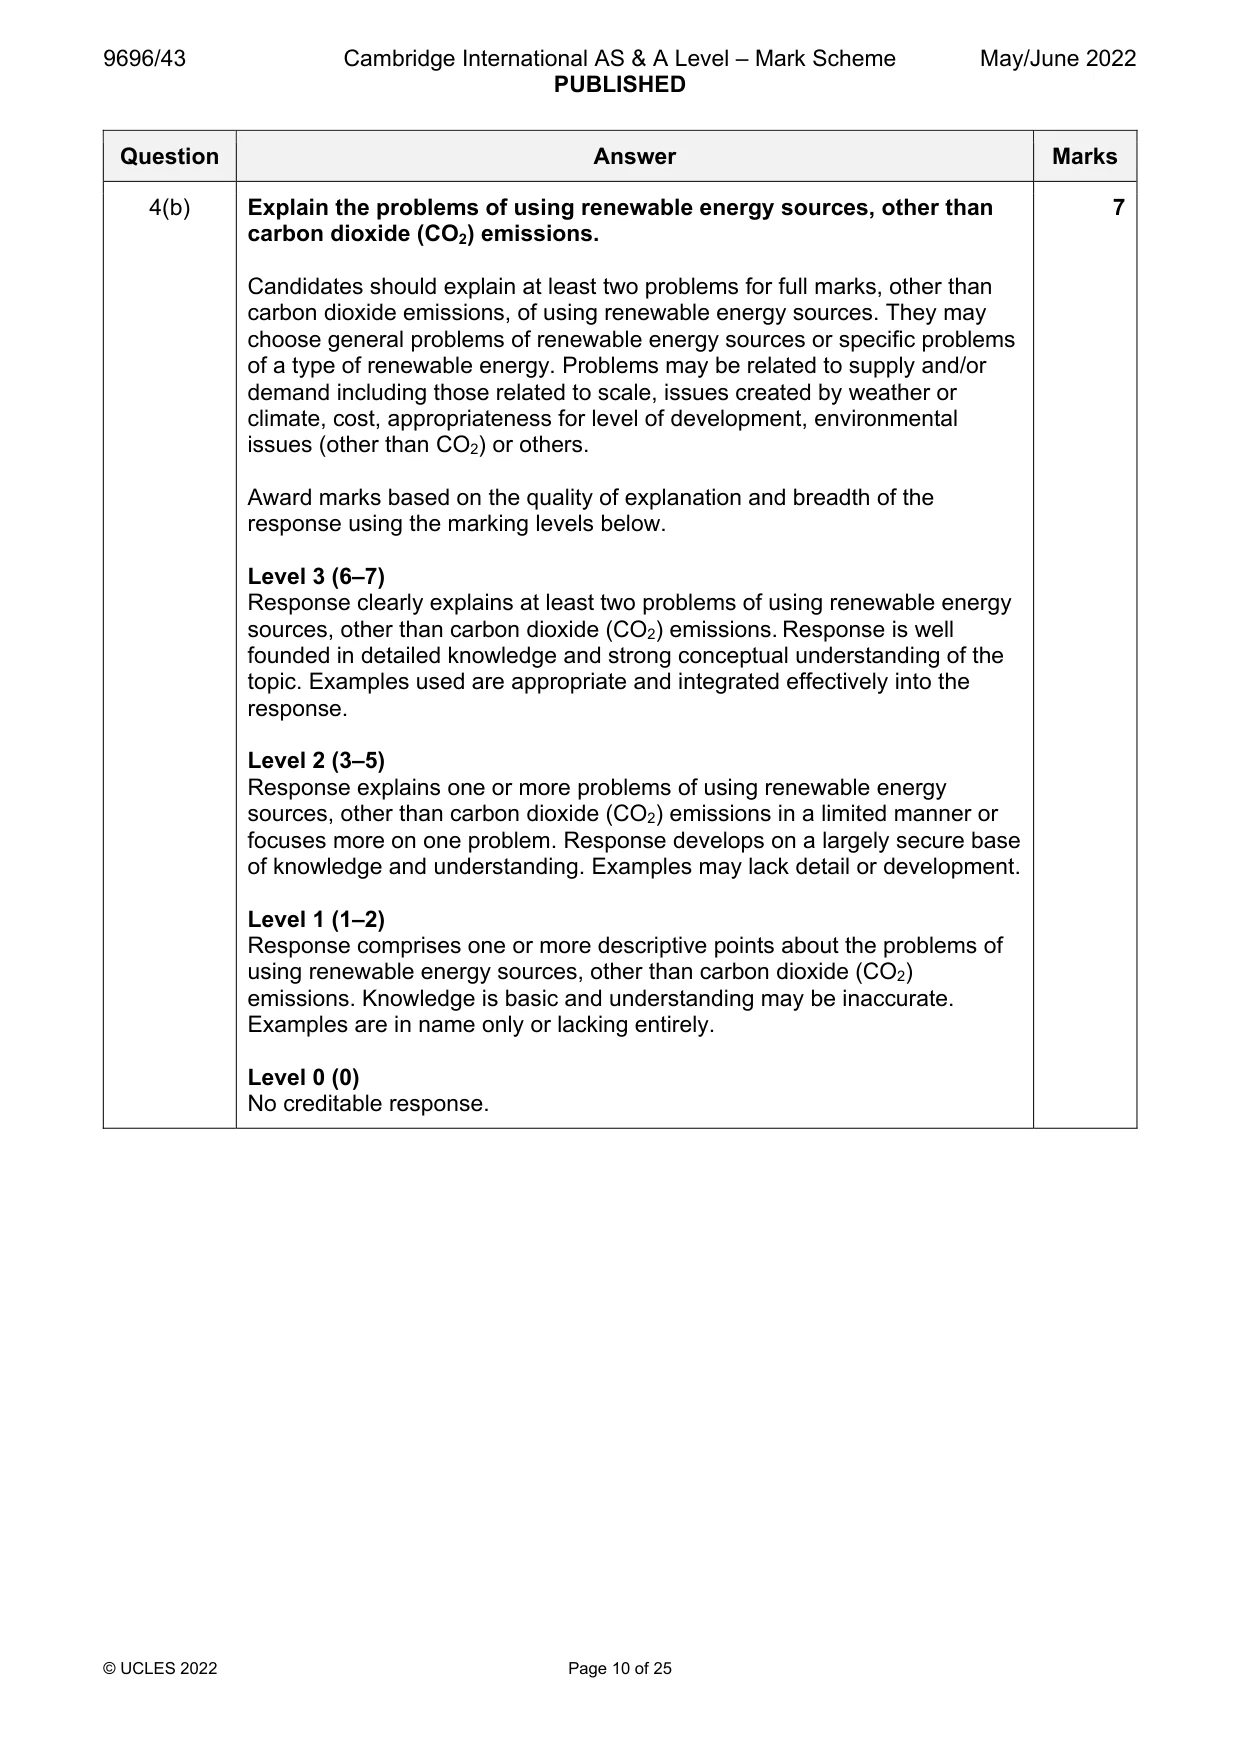
Mark scheme: 4(a) Fig. 4.1 shows the range of carbon dioxide (CO2) emissions of fossil 3 fuel and geothermal electricity production. Compare the carbon dioxide (CO2) emissions from electricity produced using fossil fuel and geothermal power. Statements comparing emissions from electricity produced by geothermal with fossil fuel power such as the following should be credited: The highest emissions from fossil fuels are from coal at 1060 g/kWh, the highest from geothermal are 740 g/kWh (1) The lowest from geothermal are 20 g/kWh, the lowest from fossil fuels is natural gas 360 g/kWh (1) There are variations in ranges in all power sources (1) more so for geothermal (range from 15 to 740 g/kWh)(1) Geothermal higher emissions are greater than those of oil and natural gas (1) Other valid comparisons Award 1 mark per valid comparison with development up to 2 marks. Maximum 2 marks if candidates only compare geothermal with one of the fossil fuels. 4(b) Explain the problems of using renewable energy sources, other than 7 carbon dioxide (CO2) emissions. Candidates should explain at least two problems for full marks, other than carbon dioxide emissions, of using renewable energy sources. They may choose general problems of renewable energy sources or specific problems of a type of renewable energy. Problems may be related to supply and/or demand including those related to scale, issues created by weather or climate, cost, appropriateness for level of development, environmental issues (other than CO2) or others. Award marks based on the quality of explanation and breadth of the response using the marking levels below. Level 3 (6–7) Response clearly explains at least two problems of using renewable energy sources, other than carbon dioxide (CO2) emissions. Response is well founded in detailed knowledge and strong conceptual understanding of the topic. Examples used are appropriate and integrated effectively into the response. Level 2 (3–5) Response explains one or more problems of using renewable energy sources, other than carbon dioxide (CO2) emissions in a limited manner or focuses more on one problem. Response develops on a largely secure base of knowledge and understanding. Examples may lack detail or development. Level 1 (1–2) Response comprises one or more descriptive points about the problems of using renewable energy sources, other than carbon dioxide (CO2) emissions. Knowledge is basic and understanding may be inaccurate. Examples are in name only or lacking entirely. Level 0 (0) No creditable response.
Q5 · Assess the extent to which climate is a factor influencing variations in demand for…
5 Assess the extent to which climate is a factor influencing variations in demand for electricity at the national scale. [20]
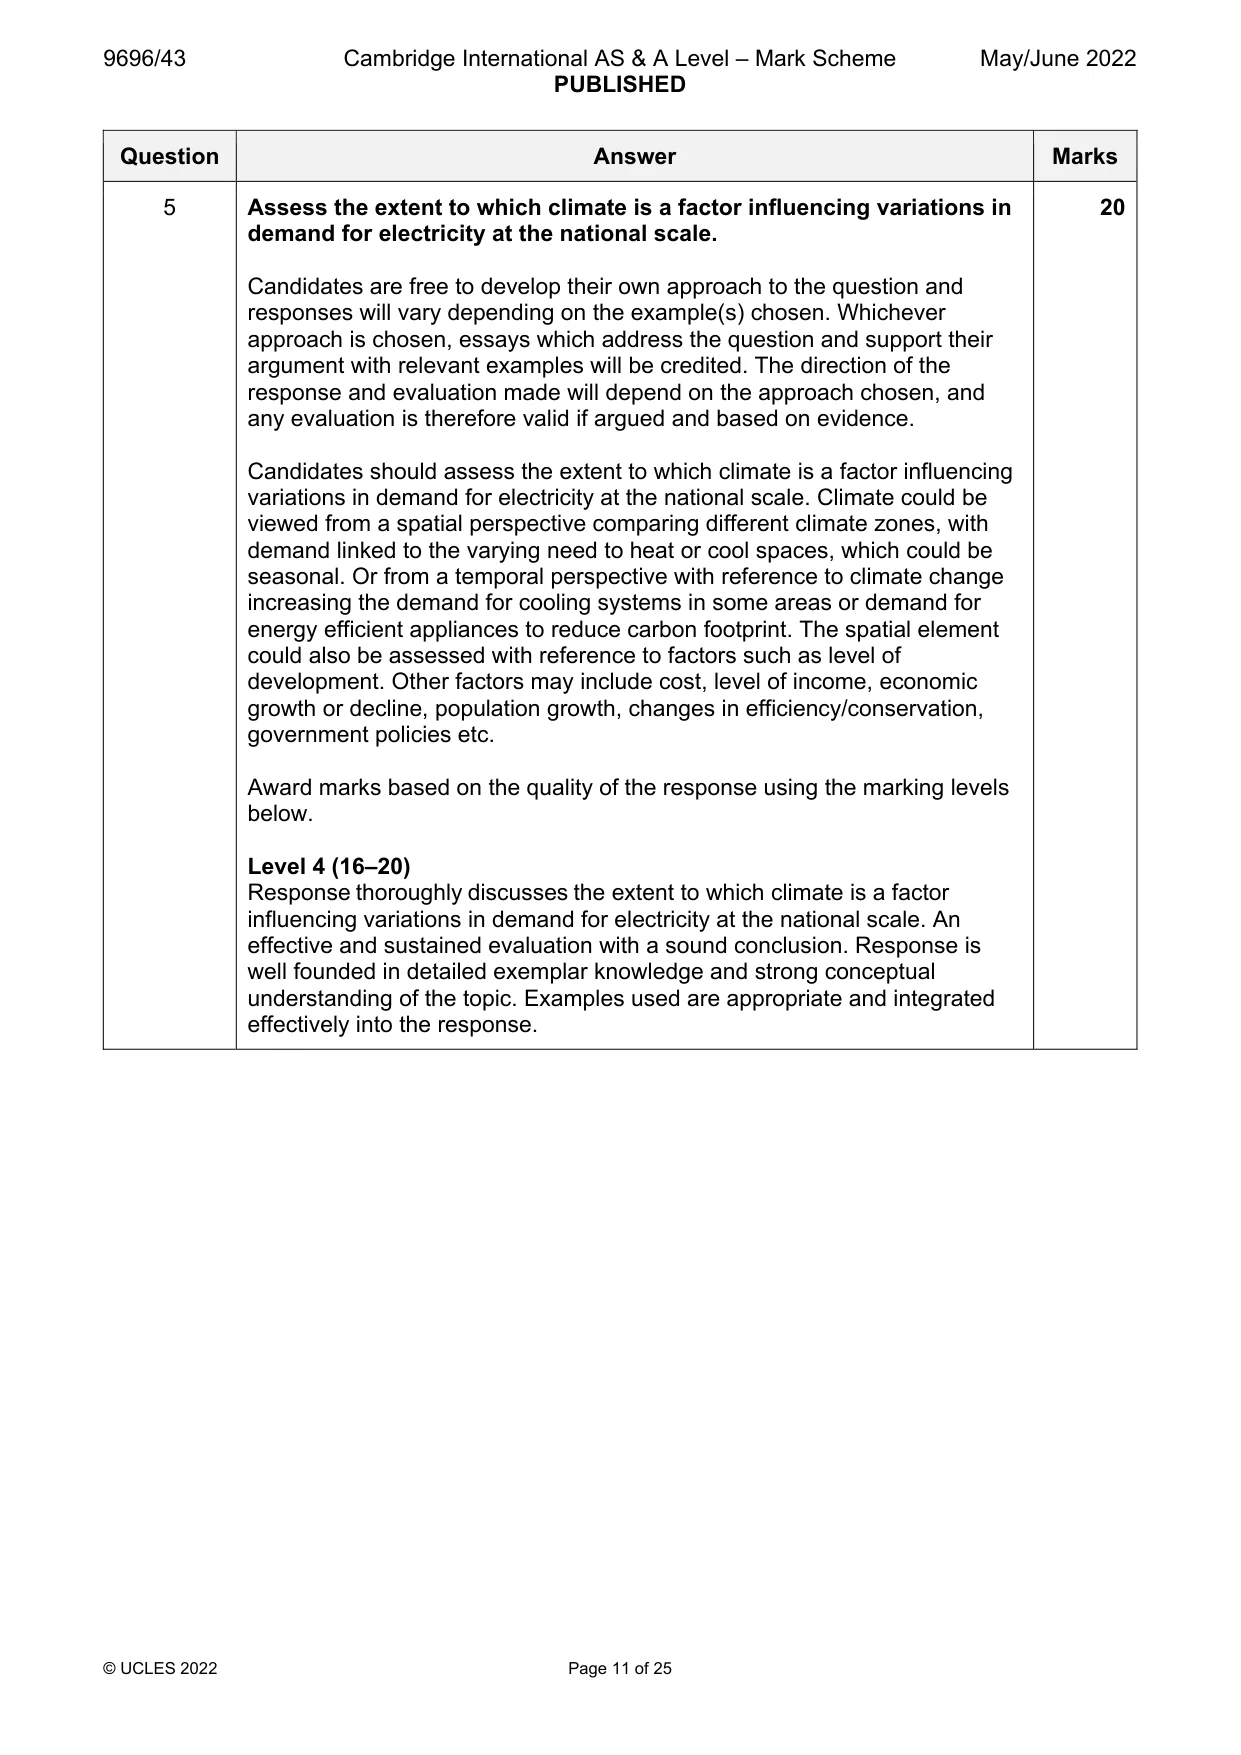
Mark scheme: 5 Assess the extent to which climate is a factor influencing variations in 20 demand for electricity at the national scale. Candidates are free to develop their own approach to the question and responses will vary depending on the example(s) chosen. Whichever approach is chosen, essays which address the question and support their argument with relevant examples will be credited. The direction of the response and evaluation made will depend on the approach chosen, and any evaluation is therefore valid if argued and based on evidence. Candidates should assess the extent to which climate is a factor influencing variations in demand for electricity at the national scale. Climate could be viewed from a spatial perspective comparing different climate zones, with demand linked to the varying need to heat or cool spaces, which could be seasonal. Or from a temporal perspective with reference to climate change increasing the demand for cooling systems in some areas or demand for energy efficient appliances to reduce carbon footprint. The spatial element could also be assessed with reference to factors such as level of development. Other factors may include cost, level of income, economic growth or decline, population growth, changes in efficiency/conservation, government policies etc. Award marks based on the quality of the response using the marking levels below. Level 4 (16–20) Response thoroughly discusses the extent to which climate is a factor influencing variations in demand for electricity at the national scale. An effective and sustained evaluation with a sound conclusion. Response is well founded in detailed exemplar knowledge and strong conceptual understanding of the topic. Examples used are appropriate and integrated effectively into the response. 5 Level 3 (11–15) Response discusses the extent to which climate is a factor influencing variations in demand for electricity at the national scale. Response is broadly evaluative in character, comprising some explanatory or narrative content and a conclusion. Response develops on a largely secure base of knowledge and understanding with the use of example(s). Level 2 (6–10) Response demonstrates some knowledge and understanding of the extent to which climate is a factor influencing variations in demand for electricity with limited reference to the national scale. Response is mainly descriptive or explanatory in approach and contains a brief or thinly supported evaluation. Responses without the use of example(s) to support the response will not get above the middle of Level 2 (8 marks). Level 1 (1–5) Response makes a few general points about climate or other factors influencing variations in demand or supply for electricity. A descriptive response comprising a few simple points. Knowledge is basic and understanding may be poor and lack relevance to the question set. Level 0 (0) No creditable response.
Q6 · ‘Removing the constraints is important for the success of attempts to improve the quality…
6 ‘Removing the constraints is important for the success of attempts to improve the quality of degraded environments.’ With reference to one or more examples, how far do you agree with this view? [20] Global interdependence If answering this option, answer Question 7 and either Question 8 or Question 9.
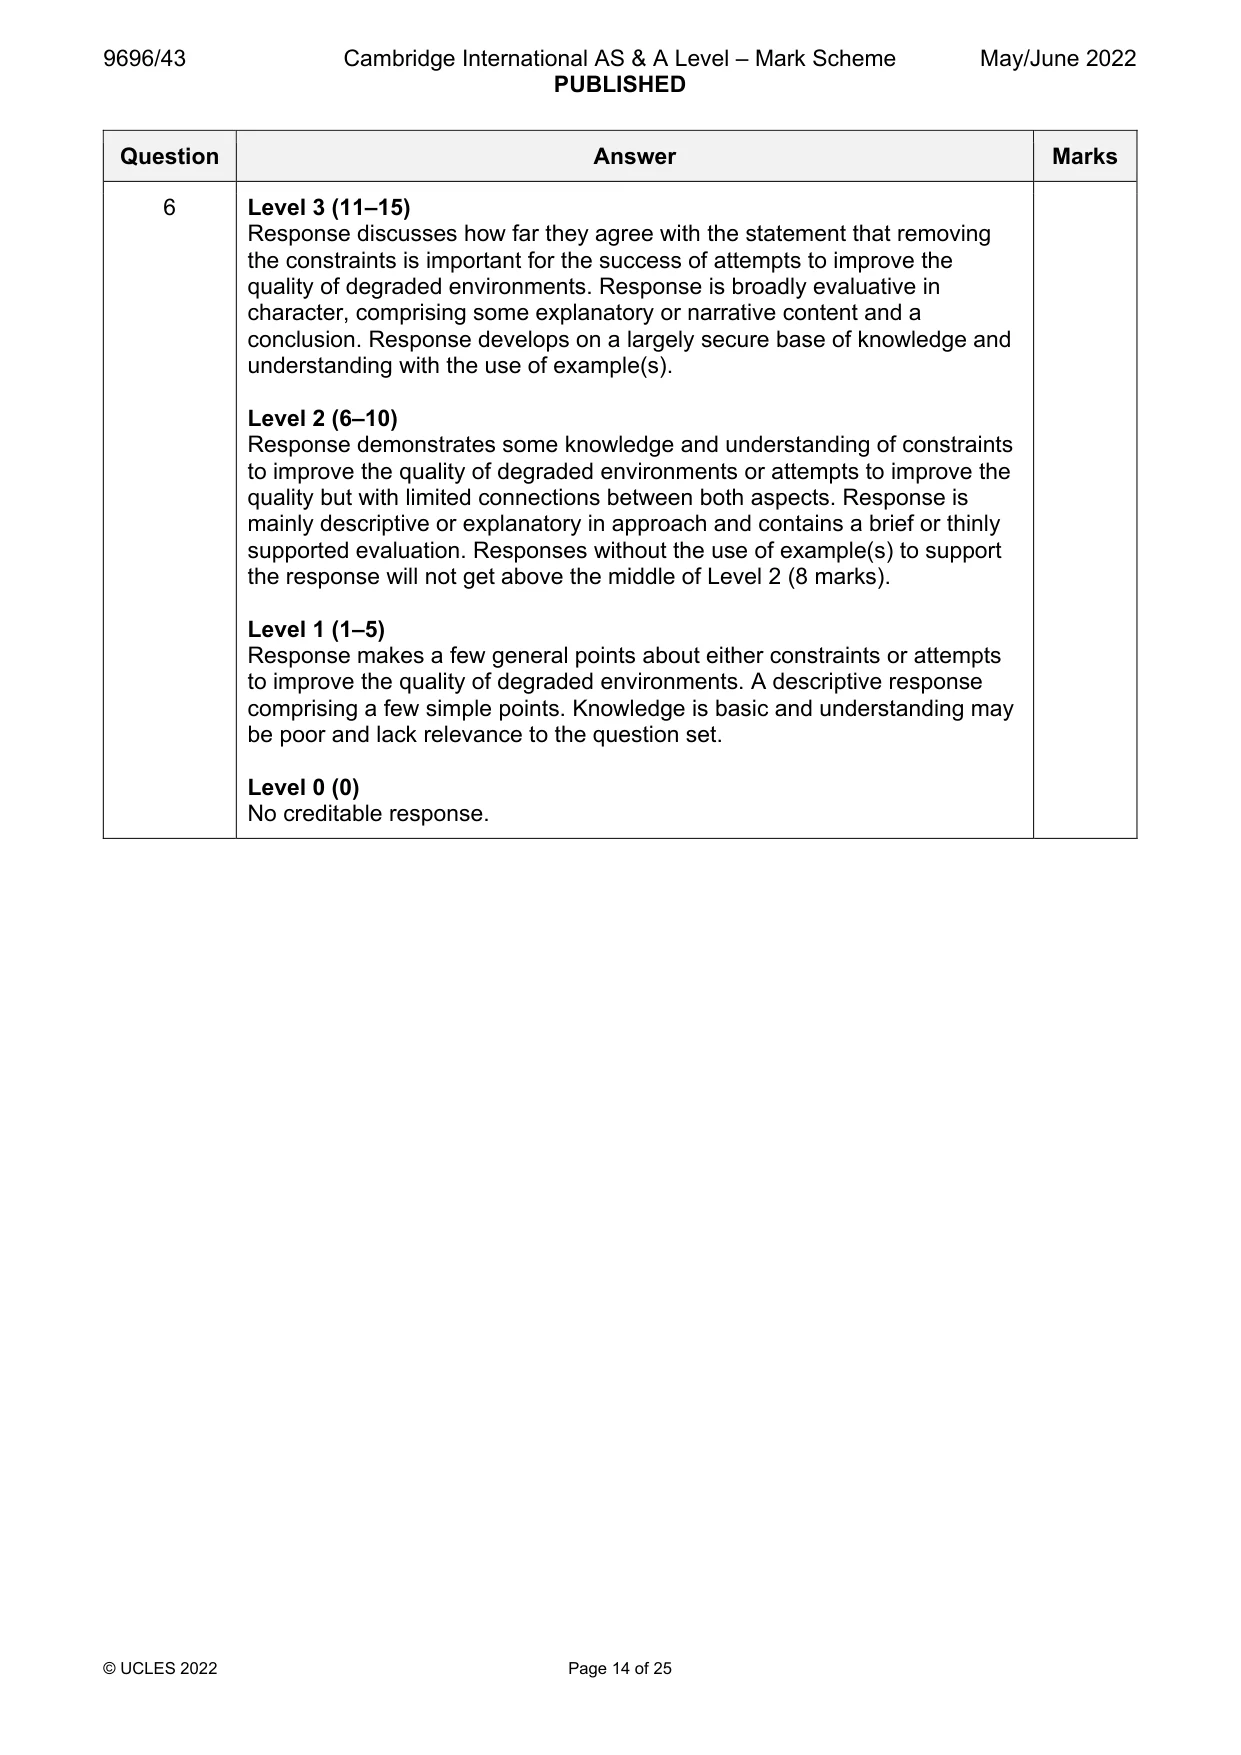
Mark scheme: 6 ‘Removing the constraints is important for the success of attempts to 20 improve the quality of degraded environments.’ With reference to one or more examples, how far do you agree with this view? Candidates are free to develop their own approach to the question and responses will vary depending on the example(s) chosen. Whichever approach is chosen, essays which address the question and support their argument with relevant examples will be credited. The direction of the response and evaluation made will depend on the approach chosen, and any evaluation is therefore valid if argued and based on evidence. Candidates should assess how far they agree with the statement that removing the constraints is important for the success of attempts to improve the quality of one or more examples of degraded environment(s). They should demonstrate an understanding of what the constraints are and how they are linked to the success of attempt(s). Constraints may be environmental e.g. soil fertility, economic e.g. cost, social e.g. other priorities or political e.g. lack of control and the constraints may work independently or as a group of interlinked factors. One or more attempts to improve the quality of the environment could be used. Some view of how successful the attempt(s) have been would help to develop the extent of agreement. It would be reasonable for a candidate to consider which constraints are most important. Award marks based on the quality of the response using the marking levels below. Level 4 (16–20) Response thoroughly discusses how far they agree with the statement that removing the constraints is important for the success of attempts to improve the quality of degraded environments. An effective and sustained evaluation with a sound conclusion. Response is well founded in detailed exemplar knowledge and strong conceptual understanding of the topic. Examples used are appropriate and integrated effectively into the response. 6 Level 3 (11–15) Response discusses how far they agree with the statement that removing the constraints is important for the success of attempts to improve the quality of degraded environments. Response is broadly evaluative in character, comprising some explanatory or narrative content and a conclusion. Response develops on a largely secure base of knowledge and understanding with the use of example(s). Level 2 (6–10) Response demonstrates some knowledge and understanding of constraints to improve the quality of degraded environments or attempts to improve the quality but with limited connections between both aspects. Response is mainly descriptive or explanatory in approach and contains a brief or thinly supported evaluation. Responses without the use of example(s) to support the response will not get above the middle of Level 2 (8 marks). Level 1 (1–5) Response makes a few general points about either constraints or attempts to improve the quality of degraded environments. A descriptive response comprising a few simple points. Knowledge is basic and understanding may be poor and lack relevance to the question set. Level 0 (0) No creditable response. Global interdependence If answering this option, answer Question 7 and either Question 8 or Question 9.
Q7 · Source and destination regions of international tourists to Europe and from Europe in 2016
7 Table 7.1 shows source and destination regions of international tourists to Europe and from Europe in 2016. (a) Compare the number of international tourists travelling to Europe and from Europe shown in Table 7.1. [4] (b) Explain two disadvantages of tourism for local environments. [6]
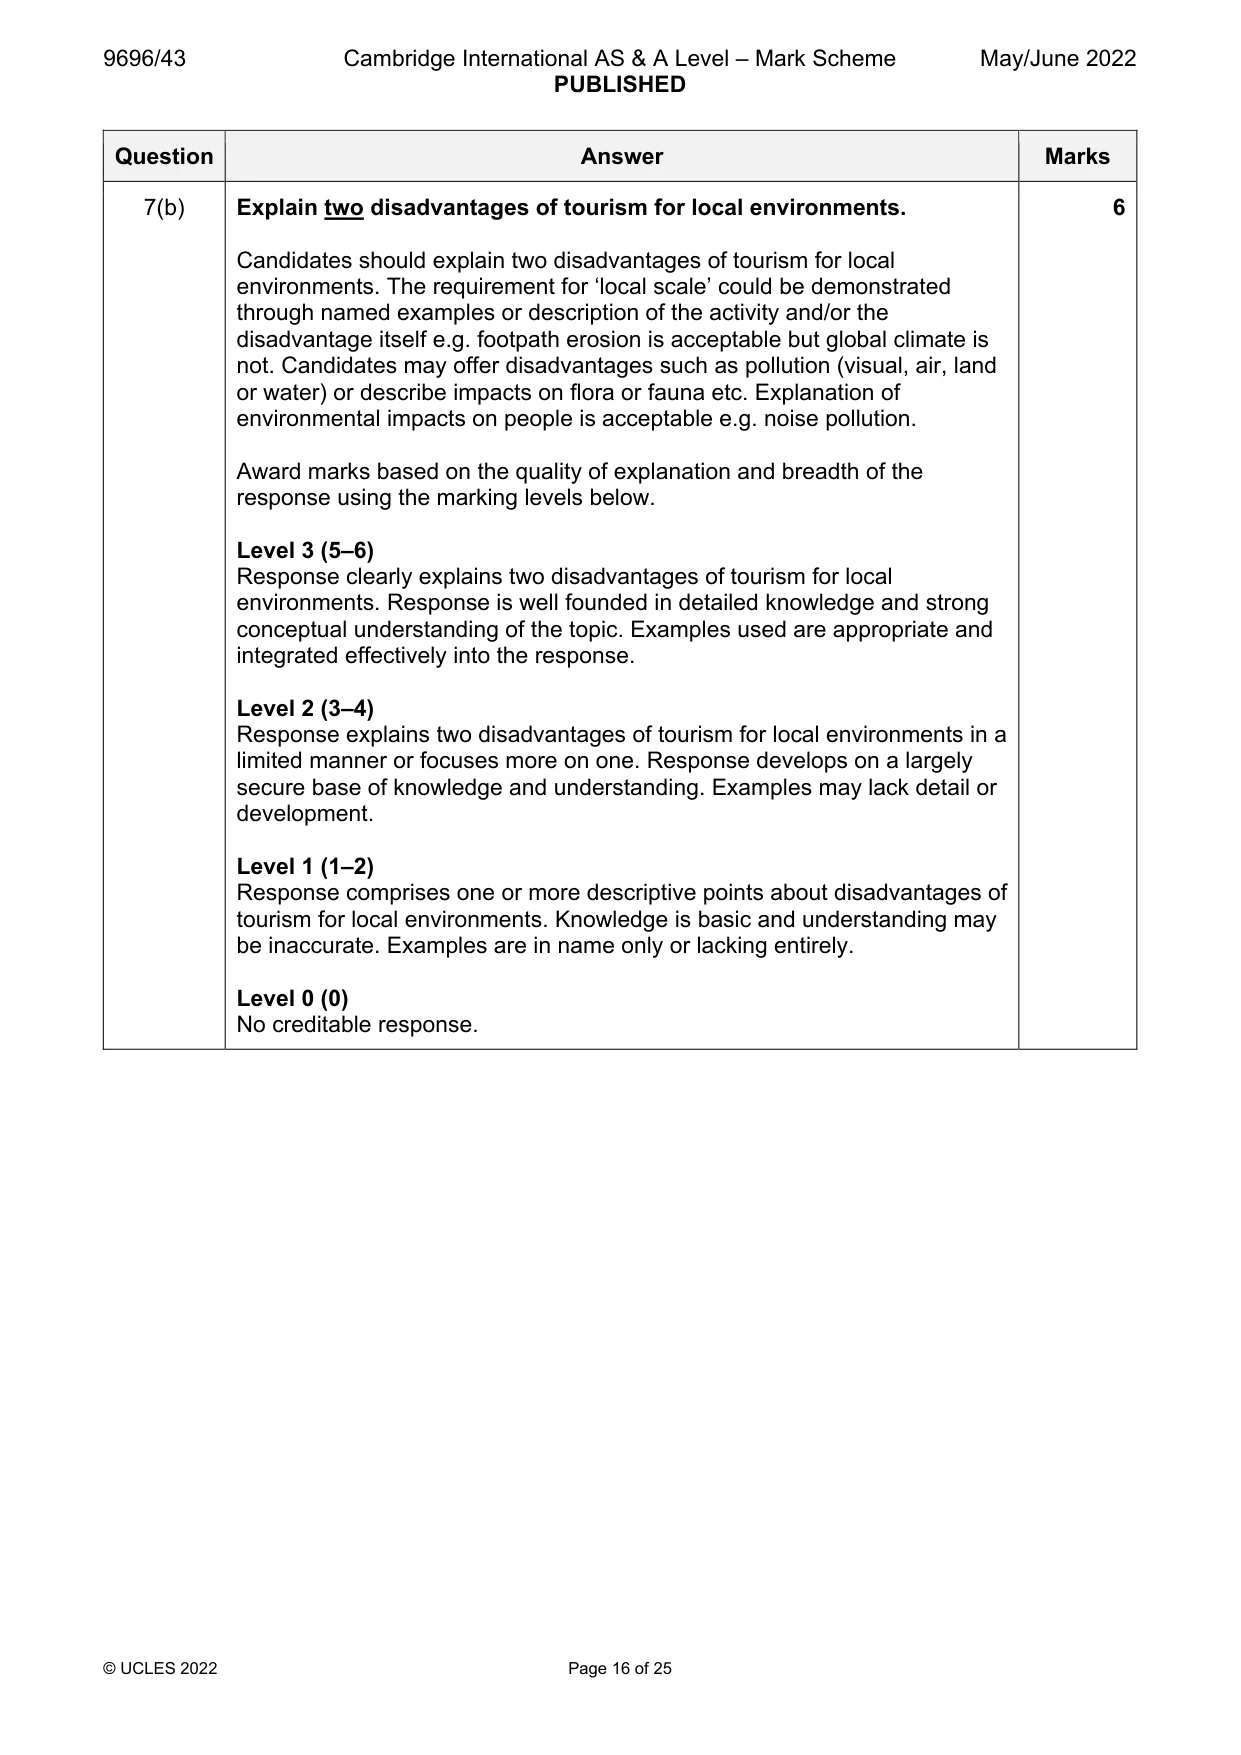
Mark scheme: 7(a) Table 7.1 shows source and destination regions of international 4 tourists to Europe and from Europe in 2016. Compare the number of international tourists travelling to Europe and from Europe shown in Table 7.1. Candidates could compare the source and destination regions in the following way: Europe receives the same number of tourists as leave 97 million Comparison within column e.g. highest to Europe is North and South America 43 million whereas lowest is Africa and Middle East with 7 million (1) The balance is positive with 11 million North and South America and 6 million Asia Pacific but negative with 12 million Africa and 5 million Middle East. Tourist destinations from Europe are more evenly represented/spread (range 12–34) than sources to Europe (7–43) The two highest numbers for both source and destination are for North and South America and Asia Pacific (1) but the order is reversed in the case of the two highest (1) Other valid comparisons Accept variations within columns for 2 marks and variations between columns (rows) for 2 marks. Maximum 2 marks for comparisons of highest and lowest. Award 1 mark for data support such as the values quoted. 7(b) Explain two disadvantages of tourism for local environments. 6 Candidates should explain two disadvantages of tourism for local environments. The requirement for ‘local scale’ could be demonstrated through named examples or description of the activity and/or the disadvantage itself e.g. footpath erosion is acceptable but global climate is not. Candidates may offer disadvantages such as pollution (visual, air, land or water) or describe impacts on flora or fauna etc. Explanation of environmental impacts on people is acceptable e.g. noise pollution. Award marks based on the quality of explanation and breadth of the response using the marking levels below. Level 3 (5–6) Response clearly explains two disadvantages of tourism for local environments. Response is well founded in detailed knowledge and strong conceptual understanding of the topic. Examples used are appropriate and integrated effectively into the response. Level 2 (3–4) Response explains two disadvantages of tourism for local environments in a limited manner or focuses more on one. Response develops on a largely secure base of knowledge and understanding. Examples may lack detail or development. Level 1 (1–2) Response comprises one or more descriptive points about disadvantages of tourism for local environments. Knowledge is basic and understanding may be inaccurate. Examples are in name only or lacking entirely. Level 0 (0) No creditable response.
Q8 · ‘All global trade should follow the principles of Fairtrade.’ How far do you agree with…
8 ‘All global trade should follow the principles of Fairtrade.’ How far do you agree with this statement? [20]
Mark scheme: 8 ‘All global trade should follow the principles of Fairtrade.’ How far do 20 you agree with this statement? Candidates are free to develop their own approach to the question and responses will vary depending on the example(s) chosen. Whichever approach is chosen, essays which address the question and support their argument with relevant examples will be credited. The direction of the response and evaluation made will depend on the approach chosen, and any evaluation is therefore valid if argued and based on evidence. Candidates should assess how far they agree that all global trade should follow the principles of Fairtrade. Global trade is the import and export of goods and services across international boundaries. Candidates may consider this as a broad view of global trade but may also consider global patterns of trade and inequalities in trade flows. A sound response, from mid-Level 3 upwards should demonstrate knowledge and understanding of the principles of Fairtrade, the factors which influence global trade and argue clearly how far they agree with the statement. The principles of Fairtrade include better prices for producers, decent working conditions for employees, social, economic and environmental sustainability. These principles are founded on democratic processes between producers, workers, buyers, consumers and campaigners. Fairtrade seeks to alter market processes in trade. Candidates are not expected to consider all of these principles and/or the more detailed principles of the Fairtrade movement. The syllabus, 13.1, refers to a range of factors affecting global trade such as: resource endowment, locational advantage, historical factors, trade agreements, and changes in the global market. The role of the World Trade Organization (WTO) and free trade. The nature and role of Fairtrade. Award marks based on the quality of the response using the marking levels below. Level 4 (16–20) Response thoroughly discusses how far they agree with the statement all global trade should follow the principles of Fairtrade. An effective and sustained evaluation with a sound conclusion. Response is well founded in detailed exemplar knowledge and strong conceptual understanding of the topic. Examples used are appropriate and integrated effectively into the response. 8 Level 3 (11–15) Response discusses how far they agree with the statement all global trade should follow the principles of Fairtrade. Response is broadly evaluative in character, comprising some explanatory or narrative content and a conclusion. Response develops on a largely secure base of knowledge and understanding with the use of example(s). Level 2 (6–10) Response demonstrates some knowledge and understanding of global trade and the principles of Fairtrade. Response is mainly descriptive or explanatory in approach and contains a brief or thinly supported evaluation. Responses without the use of example(s) to support the response will not get above the middle of Level 2 (8 marks). Level 1 (1–5) Response makes a few general points about global trade or the principles of Fairtrade. A descriptive response comprising a few simple points. Knowledge is basic and understanding may be poor and lack relevance to the question set. Level 0 (0) No creditable response.
Q9 · ‘Economic sustainability is the most important issue for the management of a tourist…
9 ‘Economic sustainability is the most important issue for the management of a tourist destination.’ With reference to one or more examples, how far do you agree? [20] Economic transition If answering this option, answer Question 10 and either Question 11 or Question 12.
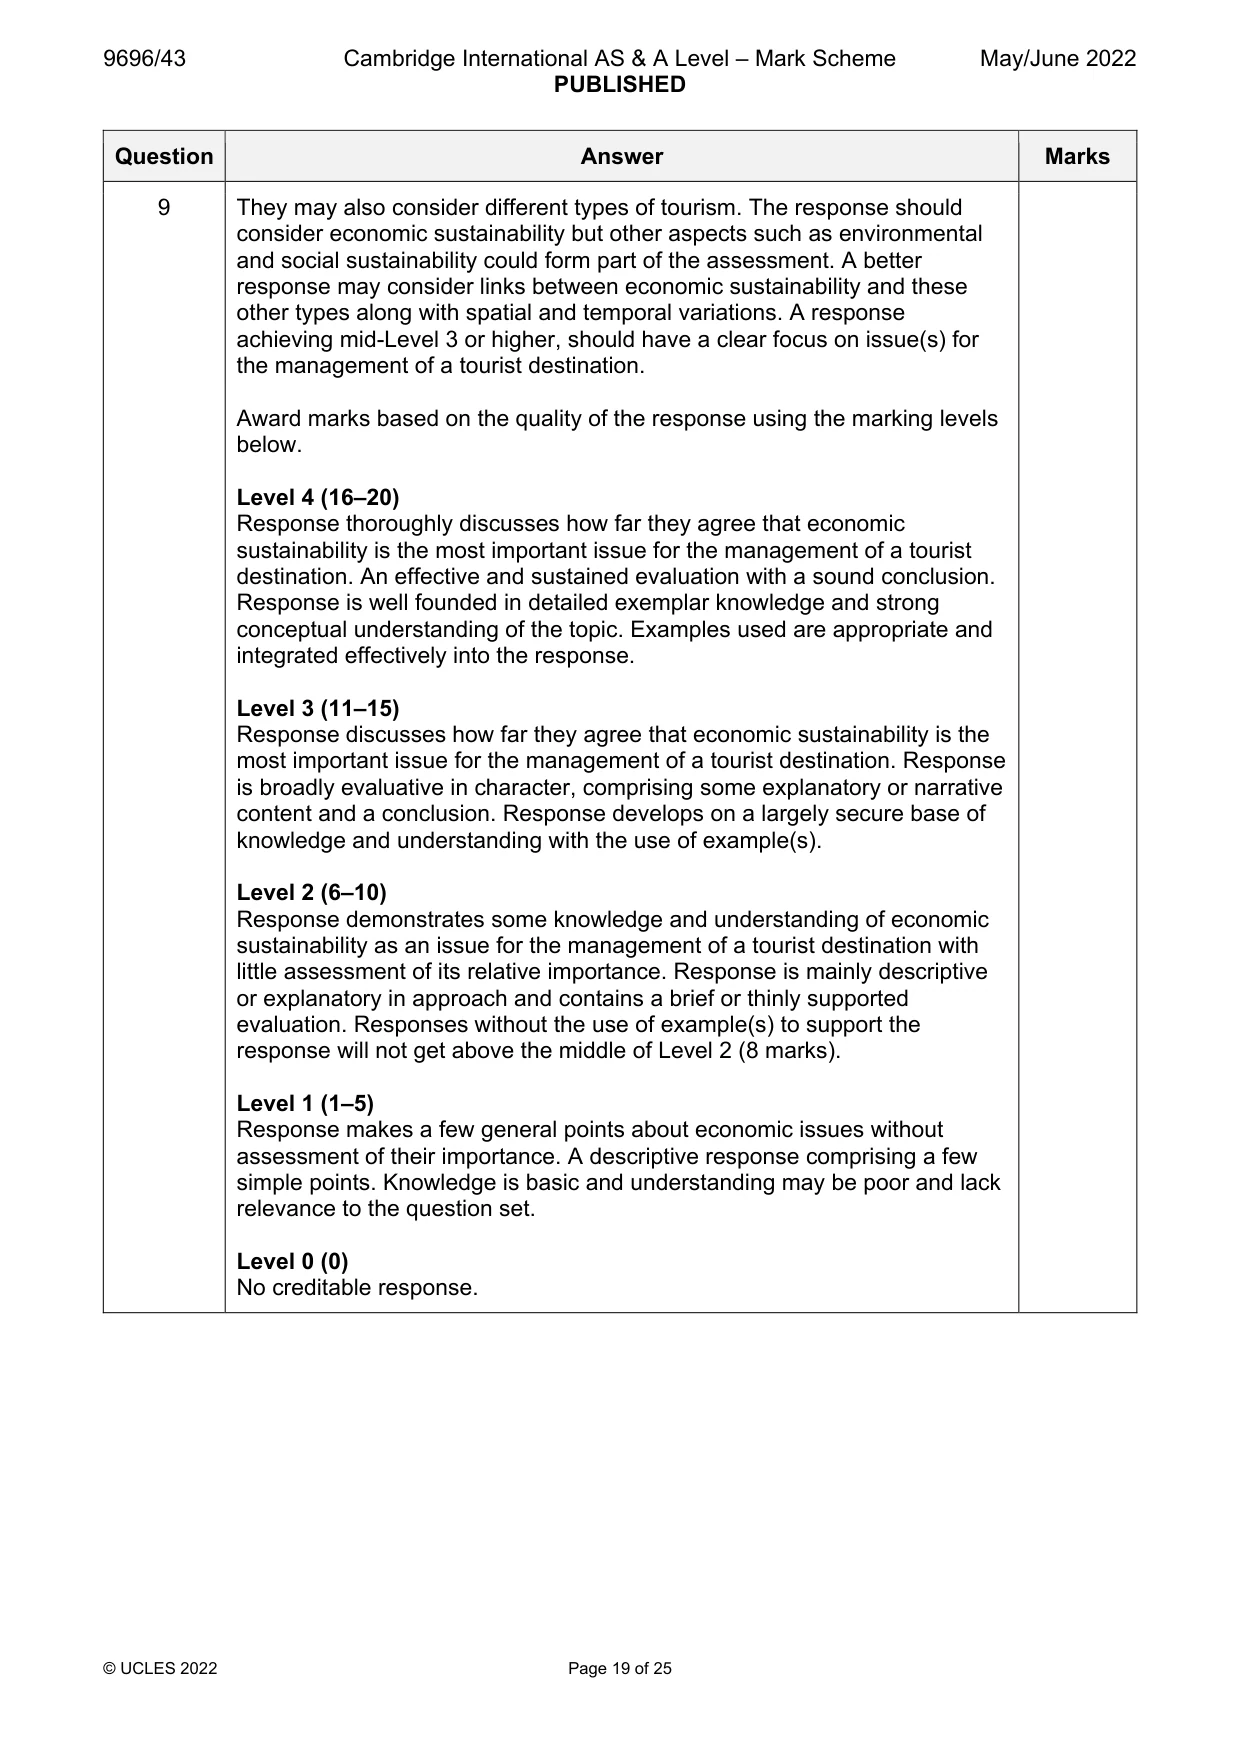
Mark scheme: 9 ‘Economic sustainability is the most important issue for the 20 management of a tourist destination.’ With reference to one or more examples, how far do you agree? Candidates are free to develop their own approach to the question and responses will vary depending on the example(s) chosen. Whichever approach is chosen, essays which address the question and support their argument with relevant examples will be credited. The direction of the response and evaluation made will depend on the approach chosen, and any evaluation is therefore valid if argued and based on evidence. Candidates should use example(s) to assess how far they agree with the statement that economic sustainability is the most important issue for the management of a tourist destination. Examples could be taken from the case study of one tourist area or resort and/or from a variety of locations. 9 They may also consider different types of tourism. The response should consider economic sustainability but other aspects such as environmental and social sustainability could form part of the assessment. A better response may consider links between economic sustainability and these other types along with spatial and temporal variations. A response achieving mid-Level 3 or higher, should have a clear focus on issue(s) for the management of a tourist destination. Award marks based on the quality of the response using the marking levels below. Level 4 (16–20) Response thoroughly discusses how far they agree that economic sustainability is the most important issue for the management of a tourist destination. An effective and sustained evaluation with a sound conclusion. Response is well founded in detailed exemplar knowledge and strong conceptual understanding of the topic. Examples used are appropriate and integrated effectively into the response. Level 3 (11–15) Response discusses how far they agree that economic sustainability is the most important issue for the management of a tourist destination. Response is broadly evaluative in character, comprising some explanatory or narrative content and a conclusion. Response develops on a largely secure base of knowledge and understanding with the use of example(s). Level 2 (6–10) Response demonstrates some knowledge and understanding of economic sustainability as an issue for the management of a tourist destination with little assessment of its relative importance. Response is mainly descriptive or explanatory in approach and contains a brief or thinly supported evaluation. Responses without the use of example(s) to support the response will not get above the middle of Level 2 (8 marks). Level 1 (1–5) Response makes a few general points about economic issues without assessment of their importance. A descriptive response comprising a few simple points. Knowledge is basic and understanding may be poor and lack relevance to the question set. Level 0 (0) No creditable response. Economic transition If answering this option, answer Question 10 and either Question 11 or Question 12.
Q10 · The distribution of world GDP in 2008, 2013 and 2018
10 Fig. 10.1 shows the distribution of world GDP in 2008, 2013 and 2018. (a) Describe the changes from 2008 to 2018 shown in Fig. 10.1. [4] (b) Explain the advantages of using social indices to measure inequality. [6]
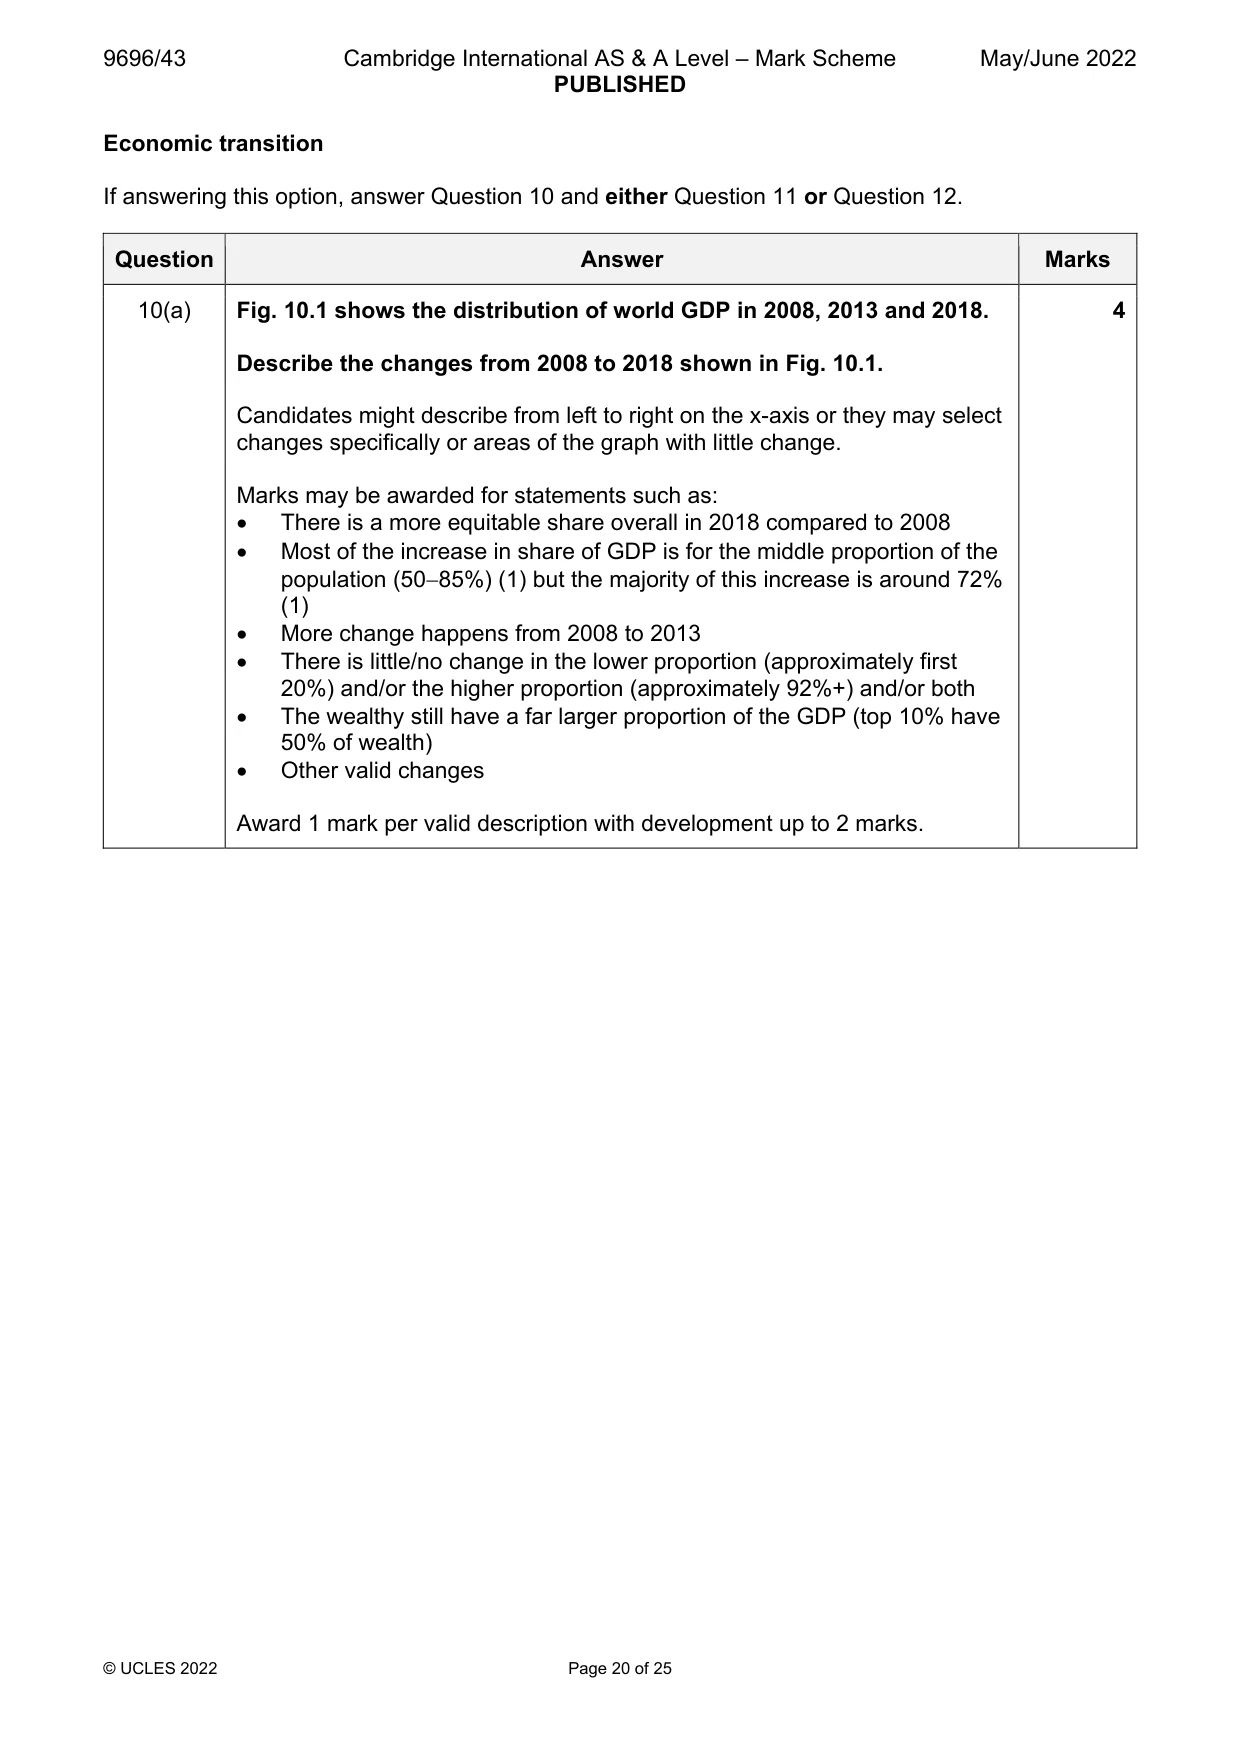
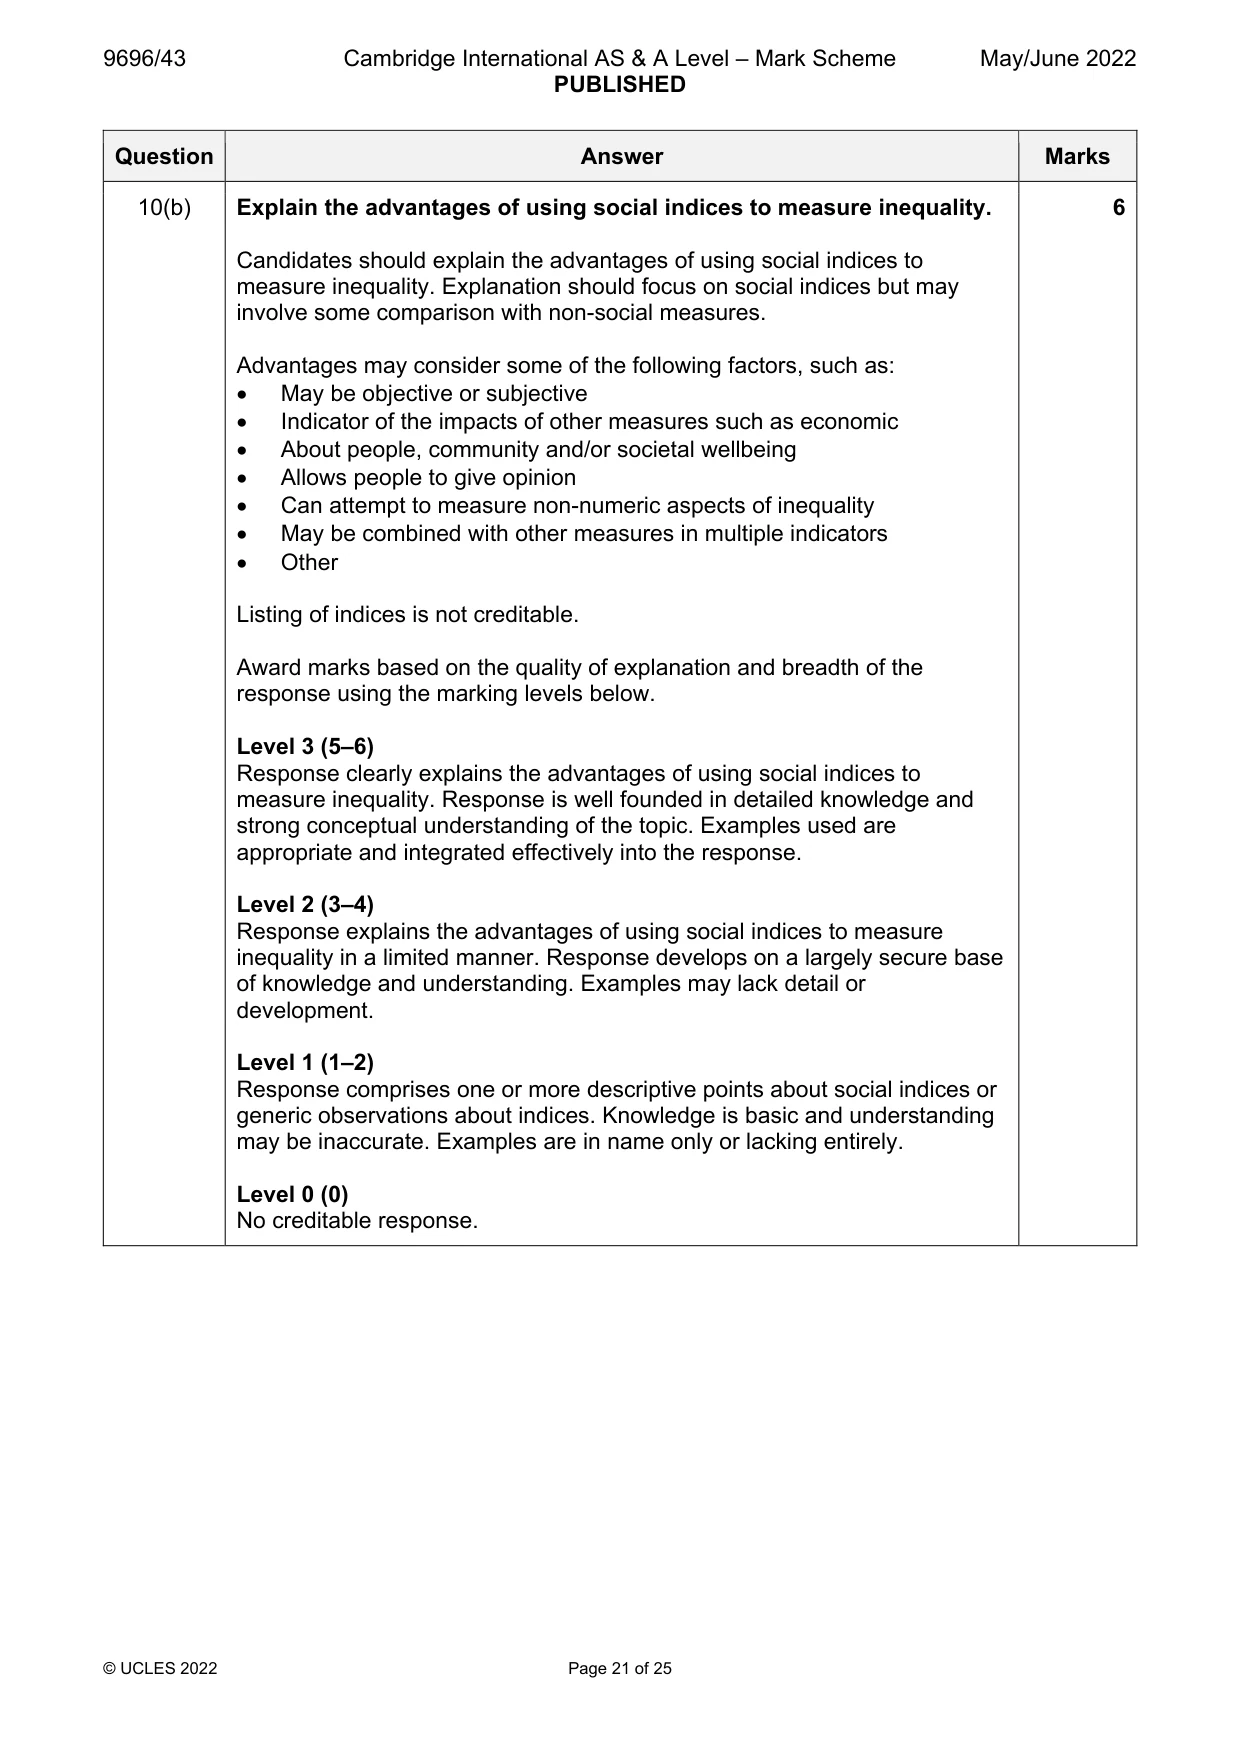
Mark scheme: 10(a) Fig. 10.1 shows the distribution of world GDP in 2008, 2013 and 2018. 4 Describe the changes from 2008 to 2018 shown in Fig. 10.1. Candidates might describe from left to right on the x-axis or they may select changes specifically or areas of the graph with little change. Marks may be awarded for statements such as: There is a more equitable share overall in 2018 compared to 2008 Most of the increase in share of GDP is for the middle proportion of the population (5085%) (1) but the majority of this increase is around 72% (1) More change happens from 2008 to 2013 There is little/no change in the lower proportion (approximately first 20%) and/or the higher proportion (approximately 92%+) and/or both The wealthy still have a far larger proportion of the GDP (top 10% have 50% of wealth) Other valid changes Award 1 mark per valid description with development up to 2 marks. 10(b) Explain the advantages of using social indices to measure inequality. 6 Candidates should explain the advantages of using social indices to measure inequality. Explanation should focus on social indices but may involve some comparison with non-social measures. Advantages may consider some of the following factors, such as: May be objective or subjective Indicator of the impacts of other measures such as economic About people, community and/or societal wellbeing Allows people to give opinion Can attempt to measure non-numeric aspects of inequality May be combined with other measures in multiple indicators Other Listing of indices is not creditable. Award marks based on the quality of explanation and breadth of the response using the marking levels below. Level 3 (5–6) Response clearly explains the advantages of using social indices to measure inequality. Response is well founded in detailed knowledge and strong conceptual understanding of the topic. Examples used are appropriate and integrated effectively into the response. Level 2 (3–4) Response explains the advantages of using social indices to measure inequality in a limited manner. Response develops on a largely secure base of knowledge and understanding. Examples may lack detail or development. Level 1 (1–2) Response comprises one or more descriptive points about social indices or generic observations about indices. Knowledge is basic and understanding may be inaccurate. Examples are in name only or lacking entirely. Level 0 (0) No creditable response.
Q11 · Assess the importance of economic factors in the emergence and growth of newly…
11 Assess the importance of economic factors in the emergence and growth of newly industrialised countries (NICs). [20]
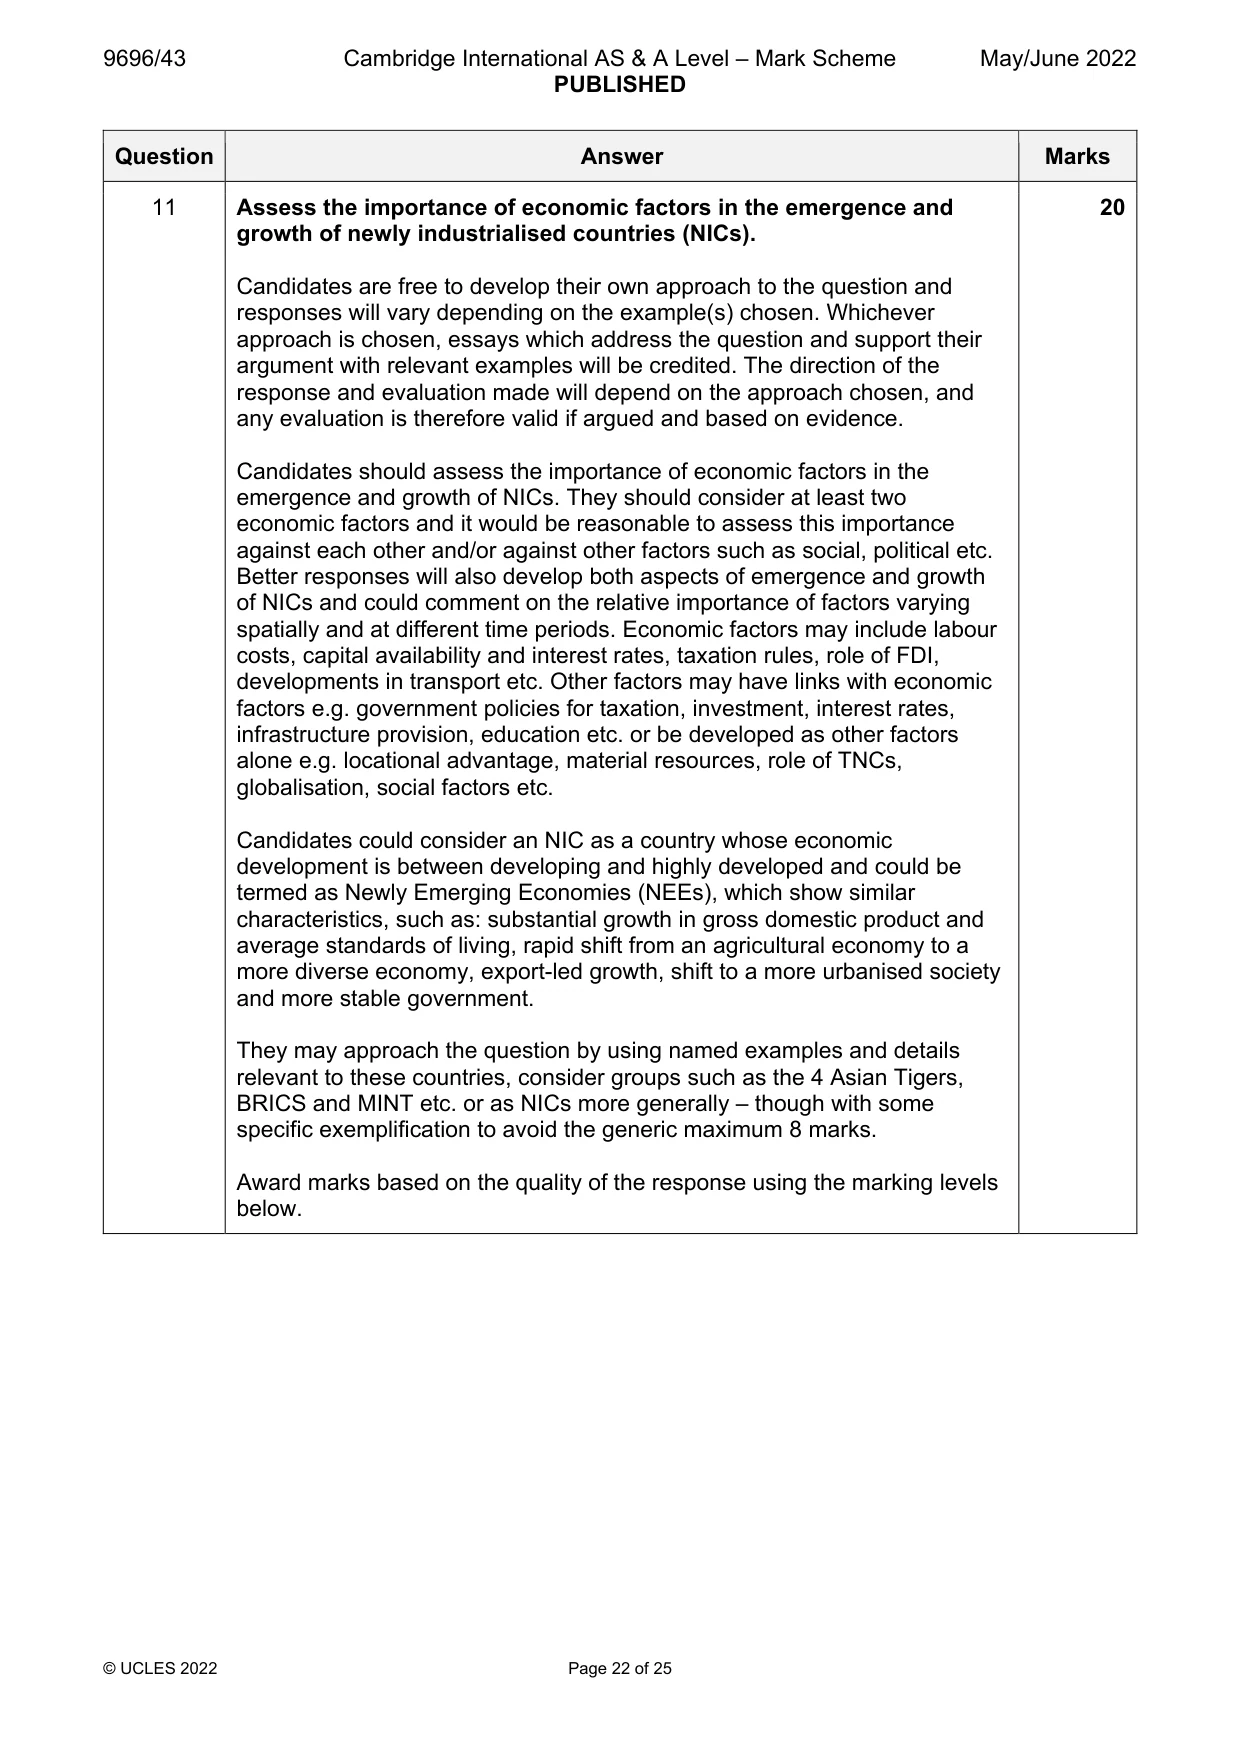
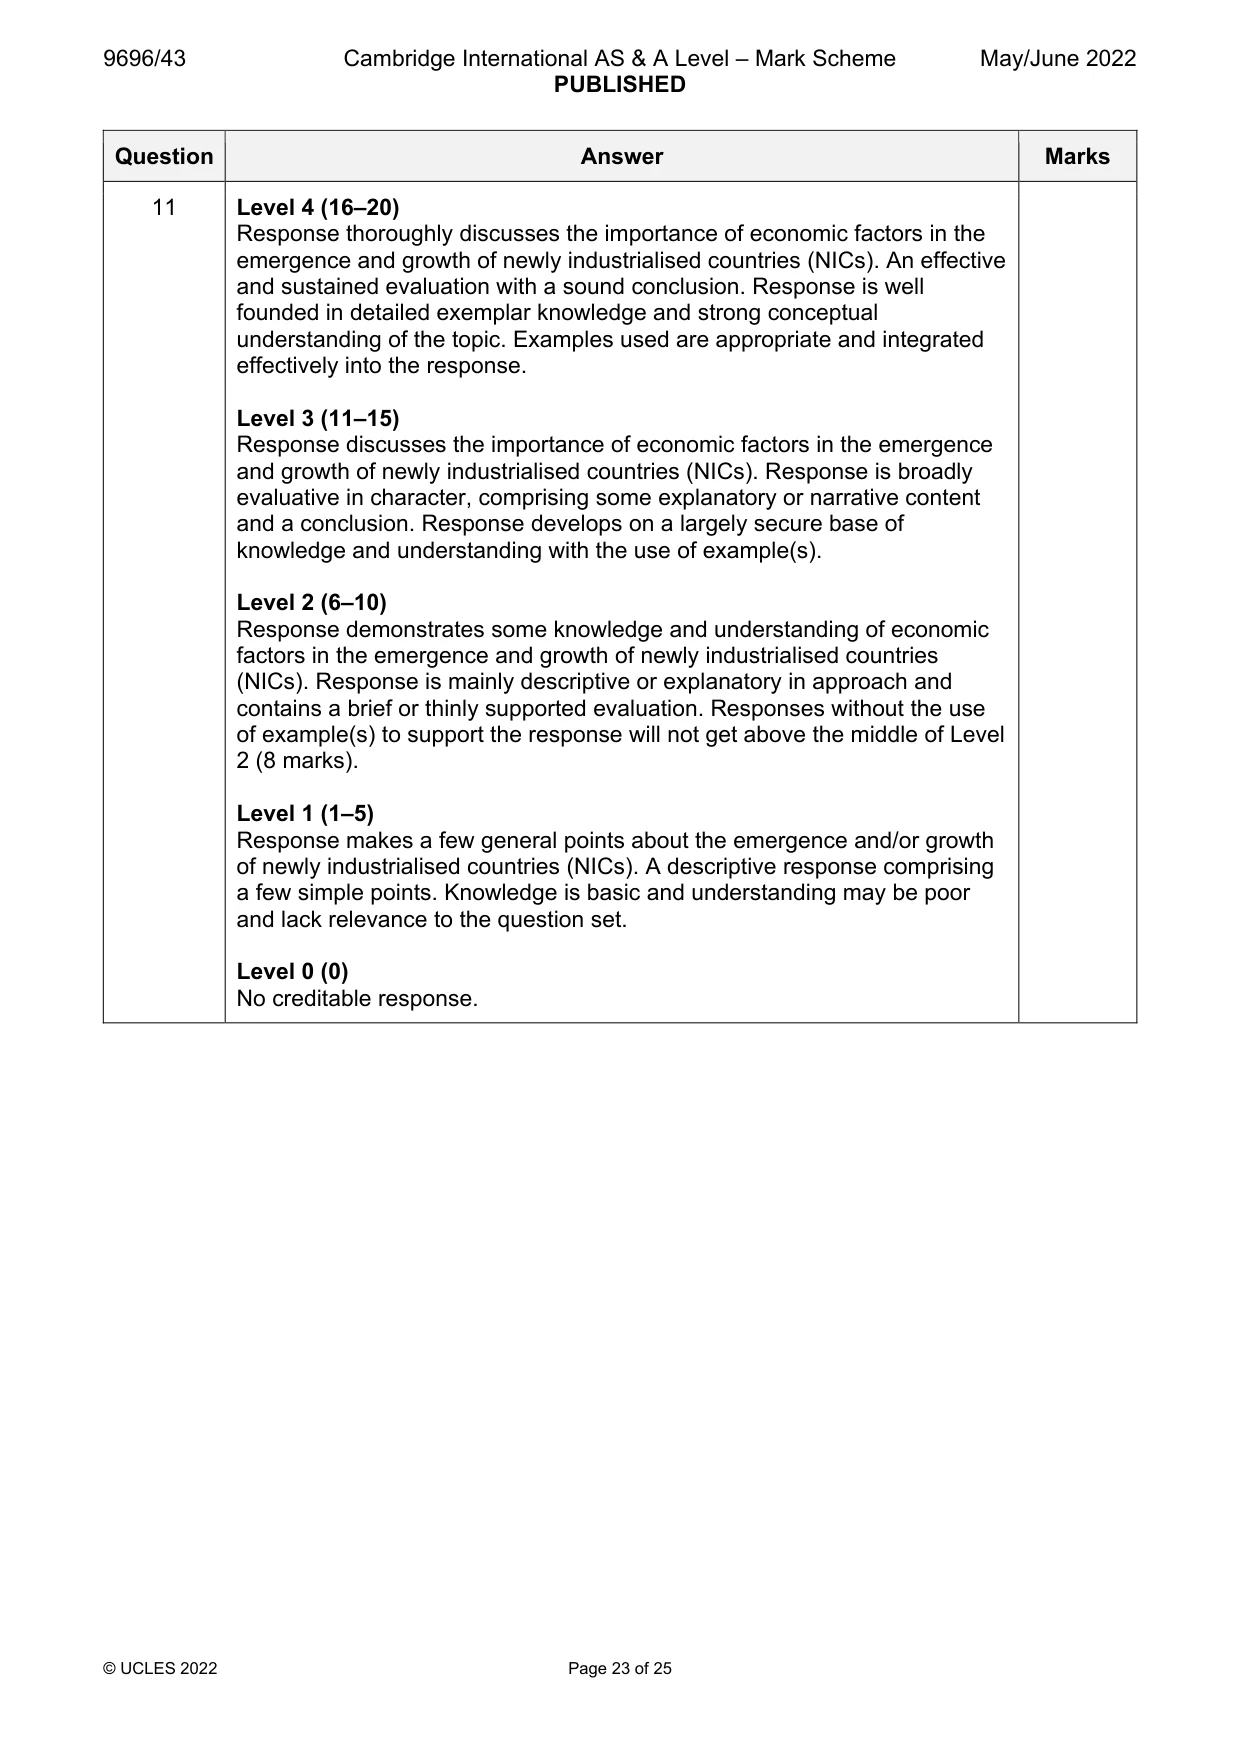
Mark scheme: 11 Assess the importance of economic factors in the emergence and 20 growth of newly industrialised countries (NICs). Candidates are free to develop their own approach to the question and responses will vary depending on the example(s) chosen. Whichever approach is chosen, essays which address the question and support their argument with relevant examples will be credited. The direction of the response and evaluation made will depend on the approach chosen, and any evaluation is therefore valid if argued and based on evidence. Candidates should assess the importance of economic factors in the emergence and growth of NICs. They should consider at least two economic factors and it would be reasonable to assess this importance against each other and/or against other factors such as social, political etc. Better responses will also develop both aspects of emergence and growth of NICs and could comment on the relative importance of factors varying spatially and at different time periods. Economic factors may include labour costs, capital availability and interest rates, taxation rules, role of FDI, developments in transport etc. Other factors may have links with economic factors e.g. government policies for taxation, investment, interest rates, infrastructure provision, education etc. or be developed as other factors alone e.g. locational advantage, material resources, role of TNCs, globalisation, social factors etc. Candidates could consider an NIC as a country whose economic development is between developing and highly developed and could be termed as Newly Emerging Economies (NEEs), which show similar characteristics, such as: substantial growth in gross domestic product and average standards of living, rapid shift from an agricultural economy to a more diverse economy, export-led growth, shift to a more urbanised society and more stable government. They may approach the question by using named examples and details relevant to these countries, consider groups such as the 4 Asian Tigers, BRICS and MINT etc. or as NICs more generally – though with some specific exemplification to avoid the generic maximum 8 marks. Award marks based on the quality of the response using the marking levels below. 11 Level 4 (16–20) Response thoroughly discusses the importance of economic factors in the emergence and growth of newly industrialised countries (NICs). An effective and sustained evaluation with a sound conclusion. Response is well founded in detailed exemplar knowledge and strong conceptual understanding of the topic. Examples used are appropriate and integrated effectively into the response. Level 3 (11–15) Response discusses the importance of economic factors in the emergence and growth of newly industrialised countries (NICs). Response is broadly evaluative in character, comprising some explanatory or narrative content and a conclusion. Response develops on a largely secure base of knowledge and understanding with the use of example(s). Level 2 (6–10) Response demonstrates some knowledge and understanding of economic factors in the emergence and growth of newly industrialised countries (NICs). Response is mainly descriptive or explanatory in approach and contains a brief or thinly supported evaluation. Responses without the use of example(s) to support the response will not get above the middle of Level 2 (8 marks). Level 1 (1–5) Response makes a few general points about the emergence and/or growth of newly industrialised countries (NICs). A descriptive response comprising a few simple points. Knowledge is basic and understanding may be poor and lack relevance to the question set. Level 0 (0) No creditable response.
What was in this paper
The subtopics covered by these 11 questions, and how many questions each got. Open one in a new tab to see every Cambridge question on it.
2The management of a tourist destination2National development1Sustainable energy supplies1The management of a degraded environment1The management of agricultural change1The management of change in manufacturing industry1The management of energy supply1Trade flows and trading patterns1What you needed in this session
Cambridge’s own grade thresholds for 2022 May/June, Paper 4 · Variant 3. A higher threshold means an easier paper — the bar moves with how the cohort did.