Cambridge A Level Geography 9696 — 2022 Oct/Nov Paper 4 · Variant 3
9696/43/O/N/22 · 60 marks · ≈68 min
The question paper and its mark scheme, free to read here and free to download. This is Cambridge’s own paper, exactly as it was sat.
Question paper4 pages


Mark scheme27 pages
Answers below. Sit the paper first if you are practising.











Paper as text
Question paper, page 1
Cambridge International AS & A Level 9696/43 October/November 2022 1 hour 30 minutes GEOGRAPHY Paper 4 Advanced Human Geography Options You must answer on the enclosed answer booklet. You will need: Answer booklet (enclosed) Insert (enclosed) INSTRUCTIONS • Answer four questions in total: Answer questions from two options. For each option, follow the instructions inside on which questions to answer. • Follow the instructions on the front cover of the answer booklet. If you need additional answer paper, ask the invigilator for a continuation booklet. • Sketch maps and diagrams should be drawn whenever they serve to illustrate an answer. • You should make reference to appropriate examples studied in the field or the classroom, even where such examples are not specifically requested by the question. INFORMATION • The total mark for this paper is 60. • The number of marks for each question or part question is shown in brackets [ ]. • The insert contains all the resources referred to in the questions. LICs = low income countries. MICs = middle income countries. HICs = high income countries. This document has 4 pages. Any blank pages are indicated. [Turn over 11_9696_43_2022_1.4 © UCLES 2022 *0916462052*
Question paper, page 2
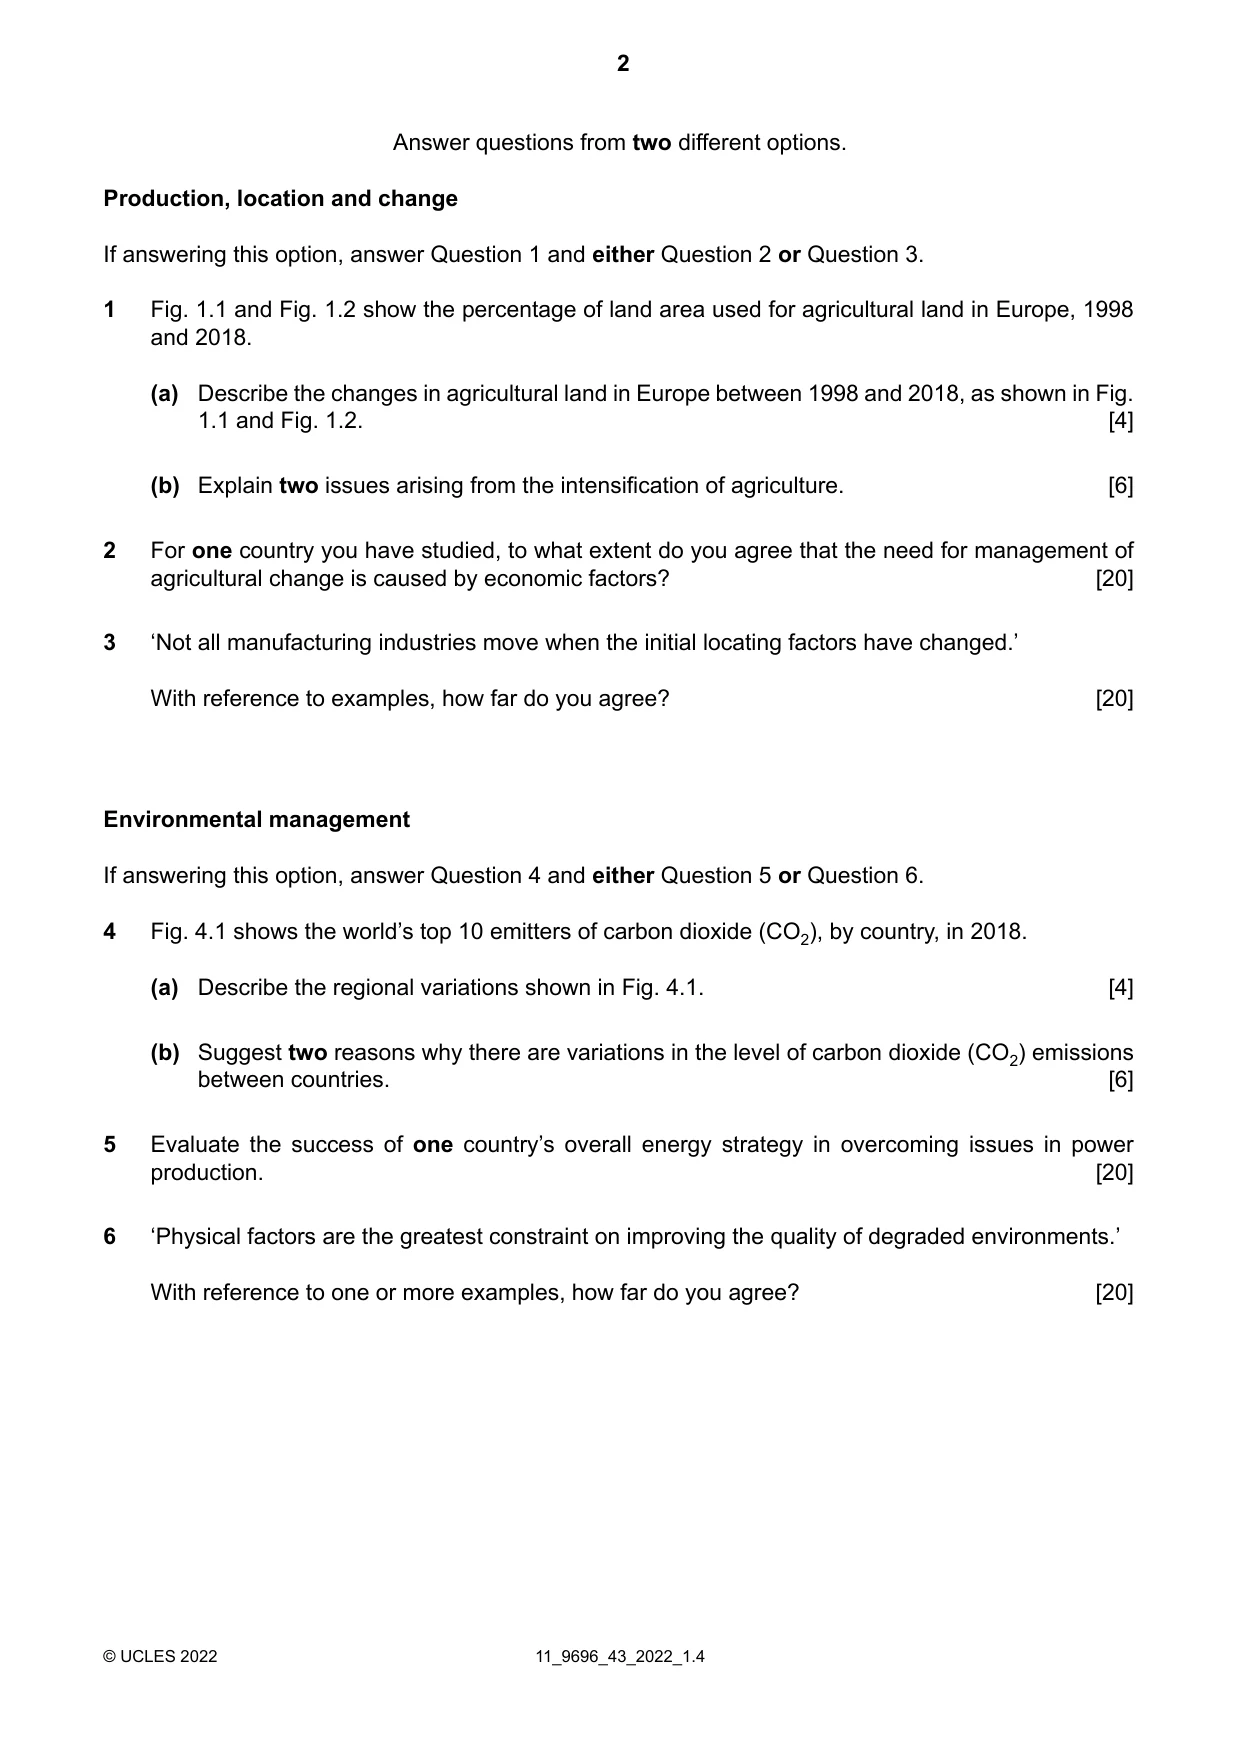
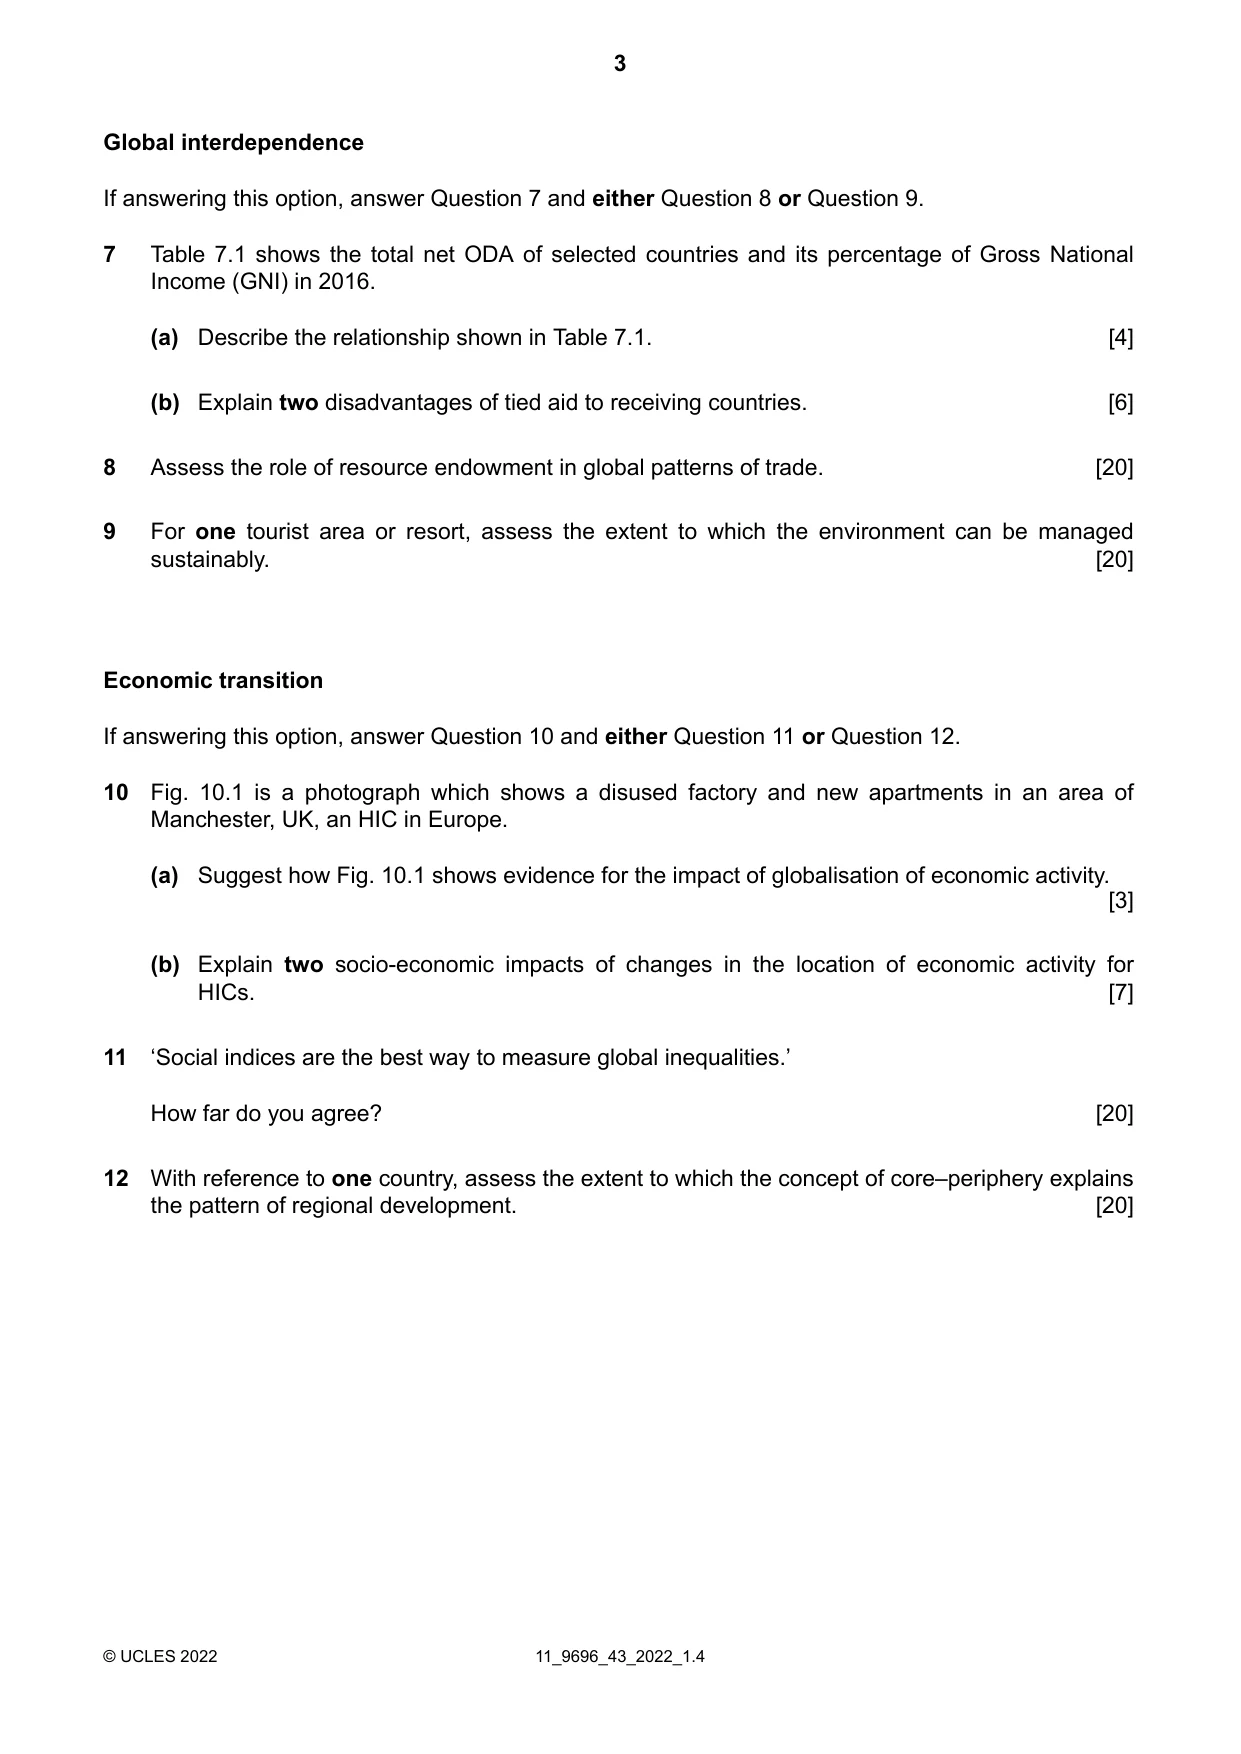
Answer questions from two different options. Production, location and change If answering this option, answer Question 1 and either Question 2 or Question 3. Fig. 1.1 and Fig. 1.2 show the percentage of land area used for agricultural land in Europe, 1998 and 2018. 1 Describe the changes in agricultural land in Europe between 1998 and 2018, as shown in Fig. 1.1 and Fig. 1.2. [4] (a) Explain two issues arising from the intensification of agriculture. [6] (b) For one country you have studied, to what extent do you agree that the need for management of agricultural change is caused by economic factors? [20] 2 ‘Not all manufacturing industries move when the initial locating factors have changed.’ With reference to examples, how far do you agree? [20] 3 Environmental management If answering this option, answer Question 4 and either Question 5 or Question 6. Fig. 4.1 shows the world’s top 10 emitters of carbon dioxide (CO2), by country, in 2018. 4 Describe the regional variations shown in Fig. 4.1. [4] (a) Suggest two reasons why there are variations in the level of carbon dioxide (CO2) emissions between countries. [6] (b) Evaluate the success of one country’s overall energy strategy in overcoming issues in power production. [20] 5 ‘Physical factors are the greatest constraint on improving the quality of degraded environments.’ With reference to one or more examples, how far do you agree? [20] 6 11_9696_43_2022_1.4 © UCLES 2022 2
Question paper, page 3
Global interdependence If answering this option, answer Question 7 and either Question 8 or Question 9. Table 7.1 shows the total net ODA of selected countries and its percentage of Gross National Income (GNI) in 2016. 7 Describe the relationship shown in Table 7.1. [4] (a) Explain two disadvantages of tied aid to receiving countries. [6] (b) Assess the role of resource endowment in global patterns of trade. [20] 8 For one tourist area or resort, assess the extent to which the environment can be managed sustainably. [20] 9 Economic transition If answering this option, answer Question 10 and either Question 11 or Question 12. Fig. 10.1 is a photograph which shows a disused factory and new apartments in an area of Manchester, UK, an HIC in Europe. 10 Suggest how Fig. 10.1 shows evidence for the impact of globalisation of economic activity. [3] (a) Explain two socio-economic impacts of changes in the location of economic activity for HICs. [7] (b) ‘Social indices are the best way to measure global inequalities.’ How far do you agree? [20] 11 With reference to one country, assess the extent to which the concept of core–periphery explains the pattern of regional development. [20] 12 11_9696_43_2022_1.4 © UCLES 2022 3
Question paper, page 4
BLANK PAGE The boundaries and names shown, the designations used and the presentation of material on any maps contained in this question paper/insert do not imply official endorsement or acceptance by Cambridge Assessment International Education concerning the legal status of any country, territory, or area or any of its authorities, or of the delimitation of its frontiers or boundaries. Permission to reproduce items where third-party owned material protected by copyright is included has been sought and cleared where possible. Every reasonable effort has been made by the publisher (UCLES) to trace copyright holders, but if any items requiring clearance have unwittingly been included, the publisher will be pleased to make amends at the earliest possible opportunity. To avoid the issue of disclosure of answer-related information to candidates, all copyright acknowledgements are reproduced online in the Cambridge Assessment International Education Copyright Acknowledgements Booklet. This is produced for each series of examinations and is freely available to download at www.cambridgeinternational.org after the live examination series. Cambridge Assessment International Education is part of Cambridge Assessment. Cambridge Assessment is the brand name of the University of Cambridge Local Examinations Syndicate (UCLES), which is a department of the University of Cambridge. 11_9696_43_2022_1.4 © UCLES 2022 4
Mark scheme, page 1
This document consists of 27 printed pages. © UCLES 2022 [Turn over Cambridge International AS & A Level GEOGRAPHY 9696/43 Paper 4 Advanced Human Geography Options October/November 2022 MARK SCHEME Maximum Mark: 60 Published This mark scheme is published as an aid to teachers and candidates, to indicate the requirements of the examination. It shows the basis on which Examiners were instructed to award marks. It does not indicate the details of the discussions that took place at an Examiners’ meeting before marking began, which would have considered the acceptability of alternative answers. Mark schemes should be read in conjunction with the question paper and the Principal Examiner Report for Teachers. Cambridge International will not enter into discussions about these mark schemes. Cambridge International is publishing the mark schemes for the October/November 2022 series for most Cambridge IGCSE™, Cambridge International A and AS Level components and some Cambridge O Level components.
Mark scheme, page 2
9696/43 Cambridge International AS & A Level – Mark Scheme PUBLISHED October/November 2022 © UCLES 2022 Page 2 of 27 Generic Marking Principles These general marking principles must be applied by all examiners when marking candidate answers. They should be applied alongside the specific content of the mark scheme or generic level descriptors for a question. Each question paper and mark scheme will also comply with these marking principles. GENERIC MARKING PRINCIPLE 1: Marks must be awarded in line with: • the specific content of the mark scheme or the generic level descriptors for the question • the specific skills defined in the mark scheme or in the generic level descriptors for the question • the standard of response required by a candidate as exemplified by the standardisation scripts. GENERIC MARKING PRINCIPLE 2: Marks awarded are always whole marks (not half marks, or other fractions). GENERIC MARKING PRINCIPLE 3: Marks must be awarded positively: • marks are awarded for correct/valid answers, as defined in the mark scheme. However, credit is given for valid answers which go beyond the scope of the syllabus and mark scheme, referring to your Team Leader as appropriate • marks are awarded when candidates clearly demonstrate what they know and can do • marks are not deducted for errors • marks are not deducted for omissions • answers should only be judged on the quality of spelling, punctuation and grammar when these features are specifically assessed by the question as indicated by the mark scheme. The meaning, however, should be unambiguous. GENERIC MARKING PRINCIPLE 4: Rules must be applied consistently, e.g. in situations where candidates have not followed instructions or in the application of generic level descriptors. GENERIC MARKING PRINCIPLE 5: Marks should be awarded using the full range of marks defined in the mark scheme for the question (however; the use of the full mark range may be limited according to the quality of the candidate responses seen). GENERIC MARKING PRINCIPLE 6: Marks awarded are based solely on the requirements as defined in the mark scheme. Marks should not be awarded with grade thresholds or grade descriptors in mind.
Mark scheme, page 3
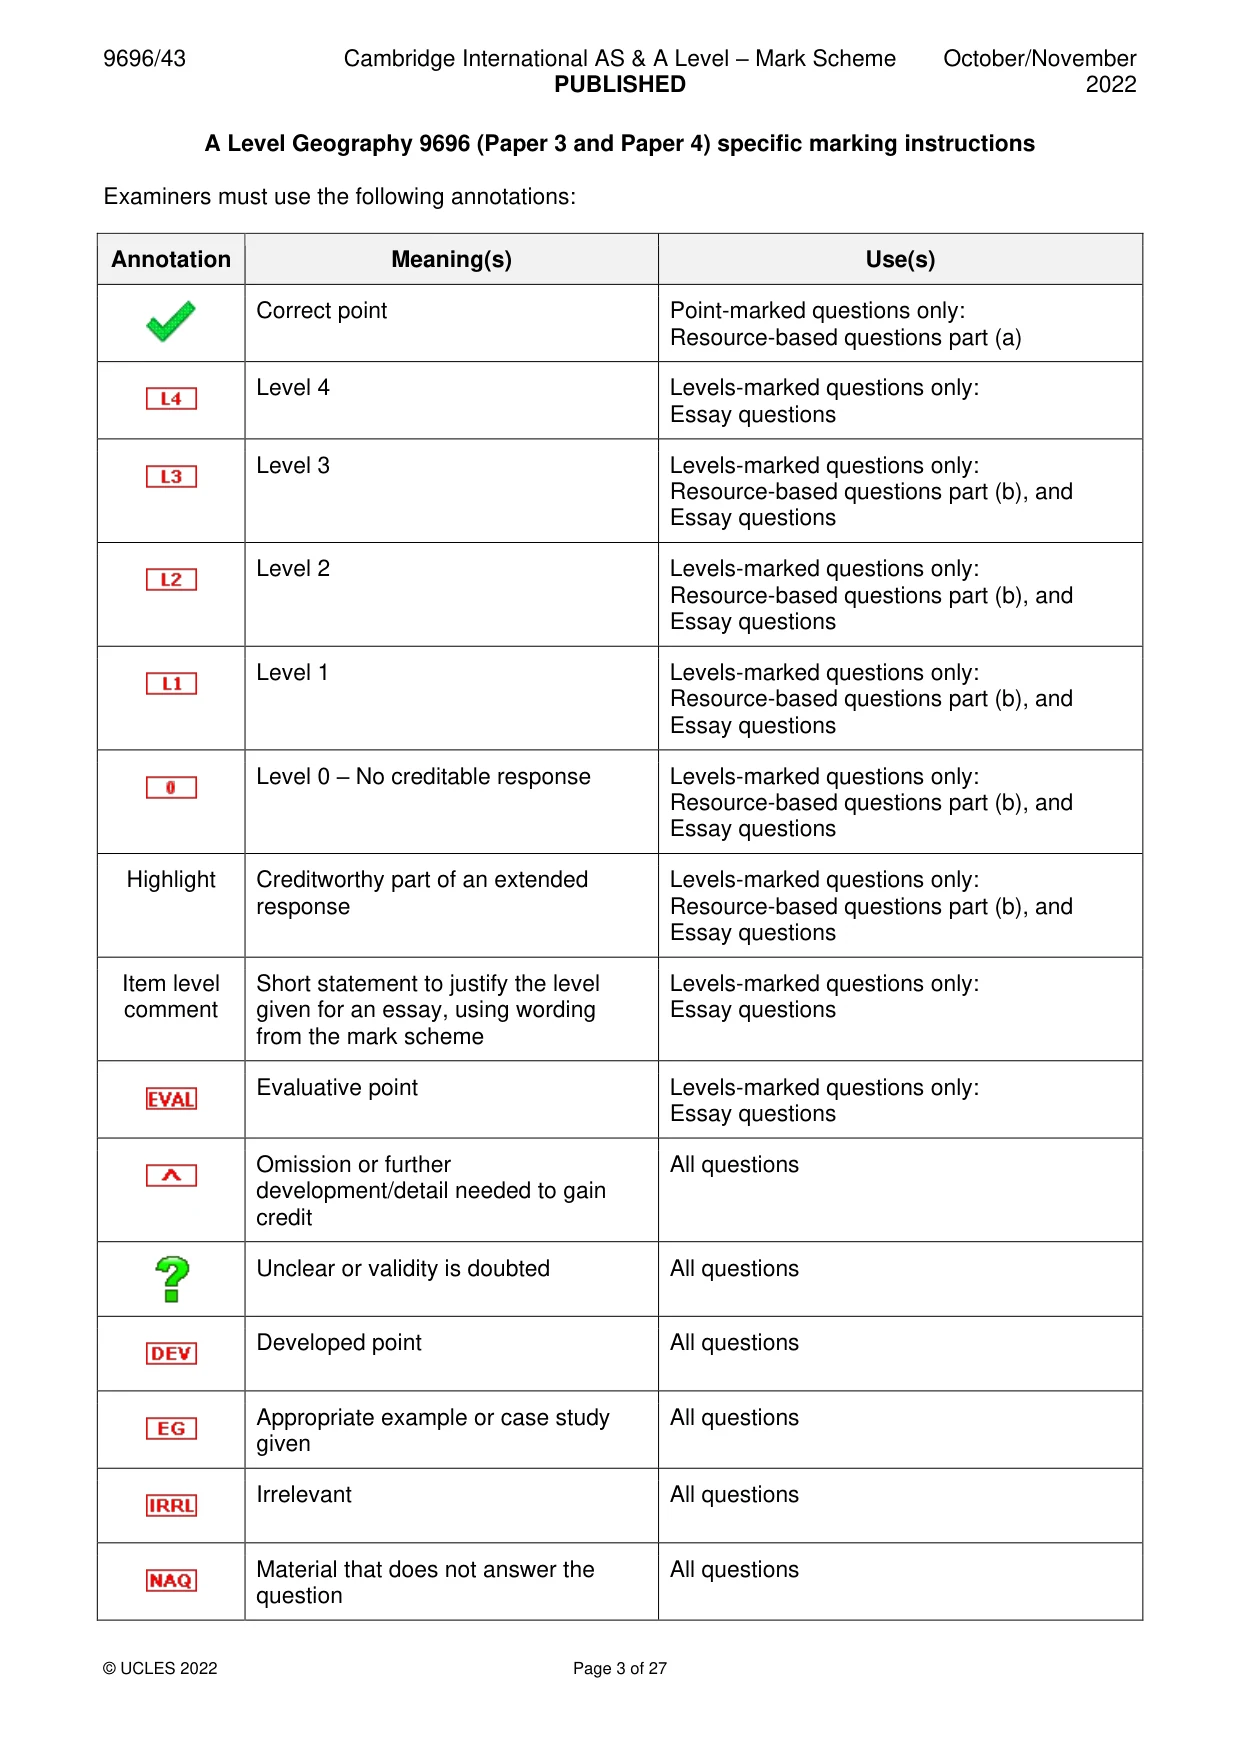
9696/43 Cambridge International AS & A Level – Mark Scheme PUBLISHED October/November 2022 © UCLES 2022 Page 3 of 27 A Level Geography 9696 (Paper 3 and Paper 4) specific marking instructions Examiners must use the following annotations: Annotation Meaning(s) Use(s) Correct point Point-marked questions only: Resource-based questions part (a) Level 4 Levels-marked questions only: Essay questions Level 3 Levels-marked questions only: Resource-based questions part (b), and Essay questions Level 2 Levels-marked questions only: Resource-based questions part (b), and Essay questions Level 1 Levels-marked questions only: Resource-based questions part (b), and Essay questions Level 0 – No creditable response Levels-marked questions only: Resource-based questions part (b), and Essay questions Highlight Creditworthy part of an extended response Levels-marked questions only: Resource-based questions part (b), and Essay questions Item level comment Short statement to justify the level given for an essay, using wording from the mark scheme Levels-marked questions only: Essay questions Evaluative point Levels-marked questions only: Essay questions Omission or further development/detail needed to gain credit All questions Unclear or validity is doubted All questions Developed point All questions Appropriate example or case study given All questions Irrelevant All questions Material that does not answer the question All questions
Mark scheme, page 4
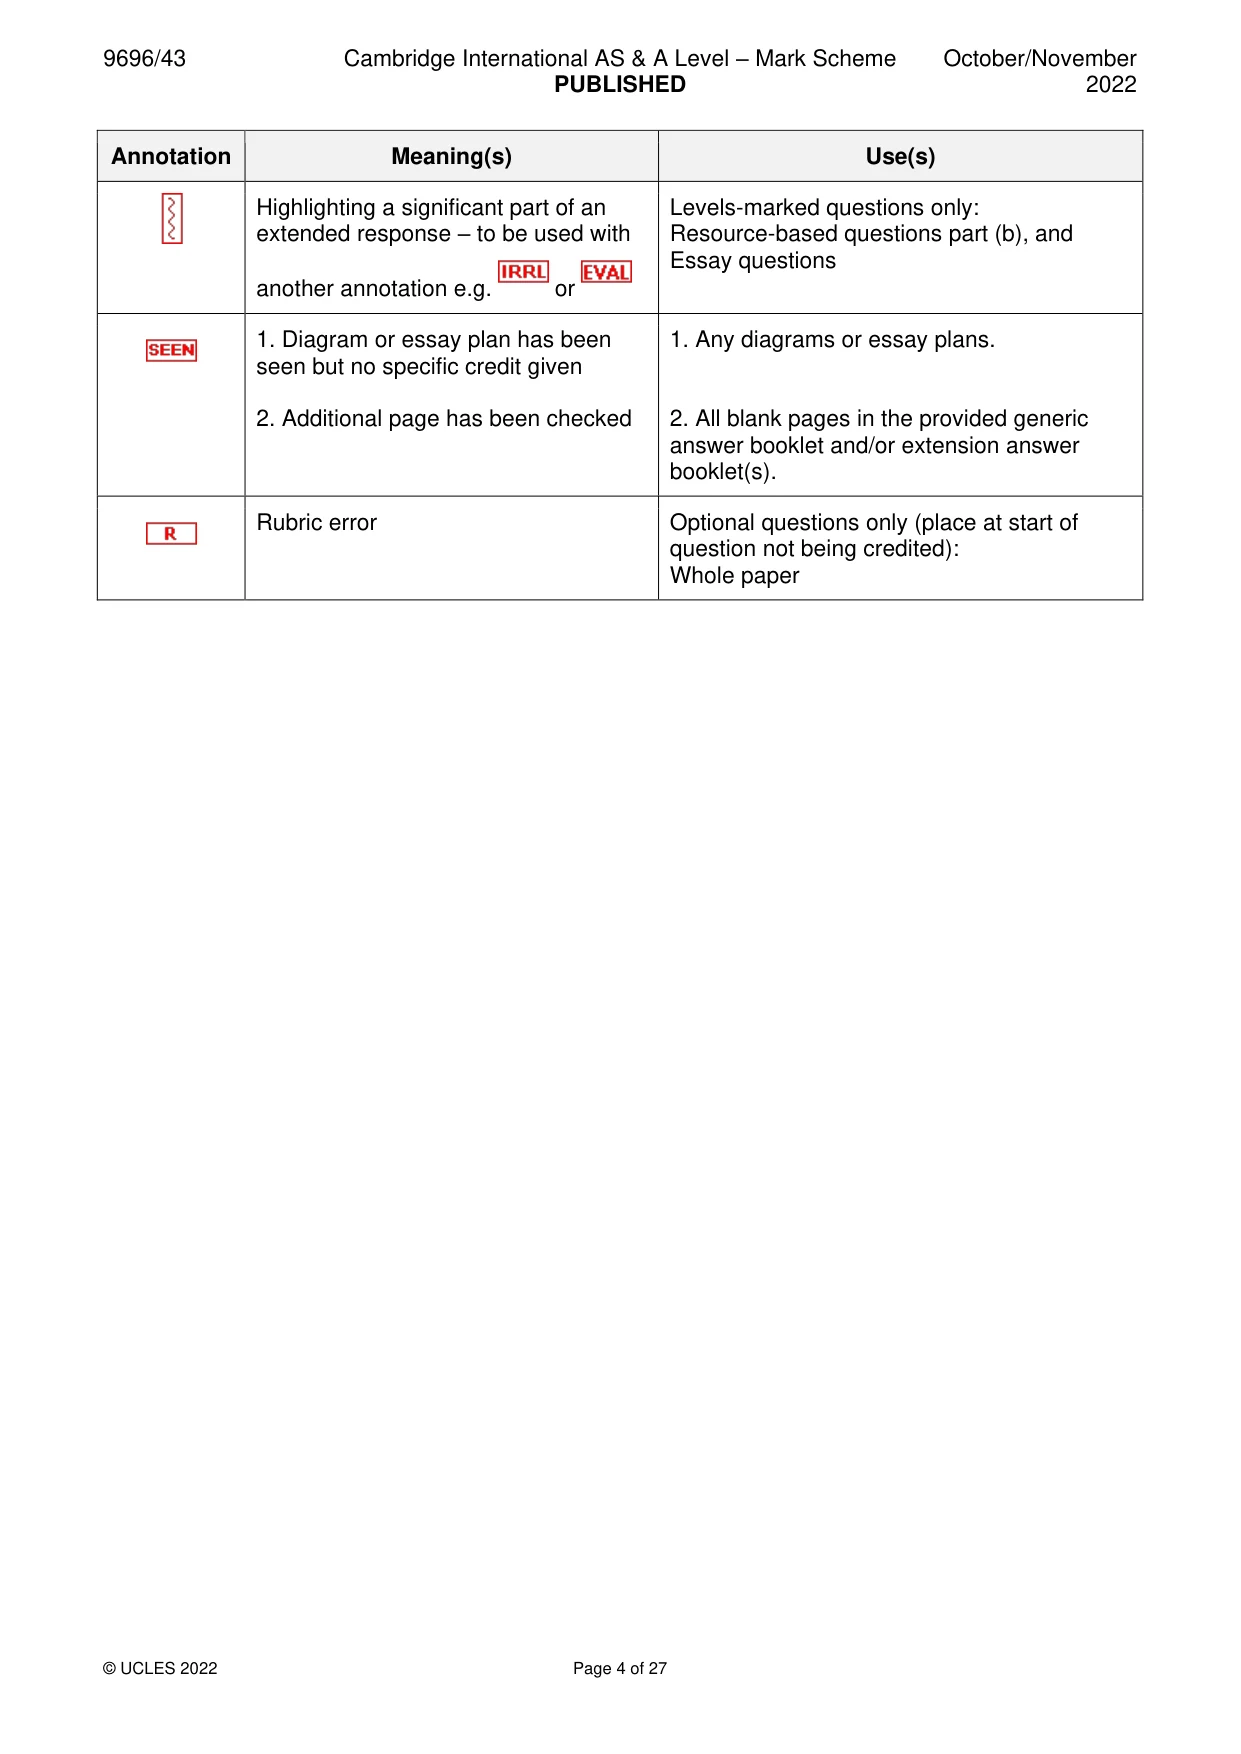
9696/43 Cambridge International AS & A Level – Mark Scheme PUBLISHED October/November 2022 © UCLES 2022 Page 4 of 27 Annotation Meaning(s) Use(s) Highlighting a significant part of an extended response – to be used with another annotation e.g. or Levels-marked questions only: Resource-based questions part (b), and Essay questions 1. Diagram or essay plan has been seen but no specific credit given 2. Additional page has been checked 1. Any diagrams or essay plans. 2. All blank pages in the provided generic answer booklet and/or extension answer booklet(s). Rubric error Optional questions only (place at start of question not being credited): Whole paper
Mark scheme, page 5
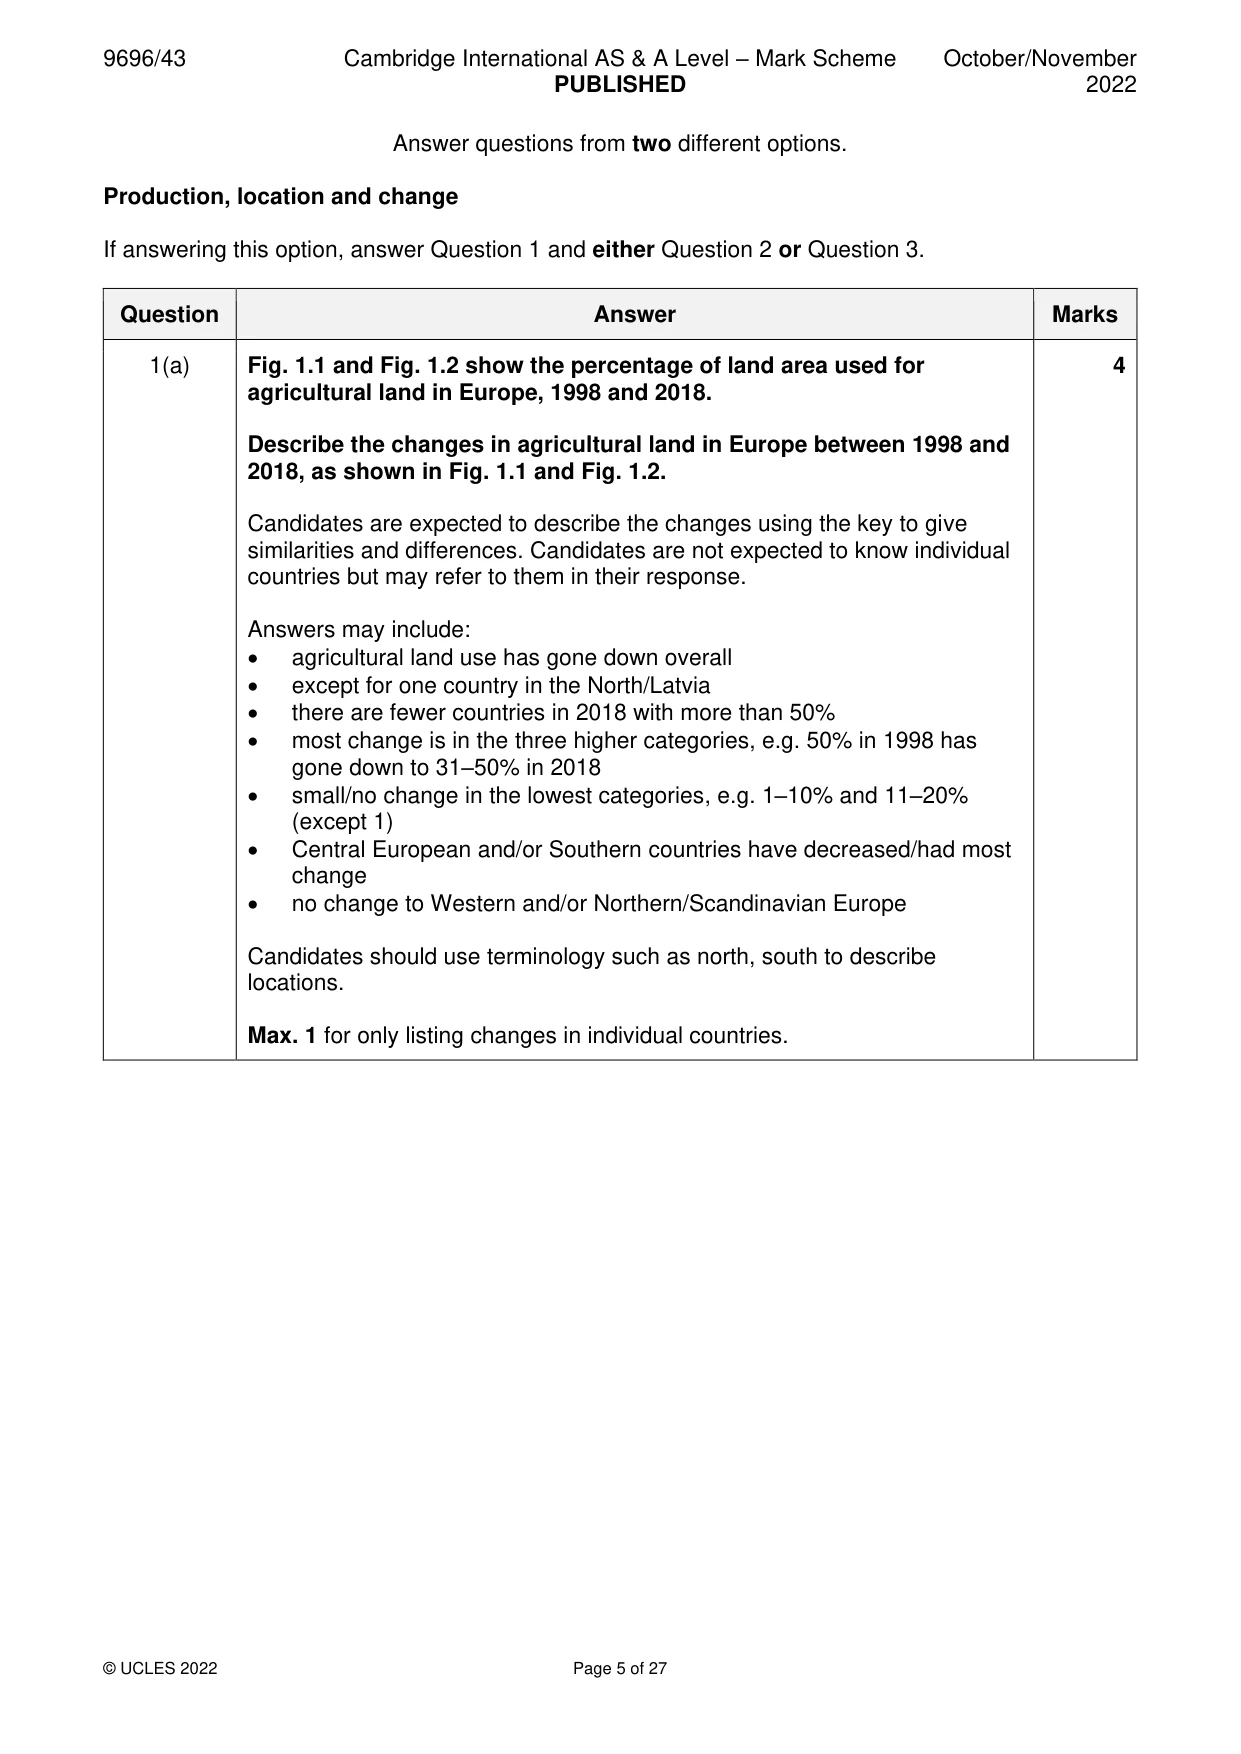
9696/43 Cambridge International AS & A Level – Mark Scheme PUBLISHED October/November 2022 © UCLES 2022 Page 5 of 27 Answer questions from two different options. Production, location and change If answering this option, answer Question 1 and either Question 2 or Question 3. Question Answer Marks 1(a) Fig. 1.1 and Fig. 1.2 show the percentage of land area used for agricultural land in Europe, 1998 and 2018. Describe the changes in agricultural land in Europe between 1998 and 2018, as shown in Fig. 1.1 and Fig. 1.2. Candidates are expected to describe the changes using the key to give similarities and differences. Candidates are not expected to know individual countries but may refer to them in their response. Answers may include: • agricultural land use has gone down overall • except for one country in the North/Latvia • there are fewer countries in 2018 with more than 50% • most change is in the three higher categories, e.g. 50% in 1998 has gone down to 31–50% in 2018 • small/no change in the lowest categories, e.g. 1–10% and 11–20% (except 1) • Central European and/or Southern countries have decreased/had most change • no change to Western and/or Northern/Scandinavian Europe Candidates should use terminology such as north, south to describe locations. Max. 1 for only listing changes in individual countries. 4
Mark scheme, page 6
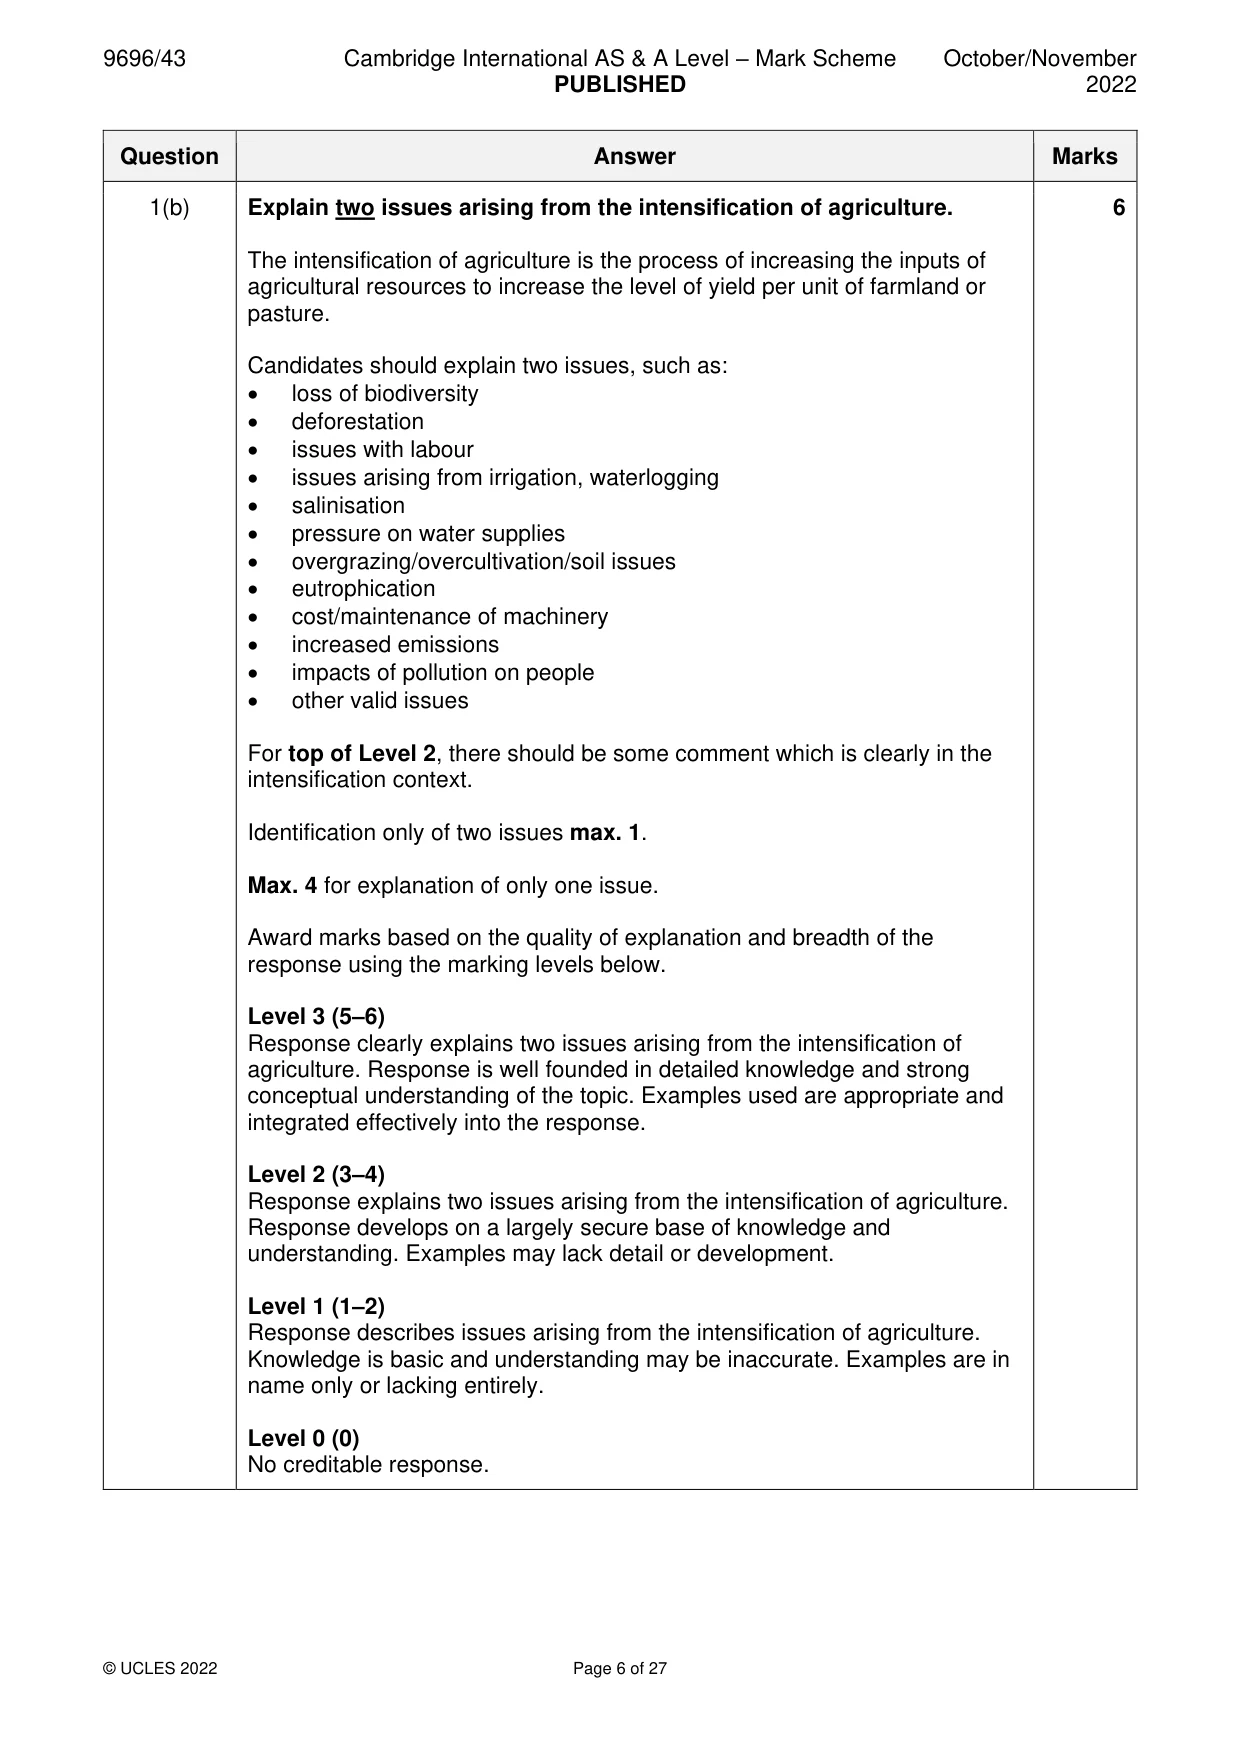
9696/43 Cambridge International AS & A Level – Mark Scheme PUBLISHED October/November 2022 © UCLES 2022 Page 6 of 27 Question Answer Marks 1(b) Explain two issues arising from the intensification of agriculture. The intensification of agriculture is the process of increasing the inputs of agricultural resources to increase the level of yield per unit of farmland or pasture. Candidates should explain two issues, such as: • loss of biodiversity • deforestation • issues with labour • issues arising from irrigation, waterlogging • salinisation • pressure on water supplies • overgrazing/overcultivation/soil issues • eutrophication • cost/maintenance of machinery • increased emissions • impacts of pollution on people • other valid issues For top of Level 2, there should be some comment which is clearly in the intensification context. Identification only of two issues max. 1. Max. 4 for explanation of only one issue. Award marks based on the quality of explanation and breadth of the response using the marking levels below. Level 3 (5–6) Response clearly explains two issues arising from the intensification of agriculture. Response is well founded in detailed knowledge and strong conceptual understanding of the topic. Examples used are appropriate and integrated effectively into the response. Level 2 (3–4) Response explains two issues arising from the intensification of agriculture. Response develops on a largely secure base of knowledge and understanding. Examples may lack detail or development. Level 1 (1–2) Response describes issues arising from the intensification of agriculture. Knowledge is basic and understanding may be inaccurate. Examples are in name only or lacking entirely. Level 0 (0) No creditable response. 6
Mark scheme, page 7
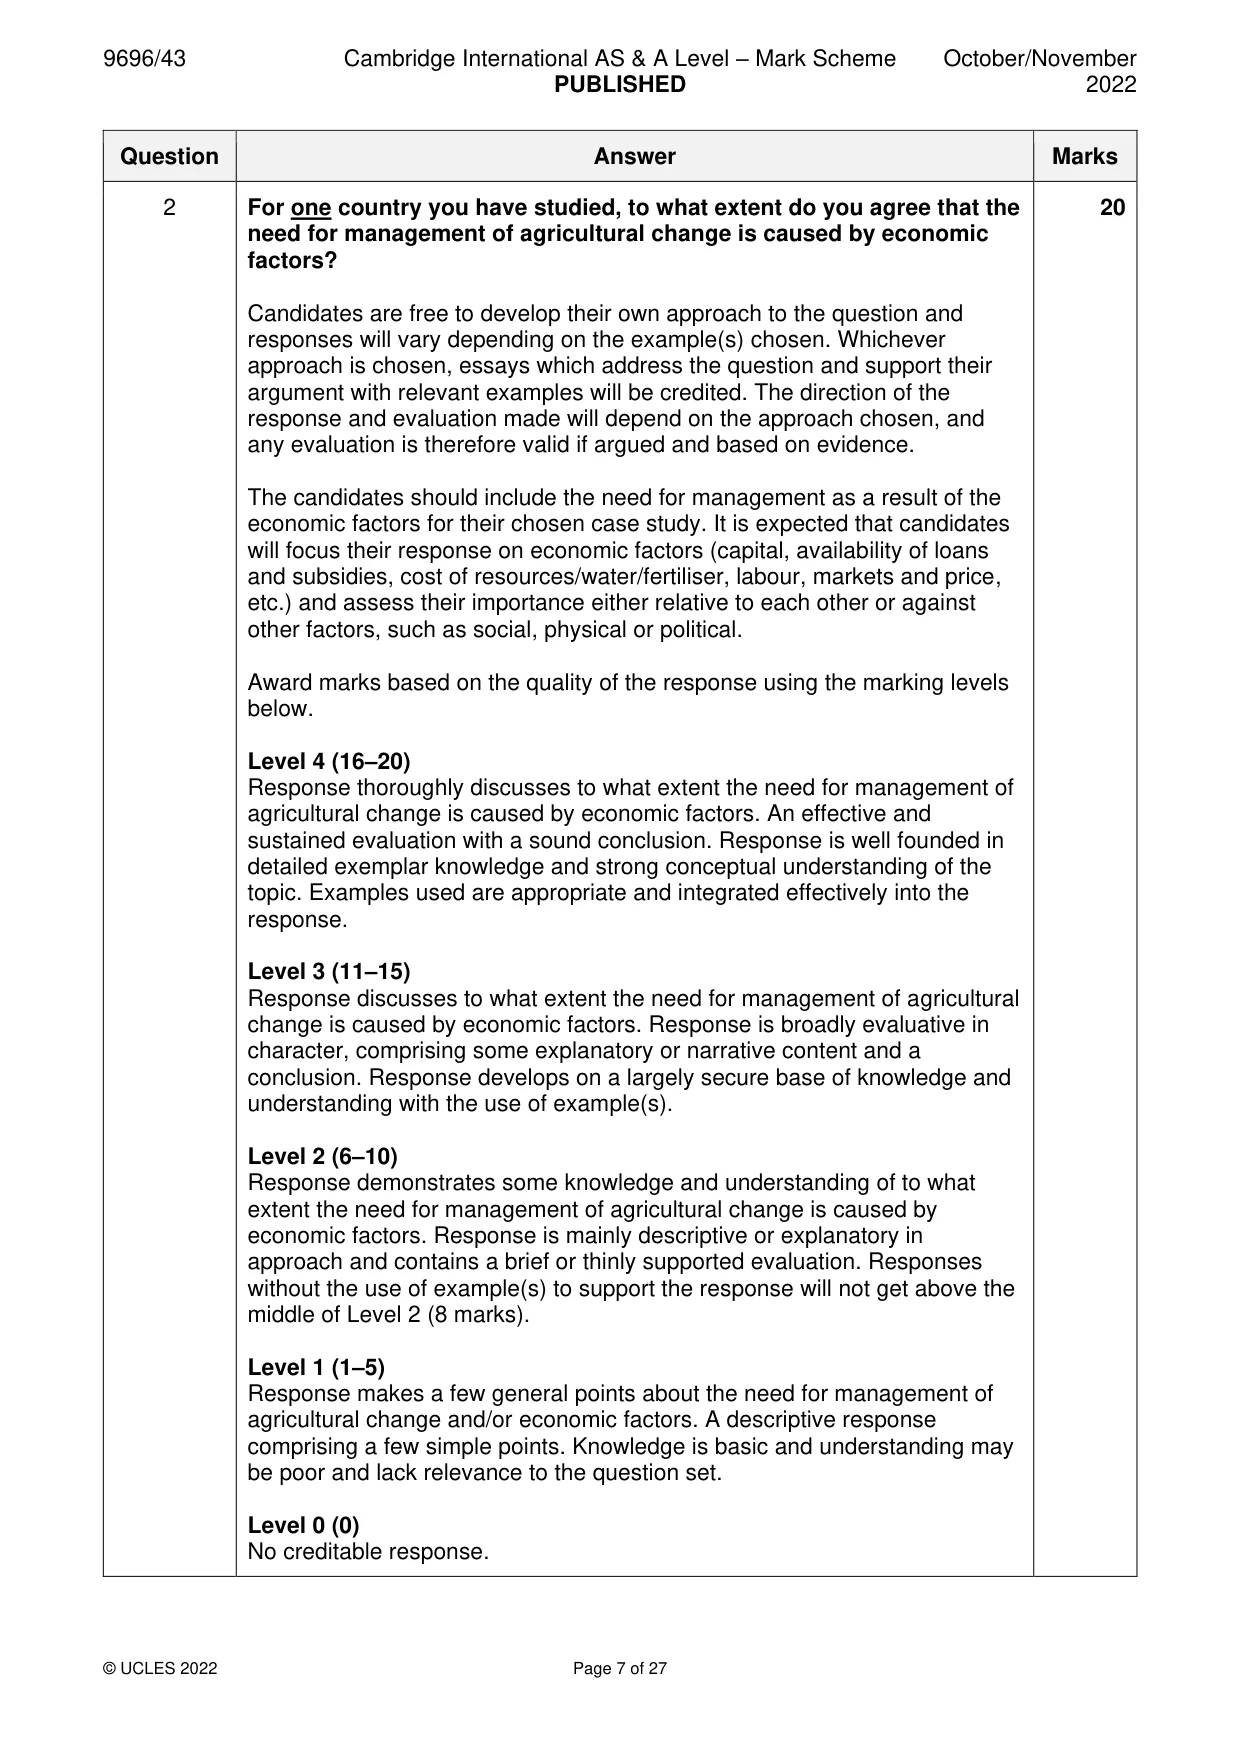
9696/43 Cambridge International AS & A Level – Mark Scheme PUBLISHED October/November 2022 © UCLES 2022 Page 7 of 27 Question Answer Marks 2 For one country you have studied, to what extent do you agree that the need for management of agricultural change is caused by economic factors? Candidates are free to develop their own approach to the question and responses will vary depending on the example(s) chosen. Whichever approach is chosen, essays which address the question and support their argument with relevant examples will be credited. The direction of the response and evaluation made will depend on the approach chosen, and any evaluation is therefore valid if argued and based on evidence. The candidates should include the need for management as a result of the economic factors for their chosen case study. It is expected that candidates will focus their response on economic factors (capital, availability of loans and subsidies, cost of resources/water/fertiliser, labour, markets and price, etc.) and assess their importance either relative to each other or against other factors, such as social, physical or political. Award marks based on the quality of the response using the marking levels below. Level 4 (16–20) Response thoroughly discusses to what extent the need for management of agricultural change is caused by economic factors. An effective and sustained evaluation with a sound conclusion. Response is well founded in detailed exemplar knowledge and strong conceptual understanding of the topic. Examples used are appropriate and integrated effectively into the response. Level 3 (11–15) Response discusses to what extent the need for management of agricultural change is caused by economic factors. Response is broadly evaluative in character, comprising some explanatory or narrative content and a conclusion. Response develops on a largely secure base of knowledge and understanding with the use of example(s). Level 2 (6–10) Response demonstrates some knowledge and understanding of to what extent the need for management of agricultural change is caused by economic factors. Response is mainly descriptive or explanatory in approach and contains a brief or thinly supported evaluation. Responses without the use of example(s) to support the response will not get above the middle of Level 2 (8 marks). Level 1 (1–5) Response makes a few general points about the need for management of agricultural change and/or economic factors. A descriptive response comprising a few simple points. Knowledge is basic and understanding may be poor and lack relevance to the question set. Level 0 (0) No creditable response. 20
Mark scheme, page 8
9696/43 Cambridge International AS & A Level – Mark Scheme PUBLISHED October/November 2022 © UCLES 2022 Page 8 of 27 Question Answer Marks 3 ‘Not all manufacturing industries move when the initial locating factors have changed.’ With reference to examples, how far do you agree? Candidates are free to develop their own approach to the question and responses will vary depending on the example(s) chosen. Whichever approach is chosen, essays which address the question and support their argument with relevant examples will be credited. The direction of the response and evaluation made will depend on the approach chosen, and any evaluation is therefore valid if argued and based on evidence. Manufacturing industries can be large-scale and may be influenced by the location of raw materials, a cheap energy source, an abundance of skilled labour, government incentives and other initial locating factors. When these factors have changed, footloose industries may move, possibly in a ‘race to the bottom’ for the most profitable location when others may stay put. Inertia refers to a stage at which industry prefers to stay in its former location, even though the initial advantages are now gone. For example, the raw material is depleted. Good transport links may be a factor in why not all manufacturing industries move, as well as government policy. The cost of moving may be more than the benefits gained in the short-term. Candidates could consider the role of inertia and how it may influence location. Award marks based on the quality of the response using the marking levels below. Level 4 (16–20) Response thoroughly discusses how far the candidate agrees that not all manufacturing industries move when initial locating factors have changed. An effective and sustained evaluation with a sound conclusion. Response is well founded in detailed exemplar knowledge and strong conceptual understanding of the topic. Examples used are appropriate and integrated effectively into the response. Level 3 (11–15) Response discusses how far the candidate agrees that not all manufacturing industries move when initial locating factors have changed but may be unbalanced. Response is broadly evaluative in character, comprising some explanatory or narrative content and a conclusion. Response develops on a largely secure base of knowledge and understanding with the use of example(s). Level 2 (6–10) Response demonstrates some knowledge and understanding of how far the candidate agrees that not all manufacturing industries move when initial locating factors have changed. Response is mainly descriptive or explanatory in approach and contains a brief or thinly supported evaluation. Responses without the use of example(s) to support the response will not get above the middle of Level 2 (8 marks). 20
Mark scheme, page 9
9696/43 Cambridge International AS & A Level – Mark Scheme PUBLISHED October/November 2022 © UCLES 2022 Page 9 of 27 Question Answer Marks 3 Level 1 (1–5) Response makes a few general points about how manufacturing industries move when initial factors have changed. A descriptive response comprising a few simple points. Knowledge is basic and understanding may be poor and lack relevance to the question set. Level 0 (0) No creditable response.
Mark scheme, page 10
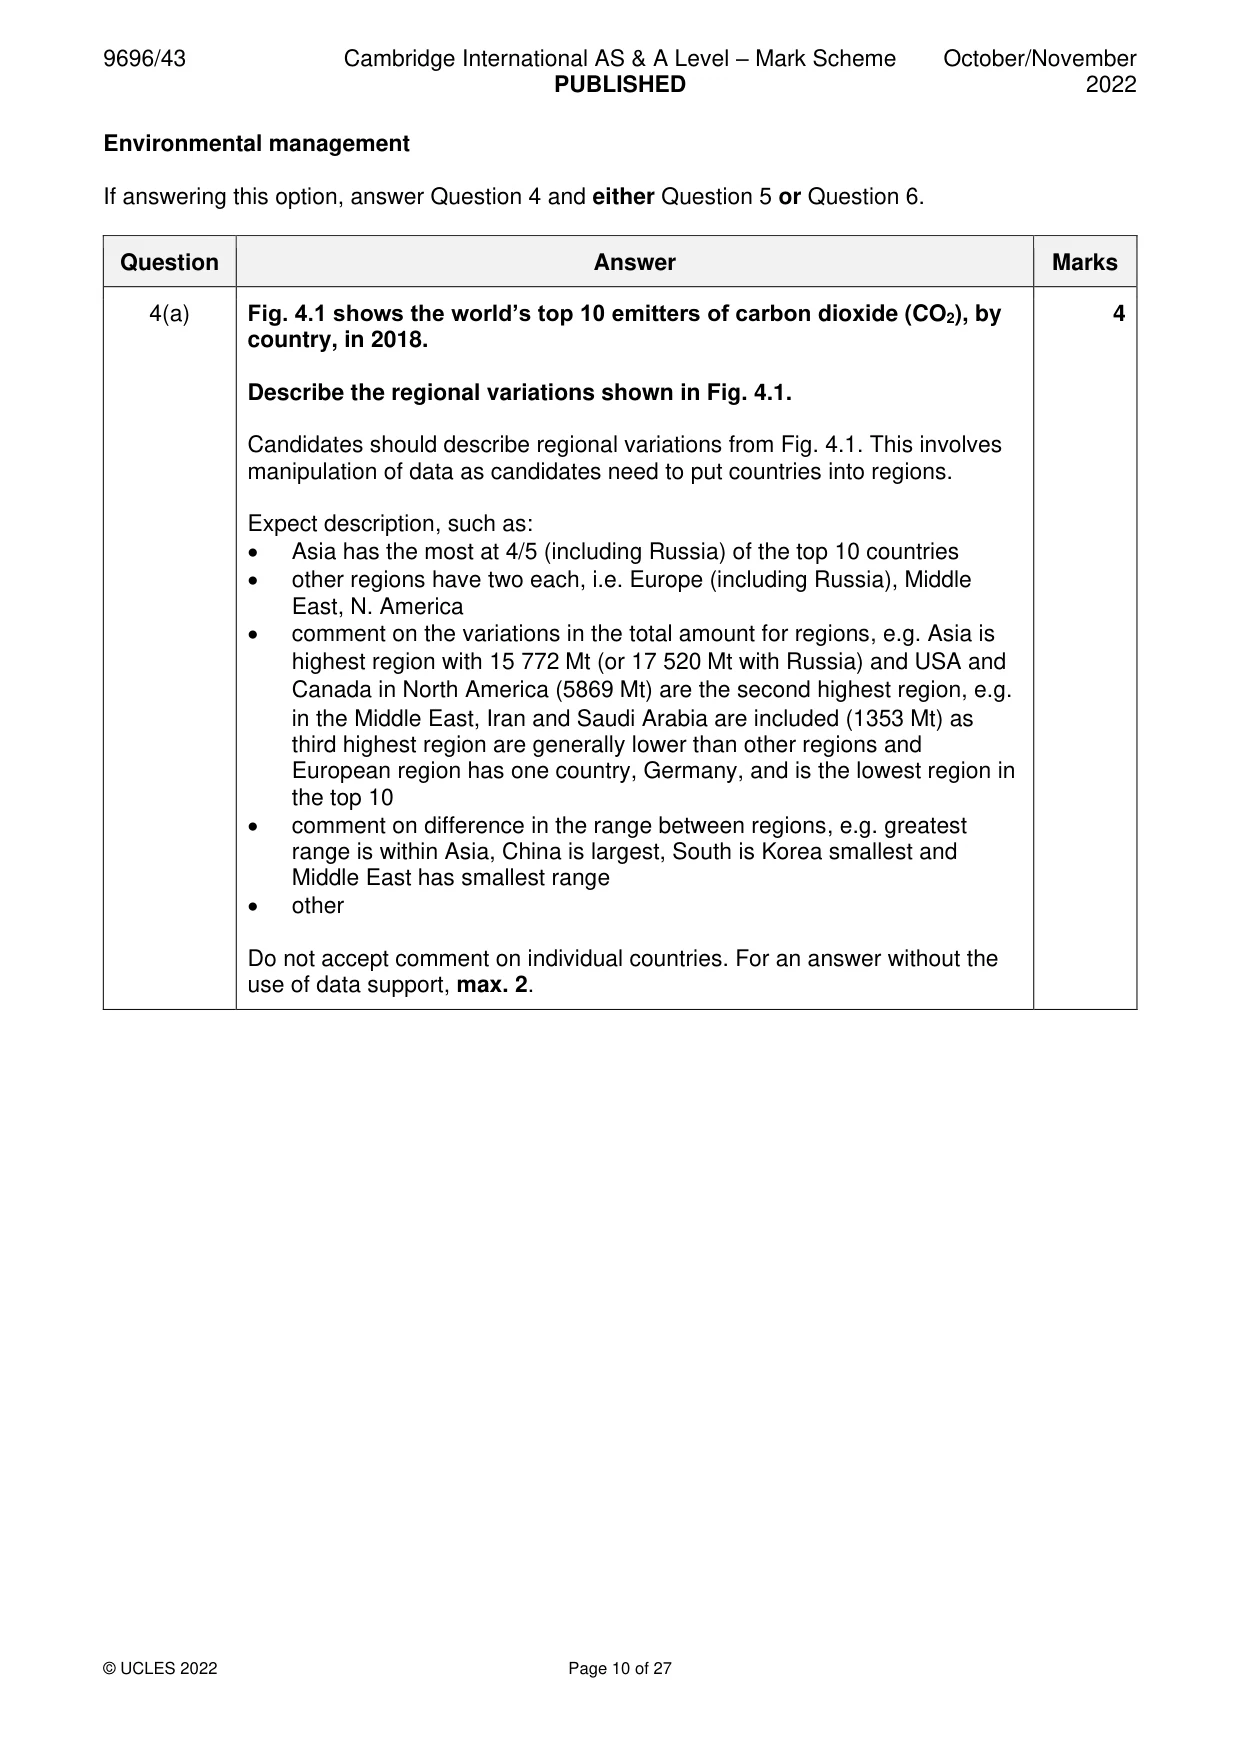
9696/43 Cambridge International AS & A Level – Mark Scheme PUBLISHED October/November 2022 © UCLES 2022 Page 10 of 27 Environmental management If answering this option, answer Question 4 and either Question 5 or Question 6. Question Answer Marks 4(a) Fig. 4.1 shows the world’s top 10 emitters of carbon dioxide (CO2), by country, in 2018. Describe the regional variations shown in Fig. 4.1. Candidates should describe regional variations from Fig. 4.1. This involves manipulation of data as candidates need to put countries into regions. Expect description, such as: • Asia has the most at 4/5 (including Russia) of the top 10 countries • other regions have two each, i.e. Europe (including Russia), Middle East, N. America • comment on the variations in the total amount for regions, e.g. Asia is highest region with 15 772 Mt (or 17 520 Mt with Russia) and USA and Canada in North America (5869 Mt) are the second highest region, e.g. in the Middle East, Iran and Saudi Arabia are included (1353 Mt) as third highest region are generally lower than other regions and European region has one country, Germany, and is the lowest region in the top 10 • comment on difference in the range between regions, e.g. greatest range is within Asia, China is largest, South is Korea smallest and Middle East has smallest range • other Do not accept comment on individual countries. For an answer without the use of data support, max. 2. 4
Mark scheme, page 11
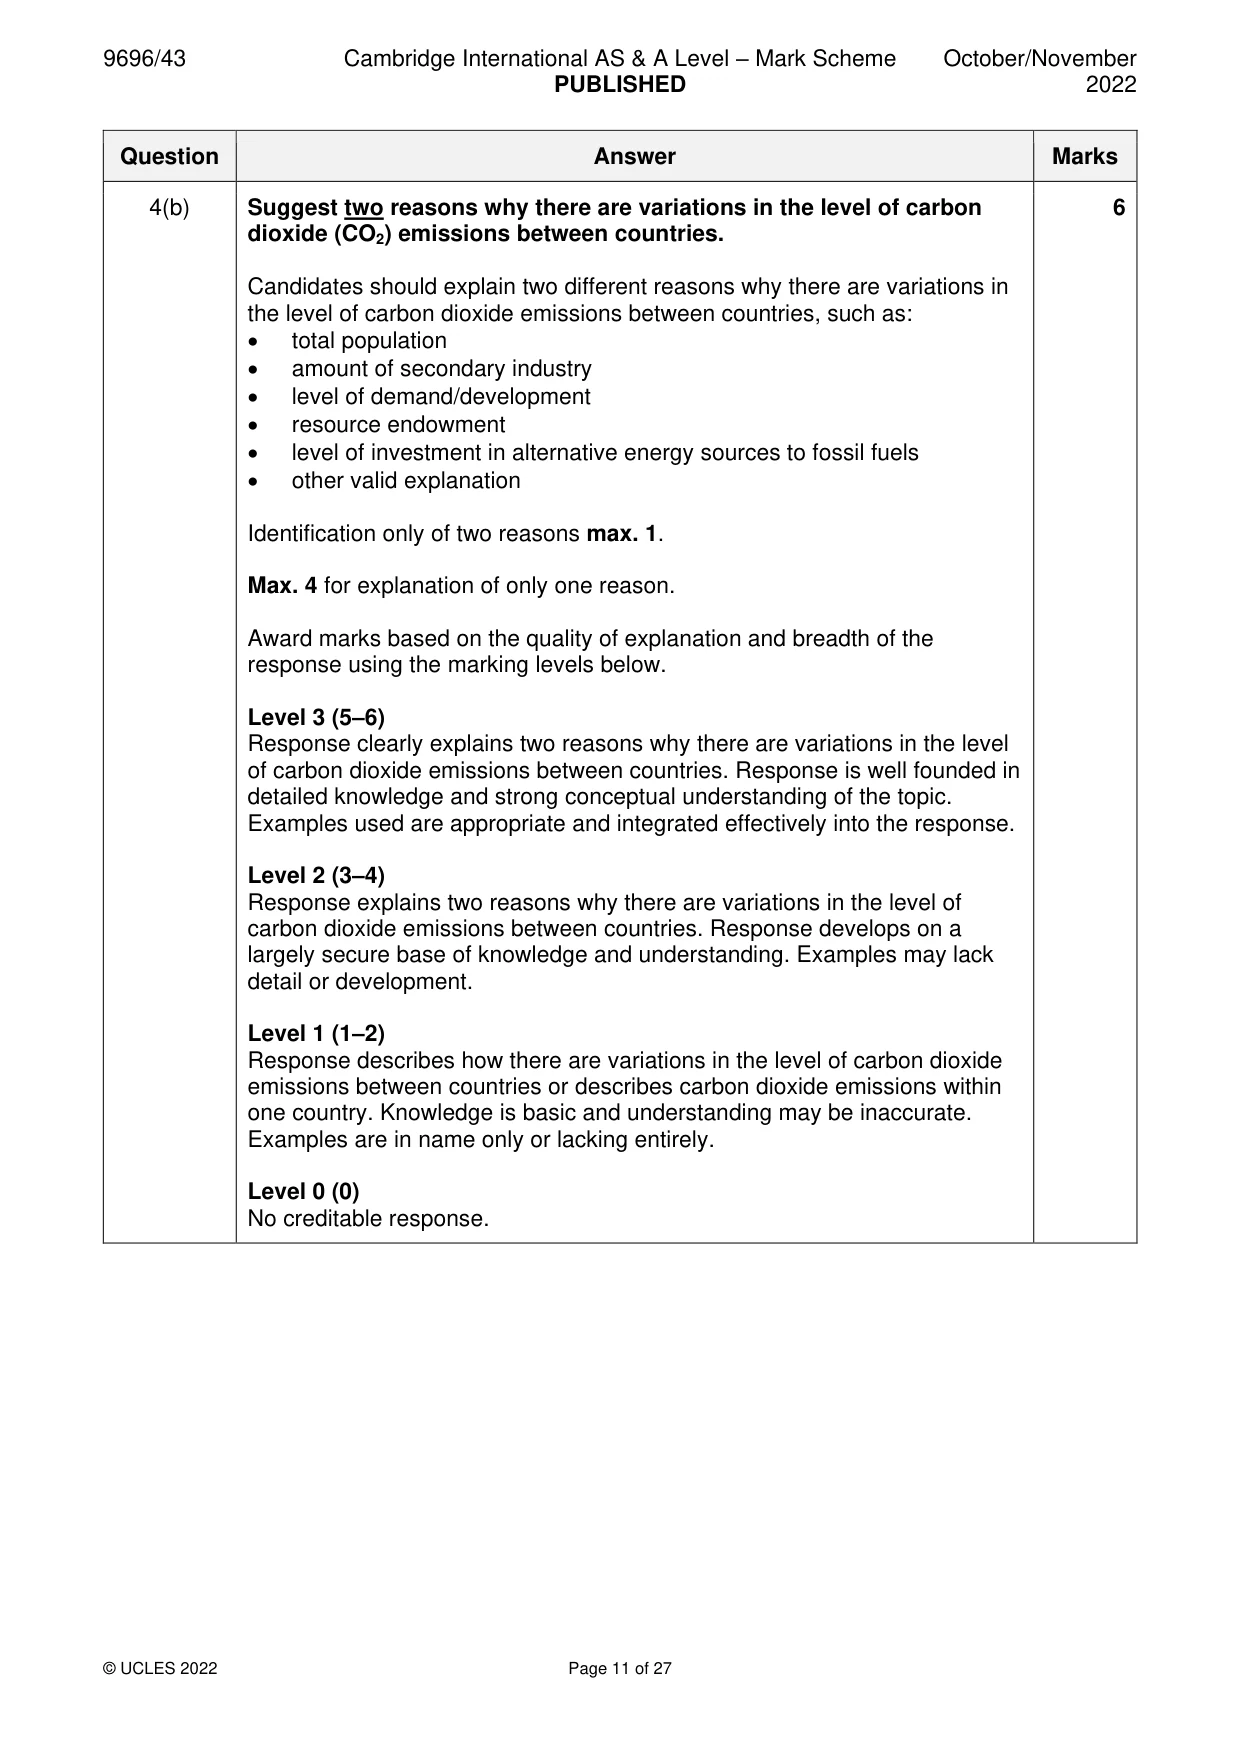
9696/43 Cambridge International AS & A Level – Mark Scheme PUBLISHED October/November 2022 © UCLES 2022 Page 11 of 27 Question Answer Marks 4(b) Suggest two reasons why there are variations in the level of carbon dioxide (CO2) emissions between countries. Candidates should explain two different reasons why there are variations in the level of carbon dioxide emissions between countries, such as: • total population • amount of secondary industry • level of demand/development • resource endowment • level of investment in alternative energy sources to fossil fuels • other valid explanation Identification only of two reasons max. 1. Max. 4 for explanation of only one reason. Award marks based on the quality of explanation and breadth of the response using the marking levels below. Level 3 (5–6) Response clearly explains two reasons why there are variations in the level of carbon dioxide emissions between countries. Response is well founded in detailed knowledge and strong conceptual understanding of the topic. Examples used are appropriate and integrated effectively into the response. Level 2 (3–4) Response explains two reasons why there are variations in the level of carbon dioxide emissions between countries. Response develops on a largely secure base of knowledge and understanding. Examples may lack detail or development. Level 1 (1–2) Response describes how there are variations in the level of carbon dioxide emissions between countries or describes carbon dioxide emissions within one country. Knowledge is basic and understanding may be inaccurate. Examples are in name only or lacking entirely. Level 0 (0) No creditable response. 6
Mark scheme, page 12
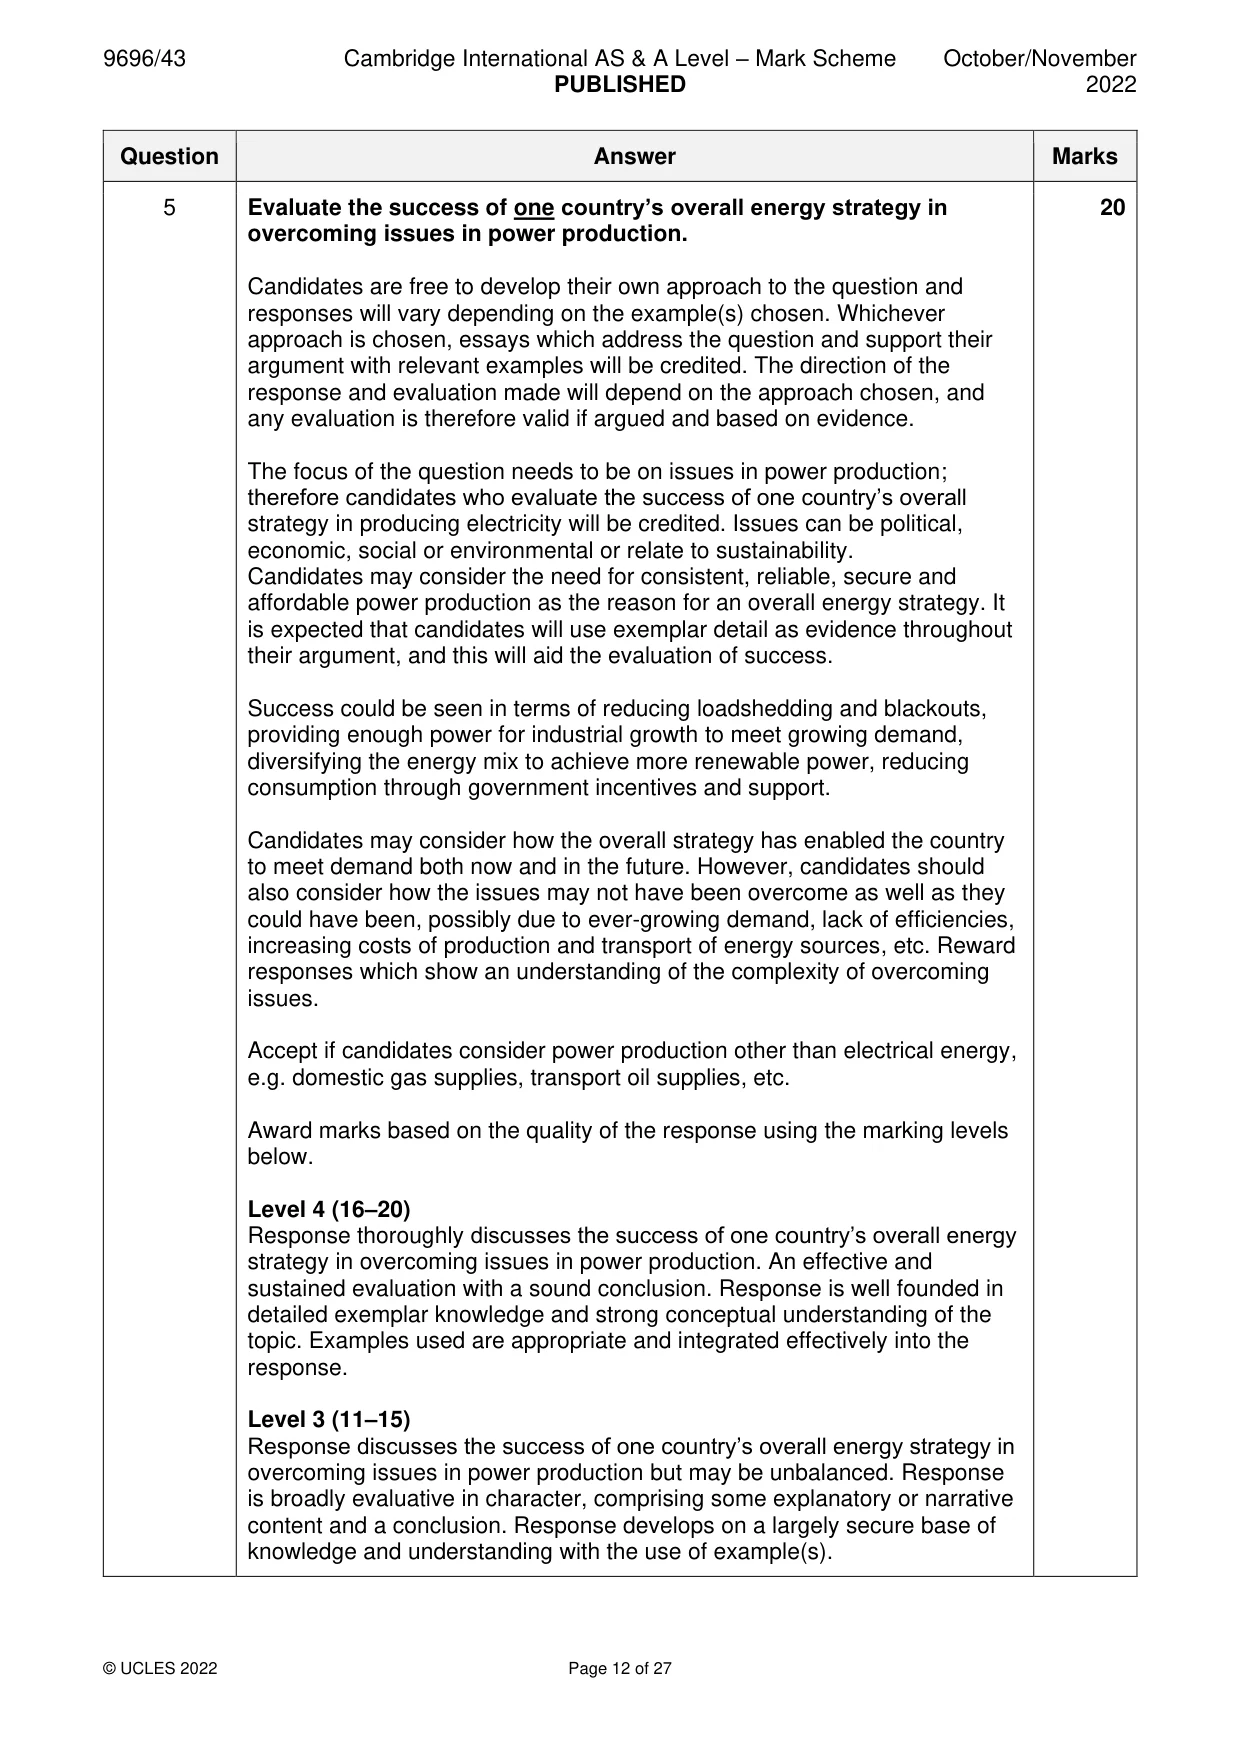
9696/43 Cambridge International AS & A Level – Mark Scheme PUBLISHED October/November 2022 © UCLES 2022 Page 12 of 27 Question Answer Marks 5 Evaluate the success of one country’s overall energy strategy in overcoming issues in power production. Candidates are free to develop their own approach to the question and responses will vary depending on the example(s) chosen. Whichever approach is chosen, essays which address the question and support their argument with relevant examples will be credited. The direction of the response and evaluation made will depend on the approach chosen, and any evaluation is therefore valid if argued and based on evidence. The focus of the question needs to be on issues in power production; therefore candidates who evaluate the success of one country’s overall strategy in producing electricity will be credited. Issues can be political, economic, social or environmental or relate to sustainability. Candidates may consider the need for consistent, reliable, secure and affordable power production as the reason for an overall energy strategy. It is expected that candidates will use exemplar detail as evidence throughout their argument, and this will aid the evaluation of success. Success could be seen in terms of reducing loadshedding and blackouts, providing enough power for industrial growth to meet growing demand, diversifying the energy mix to achieve more renewable power, reducing consumption through government incentives and support. Candidates may consider how the overall strategy has enabled the country to meet demand both now and in the future. However, candidates should also consider how the issues may not have been overcome as well as they could have been, possibly due to ever-growing demand, lack of efficiencies, increasing costs of production and transport of energy sources, etc. Reward responses which show an understanding of the complexity of overcoming issues. Accept if candidates consider power production other than electrical energy, e.g. domestic gas supplies, transport oil supplies, etc. Award marks based on the quality of the response using the marking levels below. Level 4 (16–20) Response thoroughly discusses the success of one country’s overall energy strategy in overcoming issues in power production. An effective and sustained evaluation with a sound conclusion. Response is well founded in detailed exemplar knowledge and strong conceptual understanding of the topic. Examples used are appropriate and integrated effectively into the response. Level 3 (11–15) Response discusses the success of one country’s overall energy strategy in overcoming issues in power production but may be unbalanced. Response is broadly evaluative in character, comprising some explanatory or narrative content and a conclusion. Response develops on a largely secure base of knowledge and understanding with the use of example(s). 20
Mark scheme, page 13
9696/43 Cambridge International AS & A Level – Mark Scheme PUBLISHED October/November 2022 © UCLES 2022 Page 13 of 27 Question Answer Marks 5 Level 2 (6–10) Response demonstrates some knowledge and understanding of the success of one country’s overall energy strategy in overcoming issues in power production but the success may not be clearly developed. Response is mainly descriptive or explanatory in approach and contains a brief or thinly supported evaluation. Responses without the use of example(s) to support the response will not get above the middle of Level 2 (8 marks). Level 1 (1–5) Response makes a few general points about overall energy strategy, success and/or issues in power production in a limited manner. A descriptive response comprising a few simple points. Knowledge is basic and understanding may be poor and lack relevance to the question set. Level 0 (0) No creditable response.
Mark scheme, page 14
9696/43 Cambridge International AS & A Level – Mark Scheme PUBLISHED October/November 2022 © UCLES 2022 Page 14 of 27 Question Answer Marks 6 ‘Physical factors are the greatest constraint on improving the quality of degraded environments.’ With reference to one or more examples, how far do you agree? Candidates are free to develop their own approach to the question and responses will vary depending on the example(s) chosen. Whichever approach is chosen, essays which address the question and support their argument with relevant examples will be credited. The direction of the response and evaluation made will depend on the approach chosen, and any evaluation is therefore valid if argued and based on evidence. Constraints can be anything which holds back the effectiveness of an attempt to improve a degraded environment. These can be limitations or restrictions and could be economic, physical/environmental, social, political, etc. Candidates should focus on physical factors and whether they are the greatest constraint on improving the quality of degraded environments. The focus may vary depending on the viewpoint taken. Physical factors could include climate, soils, relief, vegetation. Other constraints should be considered such as economic, political, etc., and also evaluated. It is likely that the constraints on improving any environment are never one-dimensional, and this would be a feature of better essays. The environment chosen could be urban or rural and must be described clearly. Award marks based on the quality of the response using the marking levels below. Level 4 (16–20) Response thoroughly discusses to what extent physical factors are the greatest constraint on improving the quality of degraded environments. An effective and sustained evaluation with a sound conclusion. Response is well founded in detailed exemplar knowledge and strong conceptual understanding of the topic. Examples used are appropriate and integrated effectively into the response. Level 3 (11–15) Response discusses to what extent physical factors are the greatest constraint on improving the quality of degraded environments but may be unbalanced. Response is broadly evaluative in character, comprising some explanatory or narrative content and a conclusion. Response develops on a largely secure base of knowledge and understanding with the use of example(s). Level 2 (6–10) Response demonstrates some knowledge and understanding of to what extent physical factors are the greatest constraint on improving the quality of degraded environments. Response is mainly descriptive or explanatory in approach and contains a brief or thinly supported evaluation. Responses without the use of example(s) to support the response will not get above the middle of Level 2 (8 marks). 20
Mark scheme, page 15
9696/43 Cambridge International AS & A Level – Mark Scheme PUBLISHED October/November 2022 © UCLES 2022 Page 15 of 27 Question Answer Marks 6 Level 1 (1–5) Response makes a few general points about constraints on improving the quality of degraded environments. A descriptive response comprising a few simple points. Knowledge is basic and understanding may be poor and lack relevance to the question set. Level 0 (0) No creditable response.
Mark scheme, page 16
9696/43 Cambridge International AS & A Level – Mark Scheme PUBLISHED October/November 2022 © UCLES 2022 Page 16 of 27 Global interdependence If answering this option, answer Question 7 and either Question 8 or Question 9. Question Answer Marks 7(a) Table 7.1 shows the total net ODA of selected countries and its percentage of Gross National Income (GNI) in 2016. Describe the relationship shown in Table 7.1. Candidates should describe and offer comment on the relationship between ODA and % of GNI as shown in Table 7.1, such as: • there is no clear relationship/some positive, some negative evidence • evidence of negative relationship is USA gives most at lowest % and Luxembourg gives second least amount at highest % • evidence of positive relationship is Germany and UK with high total and high % and Portugal with lowest total and low % (and Finland and NZ) • countries with lowest % have greatly different total ODA – USA, Japan and Portugal • European countries appear to give a higher % on average than non- European countries (for example, Luxembourg, Germany, UK and Denmark, etc., are highest by %) • other valid comment 4
Mark scheme, page 17
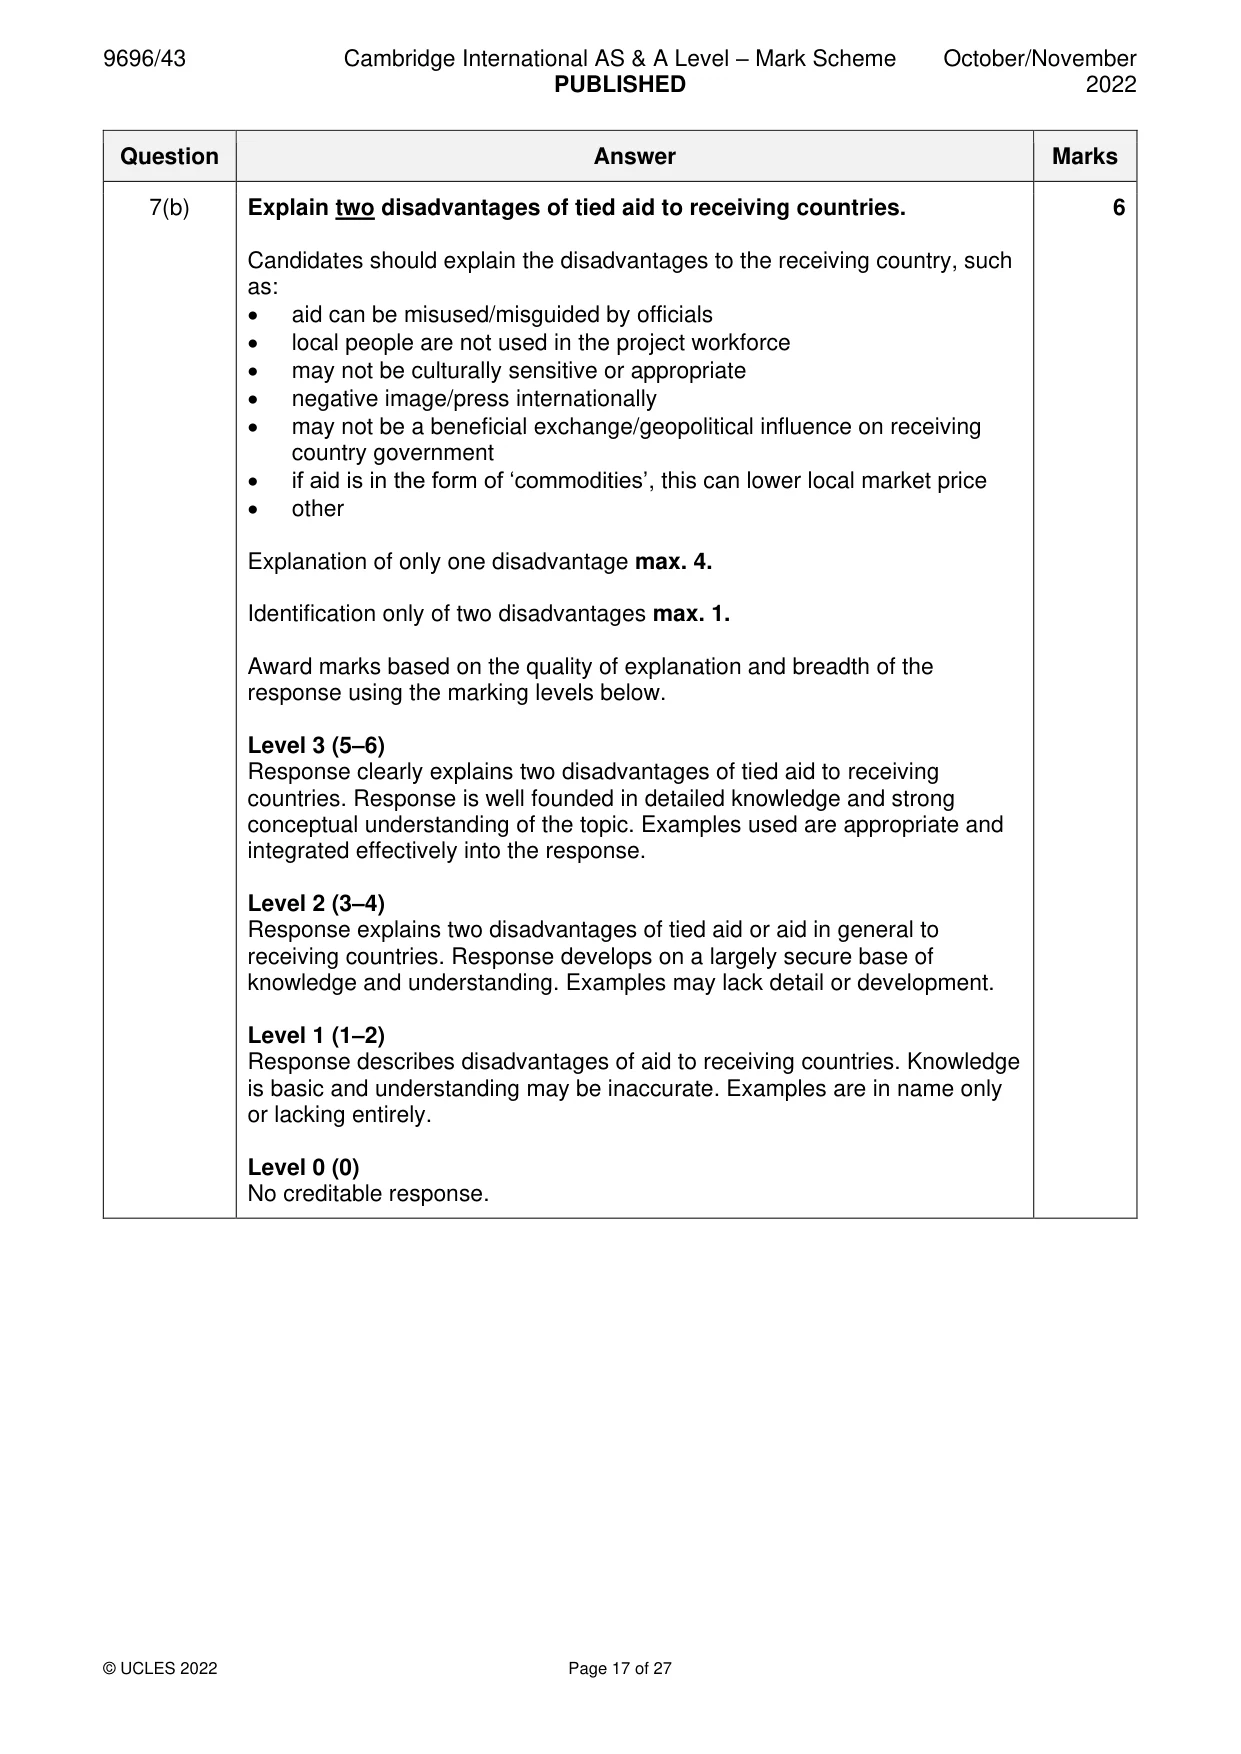
9696/43 Cambridge International AS & A Level – Mark Scheme PUBLISHED October/November 2022 © UCLES 2022 Page 17 of 27 Question Answer Marks 7(b) Explain two disadvantages of tied aid to receiving countries. Candidates should explain the disadvantages to the receiving country, such as: • aid can be misused/misguided by officials • local people are not used in the project workforce • may not be culturally sensitive or appropriate • negative image/press internationally • may not be a beneficial exchange/geopolitical influence on receiving country government • if aid is in the form of ‘commodities’, this can lower local market price • other Explanation of only one disadvantage max. 4. Identification only of two disadvantages max. 1. Award marks based on the quality of explanation and breadth of the response using the marking levels below. Level 3 (5–6) Response clearly explains two disadvantages of tied aid to receiving countries. Response is well founded in detailed knowledge and strong conceptual understanding of the topic. Examples used are appropriate and integrated effectively into the response. Level 2 (3–4) Response explains two disadvantages of tied aid or aid in general to receiving countries. Response develops on a largely secure base of knowledge and understanding. Examples may lack detail or development. Level 1 (1–2) Response describes disadvantages of aid to receiving countries. Knowledge is basic and understanding may be inaccurate. Examples are in name only or lacking entirely. Level 0 (0) No creditable response. 6
Mark scheme, page 18
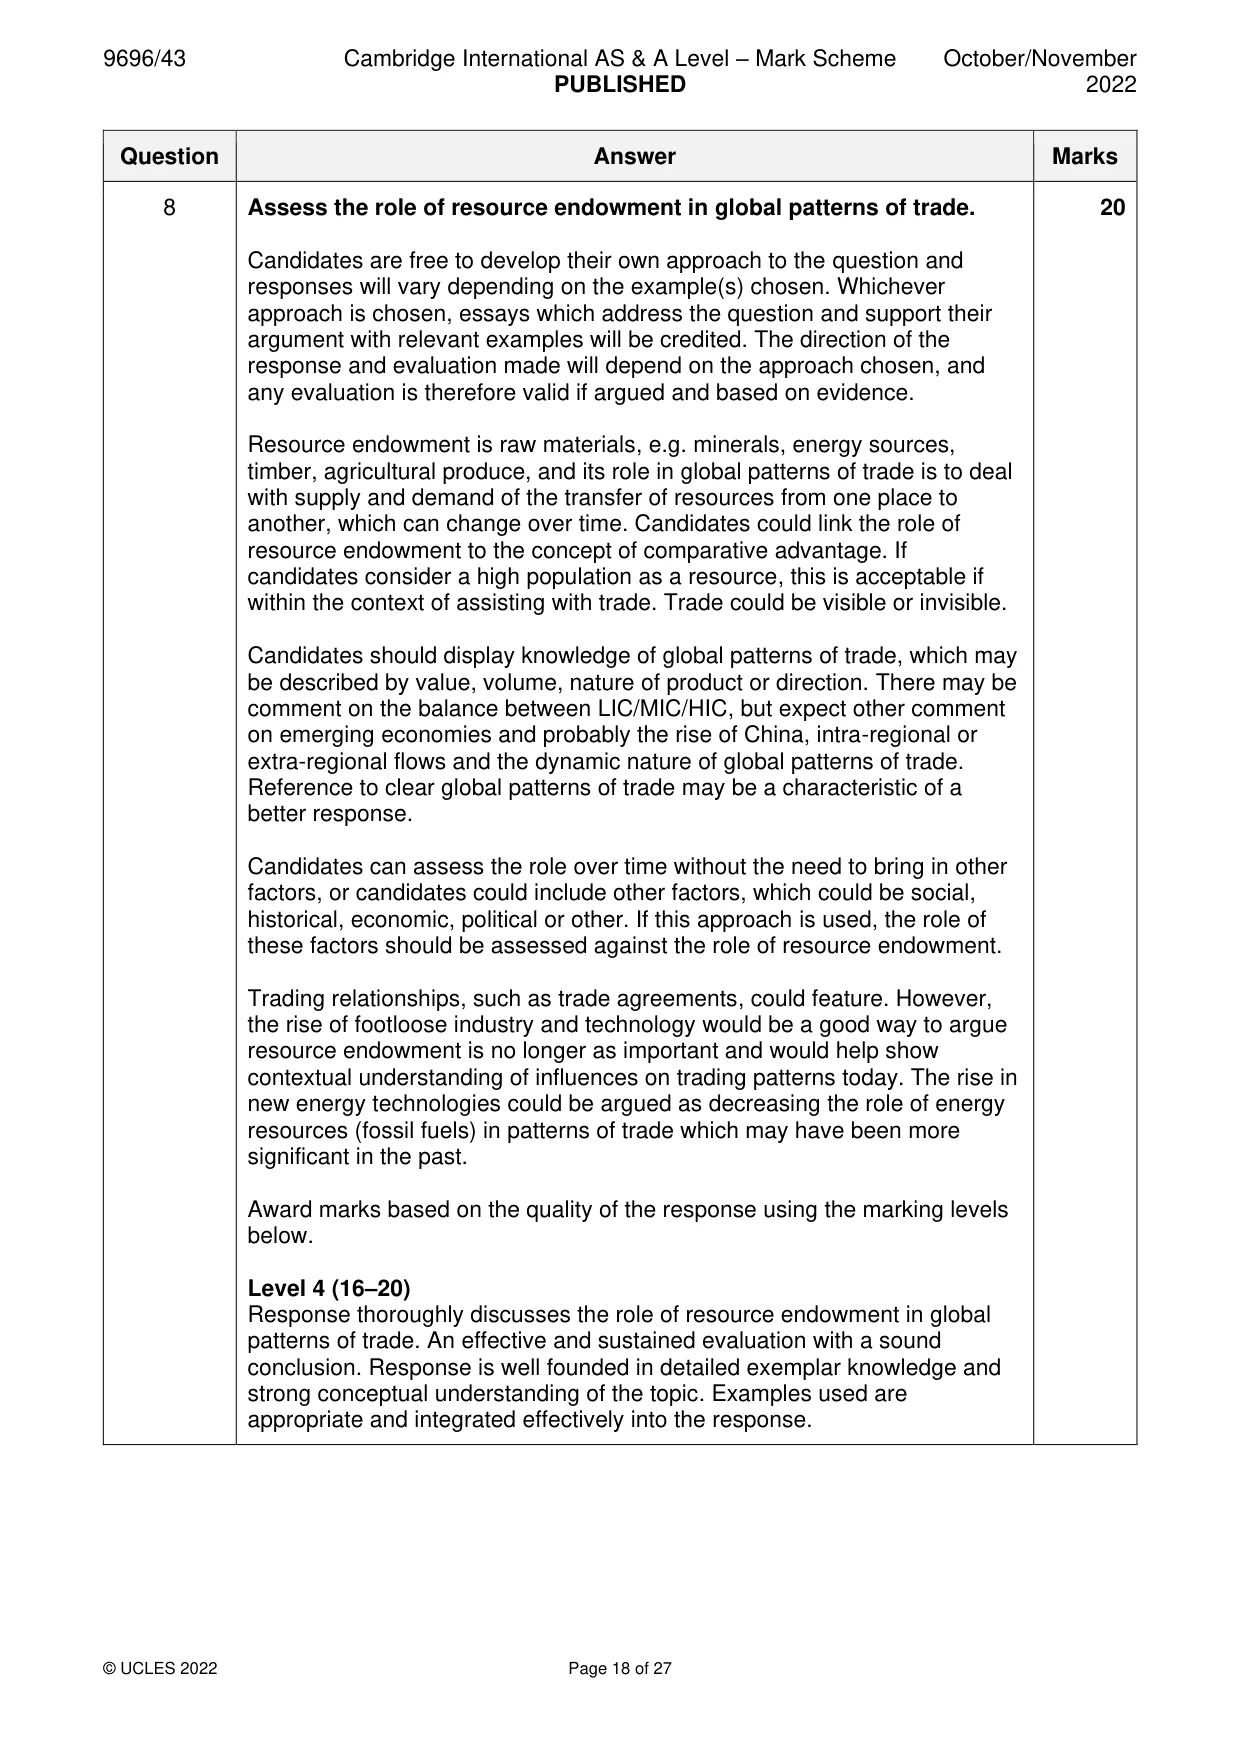
9696/43 Cambridge International AS & A Level – Mark Scheme PUBLISHED October/November 2022 © UCLES 2022 Page 18 of 27 Question Answer Marks 8 Assess the role of resource endowment in global patterns of trade. Candidates are free to develop their own approach to the question and responses will vary depending on the example(s) chosen. Whichever approach is chosen, essays which address the question and support their argument with relevant examples will be credited. The direction of the response and evaluation made will depend on the approach chosen, and any evaluation is therefore valid if argued and based on evidence. Resource endowment is raw materials, e.g. minerals, energy sources, timber, agricultural produce, and its role in global patterns of trade is to deal with supply and demand of the transfer of resources from one place to another, which can change over time. Candidates could link the role of resource endowment to the concept of comparative advantage. If candidates consider a high population as a resource, this is acceptable if within the context of assisting with trade. Trade could be visible or invisible. Candidates should display knowledge of global patterns of trade, which may be described by value, volume, nature of product or direction. There may be comment on the balance between LIC/MIC/HIC, but expect other comment on emerging economies and probably the rise of China, intra-regional or extra-regional flows and the dynamic nature of global patterns of trade. Reference to clear global patterns of trade may be a characteristic of a better response. Candidates can assess the role over time without the need to bring in other factors, or candidates could include other factors, which could be social, historical, economic, political or other. If this approach is used, the role of these factors should be assessed against the role of resource endowment. Trading relationships, such as trade agreements, could feature. However, the rise of footloose industry and technology would be a good way to argue resource endowment is no longer as important and would help show contextual understanding of influences on trading patterns today. The rise in new energy technologies could be argued as decreasing the role of energy resources (fossil fuels) in patterns of trade which may have been more significant in the past. Award marks based on the quality of the response using the marking levels below. Level 4 (16–20) Response thoroughly discusses the role of resource endowment in global patterns of trade. An effective and sustained evaluation with a sound conclusion. Response is well founded in detailed exemplar knowledge and strong conceptual understanding of the topic. Examples used are appropriate and integrated effectively into the response. 20
Mark scheme, page 19
9696/43 Cambridge International AS & A Level – Mark Scheme PUBLISHED October/November 2022 © UCLES 2022 Page 19 of 27 Question Answer Marks 8 Level 3 (11–15) Response discusses the role of resource endowment in global patterns of trade but may be unbalanced. Response is broadly evaluative in character, comprising some explanatory or narrative content and a conclusion. Response develops on a largely secure base of knowledge and understanding with the use of example(s). Level 2 (6–10) Response demonstrates some knowledge and understanding of the role of resource endowment in global patterns of trade. Response is mainly descriptive or explanatory in approach and contains a brief or thinly supported evaluation. Responses without the use of example(s) to support the response will not get above the middle of Level 2 (8 marks). Level 1 (1–5) Response makes a few general points about resource endowment or other factors that influence trade. A descriptive response comprising a few simple points. Knowledge is basic and understanding may be poor and lack relevance to the question set. Level 0 (0) No creditable response.
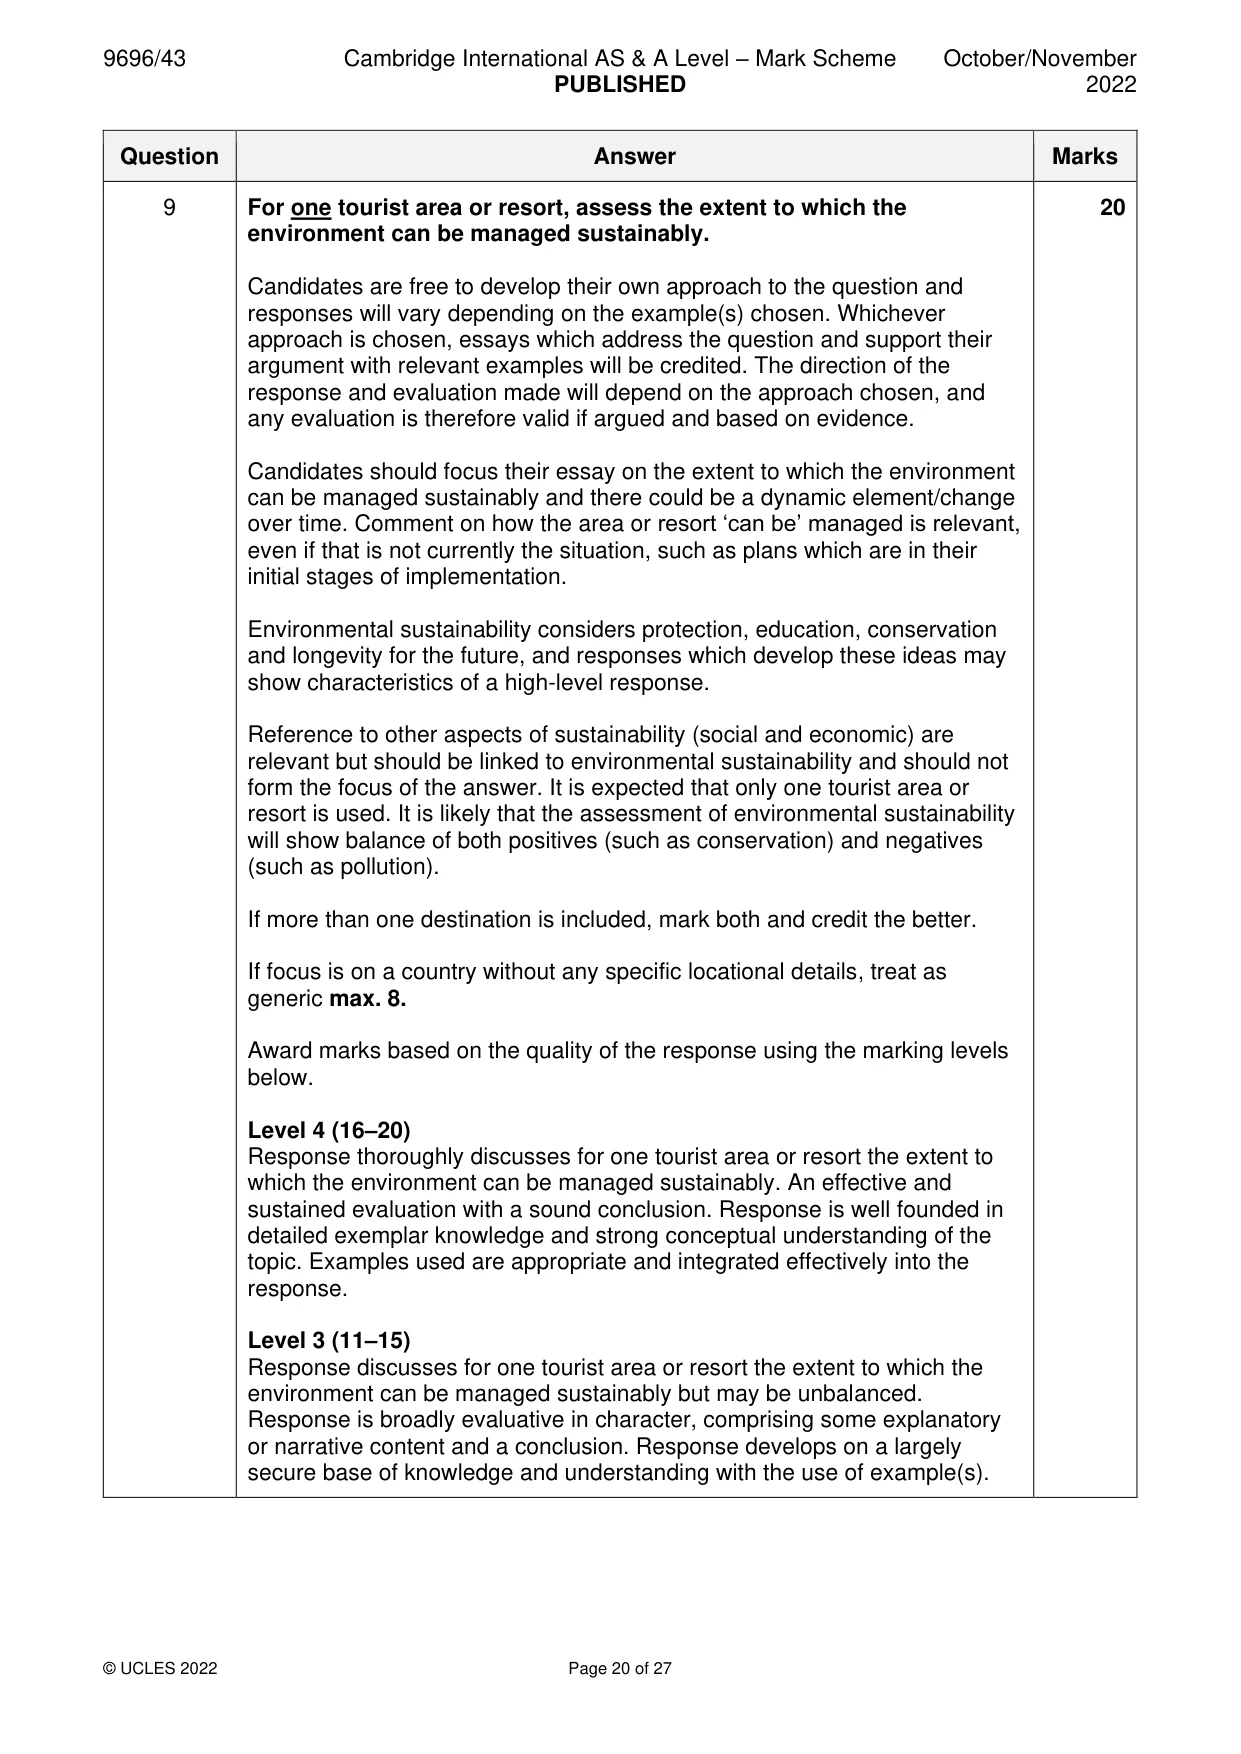
Mark scheme, page 20
9696/43 Cambridge International AS & A Level – Mark Scheme PUBLISHED October/November 2022 © UCLES 2022 Page 20 of 27 Question Answer Marks 9 For one tourist area or resort, assess the extent to which the environment can be managed sustainably. Candidates are free to develop their own approach to the question and responses will vary depending on the example(s) chosen. Whichever approach is chosen, essays which address the question and support their argument with relevant examples will be credited. The direction of the response and evaluation made will depend on the approach chosen, and any evaluation is therefore valid if argued and based on evidence. Candidates should focus their essay on the extent to which the environment can be managed sustainably and there could be a dynamic element/change over time. Comment on how the area or resort ‘can be’ managed is relevant, even if that is not currently the situation, such as plans which are in their initial stages of implementation. Environmental sustainability considers protection, education, conservation and longevity for the future, and responses which develop these ideas may show characteristics of a high-level response. Reference to other aspects of sustainability (social and economic) are relevant but should be linked to environmental sustainability and should not form the focus of the answer. It is expected that only one tourist area or resort is used. It is likely that the assessment of environmental sustainability will show balance of both positives (such as conservation) and negatives (such as pollution). If more than one destination is included, mark both and credit the better. If focus is on a country without any specific locational details, treat as generic max. 8. Award marks based on the quality of the response using the marking levels below. Level 4 (16–20) Response thoroughly discusses for one tourist area or resort the extent to which the environment can be managed sustainably. An effective and sustained evaluation with a sound conclusion. Response is well founded in detailed exemplar knowledge and strong conceptual understanding of the topic. Examples used are appropriate and integrated effectively into the response. Level 3 (11–15) Response discusses for one tourist area or resort the extent to which the environment can be managed sustainably but may be unbalanced. Response is broadly evaluative in character, comprising some explanatory or narrative content and a conclusion. Response develops on a largely secure base of knowledge and understanding with the use of example(s). 20
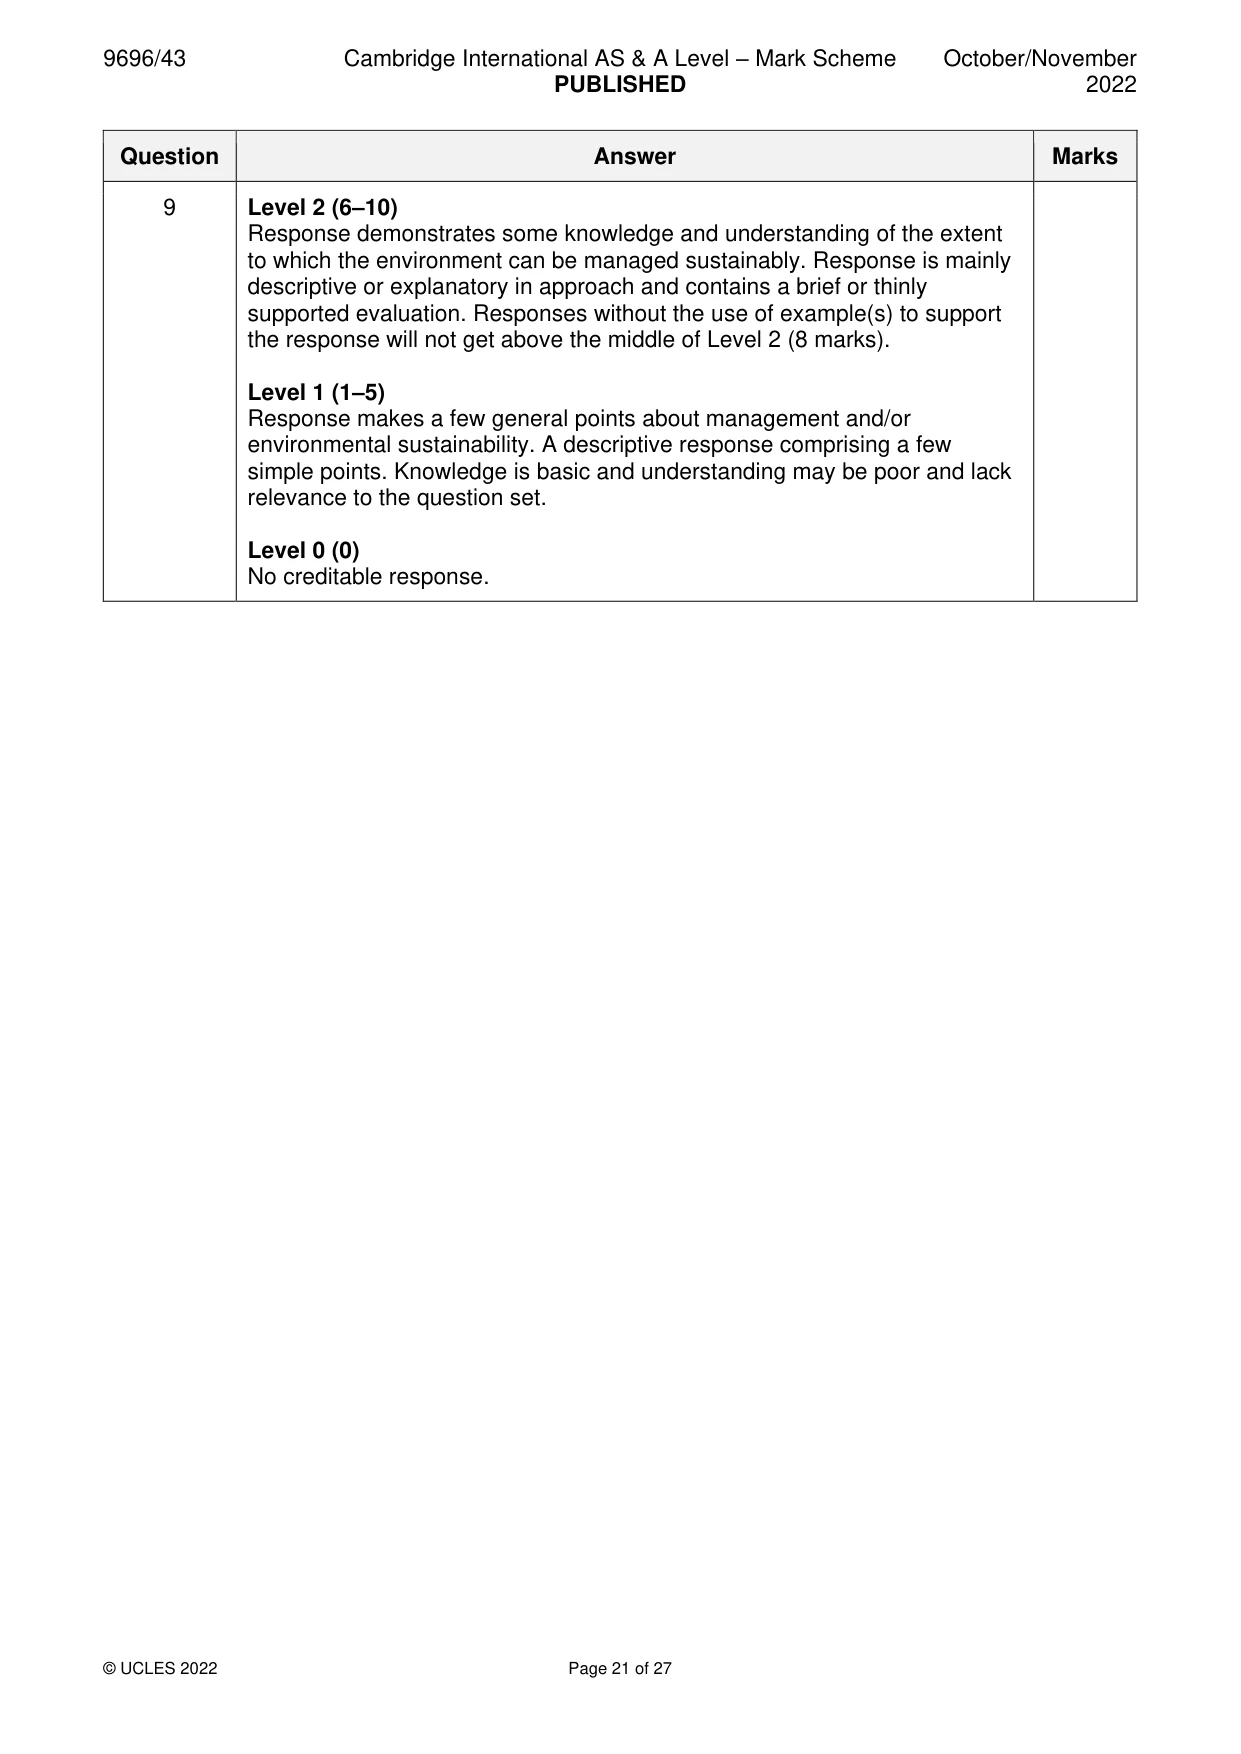
Mark scheme, page 21
9696/43 Cambridge International AS & A Level – Mark Scheme PUBLISHED October/November 2022 © UCLES 2022 Page 21 of 27 Question Answer Marks 9 Level 2 (6–10) Response demonstrates some knowledge and understanding of the extent to which the environment can be managed sustainably. Response is mainly descriptive or explanatory in approach and contains a brief or thinly supported evaluation. Responses without the use of example(s) to support the response will not get above the middle of Level 2 (8 marks). Level 1 (1–5) Response makes a few general points about management and/or environmental sustainability. A descriptive response comprising a few simple points. Knowledge is basic and understanding may be poor and lack relevance to the question set. Level 0 (0) No creditable response.
Mark scheme, page 22
9696/43 Cambridge International AS & A Level – Mark Scheme PUBLISHED October/November 2022 © UCLES 2022 Page 22 of 27 Economic transition If answering this option, answer Question 10 and either Question 11 or Question 12. Question Answer Marks 10(a) Fig. 10.1 is a photograph which shows a disused factory and new apartments in an area of Manchester, UK, an HIC in Europe. Suggest how Fig. 10.1 shows evidence for the impact of globalisation of economic activity. Candidates should use Fig. 10.1 to provide evidence for the globalisation of economic activity. Candidates cannot use the expression ‘disused’ or ‘new’ but alternative phrases can be acceptable. Evidence from the photograph should be used and developed to illustrate aspects of economic restructuring: • abandoned/derelict/empty factory buildings (1) suggest de- industrialisation in this area (1) • there are modern/recently built apartments in the background (1) which indicate a shift from secondary industry to residential land use (1) • the vegetation is overgrown and unmanaged (1) indicating that some of the area is in industrial decline (1) • the canal appears to have changed its main function (1), suggesting that it is no longer in use for transport of goods; there is now a cycleway or footpath (1) • other relevant suggestion linked to Fig. 10.1 3
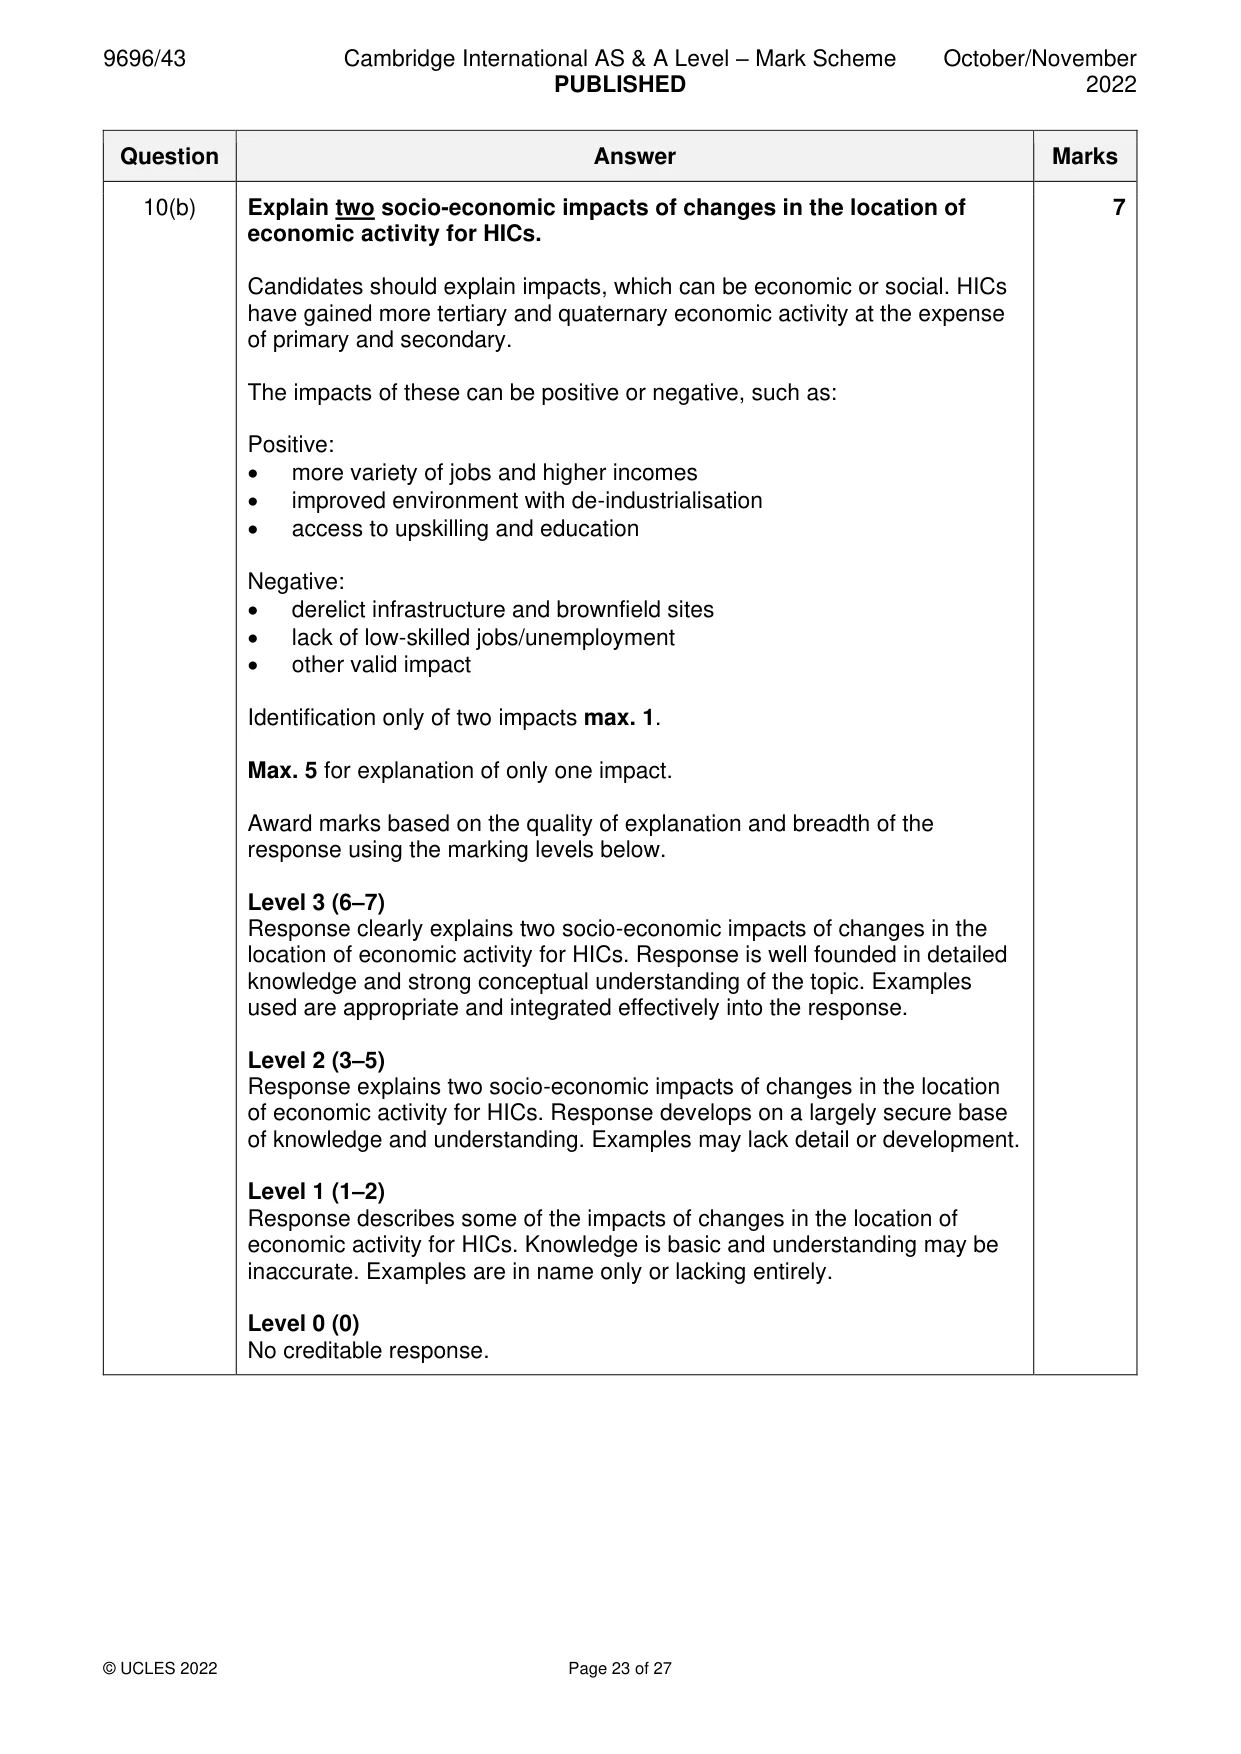
Mark scheme, page 23
9696/43 Cambridge International AS & A Level – Mark Scheme PUBLISHED October/November 2022 © UCLES 2022 Page 23 of 27 Question Answer Marks 10(b) Explain two socio-economic impacts of changes in the location of economic activity for HICs. Candidates should explain impacts, which can be economic or social. HICs have gained more tertiary and quaternary economic activity at the expense of primary and secondary. The impacts of these can be positive or negative, such as: Positive: • more variety of jobs and higher incomes • improved environment with de-industrialisation • access to upskilling and education Negative: • derelict infrastructure and brownfield sites • lack of low-skilled jobs/unemployment • other valid impact Identification only of two impacts max. 1. Max. 5 for explanation of only one impact. Award marks based on the quality of explanation and breadth of the response using the marking levels below. Level 3 (6–7) Response clearly explains two socio-economic impacts of changes in the location of economic activity for HICs. Response is well founded in detailed knowledge and strong conceptual understanding of the topic. Examples used are appropriate and integrated effectively into the response. Level 2 (3–5) Response explains two socio-economic impacts of changes in the location of economic activity for HICs. Response develops on a largely secure base of knowledge and understanding. Examples may lack detail or development. Level 1 (1–2) Response describes some of the impacts of changes in the location of economic activity for HICs. Knowledge is basic and understanding may be inaccurate. Examples are in name only or lacking entirely. Level 0 (0) No creditable response. 7
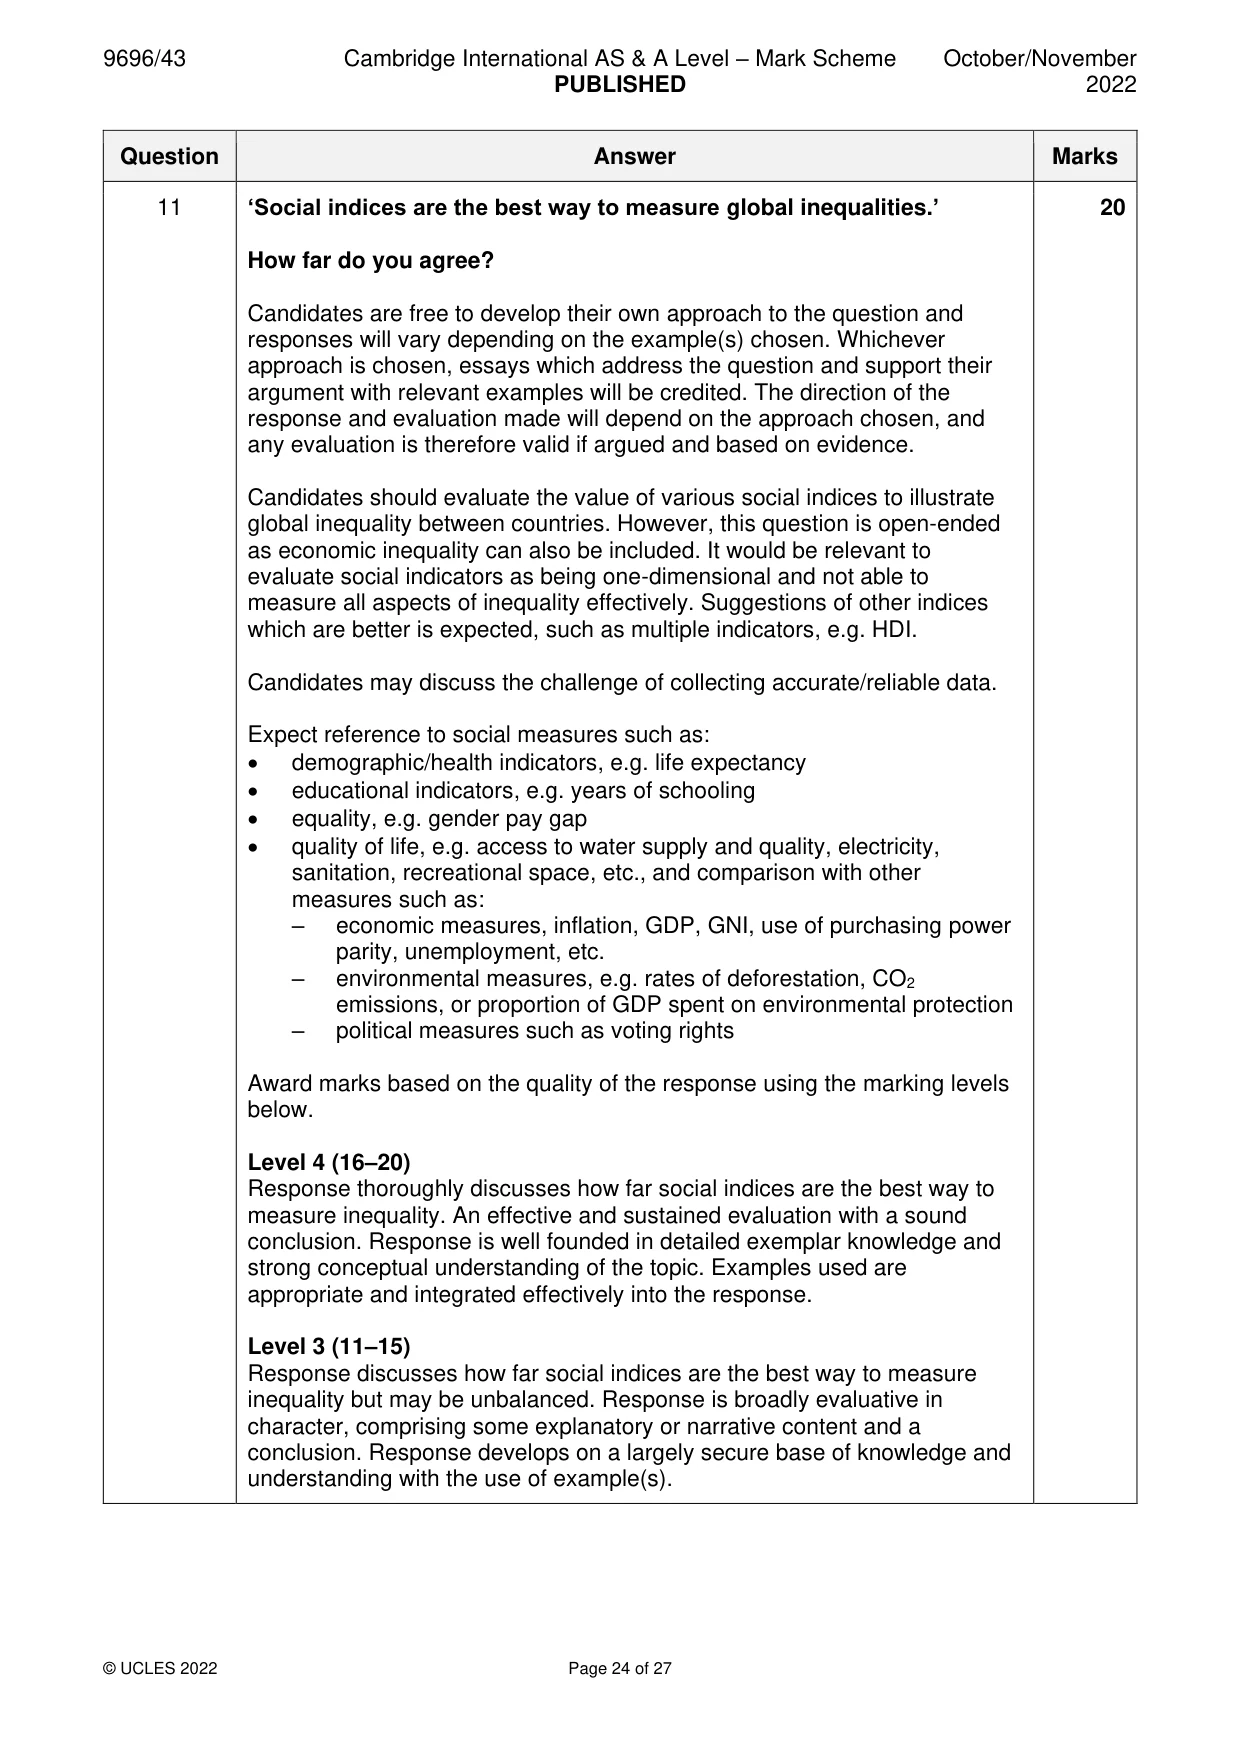
Mark scheme, page 24
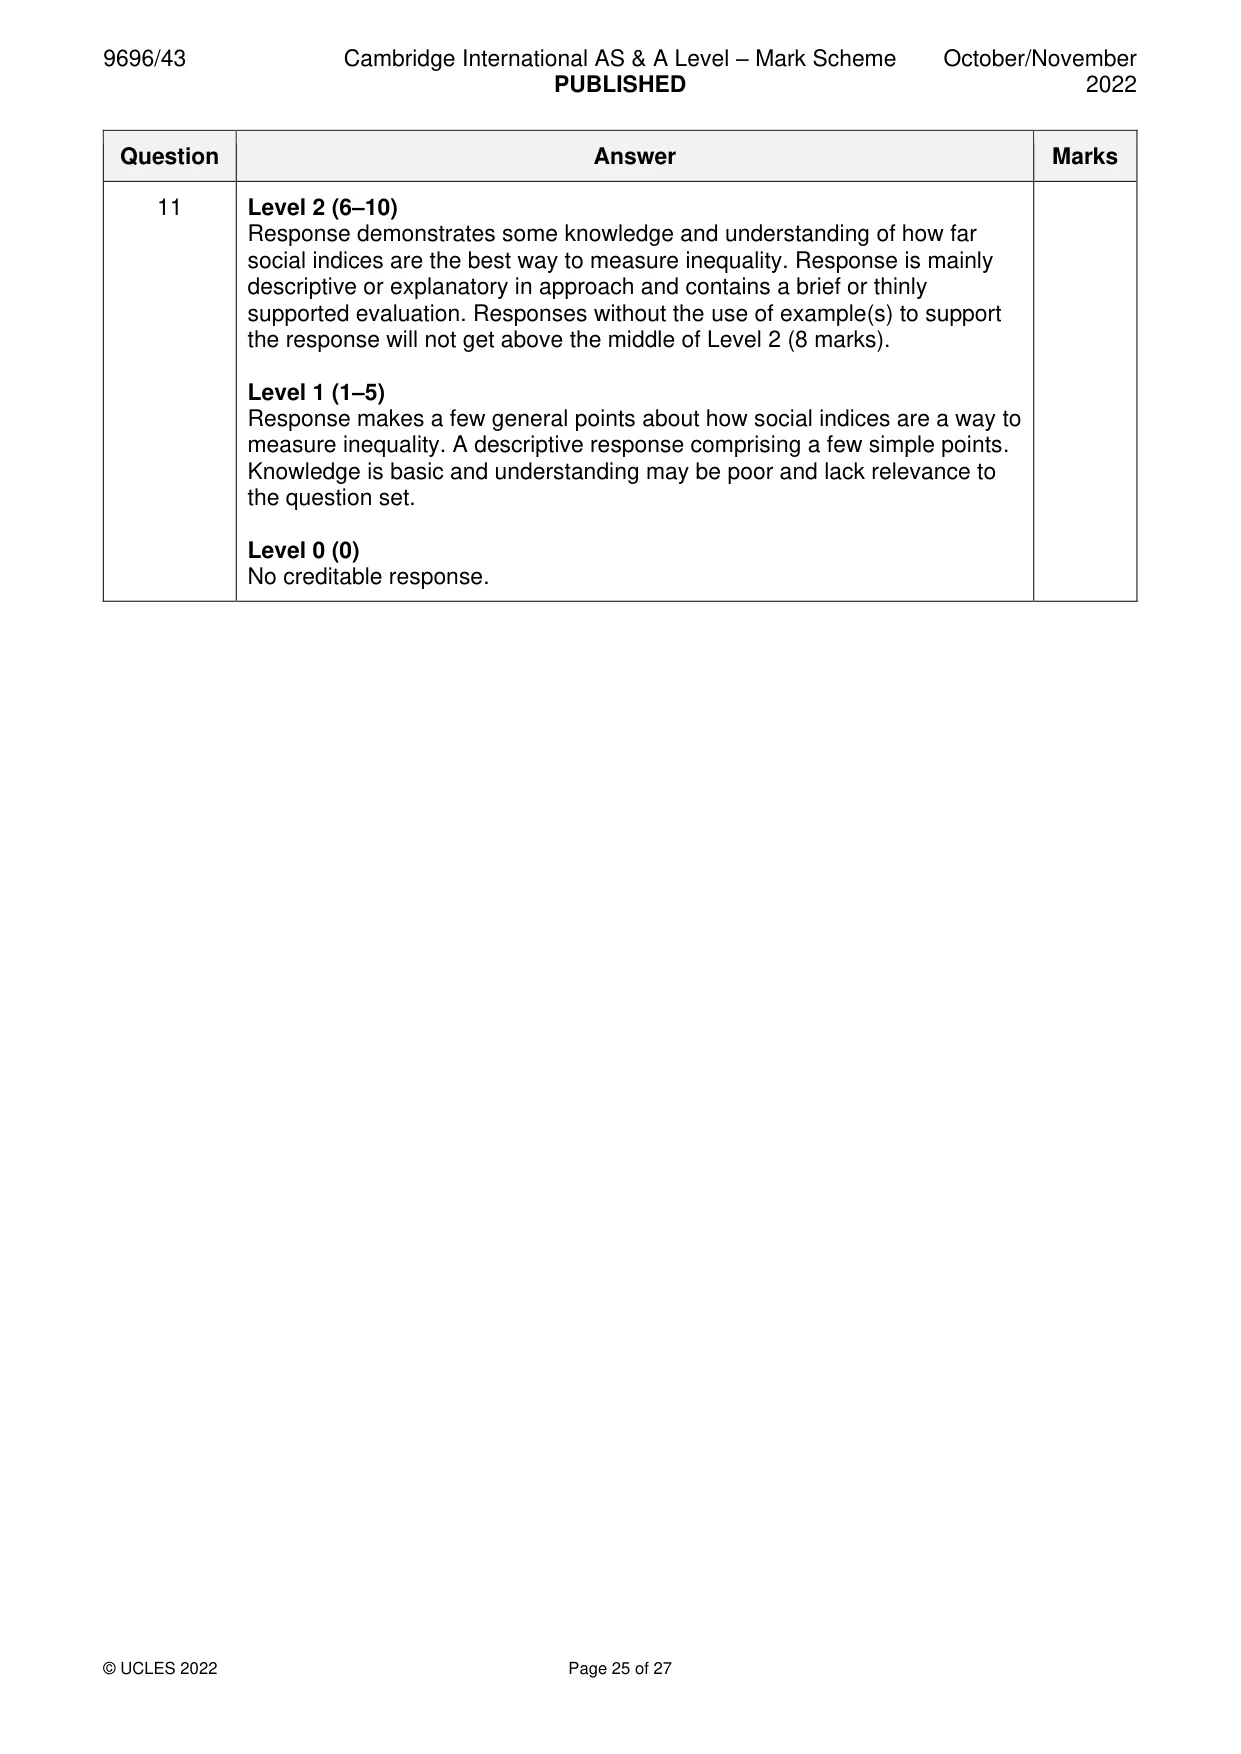
9696/43 Cambridge International AS & A Level – Mark Scheme PUBLISHED October/November 2022 © UCLES 2022 Page 24 of 27 Question Answer Marks 11 ‘Social indices are the best way to measure global inequalities.’ How far do you agree? Candidates are free to develop their own approach to the question and responses will vary depending on the example(s) chosen. Whichever approach is chosen, essays which address the question and support their argument with relevant examples will be credited. The direction of the response and evaluation made will depend on the approach chosen, and any evaluation is therefore valid if argued and based on evidence. Candidates should evaluate the value of various social indices to illustrate global inequality between countries. However, this question is open-ended as economic inequality can also be included. It would be relevant to evaluate social indicators as being one-dimensional and not able to measure all aspects of inequality effectively. Suggestions of other indices which are better is expected, such as multiple indicators, e.g. HDI. Candidates may discuss the challenge of collecting accurate/reliable data. Expect reference to social measures such as: • demographic/health indicators, e.g. life expectancy • educational indicators, e.g. years of schooling • equality, e.g. gender pay gap • quality of life, e.g. access to water supply and quality, electricity, sanitation, recreational space, etc., and comparison with other measures such as: – economic measures, inflation, GDP, GNI, use of purchasing power parity, unemployment, etc. – environmental measures, e.g. rates of deforestation, CO2 emissions, or proportion of GDP spent on environmental protection – political measures such as voting rights Award marks based on the quality of the response using the marking levels below. Level 4 (16–20) Response thoroughly discusses how far social indices are the best way to measure inequality. An effective and sustained evaluation with a sound conclusion. Response is well founded in detailed exemplar knowledge and strong conceptual understanding of the topic. Examples used are appropriate and integrated effectively into the response. Level 3 (11–15) Response discusses how far social indices are the best way to measure inequality but may be unbalanced. Response is broadly evaluative in character, comprising some explanatory or narrative content and a conclusion. Response develops on a largely secure base of knowledge and understanding with the use of example(s). 20
Mark scheme, page 25
9696/43 Cambridge International AS & A Level – Mark Scheme PUBLISHED October/November 2022 © UCLES 2022 Page 25 of 27 Question Answer Marks 11 Level 2 (6–10) Response demonstrates some knowledge and understanding of how far social indices are the best way to measure inequality. Response is mainly descriptive or explanatory in approach and contains a brief or thinly supported evaluation. Responses without the use of example(s) to support the response will not get above the middle of Level 2 (8 marks). Level 1 (1–5) Response makes a few general points about how social indices are a way to measure inequality. A descriptive response comprising a few simple points. Knowledge is basic and understanding may be poor and lack relevance to the question set. Level 0 (0) No creditable response.
Mark scheme, page 26
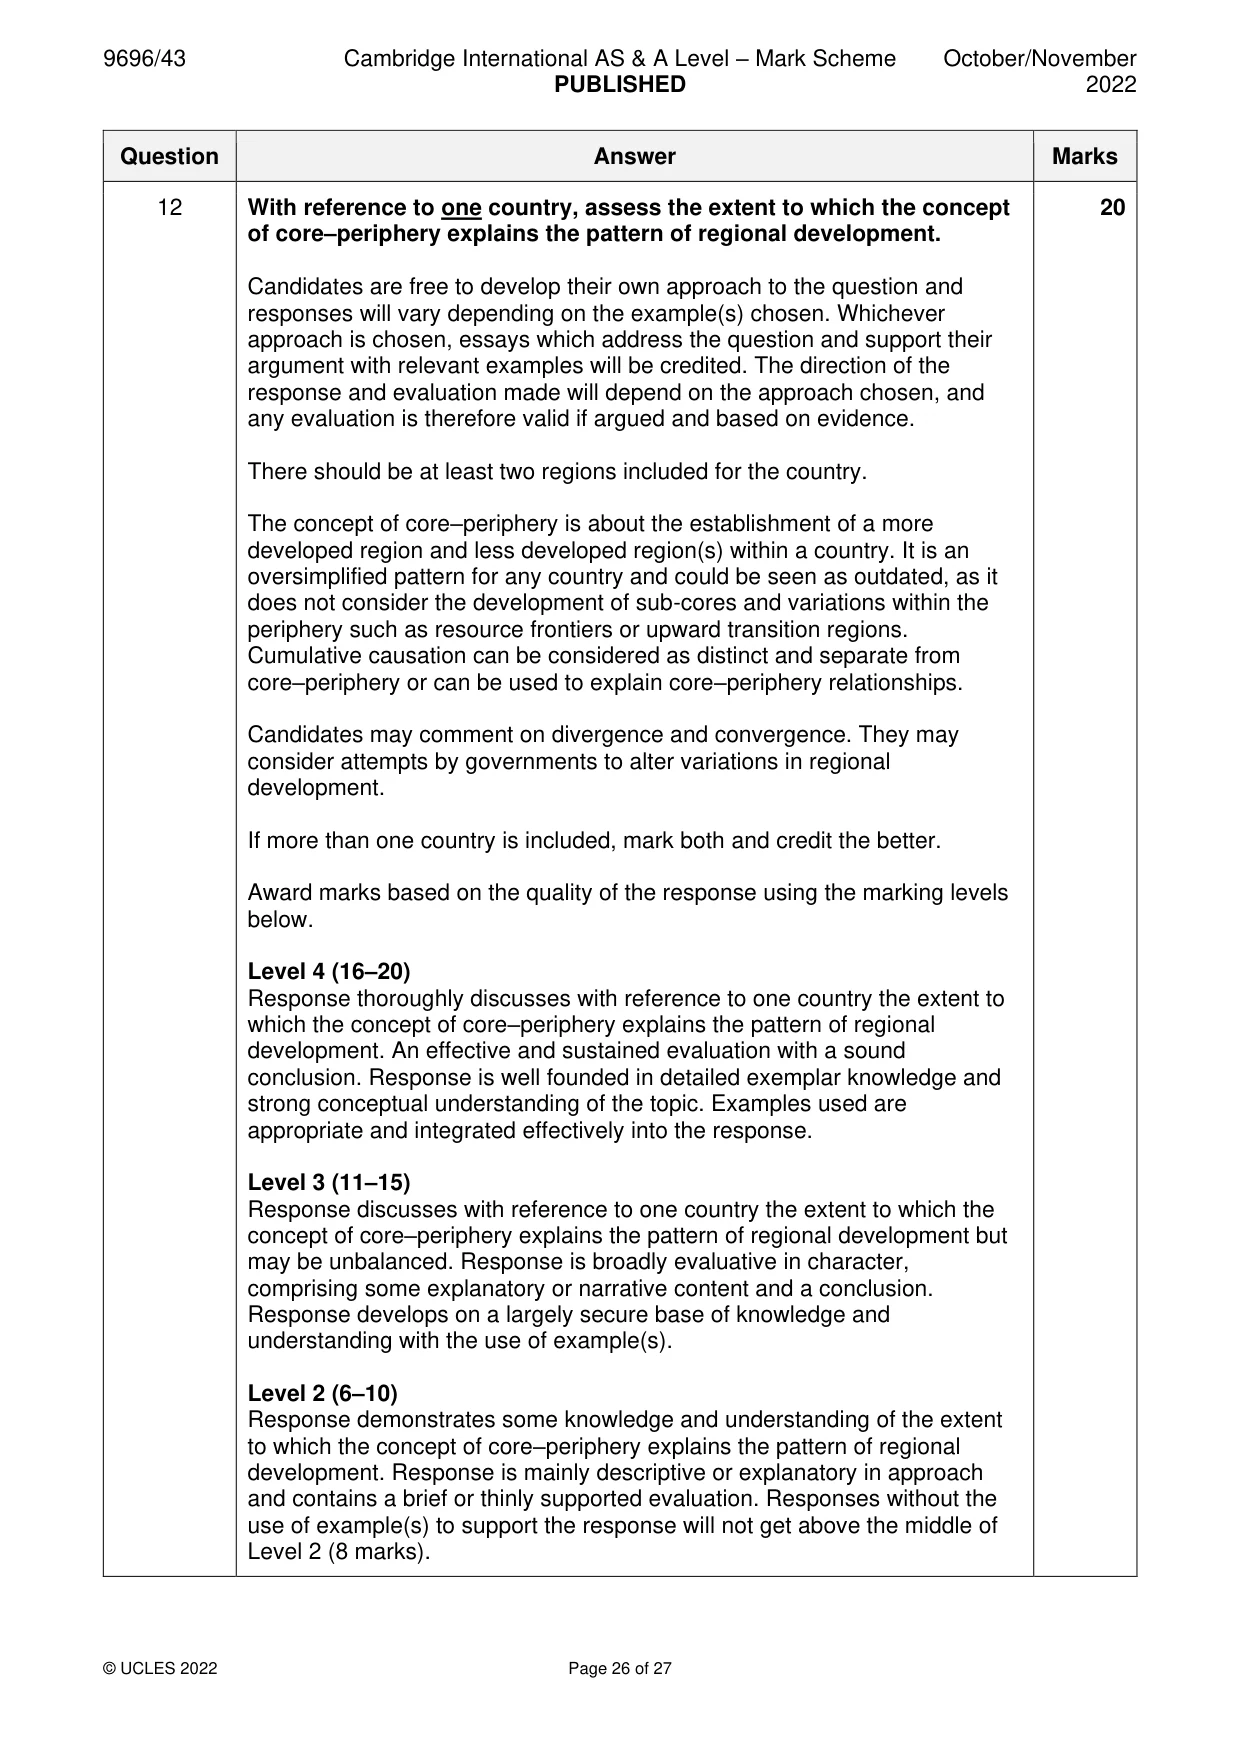
9696/43 Cambridge International AS & A Level – Mark Scheme PUBLISHED October/November 2022 © UCLES 2022 Page 26 of 27 Question Answer Marks 12 With reference to one country, assess the extent to which the concept of core–periphery explains the pattern of regional development. Candidates are free to develop their own approach to the question and responses will vary depending on the example(s) chosen. Whichever approach is chosen, essays which address the question and support their argument with relevant examples will be credited. The direction of the response and evaluation made will depend on the approach chosen, and any evaluation is therefore valid if argued and based on evidence. There should be at least two regions included for the country. The concept of core–periphery is about the establishment of a more developed region and less developed region(s) within a country. It is an oversimplified pattern for any country and could be seen as outdated, as it does not consider the development of sub-cores and variations within the periphery such as resource frontiers or upward transition regions. Cumulative causation can be considered as distinct and separate from core–periphery or can be used to explain core–periphery relationships. Candidates may comment on divergence and convergence. They may consider attempts by governments to alter variations in regional development. If more than one country is included, mark both and credit the better. Award marks based on the quality of the response using the marking levels below. Level 4 (16–20) Response thoroughly discusses with reference to one country the extent to which the concept of core–periphery explains the pattern of regional development. An effective and sustained evaluation with a sound conclusion. Response is well founded in detailed exemplar knowledge and strong conceptual understanding of the topic. Examples used are appropriate and integrated effectively into the response. Level 3 (11–15) Response discusses with reference to one country the extent to which the concept of core–periphery explains the pattern of regional development but may be unbalanced. Response is broadly evaluative in character, comprising some explanatory or narrative content and a conclusion. Response develops on a largely secure base of knowledge and understanding with the use of example(s). Level 2 (6–10) Response demonstrates some knowledge and understanding of the extent to which the concept of core–periphery explains the pattern of regional development. Response is mainly descriptive or explanatory in approach and contains a brief or thinly supported evaluation. Responses without the use of example(s) to support the response will not get above the middle of Level 2 (8 marks). 20
Mark scheme, page 27
9696/43 Cambridge International AS & A Level – Mark Scheme PUBLISHED October/November 2022 © UCLES 2022 Page 27 of 27 Question Answer Marks 12 Level 1 (1–5) Response makes a few general points about the concept of core–periphery and/or patterns of regional development. A descriptive response comprising a few simple points. Knowledge is basic and understanding may be poor and lack relevance to the question set. Level 0 (0) No creditable response.
What you needed in this session
Cambridge’s own grade thresholds for 2022 Oct/Nov, Paper 4 · Variant 3. A higher threshold means an easier paper — the bar moves with how the cohort did.