Cambridge A Level Geography 9696 — 2021 Oct/Nov Paper 1 · Variant 3
9696/13/O/N/21 · 60 marks · ≈68 min
The question paper and its mark scheme, free to read here and free to download. This is Cambridge’s own paper, exactly as it was sat.
Question paper4 pages
Mark scheme15 pages
Answers below. Sit the paper first if you are practising.
Paper as text
Question paper, page 1
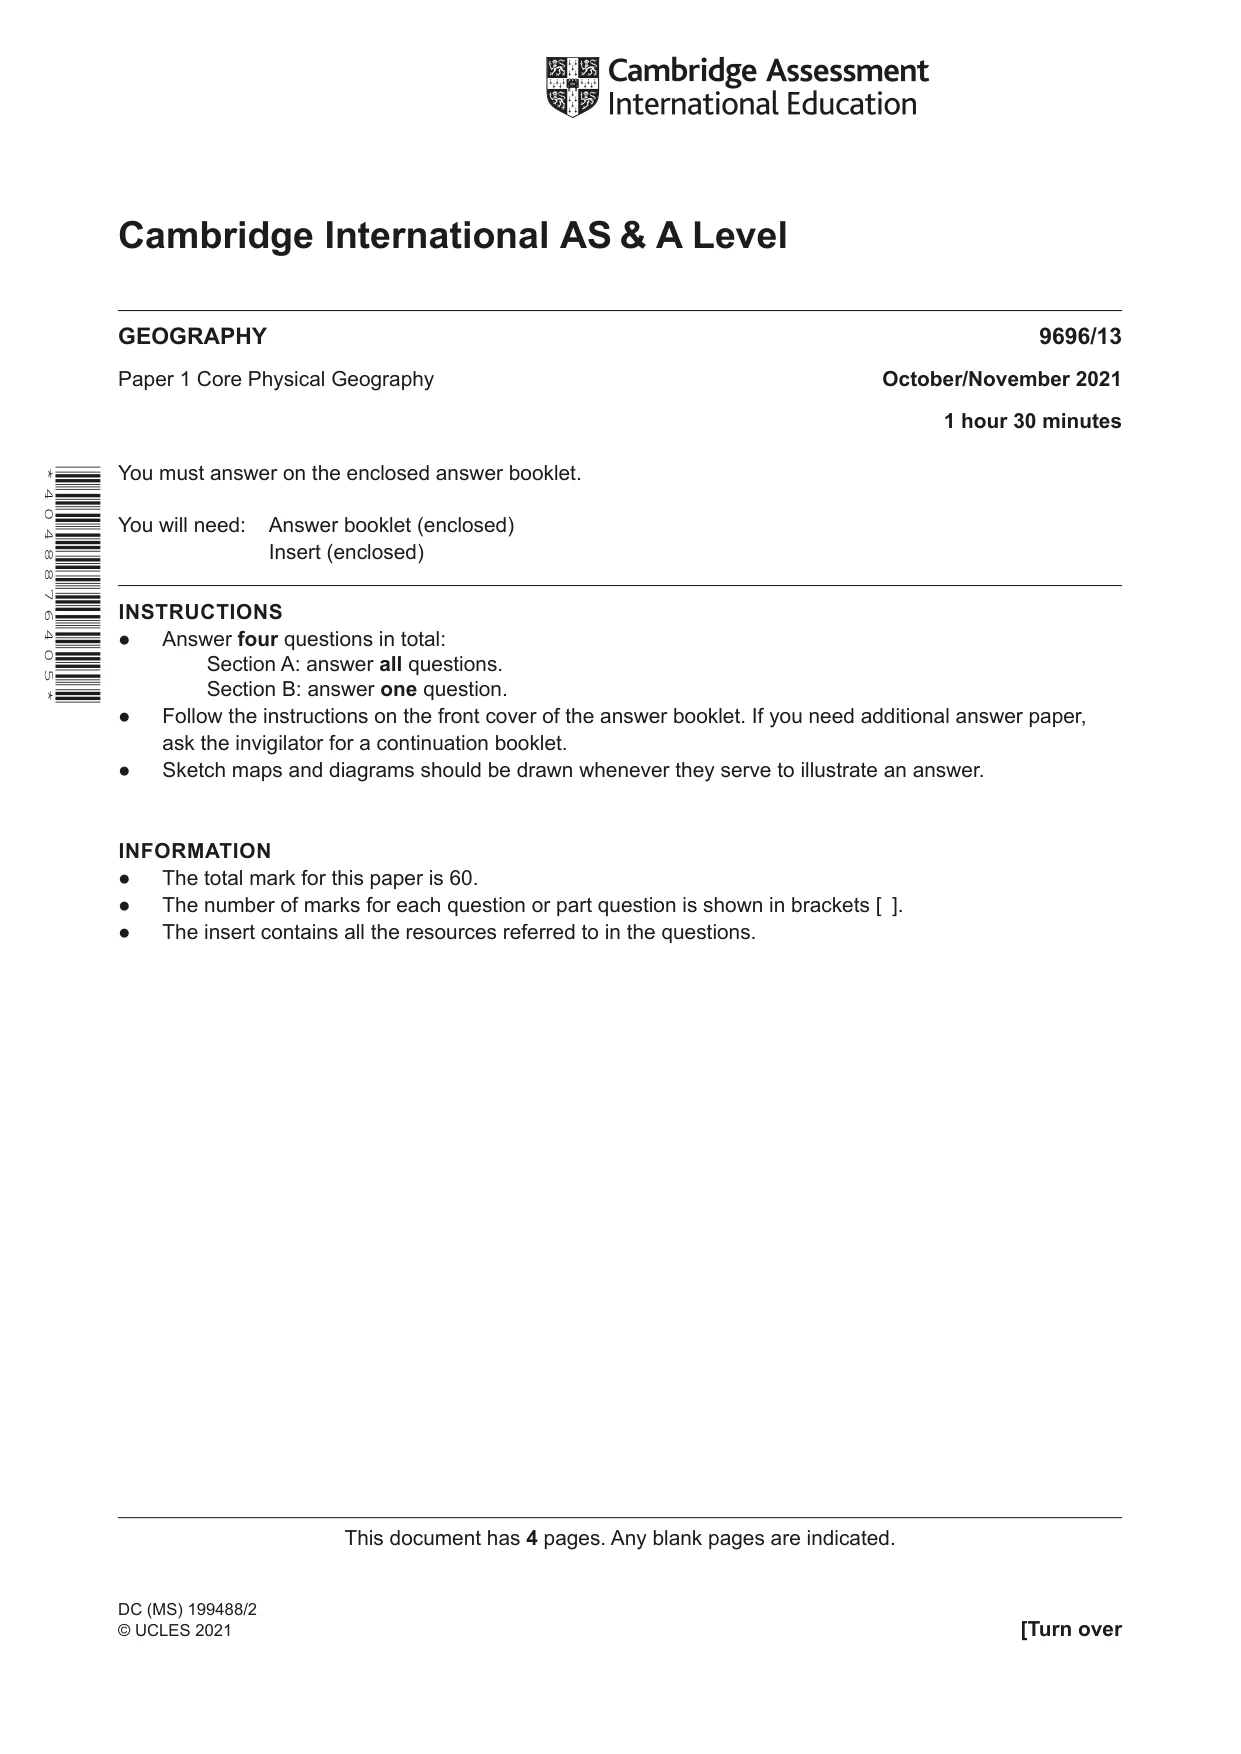
This document has 4 pages. Any blank pages are indicated. Cambridge International AS & A Level * 4 0 4 8 8 7 6 4 0 5 * DC (MS) 199488/2 © UCLES 2021 [Turn over GEOGRAPHY 9696/13 Paper 1 Core Physical Geography October/November 2021 1 hour 30 minutes You must answer on the enclosed answer booklet. You will need: Answer booklet (enclosed) Insert (enclosed) INSTRUCTIONS ● Answer four questions in total: Section A: answer all questions. Section B: answer one question. ● Follow the instructions on the front cover of the answer booklet. If you need additional answer paper, ask the invigilator for a continuation booklet. ● Sketch maps and diagrams should be drawn whenever they serve to illustrate an answer. INFORMATION ● The total mark for this paper is 60. ● The number of marks for each question or part question is shown in brackets [ ]. ● The insert contains all the resources referred to in the questions.
Question paper, page 2
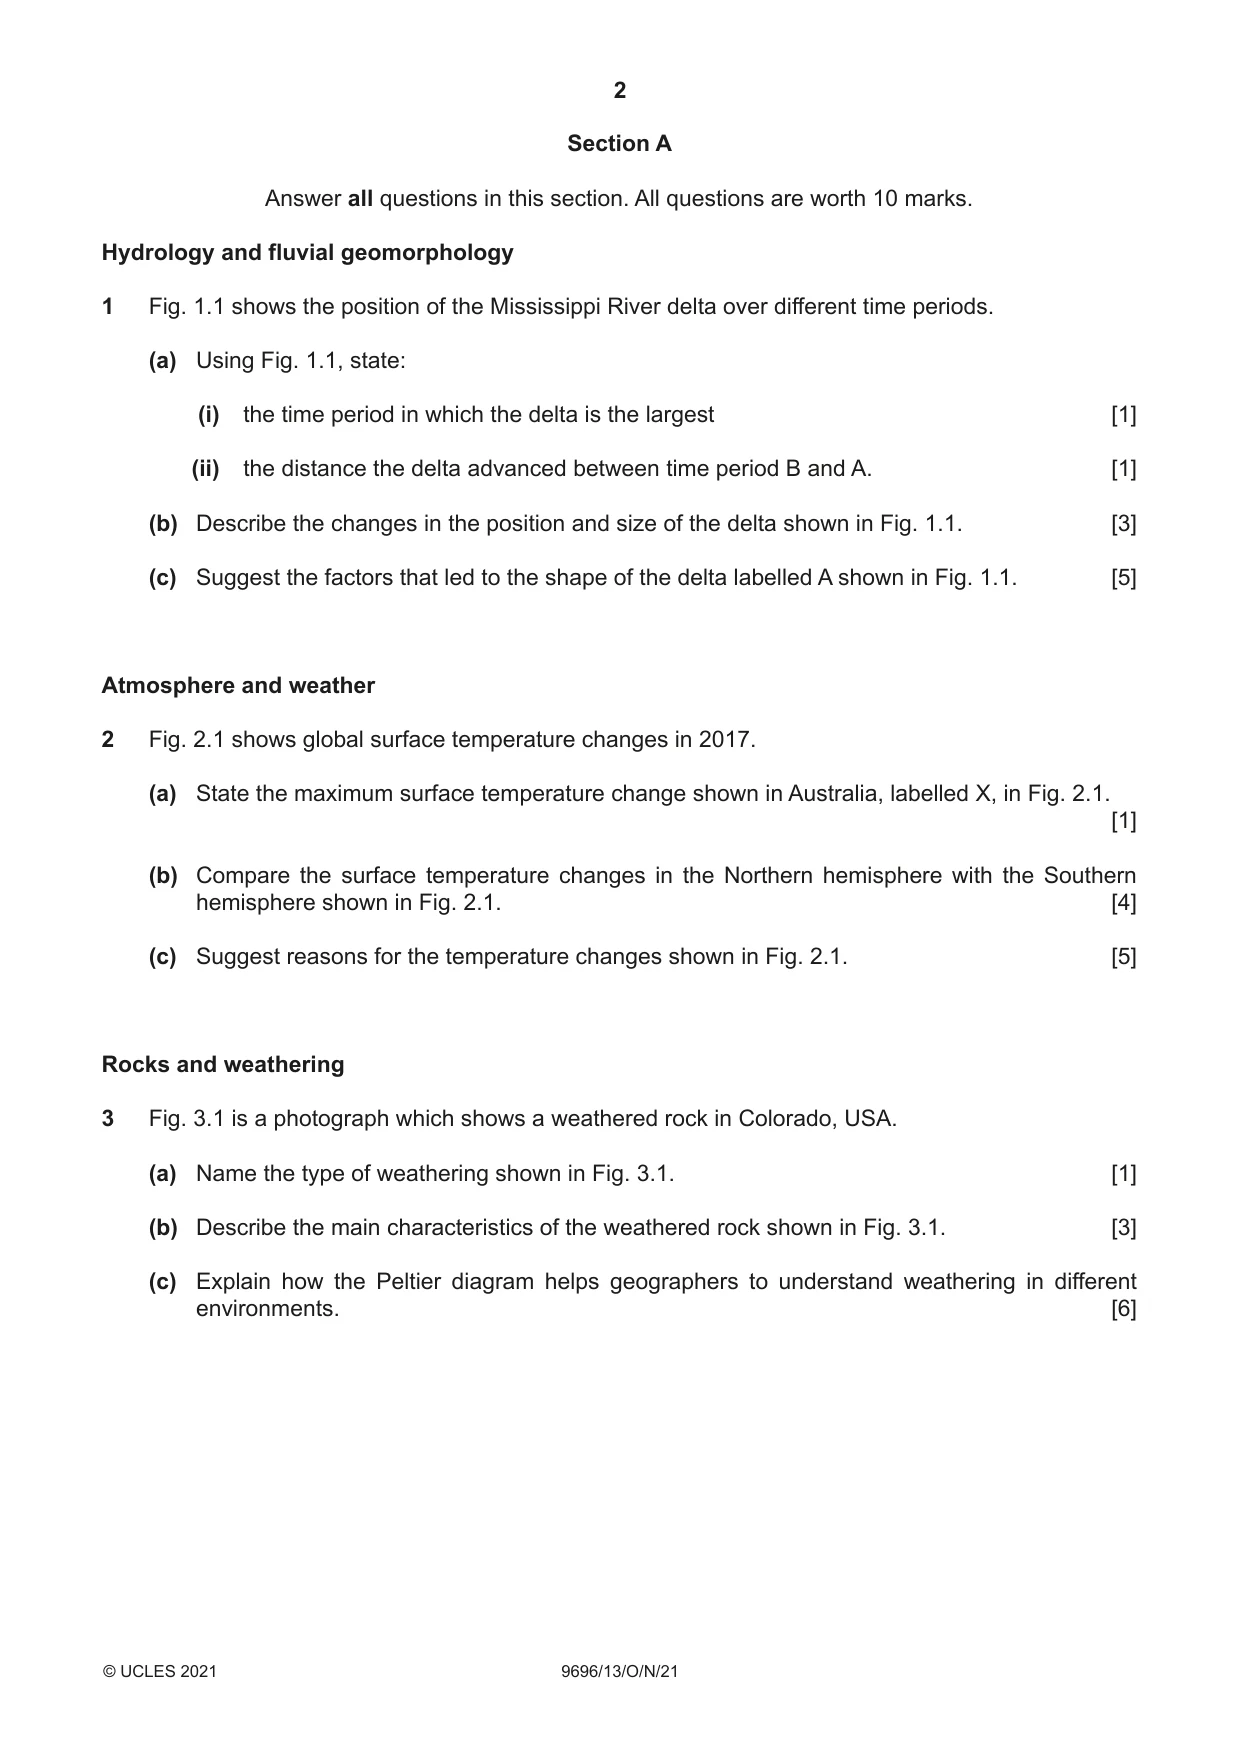
2 9696/13/O/N/21 © UCLES 2021 Section A Answer all questions in this section. All questions are worth 10 marks. Hydrology and fluvial geomorphology 1 Fig. 1.1 shows the position of the Mississippi River delta over different time periods. (a) Using Fig. 1.1, state: (i) the time period in which the delta is the largest [1] (ii) the distance the delta advanced between time period B and A. [1] (b) Describe the changes in the position and size of the delta shown in Fig. 1.1. [3] (c) Suggest the factors that led to the shape of the delta labelled A shown in Fig. 1.1. [5] Atmosphere and weather 2 Fig. 2.1 shows global surface temperature changes in 2017. (a) State the maximum surface temperature change shown in Australia, labelled X, in Fig. 2.1. [1] (b) Compare the surface temperature changes in the Northern hemisphere with the Southern hemisphere shown in Fig. 2.1. [4] (c) Suggest reasons for the temperature changes shown in Fig. 2.1. [5] Rocks and weathering 3 Fig. 3.1 is a photograph which shows a weathered rock in Colorado, USA. (a) Name the type of weathering shown in Fig. 3.1. [1] (b) Describe the main characteristics of the weathered rock shown in Fig. 3.1. [3] (c) Explain how the Peltier diagram helps geographers to understand weathering in different environments. [6]
Question paper, page 3
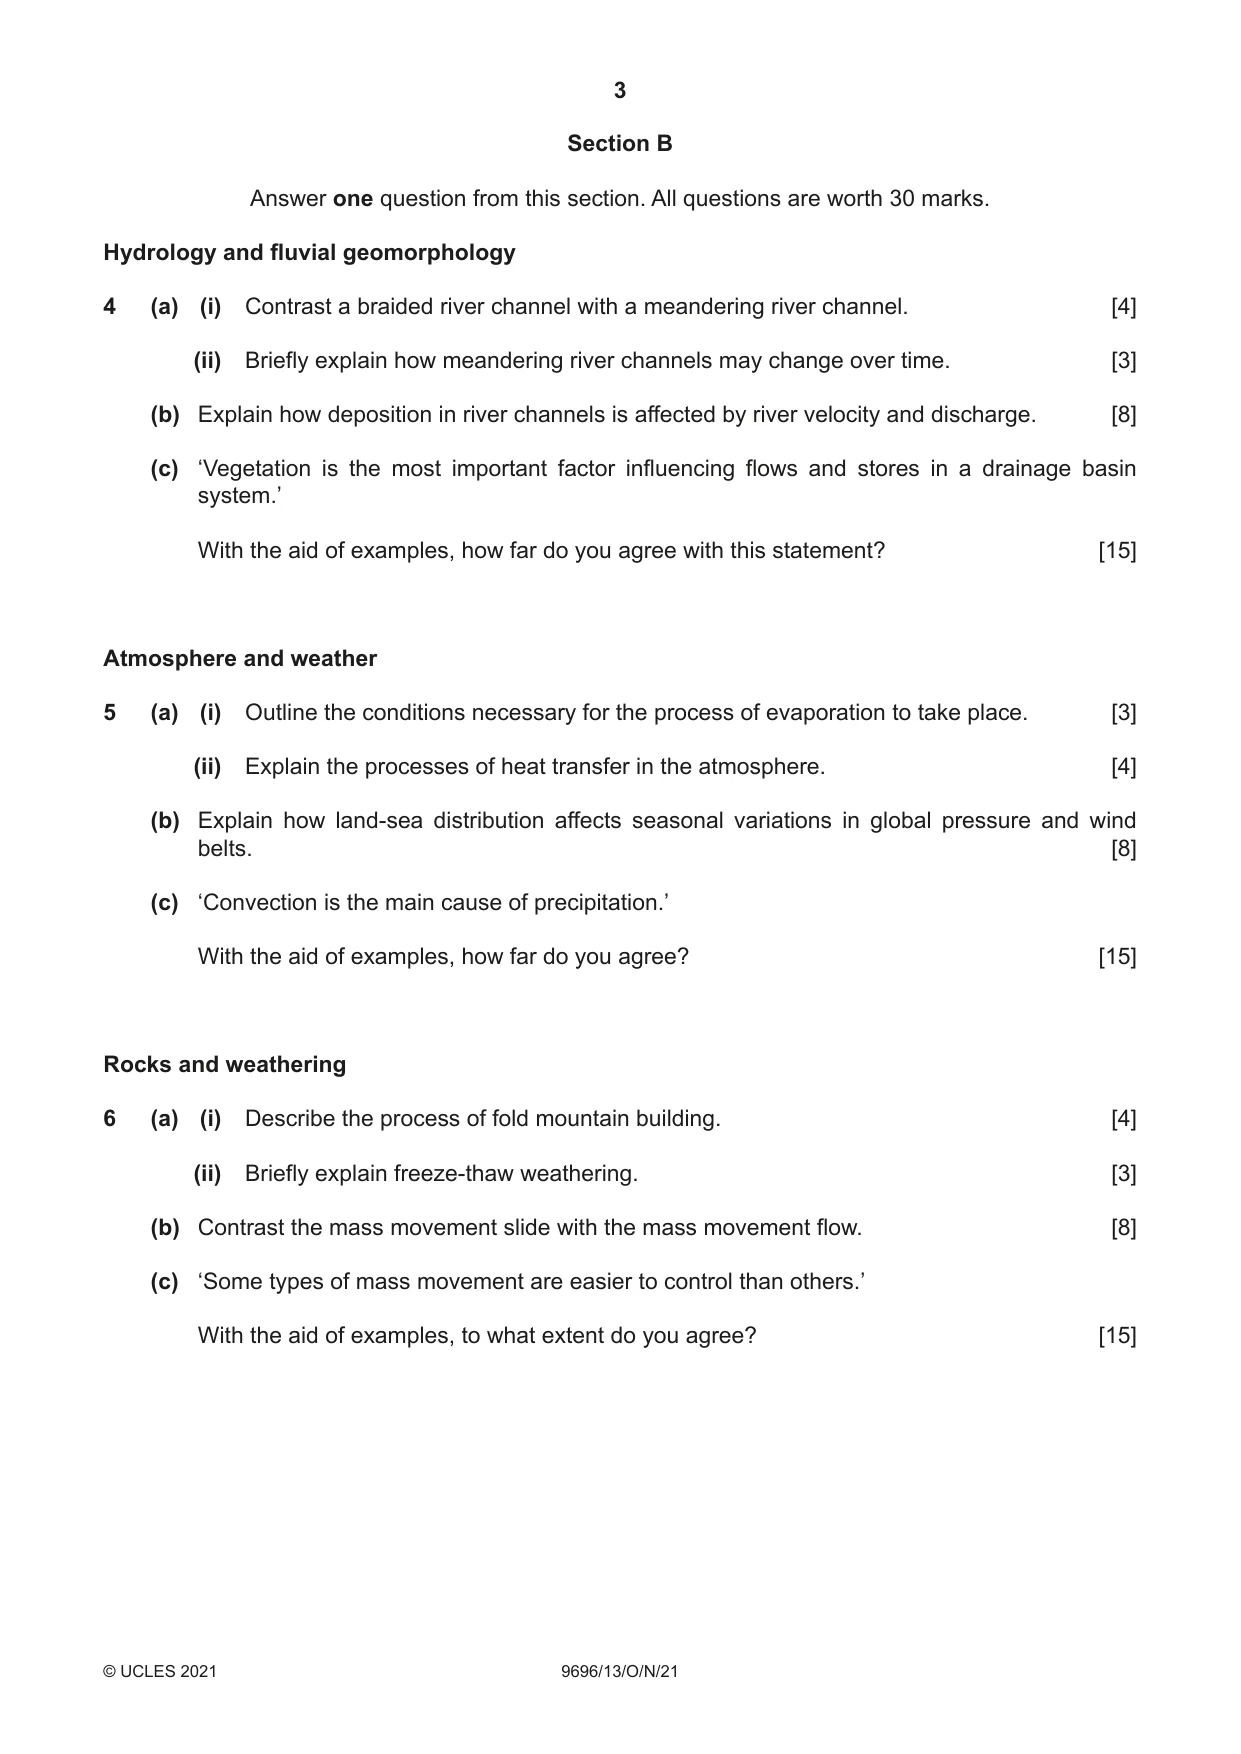
3 9696/13/O/N/21 © UCLES 2021 Section B Answer one question from this section. All questions are worth 30 marks. Hydrology and fluvial geomorphology 4 (a) (i) Contrast a braided river channel with a meandering river channel. [4] (ii) Briefly explain how meandering river channels may change over time. [3] (b) Explain how deposition in river channels is affected by river velocity and discharge. [8] (c) ‘Vegetation is the most important factor influencing flows and stores in a drainage basin system.’ With the aid of examples, how far do you agree with this statement? [15] Atmosphere and weather 5 (a) (i) Outline the conditions necessary for the process of evaporation to take place. [3] (ii) Explain the processes of heat transfer in the atmosphere. [4] (b) Explain how land-sea distribution affects seasonal variations in global pressure and wind belts. [8] (c) ‘Convection is the main cause of precipitation.’ With the aid of examples, how far do you agree? [15] Rocks and weathering 6 (a) (i) Describe the process of fold mountain building. [4] (ii) Briefly explain freeze-thaw weathering. [3] (b) Contrast the mass movement slide with the mass movement flow. [8] (c) ‘Some types of mass movement are easier to control than others.’ With the aid of examples, to what extent do you agree? [15]
Question paper, page 4
4 9696/13/O/N/21 © UCLES 2021 The boundaries and names shown, the designations used and the presentation of material on any maps contained in this question paper/insert do not imply official endorsement or acceptance by Cambridge Assessment International Education concerning the legal status of any country, territory, or area or any of its authorities, or of the delimitation of its frontiers or boundaries. Permission to reproduce items where third-party owned material protected by copyright is included has been sought and cleared where possible. Every reasonable effort has been made by the publisher (UCLES) to trace copyright holders, but if any items requiring clearance have unwittingly been included, the publisher will be pleased to make amends at the earliest possible opportunity. To avoid the issue of disclosure of answer-related information to candidates, all copyright acknowledgements are reproduced online in the Cambridge Assessment International Education Copyright Acknowledgements Booklet. This is produced for each series of examinations and is freely available to download at www.cambridgeinternational.org after the live examination series. Cambridge Assessment International Education is part of the Cambridge Assessment Group. Cambridge Assessment is the brand name of the University of Cambridge Local Examinations Syndicate (UCLES), which itself is a department of the University of Cambridge. BLANK PAGE
Mark scheme, page 1
This document consists of 15 printed pages. © UCLES 2021 [Turn over Cambridge International AS & A Level GEOGRAPHY 9696/13 Paper 1 Core Physical Geography October/November 2021 MARK SCHEME Maximum Mark: 60 Published This mark scheme is published as an aid to teachers and candidates, to indicate the requirements of the examination. It shows the basis on which Examiners were instructed to award marks. It does not indicate the details of the discussions that took place at an Examiners’ meeting before marking began, which would have considered the acceptability of alternative answers. Mark schemes should be read in conjunction with the question paper and the Principal Examiner Report for Teachers. Cambridge International will not enter into discussions about these mark schemes. Cambridge International is publishing the mark schemes for the October/November 2021 series for most Cambridge IGCSE™, Cambridge International A and AS Level components and some Cambridge O Level components.
Mark scheme, page 2
9696/13 Cambridge International AS & A Level – Mark Scheme PUBLISHED October/November 2021 © UCLES 2021 Page 2 of 15 Generic Marking Principles These general marking principles must be applied by all examiners when marking candidate answers. They should be applied alongside the specific content of the mark scheme or generic level descriptors for a question. Each question paper and mark scheme will also comply with these marking principles. GENERIC MARKING PRINCIPLE 1: Marks must be awarded in line with: • the specific content of the mark scheme or the generic level descriptors for the question • the specific skills defined in the mark scheme or in the generic level descriptors for the question • the standard of response required by a candidate as exemplified by the standardisation scripts. GENERIC MARKING PRINCIPLE 2: Marks awarded are always whole marks (not half marks, or other fractions). GENERIC MARKING PRINCIPLE 3: Marks must be awarded positively: • marks are awarded for correct/valid answers, as defined in the mark scheme. However, credit is given for valid answers which go beyond the scope of the syllabus and mark scheme, referring to your Team Leader as appropriate • marks are awarded when candidates clearly demonstrate what they know and can do • marks are not deducted for errors • marks are not deducted for omissions • answers should only be judged on the quality of spelling, punctuation and grammar when these features are specifically assessed by the question as indicated by the mark scheme. The meaning, however, should be unambiguous. GENERIC MARKING PRINCIPLE 4: Rules must be applied consistently, e.g. in situations where candidates have not followed instructions or in the application of generic level descriptors. GENERIC MARKING PRINCIPLE 5: Marks should be awarded using the full range of marks defined in the mark scheme for the question (however; the use of the full mark range may be limited according to the quality of the candidate responses seen). GENERIC MARKING PRINCIPLE 6: Marks awarded are based solely on the requirements as defined in the mark scheme. Marks should not be awarded with grade thresholds or grade descriptors in mind.
Mark scheme, page 3
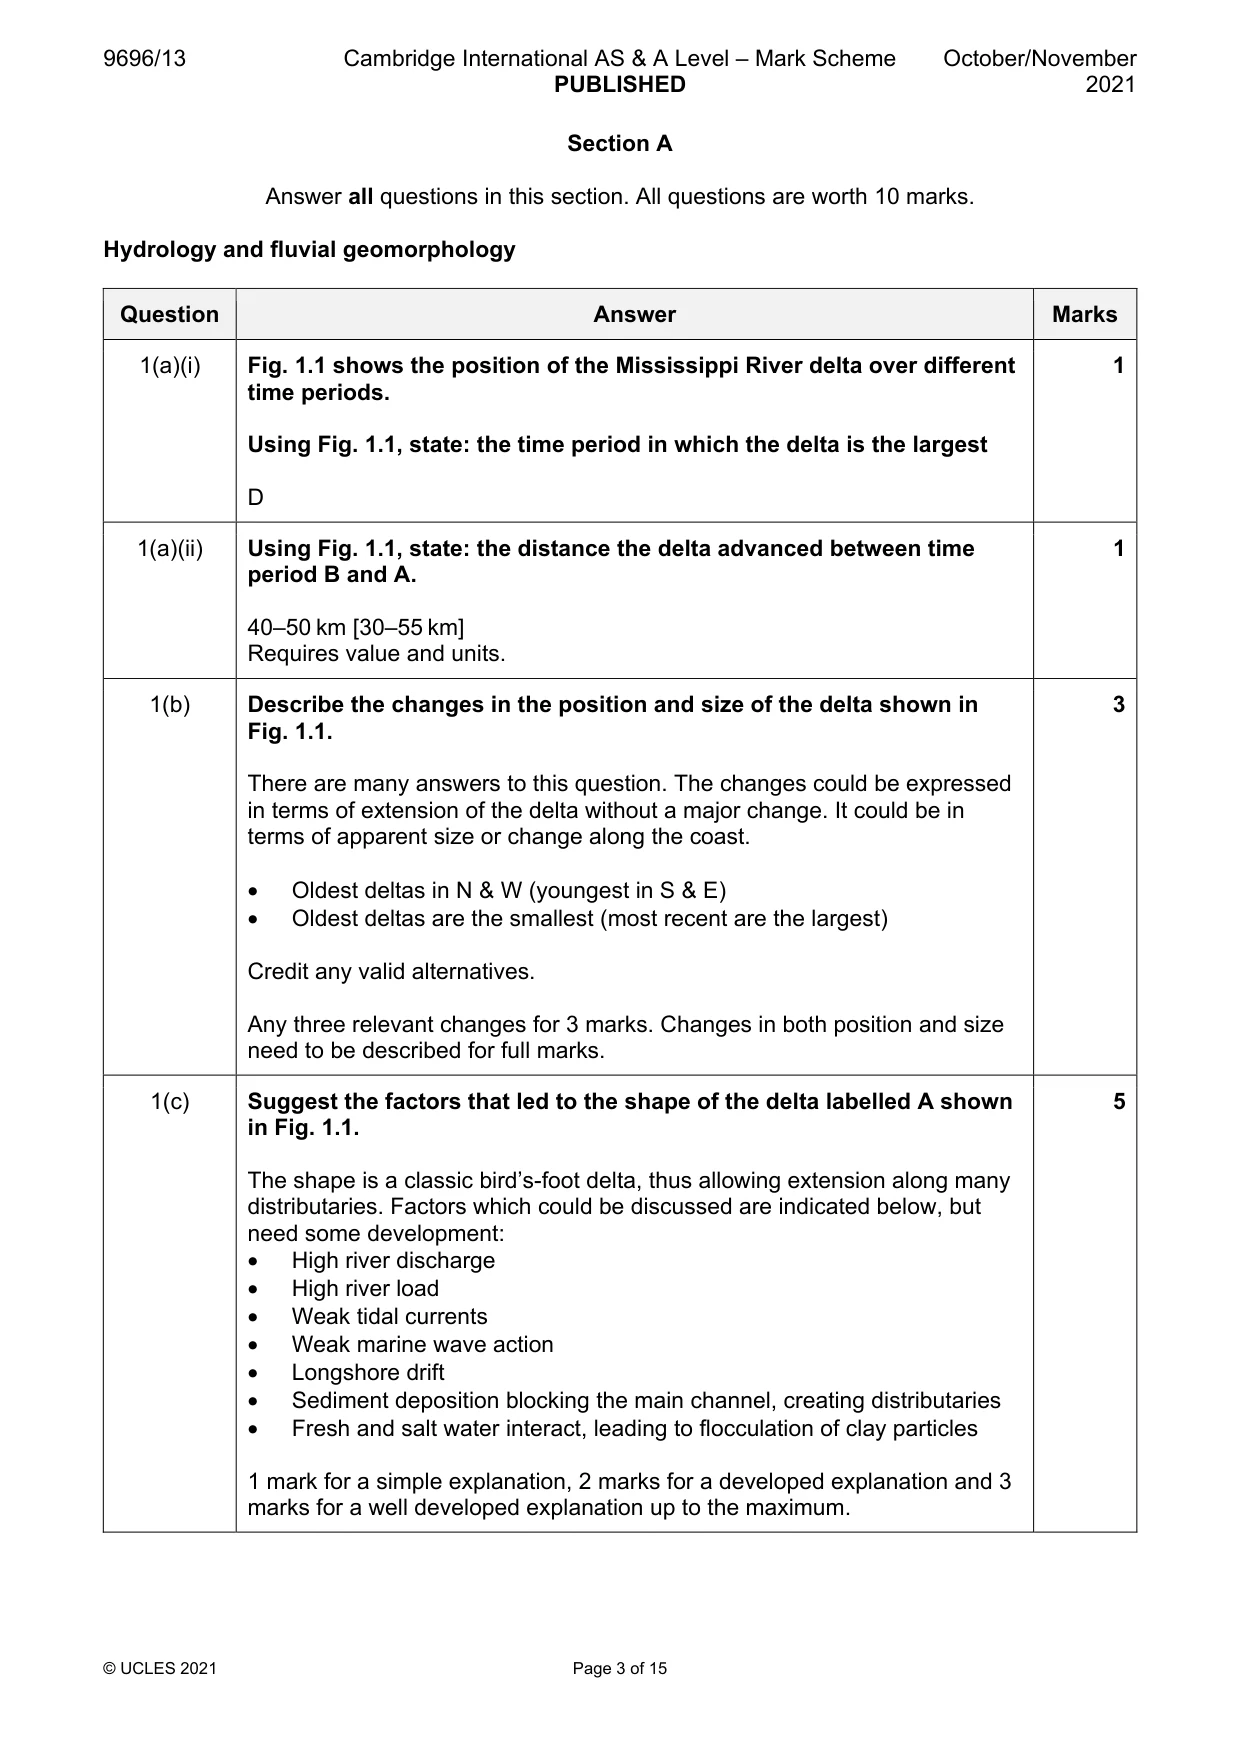
9696/13 Cambridge International AS & A Level – Mark Scheme PUBLISHED October/November 2021 © UCLES 2021 Page 3 of 15 Section A Answer all questions in this section. All questions are worth 10 marks. Hydrology and fluvial geomorphology Question Answer Marks 1(a)(i) Fig. 1.1 shows the position of the Mississippi River delta over different time periods. Using Fig. 1.1, state: the time period in which the delta is the largest D 1 1(a)(ii) Using Fig. 1.1, state: the distance the delta advanced between time period B and A. 40–50 km [30–55 km] Requires value and units. 1 1(b) Describe the changes in the position and size of the delta shown in Fig. 1.1. There are many answers to this question. The changes could be expressed in terms of extension of the delta without a major change. It could be in terms of apparent size or change along the coast. • Oldest deltas in N & W (youngest in S & E) • Oldest deltas are the smallest (most recent are the largest) Credit any valid alternatives. Any three relevant changes for 3 marks. Changes in both position and size need to be described for full marks. 3 1(c) Suggest the factors that led to the shape of the delta labelled A shown in Fig. 1.1. The shape is a classic bird’s-foot delta, thus allowing extension along many distributaries. Factors which could be discussed are indicated below, but need some development: • High river discharge • High river load • Weak tidal currents • Weak marine wave action • Longshore drift • Sediment deposition blocking the main channel, creating distributaries • Fresh and salt water interact, leading to flocculation of clay particles 1 mark for a simple explanation, 2 marks for a developed explanation and 3 marks for a well developed explanation up to the maximum. 5
Mark scheme, page 4
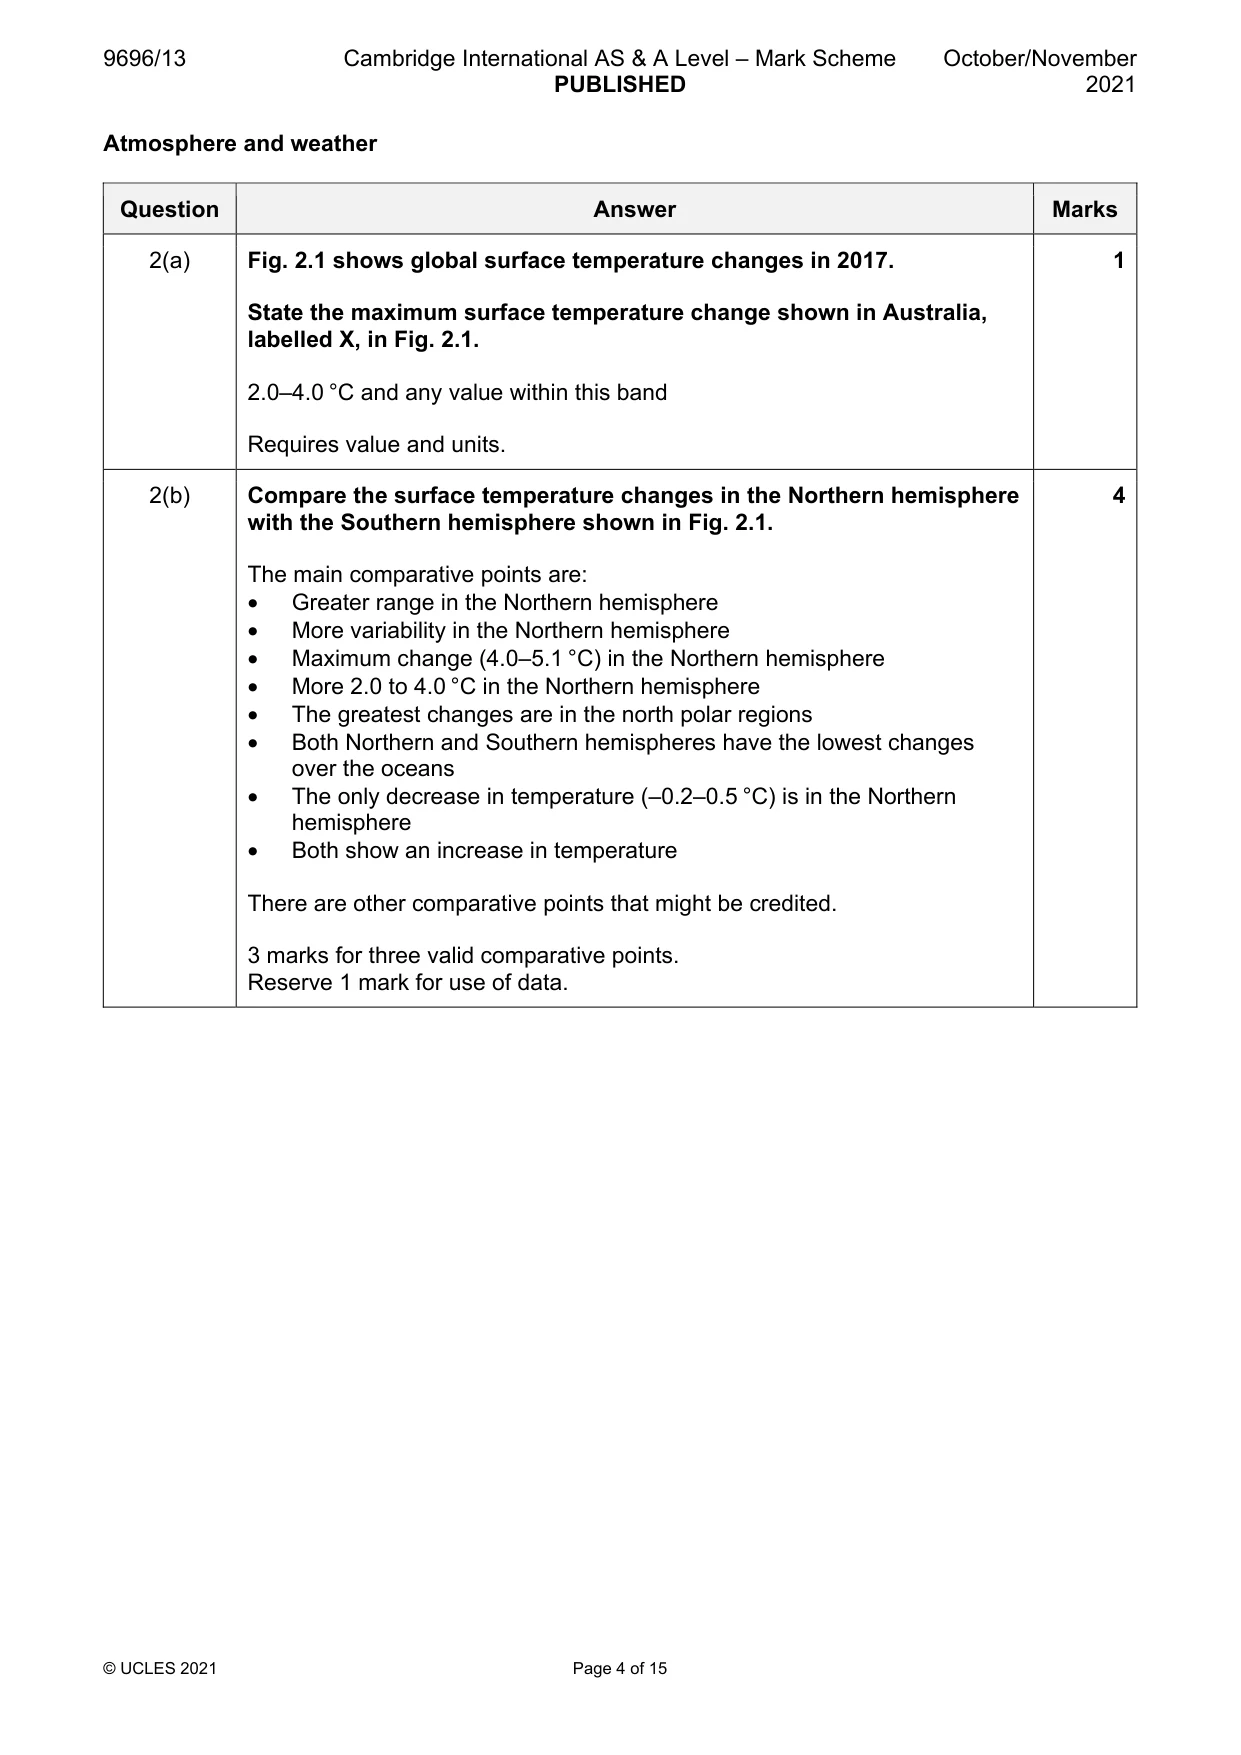
9696/13 Cambridge International AS & A Level – Mark Scheme PUBLISHED October/November 2021 © UCLES 2021 Page 4 of 15 Atmosphere and weather Question Answer Marks 2(a) Fig. 2.1 shows global surface temperature changes in 2017. State the maximum surface temperature change shown in Australia, labelled X, in Fig. 2.1. 2.0–4.0 °C and any value within this band Requires value and units. 1 2(b) Compare the surface temperature changes in the Northern hemisphere with the Southern hemisphere shown in Fig. 2.1. The main comparative points are: • Greater range in the Northern hemisphere • More variability in the Northern hemisphere • Maximum change (4.0–5.1 °C) in the Northern hemisphere • More 2.0 to 4.0 °C in the Northern hemisphere • The greatest changes are in the north polar regions • Both Northern and Southern hemispheres have the lowest changes over the oceans • The only decrease in temperature (–0.2–0.5 °C) is in the Northern hemisphere • Both show an increase in temperature There are other comparative points that might be credited. 3 marks for three valid comparative points. Reserve 1 mark for use of data. 4
Mark scheme, page 5
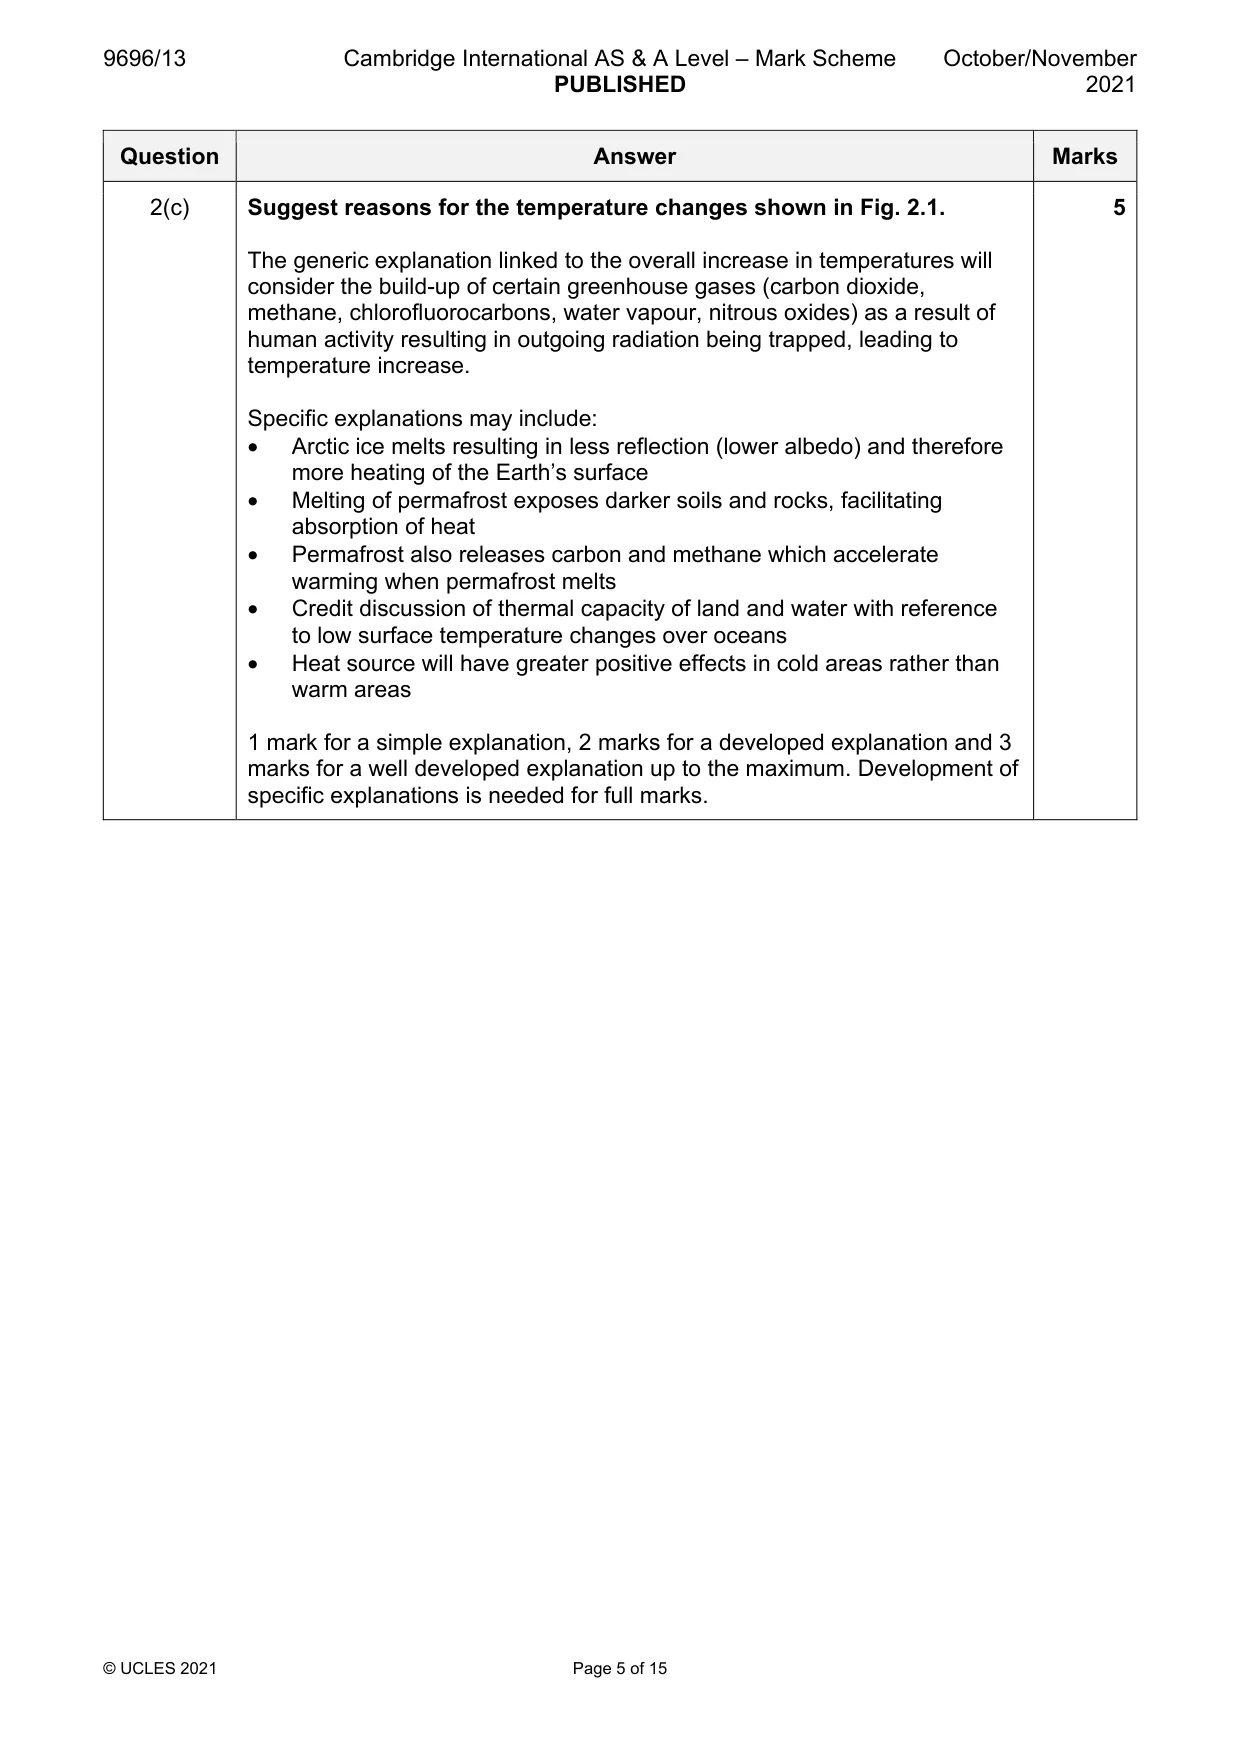
9696/13 Cambridge International AS & A Level – Mark Scheme PUBLISHED October/November 2021 © UCLES 2021 Page 5 of 15 Question Answer Marks 2(c) Suggest reasons for the temperature changes shown in Fig. 2.1. The generic explanation linked to the overall increase in temperatures will consider the build-up of certain greenhouse gases (carbon dioxide, methane, chlorofluorocarbons, water vapour, nitrous oxides) as a result of human activity resulting in outgoing radiation being trapped, leading to temperature increase. Specific explanations may include: • Arctic ice melts resulting in less reflection (lower albedo) and therefore more heating of the Earth’s surface • Melting of permafrost exposes darker soils and rocks, facilitating absorption of heat • Permafrost also releases carbon and methane which accelerate warming when permafrost melts • Credit discussion of thermal capacity of land and water with reference to low surface temperature changes over oceans • Heat source will have greater positive effects in cold areas rather than warm areas 1 mark for a simple explanation, 2 marks for a developed explanation and 3 marks for a well developed explanation up to the maximum. Development of specific explanations is needed for full marks. 5
Mark scheme, page 6
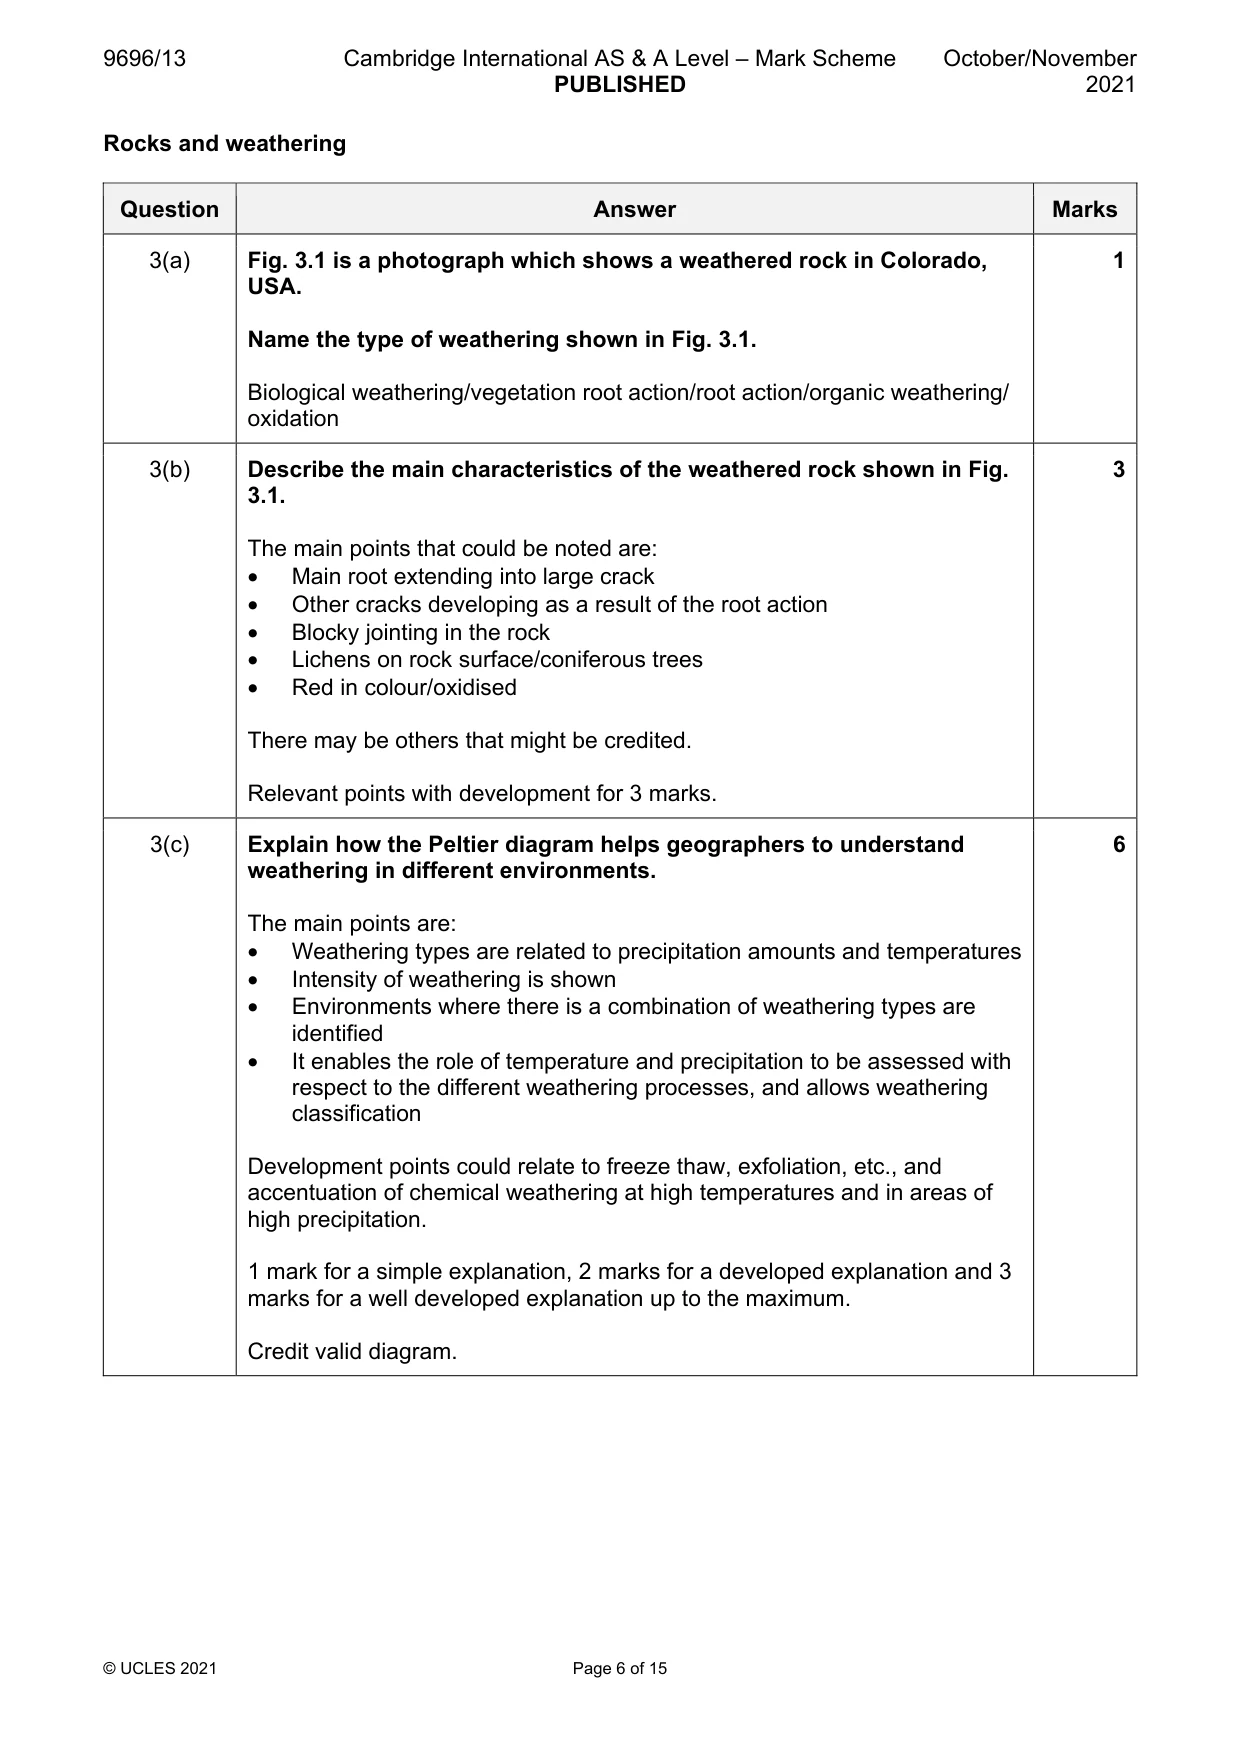
9696/13 Cambridge International AS & A Level – Mark Scheme PUBLISHED October/November 2021 © UCLES 2021 Page 6 of 15 Rocks and weathering Question Answer Marks 3(a) Fig. 3.1 is a photograph which shows a weathered rock in Colorado, USA. Name the type of weathering shown in Fig. 3.1. Biological weathering/vegetation root action/root action/organic weathering/ oxidation 1 3(b) Describe the main characteristics of the weathered rock shown in Fig. 3.1. The main points that could be noted are: • Main root extending into large crack • Other cracks developing as a result of the root action • Blocky jointing in the rock • Lichens on rock surface/coniferous trees • Red in colour/oxidised There may be others that might be credited. Relevant points with development for 3 marks. 3 3(c) Explain how the Peltier diagram helps geographers to understand weathering in different environments. The main points are: • Weathering types are related to precipitation amounts and temperatures • Intensity of weathering is shown • Environments where there is a combination of weathering types are identified • It enables the role of temperature and precipitation to be assessed with respect to the different weathering processes, and allows weathering classification Development points could relate to freeze thaw, exfoliation, etc., and accentuation of chemical weathering at high temperatures and in areas of high precipitation. 1 mark for a simple explanation, 2 marks for a developed explanation and 3 marks for a well developed explanation up to the maximum. Credit valid diagram. 6
Mark scheme, page 7
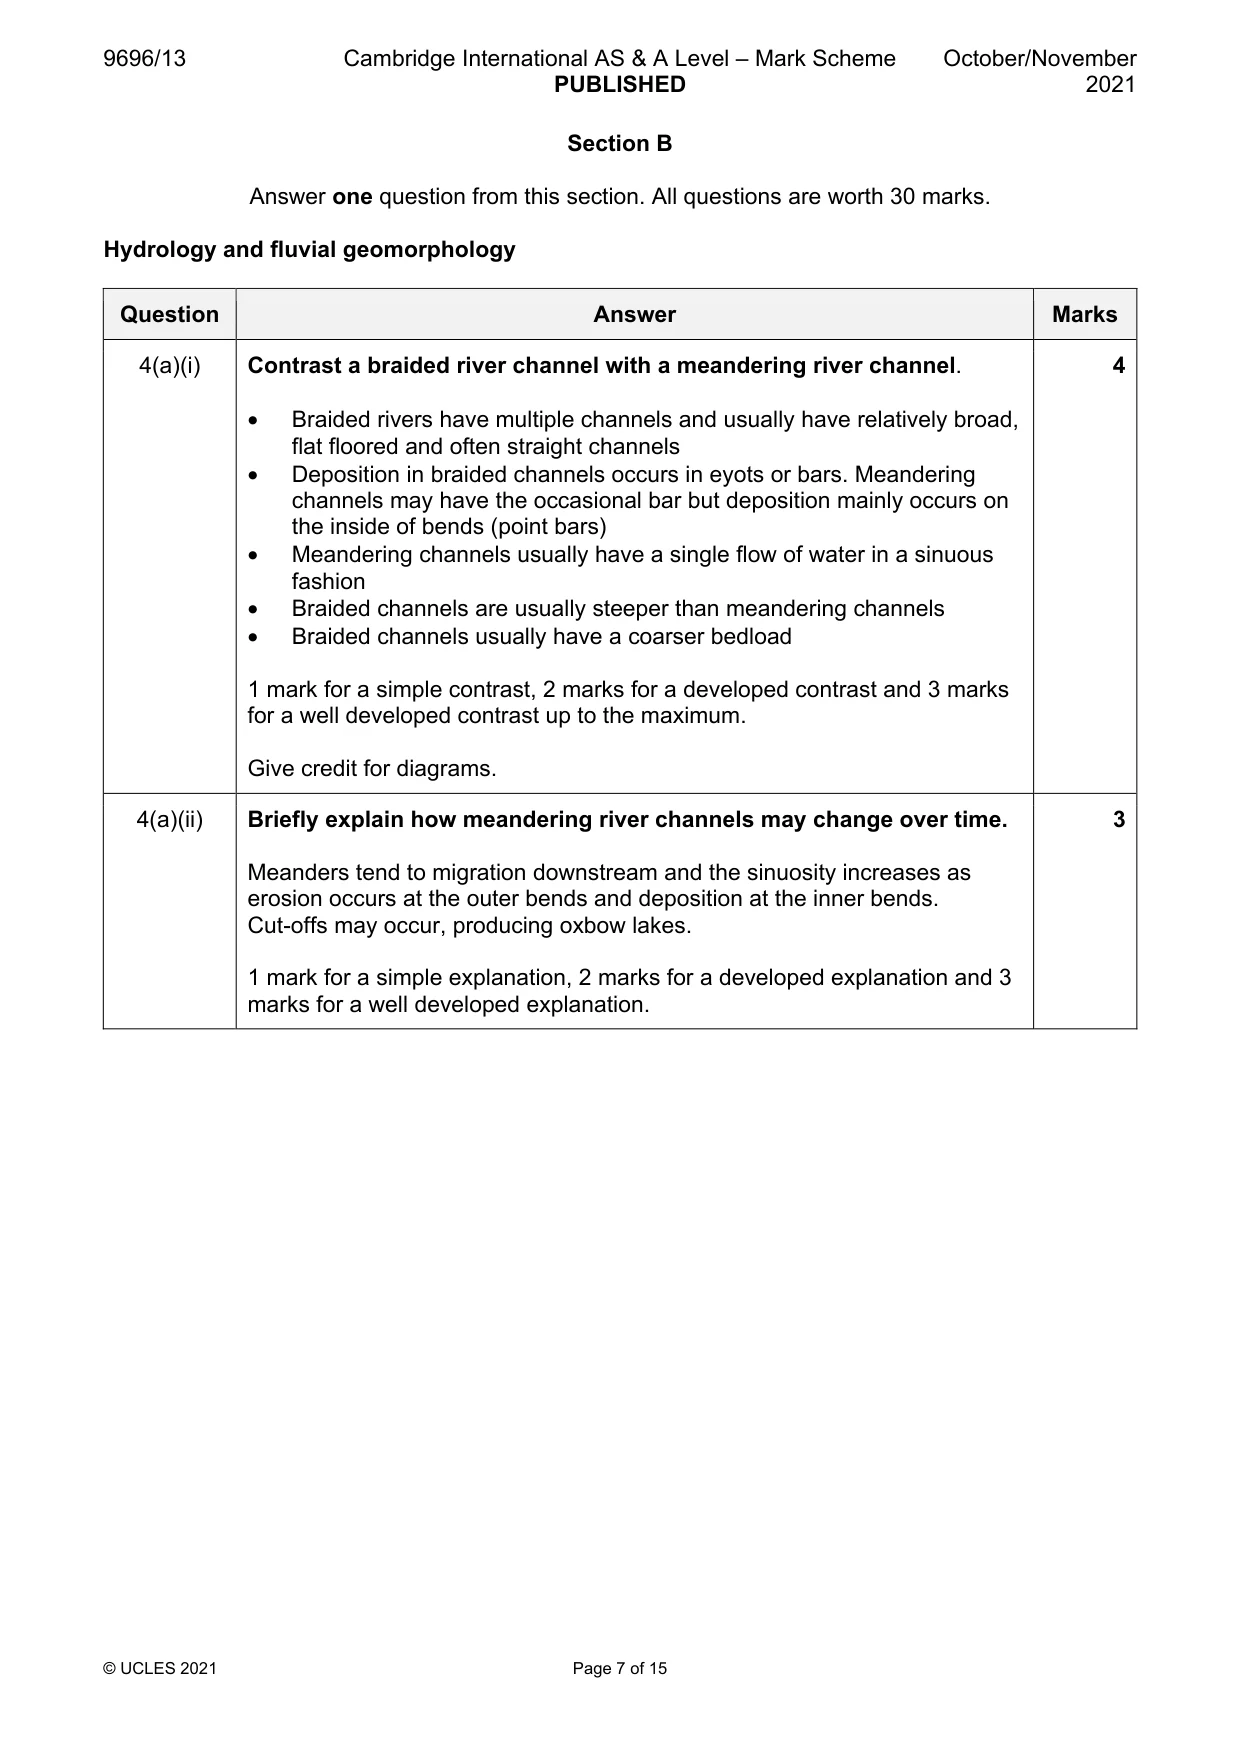
9696/13 Cambridge International AS & A Level – Mark Scheme PUBLISHED October/November 2021 © UCLES 2021 Page 7 of 15 Section B Answer one question from this section. All questions are worth 30 marks. Hydrology and fluvial geomorphology Question Answer Marks 4(a)(i) Contrast a braided river channel with a meandering river channel. • Braided rivers have multiple channels and usually have relatively broad, flat floored and often straight channels • Deposition in braided channels occurs in eyots or bars. Meandering channels may have the occasional bar but deposition mainly occurs on the inside of bends (point bars) • Meandering channels usually have a single flow of water in a sinuous fashion • Braided channels are usually steeper than meandering channels • Braided channels usually have a coarser bedload 1 mark for a simple contrast, 2 marks for a developed contrast and 3 marks for a well developed contrast up to the maximum. Give credit for diagrams. 4 4(a)(ii) Briefly explain how meandering river channels may change over time. Meanders tend to migration downstream and the sinuosity increases as erosion occurs at the outer bends and deposition at the inner bends. Cut-offs may occur, producing oxbow lakes. 1 mark for a simple explanation, 2 marks for a developed explanation and 3 marks for a well developed explanation. 3
Mark scheme, page 8
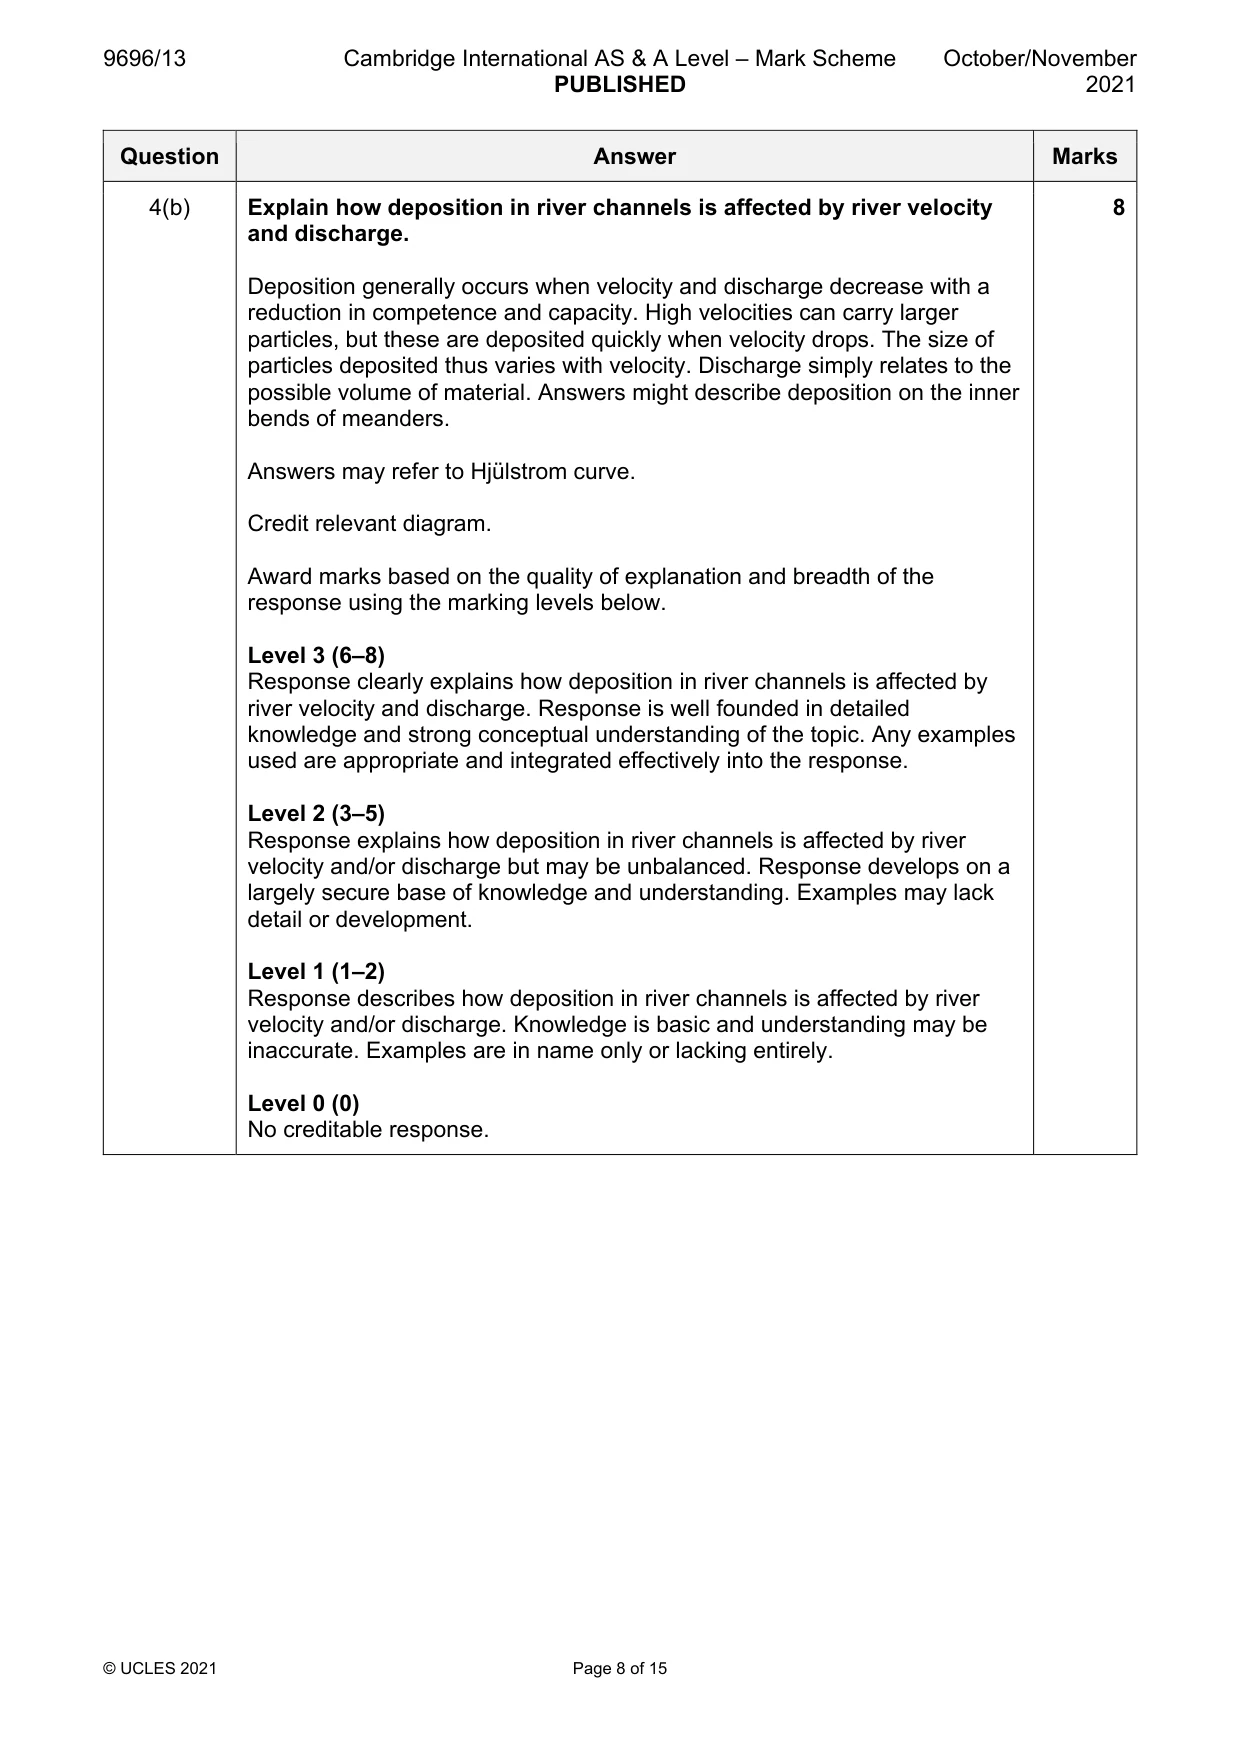
9696/13 Cambridge International AS & A Level – Mark Scheme PUBLISHED October/November 2021 © UCLES 2021 Page 8 of 15 Question Answer Marks 4(b) Explain how deposition in river channels is affected by river velocity and discharge. Deposition generally occurs when velocity and discharge decrease with a reduction in competence and capacity. High velocities can carry larger particles, but these are deposited quickly when velocity drops. The size of particles deposited thus varies with velocity. Discharge simply relates to the possible volume of material. Answers might describe deposition on the inner bends of meanders. Answers may refer to Hjülstrom curve. Credit relevant diagram. Award marks based on the quality of explanation and breadth of the response using the marking levels below. Level 3 (6–8) Response clearly explains how deposition in river channels is affected by river velocity and discharge. Response is well founded in detailed knowledge and strong conceptual understanding of the topic. Any examples used are appropriate and integrated effectively into the response. Level 2 (3–5) Response explains how deposition in river channels is affected by river velocity and/or discharge but may be unbalanced. Response develops on a largely secure base of knowledge and understanding. Examples may lack detail or development. Level 1 (1–2) Response describes how deposition in river channels is affected by river velocity and/or discharge. Knowledge is basic and understanding may be inaccurate. Examples are in name only or lacking entirely. Level 0 (0) No creditable response. 8
Mark scheme, page 9
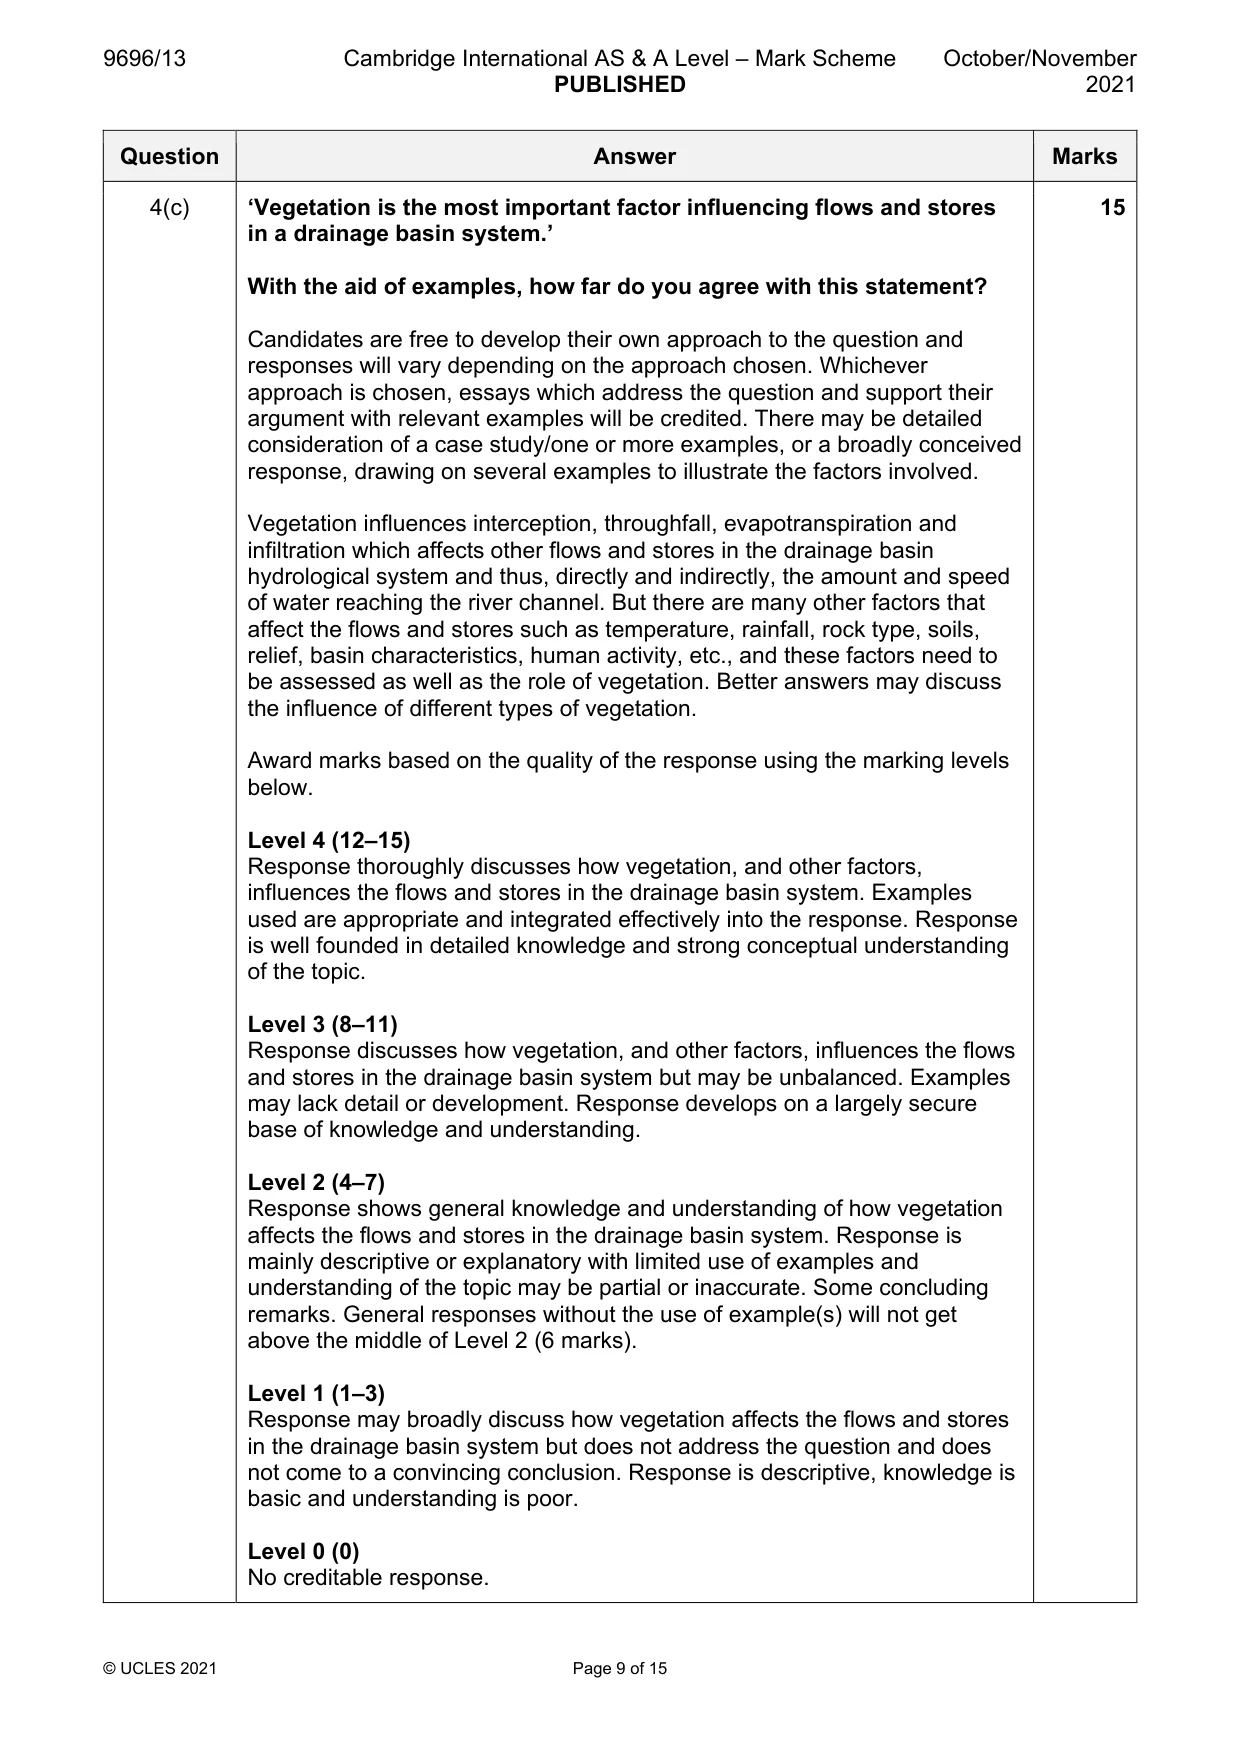
9696/13 Cambridge International AS & A Level – Mark Scheme PUBLISHED October/November 2021 © UCLES 2021 Page 9 of 15 Question Answer Marks 4(c) ‘Vegetation is the most important factor influencing flows and stores in a drainage basin system.’ With the aid of examples, how far do you agree with this statement? Candidates are free to develop their own approach to the question and responses will vary depending on the approach chosen. Whichever approach is chosen, essays which address the question and support their argument with relevant examples will be credited. There may be detailed consideration of a case study/one or more examples, or a broadly conceived response, drawing on several examples to illustrate the factors involved. Vegetation influences interception, throughfall, evapotranspiration and infiltration which affects other flows and stores in the drainage basin hydrological system and thus, directly and indirectly, the amount and speed of water reaching the river channel. But there are many other factors that affect the flows and stores such as temperature, rainfall, rock type, soils, relief, basin characteristics, human activity, etc., and these factors need to be assessed as well as the role of vegetation. Better answers may discuss the influence of different types of vegetation. Award marks based on the quality of the response using the marking levels below. Level 4 (12–15) Response thoroughly discusses how vegetation, and other factors, influences the flows and stores in the drainage basin system. Examples used are appropriate and integrated effectively into the response. Response is well founded in detailed knowledge and strong conceptual understanding of the topic. Level 3 (8–11) Response discusses how vegetation, and other factors, influences the flows and stores in the drainage basin system but may be unbalanced. Examples may lack detail or development. Response develops on a largely secure base of knowledge and understanding. Level 2 (4–7) Response shows general knowledge and understanding of how vegetation affects the flows and stores in the drainage basin system. Response is mainly descriptive or explanatory with limited use of examples and understanding of the topic may be partial or inaccurate. Some concluding remarks. General responses without the use of example(s) will not get above the middle of Level 2 (6 marks). Level 1 (1–3) Response may broadly discuss how vegetation affects the flows and stores in the drainage basin system but does not address the question and does not come to a convincing conclusion. Response is descriptive, knowledge is basic and understanding is poor. Level 0 (0) No creditable response. 15
Mark scheme, page 10
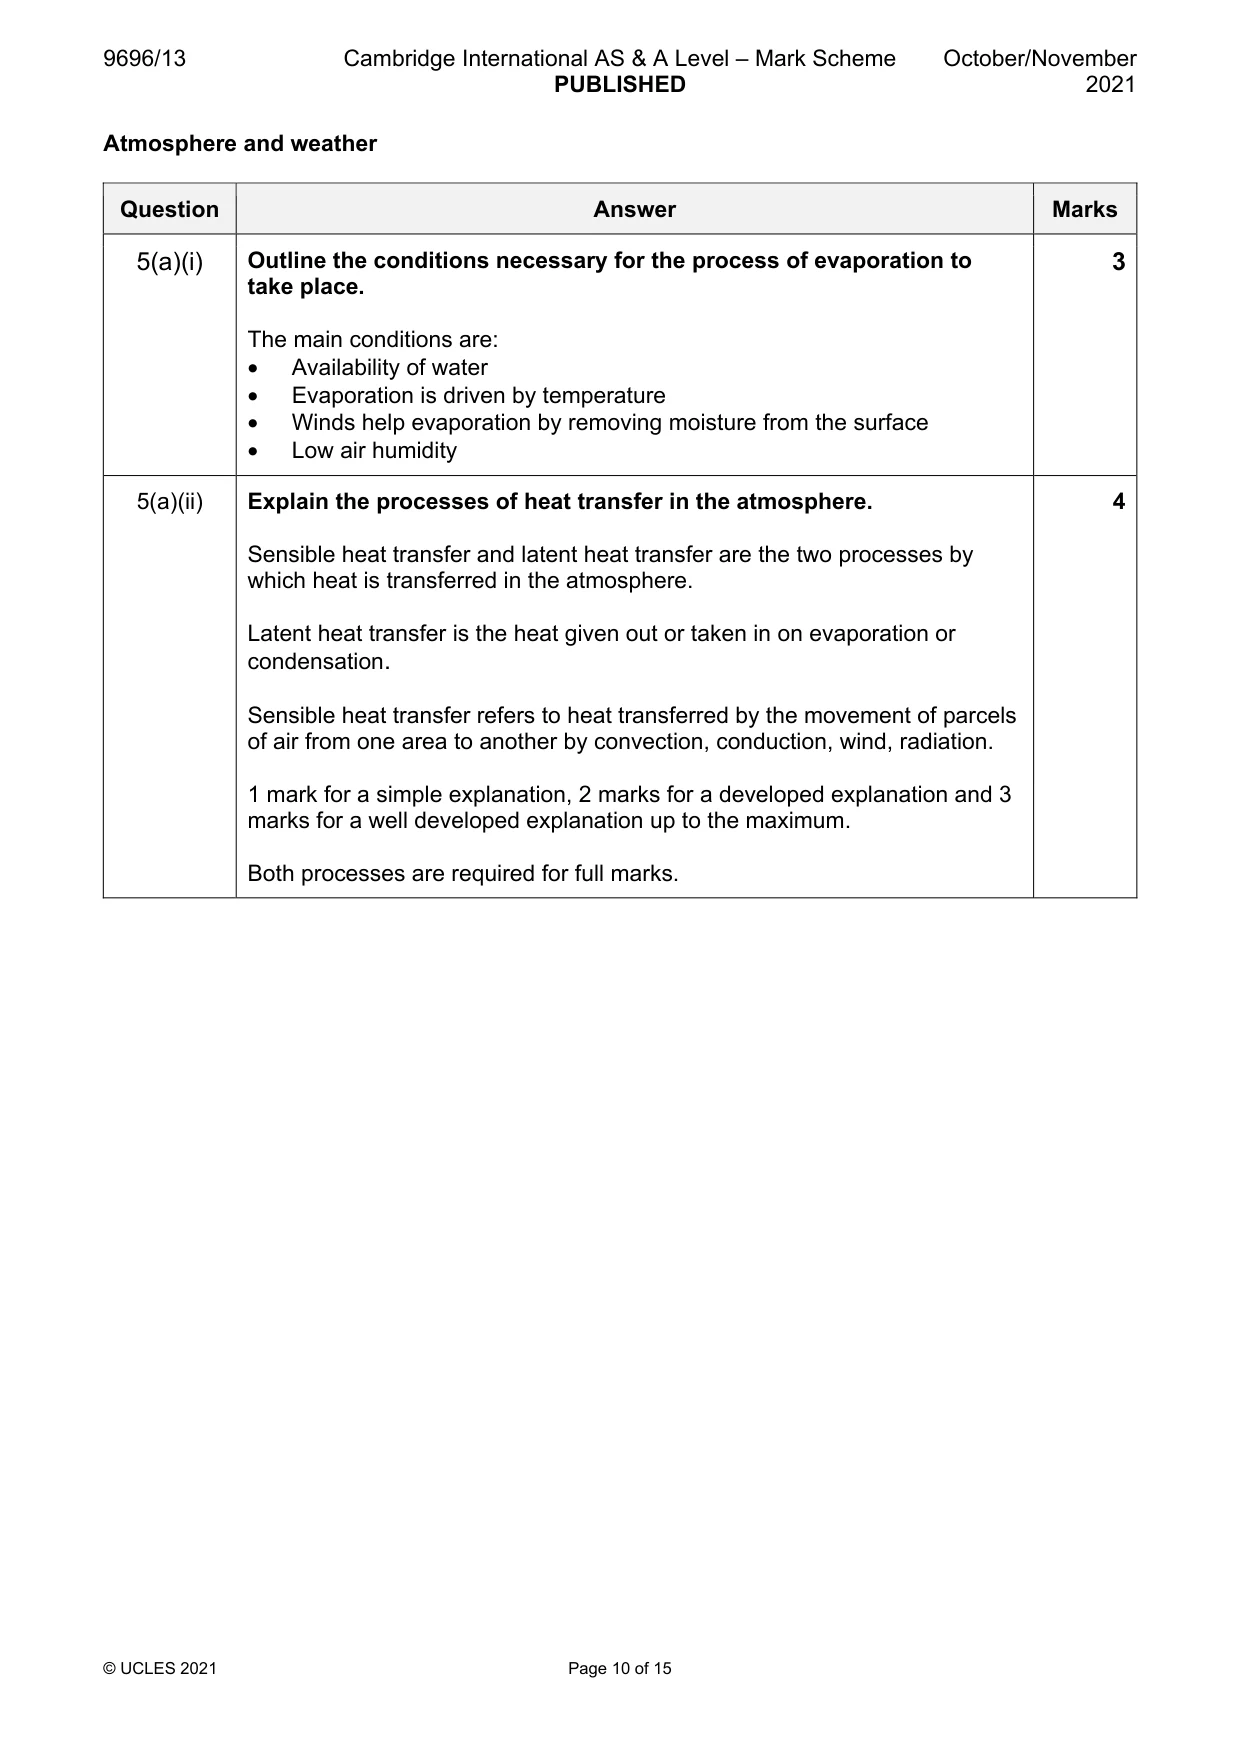
9696/13 Cambridge International AS & A Level – Mark Scheme PUBLISHED October/November 2021 © UCLES 2021 Page 10 of 15 Atmosphere and weather Question Answer Marks 5(a)(i) Outline the conditions necessary for the process of evaporation to take place. The main conditions are: • Availability of water • Evaporation is driven by temperature • Winds help evaporation by removing moisture from the surface • Low air humidity 3 5(a)(ii) Explain the processes of heat transfer in the atmosphere. Sensible heat transfer and latent heat transfer are the two processes by which heat is transferred in the atmosphere. Latent heat transfer is the heat given out or taken in on evaporation or condensation. Sensible heat transfer refers to heat transferred by the movement of parcels of air from one area to another by convection, conduction, wind, radiation. 1 mark for a simple explanation, 2 marks for a developed explanation and 3 marks for a well developed explanation up to the maximum. Both processes are required for full marks. 4
Mark scheme, page 11
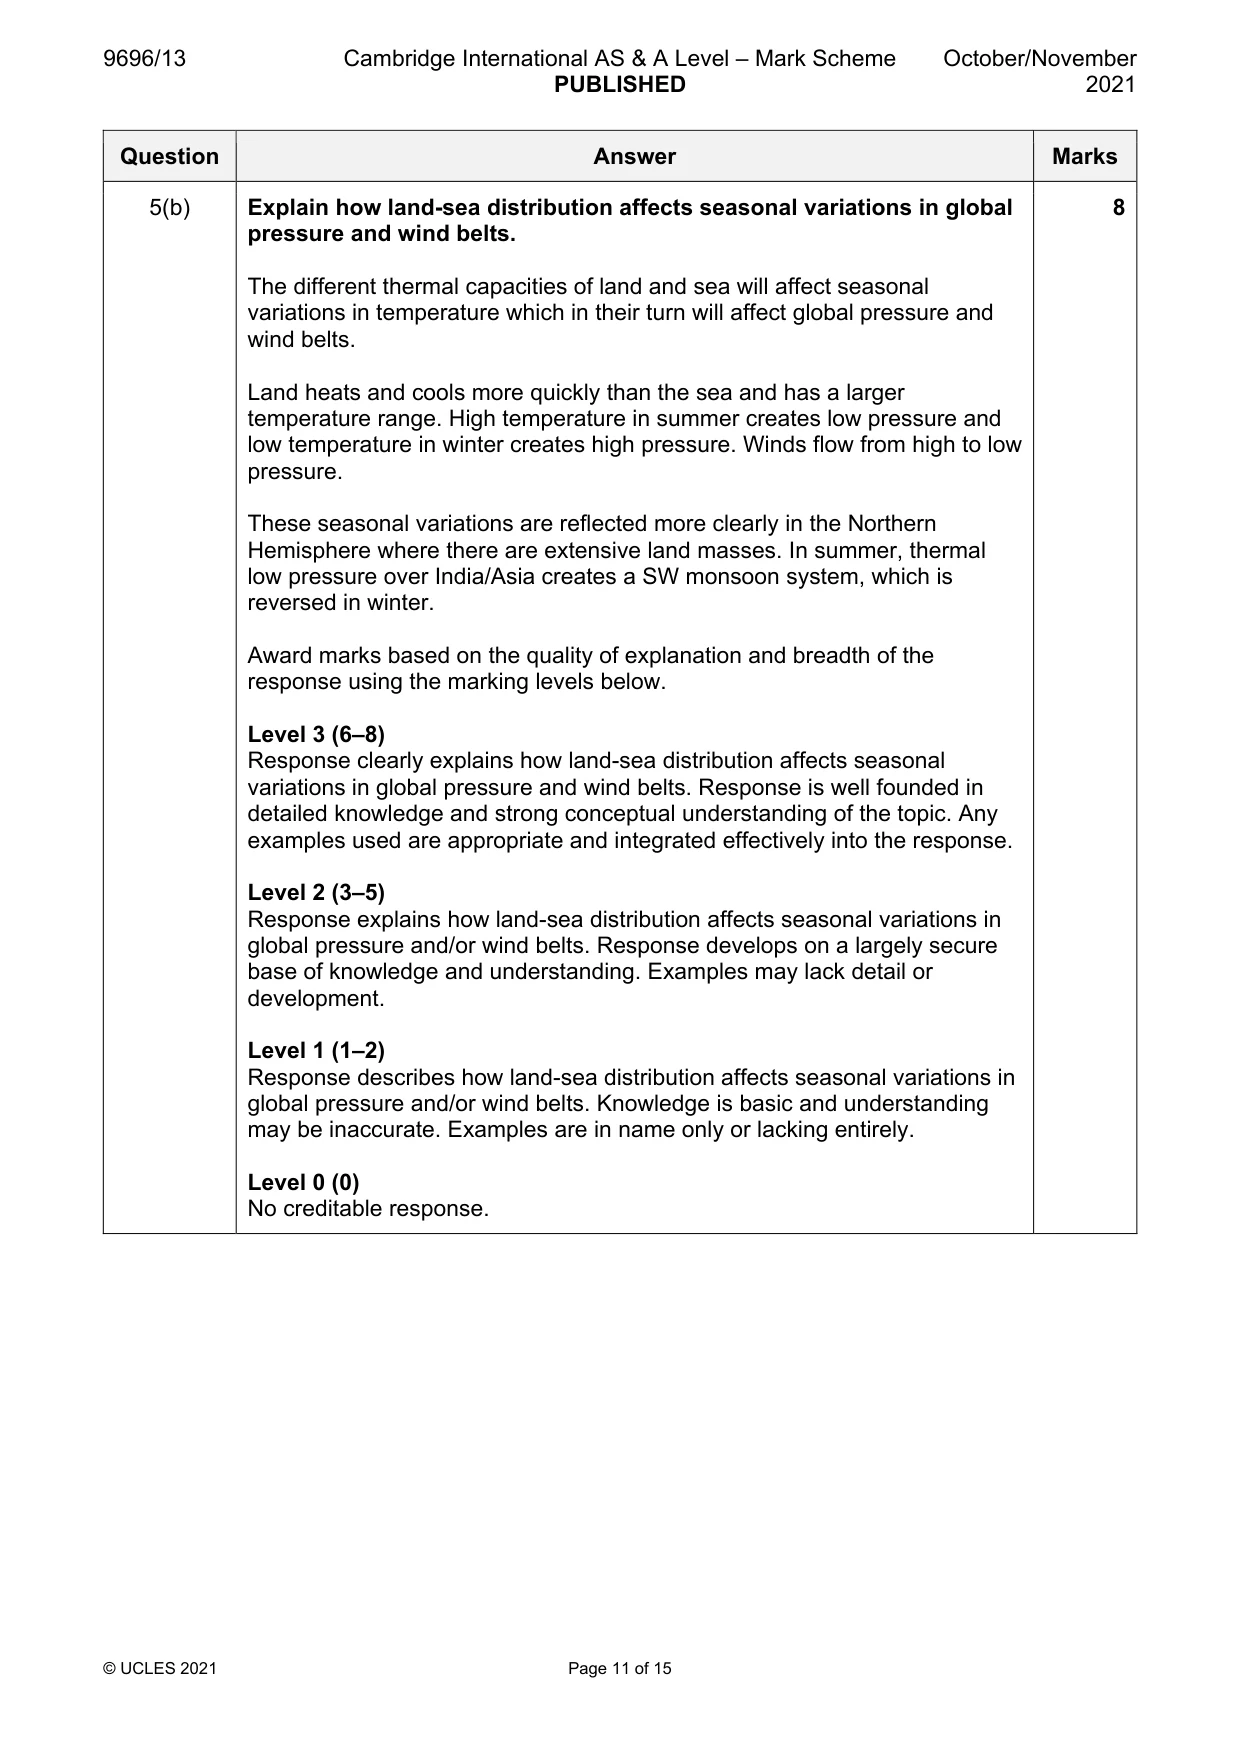
9696/13 Cambridge International AS & A Level – Mark Scheme PUBLISHED October/November 2021 © UCLES 2021 Page 11 of 15 Question Answer Marks 5(b) Explain how land-sea distribution affects seasonal variations in global pressure and wind belts. The different thermal capacities of land and sea will affect seasonal variations in temperature which in their turn will affect global pressure and wind belts. Land heats and cools more quickly than the sea and has a larger temperature range. High temperature in summer creates low pressure and low temperature in winter creates high pressure. Winds flow from high to low pressure. These seasonal variations are reflected more clearly in the Northern Hemisphere where there are extensive land masses. In summer, thermal low pressure over India/Asia creates a SW monsoon system, which is reversed in winter. Award marks based on the quality of explanation and breadth of the response using the marking levels below. Level 3 (6–8) Response clearly explains how land-sea distribution affects seasonal variations in global pressure and wind belts. Response is well founded in detailed knowledge and strong conceptual understanding of the topic. Any examples used are appropriate and integrated effectively into the response. Level 2 (3–5) Response explains how land-sea distribution affects seasonal variations in global pressure and/or wind belts. Response develops on a largely secure base of knowledge and understanding. Examples may lack detail or development. Level 1 (1–2) Response describes how land-sea distribution affects seasonal variations in global pressure and/or wind belts. Knowledge is basic and understanding may be inaccurate. Examples are in name only or lacking entirely. Level 0 (0) No creditable response. 8
Mark scheme, page 12
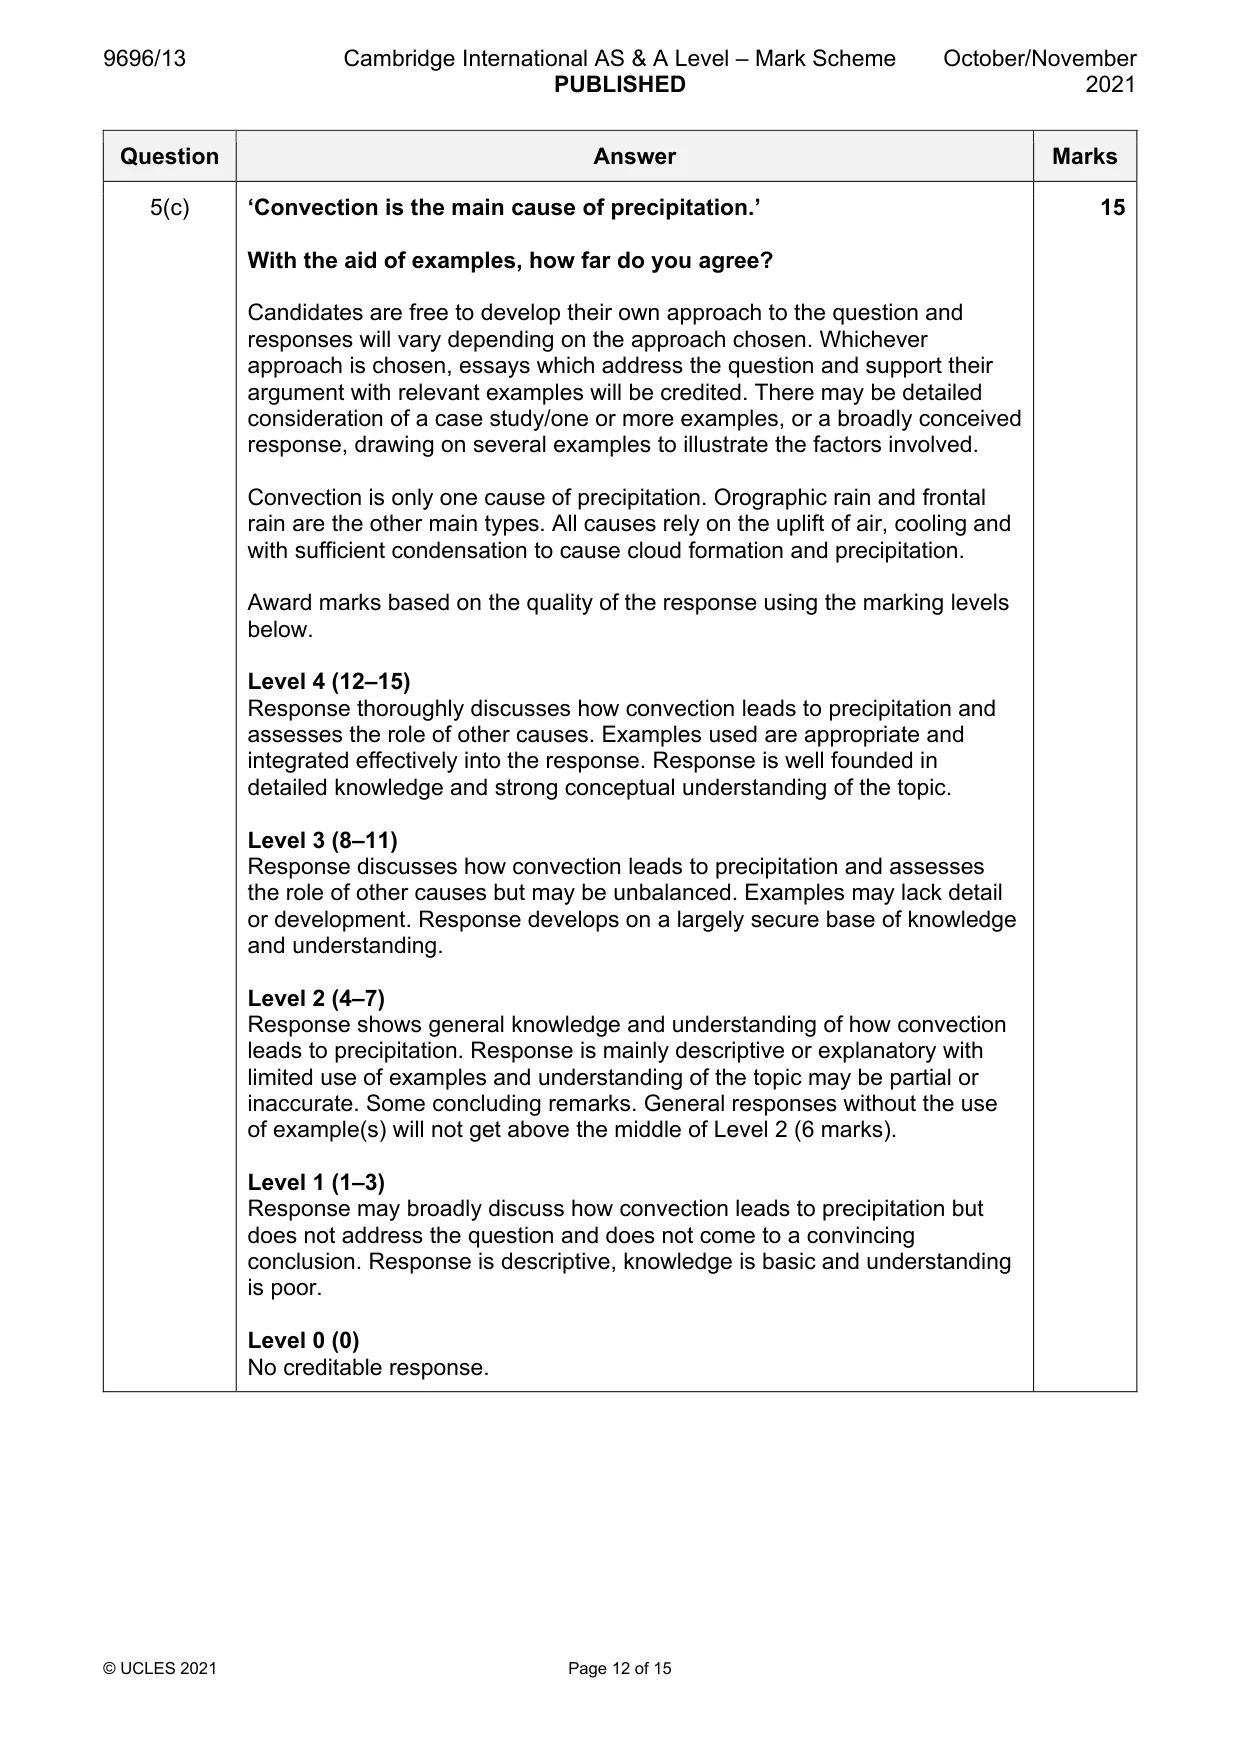
9696/13 Cambridge International AS & A Level – Mark Scheme PUBLISHED October/November 2021 © UCLES 2021 Page 12 of 15 Question Answer Marks 5(c) ‘Convection is the main cause of precipitation.’ With the aid of examples, how far do you agree? Candidates are free to develop their own approach to the question and responses will vary depending on the approach chosen. Whichever approach is chosen, essays which address the question and support their argument with relevant examples will be credited. There may be detailed consideration of a case study/one or more examples, or a broadly conceived response, drawing on several examples to illustrate the factors involved. Convection is only one cause of precipitation. Orographic rain and frontal rain are the other main types. All causes rely on the uplift of air, cooling and with sufficient condensation to cause cloud formation and precipitation. Award marks based on the quality of the response using the marking levels below. Level 4 (12–15) Response thoroughly discusses how convection leads to precipitation and assesses the role of other causes. Examples used are appropriate and integrated effectively into the response. Response is well founded in detailed knowledge and strong conceptual understanding of the topic. Level 3 (8–11) Response discusses how convection leads to precipitation and assesses the role of other causes but may be unbalanced. Examples may lack detail or development. Response develops on a largely secure base of knowledge and understanding. Level 2 (4–7) Response shows general knowledge and understanding of how convection leads to precipitation. Response is mainly descriptive or explanatory with limited use of examples and understanding of the topic may be partial or inaccurate. Some concluding remarks. General responses without the use of example(s) will not get above the middle of Level 2 (6 marks). Level 1 (1–3) Response may broadly discuss how convection leads to precipitation but does not address the question and does not come to a convincing conclusion. Response is descriptive, knowledge is basic and understanding is poor. Level 0 (0) No creditable response. 15
Mark scheme, page 13
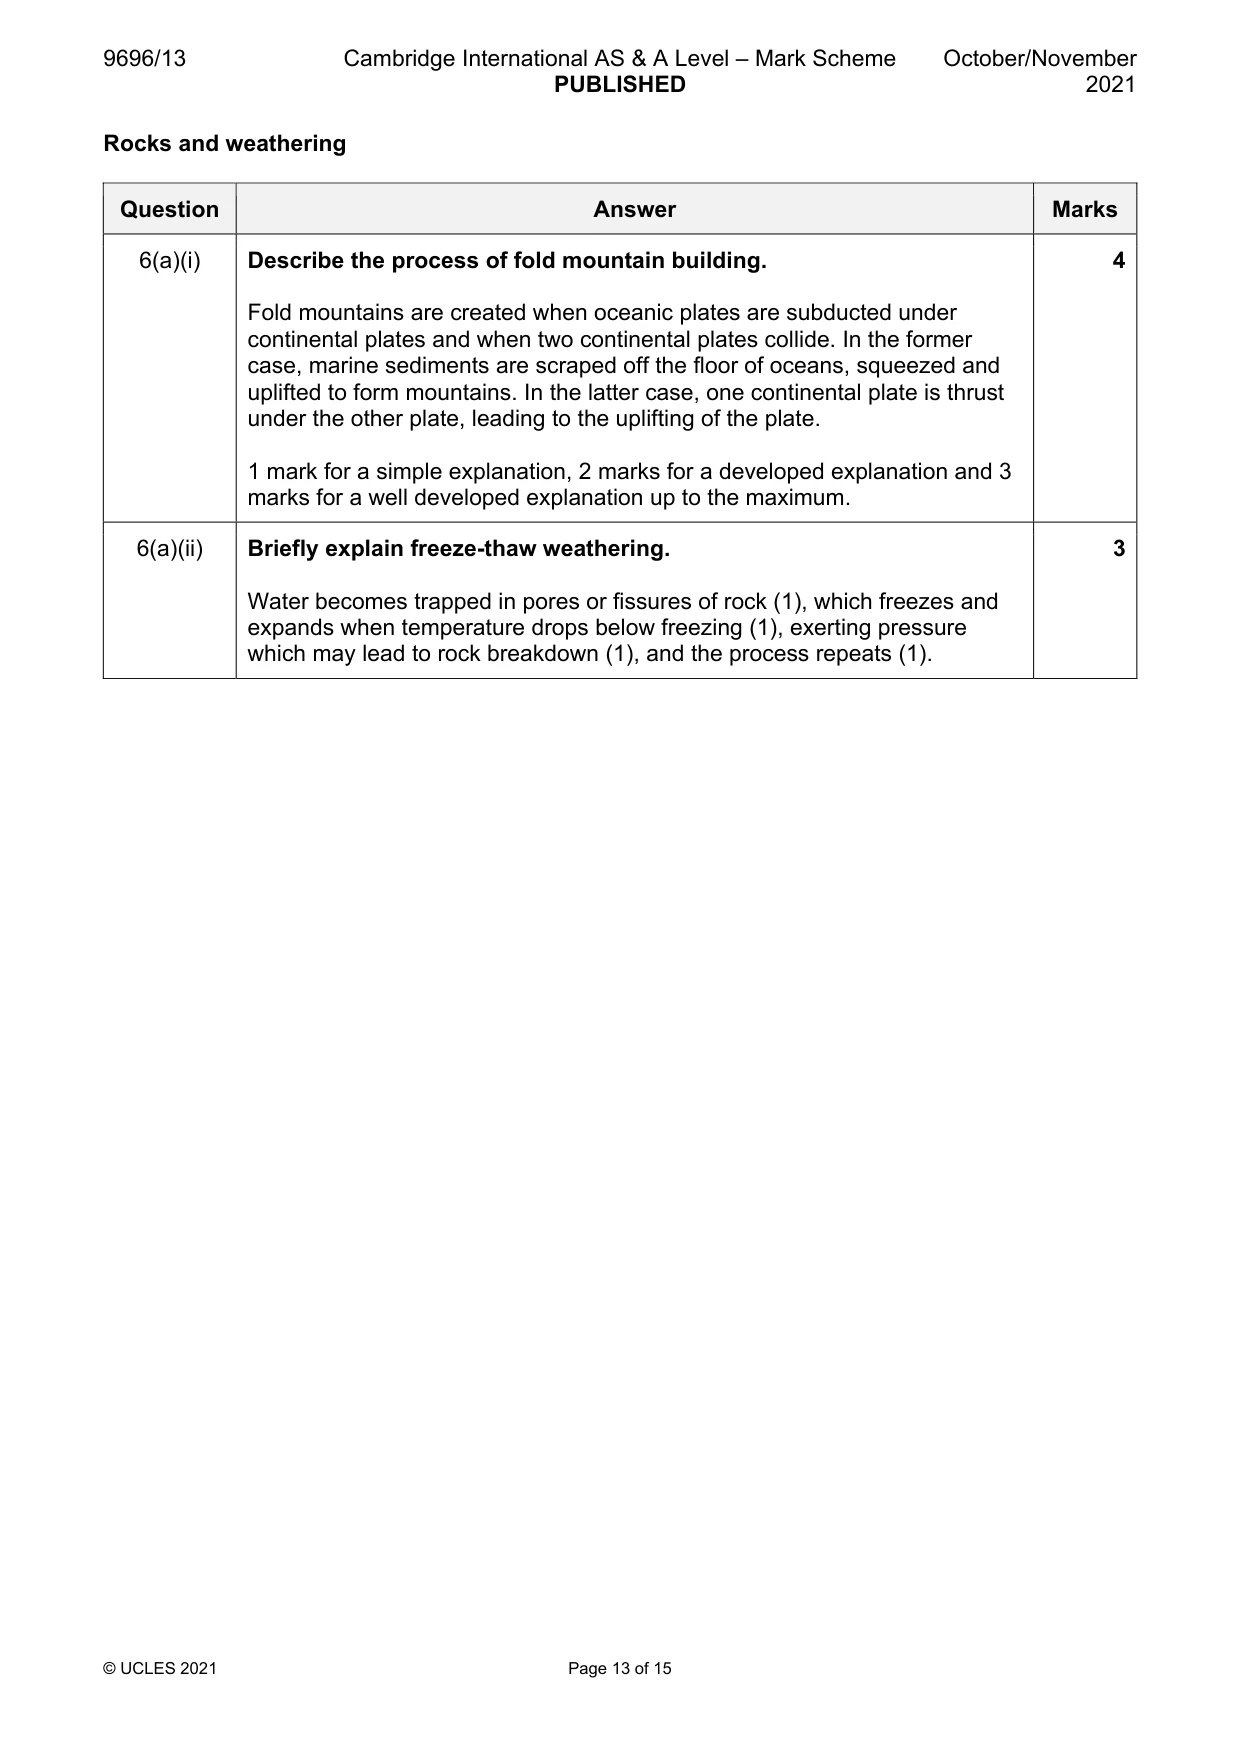
9696/13 Cambridge International AS & A Level – Mark Scheme PUBLISHED October/November 2021 © UCLES 2021 Page 13 of 15 Rocks and weathering Question Answer Marks 6(a)(i) Describe the process of fold mountain building. Fold mountains are created when oceanic plates are subducted under continental plates and when two continental plates collide. In the former case, marine sediments are scraped off the floor of oceans, squeezed and uplifted to form mountains. In the latter case, one continental plate is thrust under the other plate, leading to the uplifting of the plate. 1 mark for a simple explanation, 2 marks for a developed explanation and 3 marks for a well developed explanation up to the maximum. 4 6(a)(ii) Briefly explain freeze-thaw weathering. Water becomes trapped in pores or fissures of rock (1), which freezes and expands when temperature drops below freezing (1), exerting pressure which may lead to rock breakdown (1), and the process repeats (1). 3
Mark scheme, page 14
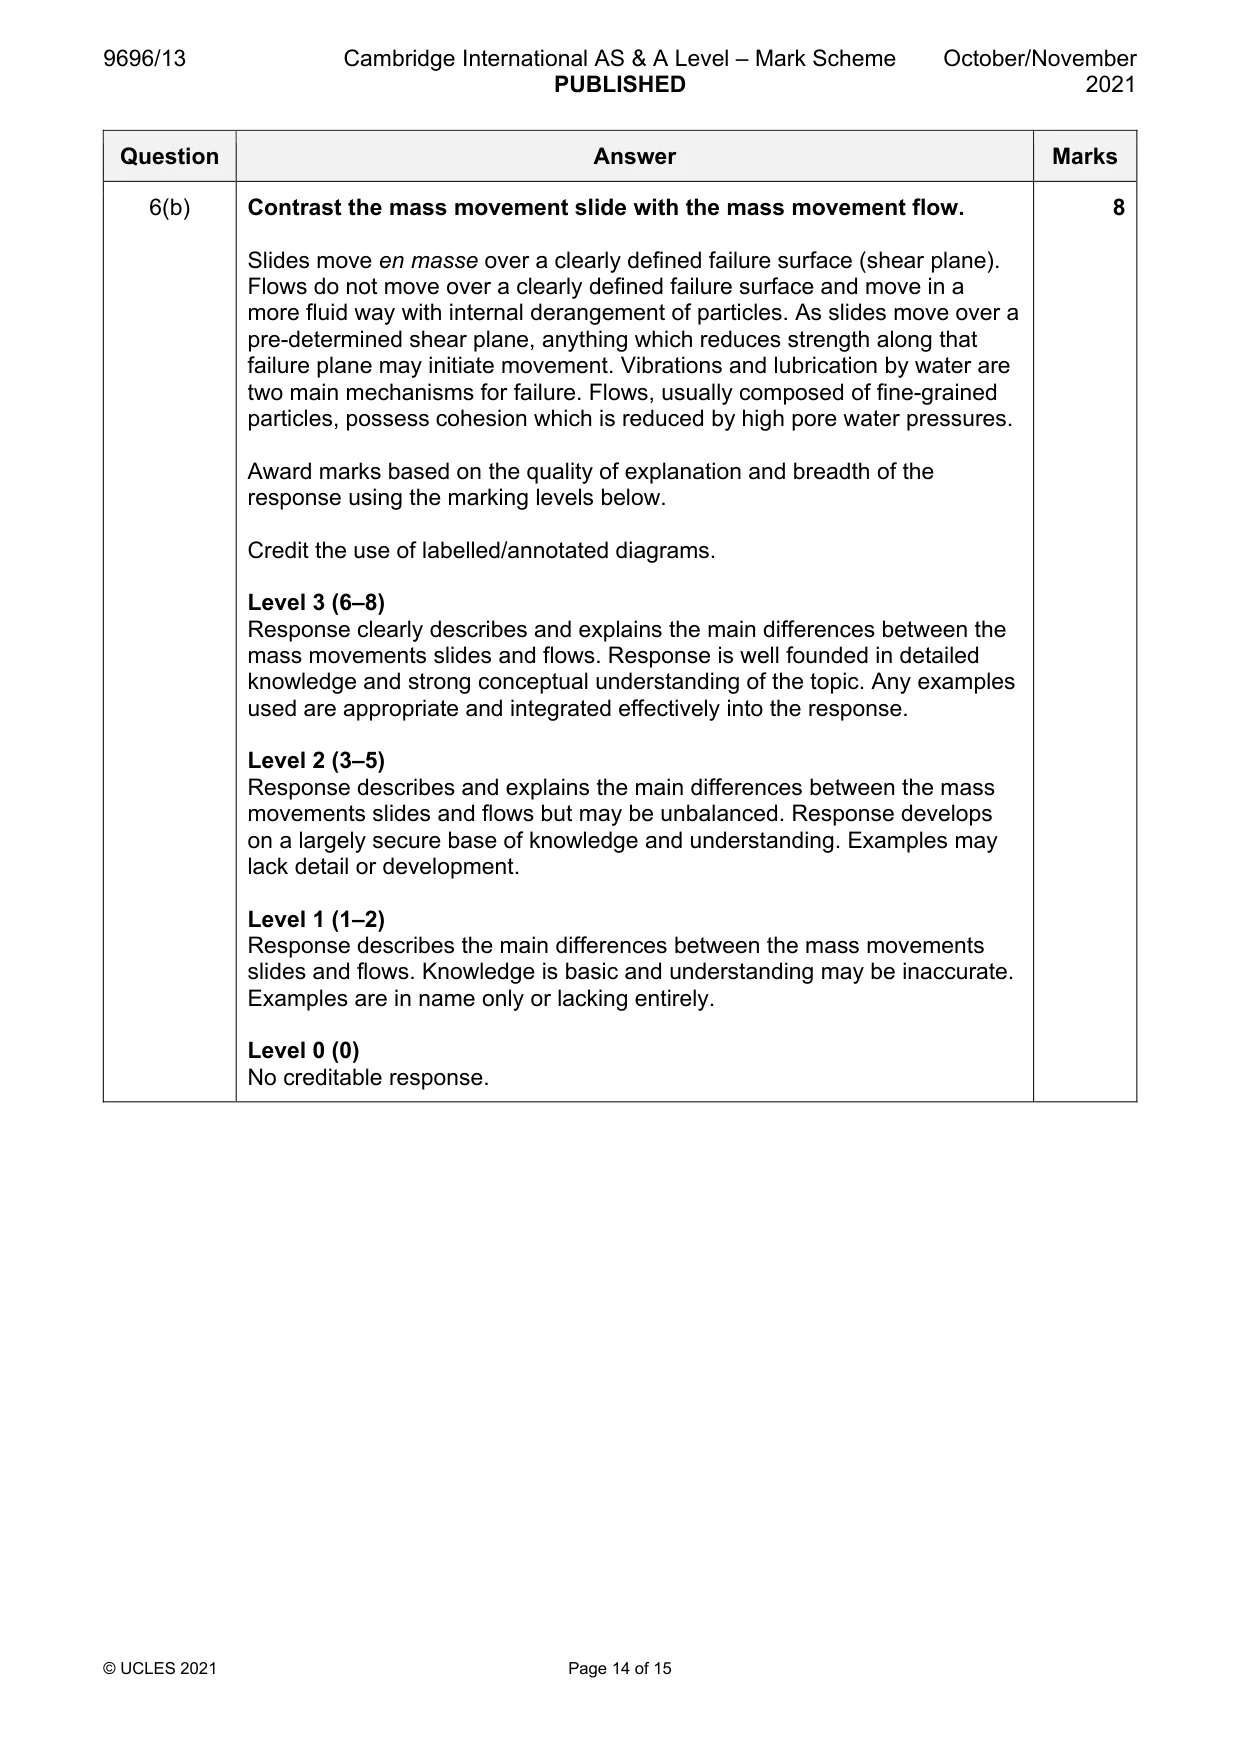
9696/13 Cambridge International AS & A Level – Mark Scheme PUBLISHED October/November 2021 © UCLES 2021 Page 14 of 15 Question Answer Marks 6(b) Contrast the mass movement slide with the mass movement flow. Slides move en masse over a clearly defined failure surface (shear plane). Flows do not move over a clearly defined failure surface and move in a more fluid way with internal derangement of particles. As slides move over a pre-determined shear plane, anything which reduces strength along that failure plane may initiate movement. Vibrations and lubrication by water are two main mechanisms for failure. Flows, usually composed of fine-grained particles, possess cohesion which is reduced by high pore water pressures. Award marks based on the quality of explanation and breadth of the response using the marking levels below. Credit the use of labelled/annotated diagrams. Level 3 (6–8) Response clearly describes and explains the main differences between the mass movements slides and flows. Response is well founded in detailed knowledge and strong conceptual understanding of the topic. Any examples used are appropriate and integrated effectively into the response. Level 2 (3–5) Response describes and explains the main differences between the mass movements slides and flows but may be unbalanced. Response develops on a largely secure base of knowledge and understanding. Examples may lack detail or development. Level 1 (1–2) Response describes the main differences between the mass movements slides and flows. Knowledge is basic and understanding may be inaccurate. Examples are in name only or lacking entirely. Level 0 (0) No creditable response. 8
Mark scheme, page 15
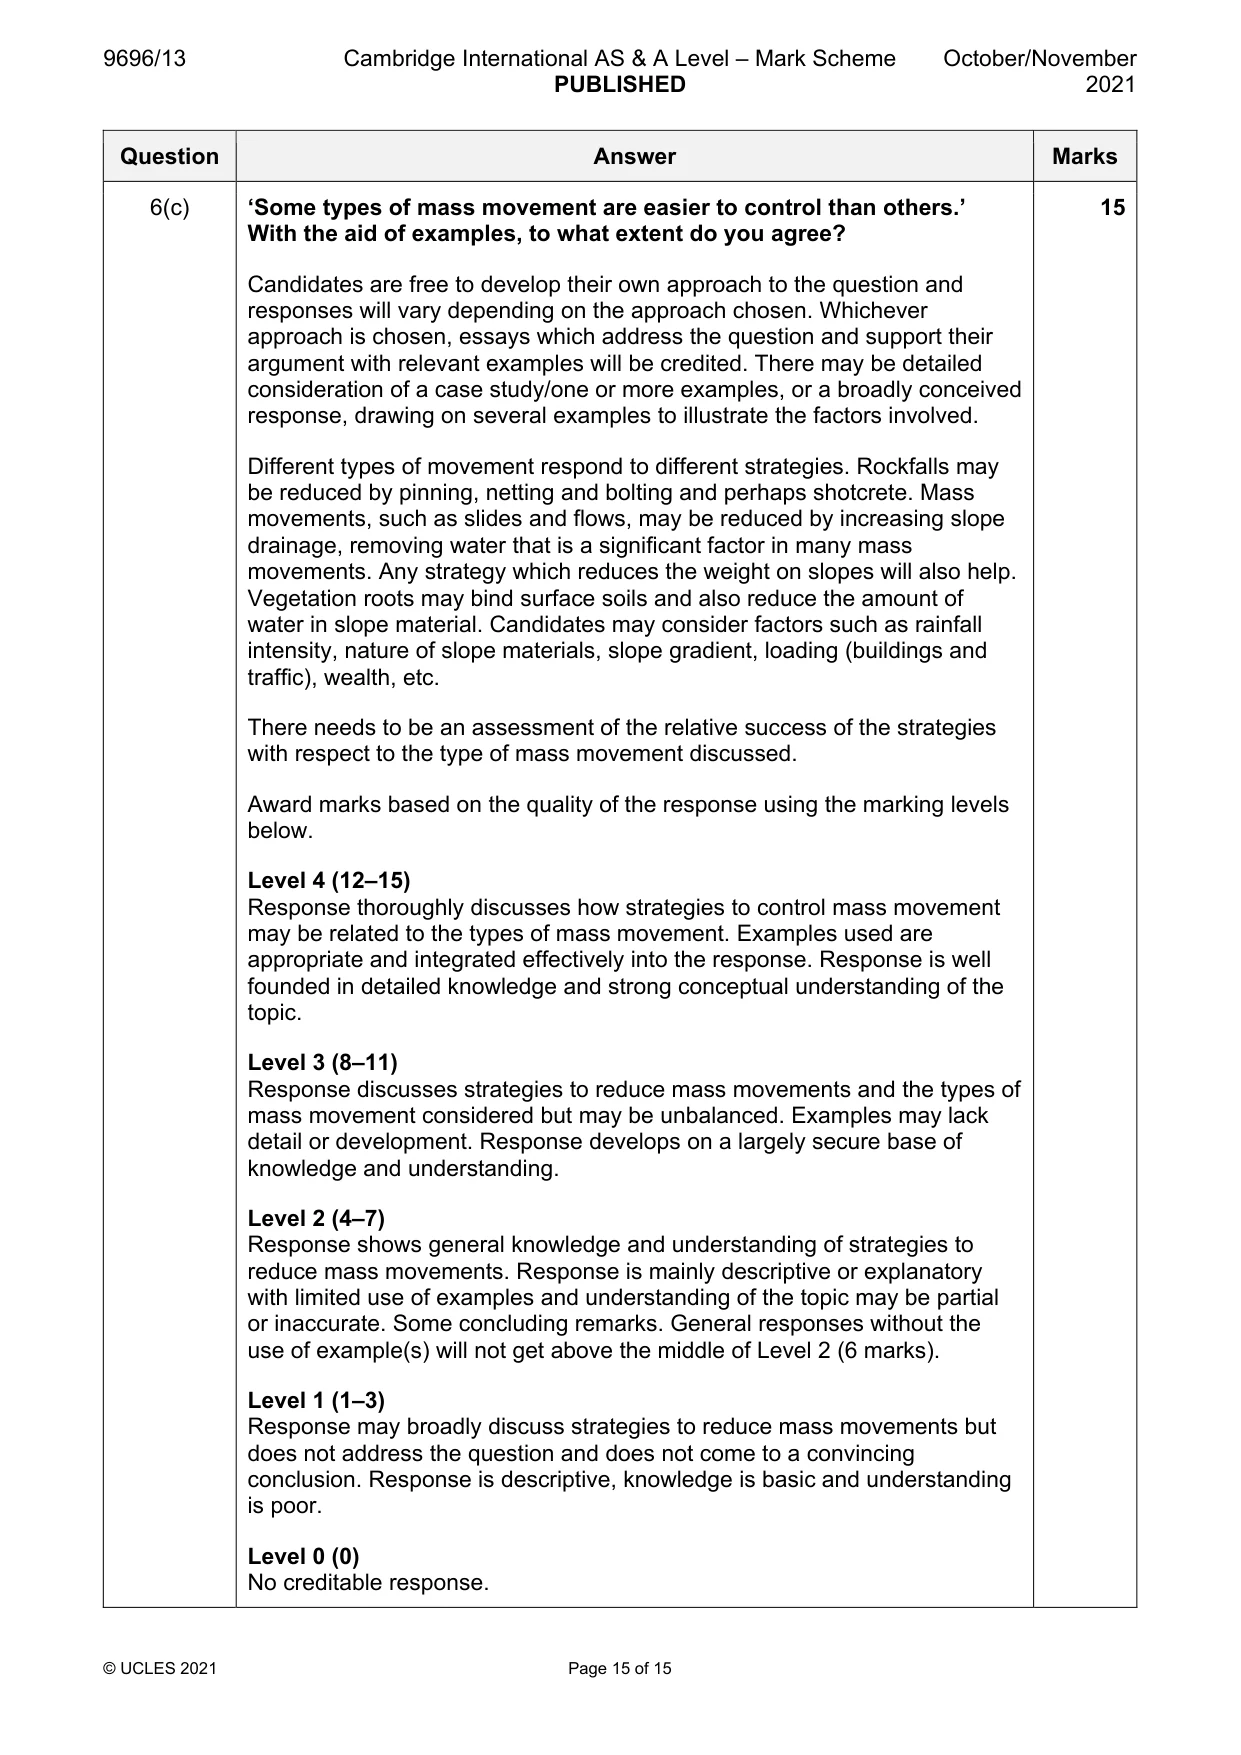
9696/13 Cambridge International AS & A Level – Mark Scheme PUBLISHED October/November 2021 © UCLES 2021 Page 15 of 15 Question Answer Marks 6(c) ‘Some types of mass movement are easier to control than others.’ With the aid of examples, to what extent do you agree? Candidates are free to develop their own approach to the question and responses will vary depending on the approach chosen. Whichever approach is chosen, essays which address the question and support their argument with relevant examples will be credited. There may be detailed consideration of a case study/one or more examples, or a broadly conceived response, drawing on several examples to illustrate the factors involved. Different types of movement respond to different strategies. Rockfalls may be reduced by pinning, netting and bolting and perhaps shotcrete. Mass movements, such as slides and flows, may be reduced by increasing slope drainage, removing water that is a significant factor in many mass movements. Any strategy which reduces the weight on slopes will also help. Vegetation roots may bind surface soils and also reduce the amount of water in slope material. Candidates may consider factors such as rainfall intensity, nature of slope materials, slope gradient, loading (buildings and traffic), wealth, etc. There needs to be an assessment of the relative success of the strategies with respect to the type of mass movement discussed. Award marks based on the quality of the response using the marking levels below. Level 4 (12–15) Response thoroughly discusses how strategies to control mass movement may be related to the types of mass movement. Examples used are appropriate and integrated effectively into the response. Response is well founded in detailed knowledge and strong conceptual understanding of the topic. Level 3 (8–11) Response discusses strategies to reduce mass movements and the types of mass movement considered but may be unbalanced. Examples may lack detail or development. Response develops on a largely secure base of knowledge and understanding. Level 2 (4–7) Response shows general knowledge and understanding of strategies to reduce mass movements. Response is mainly descriptive or explanatory with limited use of examples and understanding of the topic may be partial or inaccurate. Some concluding remarks. General responses without the use of example(s) will not get above the middle of Level 2 (6 marks). Level 1 (1–3) Response may broadly discuss strategies to reduce mass movements but does not address the question and does not come to a convincing conclusion. Response is descriptive, knowledge is basic and understanding is poor. Level 0 (0) No creditable response. 15
What you needed in this session
Cambridge’s own grade thresholds for 2021 Oct/Nov, Paper 1 · Variant 3. A higher threshold means an easier paper — the bar moves with how the cohort did.