Cambridge A Level Geography 9696 — 2021 May/June Paper 1 · Variant 3
9696/13/M/J/21 · 60 marks · ≈68 min
The question paper and its mark scheme, free to read here and free to download. This is Cambridge’s own paper, exactly as it was sat.
Question paper4 pages

Mark scheme14 pages
Answers below. Sit the paper first if you are practising.


Paper as text
Question paper, page 1
This document has 4 pages. Any blank pages are indicated. Cambridge International AS & A Level DC (DH) 199459/2 © UCLES 2021 [Turn over * 9 2 0 3 8 8 7 7 5 0 * GEOGRAPHY 9696/13 Paper 1 Core Physical Geography May/June 2021 1 hour 30 minutes You must answer on the enclosed answer booklet. You will need: Answer booklet (enclosed) Insert (enclosed) INSTRUCTIONS ● Answer four questions in total: Section A: answer all questions. Section B: answer one question. ● Follow the instructions on the front cover of the answer booklet. If you need additional answer paper, ask the invigilator for a continuation booklet. ● Sketch maps and diagrams should be drawn whenever they serve to illustrate an answer. INFORMATION ● The total mark for this paper is 60. ● The number of marks for each question or part question is shown in brackets [ ]. ● The insert contains all the resources referred to in the questions.
Question paper, page 2
2 9696/13/M/J/21 © UCLES 2021 Section A Answer all questions in this section. All questions are worth 10 marks. Hydrology and fluvial geomorphology 1 Fig. 1.1 and Fig. 1.2 show catchment flows in a drainage basin system before and after deforestation. (a) (i) Name flow X in Fig. 1.1. [1] (ii) Calculate flow Y in Fig. 1.2. [1] (b) Using Fig. 1.1 and Fig. 1.2, describe the changes to the catchment flows after deforestation. [3] (c) Suggest reasons for the changes you described in (b). [5] Atmosphere and weather 2 Fig. 2.1 is a photograph which shows weather phenomena. (a) (i) Describe the characteristics of the weather shown in Fig. 2.1. [2] (ii) Briefly explain the formation of the weather phenomena shown in Fig. 2.1. [3] (b) Suggest reasons why precipitation may not result from the weather shown in Fig. 2.1. [2] (c) Briefly explain the formation of frontal precipitation. [3] Rocks and weathering 3 Fig. 3.1 shows the location of ocean trenches in the Pacific Ocean. (a) Describe the distribution of ocean trenches shown in Fig. 3.1. [3] (b) Using Fig. 3.1, explain the formation of ocean trenches. [4] (c) Briefly explain the global distribution of ocean ridges. [3]
Question paper, page 3
3 9696/13/M/J/21 © UCLES 2021 Section B Answer one question from this section. All questions are worth 30 marks. Hydrology and fluvial geomorphology 4 (a) (i) Describe the formation of a river cliff. [3] (ii) Briefly explain two characteristics of a drainage basin which influence its drainage density. [4] (b) Explain how flood forecasts and warnings may prevent and ameliorate river floods. [8] (c) ‘Rock type is the most significant influence on the shape of a storm hydrograph.’ With the aid of examples, how far do you agree? [15] Atmosphere and weather 5 (a) (i) Define the atmospheric terms melting and reflected solar radiation. [4] (ii) Briefly explain one way solar energy absorbed into the surface affects the diurnal energy budget. [3] (b) Explain the seasonal variation in global wind belts. [8] (c) ‘The most significant effect of human activity on urban climates is on temperature.’ With the aid of examples, how far do you agree? [15] Rocks and weathering 6 (a) (i) Describe the effects of a mass movement flow on a slope. [3] (ii) Briefly explain the small-scale movements of sediment on slopes. [4] (b) Explain how temperature influences the type and rate of weathering. [8] (c) With the aid of case study material, evaluate attempts to reduce mass movement on slopes. [15]
Question paper, page 4
4 9696/13/M/J/21 © UCLES 2021 BLANK PAGE The boundaries and names shown, the designations used and the presentation of material on any maps contained in this question paper/insert do not imply official endorsement or acceptance by Cambridge Assessment International Education concerning the legal status of any country, territory, or area or any of its authorities, or of the delimitation of its frontiers or boundaries. Permission to reproduce items where third-party owned material protected by copyright is included has been sought and cleared where possible. Every reasonable effort has been made by the publisher (UCLES) to trace copyright holders, but if any items requiring clearance have unwittingly been included, the publisher will be pleased to make amends at the earliest possible opportunity. To avoid the issue of disclosure of answer-related information to candidates, all copyright acknowledgements are reproduced online in the Cambridge Assessment International Education Copyright Acknowledgements Booklet. This is produced for each series of examinations and is freely available to download at www.cambridgeinternational.org after the live examination series. Cambridge Assessment International Education is part of the Cambridge Assessment Group. Cambridge Assessment is the brand name of the University of Cambridge Local Examinations Syndicate (UCLES), which itself is a department of the University of Cambridge.
Mark scheme, page 1
This document consists of 14 printed pages. © UCLES 2021 [Turn over Cambridge International AS & A Level GEOGRAPHY 9696/13 Paper 1 Core Physical Geography May/June 2021 MARK SCHEME Maximum Mark: 60 Published This mark scheme is published as an aid to teachers and candidates, to indicate the requirements of the examination. It shows the basis on which Examiners were instructed to award marks. It does not indicate the details of the discussions that took place at an Examiners’ meeting before marking began, which would have considered the acceptability of alternative answers. Mark schemes should be read in conjunction with the question paper and the Principal Examiner Report for Teachers. Cambridge International will not enter into discussions about these mark schemes. Cambridge International is publishing the mark schemes for the May/June 2021 series for most Cambridge IGCSE™, Cambridge International A and AS Level components and some Cambridge O Level components.
Mark scheme, page 2
9696/13 Cambridge International AS & A Level – Mark Scheme PUBLISHED May/June 2021 © UCLES 2021 Page 2 of 14 Generic Marking Principles These general marking principles must be applied by all examiners when marking candidate answers. They should be applied alongside the specific content of the mark scheme or generic level descriptors for a question. Each question paper and mark scheme will also comply with these marking principles. GENERIC MARKING PRINCIPLE 1: Marks must be awarded in line with: • the specific content of the mark scheme or the generic level descriptors for the question • the specific skills defined in the mark scheme or in the generic level descriptors for the question • the standard of response required by a candidate as exemplified by the standardisation scripts. GENERIC MARKING PRINCIPLE 2: Marks awarded are always whole marks (not half marks, or other fractions). GENERIC MARKING PRINCIPLE 3: Marks must be awarded positively: • marks are awarded for correct/valid answers, as defined in the mark scheme. However, credit is given for valid answers which go beyond the scope of the syllabus and mark scheme, referring to your Team Leader as appropriate • marks are awarded when candidates clearly demonstrate what they know and can do • marks are not deducted for errors • marks are not deducted for omissions • answers should only be judged on the quality of spelling, punctuation and grammar when these features are specifically assessed by the question as indicated by the mark scheme. The meaning, however, should be unambiguous. GENERIC MARKING PRINCIPLE 4: Rules must be applied consistently, e.g. in situations where candidates have not followed instructions or in the application of generic level descriptors. GENERIC MARKING PRINCIPLE 5: Marks should be awarded using the full range of marks defined in the mark scheme for the question (however; the use of the full mark range may be limited according to the quality of the candidate responses seen). GENERIC MARKING PRINCIPLE 6: Marks awarded are based solely on the requirements as defined in the mark scheme. Marks should not be awarded with grade thresholds or grade descriptors in mind.
Mark scheme, page 3
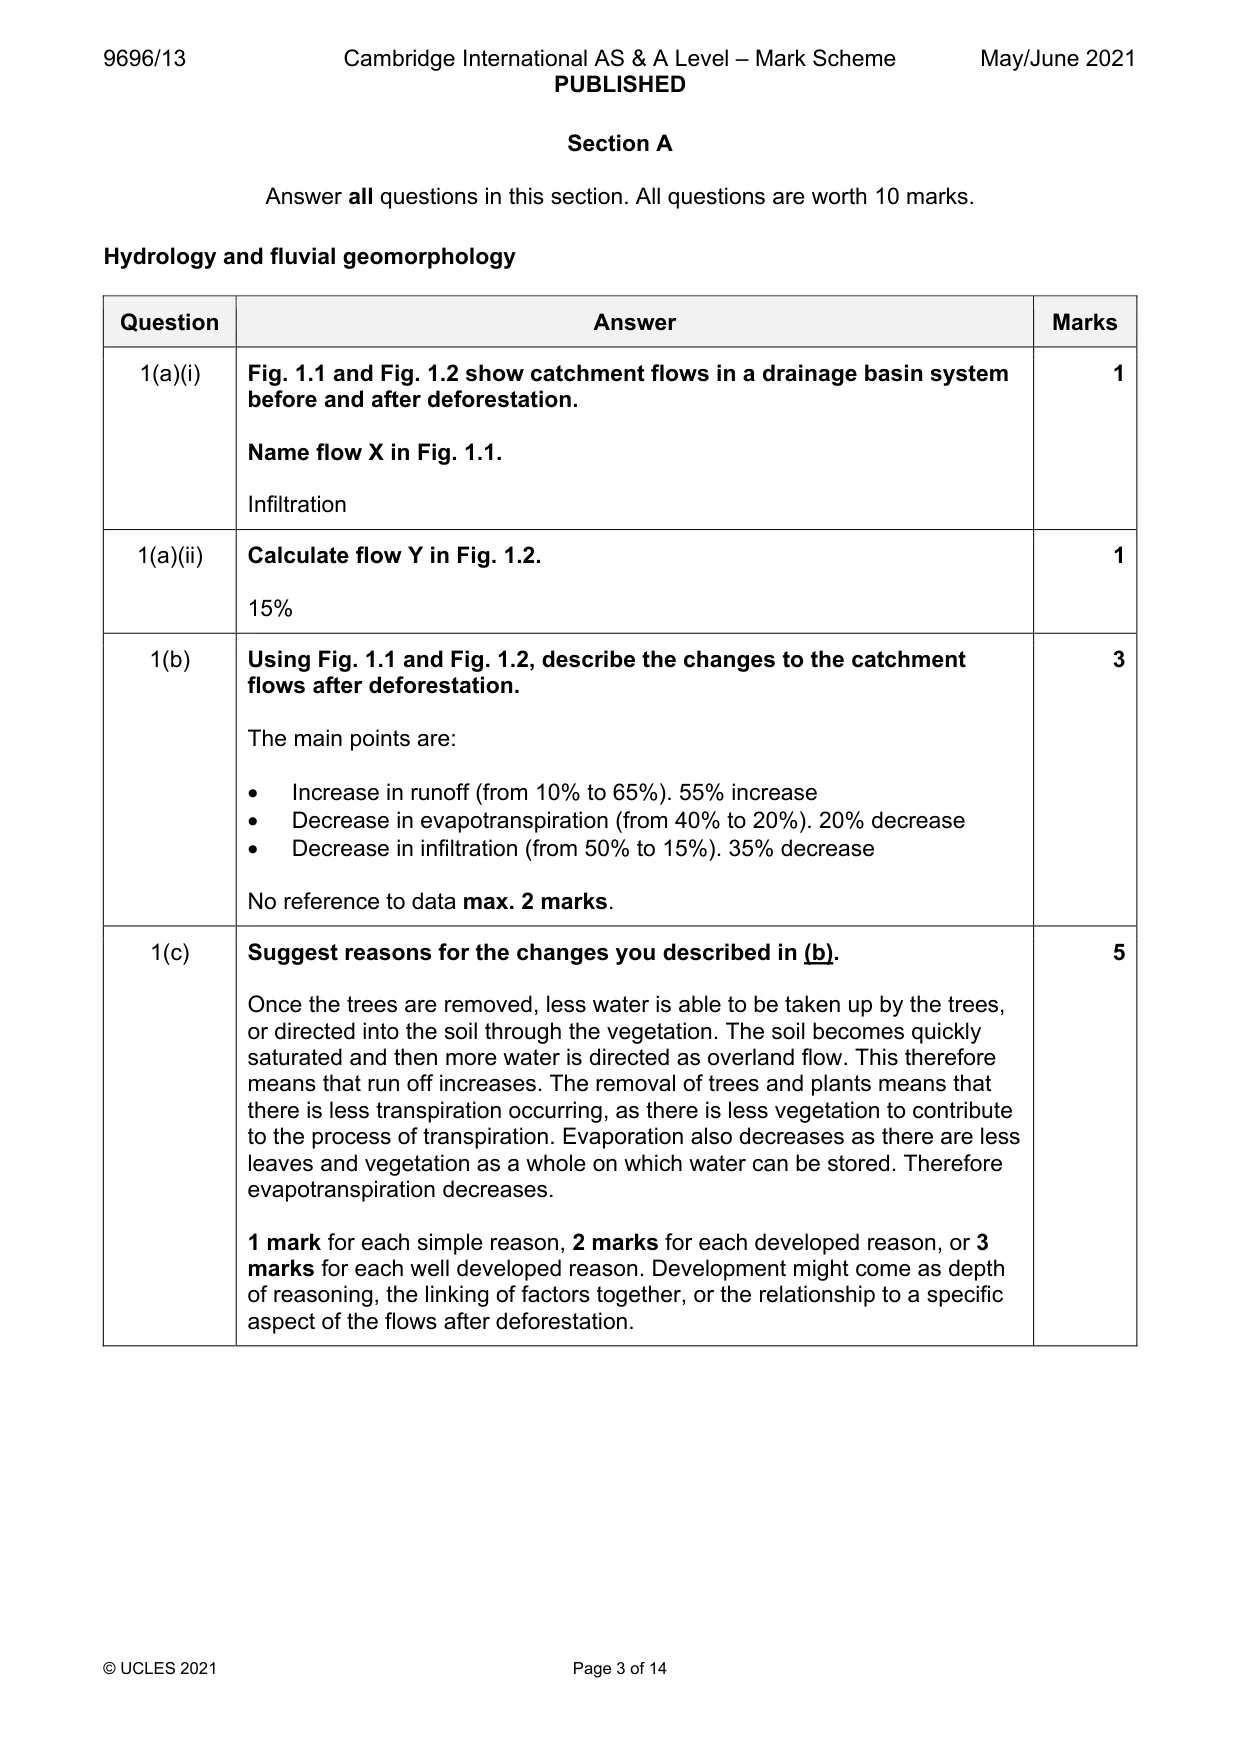
9696/13 Cambridge International AS & A Level – Mark Scheme PUBLISHED May/June 2021 © UCLES 2021 Page 3 of 14 Section A Answer all questions in this section. All questions are worth 10 marks. Hydrology and fluvial geomorphology Question Answer Marks 1(a)(i) Fig. 1.1 and Fig. 1.2 show catchment flows in a drainage basin system before and after deforestation. Name flow X in Fig. 1.1. Infiltration 1 1(a)(ii) Calculate flow Y in Fig. 1.2. 15% 1 1(b) Using Fig. 1.1 and Fig. 1.2, describe the changes to the catchment flows after deforestation. The main points are: • Increase in runoff (from 10% to 65%). 55% increase • Decrease in evapotranspiration (from 40% to 20%). 20% decrease • Decrease in infiltration (from 50% to 15%). 35% decrease No reference to data max. 2 marks. 3 1(c) Suggest reasons for the changes you described in (b). Once the trees are removed, less water is able to be taken up by the trees, or directed into the soil through the vegetation. The soil becomes quickly saturated and then more water is directed as overland flow. This therefore means that run off increases. The removal of trees and plants means that there is less transpiration occurring, as there is less vegetation to contribute to the process of transpiration. Evaporation also decreases as there are less leaves and vegetation as a whole on which water can be stored. Therefore evapotranspiration decreases. 1 mark for each simple reason, 2 marks for each developed reason, or 3 marks for each well developed reason. Development might come as depth of reasoning, the linking of factors together, or the relationship to a specific aspect of the flows after deforestation. 5
Mark scheme, page 4
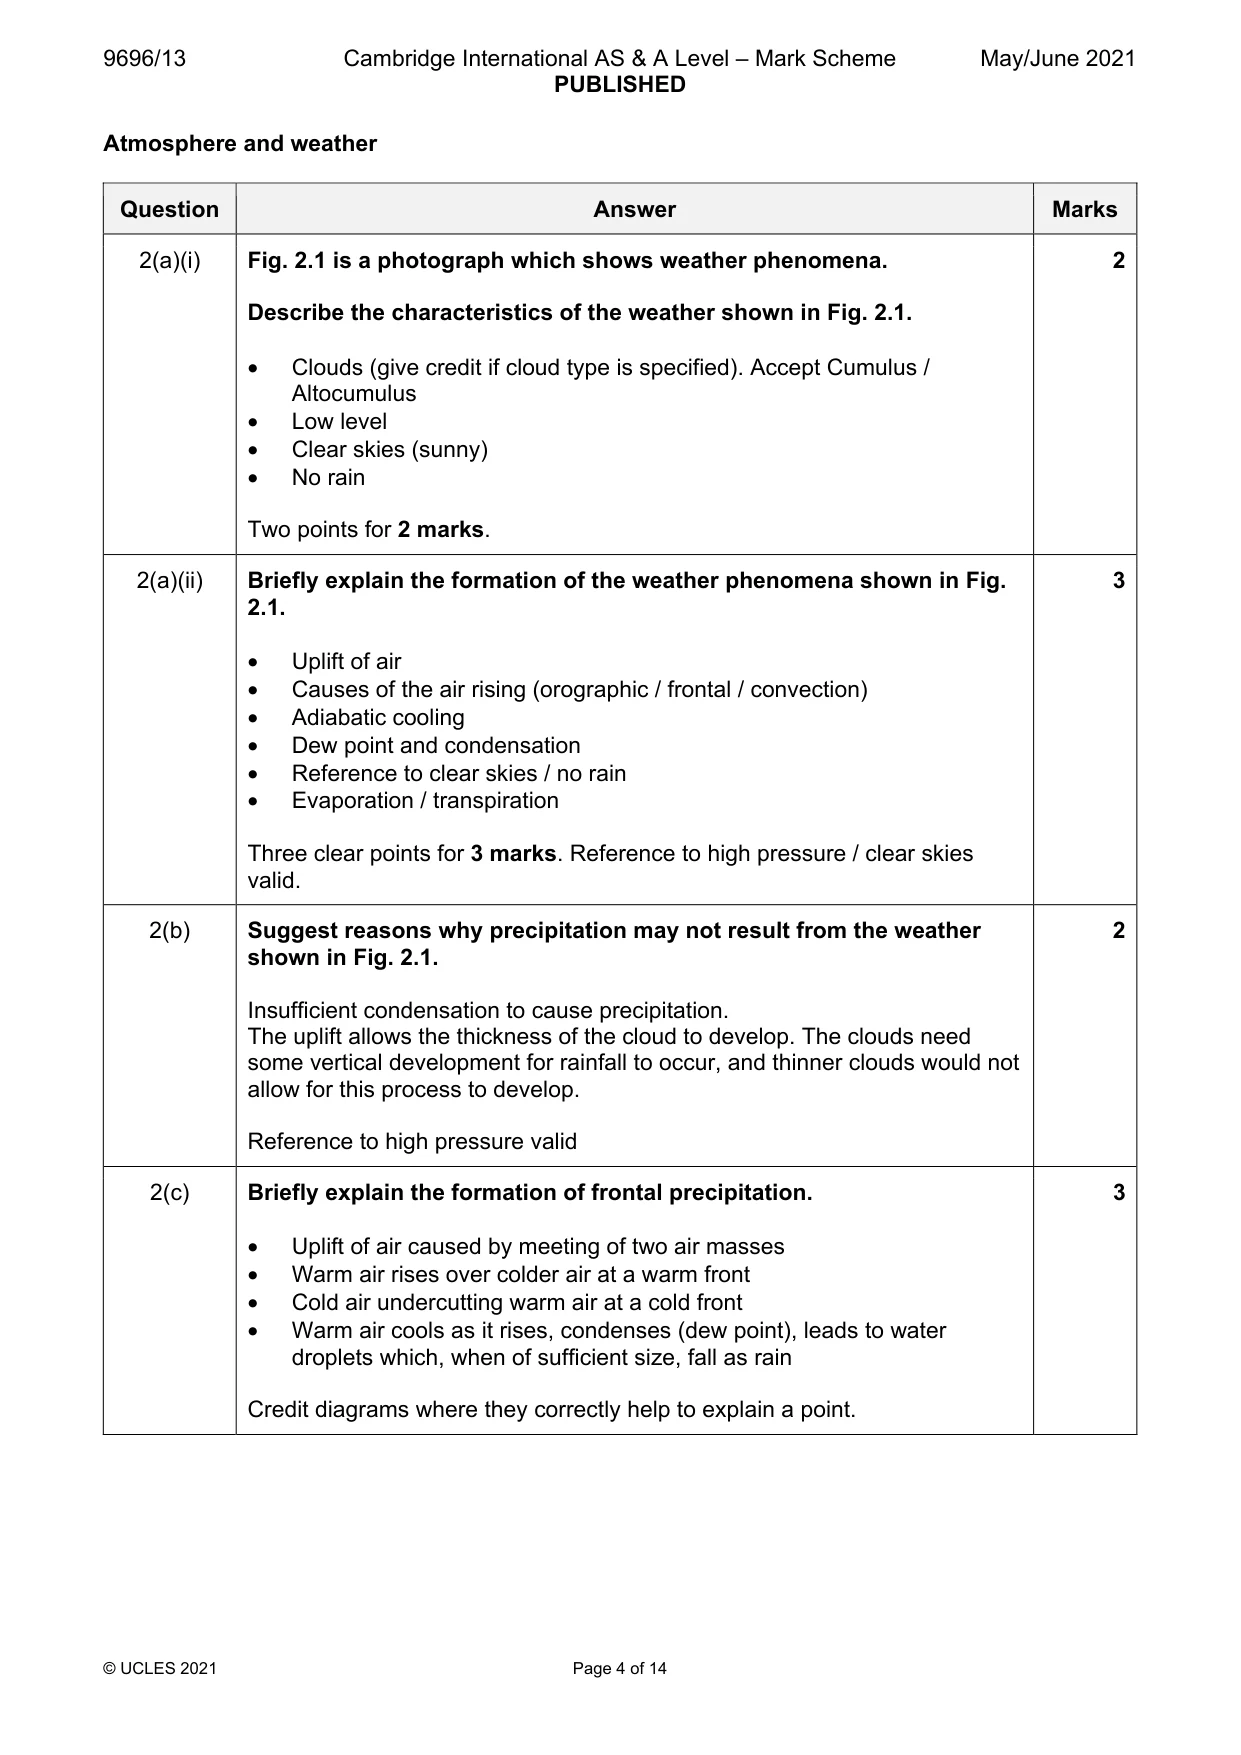
9696/13 Cambridge International AS & A Level – Mark Scheme PUBLISHED May/June 2021 © UCLES 2021 Page 4 of 14 Atmosphere and weather Question Answer Marks 2(a)(i) Fig. 2.1 is a photograph which shows weather phenomena. Describe the characteristics of the weather shown in Fig. 2.1. • Clouds (give credit if cloud type is specified). Accept Cumulus / Altocumulus • Low level • Clear skies (sunny) • No rain Two points for 2 marks. 2 2(a)(ii) Briefly explain the formation of the weather phenomena shown in Fig. 2.1. • Uplift of air • Causes of the air rising (orographic / frontal / convection) • Adiabatic cooling • Dew point and condensation • Reference to clear skies / no rain • Evaporation / transpiration Three clear points for 3 marks. Reference to high pressure / clear skies valid. 3 2(b) Suggest reasons why precipitation may not result from the weather shown in Fig. 2.1. Insufficient condensation to cause precipitation. The uplift allows the thickness of the cloud to develop. The clouds need some vertical development for rainfall to occur, and thinner clouds would not allow for this process to develop. Reference to high pressure valid 2 2(c) Briefly explain the formation of frontal precipitation. • Uplift of air caused by meeting of two air masses • Warm air rises over colder air at a warm front • Cold air undercutting warm air at a cold front • Warm air cools as it rises, condenses (dew point), leads to water droplets which, when of sufficient size, fall as rain Credit diagrams where they correctly help to explain a point. 3
Mark scheme, page 5
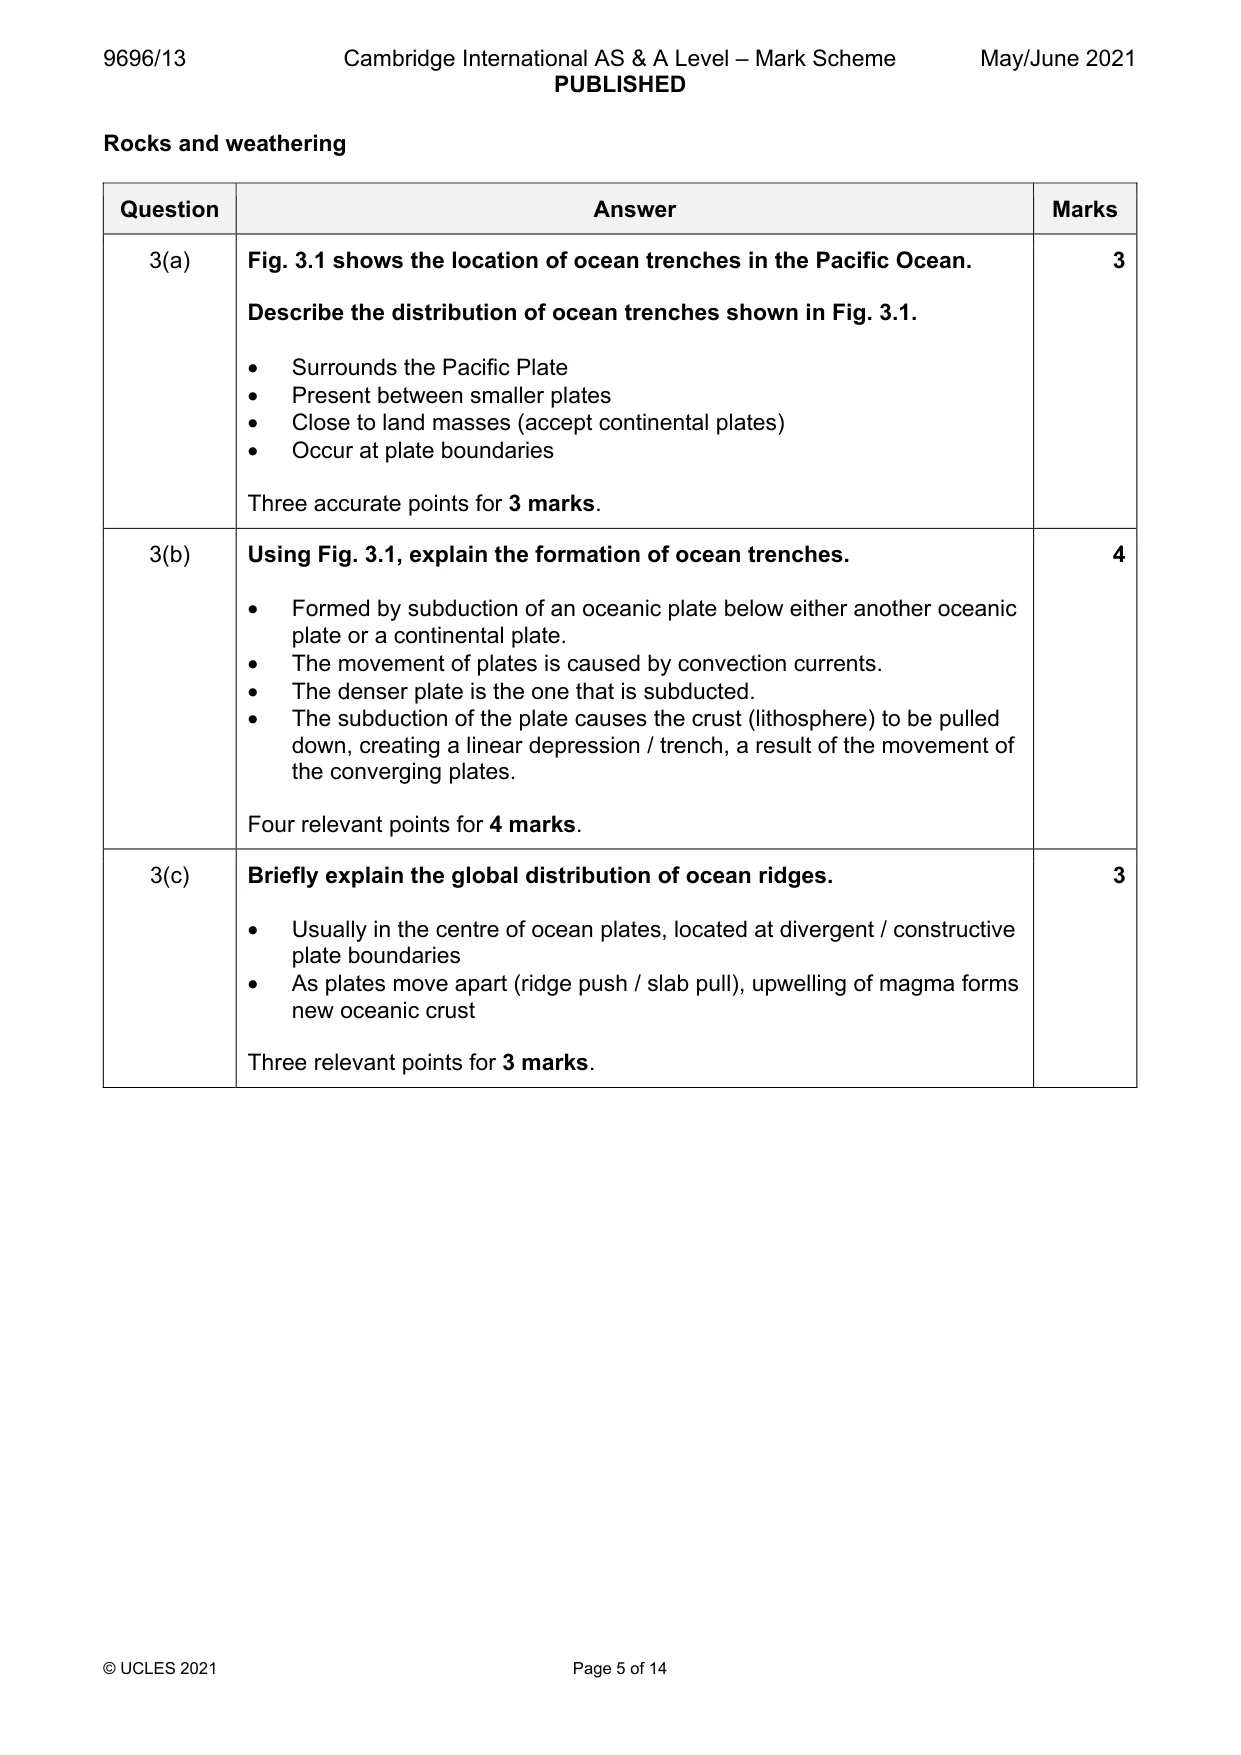
9696/13 Cambridge International AS & A Level – Mark Scheme PUBLISHED May/June 2021 © UCLES 2021 Page 5 of 14 Rocks and weathering Question Answer Marks 3(a) Fig. 3.1 shows the location of ocean trenches in the Pacific Ocean. Describe the distribution of ocean trenches shown in Fig. 3.1. • Surrounds the Pacific Plate • Present between smaller plates • Close to land masses (accept continental plates) • Occur at plate boundaries Three accurate points for 3 marks. 3 3(b) Using Fig. 3.1, explain the formation of ocean trenches. • Formed by subduction of an oceanic plate below either another oceanic plate or a continental plate. • The movement of plates is caused by convection currents. • The denser plate is the one that is subducted. • The subduction of the plate causes the crust (lithosphere) to be pulled down, creating a linear depression / trench, a result of the movement of the converging plates. Four relevant points for 4 marks. 4 3(c) Briefly explain the global distribution of ocean ridges. • Usually in the centre of ocean plates, located at divergent / constructive plate boundaries • As plates move apart (ridge push / slab pull), upwelling of magma forms new oceanic crust Three relevant points for 3 marks. 3
Mark scheme, page 6
9696/13 Cambridge International AS & A Level – Mark Scheme PUBLISHED May/June 2021 © UCLES 2021 Page 6 of 14 Section B Answer one question from this section. All questions are worth 30 marks. Hydrology and fluvial geomorphology Question Answer Marks 4(a)(i) Describe the formation of a river cliff. The main points are: • Caused by lateral erosion on the outside of a meander bend • Where the river flow is greatest • Leading to undercutting of river bank, causing a steep bank • Related to Helicoidal flow undercutting bank 3 4(a)(ii) Briefly explain two characteristics of a drainage basin which influence its drainage density. The characteristics that could be considered are: • Porosity and permeability of soils • Rock type • Relief • Vegetation • Land use • Climate 2 + 2 marks for each characteristic. 4
Mark scheme, page 7
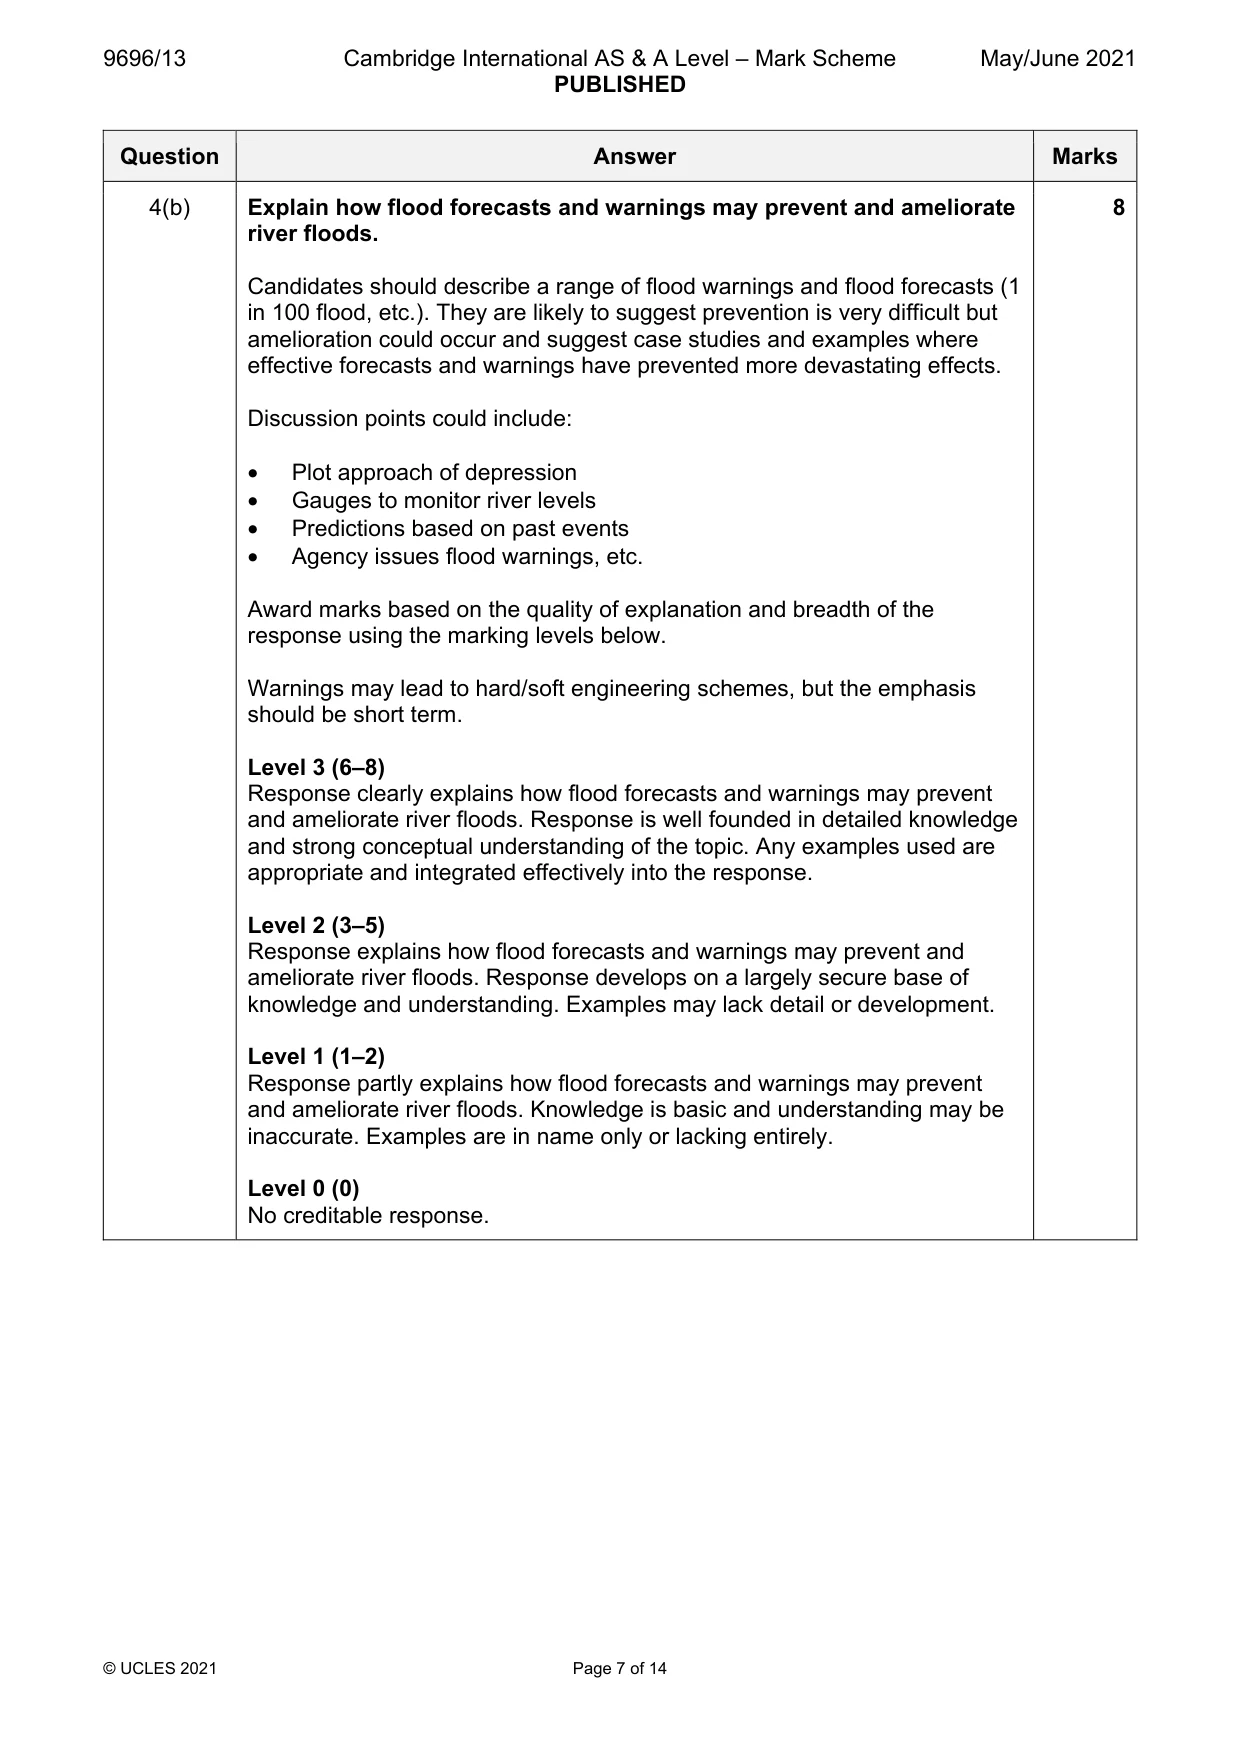
9696/13 Cambridge International AS & A Level – Mark Scheme PUBLISHED May/June 2021 © UCLES 2021 Page 7 of 14 Question Answer Marks 4(b) Explain how flood forecasts and warnings may prevent and ameliorate river floods. Candidates should describe a range of flood warnings and flood forecasts (1 in 100 flood, etc.). They are likely to suggest prevention is very difficult but amelioration could occur and suggest case studies and examples where effective forecasts and warnings have prevented more devastating effects. Discussion points could include: • Plot approach of depression • Gauges to monitor river levels • Predictions based on past events • Agency issues flood warnings, etc. Award marks based on the quality of explanation and breadth of the response using the marking levels below. Warnings may lead to hard/soft engineering schemes, but the emphasis should be short term. Level 3 (6–8) Response clearly explains how flood forecasts and warnings may prevent and ameliorate river floods. Response is well founded in detailed knowledge and strong conceptual understanding of the topic. Any examples used are appropriate and integrated effectively into the response. Level 2 (3–5) Response explains how flood forecasts and warnings may prevent and ameliorate river floods. Response develops on a largely secure base of knowledge and understanding. Examples may lack detail or development. Level 1 (1–2) Response partly explains how flood forecasts and warnings may prevent and ameliorate river floods. Knowledge is basic and understanding may be inaccurate. Examples are in name only or lacking entirely. Level 0 (0) No creditable response. 8
Mark scheme, page 8
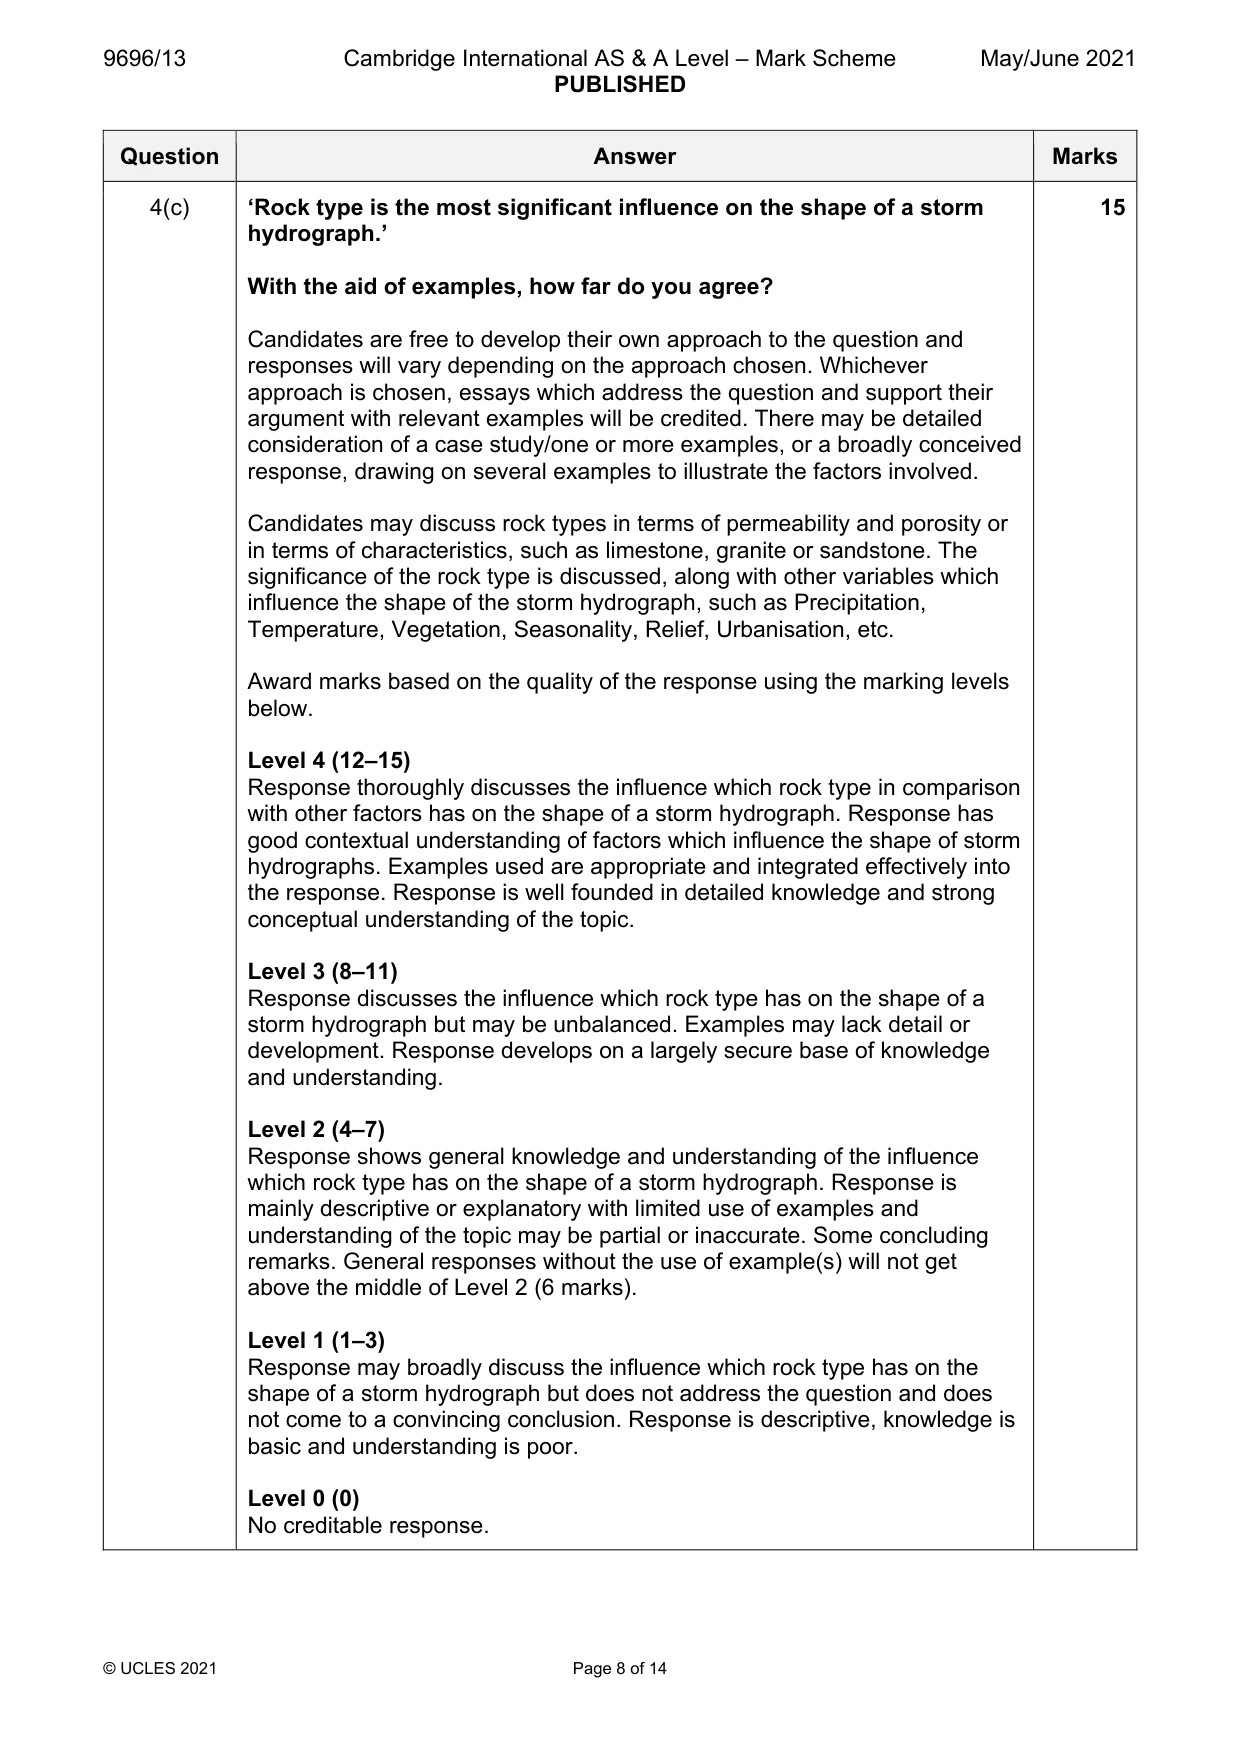
9696/13 Cambridge International AS & A Level – Mark Scheme PUBLISHED May/June 2021 © UCLES 2021 Page 8 of 14 Question Answer Marks 4(c) ‘Rock type is the most significant influence on the shape of a storm hydrograph.’ With the aid of examples, how far do you agree? Candidates are free to develop their own approach to the question and responses will vary depending on the approach chosen. Whichever approach is chosen, essays which address the question and support their argument with relevant examples will be credited. There may be detailed consideration of a case study/one or more examples, or a broadly conceived response, drawing on several examples to illustrate the factors involved. Candidates may discuss rock types in terms of permeability and porosity or in terms of characteristics, such as limestone, granite or sandstone. The significance of the rock type is discussed, along with other variables which influence the shape of the storm hydrograph, such as Precipitation, Temperature, Vegetation, Seasonality, Relief, Urbanisation, etc. Award marks based on the quality of the response using the marking levels below. Level 4 (12–15) Response thoroughly discusses the influence which rock type in comparison with other factors has on the shape of a storm hydrograph. Response has good contextual understanding of factors which influence the shape of storm hydrographs. Examples used are appropriate and integrated effectively into the response. Response is well founded in detailed knowledge and strong conceptual understanding of the topic. Level 3 (8–11) Response discusses the influence which rock type has on the shape of a storm hydrograph but may be unbalanced. Examples may lack detail or development. Response develops on a largely secure base of knowledge and understanding. Level 2 (4–7) Response shows general knowledge and understanding of the influence which rock type has on the shape of a storm hydrograph. Response is mainly descriptive or explanatory with limited use of examples and understanding of the topic may be partial or inaccurate. Some concluding remarks. General responses without the use of example(s) will not get above the middle of Level 2 (6 marks). Level 1 (1–3) Response may broadly discuss the influence which rock type has on the shape of a storm hydrograph but does not address the question and does not come to a convincing conclusion. Response is descriptive, knowledge is basic and understanding is poor. Level 0 (0) No creditable response. 15
Mark scheme, page 9
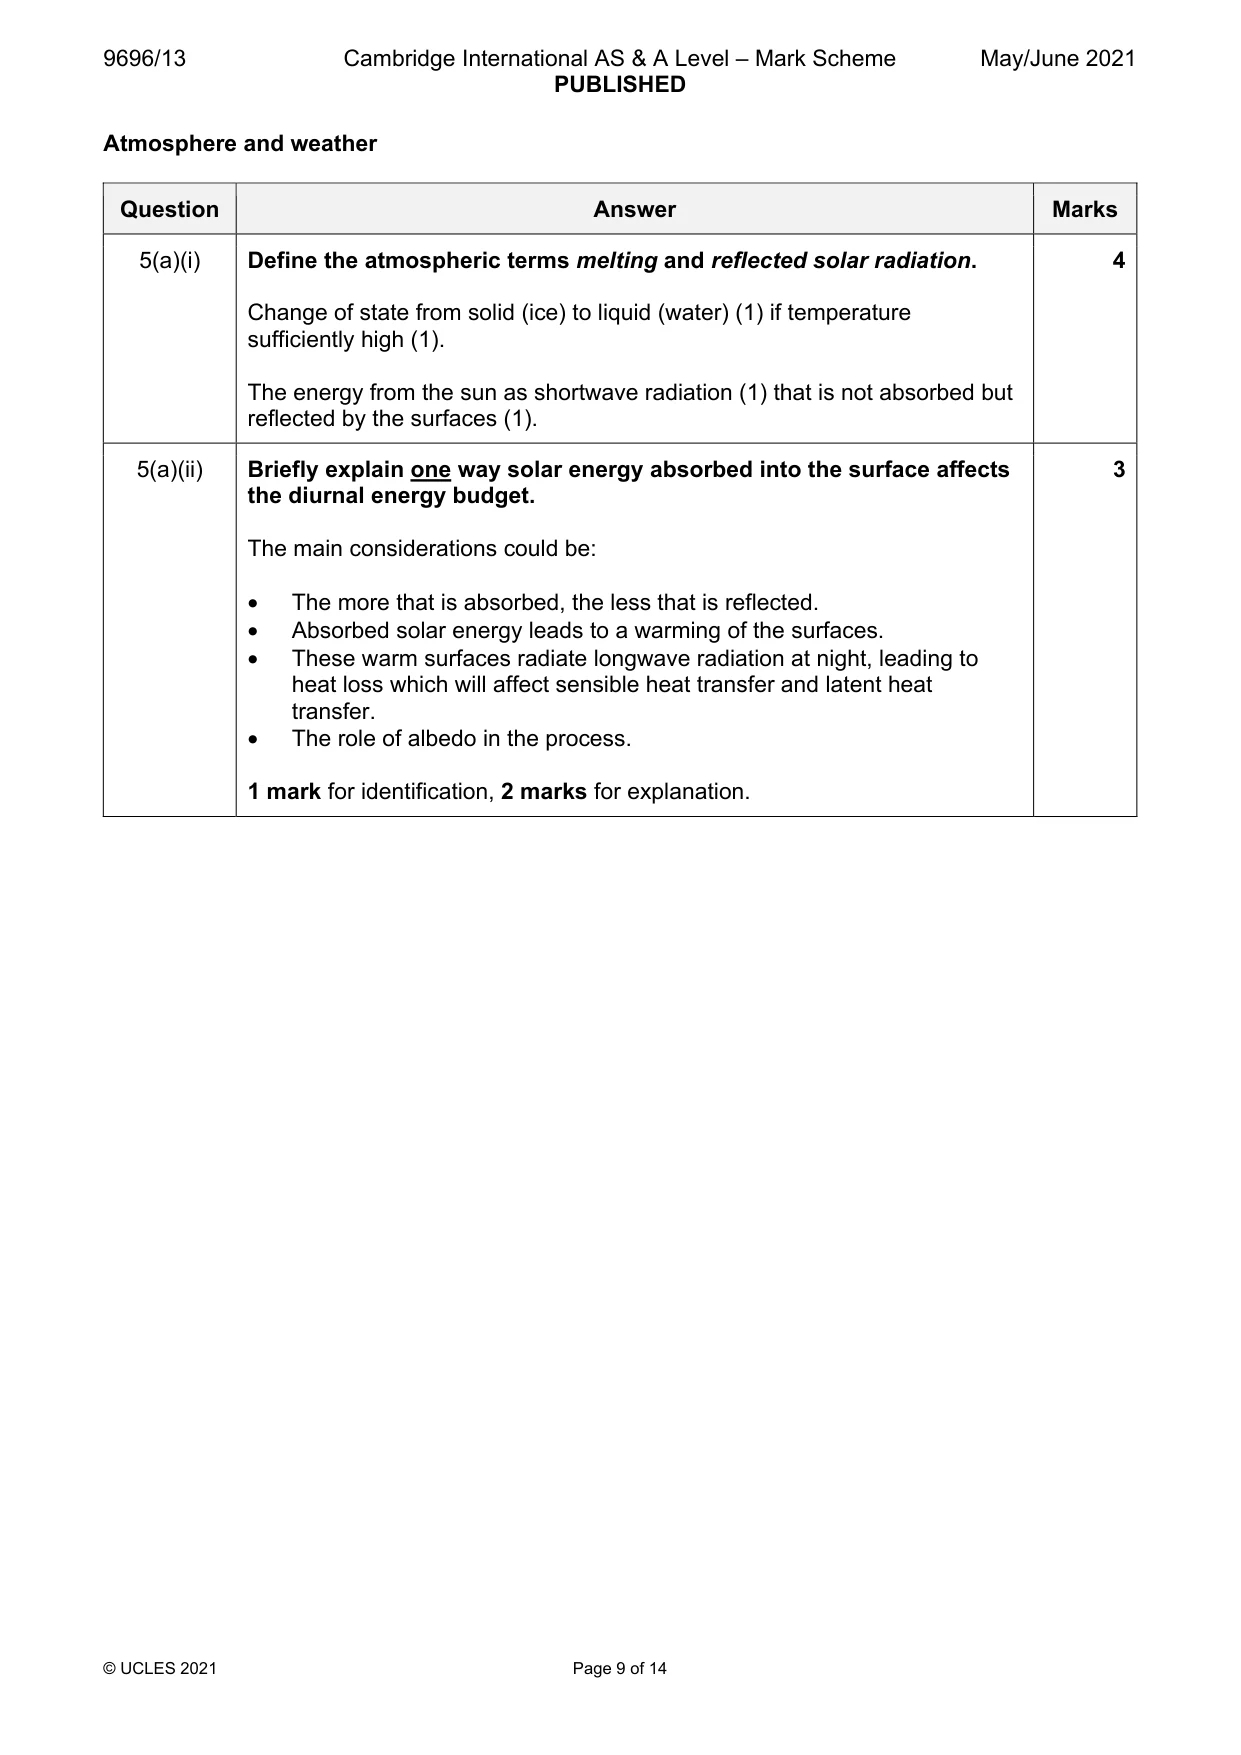
9696/13 Cambridge International AS & A Level – Mark Scheme PUBLISHED May/June 2021 © UCLES 2021 Page 9 of 14 Atmosphere and weather Question Answer Marks 5(a)(i) Define the atmospheric terms melting and reflected solar radiation. Change of state from solid (ice) to liquid (water) (1) if temperature sufficiently high (1). The energy from the sun as shortwave radiation (1) that is not absorbed but reflected by the surfaces (1). 4 5(a)(ii) Briefly explain one way solar energy absorbed into the surface affects the diurnal energy budget. The main considerations could be: • The more that is absorbed, the less that is reflected. • Absorbed solar energy leads to a warming of the surfaces. • These warm surfaces radiate longwave radiation at night, leading to heat loss which will affect sensible heat transfer and latent heat transfer. • The role of albedo in the process. 1 mark for identification, 2 marks for explanation. 3
Mark scheme, page 10
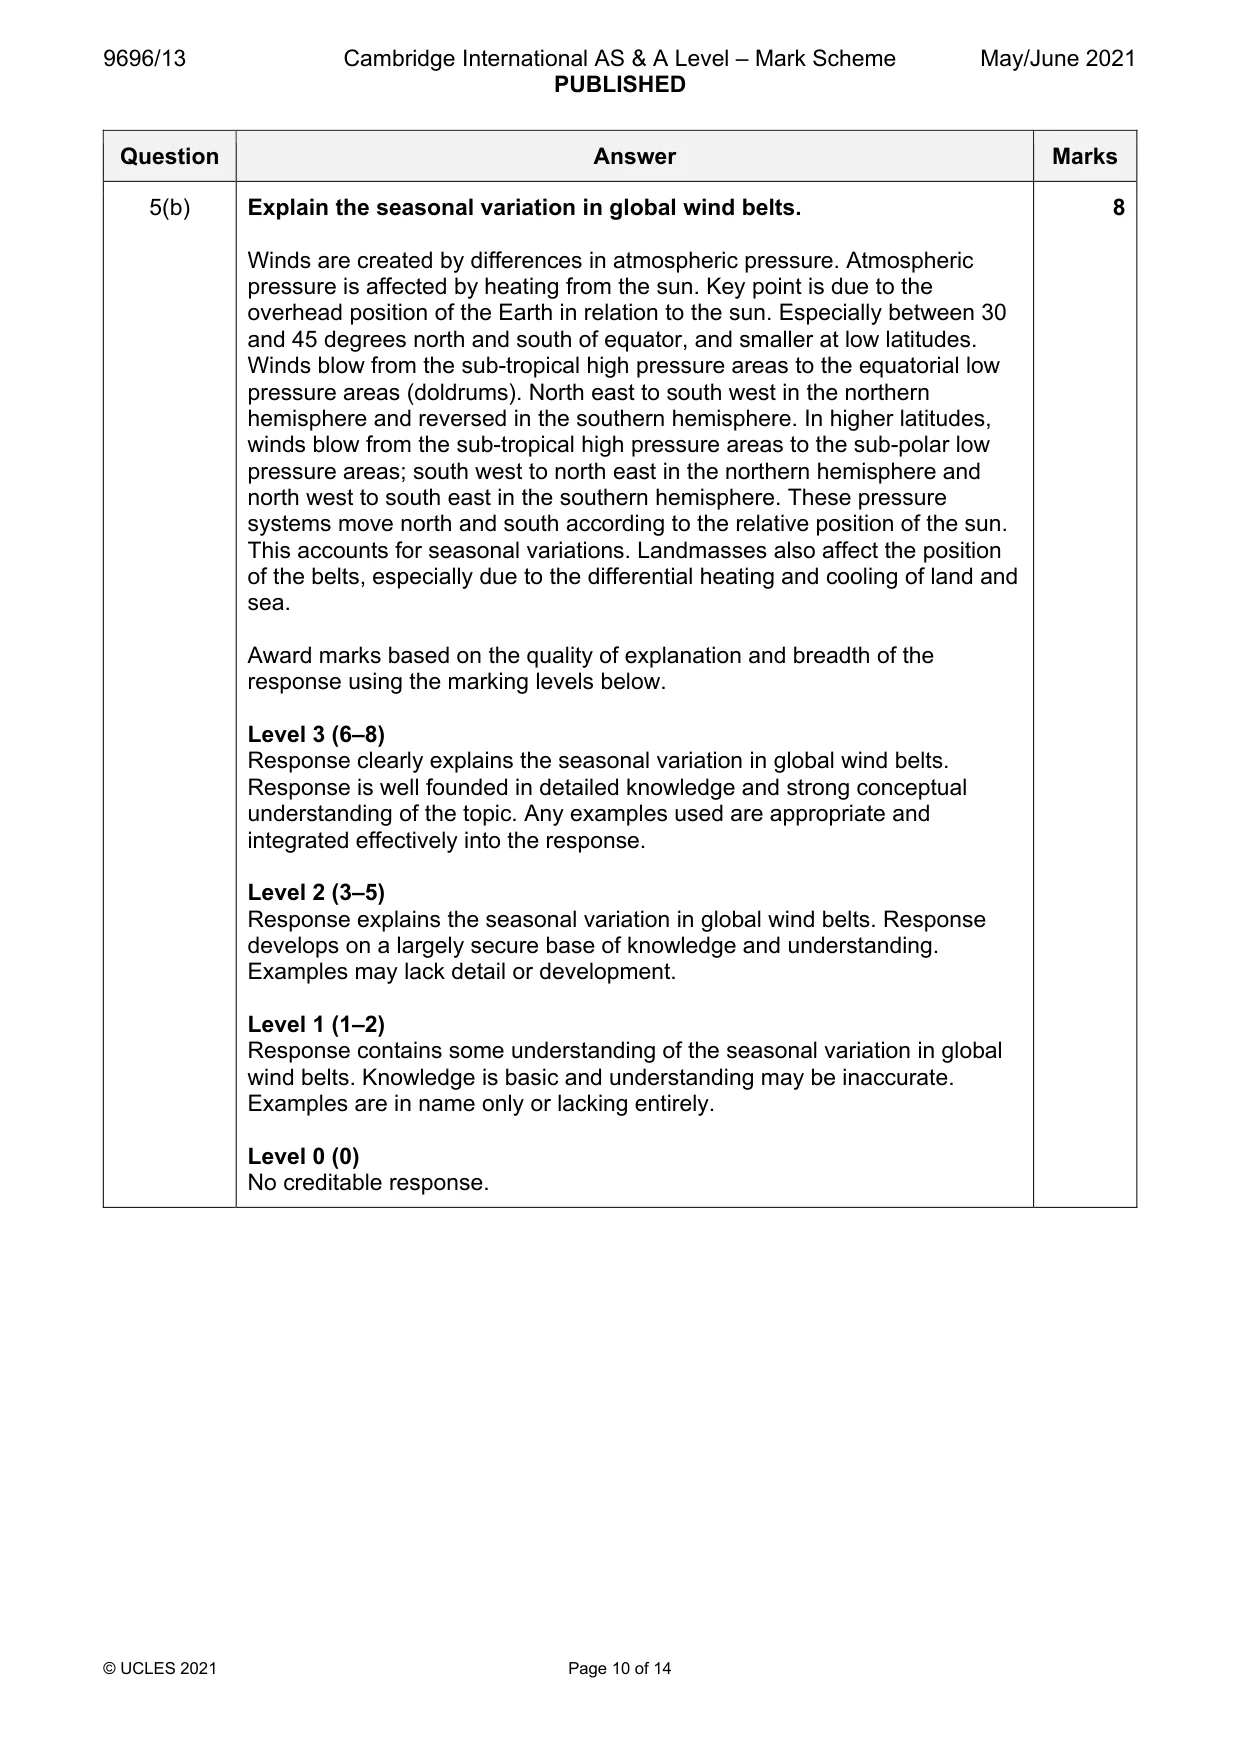
9696/13 Cambridge International AS & A Level – Mark Scheme PUBLISHED May/June 2021 © UCLES 2021 Page 10 of 14 Question Answer Marks 5(b) Explain the seasonal variation in global wind belts. Winds are created by differences in atmospheric pressure. Atmospheric pressure is affected by heating from the sun. Key point is due to the overhead position of the Earth in relation to the sun. Especially between 30 and 45 degrees north and south of equator, and smaller at low latitudes. Winds blow from the sub-tropical high pressure areas to the equatorial low pressure areas (doldrums). North east to south west in the northern hemisphere and reversed in the southern hemisphere. In higher latitudes, winds blow from the sub-tropical high pressure areas to the sub-polar low pressure areas; south west to north east in the northern hemisphere and north west to south east in the southern hemisphere. These pressure systems move north and south according to the relative position of the sun. This accounts for seasonal variations. Landmasses also affect the position of the belts, especially due to the differential heating and cooling of land and sea. Award marks based on the quality of explanation and breadth of the response using the marking levels below. Level 3 (6–8) Response clearly explains the seasonal variation in global wind belts. Response is well founded in detailed knowledge and strong conceptual understanding of the topic. Any examples used are appropriate and integrated effectively into the response. Level 2 (3–5) Response explains the seasonal variation in global wind belts. Response develops on a largely secure base of knowledge and understanding. Examples may lack detail or development. Level 1 (1–2) Response contains some understanding of the seasonal variation in global wind belts. Knowledge is basic and understanding may be inaccurate. Examples are in name only or lacking entirely. Level 0 (0) No creditable response. 8
Mark scheme, page 11
9696/13 Cambridge International AS & A Level – Mark Scheme PUBLISHED May/June 2021 © UCLES 2021 Page 11 of 14 Question Answer Marks 5(c) ‘The most significant effect of human activity on urban climates is on temperature.’ With the aid of examples, how far do you agree? Candidates are free to develop their own approach to the question and responses will vary depending on the approach chosen. Whichever approach is chosen, essays which address the question and support their argument with relevant examples will be credited. There may be detailed consideration of a case study/one or more examples, or a broadly conceived response, drawing on several examples to illustrate the factors involved. Reference to the urban heat model is expected. The effect of human activity on temperature in an urban area can be discussed – consideration of day and night, as well as location of the urban area. In addition, the other variables such as humidity, precipitation and wind also are affected by human activity and so the argument can be made as to which variable has the most significant effect. This argument needs to be justified, and examples may be used to illustrate the key points being made. Award marks based on the quality of the response using the marking levels below. Level 4 (12–15) Response thoroughly discusses the effect of human activity on urban climates. Response has good contextual understanding of the significance of different effects on climate from human activity. Examples used are appropriate and integrated effectively into the response. Response is well founded in detailed knowledge and strong conceptual understanding of the topic. Level 3 (8–11) Response discusses the effect of human activity on urban climates but may be unbalanced. Examples may lack detail or development. Response develops on a largely secure base of knowledge and understanding. Level 2 (4–7) Response shows general knowledge and understanding of the effect of human activity on urban climates. Response is mainly descriptive or explanatory with limited use of examples and understanding of the topic may be partial or inaccurate. Some concluding remarks. General responses without the use of example(s) will not get above the middle of Level 2 (6 marks). Level 1 (1–3) Response may broadly discuss the effect of human activity on urban climates but does not address the question and does not come to a convincing conclusion. Response is descriptive, knowledge is basic and understanding is poor. Level 0 (0) No creditable response. 15
Mark scheme, page 12
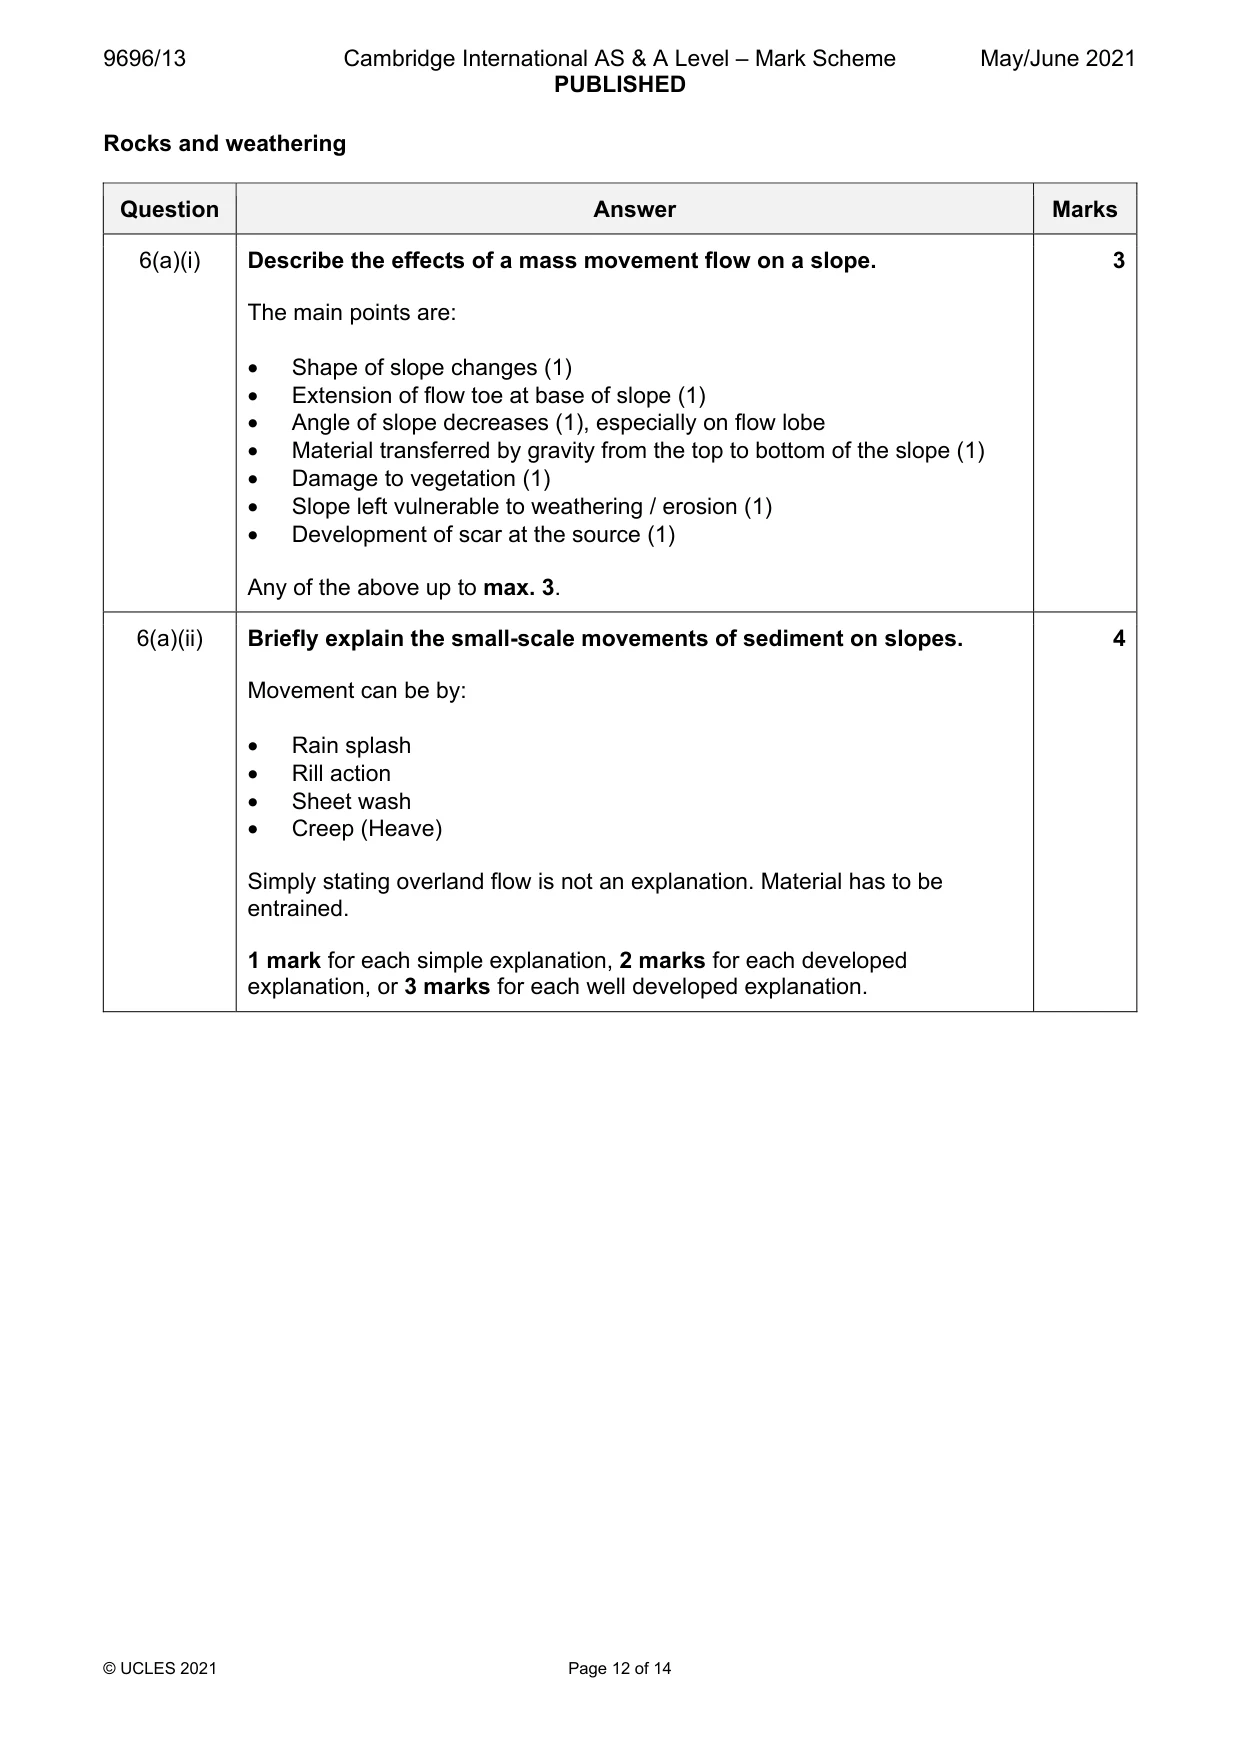
9696/13 Cambridge International AS & A Level – Mark Scheme PUBLISHED May/June 2021 © UCLES 2021 Page 12 of 14 Rocks and weathering Question Answer Marks 6(a)(i) Describe the effects of a mass movement flow on a slope. The main points are: • Shape of slope changes (1) • Extension of flow toe at base of slope (1) • Angle of slope decreases (1), especially on flow lobe • Material transferred by gravity from the top to bottom of the slope (1) • Damage to vegetation (1) • Slope left vulnerable to weathering / erosion (1) • Development of scar at the source (1) Any of the above up to max. 3. 3 6(a)(ii) Briefly explain the small-scale movements of sediment on slopes. Movement can be by: • Rain splash • Rill action • Sheet wash • Creep (Heave) Simply stating overland flow is not an explanation. Material has to be entrained. 1 mark for each simple explanation, 2 marks for each developed explanation, or 3 marks for each well developed explanation. 4
Mark scheme, page 13
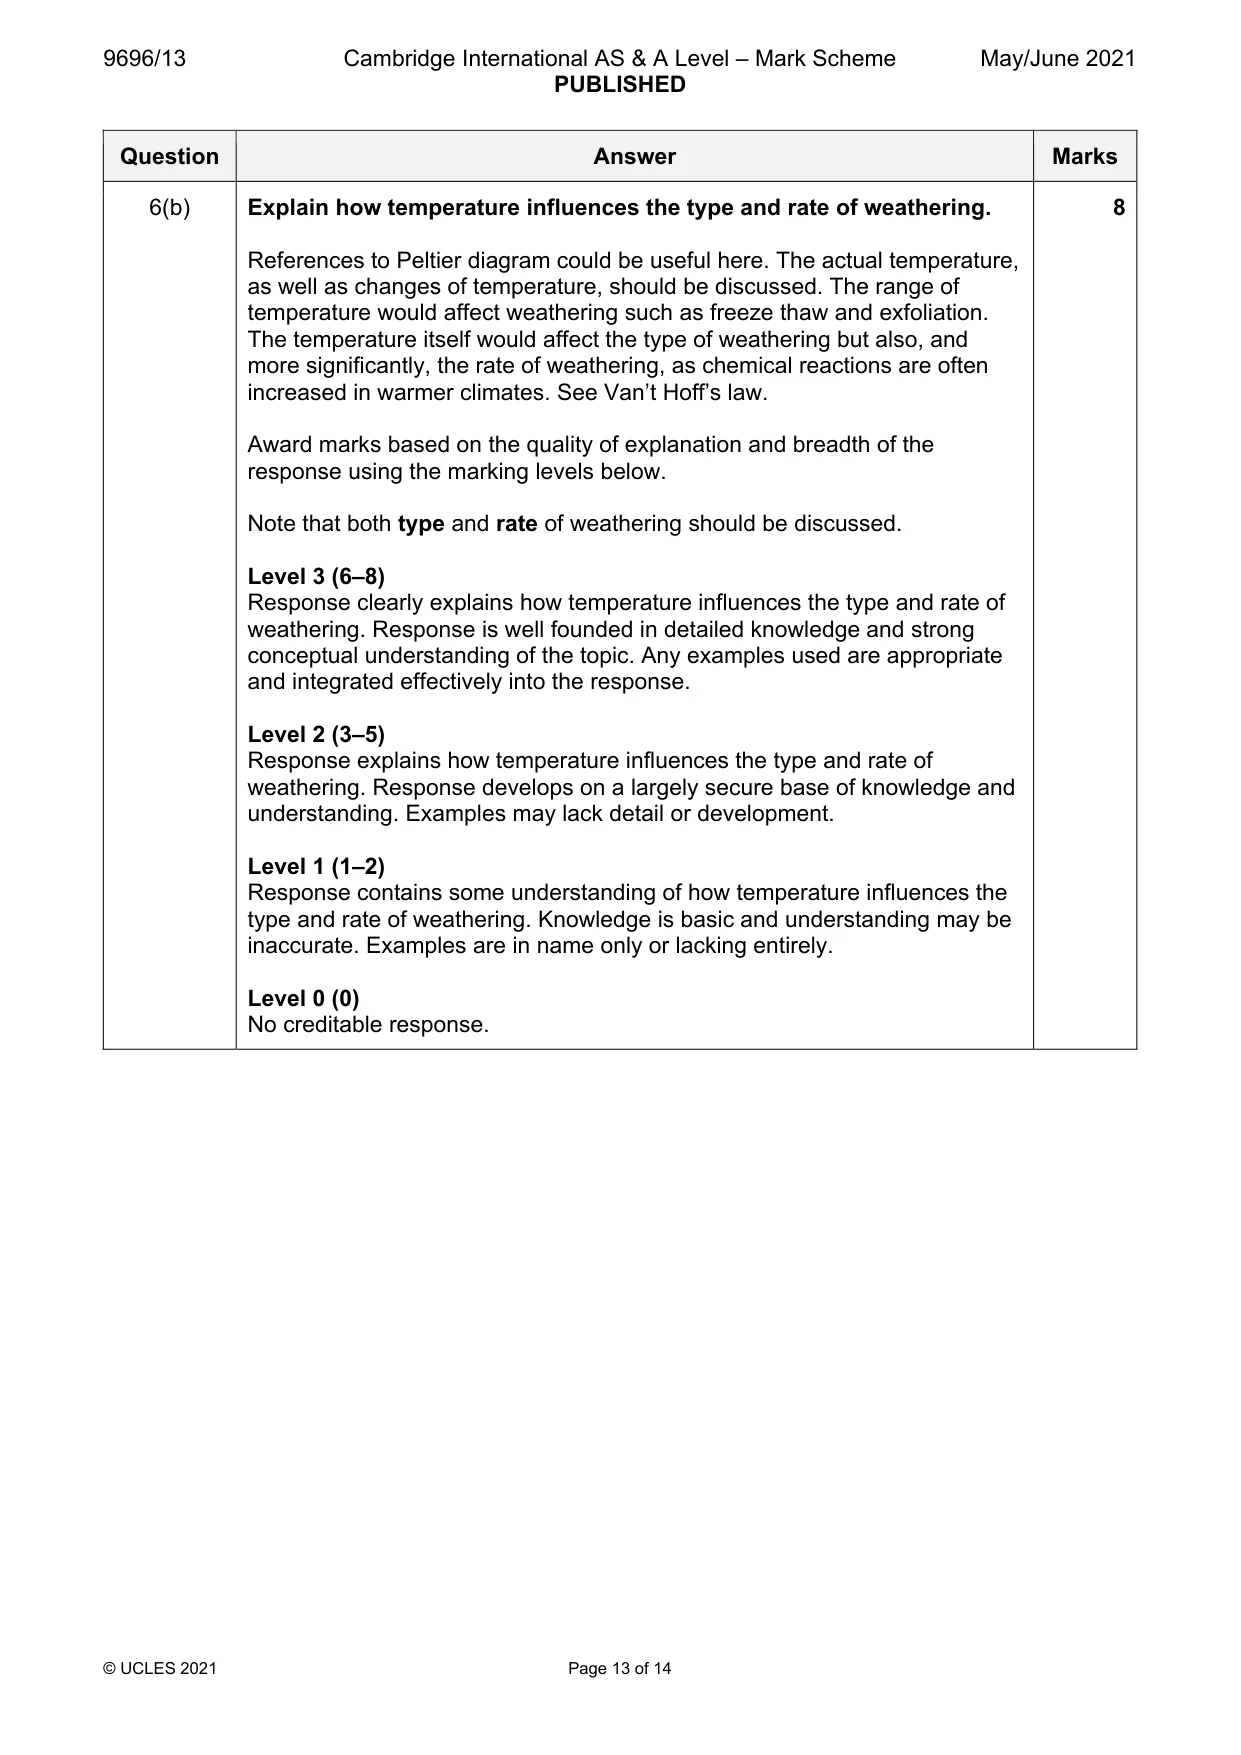
9696/13 Cambridge International AS & A Level – Mark Scheme PUBLISHED May/June 2021 © UCLES 2021 Page 13 of 14 Question Answer Marks 6(b) Explain how temperature influences the type and rate of weathering. References to Peltier diagram could be useful here. The actual temperature, as well as changes of temperature, should be discussed. The range of temperature would affect weathering such as freeze thaw and exfoliation. The temperature itself would affect the type of weathering but also, and more significantly, the rate of weathering, as chemical reactions are often increased in warmer climates. See Van’t Hoff’s law. Award marks based on the quality of explanation and breadth of the response using the marking levels below. Note that both type and rate of weathering should be discussed. Level 3 (6–8) Response clearly explains how temperature influences the type and rate of weathering. Response is well founded in detailed knowledge and strong conceptual understanding of the topic. Any examples used are appropriate and integrated effectively into the response. Level 2 (3–5) Response explains how temperature influences the type and rate of weathering. Response develops on a largely secure base of knowledge and understanding. Examples may lack detail or development. Level 1 (1–2) Response contains some understanding of how temperature influences the type and rate of weathering. Knowledge is basic and understanding may be inaccurate. Examples are in name only or lacking entirely. Level 0 (0) No creditable response. 8
Mark scheme, page 14
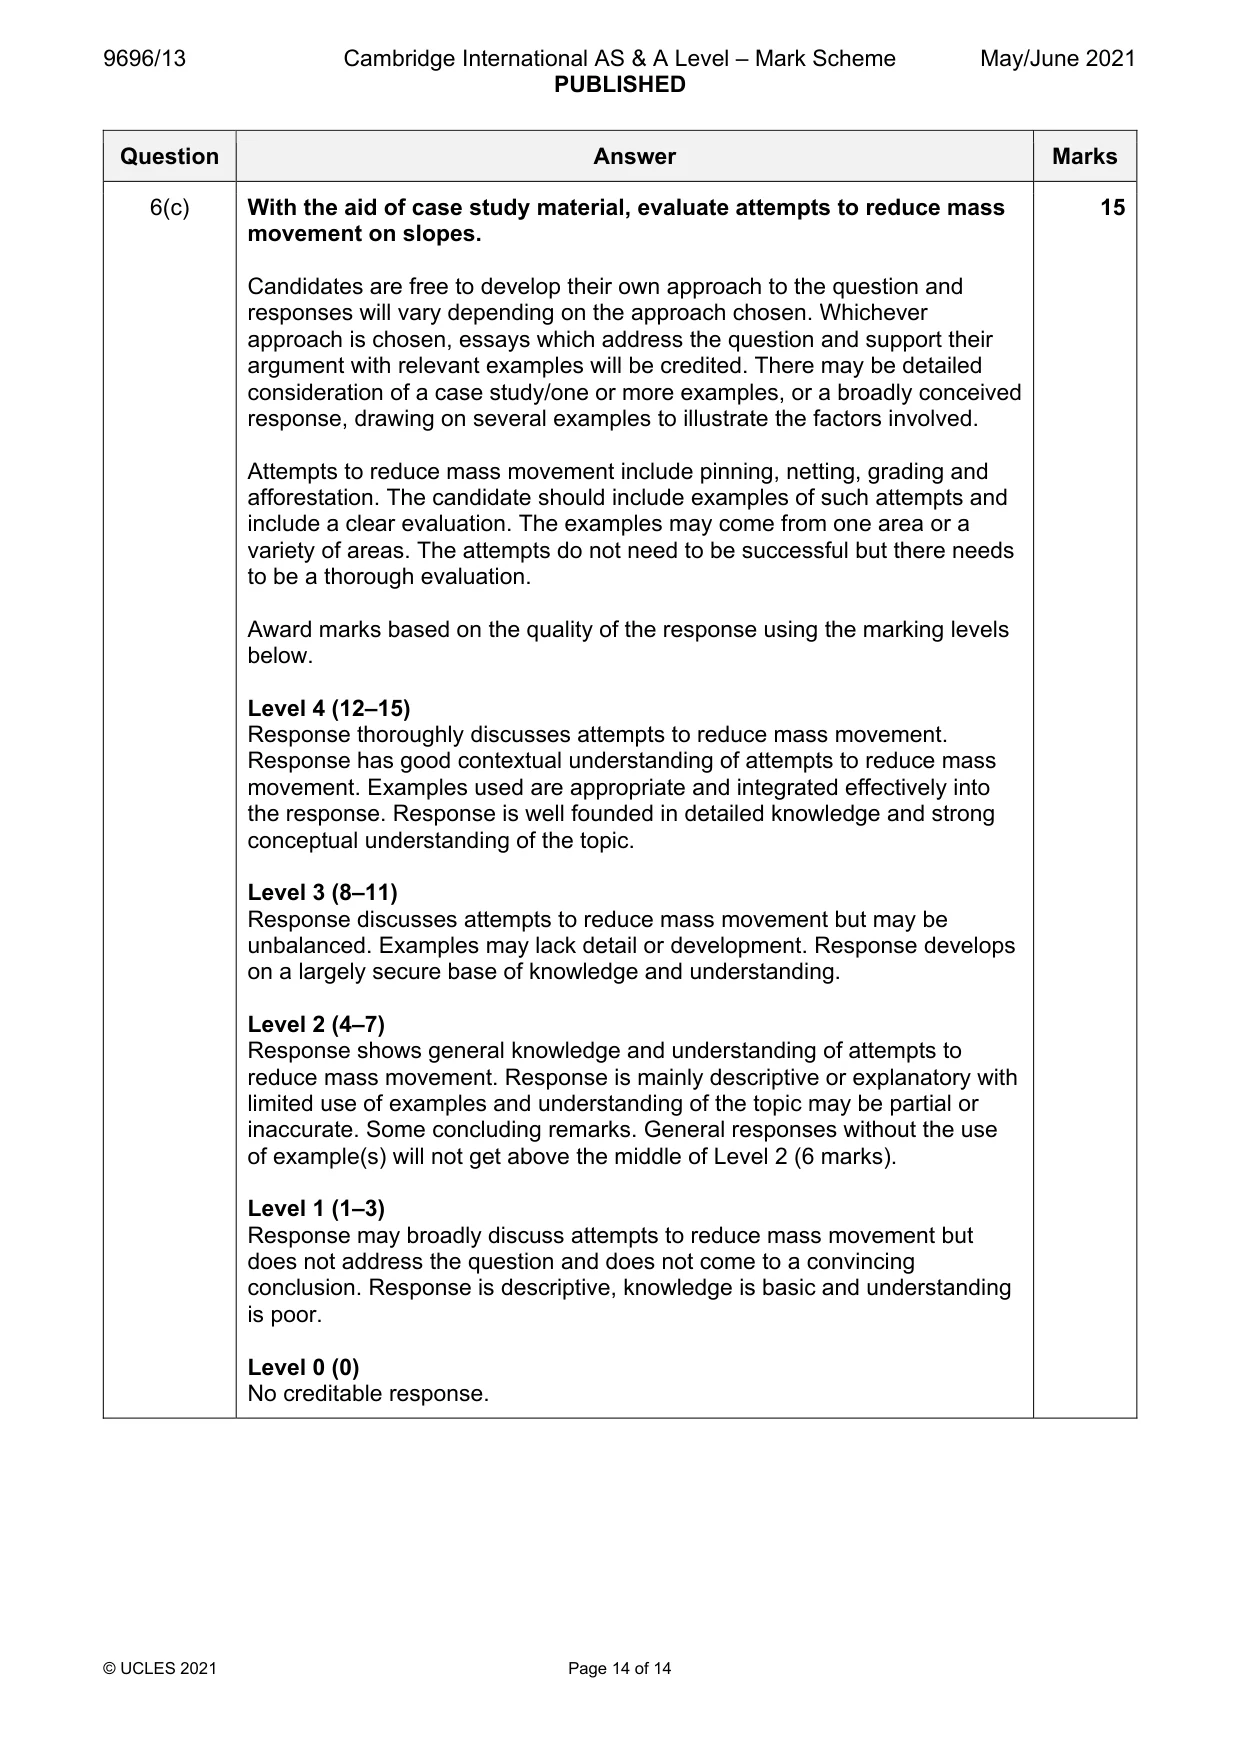
9696/13 Cambridge International AS & A Level – Mark Scheme PUBLISHED May/June 2021 © UCLES 2021 Page 14 of 14 Question Answer Marks 6(c) With the aid of case study material, evaluate attempts to reduce mass movement on slopes. Candidates are free to develop their own approach to the question and responses will vary depending on the approach chosen. Whichever approach is chosen, essays which address the question and support their argument with relevant examples will be credited. There may be detailed consideration of a case study/one or more examples, or a broadly conceived response, drawing on several examples to illustrate the factors involved. Attempts to reduce mass movement include pinning, netting, grading and afforestation. The candidate should include examples of such attempts and include a clear evaluation. The examples may come from one area or a variety of areas. The attempts do not need to be successful but there needs to be a thorough evaluation. Award marks based on the quality of the response using the marking levels below. Level 4 (12–15) Response thoroughly discusses attempts to reduce mass movement. Response has good contextual understanding of attempts to reduce mass movement. Examples used are appropriate and integrated effectively into the response. Response is well founded in detailed knowledge and strong conceptual understanding of the topic. Level 3 (8–11) Response discusses attempts to reduce mass movement but may be unbalanced. Examples may lack detail or development. Response develops on a largely secure base of knowledge and understanding. Level 2 (4–7) Response shows general knowledge and understanding of attempts to reduce mass movement. Response is mainly descriptive or explanatory with limited use of examples and understanding of the topic may be partial or inaccurate. Some concluding remarks. General responses without the use of example(s) will not get above the middle of Level 2 (6 marks). Level 1 (1–3) Response may broadly discuss attempts to reduce mass movement but does not address the question and does not come to a convincing conclusion. Response is descriptive, knowledge is basic and understanding is poor. Level 0 (0) No creditable response. 15
What you needed in this session
Cambridge’s own grade thresholds for 2021 May/June, Paper 1 · Variant 3. A higher threshold means an easier paper — the bar moves with how the cohort did.