Cambridge A Level Geography 9696 — 2019 Oct/Nov Paper 4 · Variant 3
9696/43/O/N/19 · 12 questions · 60 marks · ≈68 min
The question paper and its mark scheme, free to read here and free to download. This is Cambridge’s own paper, exactly as it was sat.
Question paper4 pages


Mark scheme24 pages
Answers below. Sit the paper first if you are practising.






Questions as text
Q1 · The metal forging industry in India, an MIC in Asia, 2013–14
1 Fig. 1.1 shows the metal forging industry in India, an MIC in Asia, 2013–14. (a) Describe the regional variations shown in Fig. 1.1. [4] (b) Suggest reasons why the market share shown in Fig. 1.1 changes over time. [6]
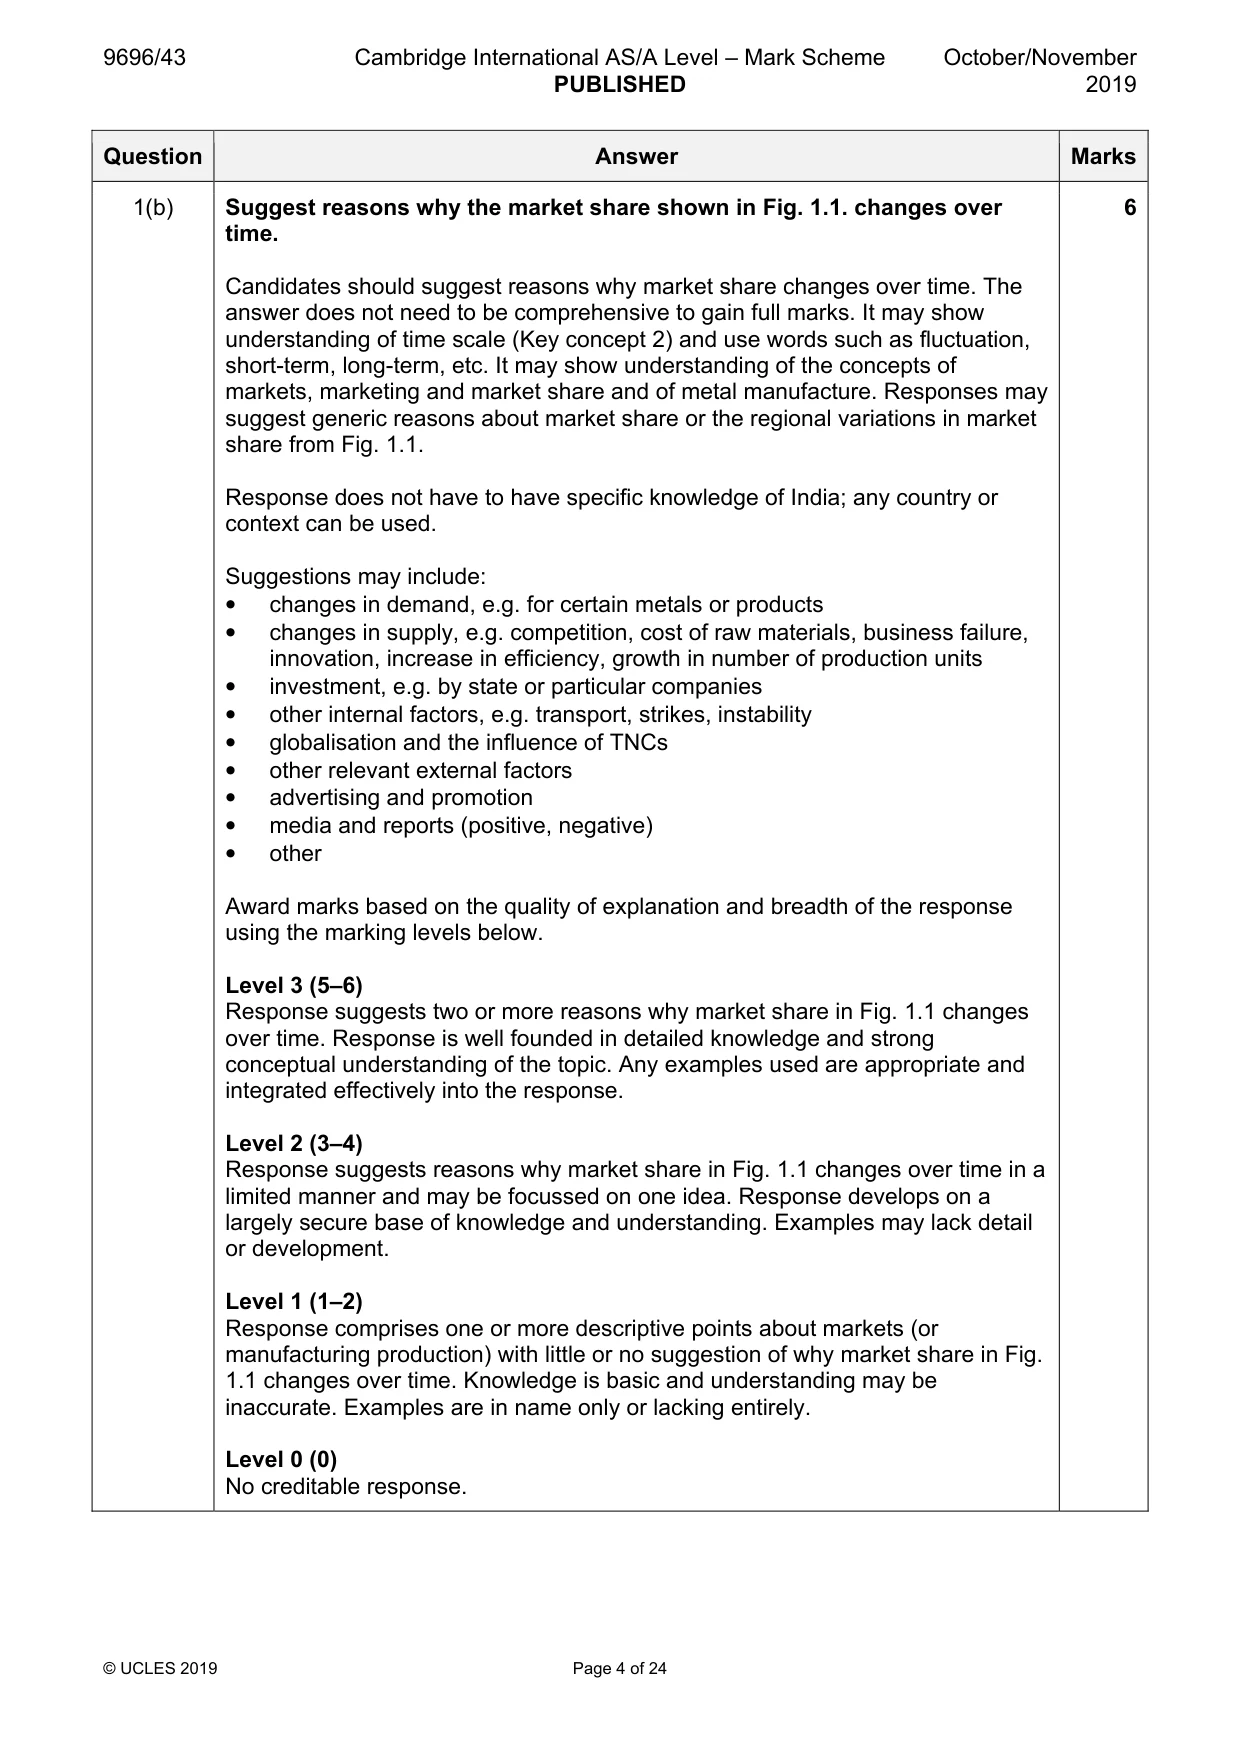
Mark scheme: Question Answer Marks 1(a) Fig. 1.1 shows the metal forging industry in India, an MIC in Asia, 2013–14. 4 Describe the regional variations shown in Fig. 1.1. There are three variables which vary between the four regions: Demand for forged metals and metal products (varies from highest in W, 1 280 000 MTPA, to lowest in E 240 000 MTPA, approx. one fifth of the W). Market share dominated by W and highest in W 45%, N is second at 31%, lower in S 16%, lowest in E 8% (one fifth of the highest share in the W). Production units only/lowest 22 in the E to larger similar numbers in N and W 157/159. Regional comparisons: such as North and West together have significant majority of market share (76%) and production units. However, East region has the highest productivity per unit (10 909 MTPA). Credit accurate description of each of the three variables shown 1 mark each. Award the remaining mark for overall comment or detail, such as developed use of supporting data, data manipulation or vocabulary of variation. For highest in all three variables (W) and lowest in all three variables (E) max. 2. 1(b) Suggest reasons why the market share shown in Fig. 1.1. changes over 6 time. Candidates should suggest reasons why market share changes over time. The answer does not need to be comprehensive to gain full marks. It may show understanding of time scale (Key concept 2) and use words such as fluctuation, short-term, long-term, etc. It may show understanding of the concepts of markets, marketing and market share and of metal manufacture. Responses may suggest generic reasons about market share or the regional variations in market share from Fig. 1.1. Response does not have to have specific knowledge of India; any country or context can be used. Suggestions may include: • changes in demand, e.g. for certain metals or products • changes in supply, e.g. competition, cost of raw materials, business failure, innovation, increase in efficiency, growth in number of production units • investment, e.g. by state or particular companies • other internal factors, e.g. transport, strikes, instability • globalisation and the influence of TNCs • other relevant external factors • advertising and promotion • media and reports (positive, negative) • other Award marks based on the quality of explanation and breadth of the response using the marking levels below. Level 3 (5–6) Response suggests two or more reasons why market share in Fig. 1.1 changes over time. Response is well founded in detailed knowledge and strong conceptual understanding of the topic. Any examples used are appropriate and integrated effectively into the response. Level 2 (3–4) Response suggests reasons why market share in Fig. 1.1 changes over time in a limited manner and may be focussed on one idea. Response develops on a largely secure base of knowledge and understanding. Examples may lack detail or development. Level 1 (1–2) Response comprises one or more descriptive points about markets (or manufacturing production) with little or no suggestion of why market share in Fig. 1.1 changes over time. Knowledge is basic and understanding may be inaccurate. Examples are in name only or lacking entirely. Level 0 (0) No creditable response.
Q2 · With the help of one or more examples, assess the need for, and the effects of…
2 With the help of one or more examples, assess the need for, and the effects of, irrigation in agriculture. [20]
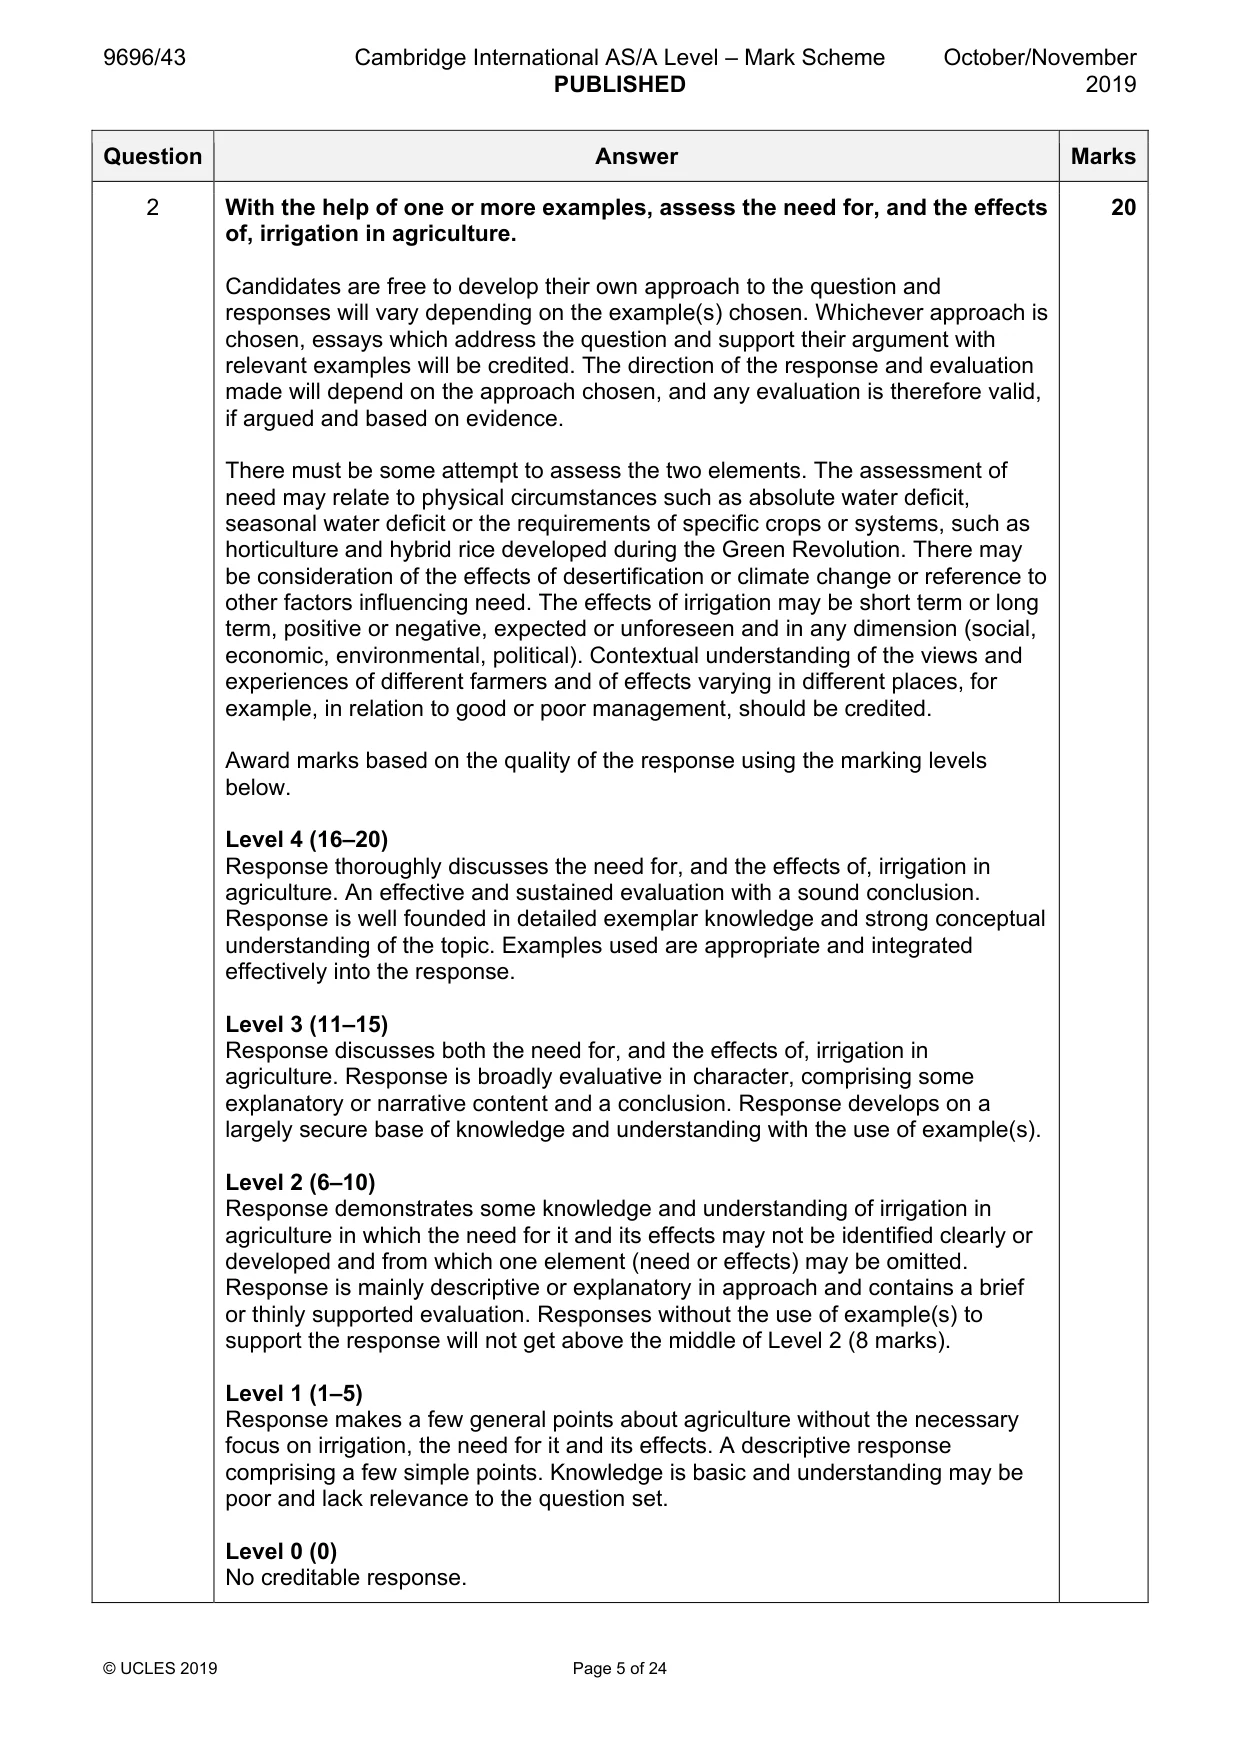
Mark scheme: 2 With the help of one or more examples, assess the need for, and the effects 20 of, irrigation in agriculture. Candidates are free to develop their own approach to the question and responses will vary depending on the example(s) chosen. Whichever approach is chosen, essays which address the question and support their argument with relevant examples will be credited. The direction of the response and evaluation made will depend on the approach chosen, and any evaluation is therefore valid, if argued and based on evidence. There must be some attempt to assess the two elements. The assessment of need may relate to physical circumstances such as absolute water deficit, seasonal water deficit or the requirements of specific crops or systems, such as horticulture and hybrid rice developed during the Green Revolution. There may be consideration of the effects of desertification or climate change or reference to other factors influencing need. The effects of irrigation may be short term or long term, positive or negative, expected or unforeseen and in any dimension (social, economic, environmental, political). Contextual understanding of the views and experiences of different farmers and of effects varying in different places, for example, in relation to good or poor management, should be credited. Award marks based on the quality of the response using the marking levels below. Level 4 (16–20) Response thoroughly discusses the need for, and the effects of, irrigation in agriculture. An effective and sustained evaluation with a sound conclusion. Response is well founded in detailed exemplar knowledge and strong conceptual understanding of the topic. Examples used are appropriate and integrated effectively into the response. Level 3 (11–15) Response discusses both the need for, and the effects of, irrigation in agriculture. Response is broadly evaluative in character, comprising some explanatory or narrative content and a conclusion. Response develops on a largely secure base of knowledge and understanding with the use of example(s). Level 2 (6–10) Response demonstrates some knowledge and understanding of irrigation in agriculture in which the need for it and its effects may not be identified clearly or developed and from which one element (need or effects) may be omitted. Response is mainly descriptive or explanatory in approach and contains a brief or thinly supported evaluation. Responses without the use of example(s) to support the response will not get above the middle of Level 2 (8 marks). Level 1 (1–5) Response makes a few general points about agriculture without the necessary focus on irrigation, the need for it and its effects. A descriptive response comprising a few simple points. Knowledge is basic and understanding may be poor and lack relevance to the question set. Level 0 (0) No creditable response.
Q3 · Evaluate the impacts of economies of scale and diseconomies of scale on manufacturing…
3 Evaluate the impacts of economies of scale and diseconomies of scale on manufacturing production and its location. [20] Environmental management If answering this option, answer Question 4 and either Question 5 or Question 6.
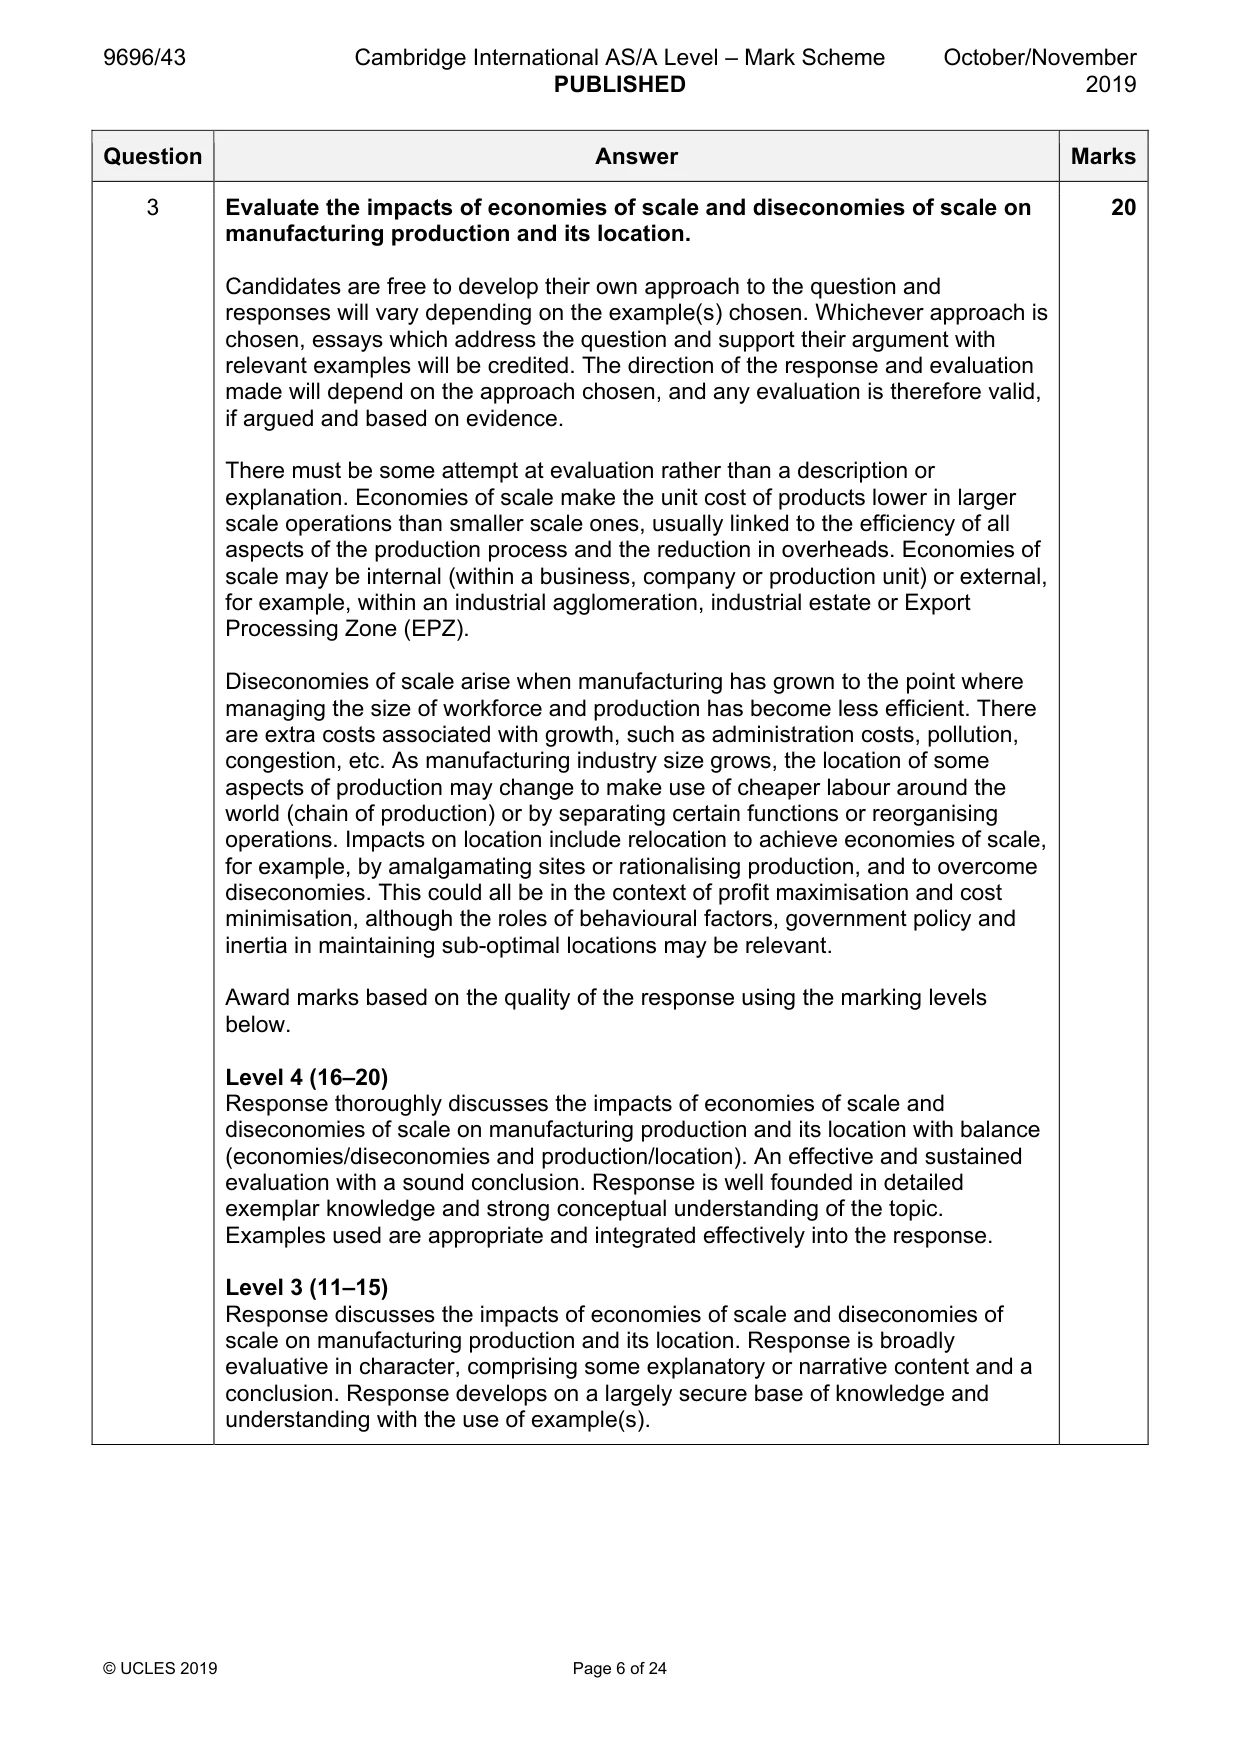
Mark scheme: 3 Evaluate the impacts of economies of scale and diseconomies of scale on 20 manufacturing production and its location. Candidates are free to develop their own approach to the question and responses will vary depending on the example(s) chosen. Whichever approach is chosen, essays which address the question and support their argument with relevant examples will be credited. The direction of the response and evaluation made will depend on the approach chosen, and any evaluation is therefore valid, if argued and based on evidence. There must be some attempt at evaluation rather than a description or explanation. Economies of scale make the unit cost of products lower in larger scale operations than smaller scale ones, usually linked to the efficiency of all aspects of the production process and the reduction in overheads. Economies of scale may be internal (within a business, company or production unit) or external, for example, within an industrial agglomeration, industrial estate or Export Processing Zone (EPZ). Diseconomies of scale arise when manufacturing has grown to the point where managing the size of workforce and production has become less efficient. There are extra costs associated with growth, such as administration costs, pollution, congestion, etc. As manufacturing industry size grows, the location of some aspects of production may change to make use of cheaper labour around the world (chain of production) or by separating certain functions or reorganising operations. Impacts on location include relocation to achieve economies of scale, for example, by amalgamating sites or rationalising production, and to overcome diseconomies. This could all be in the context of profit maximisation and cost minimisation, although the roles of behavioural factors, government policy and inertia in maintaining sub-optimal locations may be relevant. Award marks based on the quality of the response using the marking levels below. Level 4 (16–20) Response thoroughly discusses the impacts of economies of scale and diseconomies of scale on manufacturing production and its location with balance (economies/diseconomies and production/location). An effective and sustained evaluation with a sound conclusion. Response is well founded in detailed exemplar knowledge and strong conceptual understanding of the topic. Examples used are appropriate and integrated effectively into the response. Level 3 (11–15) Response discusses the impacts of economies of scale and diseconomies of scale on manufacturing production and its location. Response is broadly evaluative in character, comprising some explanatory or narrative content and a conclusion. Response develops on a largely secure base of knowledge and understanding with the use of example(s). 3 Level 2 (6–10) Response demonstrates some knowledge and understanding of scale economies in which their impacts on manufacturing production and its location may not be identified clearly or developed. Response is mainly descriptive or explanatory in approach and contains a brief or thinly supported evaluation. Responses without the use of example(s) to support the response will not get above the middle of Level 2 (8 marks). Level 1 (1–5) Response makes a few general points about manufacturing without the necessary focus on scale economies and their impacts on production and location. A descriptive response comprising a few simple points. Knowledge is basic and understanding may be poor and lack relevance to the question set. Level 0 (0) No creditable response. Environmental management If answering this option, answer Question 4 and either Question 5 or Question 6.
Q4 · Electricity generating capacity in Europe, by fuel type, in 2013 and predicted for 2020…
4 Fig. 4.1 shows electricity generating capacity in Europe, by fuel type, in 2013 and predicted for 2020 and 2030. (a) Describe the predicted changes in the capacity of hydro-electric power (HEP) and renewables shown in Fig. 4.1. [4] (b) Explain two reasons for reducing the use of fossil fuels in electricity production. [6]
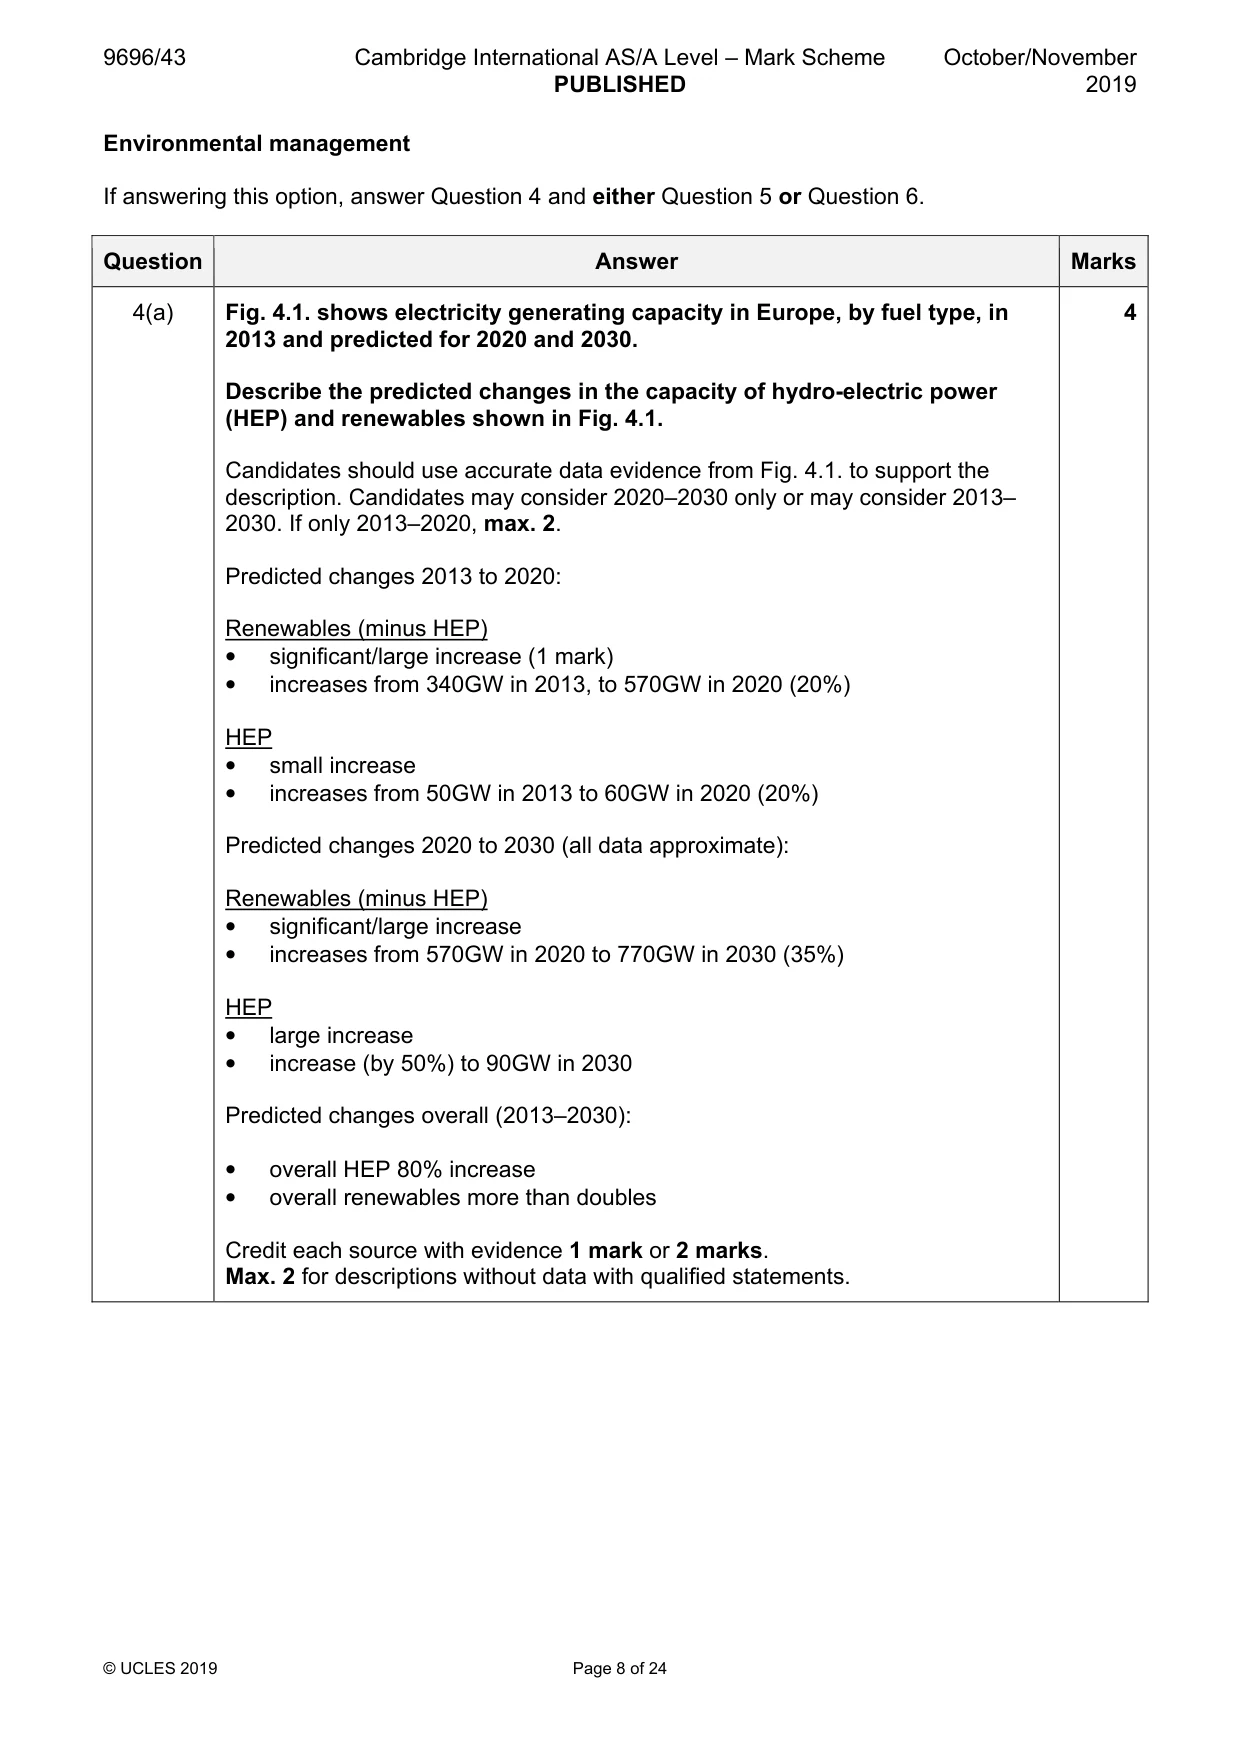
Mark scheme: 4(a) Fig. 4.1. shows electricity generating capacity in Europe, by fuel type, in 4 2013 and predicted for 2020 and 2030. Describe the predicted changes in the capacity of hydro-electric power (HEP) and renewables shown in Fig. 4.1. Candidates should use accurate data evidence from Fig. 4.1. to support the description. Candidates may consider 2020–2030 only or may consider 2013– 2030. If only 2013–2020, max. 2. Predicted changes 2013 to 2020: Renewables (minus HEP) • significant/large increase (1 mark) • increases from 340GW in 2013, to 570GW in 2020 (20%) HEP • small increase • increases from 50GW in 2013 to 60GW in 2020 (20%) Predicted changes 2020 to 2030 (all data approximate): Renewables (minus HEP) • significant/large increase • increases from 570GW in 2020 to 770GW in 2030 (35%) HEP • large increase • increase (by 50%) to 90GW in 2030 Predicted changes overall (2013–2030): • overall HEP 80% increase • overall renewables more than doubles Credit each source with evidence 1 mark or 2 marks. Max. 2 for descriptions without data with qualified statements. 4(b) Explain two reasons for reducing the use of fossil fuels in electricity 6 production. Candidates should explain two reasons for reducing the use of fossil fuels in electricity production. Responses which include detail on the use of fossil fuels in vehicle combustion or domestic heating should not be credited. Main reasons relate to unsustainability: • depletion of fossil fuels/finite resource • concerns about environmental impacts of fossil fuels: o land degradation from extraction o waste disposal from refining o transport – spills, leaks o combustion/use: air pollution (particulate matter, smog, etc.) greenhouse gas emissions/climate change Other reasons may be offered, including: • policy commitments and protocols • development of viable technological alternatives, e.g. wind, solar energy • security, especially in relation to oil If more than two reasons are given, mark all and award the best or better. Award marks based on the quality of explanation and breadth of the response using the marking levels below. Level 3 (5–6) Response explains two reasons for reducing the use of fossil fuels in electricity production clearly. Response is well founded in detailed knowledge and strong conceptual understanding of the topic. Any examples used are appropriate and integrated effectively into the response. Level 2 (3–4) Response explains two reasons for reducing the use of fossil fuels in electricity production in a limited manner or explains one reason well. Response develops on a largely secure base of knowledge and understanding. Examples may lack detail or development. Level 1 (1–2) Response comprises one or more points about energy production with little or no explanation of reasons for reducing the use of fossil fuels in electricity production. Knowledge is basic and understanding may be inaccurate. Examples are in name only or lacking entirely. Level 0 (0) No creditable response.
Q5 · Evaluate the success of one country’s overall electrical energy strategy in overcoming…
5 Evaluate the success of one country’s overall electrical energy strategy in overcoming issues of changes in demand and supply of electricity. [20]
Mark scheme: 5 Evaluate the success of one country’s overall electrical energy strategy in 20 overcoming issues of changes in demand and supply of electricity. Candidates are free to develop their own approach to the question and responses will vary depending on the example(s) chosen. Whichever approach is chosen, essays which address the question and support their argument with relevant examples will be credited. The direction of the response and evaluation made will depend on the approach chosen, and any evaluation is therefore valid, if argued and based on evidence. There must be some attempt at evaluating success. Possible issues include: Demand Ability to meet increasing demand; ensuring supply at peak times; avoiding load shedding, blackouts and disruption to supply; supply to the whole country; reducing demand through efficiencies in building regulations, insulation, appliances, etc. Supply Future proofing supply; (un)sustainability; energy security; environmental impact; affordability; public approval, etc. Overall electrical energy strategy is more than one located scheme. It includes policies for the energy mix, conservation, efficiency of use, etc., and should be evaluated for success to supply enough for demand. A high-level response will clearly articulate the strategy for one country. Contextual understanding of the different viewpoints of different stakeholders about success should be credited. For candidates who include more than one country, mark all and credit the best or better answer. Award marks based on the quality of the response using the marking levels below. Level 4 (16–20) Response thoroughly discusses the success of the chosen country’s overall electricity strategy in overcoming issues of changes in demand and supply of electricity. An effective and sustained evaluation with a sound conclusion. Response is well founded in detailed exemplar knowledge and strong conceptual understanding of the topic. Examples used are appropriate and integrated effectively into the response. Level 3 (11–15) Response discusses the success of the chosen country’s overall electricity strategy in overcoming issues of changes in demand and supply of electricity but may focus more on one of demand or supply. Response is broadly evaluative in character, comprising some explanatory or narrative content and a conclusion. Response develops on a largely secure base of knowledge and understanding with the use of example(s). 5 Level 2 (6–10) Response demonstrates some knowledge and understanding of the overall electricity strategy of one country in which success in overcoming issues of changes in demand and supply of electricity may not be the clear focus or developed. Response is mainly descriptive or explanatory in approach and contains a brief or thinly supported evaluation. Responses without the use of example(s) to support the response will not get above the middle of Level 2 (8 marks). Level 1 (1–5) Response makes a few general points about energy in the chosen country without the necessary focus on electricity strategy and its success in overcoming issues of changes in demand and supply of electricity. A descriptive response comprising a few simple points. Knowledge is basic and understanding may be poor and lack relevance to the question set. Level 0 (0) No creditable response.
Q6 · ‘Bad management is the main cause of urban degradation.’ How far do you agree with this…
6 ‘Bad management is the main cause of urban degradation.’ How far do you agree with this view? [20] Global interdependence If answering this option, answer Question 7 and either Question 8 or Question 9.
Mark scheme: 6 ‘Bad management is the main cause of urban degradation.’ How far do you 20 agree with this view? Candidates are free to develop their own approach to the question and responses will vary depending on the example(s) chosen. Whichever approach is chosen, essays which address the question and support their argument with relevant examples will be credited. The direction of the response and evaluation made will depend on the approach chosen, and any evaluation is therefore valid, if argued and based on evidence. Factors in the degradation of urban environments in the syllabus are urbanisation, industrial development and inadequate waste management. There is clearly the potential to consider management (good, bad, effective, mismanagement or the absence of any management input) in relation to each of these and any other factors. Candidates should consider the idea that bad management is the ‘main cause’, i.e. its relative significance. There must be some attempt at assessing the extent of agreement with the statement. Candidates may agree or disagree or ‘question the question’ for credit. What management is in an urban context may be considered, such as who the managers are (urban authorities, planners, businesses, etc.), the management plan or strategy, finance, corruption, conflicts and disputes, the need to deal with complex urban problems, spatial scale, time scale, etc. Award marks based on the quality of the response using the marking levels below. Level 4 (16–20) Response thoroughly discusses the extent of agreement with the view that bad management is the main cause of urban degradation. An effective and sustained evaluation with a sound conclusion. Response is well founded in detailed exemplar knowledge and strong conceptual understanding of the topic. Examples used are appropriate and integrated effectively into the response. Level 3 (11–15) Response discusses the extent of agreement with the view that bad management is the main cause of urban degradation. Response is broadly evaluative in character, comprising some explanatory or narrative content and a conclusion. Response develops on a largely secure base of knowledge and understanding with the use of example(s). 6 Level 2 (6–10) Response demonstrates some knowledge and understanding of urban degradation in which causes may not be identified clearly nor bad management be the focus. Response is mainly descriptive or explanatory in approach and contains a brief or thinly supported evaluation. Responses without the use of example(s) to support the response will not get above the middle of Level 2 (8 marks). Level 1 (1–5) Response makes a few general points about environmental degradation without the necessary focus on the urban context or bad management as the main cause. A descriptive response comprising a few simple points. Knowledge is basic and understanding may be poor and lack relevance to the question set. Level 0 (0) No creditable response. Global interdependence If answering this option, answer Question 7 and either Question 8 or Question 9.
Q7 · A photograph which shows tourists on bicycles in a residential area of Bangkok, Thailand…
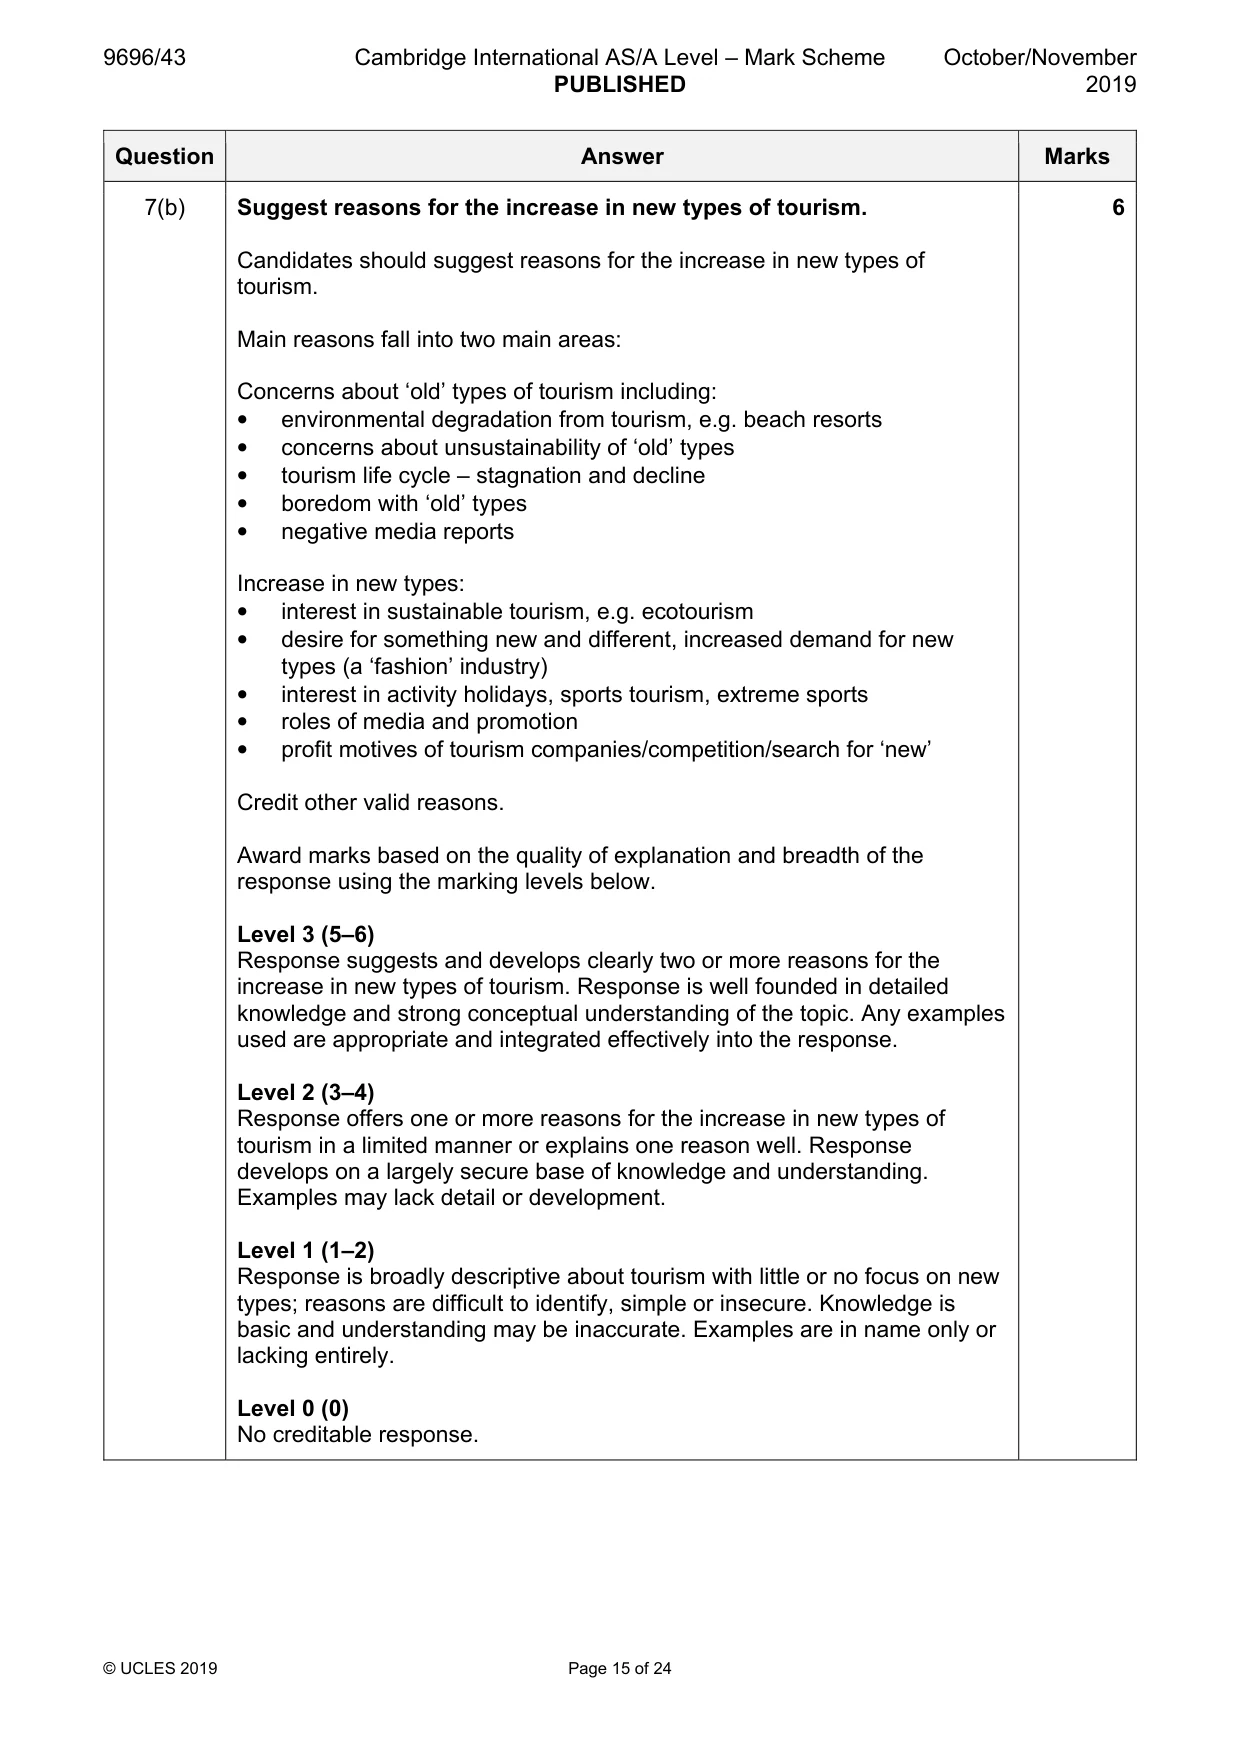
7 Fig. 7.1 is a photograph which shows tourists on bicycles in a residential area of Bangkok, Thailand, an MIC in Asia. (a) Suggest the social impacts of the tourism activity in Fig. 7.1 on the residents of the area shown. [4] (b) Suggest reasons for the increase in new types of tourism. [6]
Mark scheme: 7(a) Fig. 7.1. is a photograph which shows tourists on bicycles in a 4 residential area of Bangkok, Thailand, an MIC in Asia. Suggest the social impacts of the tourism activity in Fig. 7.1. on the residents of the area shown. Candidates should suggest the social impacts on residents of this high density, urban community of groups of tourists on bicycles. This involves skills in photographic interpretation and the application of knowledge and understanding of tourism’s impacts in this specific context. Suggested social impacts may include: Positive • social encounter, cross-cultural interaction, language acquisition • improved standard of living from bicycle related employment opportunities Negative • invasion of privacy/feeling of being ‘used’ or commodified, e.g. taking photographs • possible antagonism and conflict, e.g. noise, disturbance • disruption to daily life (washing, shopping, housework) • risk of collisions and accidents affecting local people Credit other valid suggestions. Candidates do not need to make comprehensive suggestions of social impacts for full marks. Do not credit environmental or economic impacts unless they are made relevant. Reward responses which demonstrate clear understanding of the photograph and of tourism. For a simple valid social impact 1 mark, for a detailed or developed social impact 2 marks to the maximum. 7(b) Suggest reasons for the increase in new types of tourism. 6 Candidates should suggest reasons for the increase in new types of tourism. Main reasons fall into two main areas: Concerns about ‘old’ types of tourism including: • environmental degradation from tourism, e.g. beach resorts • concerns about unsustainability of ‘old’ types • tourism life cycle – stagnation and decline • boredom with ‘old’ types • negative media reports Increase in new types: • interest in sustainable tourism, e.g. ecotourism • desire for something new and different, increased demand for new types (a ‘fashion’ industry) • interest in activity holidays, sports tourism, extreme sports • roles of media and promotion • profit motives of tourism companies/competition/search for ‘new’ Credit other valid reasons. Award marks based on the quality of explanation and breadth of the response using the marking levels below. Level 3 (5–6) Response suggests and develops clearly two or more reasons for the increase in new types of tourism. Response is well founded in detailed knowledge and strong conceptual understanding of the topic. Any examples used are appropriate and integrated effectively into the response. Level 2 (3–4) Response offers one or more reasons for the increase in new types of tourism in a limited manner or explains one reason well. Response develops on a largely secure base of knowledge and understanding. Examples may lack detail or development. Level 1 (1–2) Response is broadly descriptive about tourism with little or no focus on new types; reasons are difficult to identify, simple or insecure. Knowledge is basic and understanding may be inaccurate. Examples are in name only or lacking entirely. Level 0 (0) No creditable response.
Q8 · Assess the strengths and limitations of the work of the World Trade Organization (WTO)
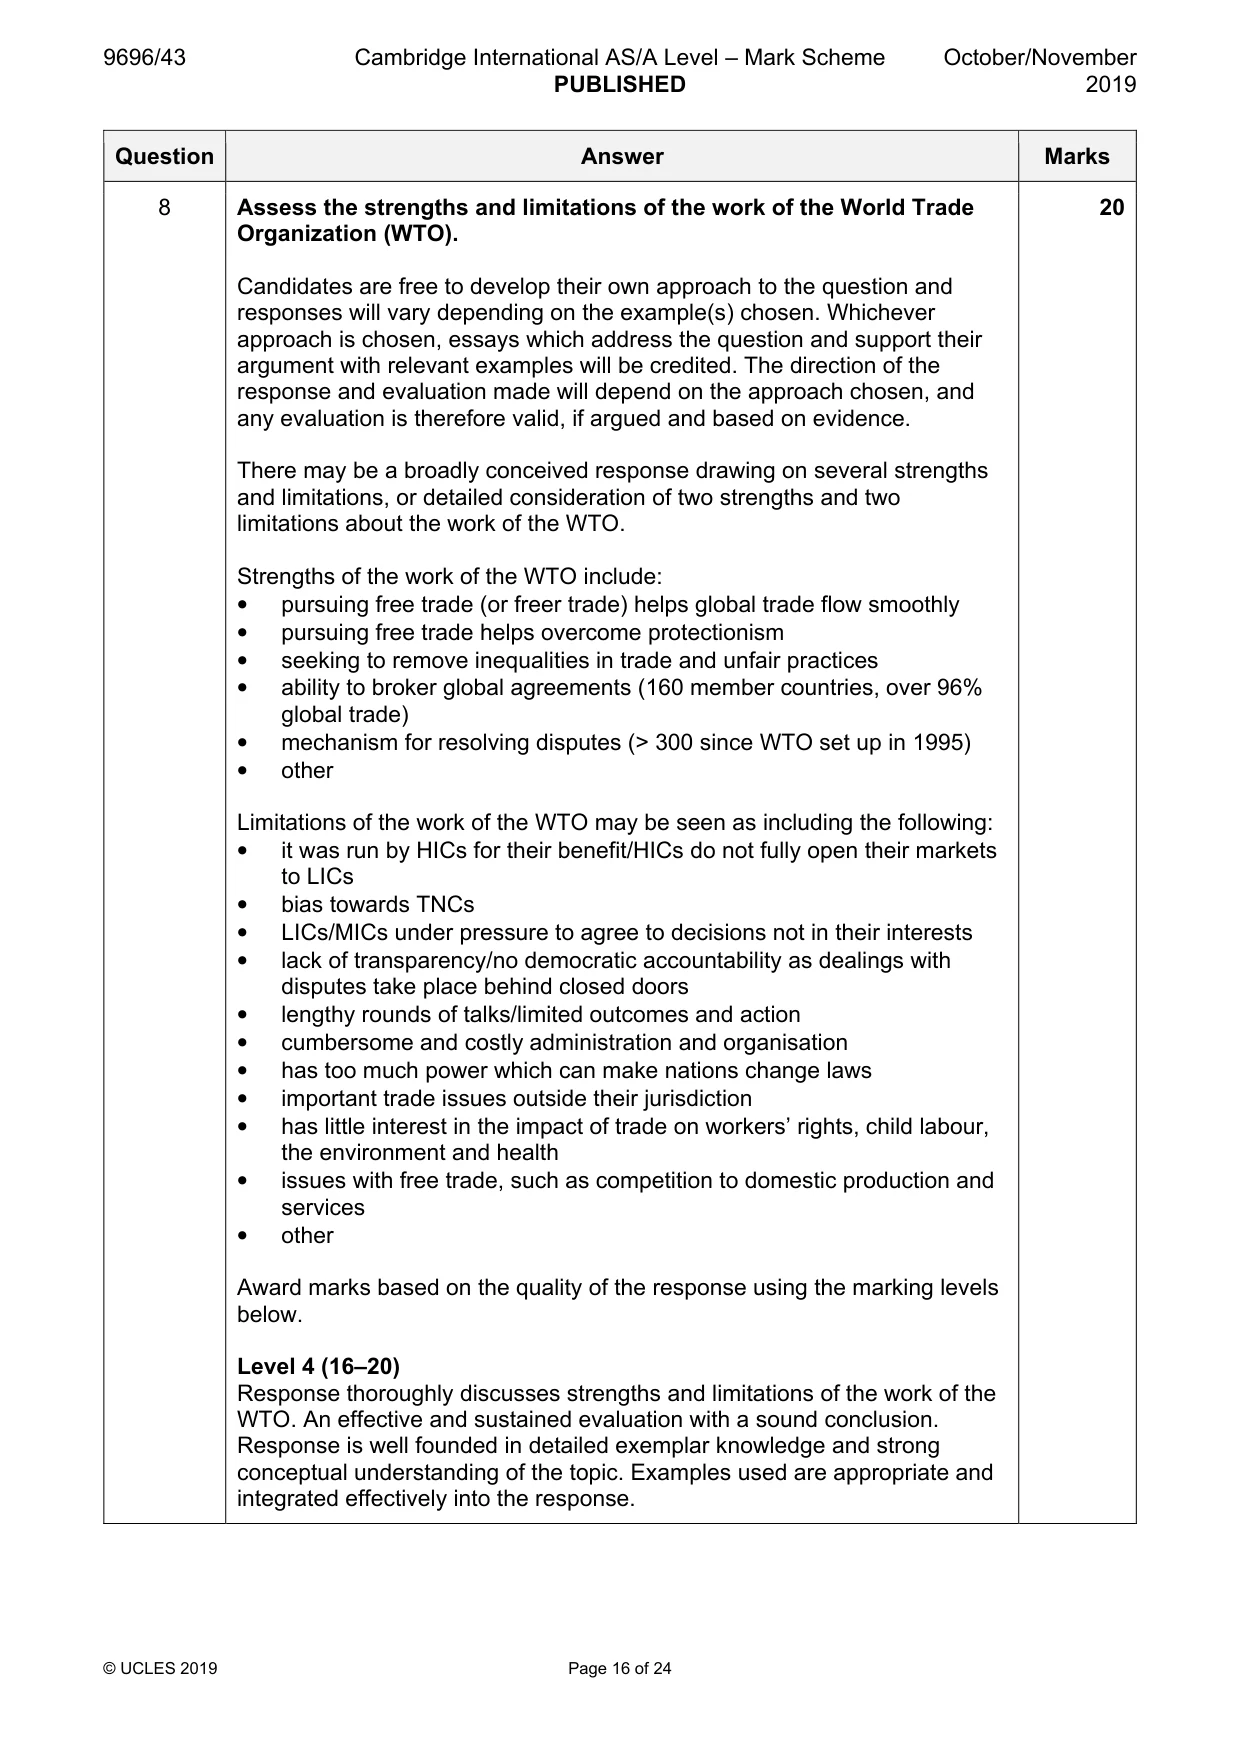
8 Assess the strengths and limitations of the work of the World Trade Organization (WTO). [20]
Mark scheme: 8 Assess the strengths and limitations of the work of the World Trade 20 Organization (WTO). Candidates are free to develop their own approach to the question and responses will vary depending on the example(s) chosen. Whichever approach is chosen, essays which address the question and support their argument with relevant examples will be credited. The direction of the response and evaluation made will depend on the approach chosen, and any evaluation is therefore valid, if argued and based on evidence. There may be a broadly conceived response drawing on several strengths and limitations, or detailed consideration of two strengths and two limitations about the work of the WTO. Strengths of the work of the WTO include: • pursuing free trade (or freer trade) helps global trade flow smoothly • pursuing free trade helps overcome protectionism • seeking to remove inequalities in trade and unfair practices • ability to broker global agreements (160 member countries, over 96% global trade) • mechanism for resolving disputes (> 300 since WTO set up in 1995) • other Limitations of the work of the WTO may be seen as including the following: • it was run by HICs for their benefit/HICs do not fully open their markets to LICs • bias towards TNCs • LICs/MICs under pressure to agree to decisions not in their interests • lack of transparency/no democratic accountability as dealings with disputes take place behind closed doors • lengthy rounds of talks/limited outcomes and action • cumbersome and costly administration and organisation • has too much power which can make nations change laws • important trade issues outside their jurisdiction • has little interest in the impact of trade on workers’ rights, child labour, the environment and health • issues with free trade, such as competition to domestic production and services • other Award marks based on the quality of the response using the marking levels below. Level 4 (16–20) Response thoroughly discusses strengths and limitations of the work of the WTO. An effective and sustained evaluation with a sound conclusion. Response is well founded in detailed exemplar knowledge and strong conceptual understanding of the topic. Examples used are appropriate and integrated effectively into the response. 8 Level 3 (11–15) Response discusses the strengths and limitations of the work of the WTO but may focus more on one strength or limitation. Response is broadly evaluative in character, comprising some explanatory or narrative content and a conclusion. Response develops on a largely secure base of knowledge and understanding with the use of example(s). Level 2 (6–10) Response demonstrates some knowledge and understanding of the work of the WTO in which strengths and/or limitations may not be identified clearly or developed. Response is mainly descriptive or explanatory in approach and contains a brief or thinly supported evaluation. Responses without the use of example(s) to support the response will not get above the middle of Level 2 (8 marks). Level 1 (1–5) Response makes a few general points about world trade without the necessary focus on the work of the WTO, its strengths and limitations. A descriptive response comprising a few simple points. Knowledge is basic and understanding may be poor and lack relevance to the question set. Level 0 (0) No creditable response.
Q9 · How far do you agree that international aid constrains development rather than helping…
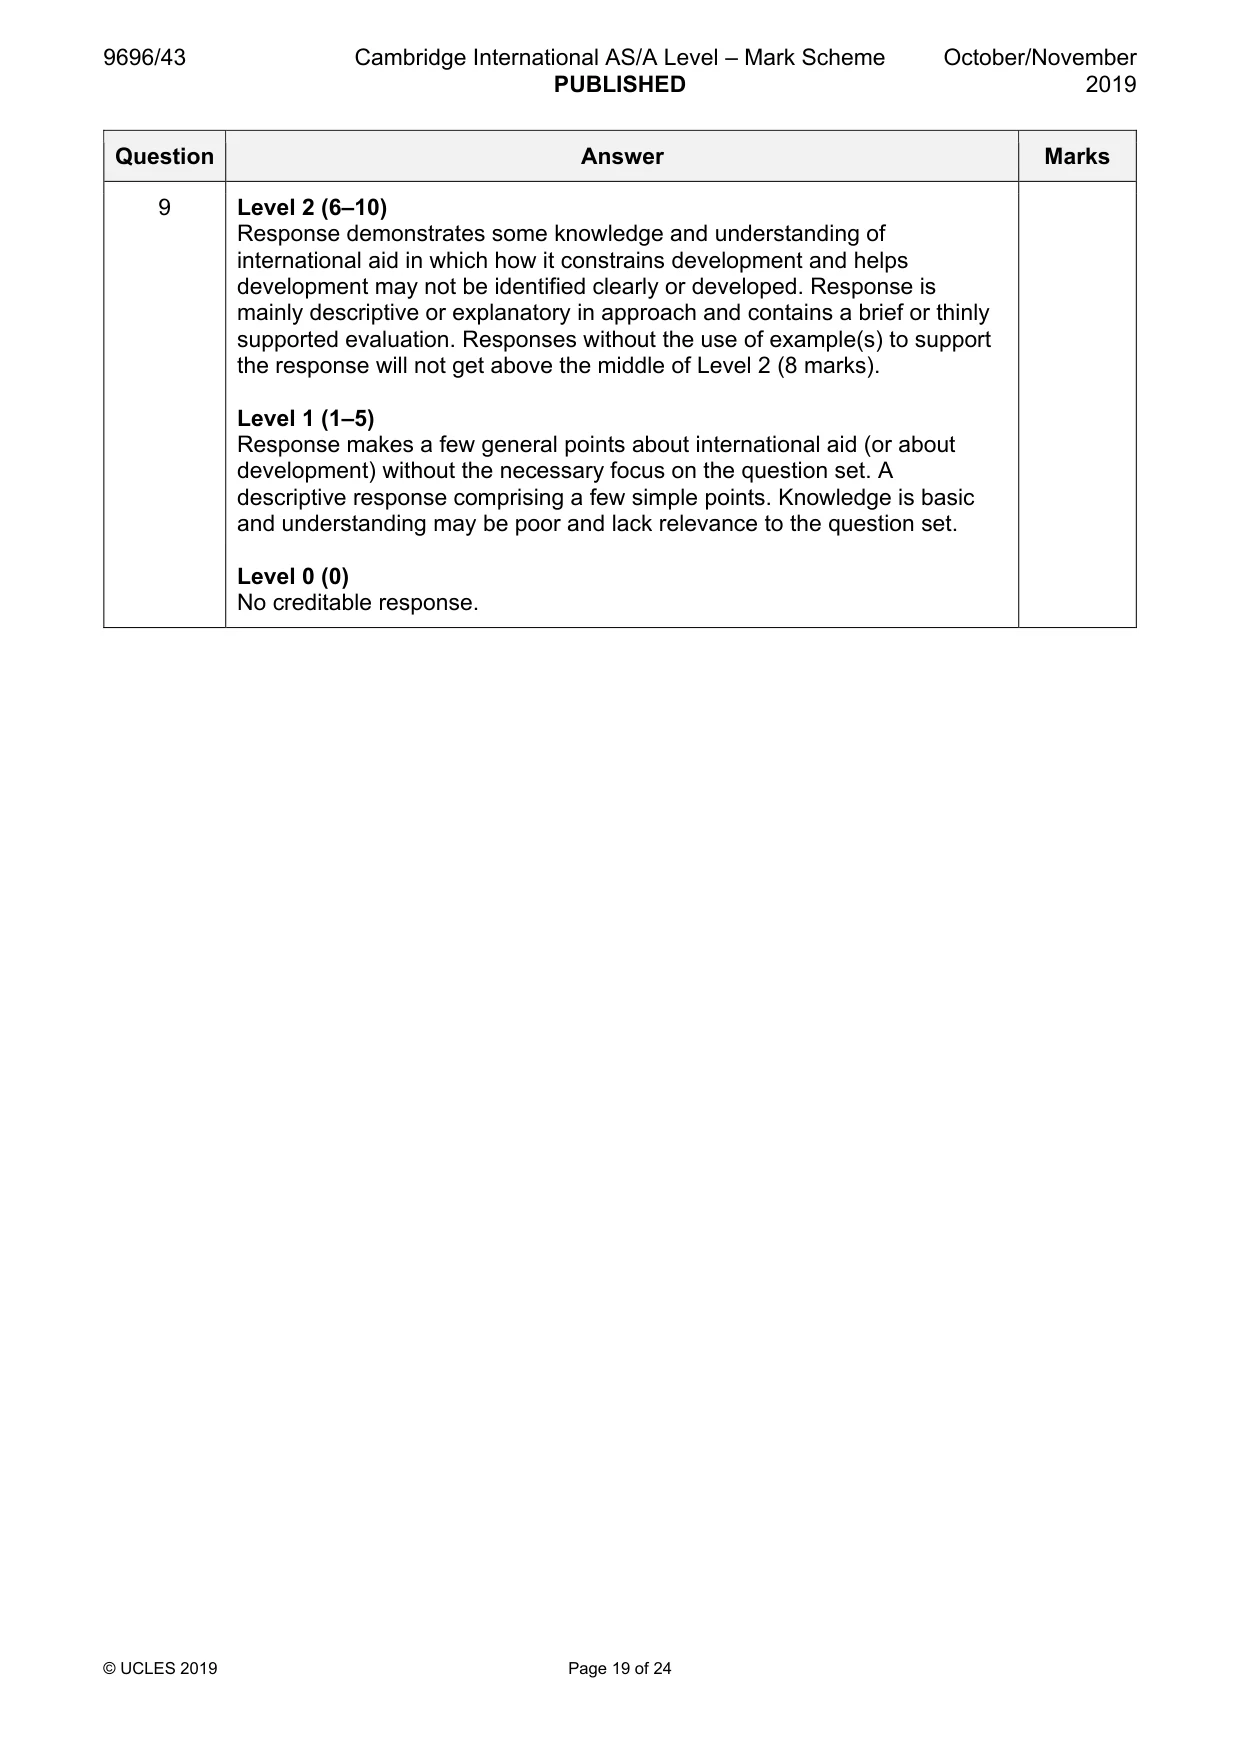
9 How far do you agree that international aid constrains development rather than helping development? [20] Economic transition If answering this option, answer Question 10 and either Question 11 or Question 12.
Mark scheme: 9 How far do you agree that international aid constrains development 20 rather than helping development? Candidates are free to develop their own approach to the question and responses will vary depending on the example(s) chosen. Whichever approach is chosen, essays which address the question and support their argument with relevant examples will be credited. The direction of the response and evaluation made will depend on the approach chosen, and any evaluation is therefore valid, if argued and based on evidence. The syllabus lists different types of aid: relief, development, tied, bilateral and multilateral and requires a critical evaluation of the impacts of international aid on receiving countries. Candidates may consider spatial scale and time scale as constraints on development. Possible ways that international aid constrains development include: • creating and fostering dependency rather than self-sufficiency, responsibility and innovation • inappropriate aims, e.g. culturally insensitive • forms of aid, e.g. tied aid • mismanagement and corruption • imports may impact local production negatively • other Possible ways that international aid helps development include: • large scale projects undertaken that would be impossible to achieve otherwise, e.g. dams, airports, road construction, water infrastructure • improving quality of life, e.g. housing, clean water, healthcare • good priorities transferred, e.g. child education, gender empowerment, political freedom, sustainability • multiplier effect, e.g. legacy of training, skills transfer helps further development • other, such as specific successful projects Award marks based on the quality of the response using the marking levels below. Level 4 (16–20) Response thoroughly discusses how far international aid constrains or helps development. An effective and sustained evaluation with a sound conclusion. Response is well founded in detailed exemplar knowledge and strong conceptual understanding of the topic. Examples used are appropriate and integrated effectively into the response. Level 3 (11–15) Response discusses how far international aid constrains or helps development. Response is broadly evaluative in character, comprising some explanatory or narrative content and a conclusion. Response develops on a largely secure base of knowledge and understanding with the use of example(s). 9 Level 2 (6–10) Response demonstrates some knowledge and understanding of international aid in which how it constrains development and helps development may not be identified clearly or developed. Response is mainly descriptive or explanatory in approach and contains a brief or thinly supported evaluation. Responses without the use of example(s) to support the response will not get above the middle of Level 2 (8 marks). Level 1 (1–5) Response makes a few general points about international aid (or about development) without the necessary focus on the question set. A descriptive response comprising a few simple points. Knowledge is basic and understanding may be poor and lack relevance to the question set. Level 0 (0) No creditable response. Economic transition If answering this option, answer Question 10 and either Question 11 or Question 12.
Q10 · Foreign direct investment (FDI), 2007–16
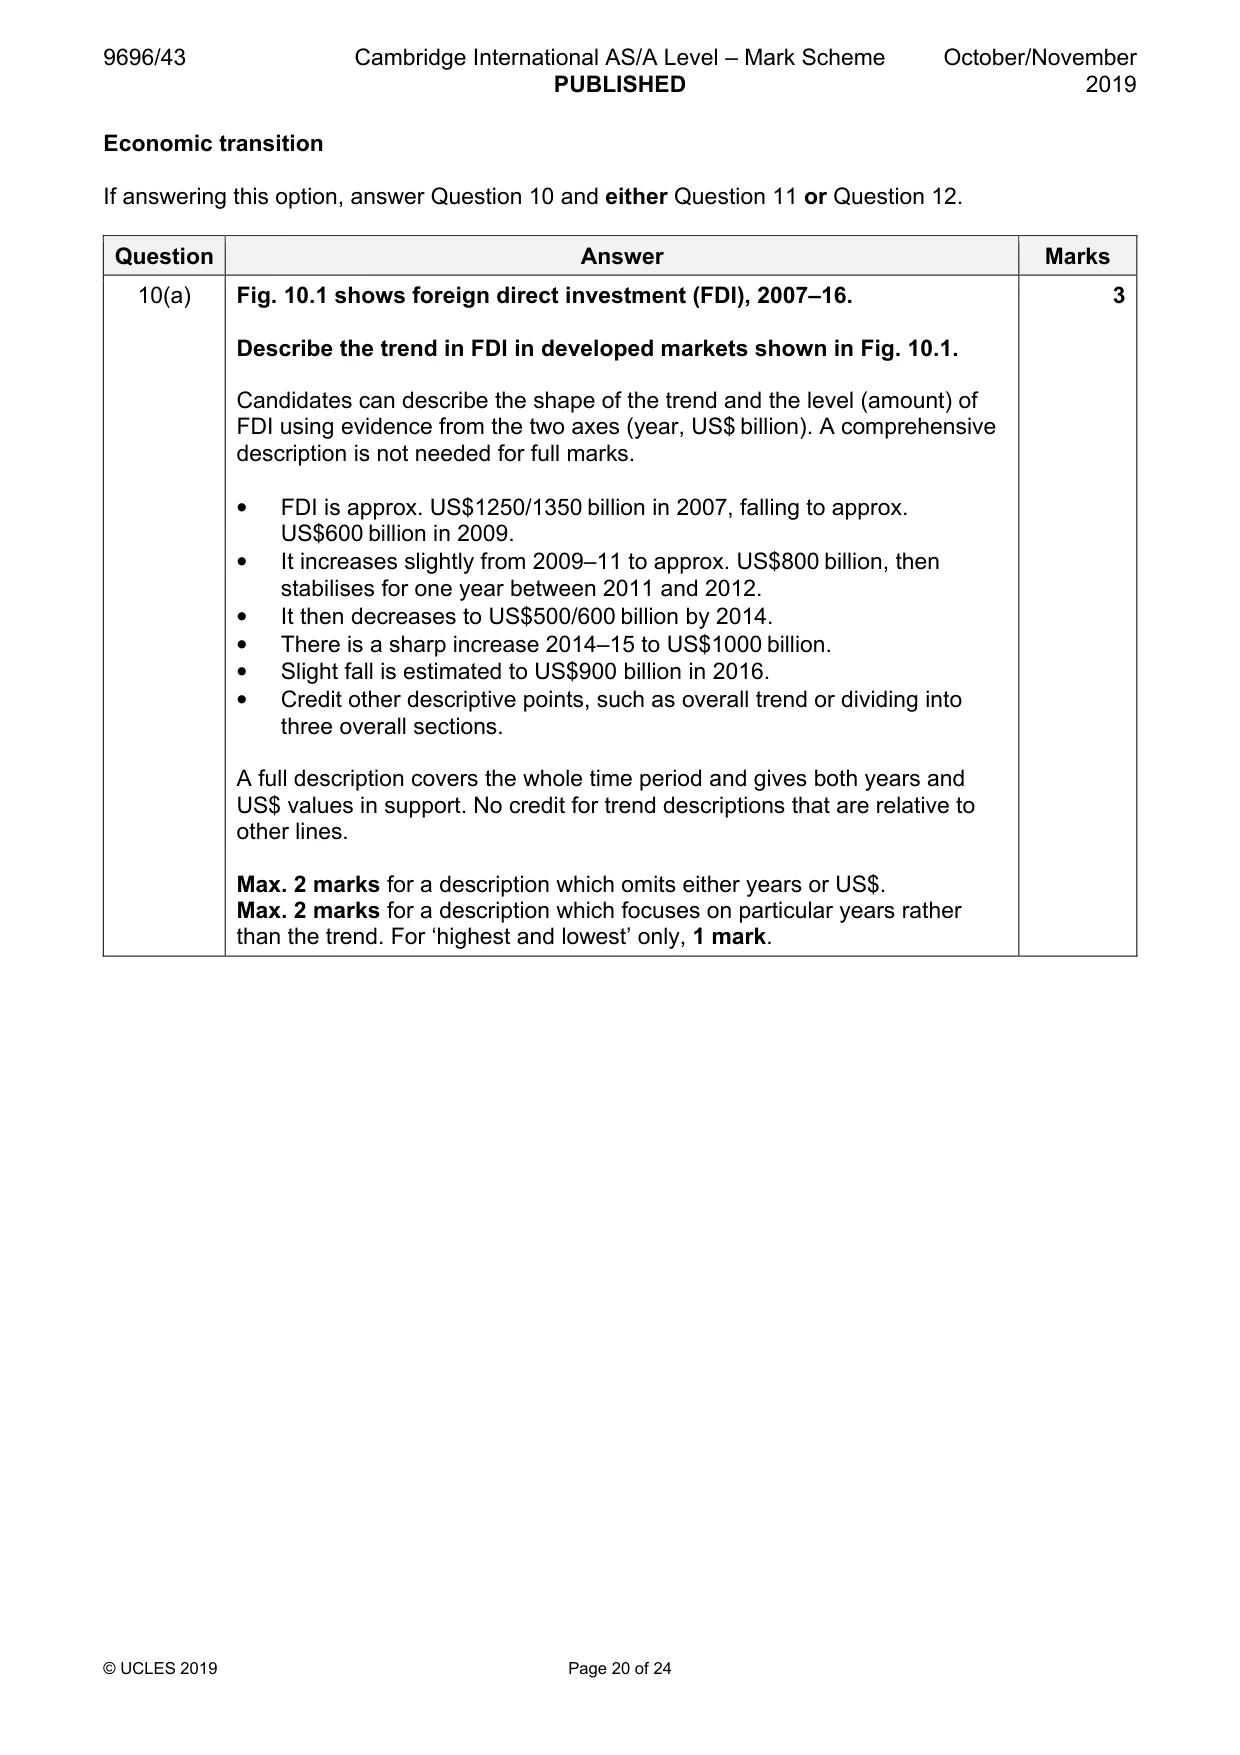
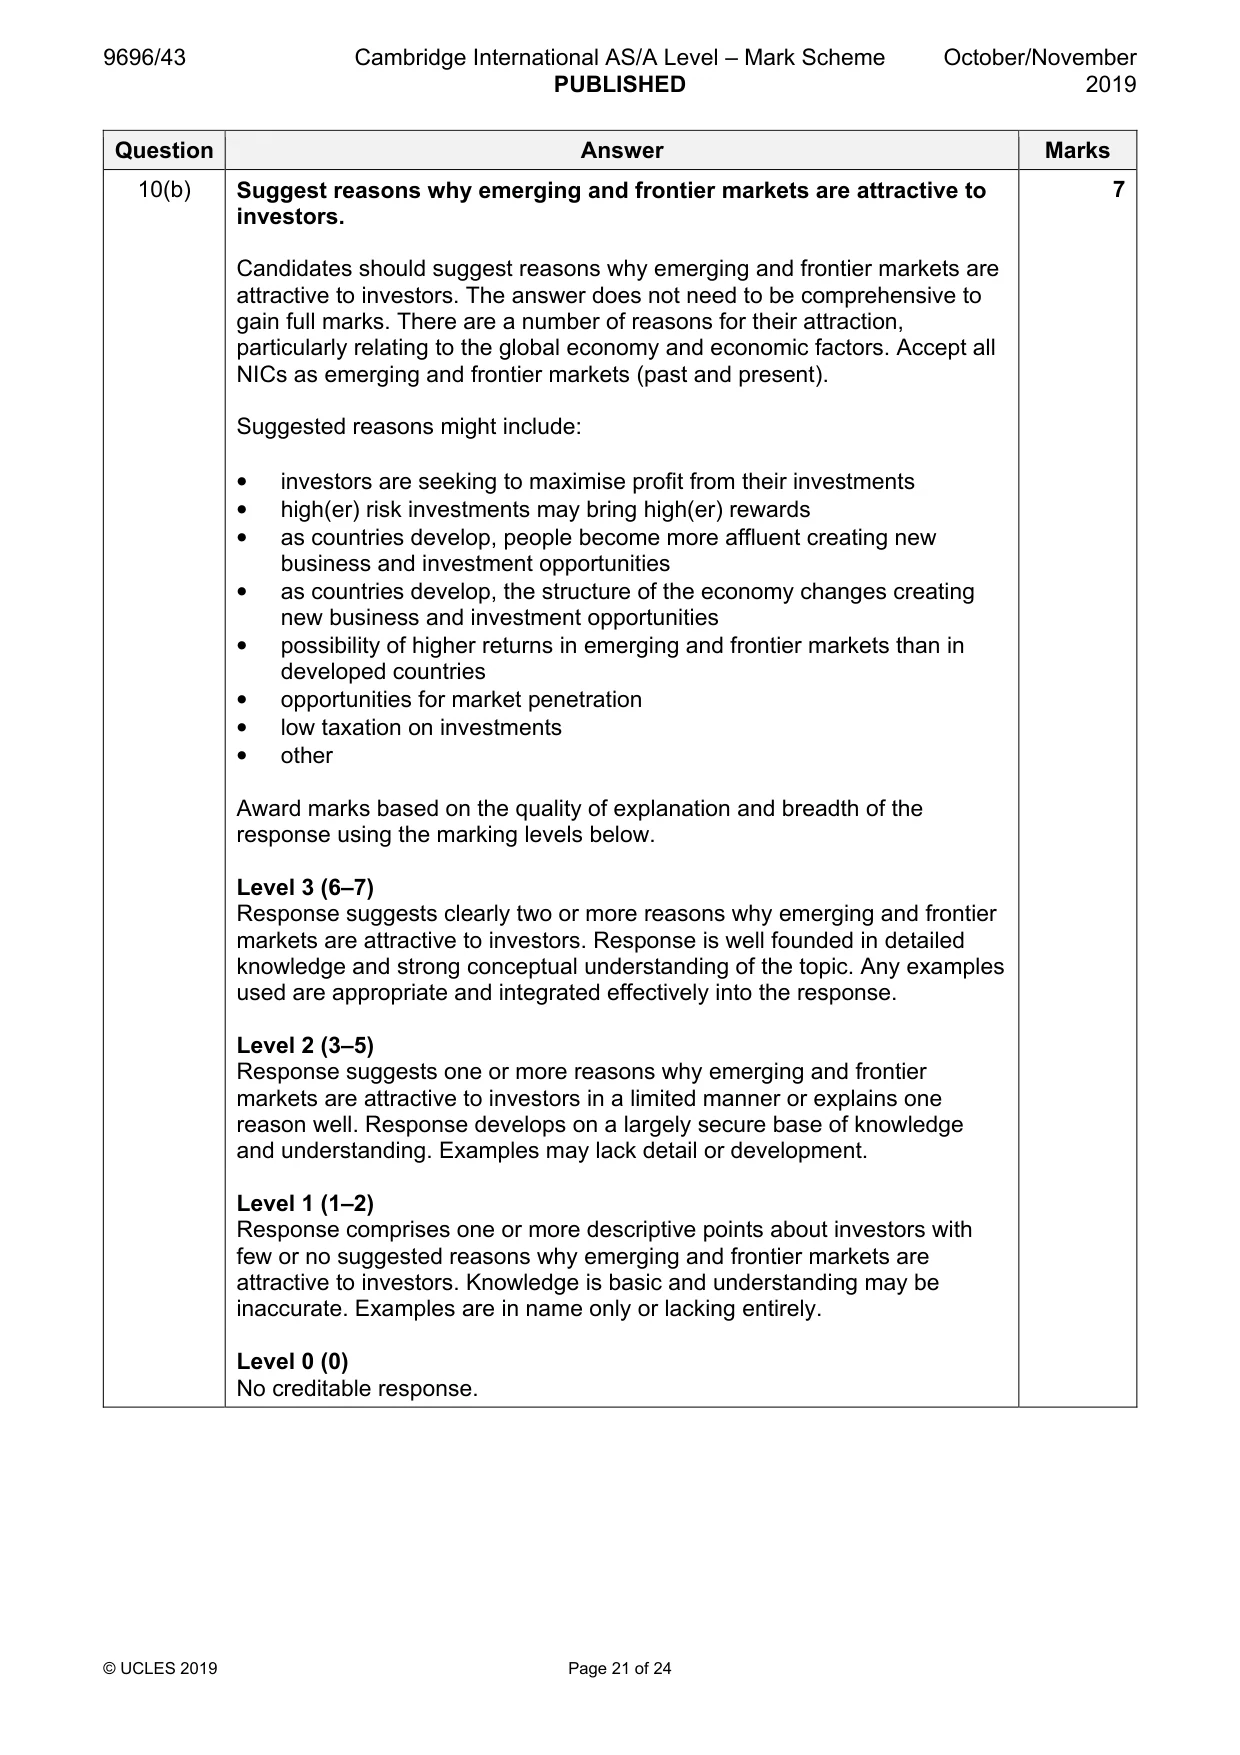
10 Fig. 10.1 shows foreign direct investment (FDI), 2007–16. (a) Describe the trend in FDI in developed markets shown in Fig. 10.1. [3] (b) Suggest reasons why emerging and frontier markets are attractive to investors. [7]
Mark scheme: 10(a) Fig. 10.1 shows foreign direct investment (FDI), 2007–16. 3 Describe the trend in FDI in developed markets shown in Fig. 10.1. Candidates can describe the shape of the trend and the level (amount) of FDI using evidence from the two axes (year, US$ billion). A comprehensive description is not needed for full marks. • FDI is approx. US$1250/1350 billion in 2007, falling to approx. US$600 billion in 2009. • It increases slightly from 2009–11 to approx. US$800 billion, then stabilises for one year between 2011 and 2012. • It then decreases to US$500/600 billion by 2014. • There is a sharp increase 2014–15 to US$1000 billion. • Slight fall is estimated to US$900 billion in 2016. • Credit other descriptive points, such as overall trend or dividing into three overall sections. A full description covers the whole time period and gives both years and US$ values in support. No credit for trend descriptions that are relative to other lines. Max. 2 marks for a description which omits either years or US$. Max. 2 marks for a description which focuses on particular years rather than the trend. For ‘highest and lowest’ only, 1 mark. 10(b) Suggest reasons why emerging and frontier markets are attractive to 7 investors. Candidates should suggest reasons why emerging and frontier markets are attractive to investors. The answer does not need to be comprehensive to gain full marks. There are a number of reasons for their attraction, particularly relating to the global economy and economic factors. Accept all NICs as emerging and frontier markets (past and present). Suggested reasons might include: • investors are seeking to maximise profit from their investments • high(er) risk investments may bring high(er) rewards • as countries develop, people become more affluent creating new business and investment opportunities • as countries develop, the structure of the economy changes creating new business and investment opportunities • possibility of higher returns in emerging and frontier markets than in developed countries • opportunities for market penetration • low taxation on investments • other Award marks based on the quality of explanation and breadth of the response using the marking levels below. Level 3 (6–7) Response suggests clearly two or more reasons why emerging and frontier markets are attractive to investors. Response is well founded in detailed knowledge and strong conceptual understanding of the topic. Any examples used are appropriate and integrated effectively into the response. Level 2 (3–5) Response suggests one or more reasons why emerging and frontier markets are attractive to investors in a limited manner or explains one reason well. Response develops on a largely secure base of knowledge and understanding. Examples may lack detail or development. Level 1 (1–2) Response comprises one or more descriptive points about investors with few or no suggested reasons why emerging and frontier markets are attractive to investors. Knowledge is basic and understanding may be inaccurate. Examples are in name only or lacking entirely. Level 0 (0) No creditable response.
Q11 · Discuss the best way to measure social inequality
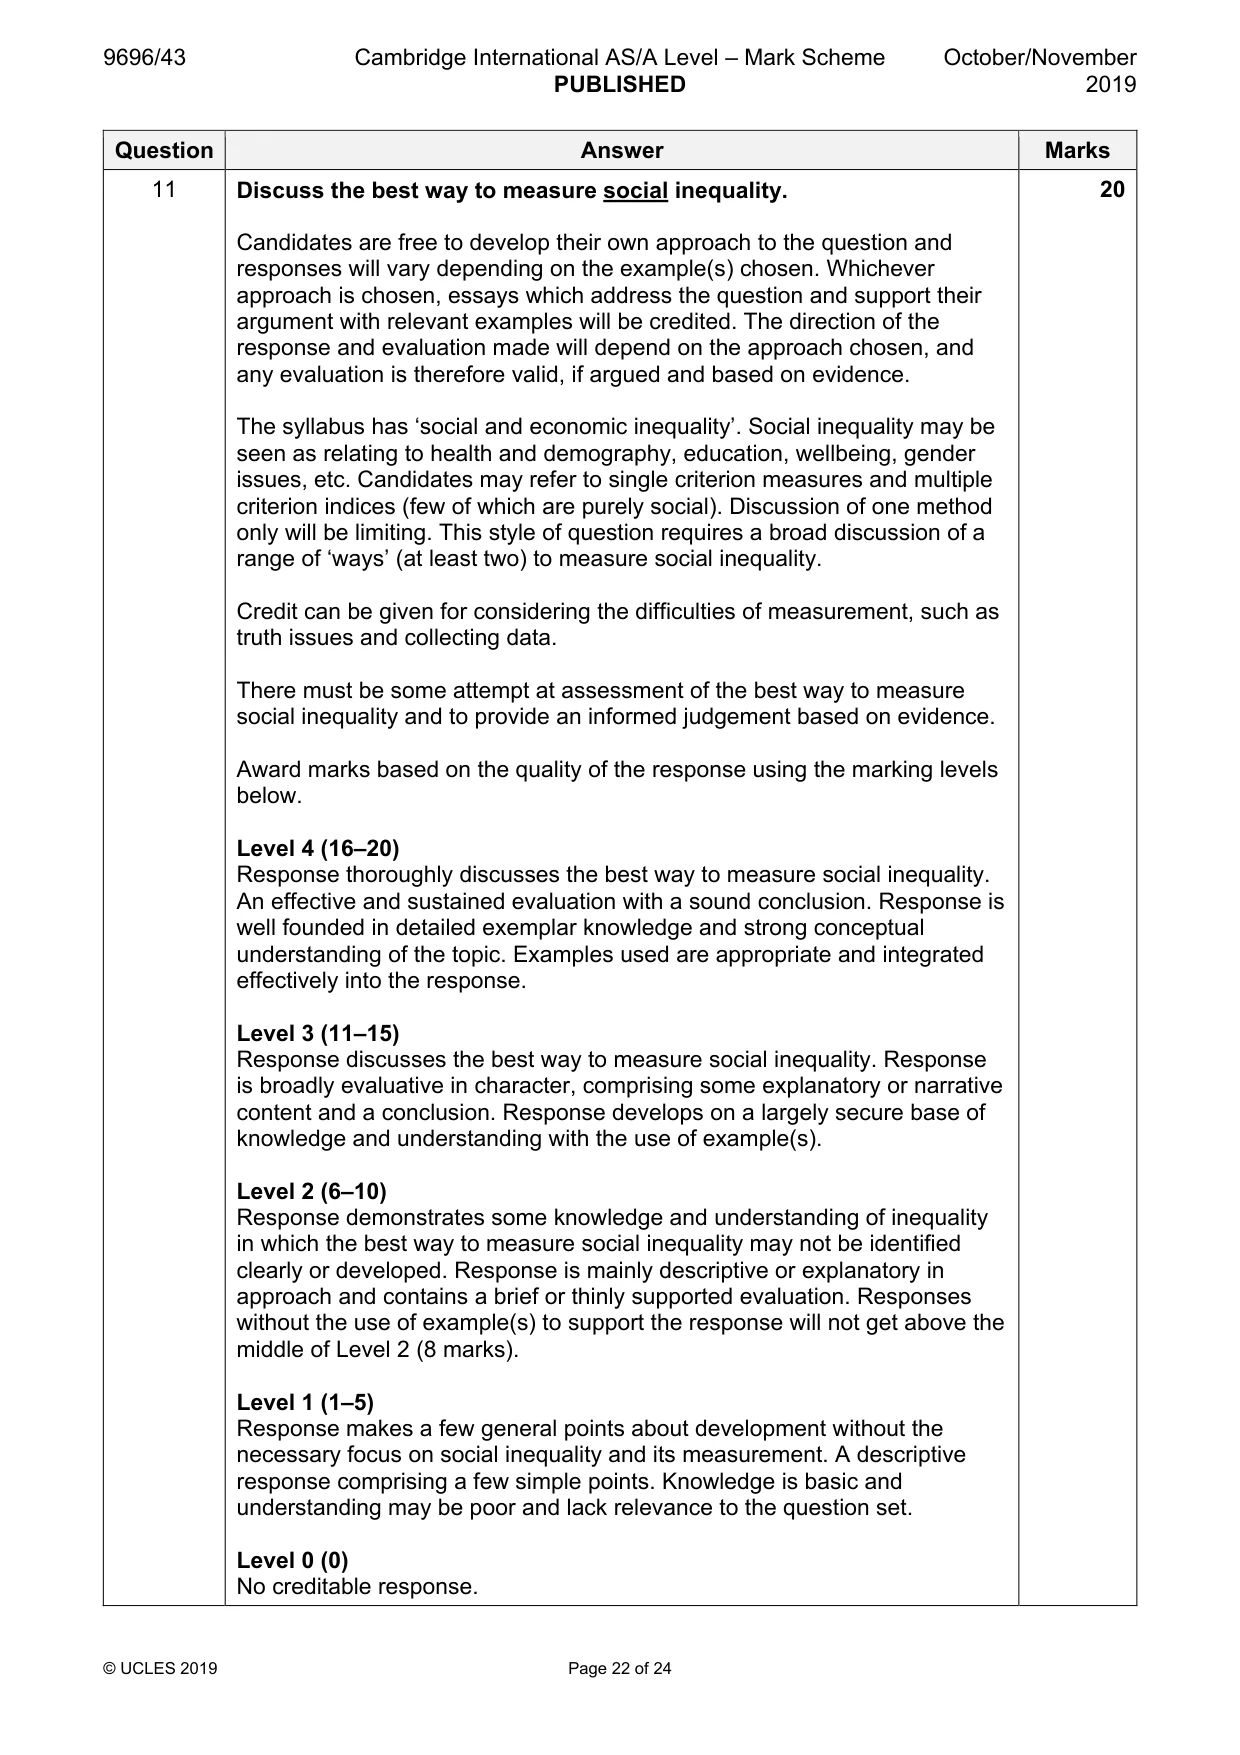
11 Discuss the best way to measure social inequality. [20]
Mark scheme: 11 Discuss the best way to measure social inequality. 20 Candidates are free to develop their own approach to the question and responses will vary depending on the example(s) chosen. Whichever approach is chosen, essays which address the question and support their argument with relevant examples will be credited. The direction of the response and evaluation made will depend on the approach chosen, and any evaluation is therefore valid, if argued and based on evidence. The syllabus has ‘social and economic inequality’. Social inequality may be seen as relating to health and demography, education, wellbeing, gender issues, etc. Candidates may refer to single criterion measures and multiple criterion indices (few of which are purely social). Discussion of one method only will be limiting. This style of question requires a broad discussion of a range of ‘ways’ (at least two) to measure social inequality. Credit can be given for considering the difficulties of measurement, such as truth issues and collecting data. There must be some attempt at assessment of the best way to measure social inequality and to provide an informed judgement based on evidence. Award marks based on the quality of the response using the marking levels below. Level 4 (16–20) Response thoroughly discusses the best way to measure social inequality. An effective and sustained evaluation with a sound conclusion. Response is well founded in detailed exemplar knowledge and strong conceptual understanding of the topic. Examples used are appropriate and integrated effectively into the response. Level 3 (11–15) Response discusses the best way to measure social inequality. Response is broadly evaluative in character, comprising some explanatory or narrative content and a conclusion. Response develops on a largely secure base of knowledge and understanding with the use of example(s). Level 2 (6–10) Response demonstrates some knowledge and understanding of inequality in which the best way to measure social inequality may not be identified clearly or developed. Response is mainly descriptive or explanatory in approach and contains a brief or thinly supported evaluation. Responses without the use of example(s) to support the response will not get above the middle of Level 2 (8 marks). Level 1 (1–5) Response makes a few general points about development without the necessary focus on social inequality and its measurement. A descriptive response comprising a few simple points. Knowledge is basic and understanding may be poor and lack relevance to the question set. Level 0 (0) No creditable response.
Q12 · Assess the role of initial advantage(s) in the development of the core region of one or…
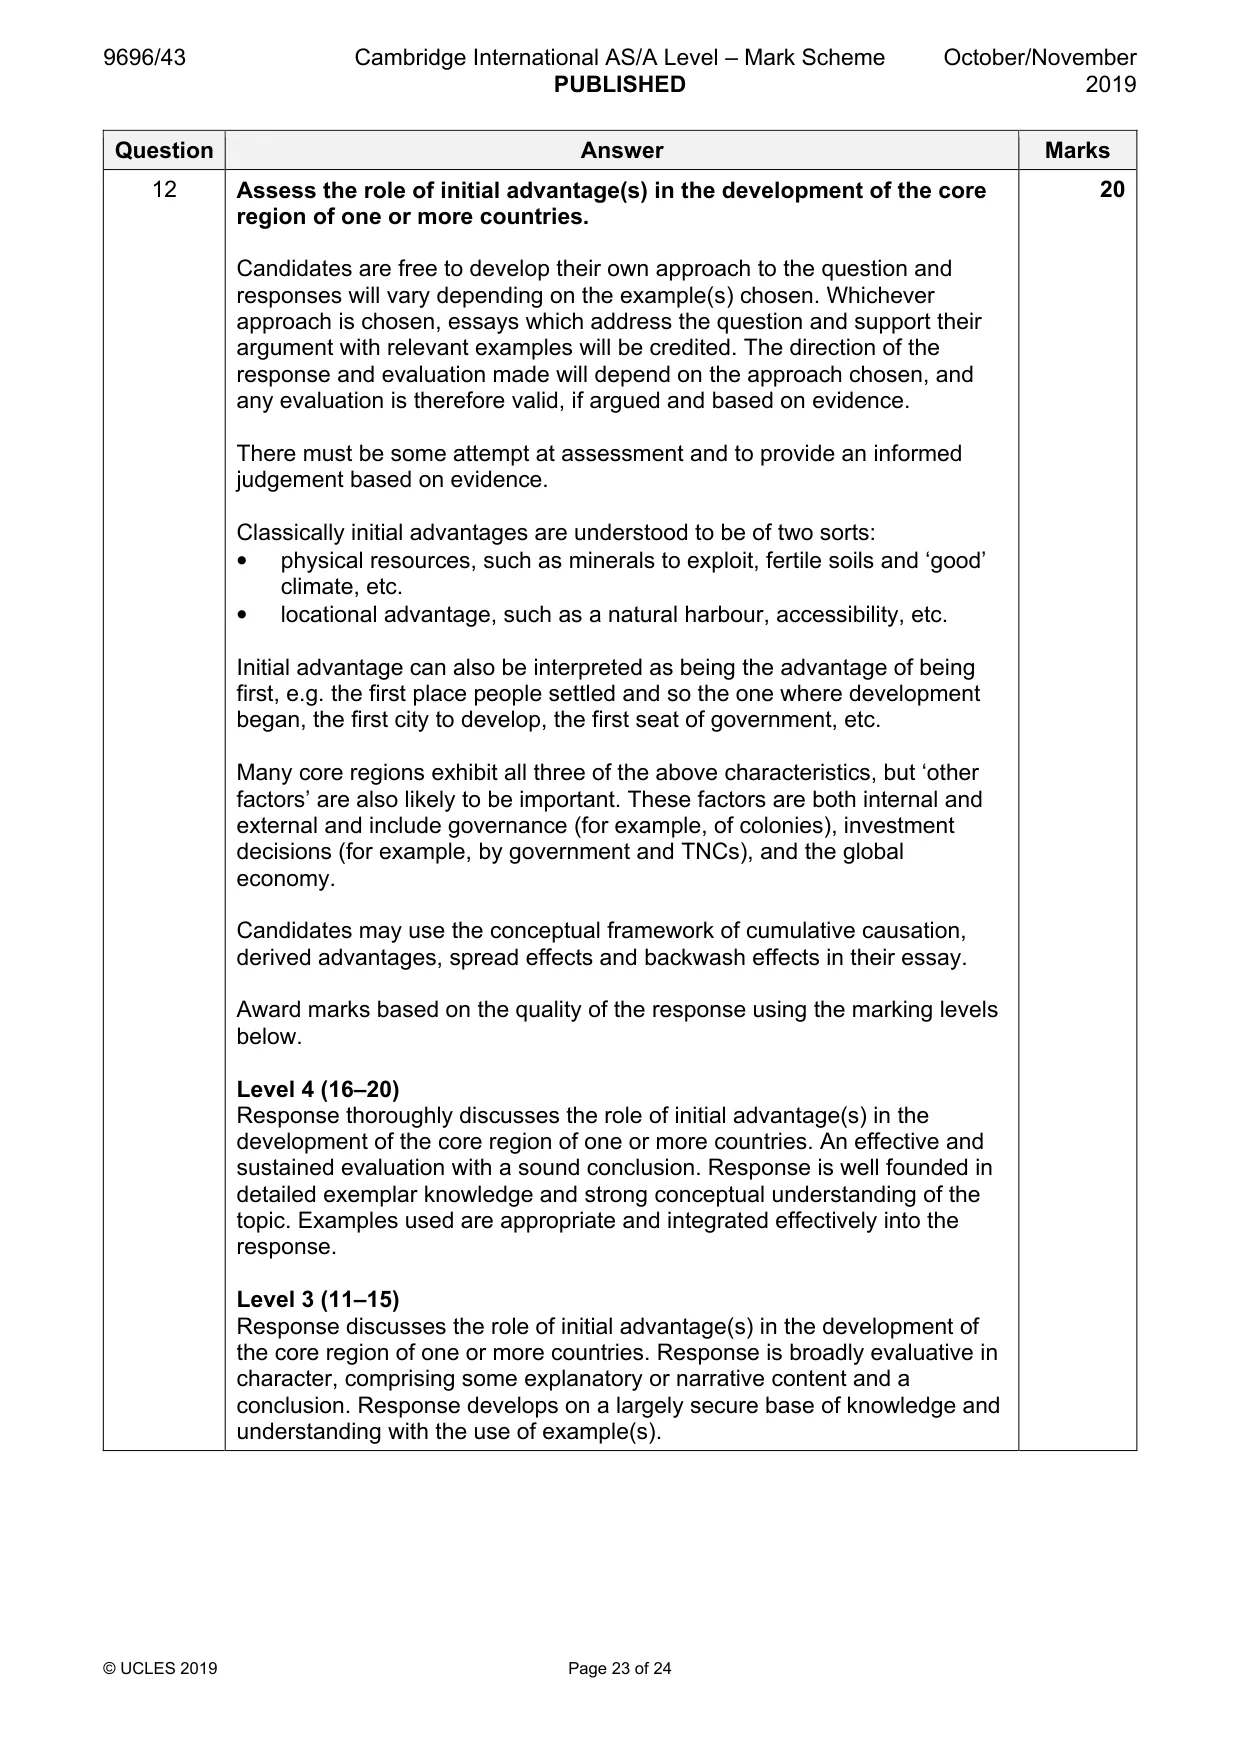
12 Assess the role of initial advantage(s) in the development of the core region of one or more countries. [20]
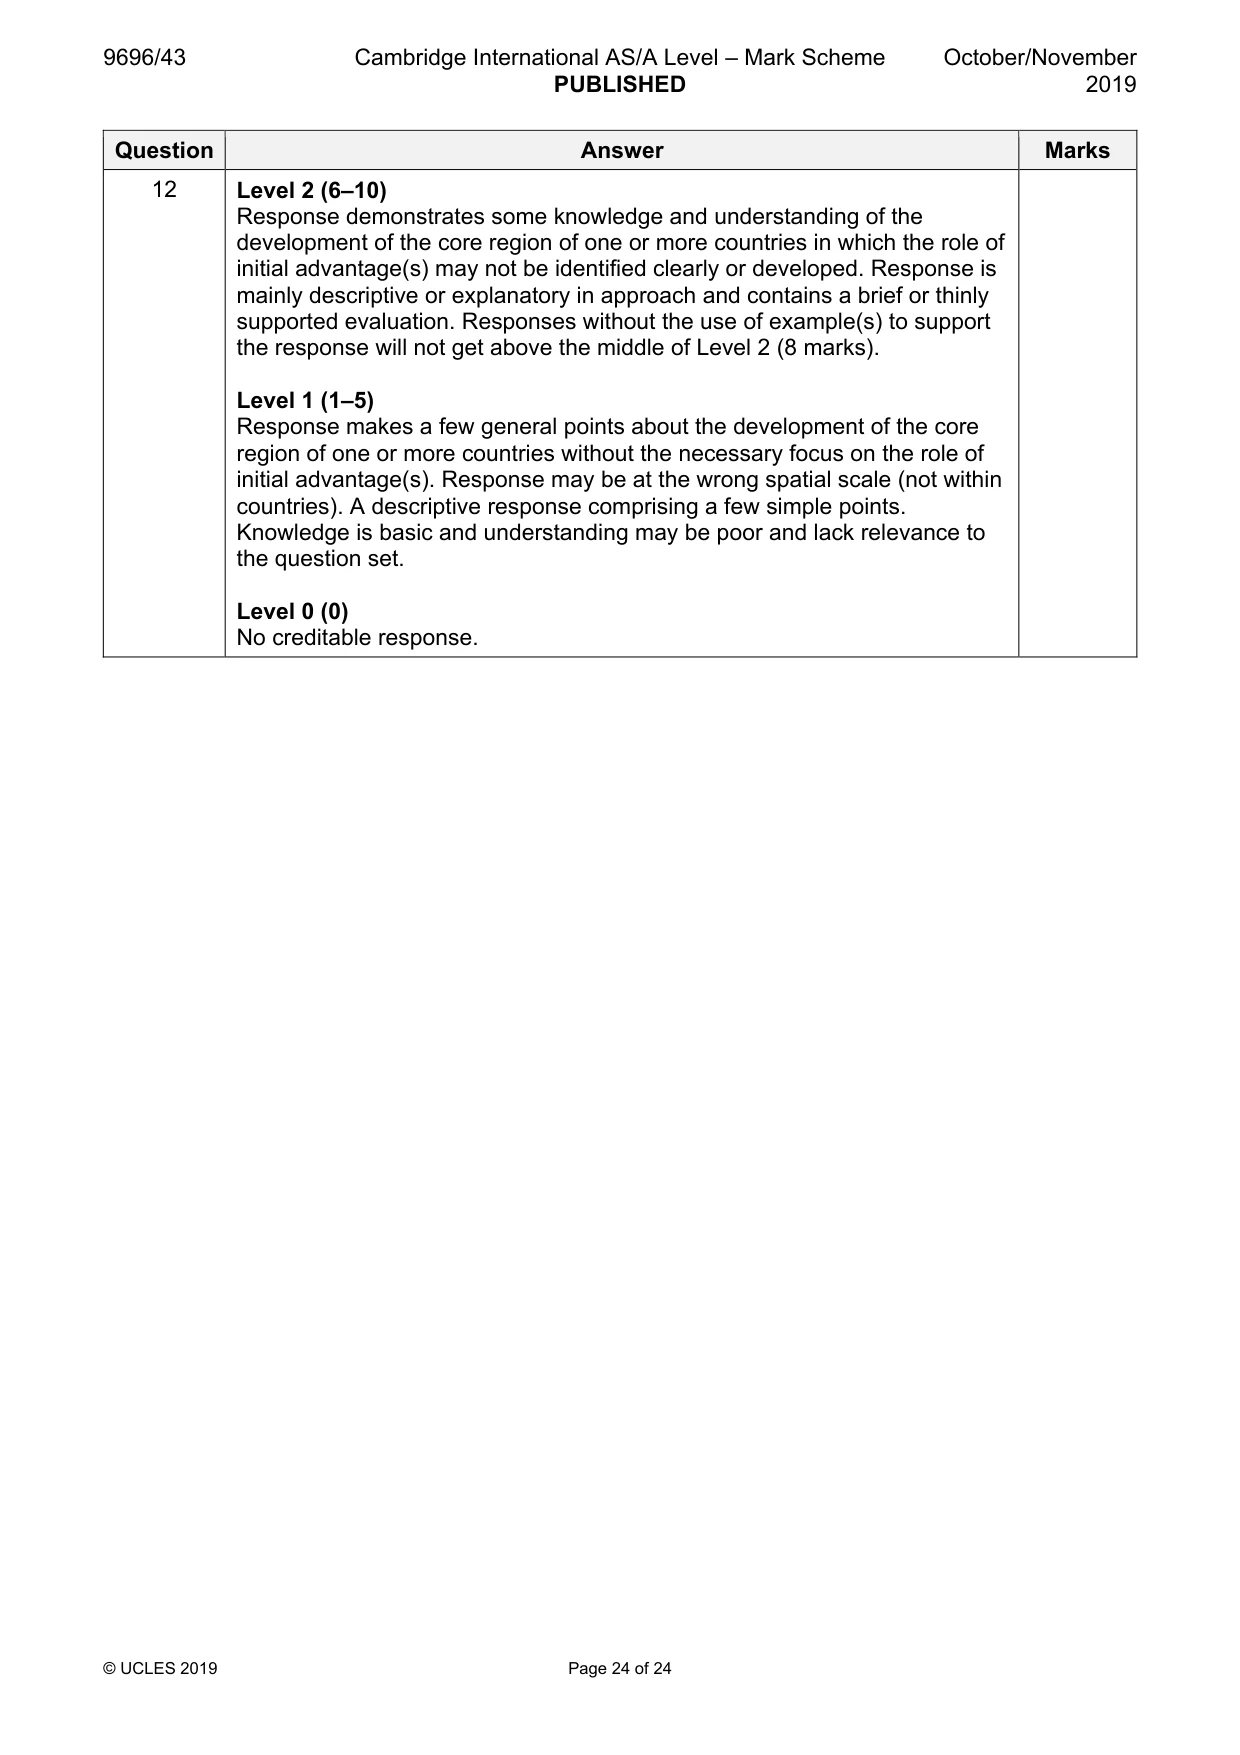
Mark scheme: 12 Assess the role of initial advantage(s) in the development of the core 20 region of one or more countries. Candidates are free to develop their own approach to the question and responses will vary depending on the example(s) chosen. Whichever approach is chosen, essays which address the question and support their argument with relevant examples will be credited. The direction of the response and evaluation made will depend on the approach chosen, and any evaluation is therefore valid, if argued and based on evidence. There must be some attempt at assessment and to provide an informed judgement based on evidence. Classically initial advantages are understood to be of two sorts: • physical resources, such as minerals to exploit, fertile soils and ‘good’ climate, etc. • locational advantage, such as a natural harbour, accessibility, etc. Initial advantage can also be interpreted as being the advantage of being first, e.g. the first place people settled and so the one where development began, the first city to develop, the first seat of government, etc. Many core regions exhibit all three of the above characteristics, but ‘other factors’ are also likely to be important. These factors are both internal and external and include governance (for example, of colonies), investment decisions (for example, by government and TNCs), and the global economy. Candidates may use the conceptual framework of cumulative causation, derived advantages, spread effects and backwash effects in their essay. Award marks based on the quality of the response using the marking levels below. Level 4 (16–20) Response thoroughly discusses the role of initial advantage(s) in the development of the core region of one or more countries. An effective and sustained evaluation with a sound conclusion. Response is well founded in detailed exemplar knowledge and strong conceptual understanding of the topic. Examples used are appropriate and integrated effectively into the response. Level 3 (11–15) Response discusses the role of initial advantage(s) in the development of the core region of one or more countries. Response is broadly evaluative in character, comprising some explanatory or narrative content and a conclusion. Response develops on a largely secure base of knowledge and understanding with the use of example(s). 12 Level 2 (6–10) Response demonstrates some knowledge and understanding of the development of the core region of one or more countries in which the role of initial advantage(s) may not be identified clearly or developed. Response is mainly descriptive or explanatory in approach and contains a brief or thinly supported evaluation. Responses without the use of example(s) to support the response will not get above the middle of Level 2 (8 marks). Level 1 (1–5) Response makes a few general points about the development of the core region of one or more countries without the necessary focus on the role of initial advantage(s). Response may be at the wrong spatial scale (not within countries). A descriptive response comprising a few simple points. Knowledge is basic and understanding may be poor and lack relevance to the question set. Level 0 (0) No creditable response.
What was in this paper
The subtopics covered by these 12 questions, and how many questions each got. Open one in a new tab to see every Cambridge question on it.
1Environmental degradation1International debt and international aid1Manufacturing and related service industry1National development1Regional development within countries1The development of international tourism1The globalisation of economic activity1The management of change in manufacturing industry1The management of energy supply1The management of urban settlements1Trade flows and trading patterns1What you needed in this session
Cambridge’s own grade thresholds for 2019 Oct/Nov, Paper 4 · Variant 3. A higher threshold means an easier paper — the bar moves with how the cohort did.