Cambridge A Level Geography 9696 — 2018 May/June Paper 1 · Variant 1
9696/11/M/J/18 · 60 marks · ≈68 min
The question paper and its mark scheme, free to read here and free to download. This is Cambridge’s own paper, exactly as it was sat.
Question paper4 pages

Mark scheme14 pages
Answers below. Sit the paper first if you are practising.


Paper as text
Question paper, page 1
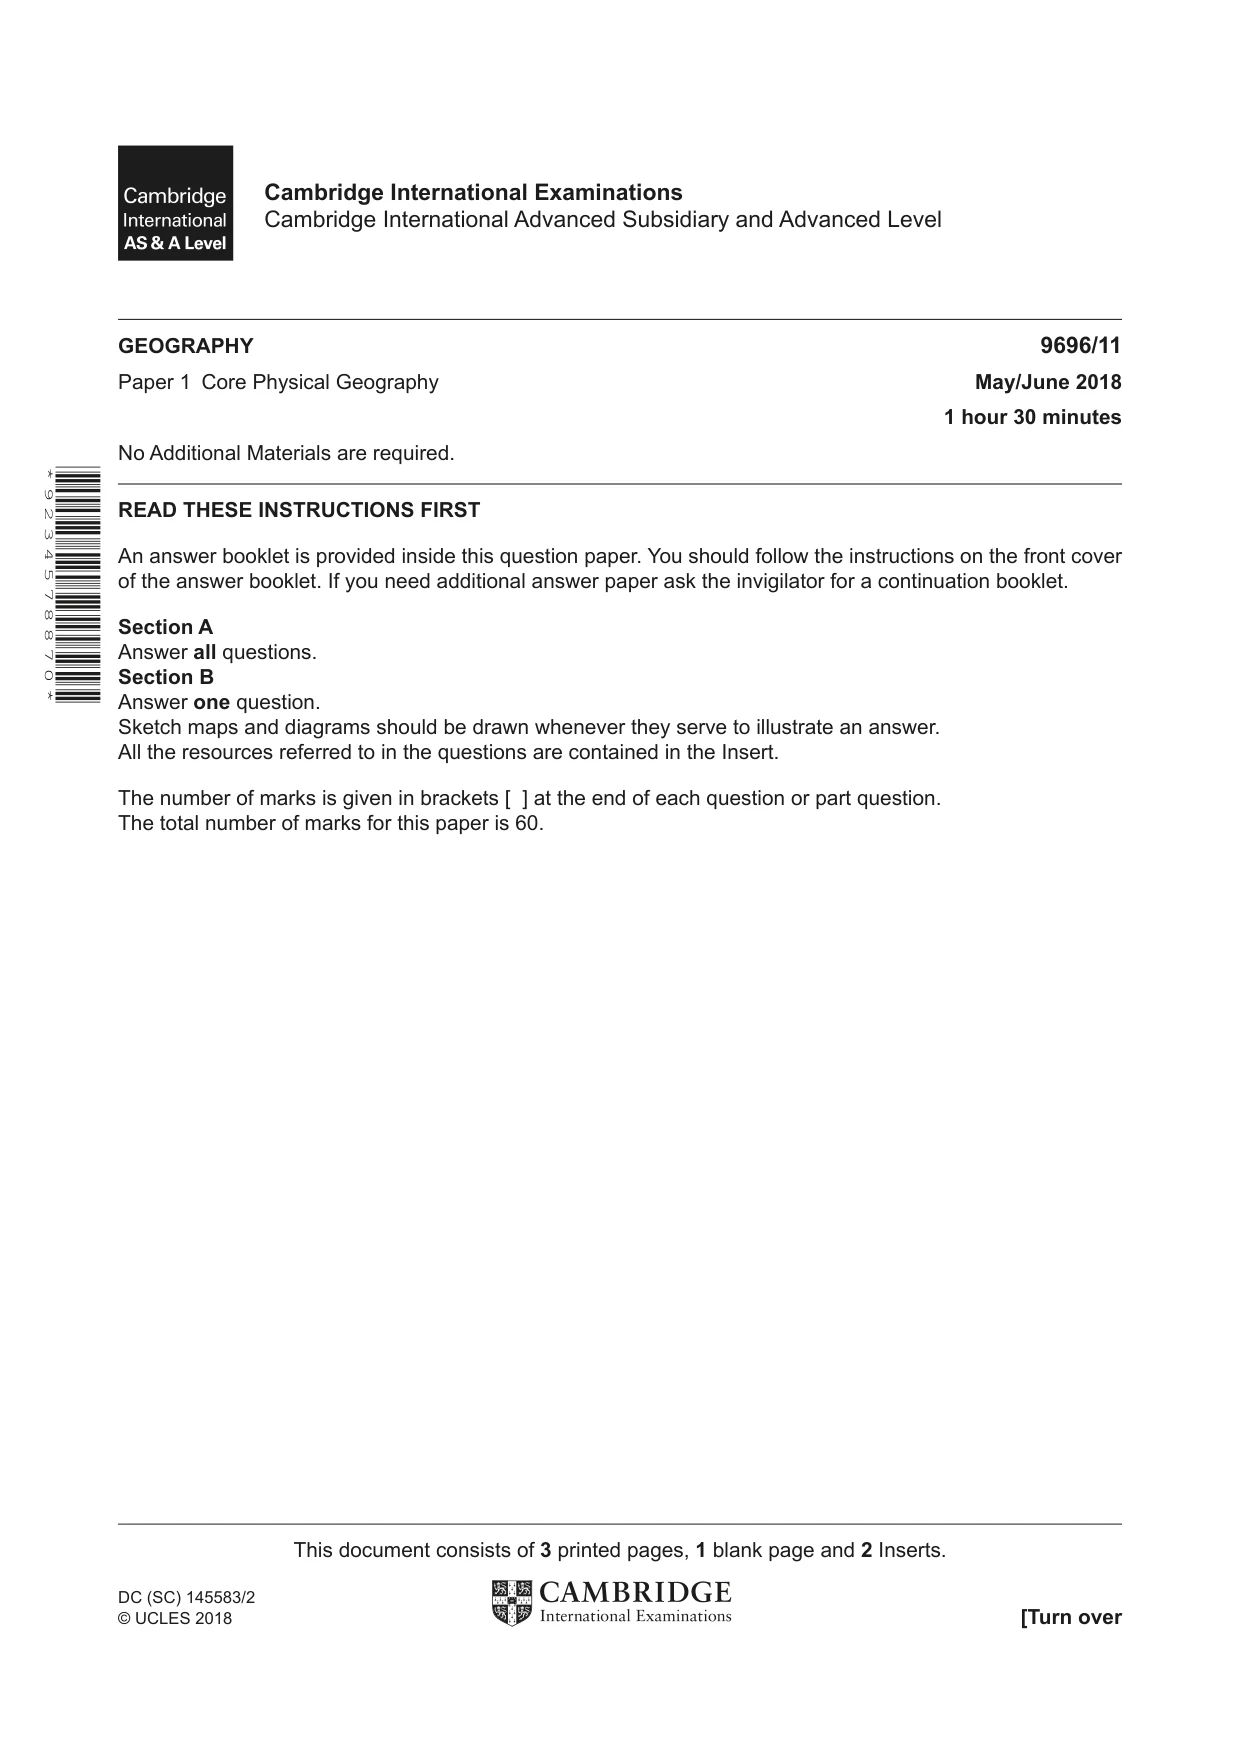
This document consists of 3 printed pages, 1 blank page and 2 Inserts. DC (SC) 145583/2 © UCLES 2018 [Turn over Cambridge International Examinations Cambridge International Advanced Subsidiary and Advanced Level * 9 2 3 4 5 7 8 8 7 0 * GEOGRAPHY 9696/11 Paper 1 Core Physical Geography May/June 2018 1 hour 30 minutes No Additional Materials are required. READ THESE INSTRUCTIONS FIRST An answer booklet is provided inside this question paper. You should follow the instructions on the front cover of the answer booklet. If you need additional answer paper ask the invigilator for a continuation booklet. Section A Answer all questions. Section B Answer one question. Sketch maps and diagrams should be drawn whenever they serve to illustrate an answer. All the resources referred to in the questions are contained in the Insert. The number of marks is given in brackets [ ] at the end of each question or part question. The total number of marks for this paper is 60.
Question paper, page 2
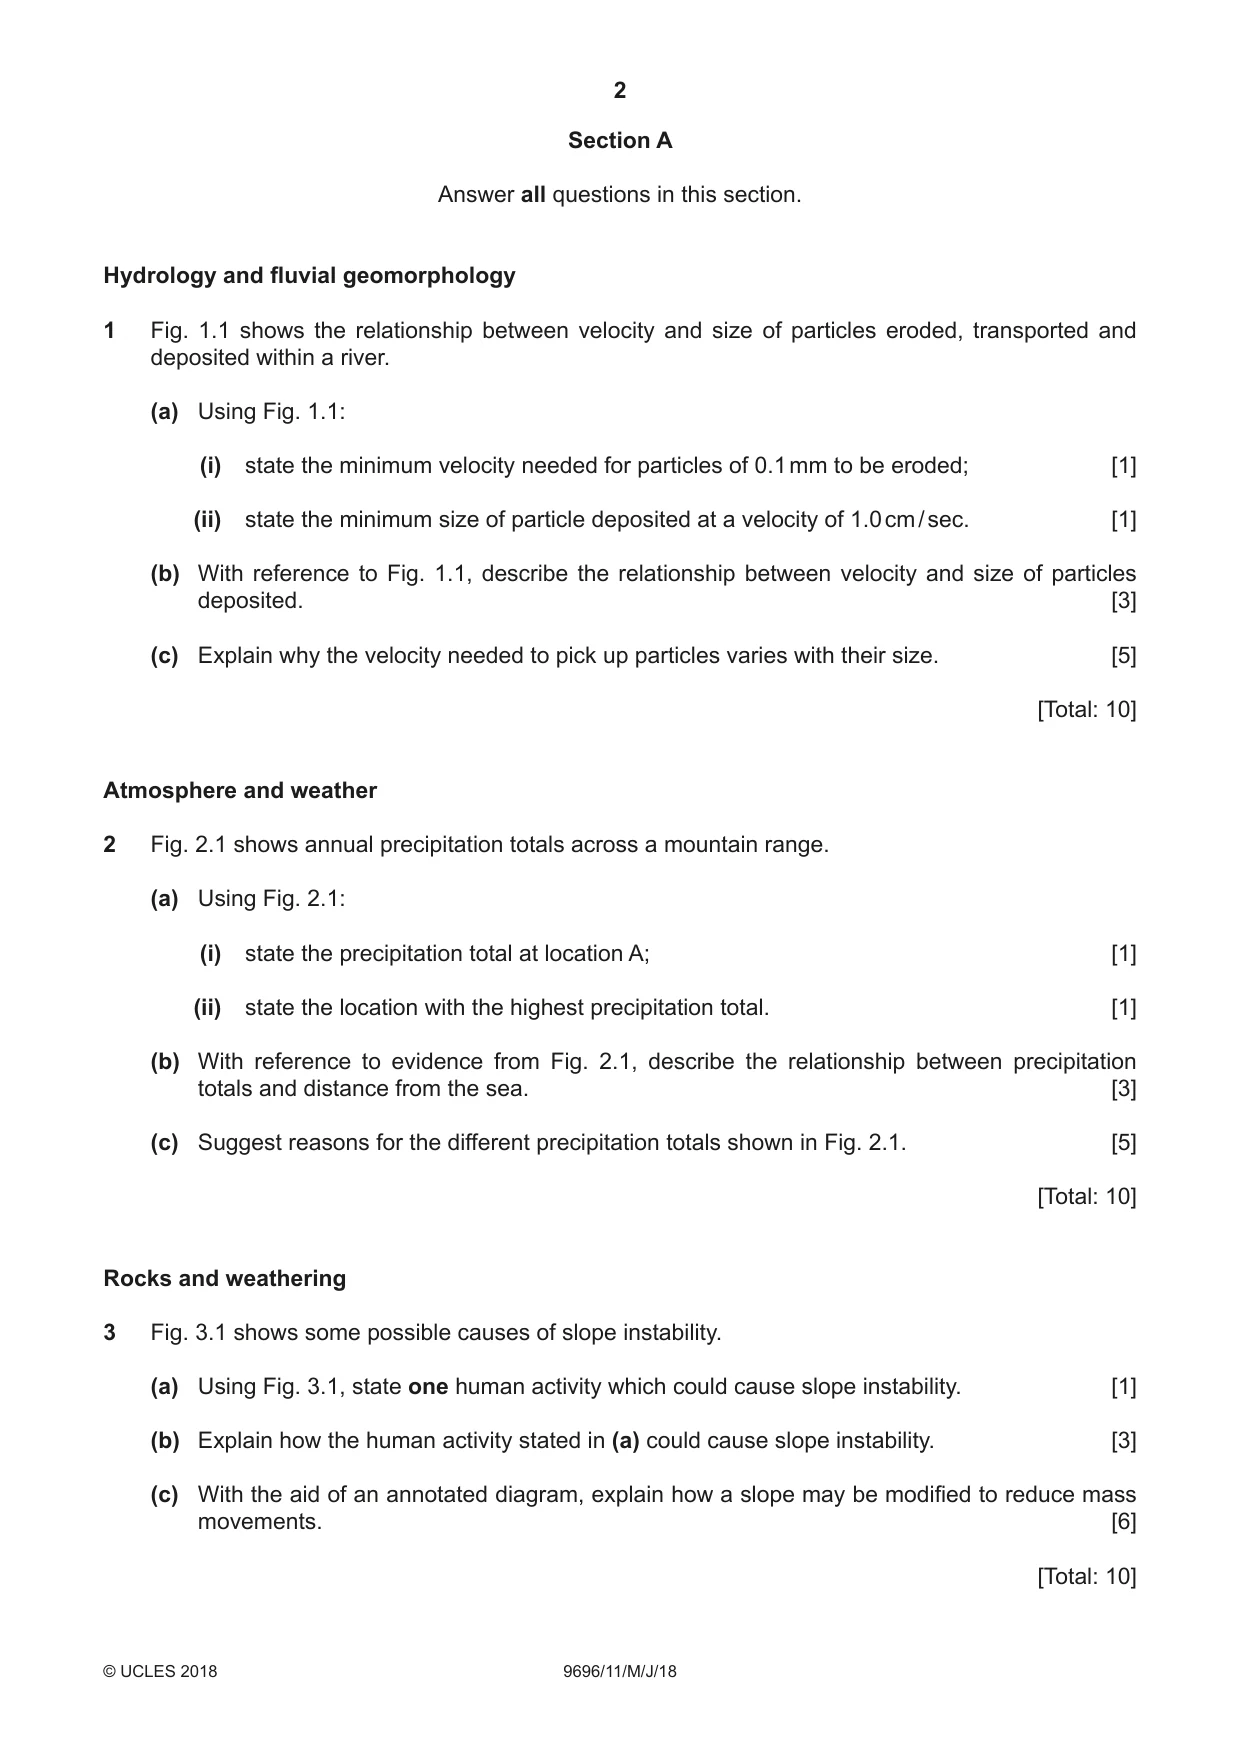
2 9696/11/M/J/18 © UCLES 2018 Section A Answer all questions in this section. Hydrology and fluvial geomorphology 1 Fig. 1.1 shows the relationship between velocity and size of particles eroded, transported and deposited within a river. (a) Using Fig. 1.1: (i) state the minimum velocity needed for particles of 0.1 mm to be eroded; [1] (ii) state the minimum size of particle deposited at a velocity of 1.0 cm / sec. [1] (b) With reference to Fig. 1.1, describe the relationship between velocity and size of particles deposited. [3] (c) Explain why the velocity needed to pick up particles varies with their size. [5] [Total: 10] Atmosphere and weather 2 Fig. 2.1 shows annual precipitation totals across a mountain range. (a) Using Fig. 2.1: (i) state the precipitation total at location A; [1] (ii) state the location with the highest precipitation total. [1] (b) With reference to evidence from Fig. 2.1, describe the relationship between precipitation totals and distance from the sea. [3] (c) Suggest reasons for the different precipitation totals shown in Fig. 2.1. [5] [Total: 10] Rocks and weathering 3 Fig. 3.1 shows some possible causes of slope instability. (a) Using Fig. 3.1, state one human activity which could cause slope instability. [1] (b) Explain how the human activity stated in (a) could cause slope instability. [3] (c) With the aid of an annotated diagram, explain how a slope may be modified to reduce mass movements. [6] [Total: 10]
Question paper, page 3
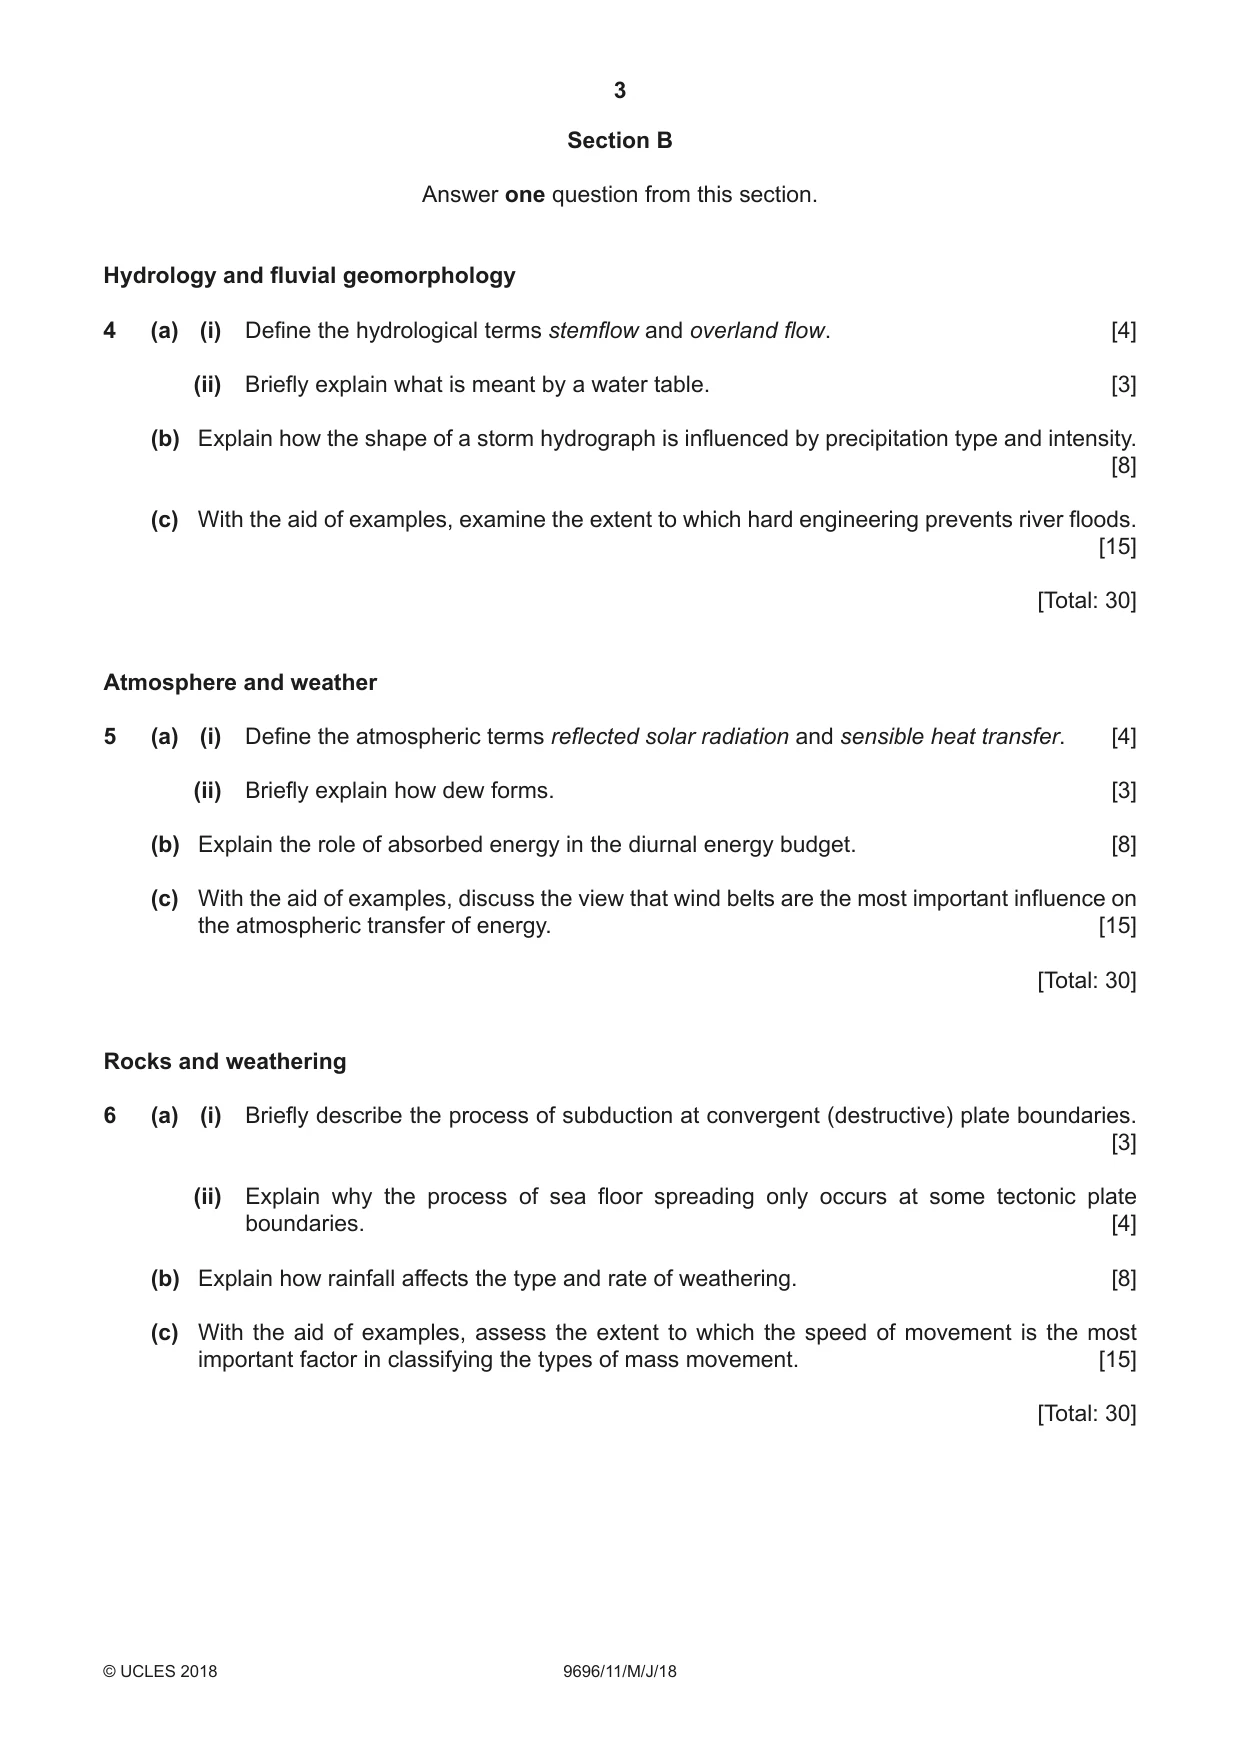
3 9696/11/M/J/18 © UCLES 2018 Section B Answer one question from this section. Hydrology and fluvial geomorphology 4 (a) (i) Define the hydrological terms stemflow and overland flow. [4] (ii) Briefly explain what is meant by a water table. [3] (b) Explain how the shape of a storm hydrograph is influenced by precipitation type and intensity. [8] (c) With the aid of examples, examine the extent to which hard engineering prevents river floods. [15] [Total: 30] Atmosphere and weather 5 (a) (i) Define the atmospheric terms reflected solar radiation and sensible heat transfer. [4] (ii) Briefly explain how dew forms. [3] (b) Explain the role of absorbed energy in the diurnal energy budget. [8] (c) With the aid of examples, discuss the view that wind belts are the most important influence on the atmospheric transfer of energy. [15] [Total: 30] Rocks and weathering 6 (a) (i) Briefly describe the process of subduction at convergent (destructive) plate boundaries. [3] (ii) Explain why the process of sea floor spreading only occurs at some tectonic plate boundaries. [4] (b) Explain how rainfall affects the type and rate of weathering. [8] (c) With the aid of examples, assess the extent to which the speed of movement is the most important factor in classifying the types of mass movement. [15] [Total: 30]
Question paper, page 4
4 9696/11/M/J/18 © UCLES 2018 BLANK PAGE Permission to reproduce items where third-party owned material protected by copyright is included has been sought and cleared where possible. Every reasonable effort has been made by the publisher (UCLES) to trace copyright holders, but if any items requiring clearance have unwittingly been included, the publisher will be pleased to make amends at the earliest possible opportunity. To avoid the issue of disclosure of answer-related information to candidates, all copyright acknowledgements are reproduced online in the Cambridge International Examinations Copyright Acknowledgements Booklet. This is produced for each series of examinations and is freely available to download at www.cie.org.uk after the live examination series. Cambridge International Examinations is part of the Cambridge Assessment Group. Cambridge Assessment is the brand name of University of Cambridge Local Examinations Syndicate (UCLES), which is itself a department of the University of Cambridge.
Mark scheme, page 1
® IGCSE is a registered trademark. This document consists of 14 printed pages. © UCLES 2018 [Turn over Cambridge Assessment International Education Cambridge International Advanced Subsidiary and Advanced Level GEOGRAPHY 9696/11 Paper 1 Core Physical Geography May/June 2018 MARK SCHEME Maximum Mark: 60 Published This mark scheme is published as an aid to teachers and candidates, to indicate the requirements of the examination. It shows the basis on which Examiners were instructed to award marks. It does not indicate the details of the discussions that took place at an Examiners’ meeting before marking began, which would have considered the acceptability of alternative answers. Mark schemes should be read in conjunction with the question paper and the Principal Examiner Report for Teachers. Cambridge International will not enter into discussions about these mark schemes. Cambridge International is publishing the mark schemes for the May/June 2018 series for most Cambridge IGCSE®, Cambridge International A and AS Level and Cambridge Pre-U components, and some Cambridge O Level components.
Mark scheme, page 2
9696/11 Cambridge International AS/A Level – Mark Scheme PUBLISHED May/June 2018 © UCLES 2018 Page 2 of 14 Generic Marking Principles These general marking principles must be applied by all examiners when marking candidate answers. They should be applied alongside the specific content of the mark scheme or generic level descriptors for a question. Each question paper and mark scheme will also comply with these marking principles. GENERIC MARKING PRINCIPLE 1: Marks must be awarded in line with: • the specific content of the mark scheme or the generic level descriptors for the question • the specific skills defined in the mark scheme or in the generic level descriptors for the question • the standard of response required by a candidate as exemplified by the standardisation scripts. GENERIC MARKING PRINCIPLE 2: Marks awarded are always whole marks (not half marks, or other fractions). GENERIC MARKING PRINCIPLE 3: Marks must be awarded positively: • marks are awarded for correct/valid answers, as defined in the mark scheme. However, credit is given for valid answers which go beyond the scope of the syllabus and mark scheme, referring to your Team Leader as appropriate • marks are awarded when candidates clearly demonstrate what they know and can do • marks are not deducted for errors • marks are not deducted for omissions • answers should only be judged on the quality of spelling, punctuation and grammar when these features are specifically assessed by the question as indicated by the mark scheme. The meaning, however, should be unambiguous. GENERIC MARKING PRINCIPLE 4: Rules must be applied consistently e.g. in situations where candidates have not followed instructions or in the application of generic level descriptors. GENERIC MARKING PRINCIPLE 5: Marks should be awarded using the full range of marks defined in the mark scheme for the question (however; the use of the full mark range may be limited according to the quality of the candidate responses seen). GENERIC MARKING PRINCIPLE 6: Marks awarded are based solely on the requirements as defined in the mark scheme. Marks should not be awarded with grade thresholds or grade descriptors in mind.
Mark scheme, page 3
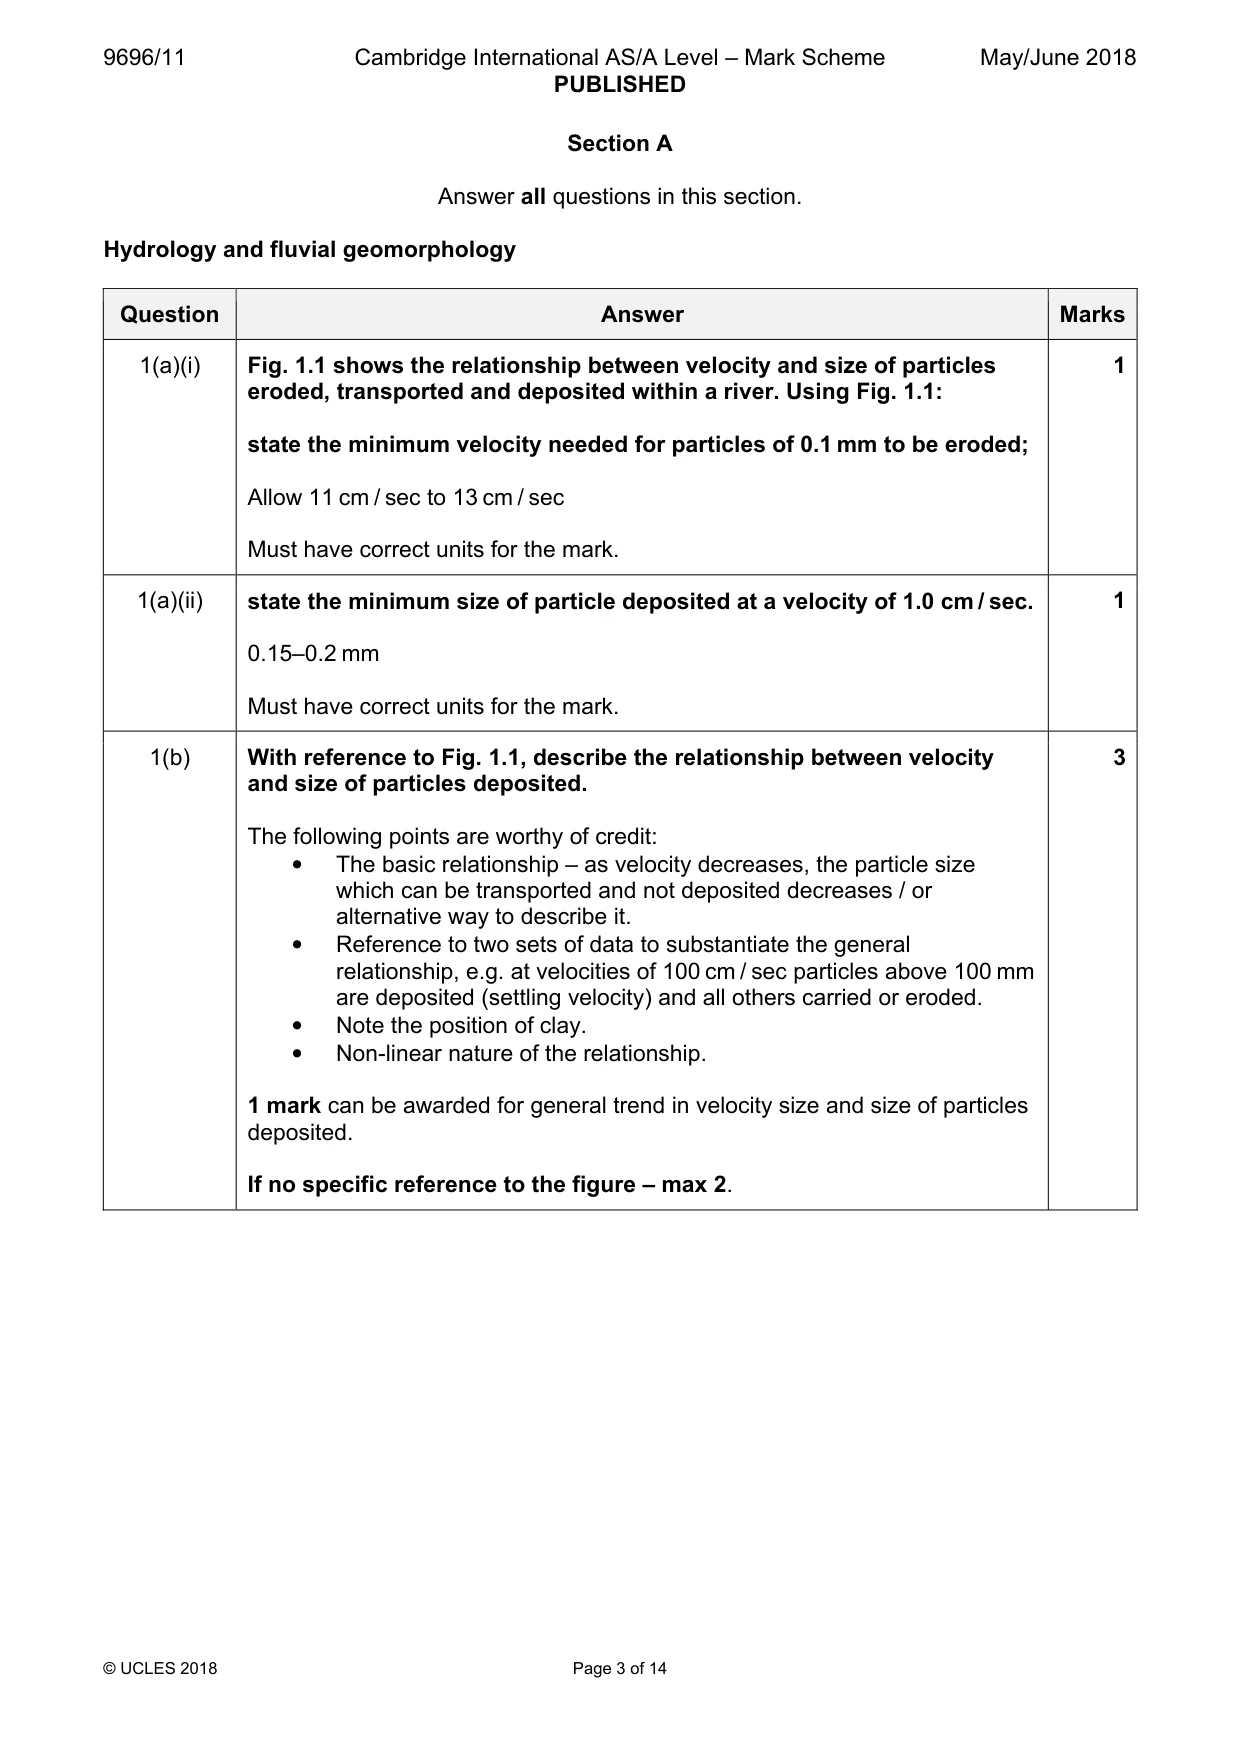
9696/11 Cambridge International AS/A Level – Mark Scheme PUBLISHED May/June 2018 © UCLES 2018 Page 3 of 14 Section A Answer all questions in this section. Hydrology and fluvial geomorphology Question Answer Marks 1(a)(i) Fig. 1.1 shows the relationship between velocity and size of particles eroded, transported and deposited within a river. Using Fig. 1.1: state the minimum velocity needed for particles of 0.1 mm to be eroded; Allow 11 cm / sec to 13 cm / sec Must have correct units for the mark. 1 1(a)(ii) state the minimum size of particle deposited at a velocity of 1.0 cm / sec. 0.15–0.2 mm Must have correct units for the mark. 1 1(b) With reference to Fig. 1.1, describe the relationship between velocity and size of particles deposited. The following points are worthy of credit: • The basic relationship – as velocity decreases, the particle size which can be transported and not deposited decreases / or alternative way to describe it. • Reference to two sets of data to substantiate the general relationship, e.g. at velocities of 100 cm / sec particles above 100 mm are deposited (settling velocity) and all others carried or eroded. • Note the position of clay. • Non-linear nature of the relationship. 1 mark can be awarded for general trend in velocity size and size of particles deposited. If no specific reference to the figure – max 2. 3
Mark scheme, page 4
9696/11 Cambridge International AS/A Level – Mark Scheme PUBLISHED May/June 2018 © UCLES 2018 Page 4 of 14 Question Answer Marks 1(c) Explain why the velocity needed to pick up particles varies with their size. Explanations should involve: • Larger particle sizes require higher velocities to be picked up because they are heavier. • Sand (0.1–1.0 mm) requires the lowest velocity for entrainment because of its small size and non-cohesive nature (granular nature). • Clays have a more cohesive nature, which requires higher velocities for entrainment. Reference to at least three different sediment sizes (e.g. clay/silt, sand, cobbles) or reference to non-linear relationship is needed for full marks. 1 mark for each basic explanation, 2 marks for developed explanation, 3 marks for a well developed explanation. 5
Mark scheme, page 5
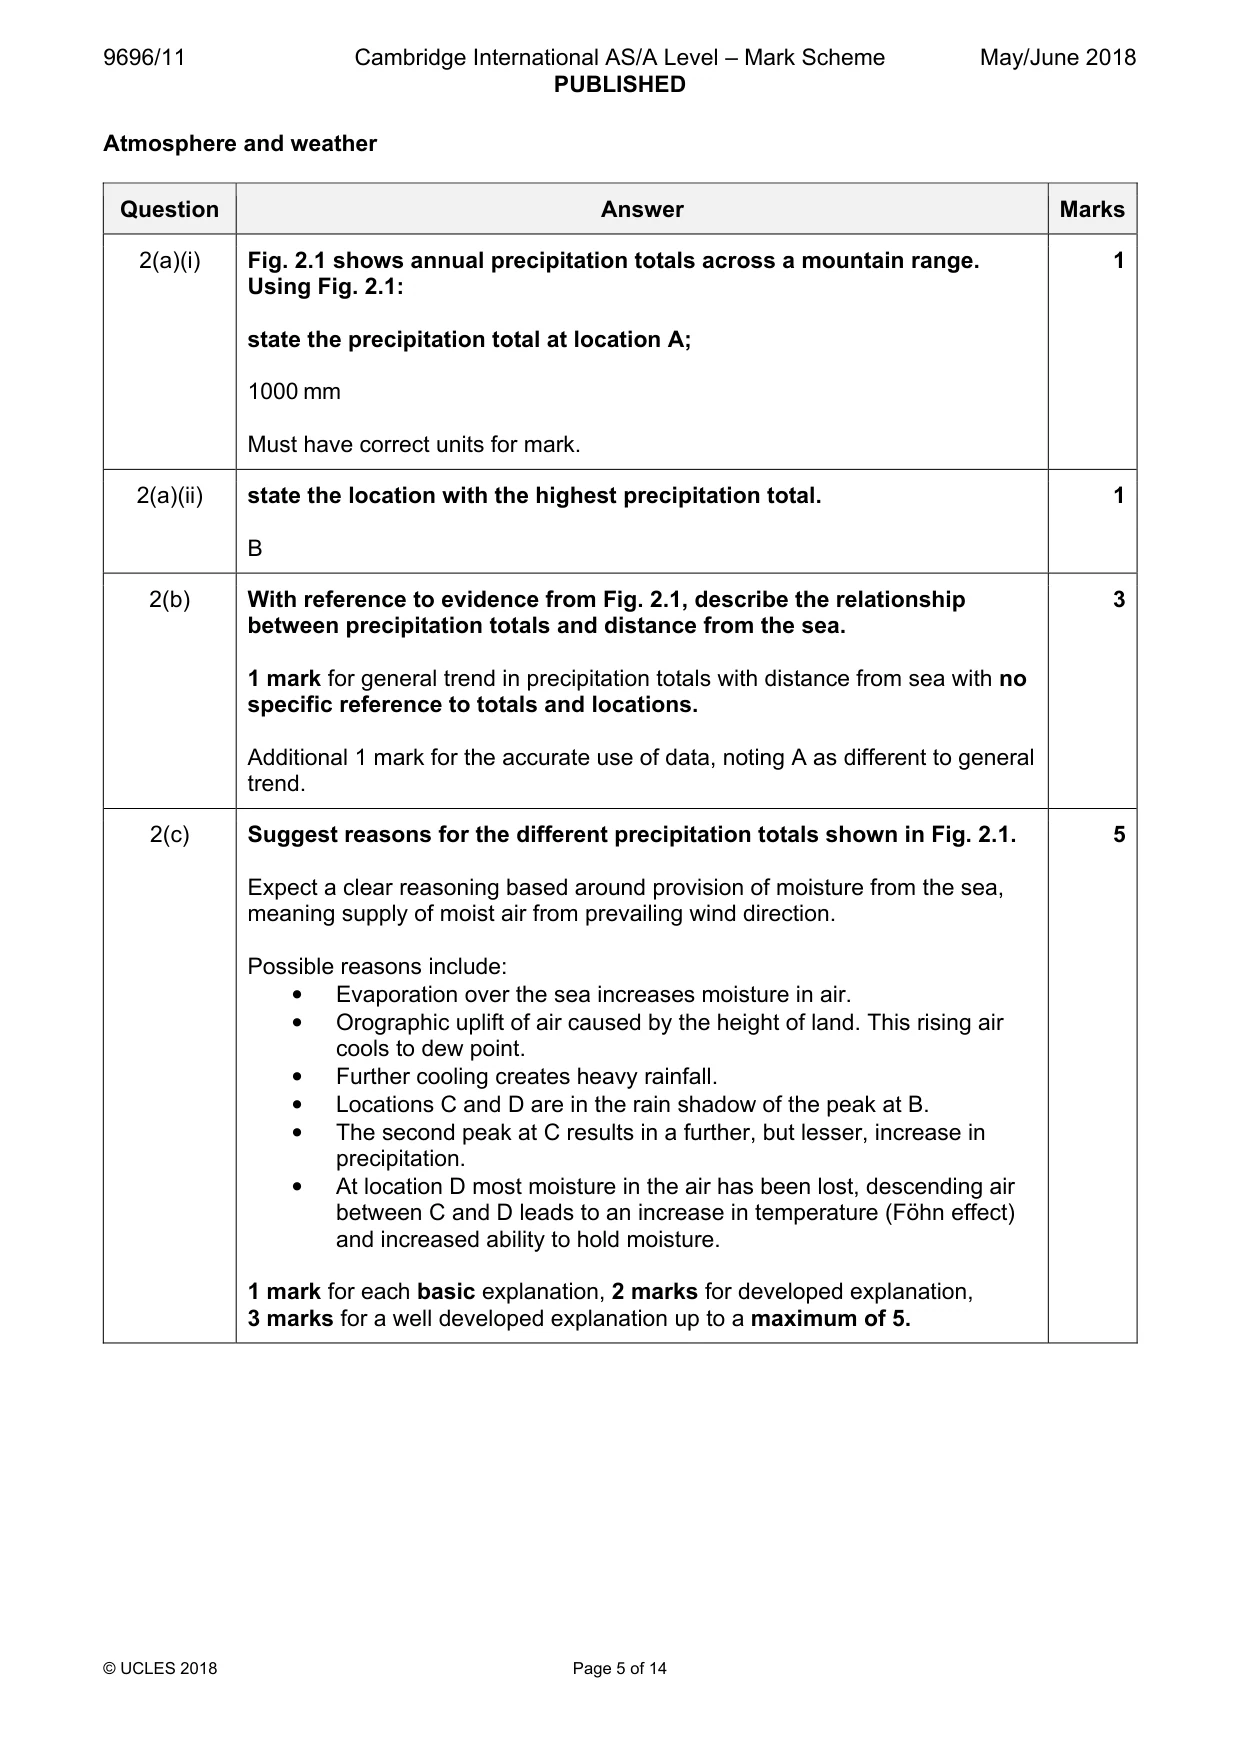
9696/11 Cambridge International AS/A Level – Mark Scheme PUBLISHED May/June 2018 © UCLES 2018 Page 5 of 14 Atmosphere and weather Question Answer Marks 2(a)(i) Fig. 2.1 shows annual precipitation totals across a mountain range. Using Fig. 2.1: state the precipitation total at location A; 1000 mm Must have correct units for mark. 1 2(a)(ii) state the location with the highest precipitation total. B 1 2(b) With reference to evidence from Fig. 2.1, describe the relationship between precipitation totals and distance from the sea. 1 mark for general trend in precipitation totals with distance from sea with no specific reference to totals and locations. Additional 1 mark for the accurate use of data, noting A as different to general trend. 3 2(c) Suggest reasons for the different precipitation totals shown in Fig. 2.1. Expect a clear reasoning based around provision of moisture from the sea, meaning supply of moist air from prevailing wind direction. Possible reasons include: • Evaporation over the sea increases moisture in air. • Orographic uplift of air caused by the height of land. This rising air cools to dew point. • Further cooling creates heavy rainfall. • Locations C and D are in the rain shadow of the peak at B. • The second peak at C results in a further, but lesser, increase in precipitation. • At location D most moisture in the air has been lost, descending air between C and D leads to an increase in temperature (Föhn effect) and increased ability to hold moisture. 1 mark for each basic explanation, 2 marks for developed explanation, 3 marks for a well developed explanation up to a maximum of 5. 5
Mark scheme, page 6
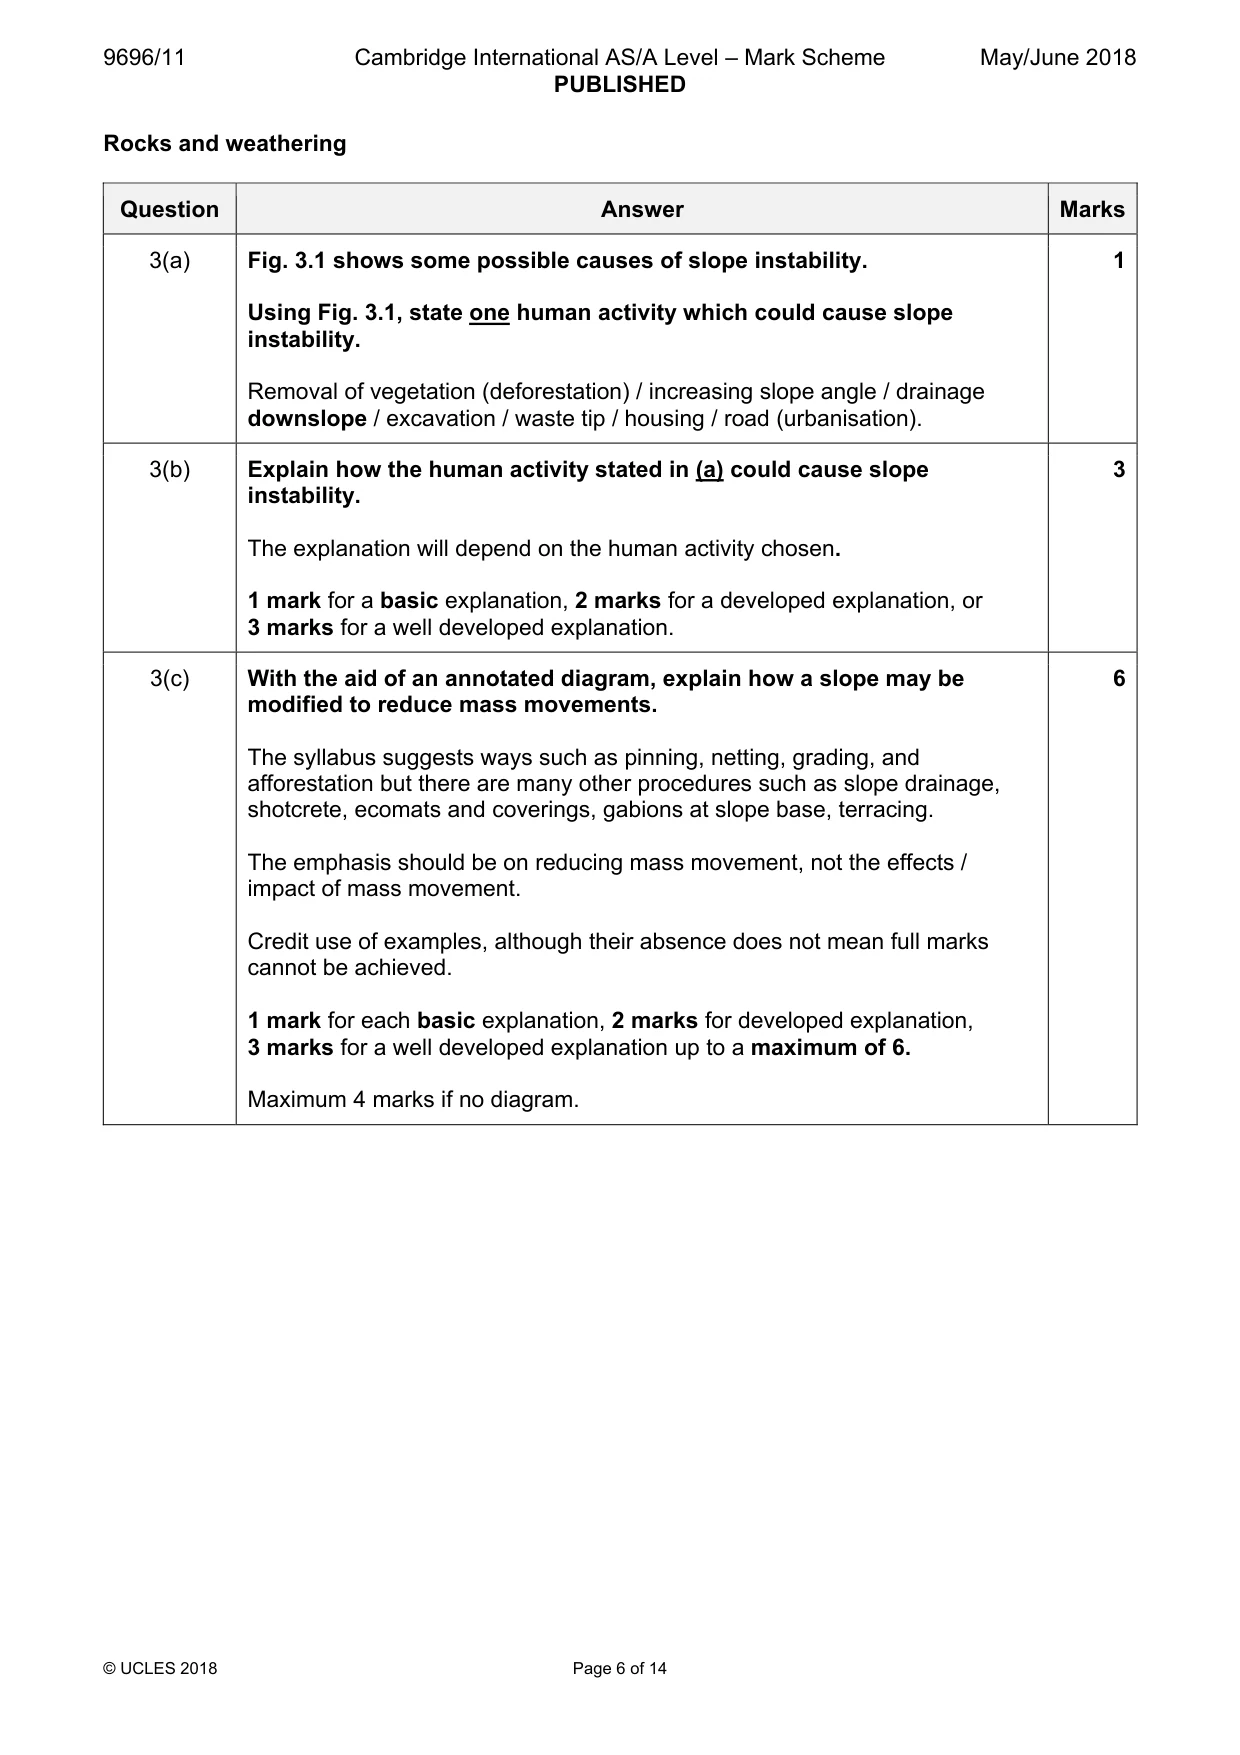
9696/11 Cambridge International AS/A Level – Mark Scheme PUBLISHED May/June 2018 © UCLES 2018 Page 6 of 14 Rocks and weathering Question Answer Marks 3(a) Fig. 3.1 shows some possible causes of slope instability. Using Fig. 3.1, state one human activity which could cause slope instability. Removal of vegetation (deforestation) / increasing slope angle / drainage downslope / excavation / waste tip / housing / road (urbanisation). 1 3(b) Explain how the human activity stated in (a) could cause slope instability. The explanation will depend on the human activity chosen. 1 mark for a basic explanation, 2 marks for a developed explanation, or 3 marks for a well developed explanation. 3 3(c) With the aid of an annotated diagram, explain how a slope may be modified to reduce mass movements. The syllabus suggests ways such as pinning, netting, grading, and afforestation but there are many other procedures such as slope drainage, shotcrete, ecomats and coverings, gabions at slope base, terracing. The emphasis should be on reducing mass movement, not the effects / impact of mass movement. Credit use of examples, although their absence does not mean full marks cannot be achieved. 1 mark for each basic explanation, 2 marks for developed explanation, 3 marks for a well developed explanation up to a maximum of 6. Maximum 4 marks if no diagram. 6
Mark scheme, page 7
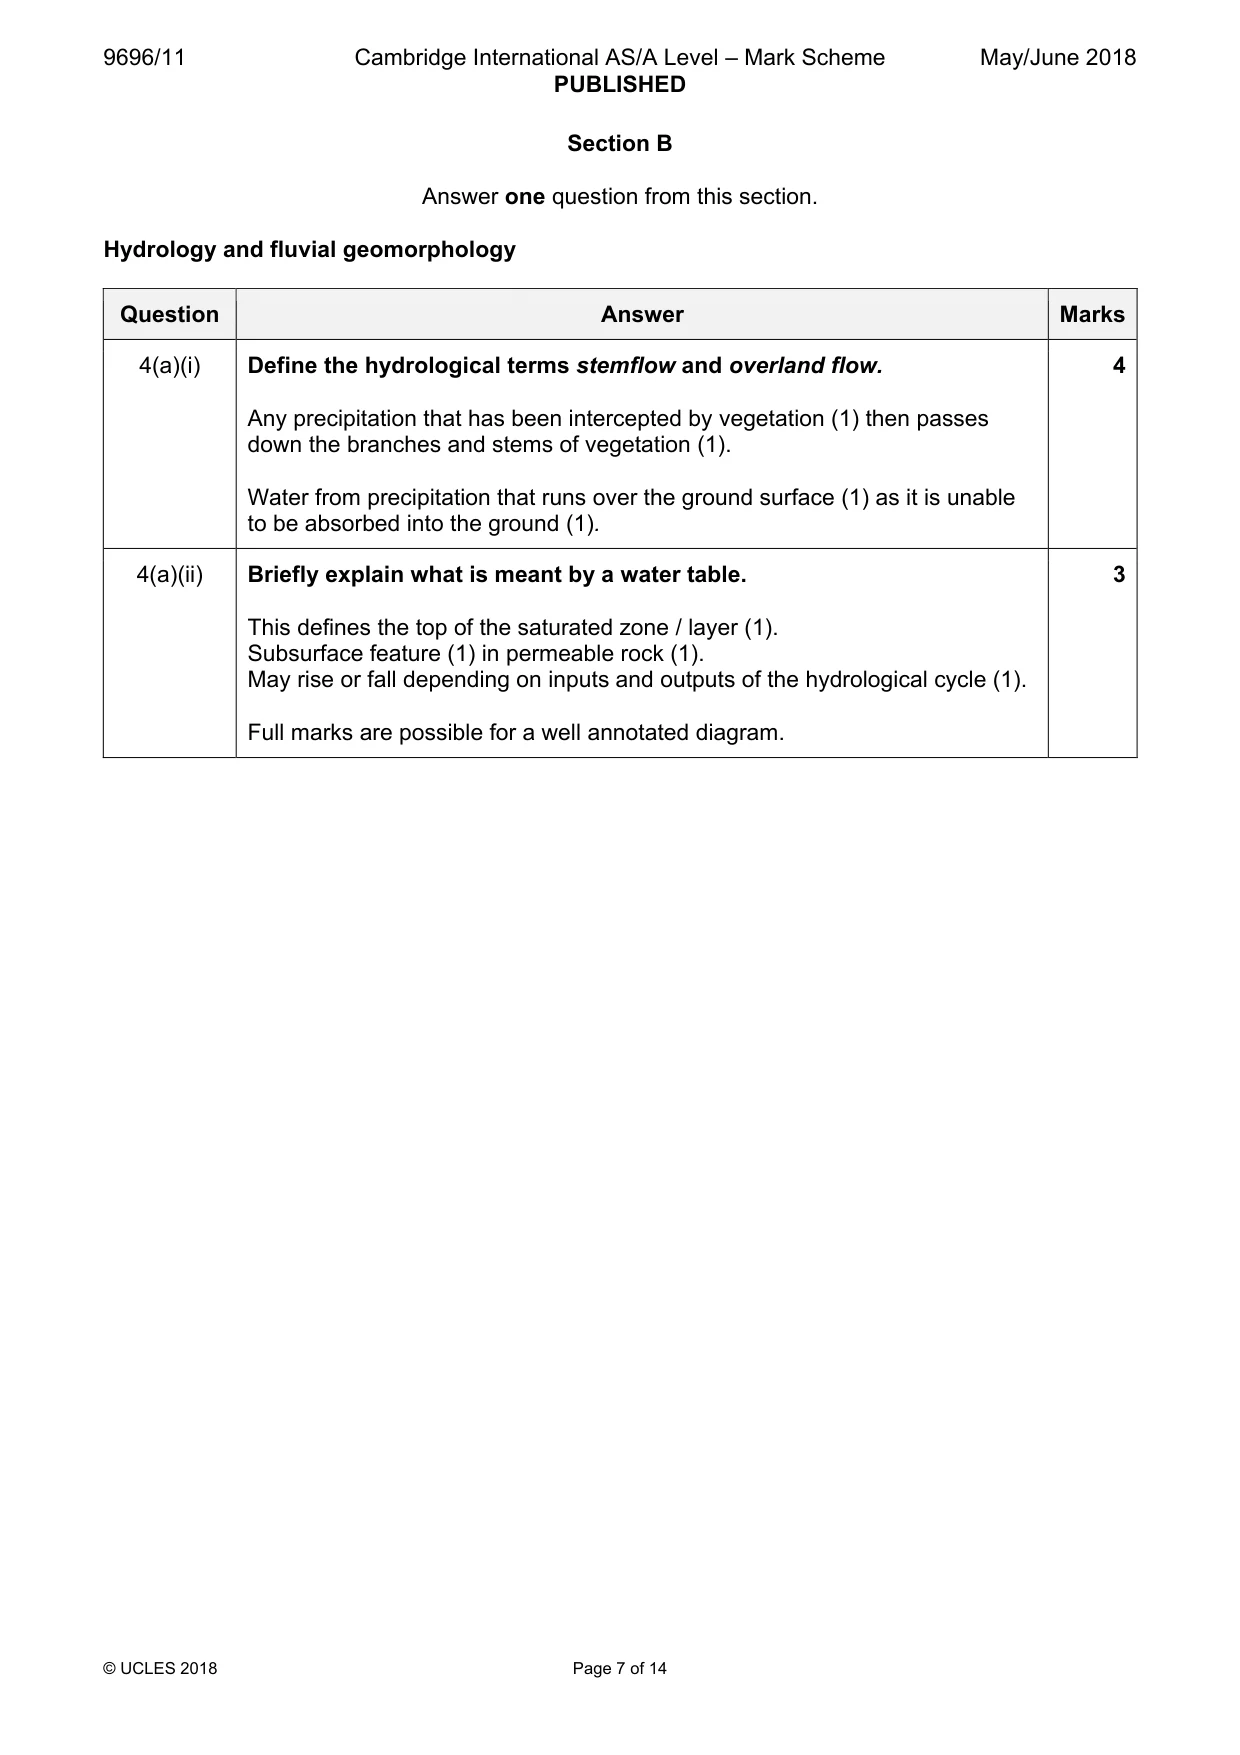
9696/11 Cambridge International AS/A Level – Mark Scheme PUBLISHED May/June 2018 © UCLES 2018 Page 7 of 14 Section B Answer one question from this section. Hydrology and fluvial geomorphology Question Answer Marks 4(a)(i) Define the hydrological terms stemflow and overland flow. Any precipitation that has been intercepted by vegetation (1) then passes down the branches and stems of vegetation (1). Water from precipitation that runs over the ground surface (1) as it is unable to be absorbed into the ground (1). 4 4(a)(ii) Briefly explain what is meant by a water table. This defines the top of the saturated zone / layer (1). Subsurface feature (1) in permeable rock (1). May rise or fall depending on inputs and outputs of the hydrological cycle (1). Full marks are possible for a well annotated diagram. 3
Mark scheme, page 8
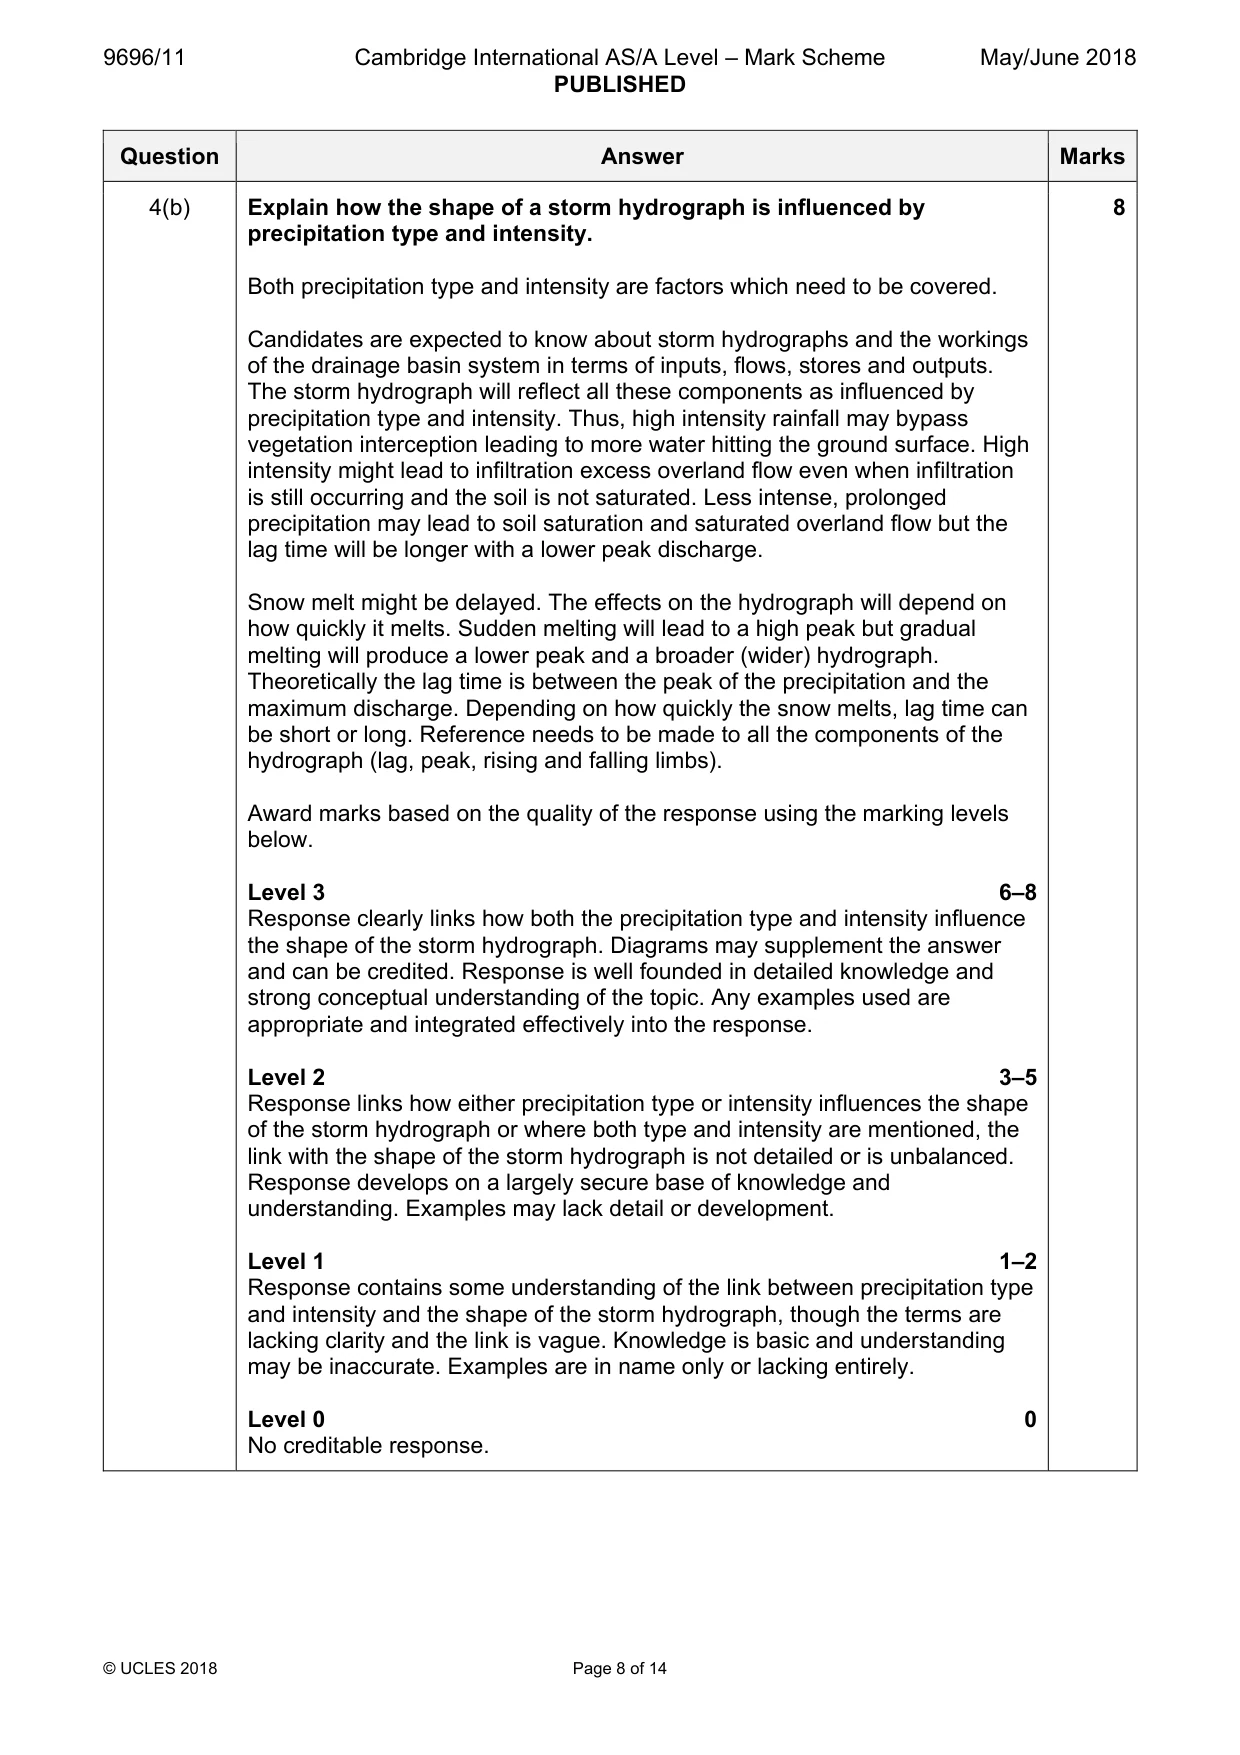
9696/11 Cambridge International AS/A Level – Mark Scheme PUBLISHED May/June 2018 © UCLES 2018 Page 8 of 14 Question Answer Marks 4(b) Explain how the shape of a storm hydrograph is influenced by precipitation type and intensity. Both precipitation type and intensity are factors which need to be covered. Candidates are expected to know about storm hydrographs and the workings of the drainage basin system in terms of inputs, flows, stores and outputs. The storm hydrograph will reflect all these components as influenced by precipitation type and intensity. Thus, high intensity rainfall may bypass vegetation interception leading to more water hitting the ground surface. High intensity might lead to infiltration excess overland flow even when infiltration is still occurring and the soil is not saturated. Less intense, prolonged precipitation may lead to soil saturation and saturated overland flow but the lag time will be longer with a lower peak discharge. Snow melt might be delayed. The effects on the hydrograph will depend on how quickly it melts. Sudden melting will lead to a high peak but gradual melting will produce a lower peak and a broader (wider) hydrograph. Theoretically the lag time is between the peak of the precipitation and the maximum discharge. Depending on how quickly the snow melts, lag time can be short or long. Reference needs to be made to all the components of the hydrograph (lag, peak, rising and falling limbs). Award marks based on the quality of the response using the marking levels below. Level 3 6–8 Response clearly links how both the precipitation type and intensity influence the shape of the storm hydrograph. Diagrams may supplement the answer and can be credited. Response is well founded in detailed knowledge and strong conceptual understanding of the topic. Any examples used are appropriate and integrated effectively into the response. Level 2 3–5 Response links how either precipitation type or intensity influences the shape of the storm hydrograph or where both type and intensity are mentioned, the link with the shape of the storm hydrograph is not detailed or is unbalanced. Response develops on a largely secure base of knowledge and understanding. Examples may lack detail or development. Level 1 1–2 Response contains some understanding of the link between precipitation type and intensity and the shape of the storm hydrograph, though the terms are lacking clarity and the link is vague. Knowledge is basic and understanding may be inaccurate. Examples are in name only or lacking entirely. Level 0 0 No creditable response. 8
Mark scheme, page 9
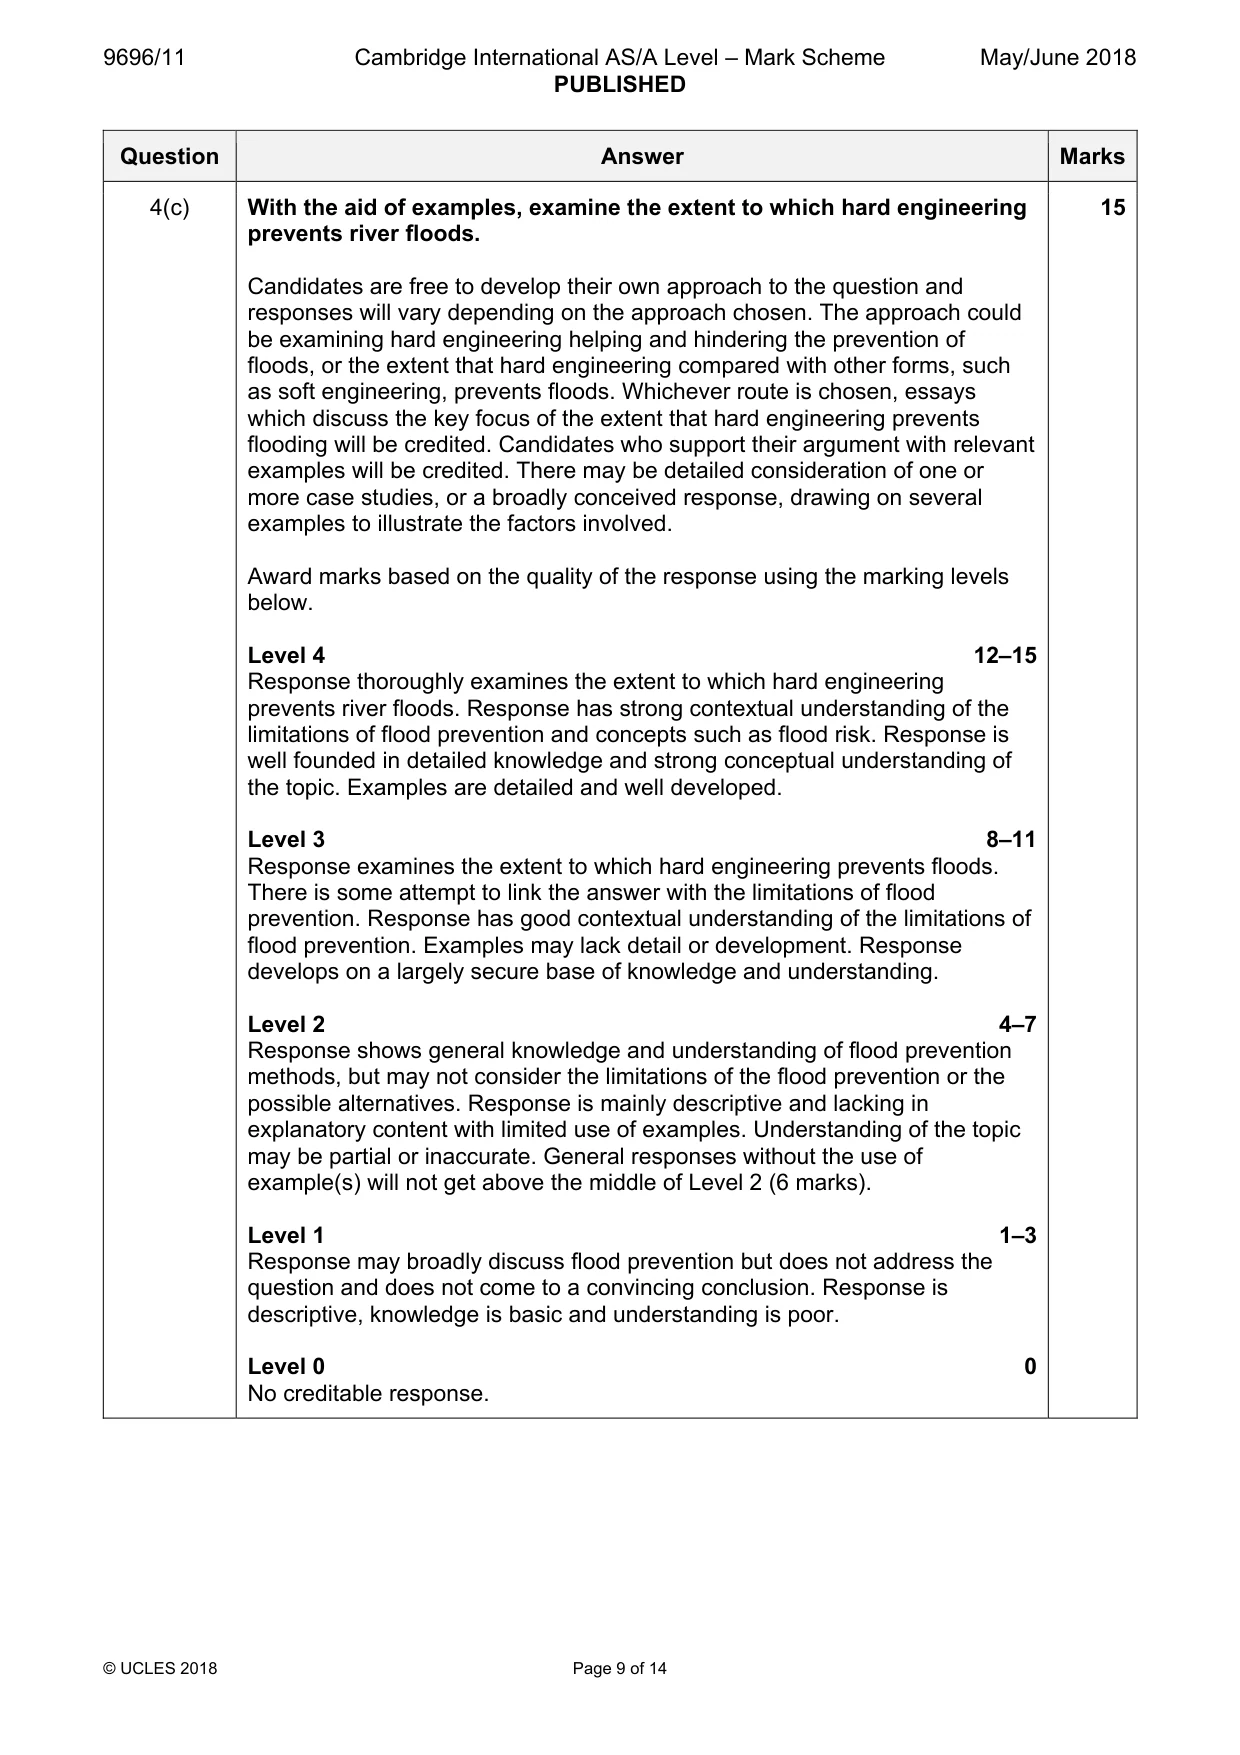
9696/11 Cambridge International AS/A Level – Mark Scheme PUBLISHED May/June 2018 © UCLES 2018 Page 9 of 14 Question Answer Marks 4(c) With the aid of examples, examine the extent to which hard engineering prevents river floods. Candidates are free to develop their own approach to the question and responses will vary depending on the approach chosen. The approach could be examining hard engineering helping and hindering the prevention of floods, or the extent that hard engineering compared with other forms, such as soft engineering, prevents floods. Whichever route is chosen, essays which discuss the key focus of the extent that hard engineering prevents flooding will be credited. Candidates who support their argument with relevant examples will be credited. There may be detailed consideration of one or more case studies, or a broadly conceived response, drawing on several examples to illustrate the factors involved. Award marks based on the quality of the response using the marking levels below. Level 4 12–15 Response thoroughly examines the extent to which hard engineering prevents river floods. Response has strong contextual understanding of the limitations of flood prevention and concepts such as flood risk. Response is well founded in detailed knowledge and strong conceptual understanding of the topic. Examples are detailed and well developed. Level 3 8–11 Response examines the extent to which hard engineering prevents floods. There is some attempt to link the answer with the limitations of flood prevention. Response has good contextual understanding of the limitations of flood prevention. Examples may lack detail or development. Response develops on a largely secure base of knowledge and understanding. Level 2 4–7 Response shows general knowledge and understanding of flood prevention methods, but may not consider the limitations of the flood prevention or the possible alternatives. Response is mainly descriptive and lacking in explanatory content with limited use of examples. Understanding of the topic may be partial or inaccurate. General responses without the use of example(s) will not get above the middle of Level 2 (6 marks). Level 1 1–3 Response may broadly discuss flood prevention but does not address the question and does not come to a convincing conclusion. Response is descriptive, knowledge is basic and understanding is poor. Level 0 0 No creditable response. 15
Mark scheme, page 10
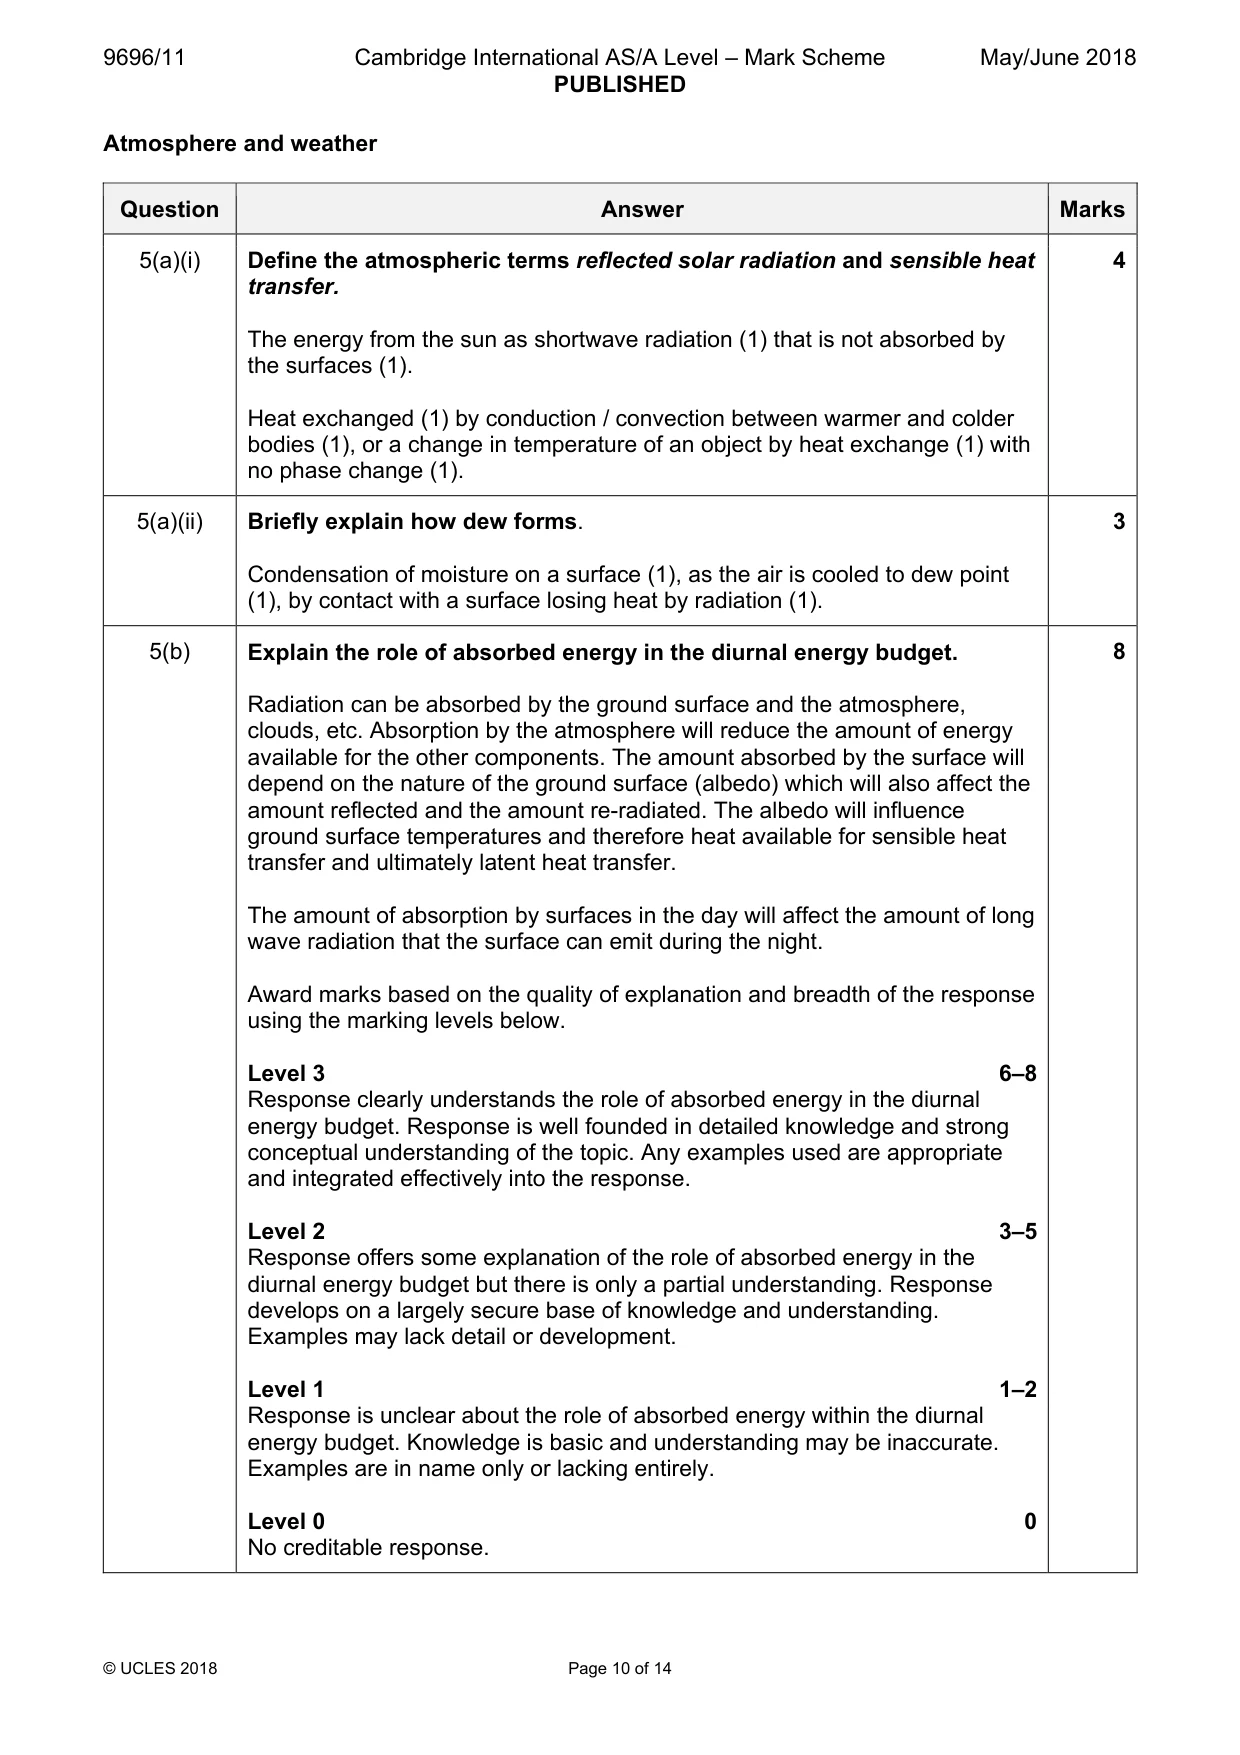
9696/11 Cambridge International AS/A Level – Mark Scheme PUBLISHED May/June 2018 © UCLES 2018 Page 10 of 14 Atmosphere and weather Question Answer Marks 5(a)(i) Define the atmospheric terms reflected solar radiation and sensible heat transfer. The energy from the sun as shortwave radiation (1) that is not absorbed by the surfaces (1). Heat exchanged (1) by conduction / convection between warmer and colder bodies (1), or a change in temperature of an object by heat exchange (1) with no phase change (1). 4 5(a)(ii) Briefly explain how dew forms. Condensation of moisture on a surface (1), as the air is cooled to dew point (1), by contact with a surface losing heat by radiation (1). 3 5(b) Explain the role of absorbed energy in the diurnal energy budget. Radiation can be absorbed by the ground surface and the atmosphere, clouds, etc. Absorption by the atmosphere will reduce the amount of energy available for the other components. The amount absorbed by the surface will depend on the nature of the ground surface (albedo) which will also affect the amount reflected and the amount re-radiated. The albedo will influence ground surface temperatures and therefore heat available for sensible heat transfer and ultimately latent heat transfer. The amount of absorption by surfaces in the day will affect the amount of long wave radiation that the surface can emit during the night. Award marks based on the quality of explanation and breadth of the response using the marking levels below. Level 3 6–8 Response clearly understands the role of absorbed energy in the diurnal energy budget. Response is well founded in detailed knowledge and strong conceptual understanding of the topic. Any examples used are appropriate and integrated effectively into the response. Level 2 3–5 Response offers some explanation of the role of absorbed energy in the diurnal energy budget but there is only a partial understanding. Response develops on a largely secure base of knowledge and understanding. Examples may lack detail or development. Level 1 1–2 Response is unclear about the role of absorbed energy within the diurnal energy budget. Knowledge is basic and understanding may be inaccurate. Examples are in name only or lacking entirely. Level 0 0 No creditable response. 8
Mark scheme, page 11
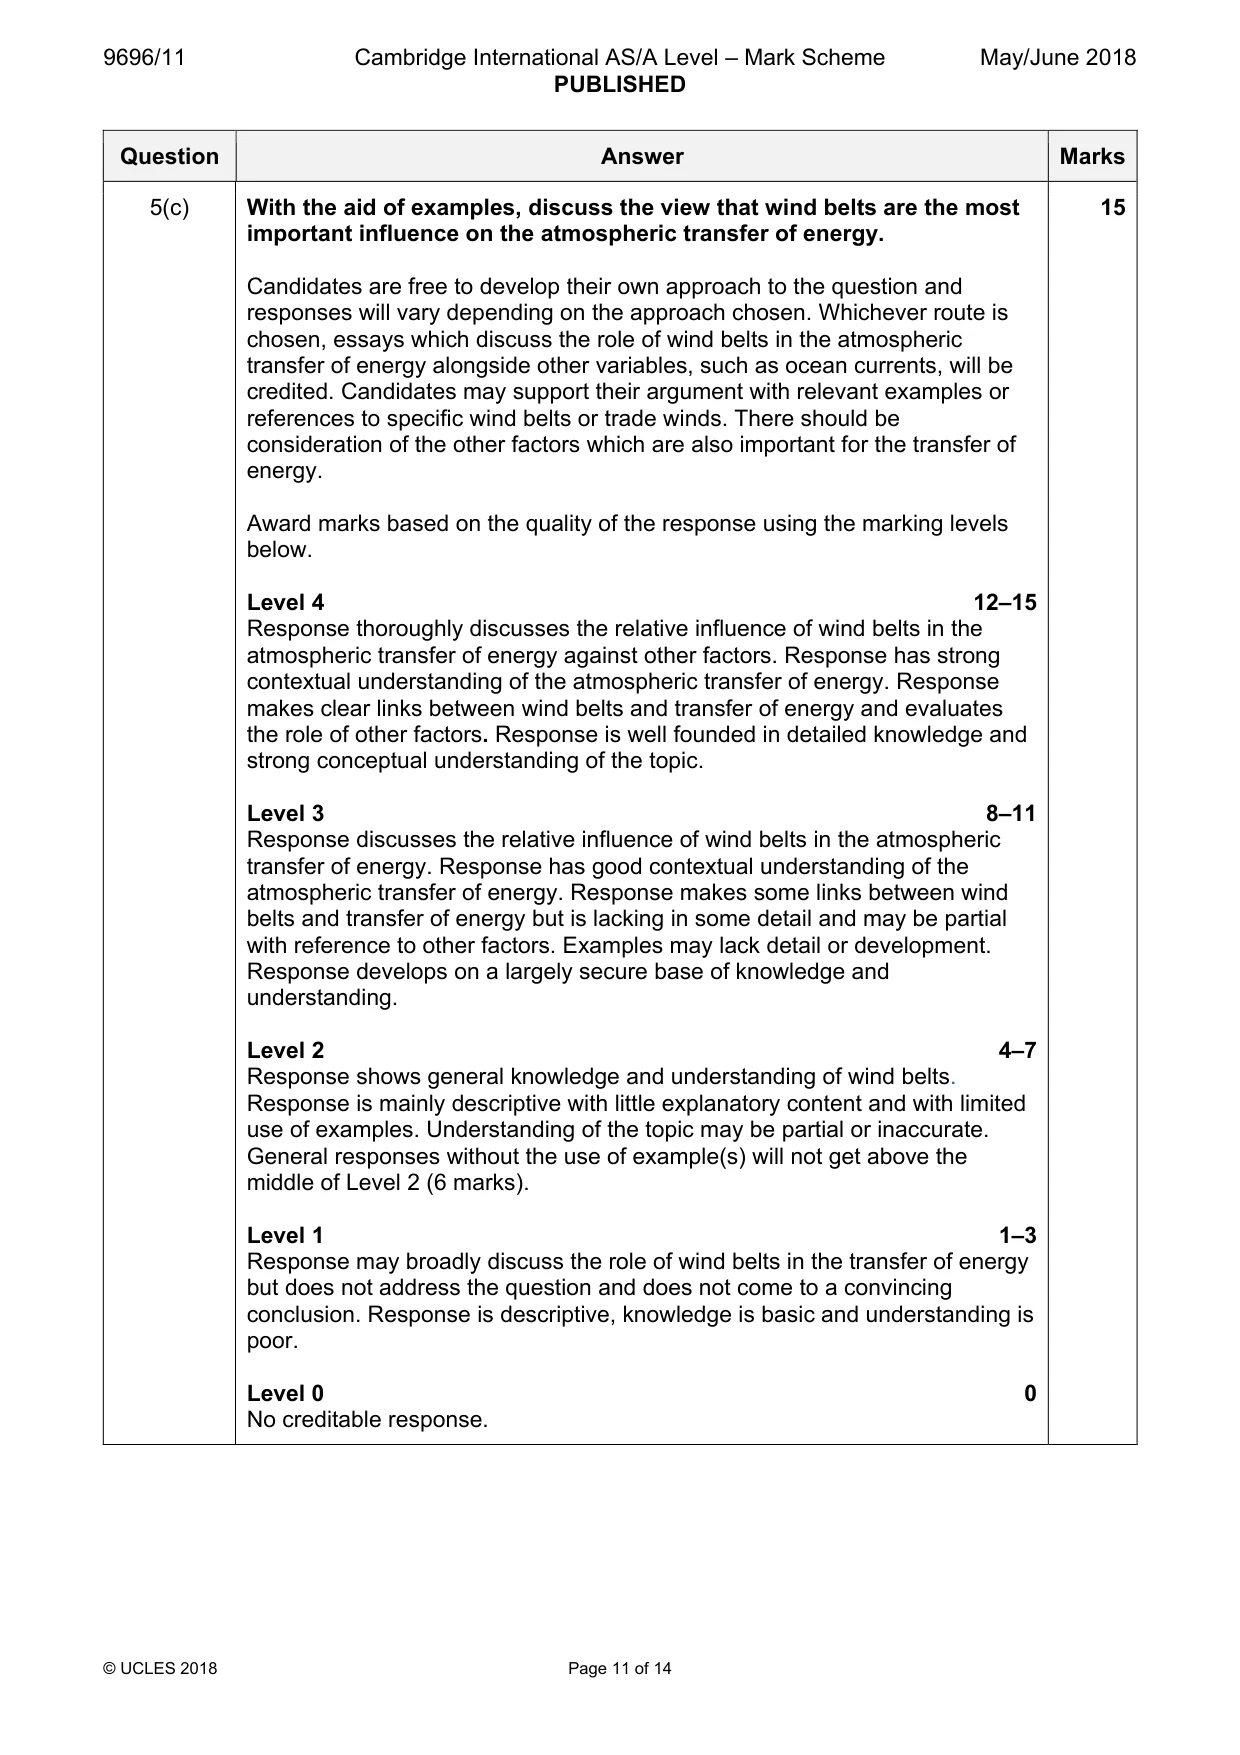
9696/11 Cambridge International AS/A Level – Mark Scheme PUBLISHED May/June 2018 © UCLES 2018 Page 11 of 14 Question Answer Marks 5(c) With the aid of examples, discuss the view that wind belts are the most important influence on the atmospheric transfer of energy. Candidates are free to develop their own approach to the question and responses will vary depending on the approach chosen. Whichever route is chosen, essays which discuss the role of wind belts in the atmospheric transfer of energy alongside other variables, such as ocean currents, will be credited. Candidates may support their argument with relevant examples or references to specific wind belts or trade winds. There should be consideration of the other factors which are also important for the transfer of energy. Award marks based on the quality of the response using the marking levels below. Level 4 12–15 Response thoroughly discusses the relative influence of wind belts in the atmospheric transfer of energy against other factors. Response has strong contextual understanding of the atmospheric transfer of energy. Response makes clear links between wind belts and transfer of energy and evaluates the role of other factors. Response is well founded in detailed knowledge and strong conceptual understanding of the topic. Level 3 8–11 Response discusses the relative influence of wind belts in the atmospheric transfer of energy. Response has good contextual understanding of the atmospheric transfer of energy. Response makes some links between wind belts and transfer of energy but is lacking in some detail and may be partial with reference to other factors. Examples may lack detail or development. Response develops on a largely secure base of knowledge and understanding. Level 2 4–7 Response shows general knowledge and understanding of wind belts. Response is mainly descriptive with little explanatory content and with limited use of examples. Understanding of the topic may be partial or inaccurate. General responses without the use of example(s) will not get above the middle of Level 2 (6 marks). Level 1 1–3 Response may broadly discuss the role of wind belts in the transfer of energy but does not address the question and does not come to a convincing conclusion. Response is descriptive, knowledge is basic and understanding is poor. Level 0 0 No creditable response. 15
Mark scheme, page 12
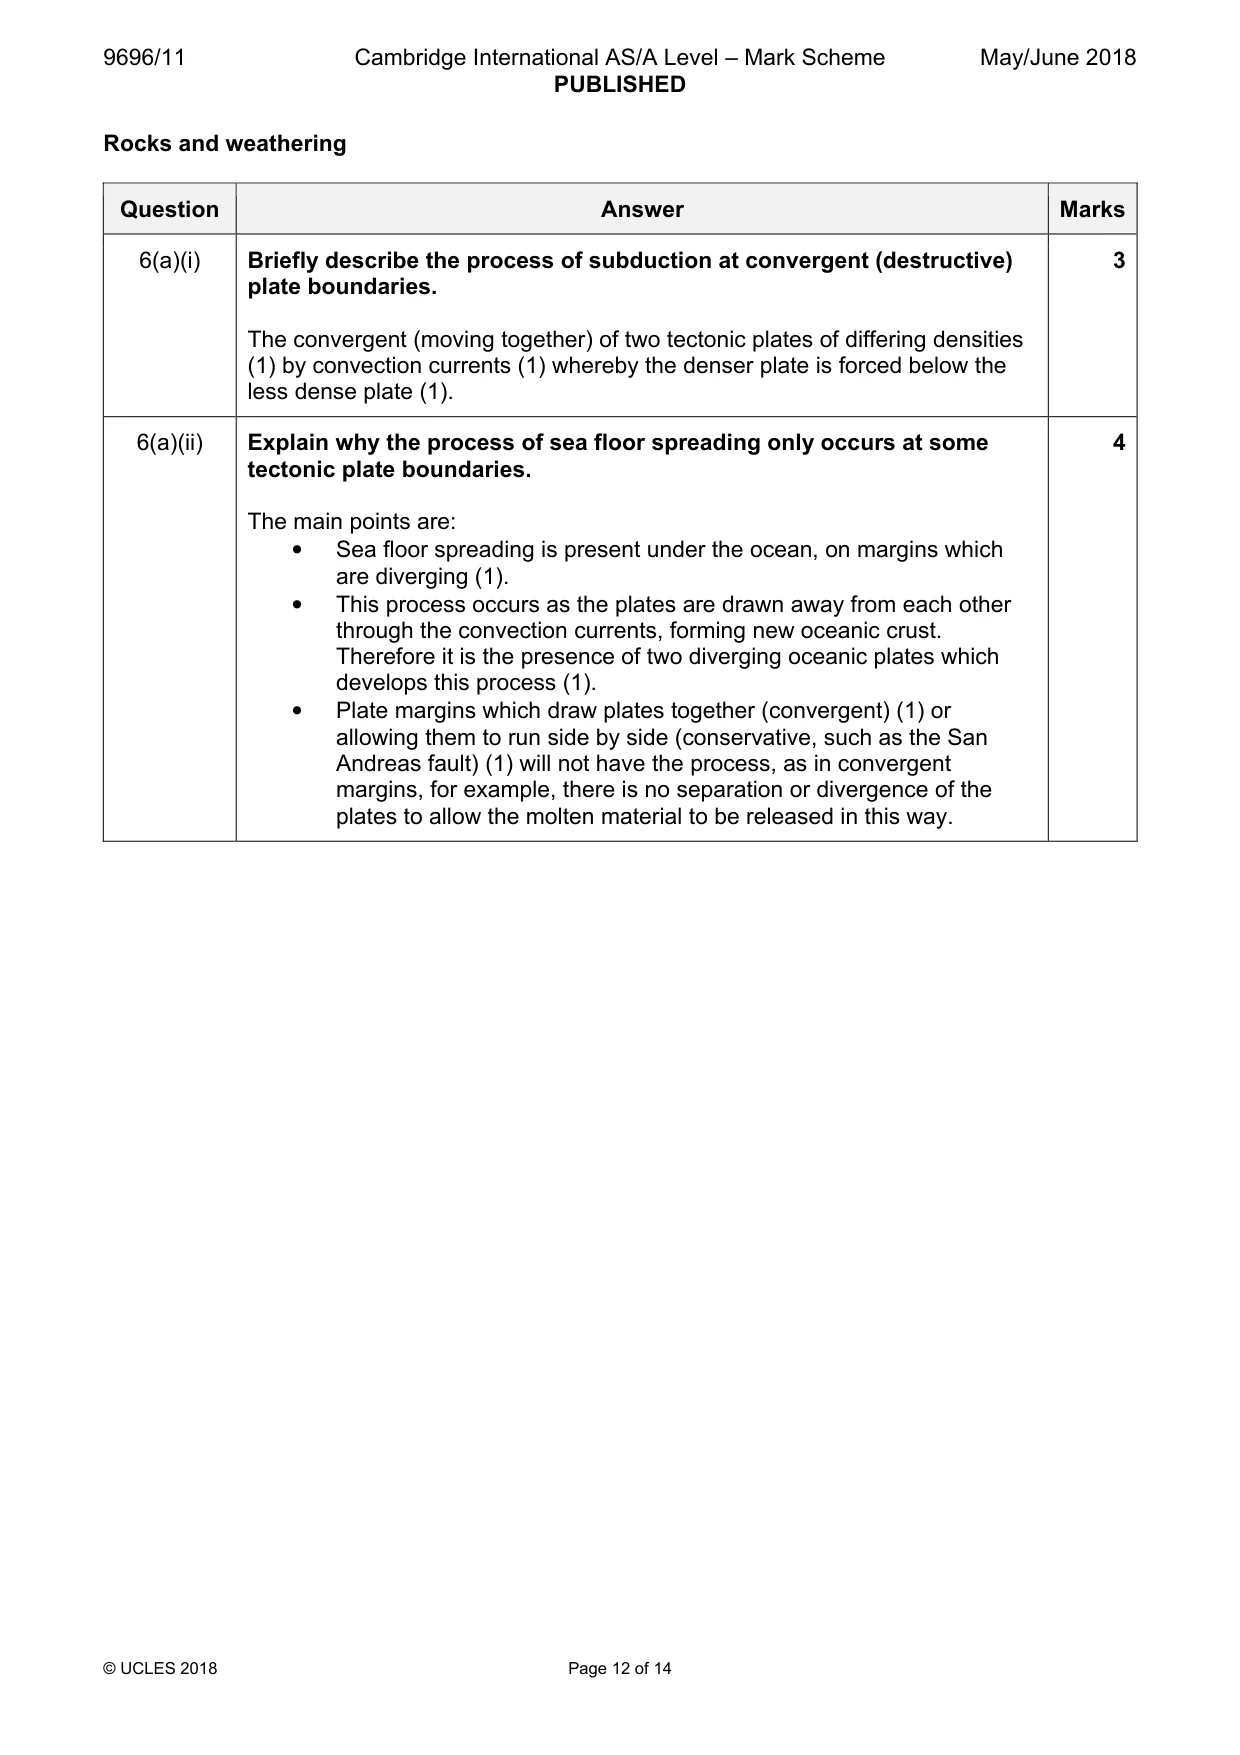
9696/11 Cambridge International AS/A Level – Mark Scheme PUBLISHED May/June 2018 © UCLES 2018 Page 12 of 14 Rocks and weathering Question Answer Marks 6(a)(i) Briefly describe the process of subduction at convergent (destructive) plate boundaries. The convergent (moving together) of two tectonic plates of differing densities (1) by convection currents (1) whereby the denser plate is forced below the less dense plate (1). 3 6(a)(ii) Explain why the process of sea floor spreading only occurs at some tectonic plate boundaries. The main points are: • Sea floor spreading is present under the ocean, on margins which are diverging (1). • This process occurs as the plates are drawn away from each other through the convection currents, forming new oceanic crust. Therefore it is the presence of two diverging oceanic plates which develops this process (1). • Plate margins which draw plates together (convergent) (1) or allowing them to run side by side (conservative, such as the San Andreas fault) (1) will not have the process, as in convergent margins, for example, there is no separation or divergence of the plates to allow the molten material to be released in this way. 4
Mark scheme, page 13
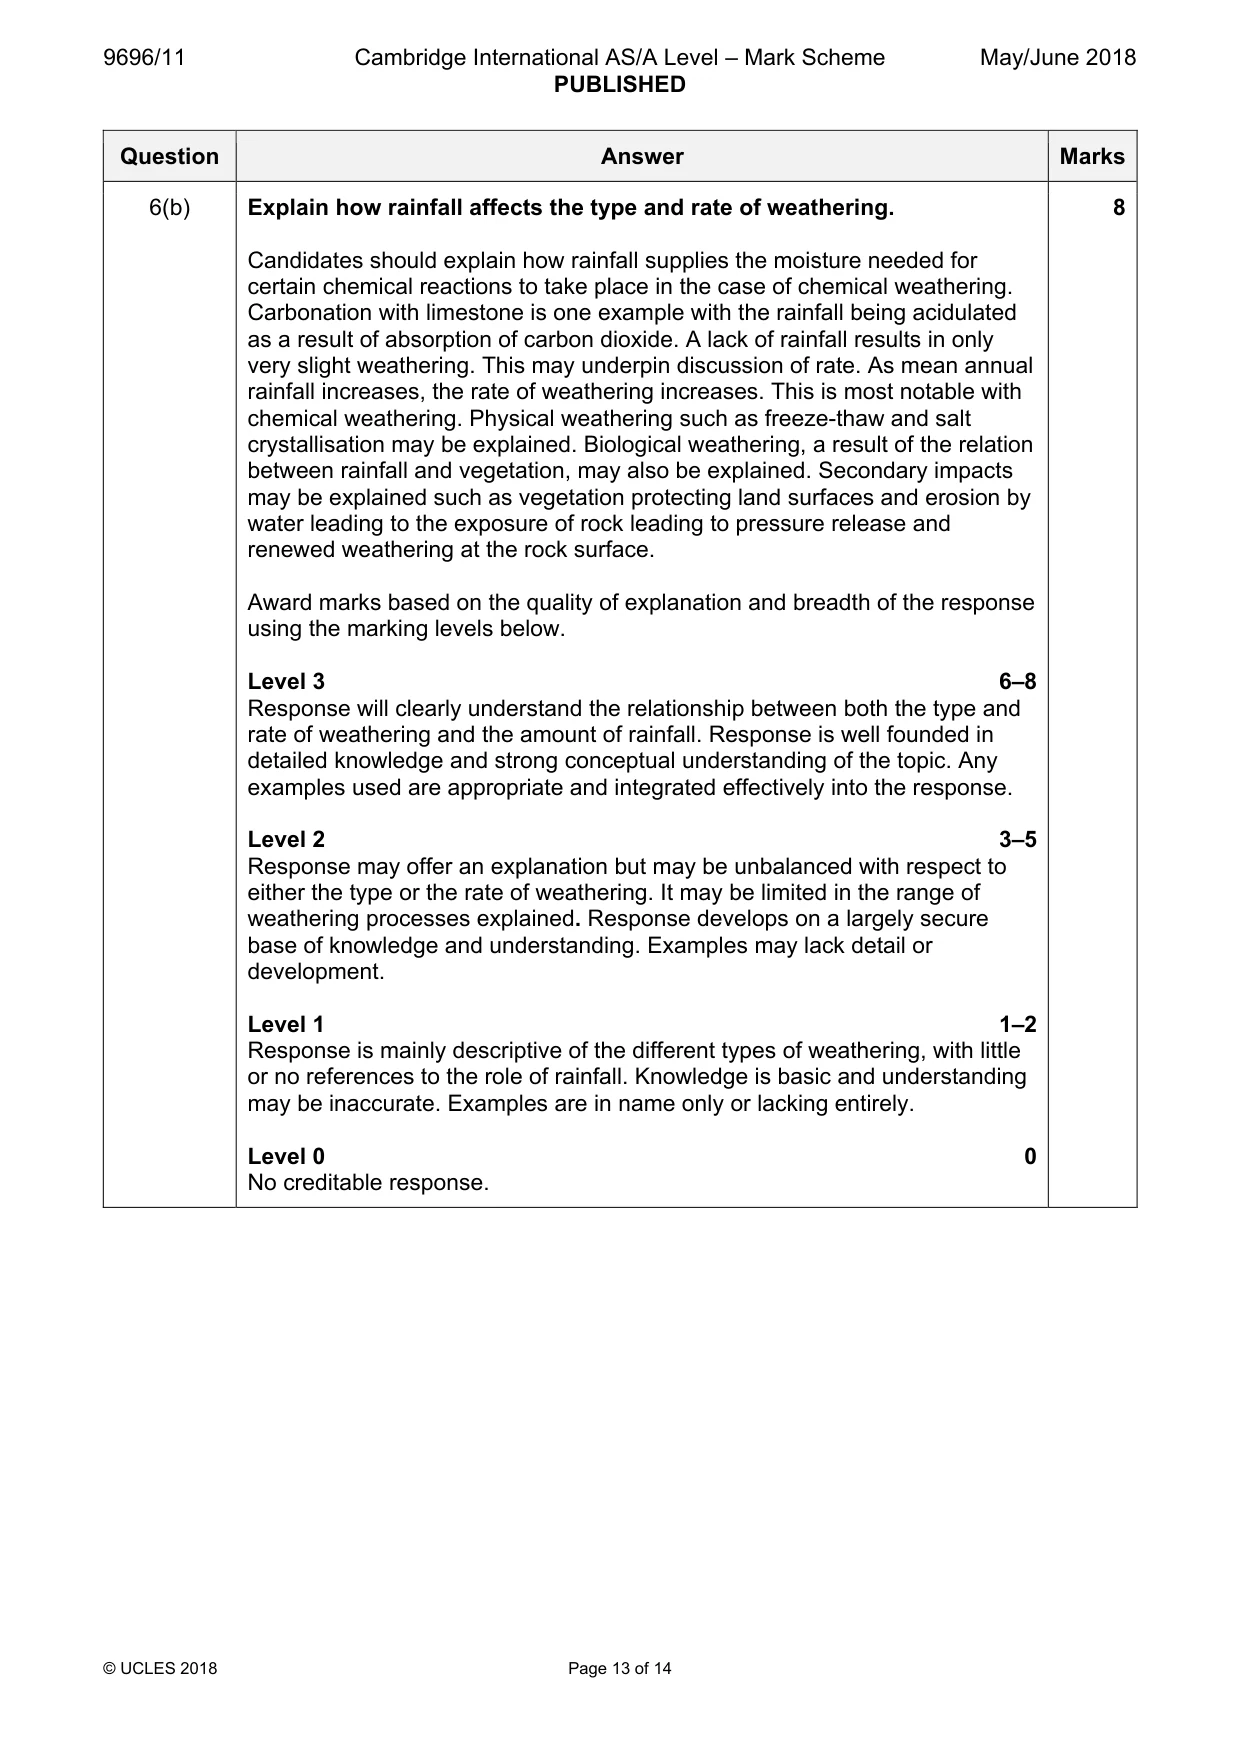
9696/11 Cambridge International AS/A Level – Mark Scheme PUBLISHED May/June 2018 © UCLES 2018 Page 13 of 14 Question Answer Marks 6(b) Explain how rainfall affects the type and rate of weathering. Candidates should explain how rainfall supplies the moisture needed for certain chemical reactions to take place in the case of chemical weathering. Carbonation with limestone is one example with the rainfall being acidulated as a result of absorption of carbon dioxide. A lack of rainfall results in only very slight weathering. This may underpin discussion of rate. As mean annual rainfall increases, the rate of weathering increases. This is most notable with chemical weathering. Physical weathering such as freeze-thaw and salt crystallisation may be explained. Biological weathering, a result of the relation between rainfall and vegetation, may also be explained. Secondary impacts may be explained such as vegetation protecting land surfaces and erosion by water leading to the exposure of rock leading to pressure release and renewed weathering at the rock surface. Award marks based on the quality of explanation and breadth of the response using the marking levels below. Level 3 6–8 Response will clearly understand the relationship between both the type and rate of weathering and the amount of rainfall. Response is well founded in detailed knowledge and strong conceptual understanding of the topic. Any examples used are appropriate and integrated effectively into the response. Level 2 3–5 Response may offer an explanation but may be unbalanced with respect to either the type or the rate of weathering. It may be limited in the range of weathering processes explained. Response develops on a largely secure base of knowledge and understanding. Examples may lack detail or development. Level 1 1–2 Response is mainly descriptive of the different types of weathering, with little or no references to the role of rainfall. Knowledge is basic and understanding may be inaccurate. Examples are in name only or lacking entirely. Level 0 0 No creditable response. 8
Mark scheme, page 14
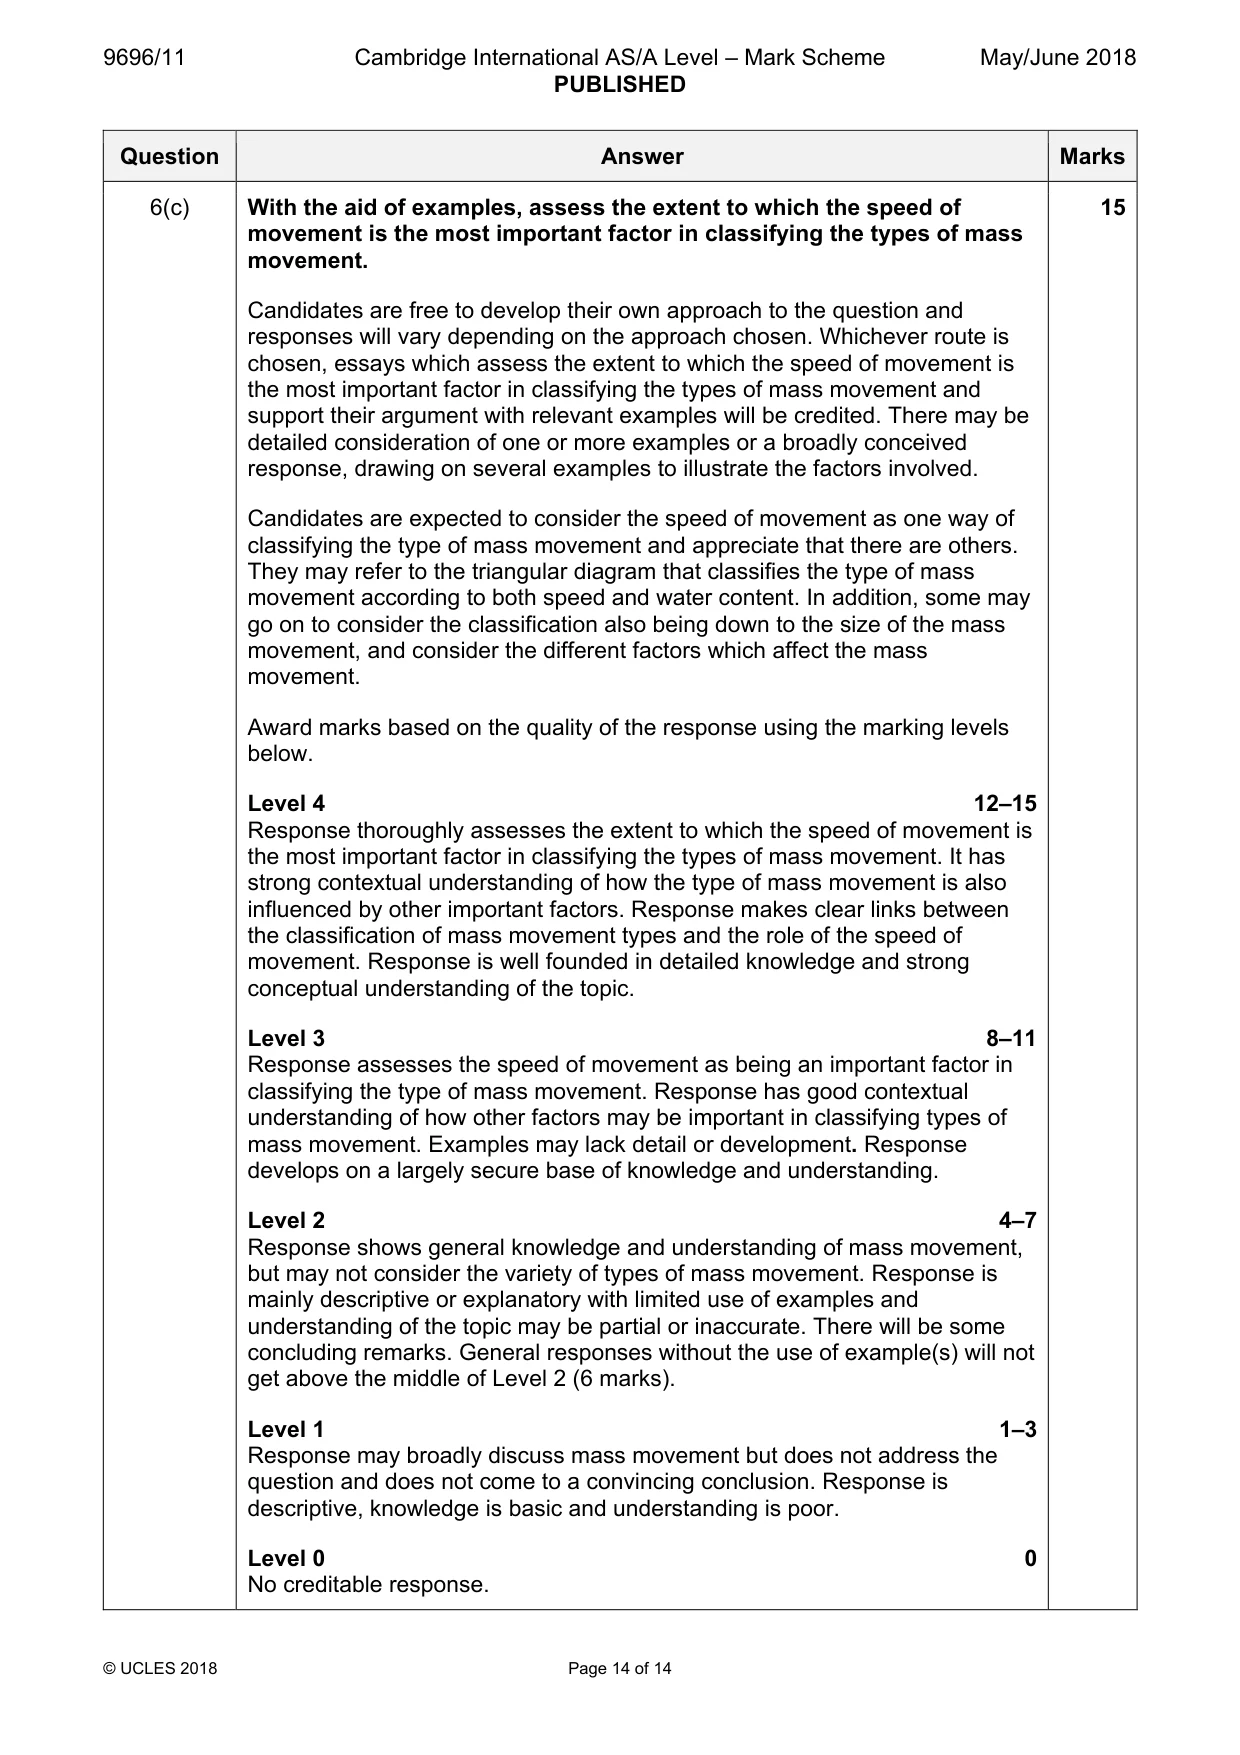
9696/11 Cambridge International AS/A Level – Mark Scheme PUBLISHED May/June 2018 © UCLES 2018 Page 14 of 14 Question Answer Marks 6(c) With the aid of examples, assess the extent to which the speed of movement is the most important factor in classifying the types of mass movement. Candidates are free to develop their own approach to the question and responses will vary depending on the approach chosen. Whichever route is chosen, essays which assess the extent to which the speed of movement is the most important factor in classifying the types of mass movement and support their argument with relevant examples will be credited. There may be detailed consideration of one or more examples or a broadly conceived response, drawing on several examples to illustrate the factors involved. Candidates are expected to consider the speed of movement as one way of classifying the type of mass movement and appreciate that there are others. They may refer to the triangular diagram that classifies the type of mass movement according to both speed and water content. In addition, some may go on to consider the classification also being down to the size of the mass movement, and consider the different factors which affect the mass movement. Award marks based on the quality of the response using the marking levels below. Level 4 12–15 Response thoroughly assesses the extent to which the speed of movement is the most important factor in classifying the types of mass movement. It has strong contextual understanding of how the type of mass movement is also influenced by other important factors. Response makes clear links between the classification of mass movement types and the role of the speed of movement. Response is well founded in detailed knowledge and strong conceptual understanding of the topic. Level 3 8–11 Response assesses the speed of movement as being an important factor in classifying the type of mass movement. Response has good contextual understanding of how other factors may be important in classifying types of mass movement. Examples may lack detail or development. Response develops on a largely secure base of knowledge and understanding. Level 2 4–7 Response shows general knowledge and understanding of mass movement, but may not consider the variety of types of mass movement. Response is mainly descriptive or explanatory with limited use of examples and understanding of the topic may be partial or inaccurate. There will be some concluding remarks. General responses without the use of example(s) will not get above the middle of Level 2 (6 marks). Level 1 1–3 Response may broadly discuss mass movement but does not address the question and does not come to a convincing conclusion. Response is descriptive, knowledge is basic and understanding is poor. Level 0 0 No creditable response. 15
What you needed in this session
Cambridge’s own grade thresholds for 2018 May/June, Paper 1 · Variant 1. A higher threshold means an easier paper — the bar moves with how the cohort did.