Cambridge A Level Geography 9696 — 2018 May/June Paper 1 · Variant 2
9696/12/M/J/18 · 60 marks · ≈68 min
The question paper and its mark scheme, free to read here and free to download. This is Cambridge’s own paper, exactly as it was sat.
Question paper4 pages

Mark scheme15 pages
Answers below. Sit the paper first if you are practising.
Paper as text
Question paper, page 1
* 2 1 5 0 8 4 1 8 0 3 * This document consists of 3 printed pages, 1 blank page and 2 Inserts. DC (LK) 145908/2 © UCLES 2018 [Turn over Cambridge International Examinations Cambridge International Advanced Subsidiary and Advanced Level GEOGRAPHY 9696/12 Paper 1 Core Physical Geography May/June 2018 1 hour 30 minutes No Additional Materials are required. READ THESE INSTRUCTIONS FIRST An answer booklet is provided inside this question paper. You should follow the instructions on the front cover of the answer booklet. If you need additional answer paper ask the invigilator for a continuation booklet. Section A Answer all questions. Section B Answer one question. Sketch maps and diagrams should be drawn whenever they serve to illustrate an answer. All the resources referred to in the questions are contained in the Insert. The number of marks is given in brackets [ ] at the end of each question or part question. The total number of marks for this paper is 60.
Question paper, page 2
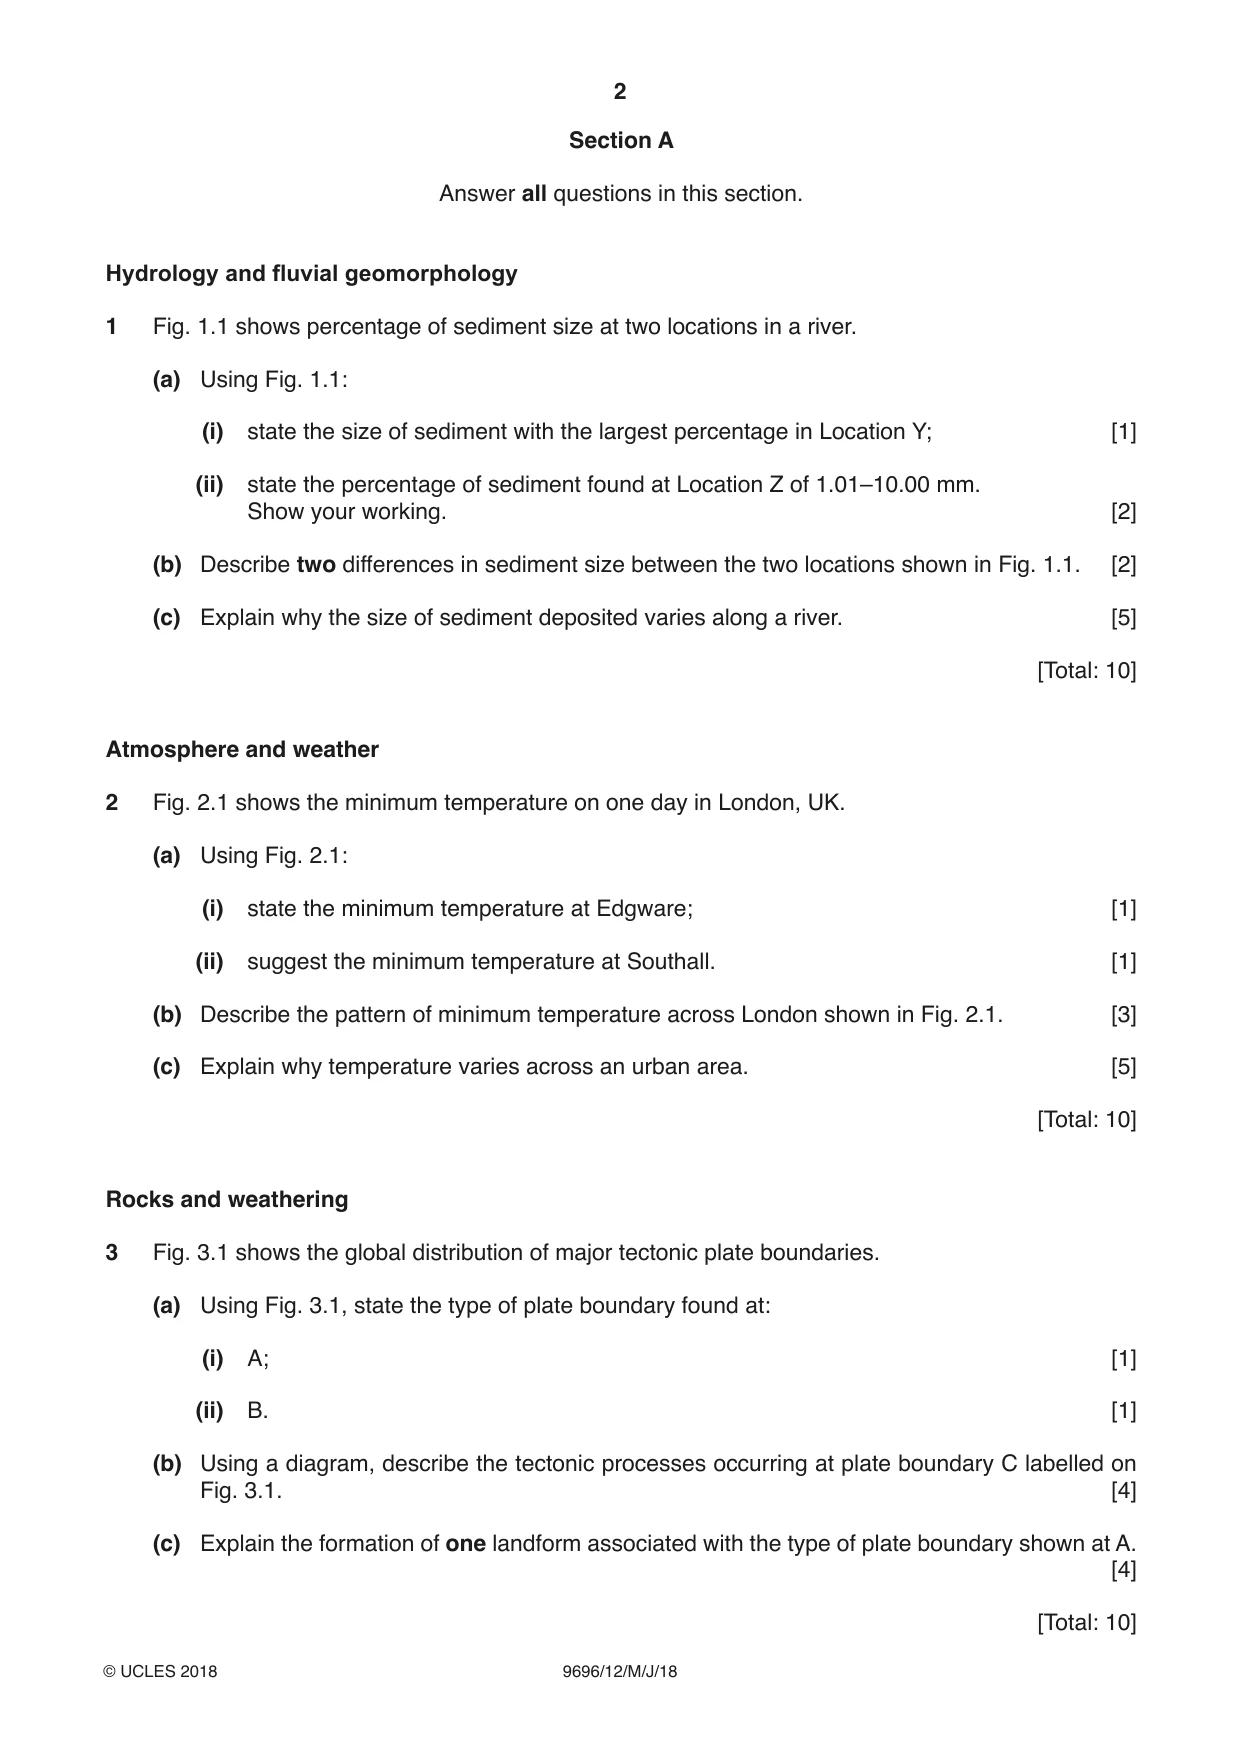
2 9696/12/M/J/18 © UCLES 2018 Section A Answer all questions in this section. Hydrology and fluvial geomorphology 1 Fig. 1.1 shows percentage of sediment size at two locations in a river. (a) Using Fig. 1.1: (i) state the size of sediment with the largest percentage in Location Y; [1] (ii) state the percentage of sediment found at Location Z of 1.01–10.00 mm. Show your working. [2] (b) Describe two differences in sediment size between the two locations shown in Fig. 1.1. [2] (c) Explain why the size of sediment deposited varies along a river. [5] [Total: 10] Atmosphere and weather 2 Fig. 2.1 shows the minimum temperature on one day in London, UK. (a) Using Fig. 2.1: (i) state the minimum temperature at Edgware; [1] (ii) suggest the minimum temperature at Southall. [1] (b) Describe the pattern of minimum temperature across London shown in Fig. 2.1. [3] (c) Explain why temperature varies across an urban area. [5] [Total: 10] Rocks and weathering 3 Fig. 3.1 shows the global distribution of major tectonic plate boundaries. (a) Using Fig. 3.1, state the type of plate boundary found at: (i) A; [1] (ii) B. [1] (b) Using a diagram, describe the tectonic processes occurring at plate boundary C labelled on Fig. 3.1. [4] (c) Explain the formation of one landform associated with the type of plate boundary shown at A. [4] [Total: 10]
Question paper, page 3
3 9696/12/M/J/18 © UCLES 2018 Section B Answer one question from this section. Hydrology and fluvial geomorphology 4 (a) (i) Define the hydrological terms percolation and stemflow. [4] (ii) Briefly explain how river discharge is calculated. [3] (b) Explain how two drainage basin characteristics can influence the shape of a storm hydrograph. [8] (c) With the aid of examples, examine the extent to which soft engineering prevents river floods. [15] [Total: 30] Atmosphere and weather 5 (a) (i) Describe how albedo varies with the nature of different surfaces. [3] (ii) Explain how frontal rainfall occurs. [4] (b) Explain the role of shortwave radiation and longwave radiation in the diurnal energy budget. [8] (c) ‘Ocean currents are the most important influence in the atmospheric transfer of energy.’ With the aid of examples, how far do you agree? [15] [Total: 30] Rocks and weathering 6 (a) (i) Define the weathering terms carbonation and pressure release (dilatation). [4] (ii) Briefly describe how temperature influences rates of weathering. [3] (b) Using a case study, explain how human activity affects slope stability. [8] (c) With the aid of examples, assess the extent to which the presence of water is the most important factor in determining the type of mass movement. [15] [Total: 30]
Question paper, page 4
4 9696/12/M/J/18 © UCLES 2018 Permission to reproduce items where third-party owned material protected by copyright is included has been sought and cleared where possible. Every reasonable effort has been made by the publisher (UCLES) to trace copyright holders, but if any items requiring clearance have unwittingly been included, the publisher will be pleased to make amends at the earliest possible opportunity. To avoid the issue of disclosure of answer-related information to candidates, all copyright acknowledgements are reproduced online in the Cambridge International Examinations Copyright Acknowledgements Booklet. This is produced for each series of examinations and is freely available to download at www.cie.org.uk after the live examination series. Cambridge International Examinations is part of the Cambridge Assessment Group. Cambridge Assessment is the brand name of University of Cambridge Local Examinations Syndicate (UCLES), which is itself a department of the University of Cambridge. BLANK PAGE
Mark scheme, page 1
® IGCSE is a registered trademark. This document consists of 15 printed pages. © UCLES 2018 [Turn over Cambridge Assessment International Education Cambridge International Advanced Subsidiary and Advanced Level GEOGRAPHY 9696/12 Paper 1 Core Physical Geography May/June 2018 MARK SCHEME Maximum Mark: 60 Published This mark scheme is published as an aid to teachers and candidates, to indicate the requirements of the examination. It shows the basis on which Examiners were instructed to award marks. It does not indicate the details of the discussions that took place at an Examiners’ meeting before marking began, which would have considered the acceptability of alternative answers. Mark schemes should be read in conjunction with the question paper and the Principal Examiner Report for Teachers. Cambridge International will not enter into discussions about these mark schemes. Cambridge International is publishing the mark schemes for the May/June 2018 series for most Cambridge IGCSE®, Cambridge International A and AS Level and Cambridge Pre-U components, and some Cambridge O Level components.
Mark scheme, page 2
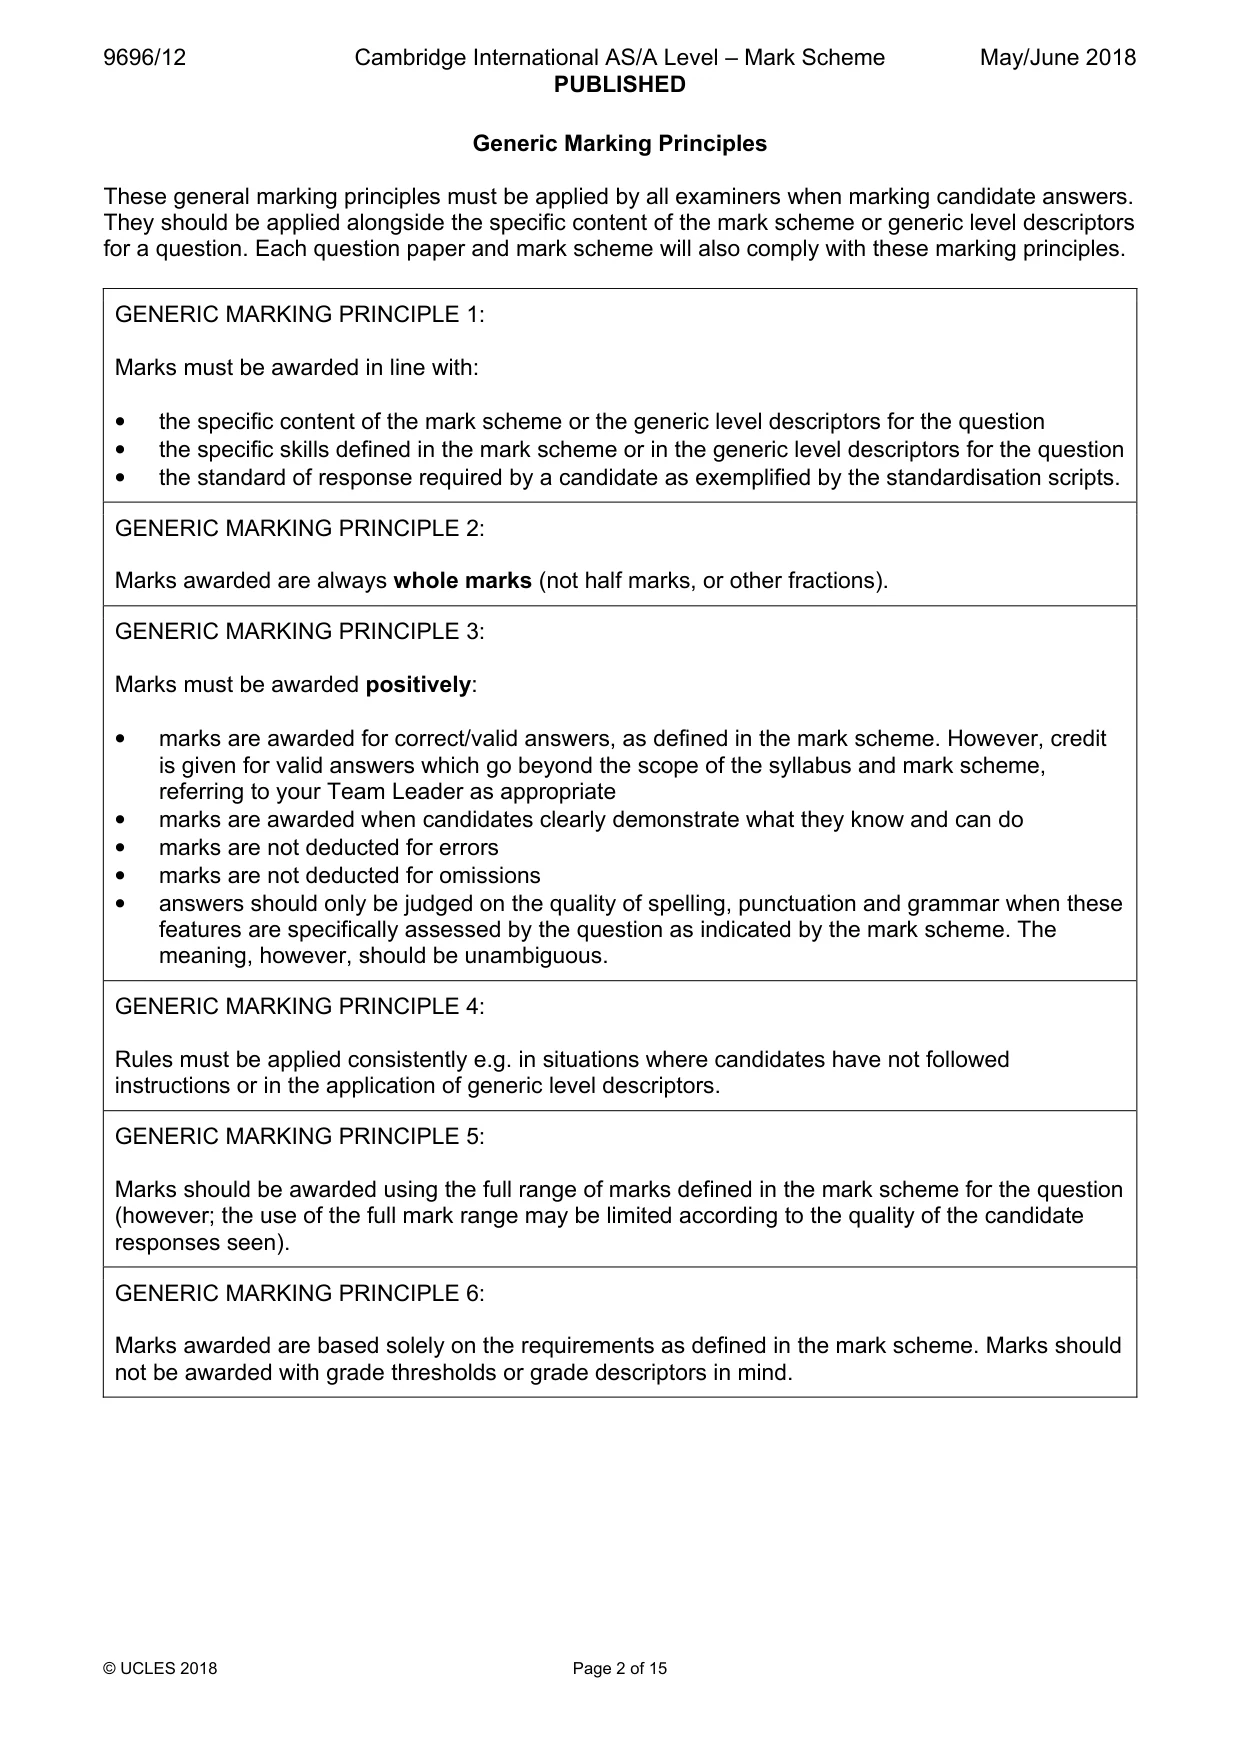
9696/12 Cambridge International AS/A Level – Mark Scheme PUBLISHED May/June 2018 © UCLES 2018 Page 2 of 15 Generic Marking Principles These general marking principles must be applied by all examiners when marking candidate answers. They should be applied alongside the specific content of the mark scheme or generic level descriptors for a question. Each question paper and mark scheme will also comply with these marking principles. GENERIC MARKING PRINCIPLE 1: Marks must be awarded in line with: • the specific content of the mark scheme or the generic level descriptors for the question • the specific skills defined in the mark scheme or in the generic level descriptors for the question • the standard of response required by a candidate as exemplified by the standardisation scripts. GENERIC MARKING PRINCIPLE 2: Marks awarded are always whole marks (not half marks, or other fractions). GENERIC MARKING PRINCIPLE 3: Marks must be awarded positively: • marks are awarded for correct/valid answers, as defined in the mark scheme. However, credit is given for valid answers which go beyond the scope of the syllabus and mark scheme, referring to your Team Leader as appropriate • marks are awarded when candidates clearly demonstrate what they know and can do • marks are not deducted for errors • marks are not deducted for omissions • answers should only be judged on the quality of spelling, punctuation and grammar when these features are specifically assessed by the question as indicated by the mark scheme. The meaning, however, should be unambiguous. GENERIC MARKING PRINCIPLE 4: Rules must be applied consistently e.g. in situations where candidates have not followed instructions or in the application of generic level descriptors. GENERIC MARKING PRINCIPLE 5: Marks should be awarded using the full range of marks defined in the mark scheme for the question (however; the use of the full mark range may be limited according to the quality of the candidate responses seen). GENERIC MARKING PRINCIPLE 6: Marks awarded are based solely on the requirements as defined in the mark scheme. Marks should not be awarded with grade thresholds or grade descriptors in mind.
Mark scheme, page 3
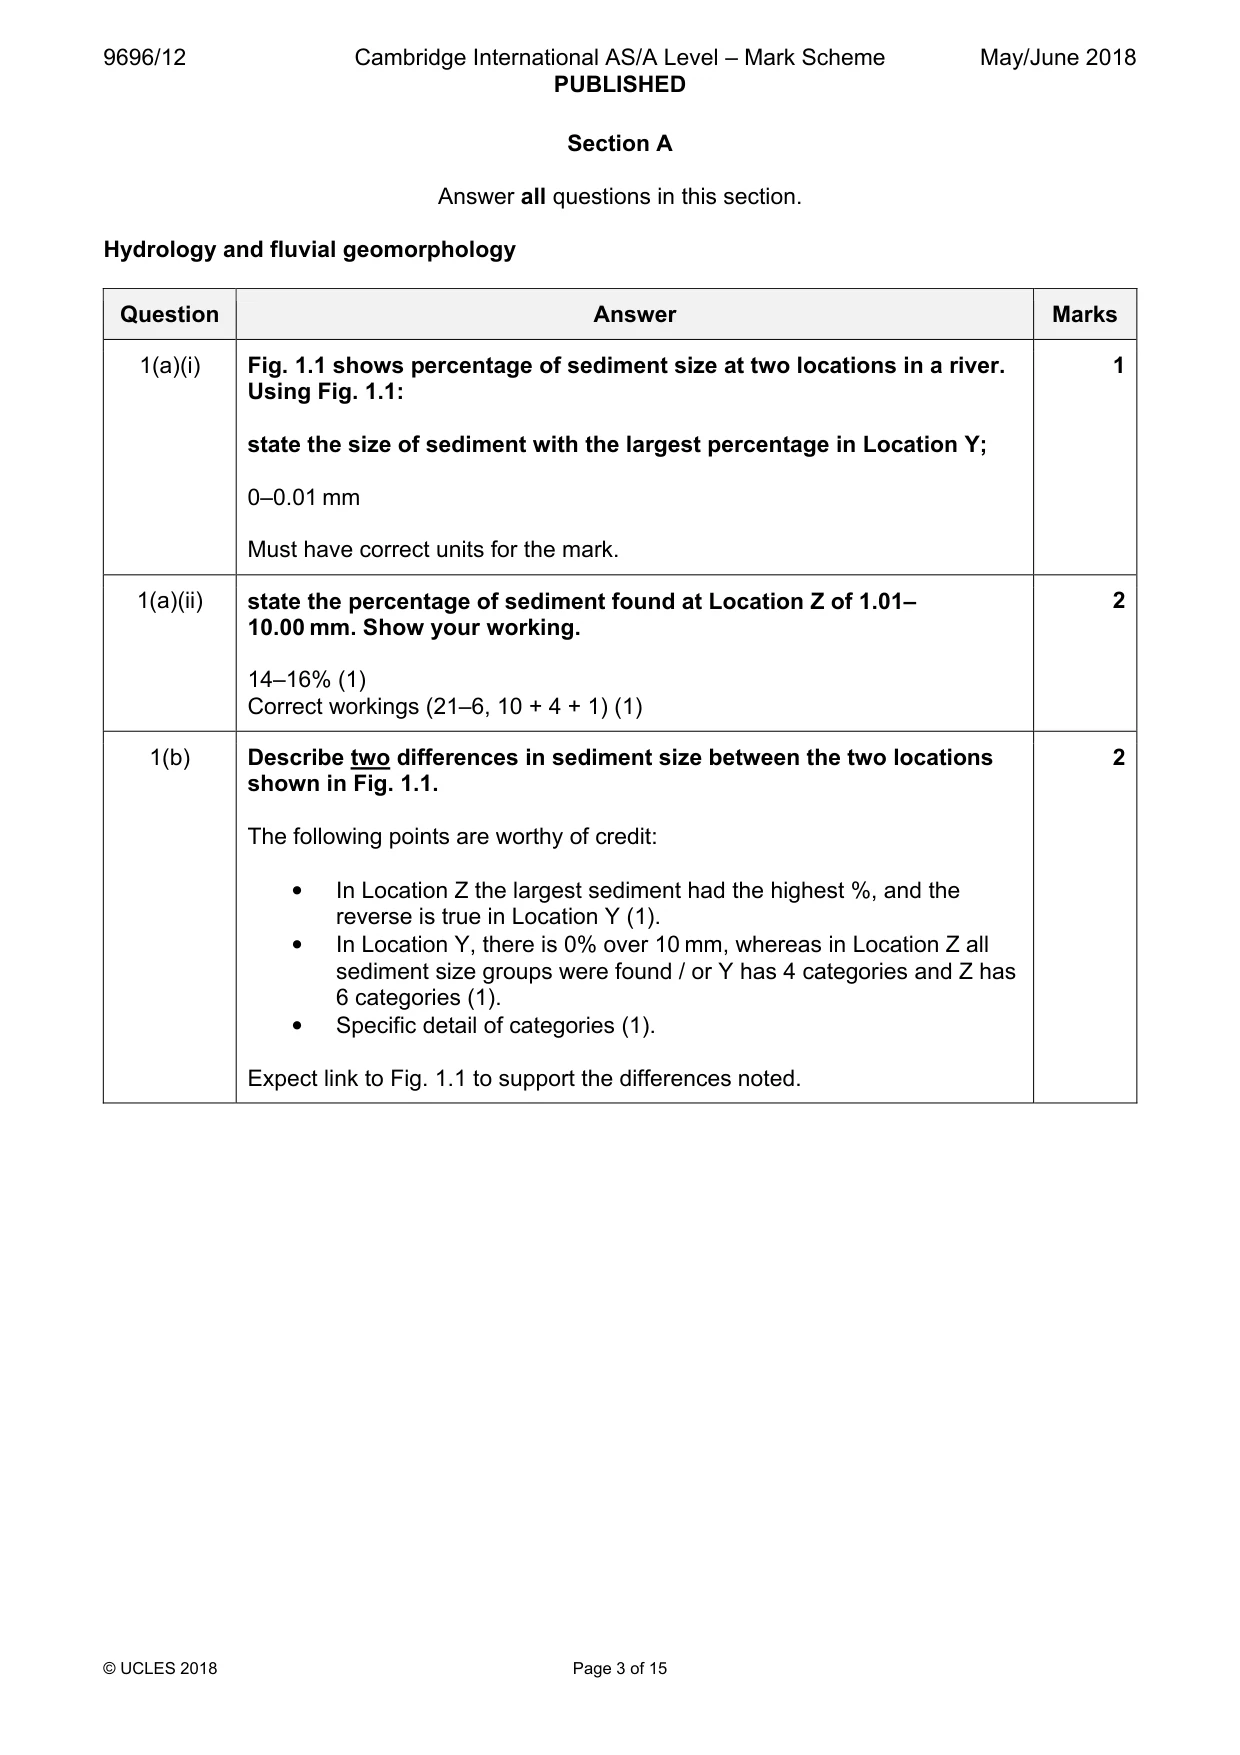
9696/12 Cambridge International AS/A Level – Mark Scheme PUBLISHED May/June 2018 © UCLES 2018 Page 3 of 15 Section A Answer all questions in this section. Hydrology and fluvial geomorphology Question Answer Marks 1(a)(i) Fig. 1.1 shows percentage of sediment size at two locations in a river. Using Fig. 1.1: state the size of sediment with the largest percentage in Location Y; 0–0.01 mm Must have correct units for the mark. 1 1(a)(ii) state the percentage of sediment found at Location Z of 1.01– 10.00 mm. Show your working. 14–16% (1) Correct workings (21–6, 10 + 4 + 1) (1) 2 1(b) Describe two differences in sediment size between the two locations shown in Fig. 1.1. The following points are worthy of credit: • In Location Z the largest sediment had the highest %, and the reverse is true in Location Y (1). • In Location Y, there is 0% over 10 mm, whereas in Location Z all sediment size groups were found / or Y has 4 categories and Z has 6 categories (1). • Specific detail of categories (1). Expect link to Fig. 1.1 to support the differences noted. 2
Mark scheme, page 4
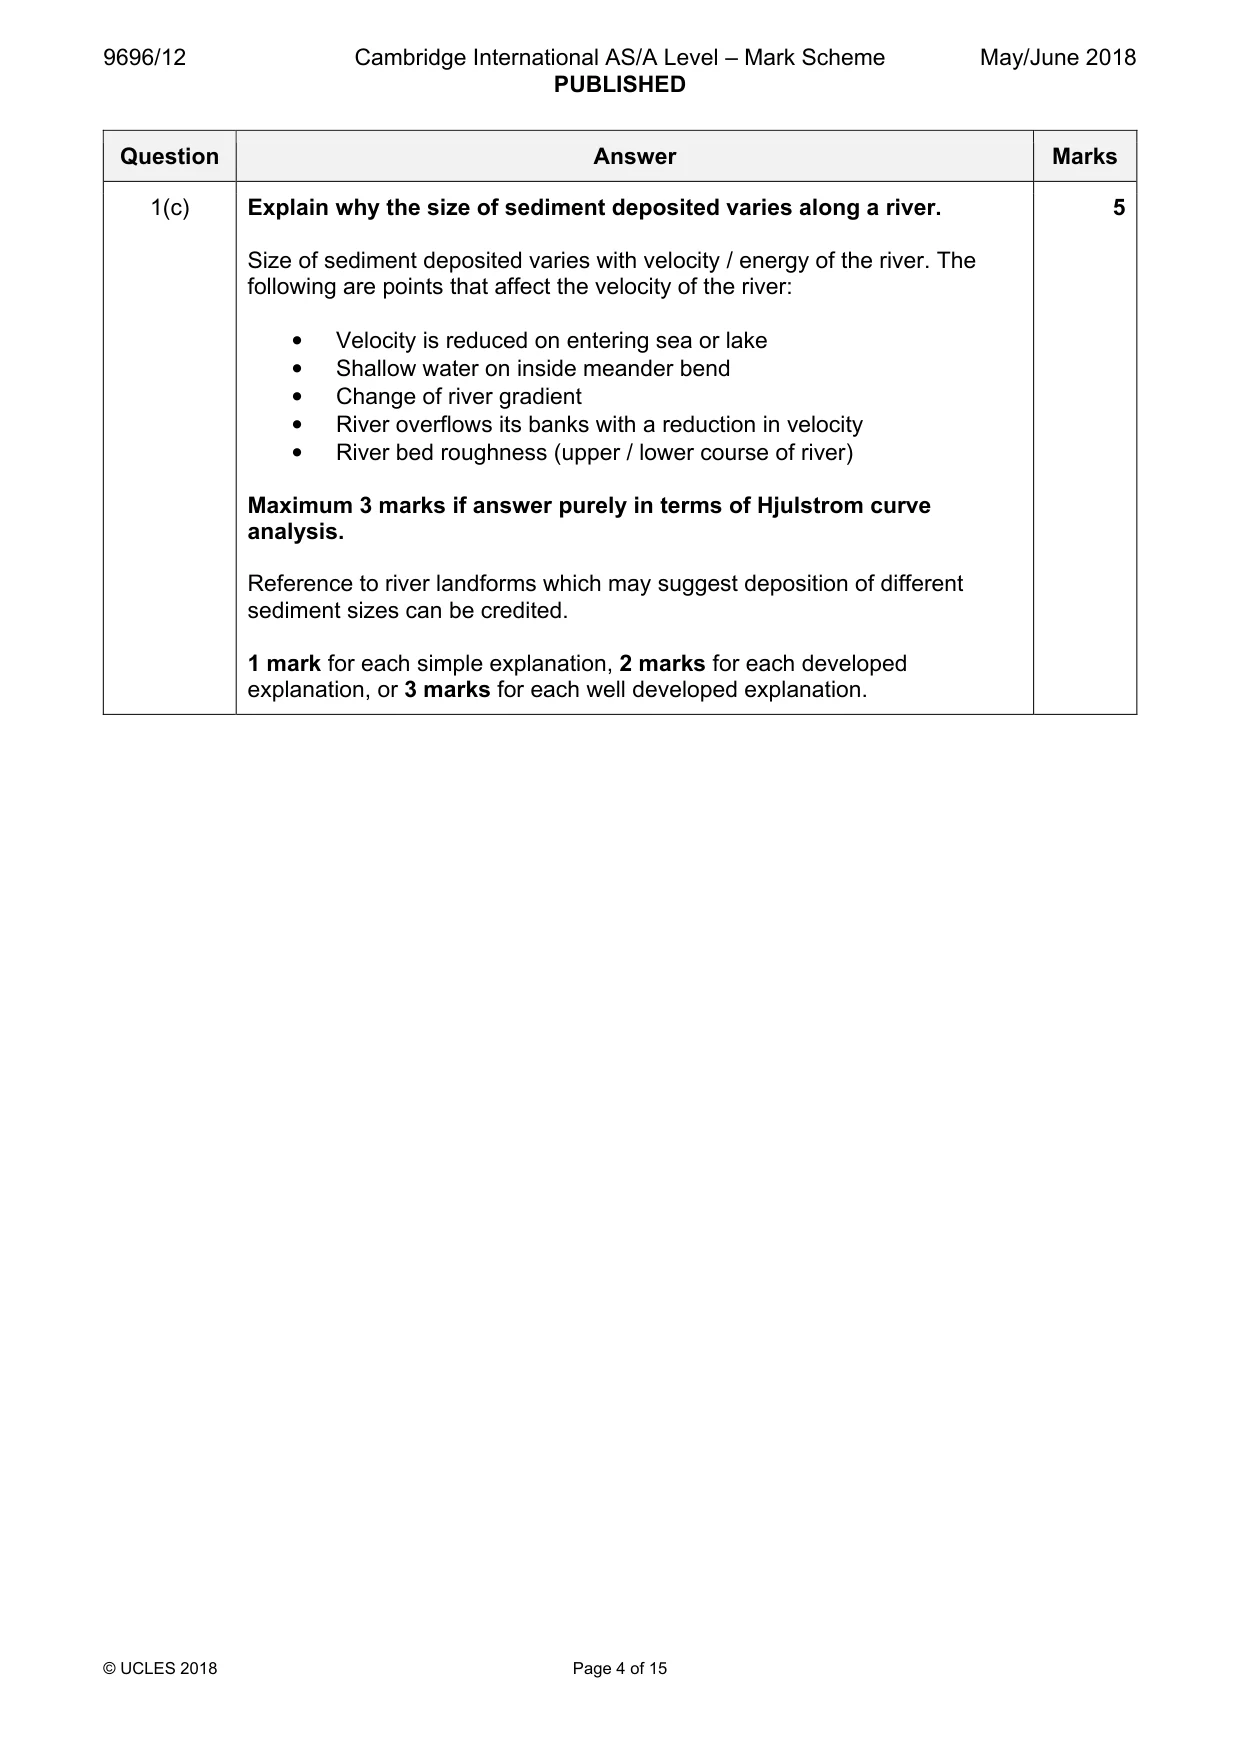
9696/12 Cambridge International AS/A Level – Mark Scheme PUBLISHED May/June 2018 © UCLES 2018 Page 4 of 15 Question Answer Marks 1(c) Explain why the size of sediment deposited varies along a river. Size of sediment deposited varies with velocity / energy of the river. The following are points that affect the velocity of the river: • Velocity is reduced on entering sea or lake • Shallow water on inside meander bend • Change of river gradient • River overflows its banks with a reduction in velocity • River bed roughness (upper / lower course of river) Maximum 3 marks if answer purely in terms of Hjulstrom curve analysis. Reference to river landforms which may suggest deposition of different sediment sizes can be credited. 1 mark for each simple explanation, 2 marks for each developed explanation, or 3 marks for each well developed explanation. 5
Mark scheme, page 5
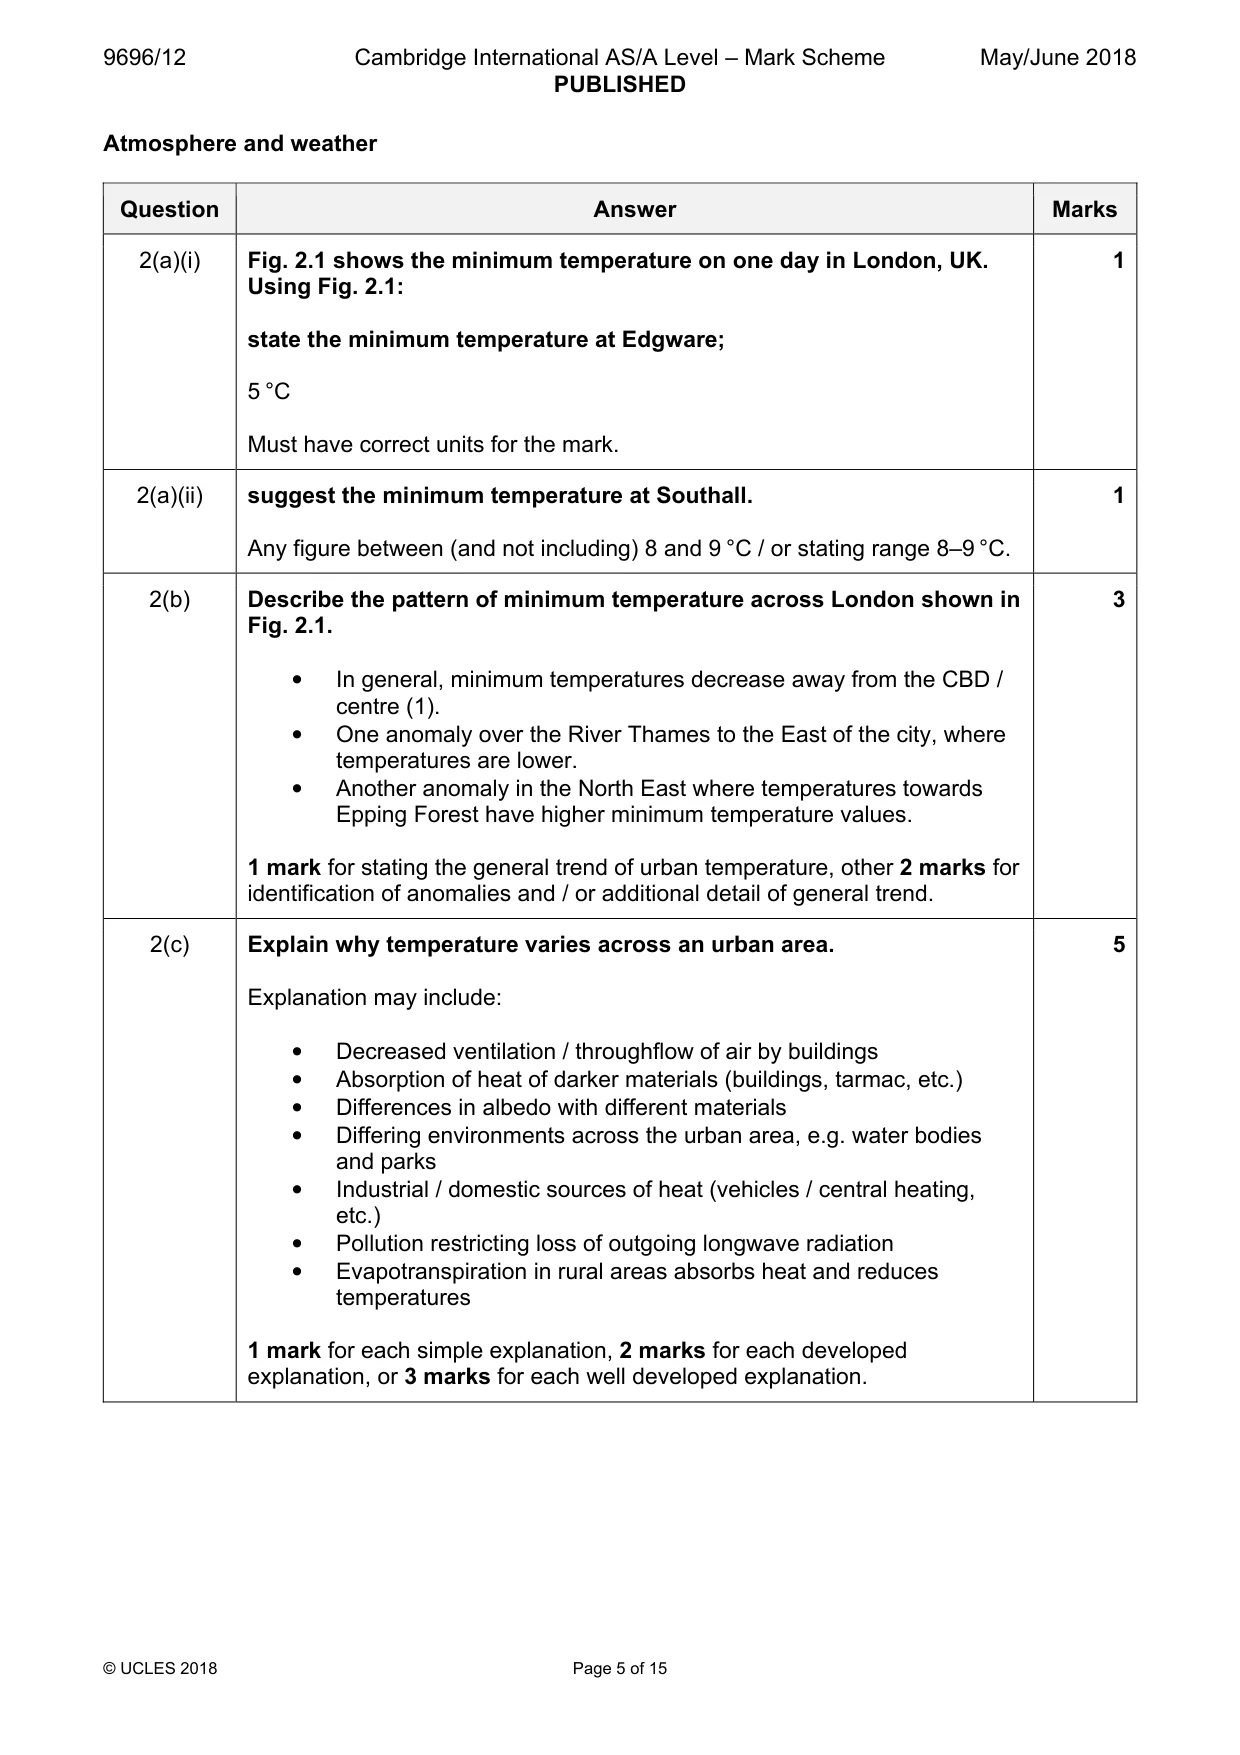
9696/12 Cambridge International AS/A Level – Mark Scheme PUBLISHED May/June 2018 © UCLES 2018 Page 5 of 15 Atmosphere and weather Question Answer Marks 2(a)(i) Fig. 2.1 shows the minimum temperature on one day in London, UK. Using Fig. 2.1: state the minimum temperature at Edgware; 5 °C Must have correct units for the mark. 1 2(a)(ii) suggest the minimum temperature at Southall. Any figure between (and not including) 8 and 9 °C / or stating range 8–9 °C. 1 2(b) Describe the pattern of minimum temperature across London shown in Fig. 2.1. • In general, minimum temperatures decrease away from the CBD / centre (1). • One anomaly over the River Thames to the East of the city, where temperatures are lower. • Another anomaly in the North East where temperatures towards Epping Forest have higher minimum temperature values. 1 mark for stating the general trend of urban temperature, other 2 marks for identification of anomalies and / or additional detail of general trend. 3 2(c) Explain why temperature varies across an urban area. Explanation may include: • Decreased ventilation / throughflow of air by buildings • Absorption of heat of darker materials (buildings, tarmac, etc.) • Differences in albedo with different materials • Differing environments across the urban area, e.g. water bodies and parks • Industrial / domestic sources of heat (vehicles / central heating, etc.) • Pollution restricting loss of outgoing longwave radiation • Evapotranspiration in rural areas absorbs heat and reduces temperatures 1 mark for each simple explanation, 2 marks for each developed explanation, or 3 marks for each well developed explanation. 5
Mark scheme, page 6
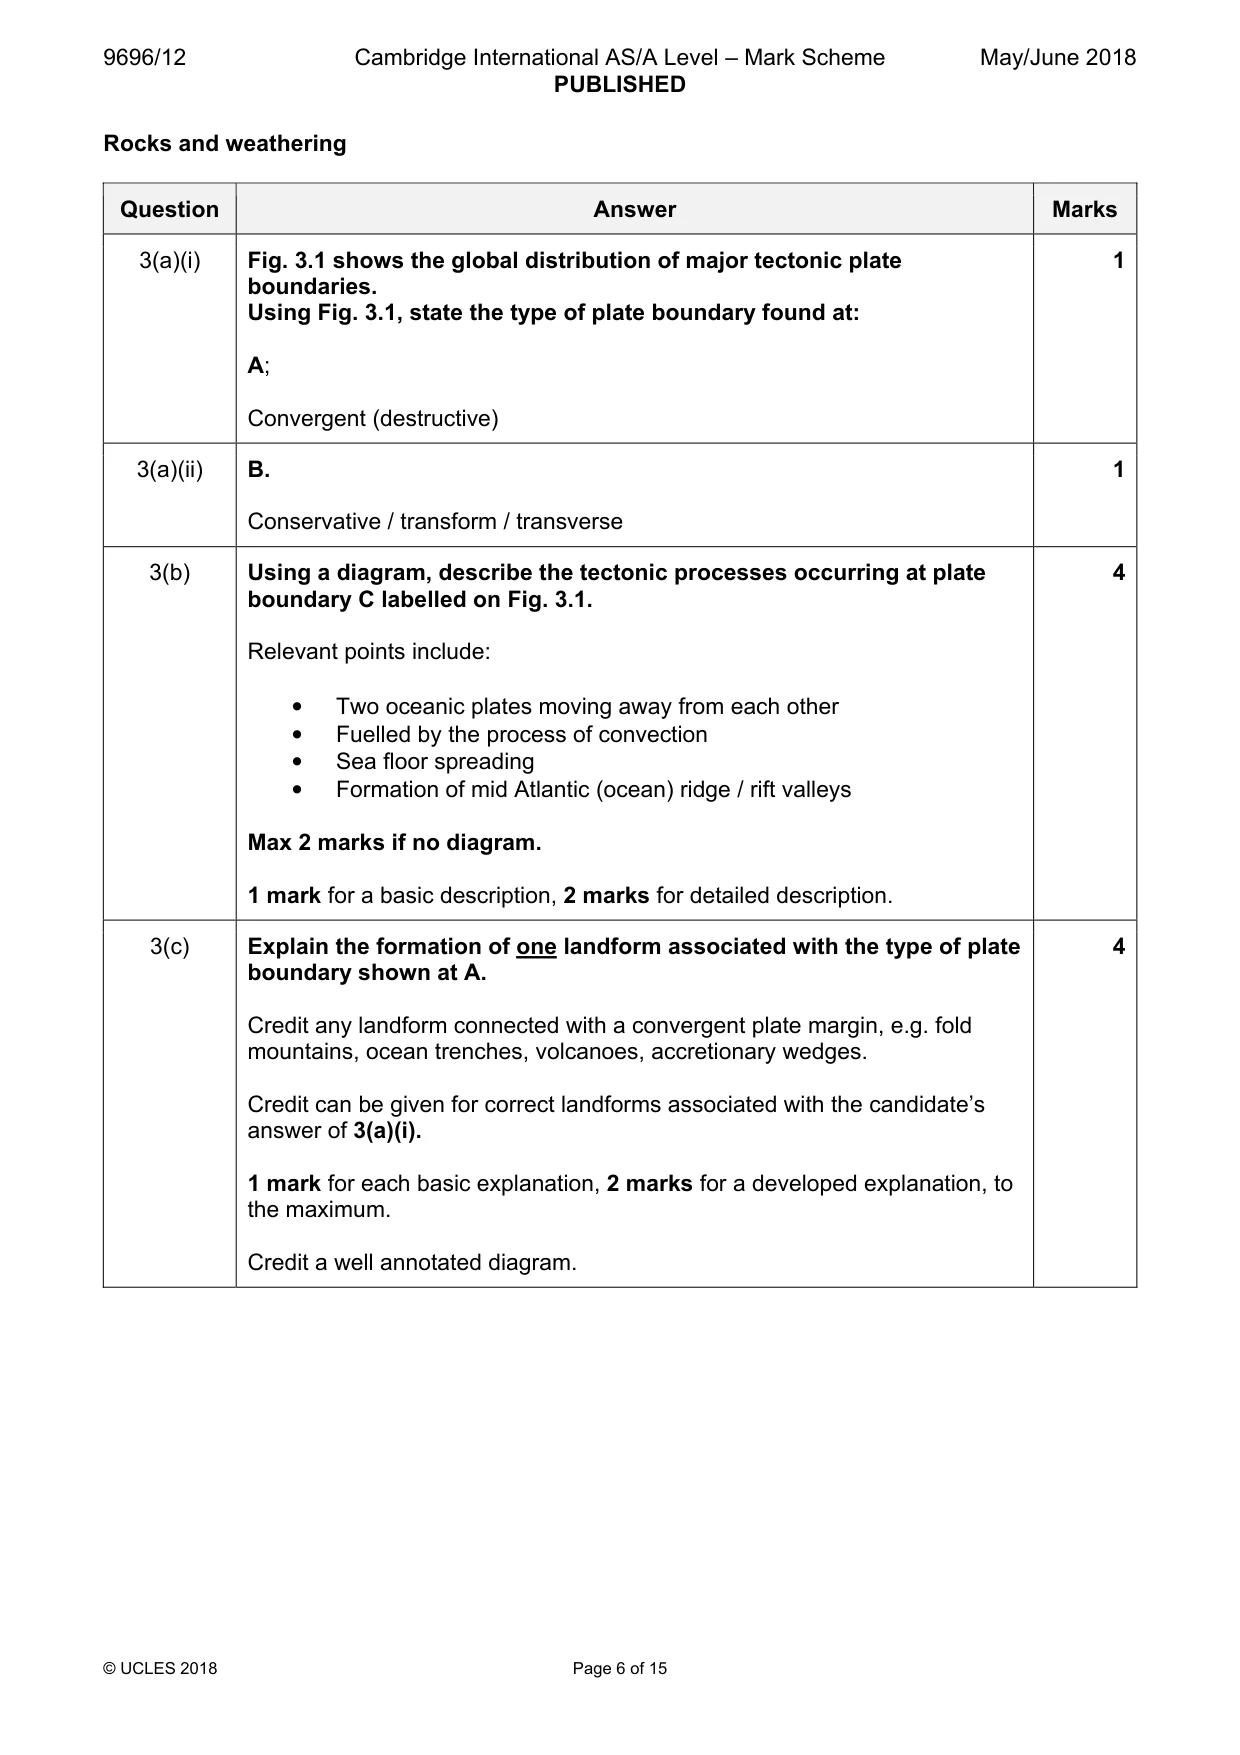
9696/12 Cambridge International AS/A Level – Mark Scheme PUBLISHED May/June 2018 © UCLES 2018 Page 6 of 15 Rocks and weathering Question Answer Marks 3(a)(i) Fig. 3.1 shows the global distribution of major tectonic plate boundaries. Using Fig. 3.1, state the type of plate boundary found at: A; Convergent (destructive) 1 3(a)(ii) B. Conservative / transform / transverse 1 3(b) Using a diagram, describe the tectonic processes occurring at plate boundary C labelled on Fig. 3.1. Relevant points include: • Two oceanic plates moving away from each other • Fuelled by the process of convection • Sea floor spreading • Formation of mid Atlantic (ocean) ridge / rift valleys Max 2 marks if no diagram. 1 mark for a basic description, 2 marks for detailed description. 4 3(c) Explain the formation of one landform associated with the type of plate boundary shown at A. Credit any landform connected with a convergent plate margin, e.g. fold mountains, ocean trenches, volcanoes, accretionary wedges. Credit can be given for correct landforms associated with the candidate’s answer of 3(a)(i). 1 mark for each basic explanation, 2 marks for a developed explanation, to the maximum. Credit a well annotated diagram. 4
Mark scheme, page 7
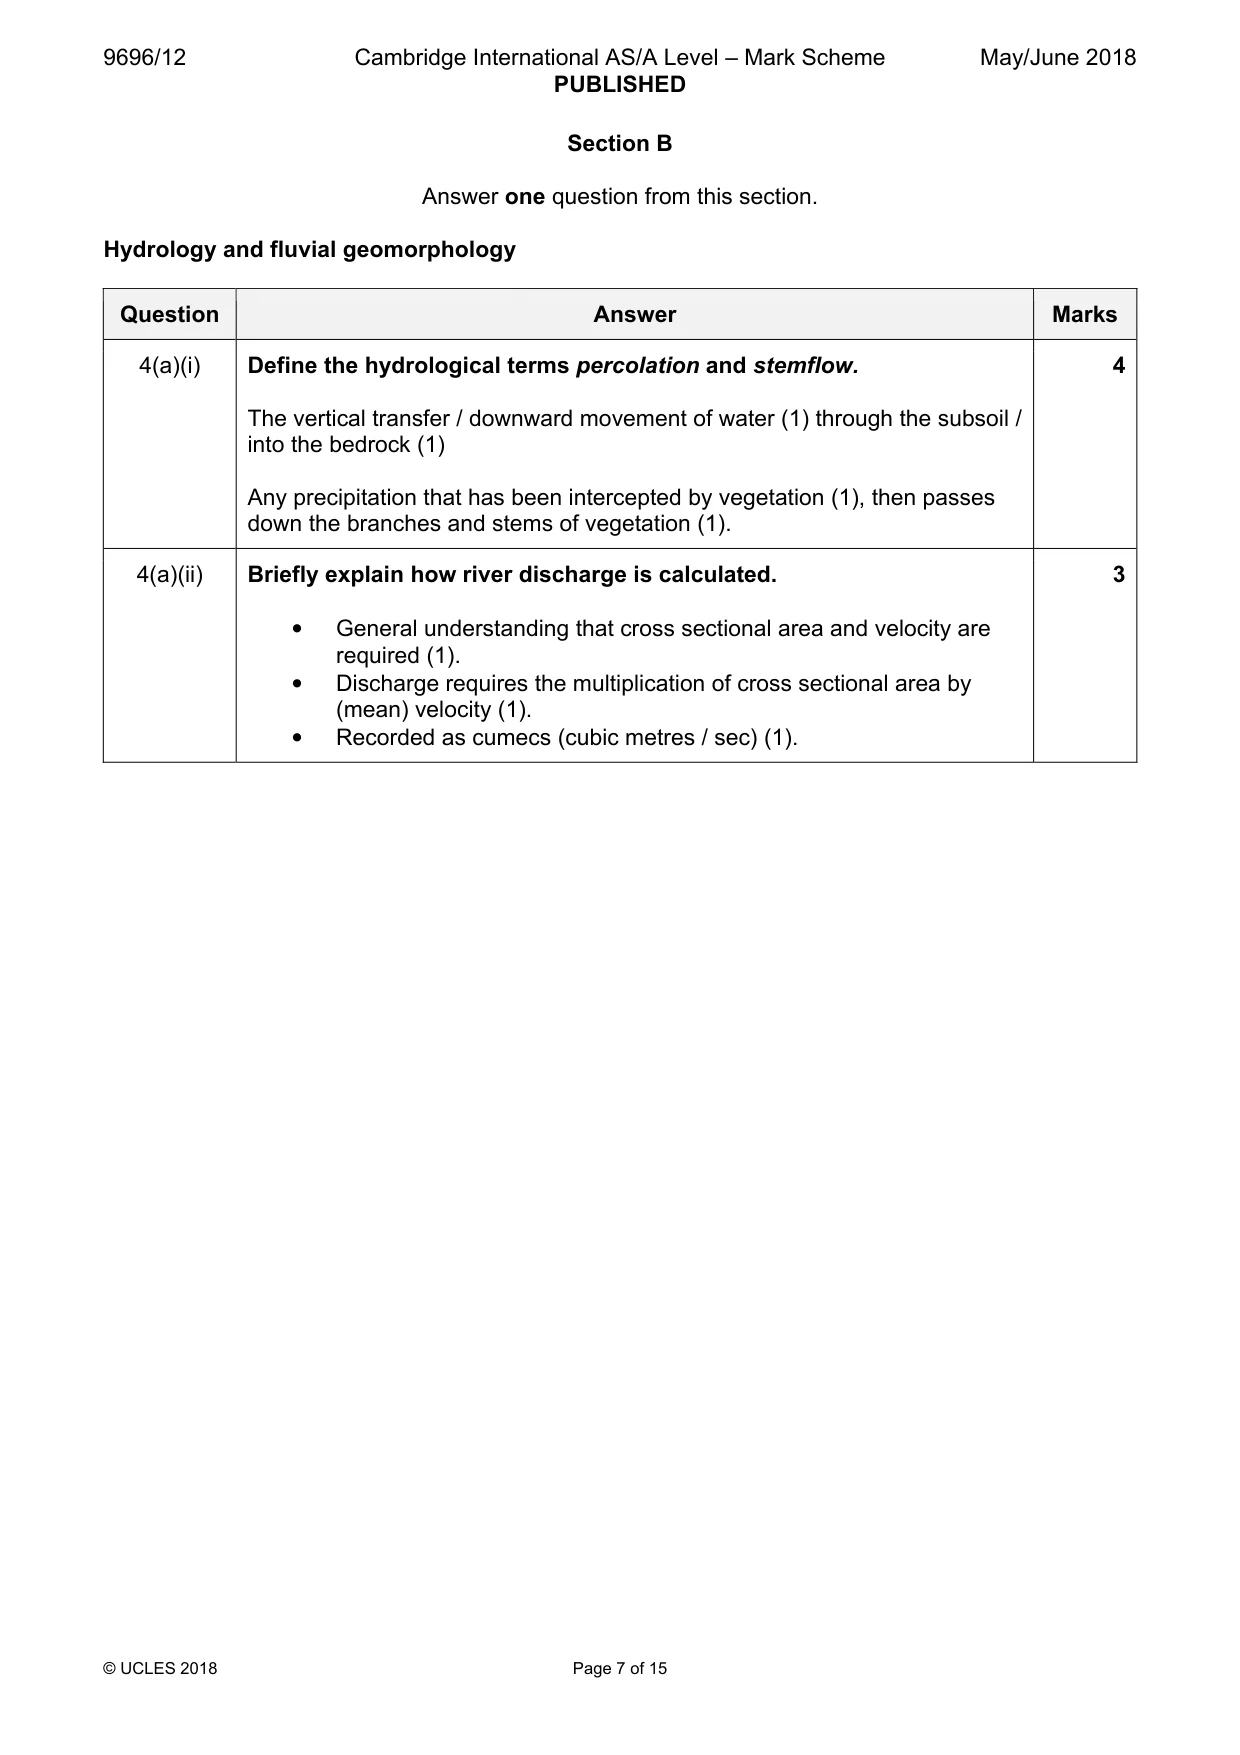
9696/12 Cambridge International AS/A Level – Mark Scheme PUBLISHED May/June 2018 © UCLES 2018 Page 7 of 15 Section B Answer one question from this section. Hydrology and fluvial geomorphology Question Answer Marks 4(a)(i) Define the hydrological terms percolation and stemflow. The vertical transfer / downward movement of water (1) through the subsoil / into the bedrock (1) Any precipitation that has been intercepted by vegetation (1), then passes down the branches and stems of vegetation (1). 4 4(a)(ii) Briefly explain how river discharge is calculated. • General understanding that cross sectional area and velocity are required (1). • Discharge requires the multiplication of cross sectional area by (mean) velocity (1). • Recorded as cumecs (cubic metres / sec) (1). 3
Mark scheme, page 8
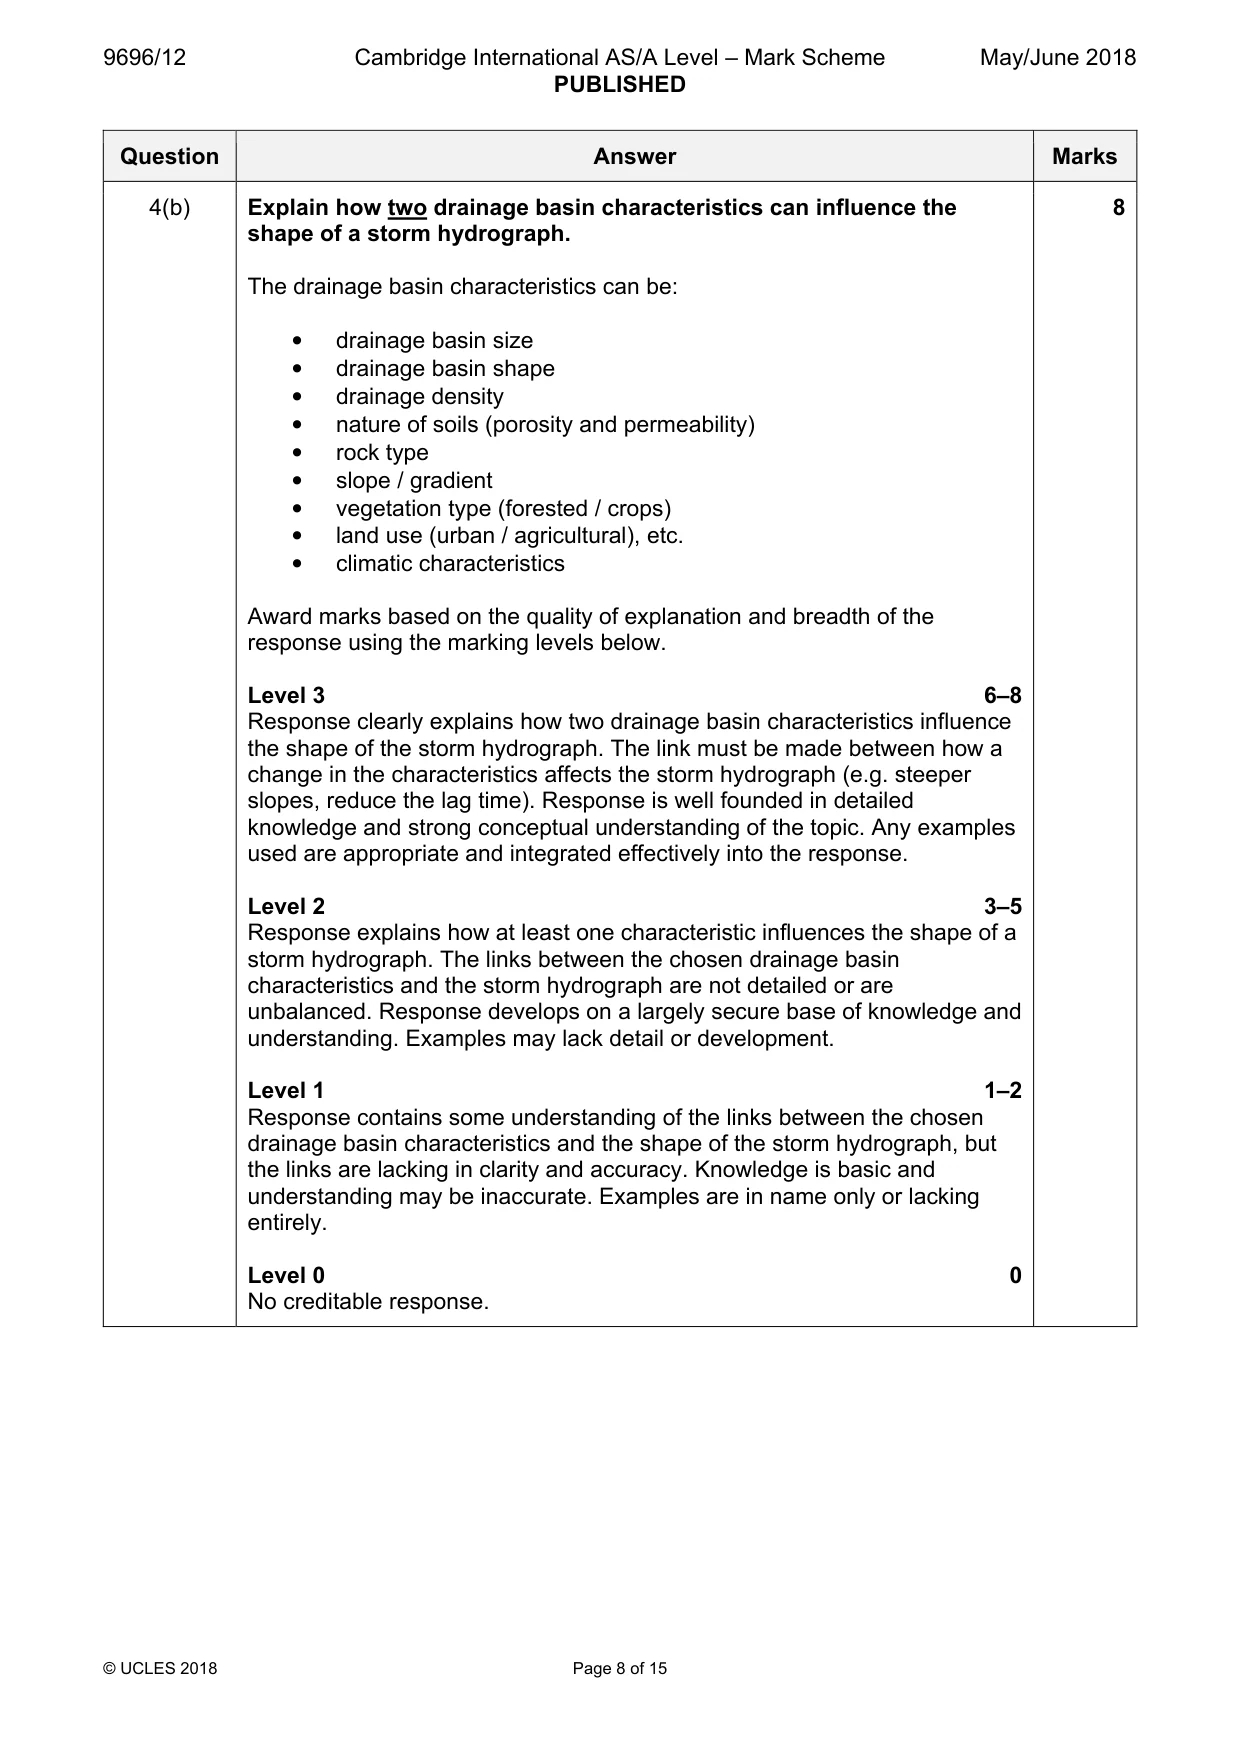
9696/12 Cambridge International AS/A Level – Mark Scheme PUBLISHED May/June 2018 © UCLES 2018 Page 8 of 15 Question Answer Marks 4(b) Explain how two drainage basin characteristics can influence the shape of a storm hydrograph. The drainage basin characteristics can be: • drainage basin size • drainage basin shape • drainage density • nature of soils (porosity and permeability) • rock type • slope / gradient • vegetation type (forested / crops) • land use (urban / agricultural), etc. • climatic characteristics Award marks based on the quality of explanation and breadth of the response using the marking levels below. Level 3 6–8 Response clearly explains how two drainage basin characteristics influence the shape of the storm hydrograph. The link must be made between how a change in the characteristics affects the storm hydrograph (e.g. steeper slopes, reduce the lag time). Response is well founded in detailed knowledge and strong conceptual understanding of the topic. Any examples used are appropriate and integrated effectively into the response. Level 2 3–5 Response explains how at least one characteristic influences the shape of a storm hydrograph. The links between the chosen drainage basin characteristics and the storm hydrograph are not detailed or are unbalanced. Response develops on a largely secure base of knowledge and understanding. Examples may lack detail or development. Level 1 1–2 Response contains some understanding of the links between the chosen drainage basin characteristics and the shape of the storm hydrograph, but the links are lacking in clarity and accuracy. Knowledge is basic and understanding may be inaccurate. Examples are in name only or lacking entirely. Level 0 0 No creditable response. 8
Mark scheme, page 9
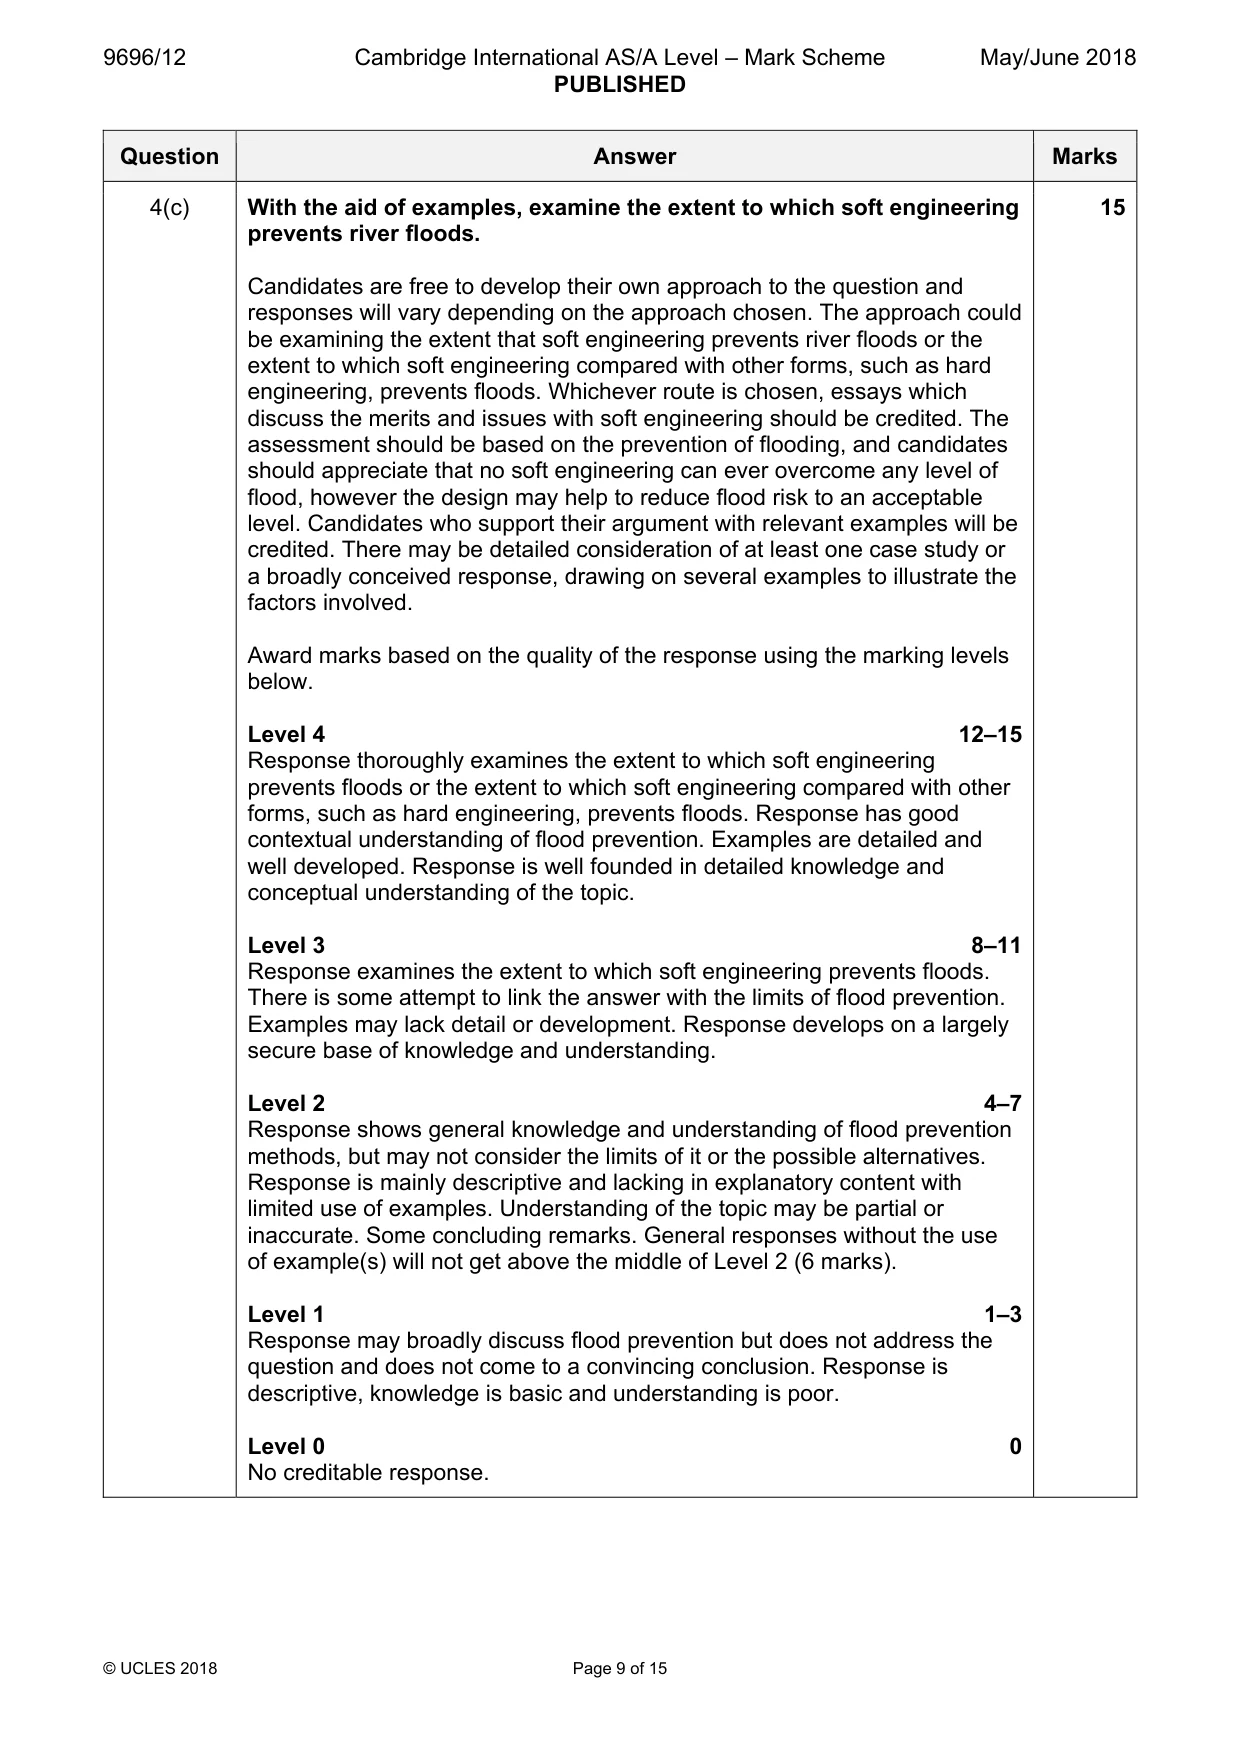
9696/12 Cambridge International AS/A Level – Mark Scheme PUBLISHED May/June 2018 © UCLES 2018 Page 9 of 15 Question Answer Marks 4(c) With the aid of examples, examine the extent to which soft engineering prevents river floods. Candidates are free to develop their own approach to the question and responses will vary depending on the approach chosen. The approach could be examining the extent that soft engineering prevents river floods or the extent to which soft engineering compared with other forms, such as hard engineering, prevents floods. Whichever route is chosen, essays which discuss the merits and issues with soft engineering should be credited. The assessment should be based on the prevention of flooding, and candidates should appreciate that no soft engineering can ever overcome any level of flood, however the design may help to reduce flood risk to an acceptable level. Candidates who support their argument with relevant examples will be credited. There may be detailed consideration of at least one case study or a broadly conceived response, drawing on several examples to illustrate the factors involved. Award marks based on the quality of the response using the marking levels below. Level 4 12–15 Response thoroughly examines the extent to which soft engineering prevents floods or the extent to which soft engineering compared with other forms, such as hard engineering, prevents floods. Response has good contextual understanding of flood prevention. Examples are detailed and well developed. Response is well founded in detailed knowledge and conceptual understanding of the topic. Level 3 8–11 Response examines the extent to which soft engineering prevents floods. There is some attempt to link the answer with the limits of flood prevention. Examples may lack detail or development. Response develops on a largely secure base of knowledge and understanding. Level 2 4–7 Response shows general knowledge and understanding of flood prevention methods, but may not consider the limits of it or the possible alternatives. Response is mainly descriptive and lacking in explanatory content with limited use of examples. Understanding of the topic may be partial or inaccurate. Some concluding remarks. General responses without the use of example(s) will not get above the middle of Level 2 (6 marks). Level 1 1–3 Response may broadly discuss flood prevention but does not address the question and does not come to a convincing conclusion. Response is descriptive, knowledge is basic and understanding is poor. Level 0 0 No creditable response. 15
Mark scheme, page 10
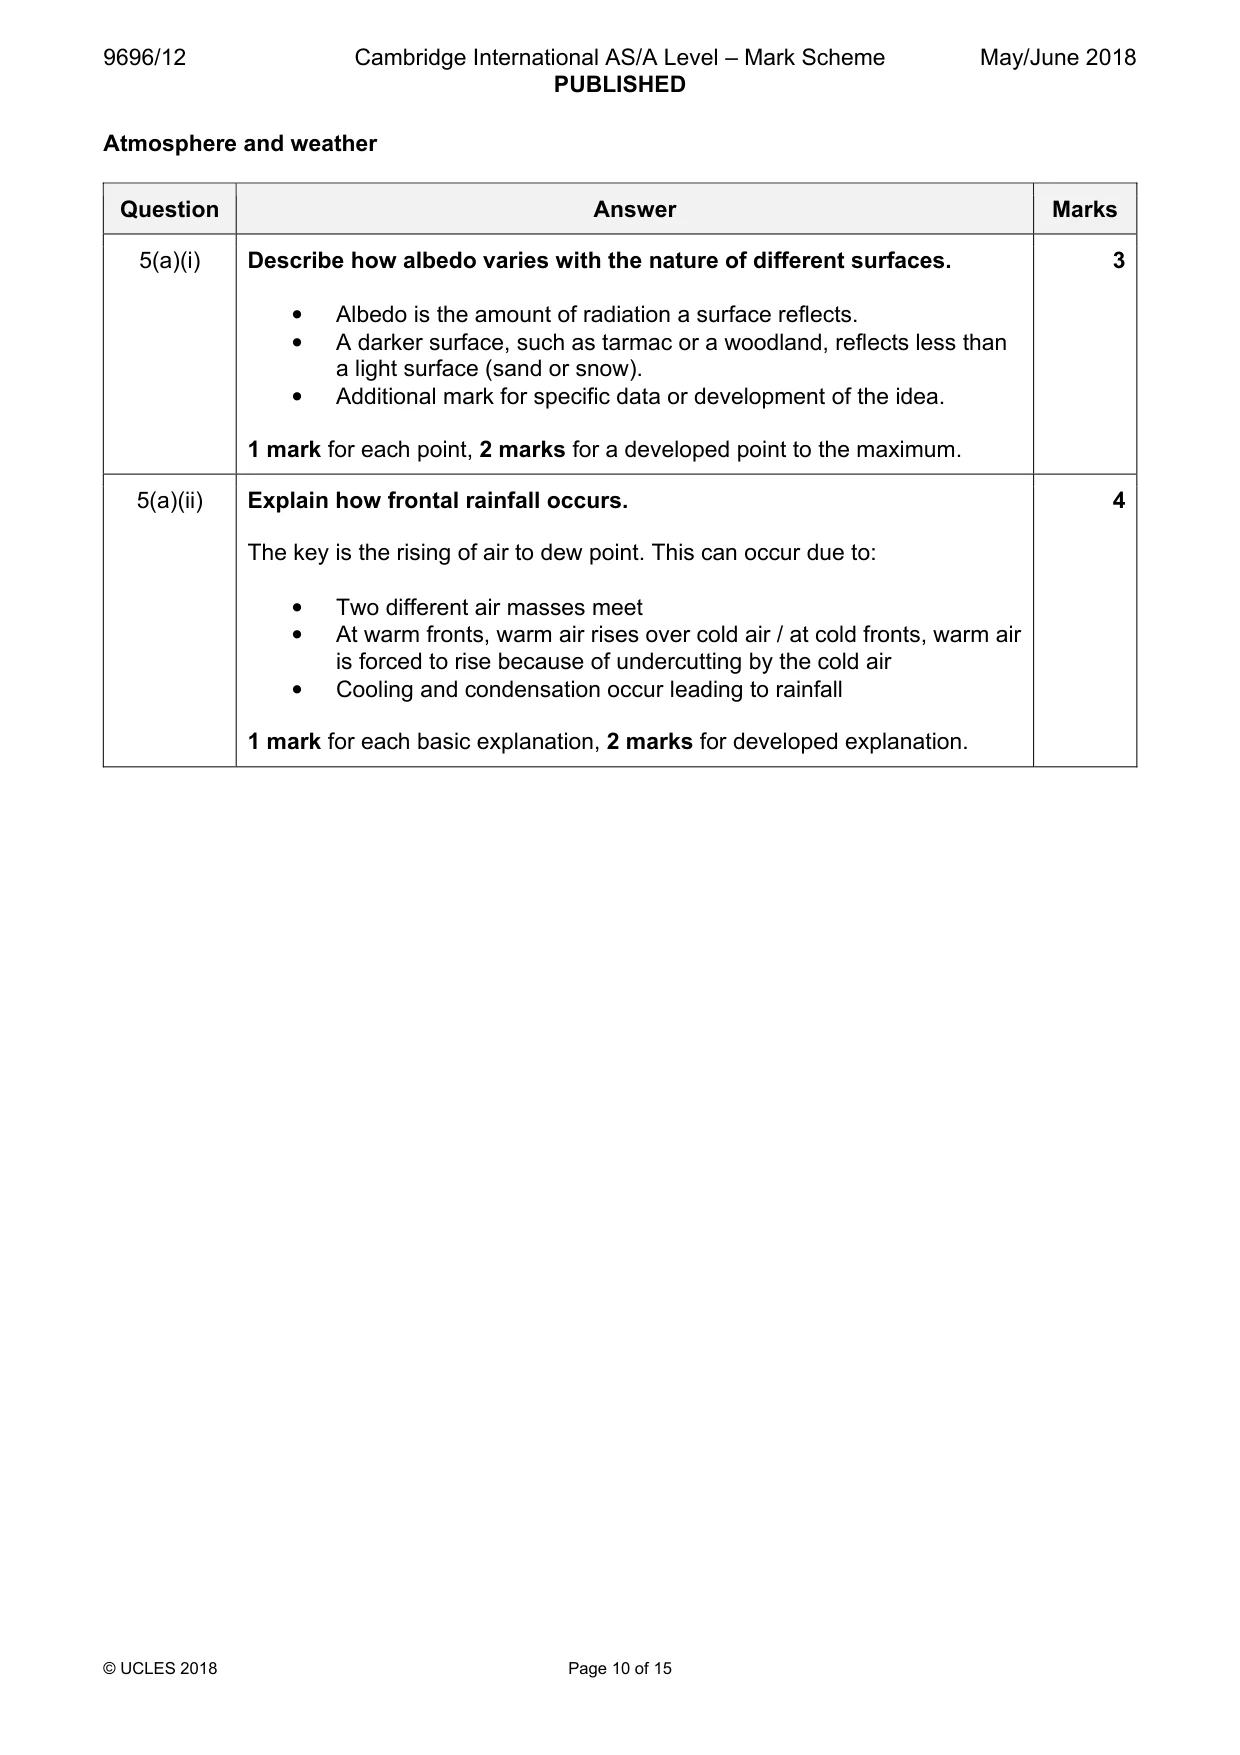
9696/12 Cambridge International AS/A Level – Mark Scheme PUBLISHED May/June 2018 © UCLES 2018 Page 10 of 15 Atmosphere and weather Question Answer Marks 5(a)(i) Describe how albedo varies with the nature of different surfaces. • Albedo is the amount of radiation a surface reflects. • A darker surface, such as tarmac or a woodland, reflects less than a light surface (sand or snow). • Additional mark for specific data or development of the idea. 1 mark for each point, 2 marks for a developed point to the maximum. 3 5(a)(ii) Explain how frontal rainfall occurs. The key is the rising of air to dew point. This can occur due to: • Two different air masses meet • At warm fronts, warm air rises over cold air / at cold fronts, warm air is forced to rise because of undercutting by the cold air • Cooling and condensation occur leading to rainfall 1 mark for each basic explanation, 2 marks for developed explanation. 4
Mark scheme, page 11
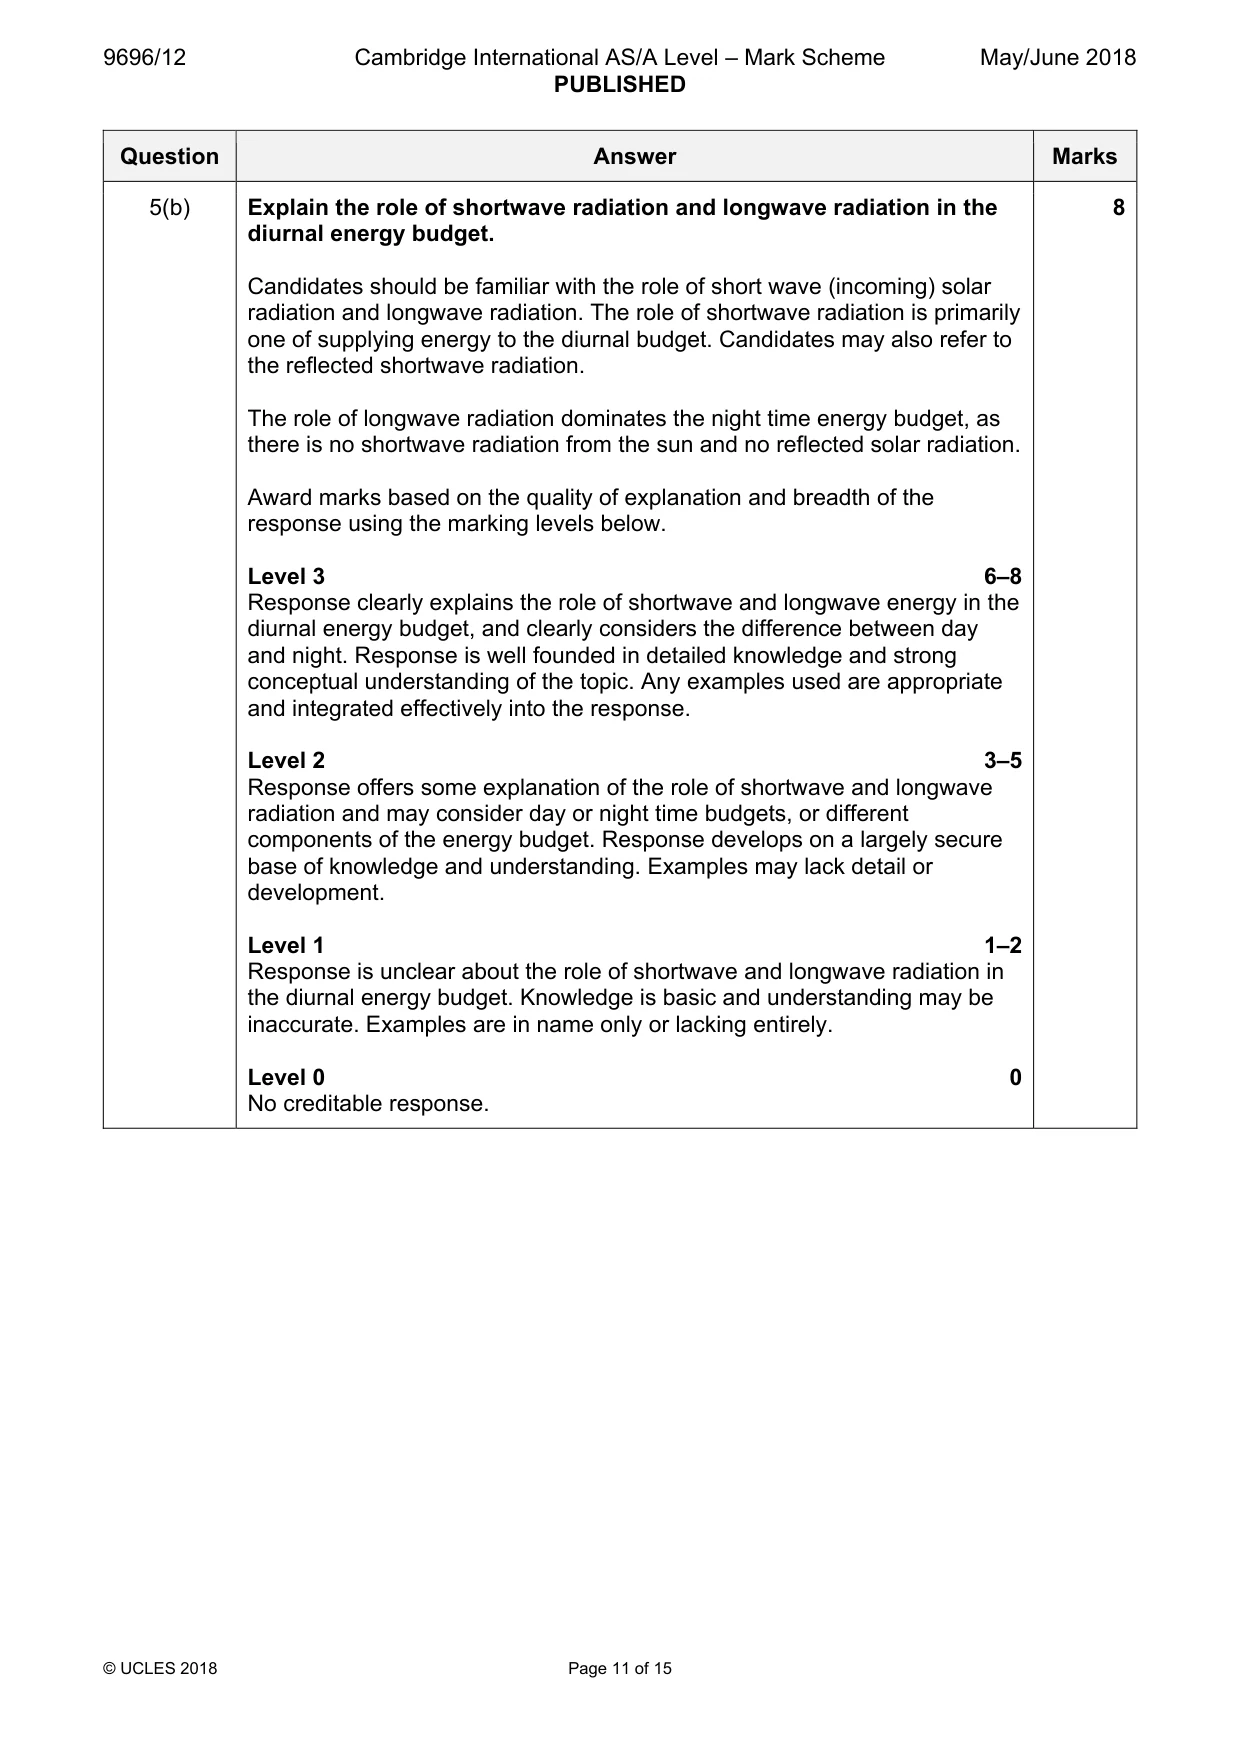
9696/12 Cambridge International AS/A Level – Mark Scheme PUBLISHED May/June 2018 © UCLES 2018 Page 11 of 15 Question Answer Marks 5(b) Explain the role of shortwave radiation and longwave radiation in the diurnal energy budget. Candidates should be familiar with the role of short wave (incoming) solar radiation and longwave radiation. The role of shortwave radiation is primarily one of supplying energy to the diurnal budget. Candidates may also refer to the reflected shortwave radiation. The role of longwave radiation dominates the night time energy budget, as there is no shortwave radiation from the sun and no reflected solar radiation. Award marks based on the quality of explanation and breadth of the response using the marking levels below. Level 3 6–8 Response clearly explains the role of shortwave and longwave energy in the diurnal energy budget, and clearly considers the difference between day and night. Response is well founded in detailed knowledge and strong conceptual understanding of the topic. Any examples used are appropriate and integrated effectively into the response. Level 2 3–5 Response offers some explanation of the role of shortwave and longwave radiation and may consider day or night time budgets, or different components of the energy budget. Response develops on a largely secure base of knowledge and understanding. Examples may lack detail or development. Level 1 1–2 Response is unclear about the role of shortwave and longwave radiation in the diurnal energy budget. Knowledge is basic and understanding may be inaccurate. Examples are in name only or lacking entirely. Level 0 0 No creditable response. 8
Mark scheme, page 12
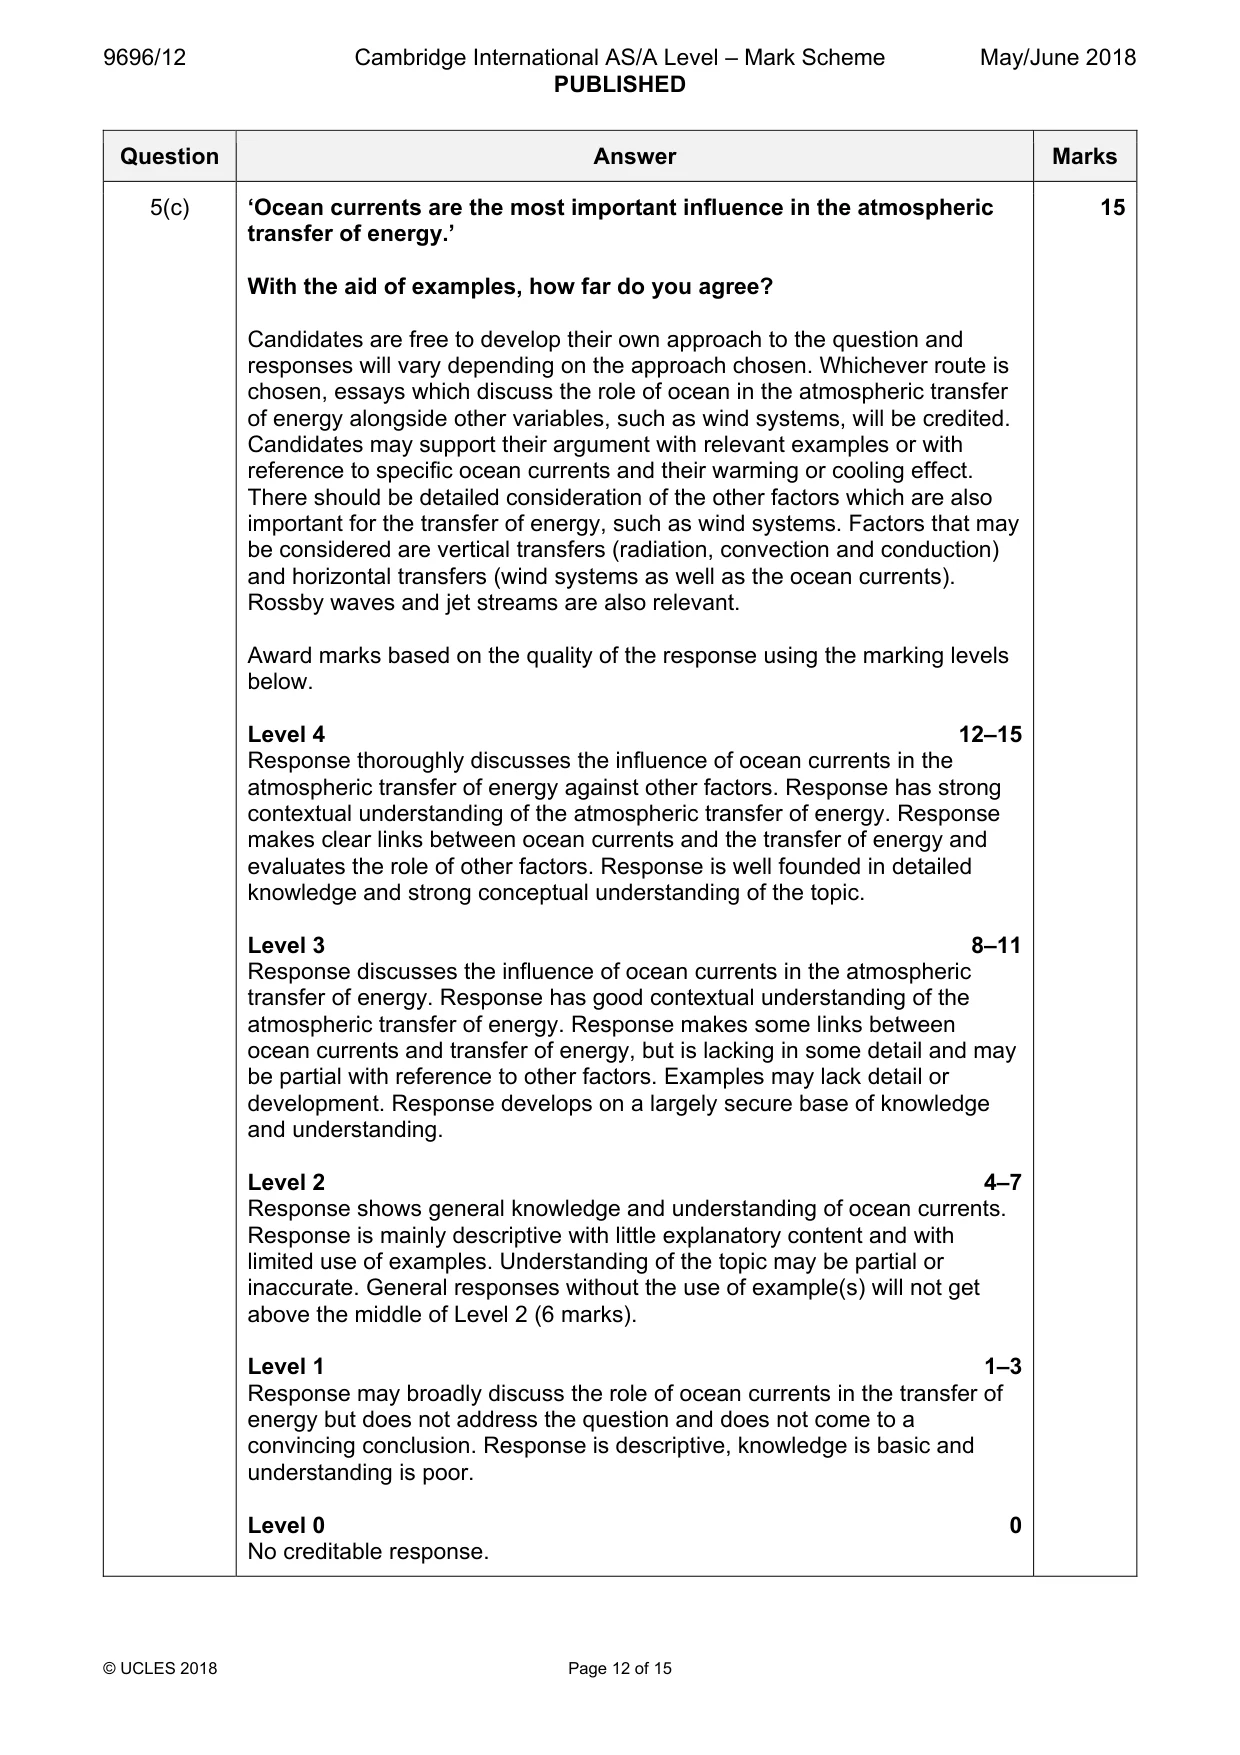
9696/12 Cambridge International AS/A Level – Mark Scheme PUBLISHED May/June 2018 © UCLES 2018 Page 12 of 15 Question Answer Marks 5(c) ‘Ocean currents are the most important influence in the atmospheric transfer of energy.’ With the aid of examples, how far do you agree? Candidates are free to develop their own approach to the question and responses will vary depending on the approach chosen. Whichever route is chosen, essays which discuss the role of ocean in the atmospheric transfer of energy alongside other variables, such as wind systems, will be credited. Candidates may support their argument with relevant examples or with reference to specific ocean currents and their warming or cooling effect. There should be detailed consideration of the other factors which are also important for the transfer of energy, such as wind systems. Factors that may be considered are vertical transfers (radiation, convection and conduction) and horizontal transfers (wind systems as well as the ocean currents). Rossby waves and jet streams are also relevant. Award marks based on the quality of the response using the marking levels below. Level 4 12–15 Response thoroughly discusses the influence of ocean currents in the atmospheric transfer of energy against other factors. Response has strong contextual understanding of the atmospheric transfer of energy. Response makes clear links between ocean currents and the transfer of energy and evaluates the role of other factors. Response is well founded in detailed knowledge and strong conceptual understanding of the topic. Level 3 8–11 Response discusses the influence of ocean currents in the atmospheric transfer of energy. Response has good contextual understanding of the atmospheric transfer of energy. Response makes some links between ocean currents and transfer of energy, but is lacking in some detail and may be partial with reference to other factors. Examples may lack detail or development. Response develops on a largely secure base of knowledge and understanding. Level 2 4–7 Response shows general knowledge and understanding of ocean currents. Response is mainly descriptive with little explanatory content and with limited use of examples. Understanding of the topic may be partial or inaccurate. General responses without the use of example(s) will not get above the middle of Level 2 (6 marks). Level 1 1–3 Response may broadly discuss the role of ocean currents in the transfer of energy but does not address the question and does not come to a convincing conclusion. Response is descriptive, knowledge is basic and understanding is poor. Level 0 0 No creditable response. 15
Mark scheme, page 13
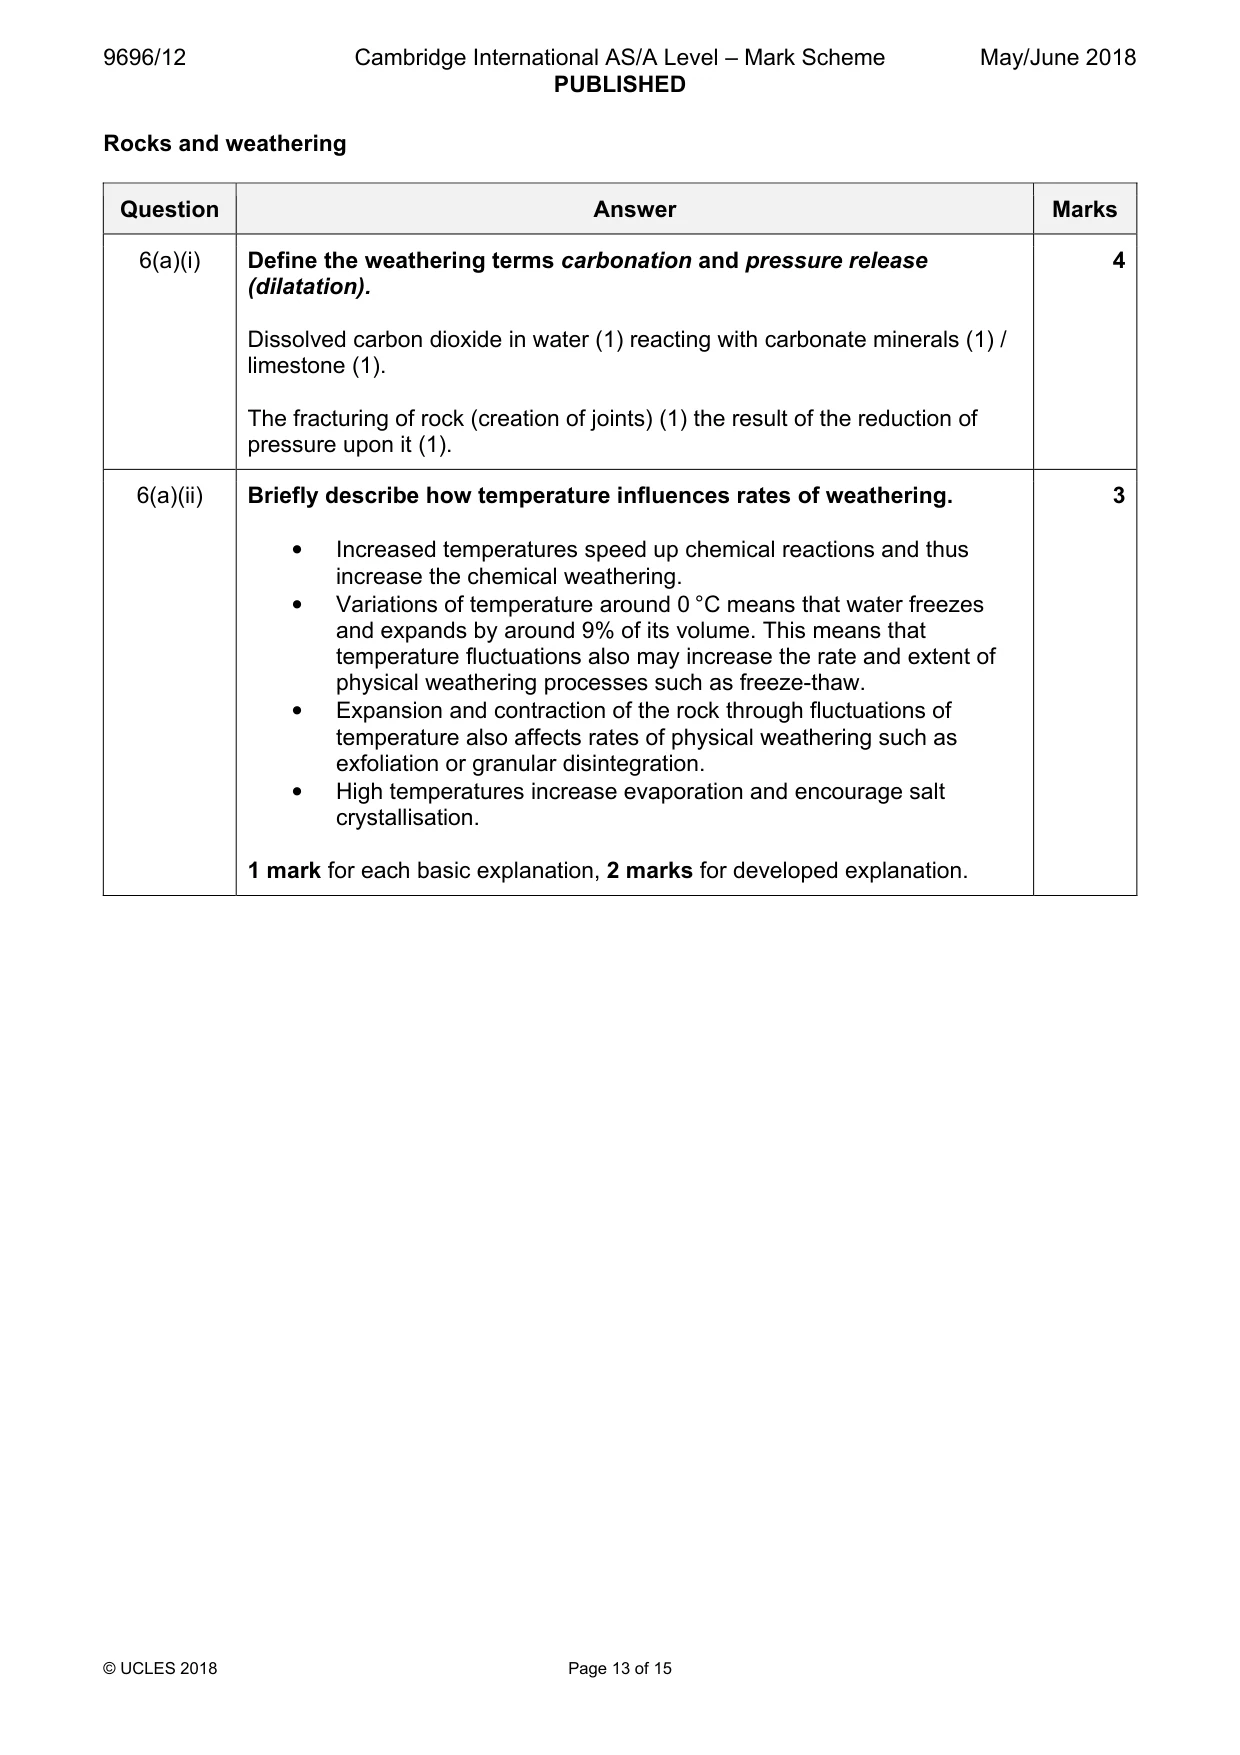
9696/12 Cambridge International AS/A Level – Mark Scheme PUBLISHED May/June 2018 © UCLES 2018 Page 13 of 15 Rocks and weathering Question Answer Marks 6(a)(i) Define the weathering terms carbonation and pressure release (dilatation). Dissolved carbon dioxide in water (1) reacting with carbonate minerals (1) / limestone (1). The fracturing of rock (creation of joints) (1) the result of the reduction of pressure upon it (1). 4 6(a)(ii) Briefly describe how temperature influences rates of weathering. • Increased temperatures speed up chemical reactions and thus increase the chemical weathering. • Variations of temperature around 0 °C means that water freezes and expands by around 9% of its volume. This means that temperature fluctuations also may increase the rate and extent of physical weathering processes such as freeze-thaw. • Expansion and contraction of the rock through fluctuations of temperature also affects rates of physical weathering such as exfoliation or granular disintegration. • High temperatures increase evaporation and encourage salt crystallisation. 1 mark for each basic explanation, 2 marks for developed explanation. 3
Mark scheme, page 14
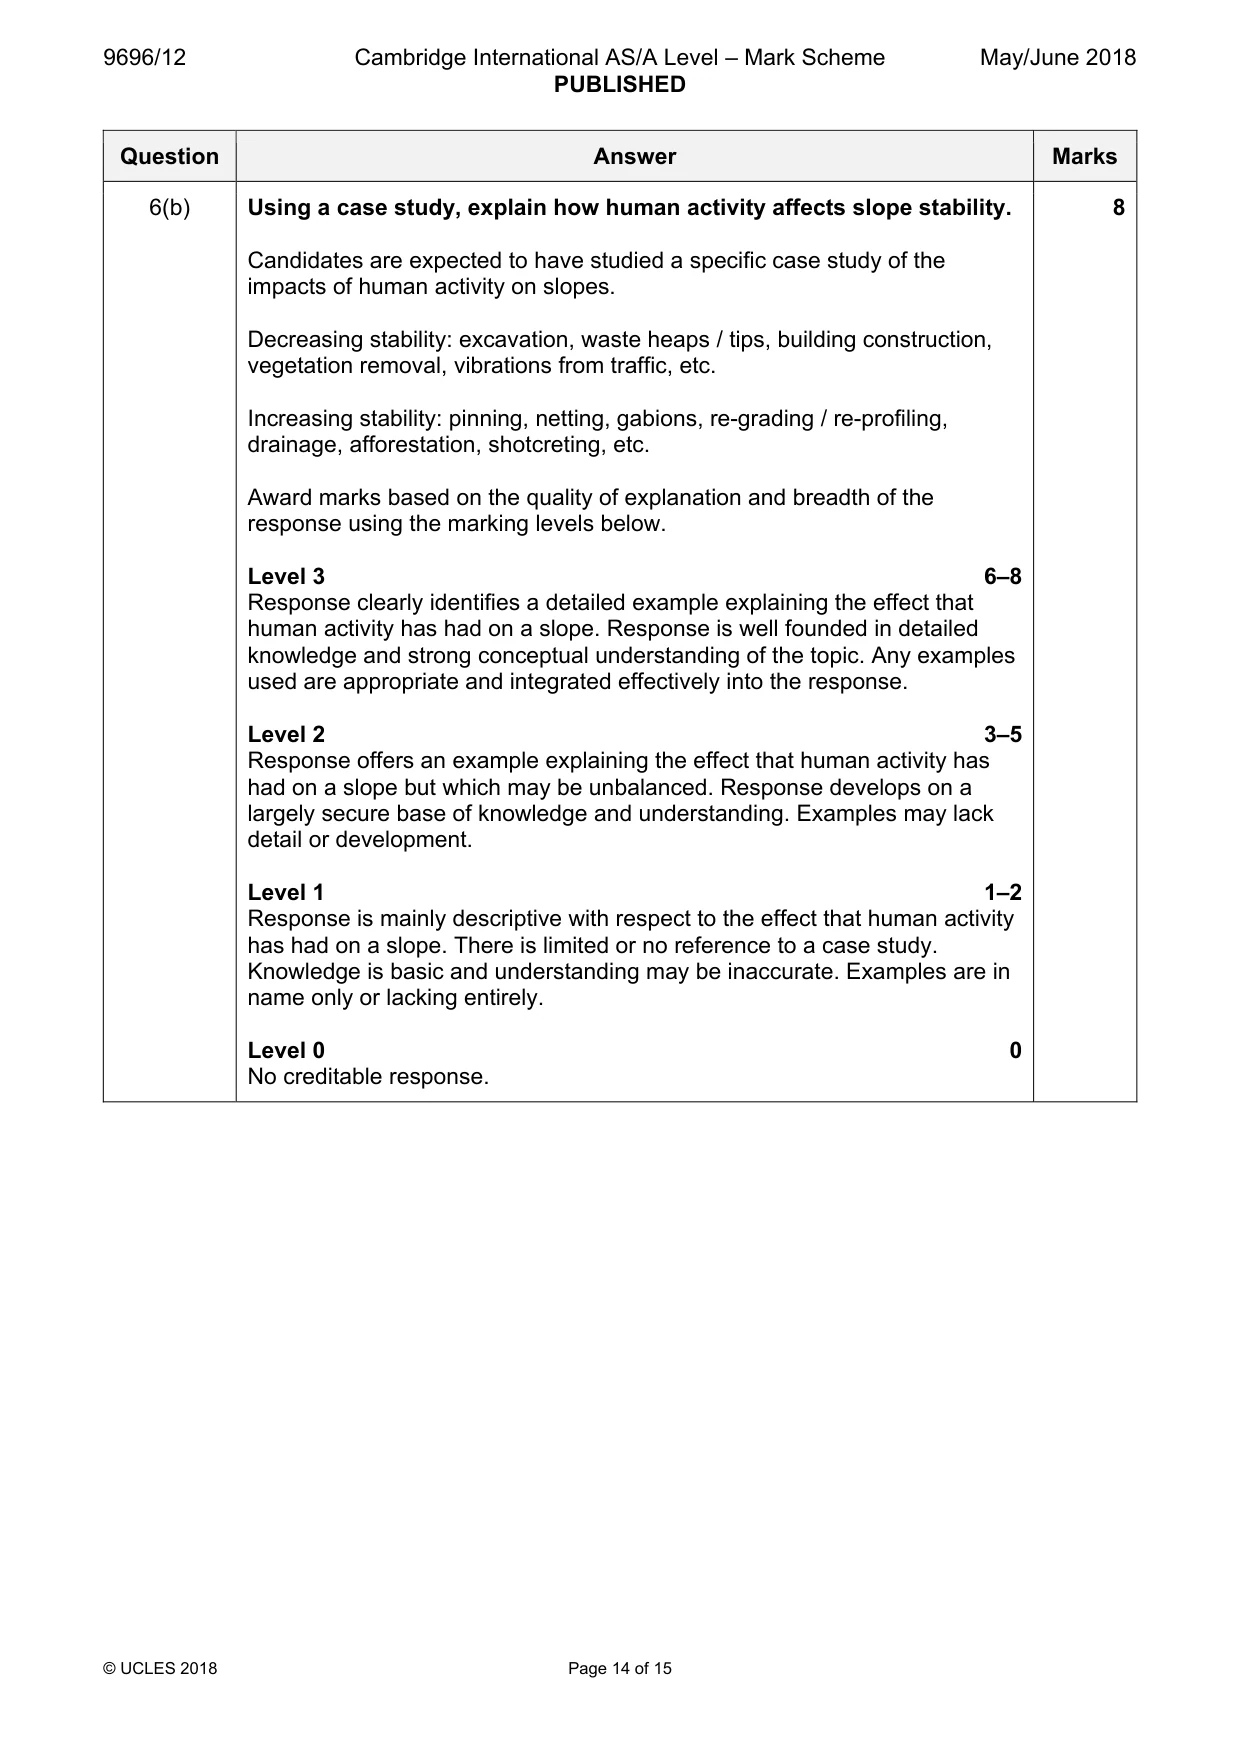
9696/12 Cambridge International AS/A Level – Mark Scheme PUBLISHED May/June 2018 © UCLES 2018 Page 14 of 15 Question Answer Marks 6(b) Using a case study, explain how human activity affects slope stability. Candidates are expected to have studied a specific case study of the impacts of human activity on slopes. Decreasing stability: excavation, waste heaps / tips, building construction, vegetation removal, vibrations from traffic, etc. Increasing stability: pinning, netting, gabions, re-grading / re-profiling, drainage, afforestation, shotcreting, etc. Award marks based on the quality of explanation and breadth of the response using the marking levels below. Level 3 6–8 Response clearly identifies a detailed example explaining the effect that human activity has had on a slope. Response is well founded in detailed knowledge and strong conceptual understanding of the topic. Any examples used are appropriate and integrated effectively into the response. Level 2 3–5 Response offers an example explaining the effect that human activity has had on a slope but which may be unbalanced. Response develops on a largely secure base of knowledge and understanding. Examples may lack detail or development. Level 1 1–2 Response is mainly descriptive with respect to the effect that human activity has had on a slope. There is limited or no reference to a case study. Knowledge is basic and understanding may be inaccurate. Examples are in name only or lacking entirely. Level 0 0 No creditable response. 8
Mark scheme, page 15
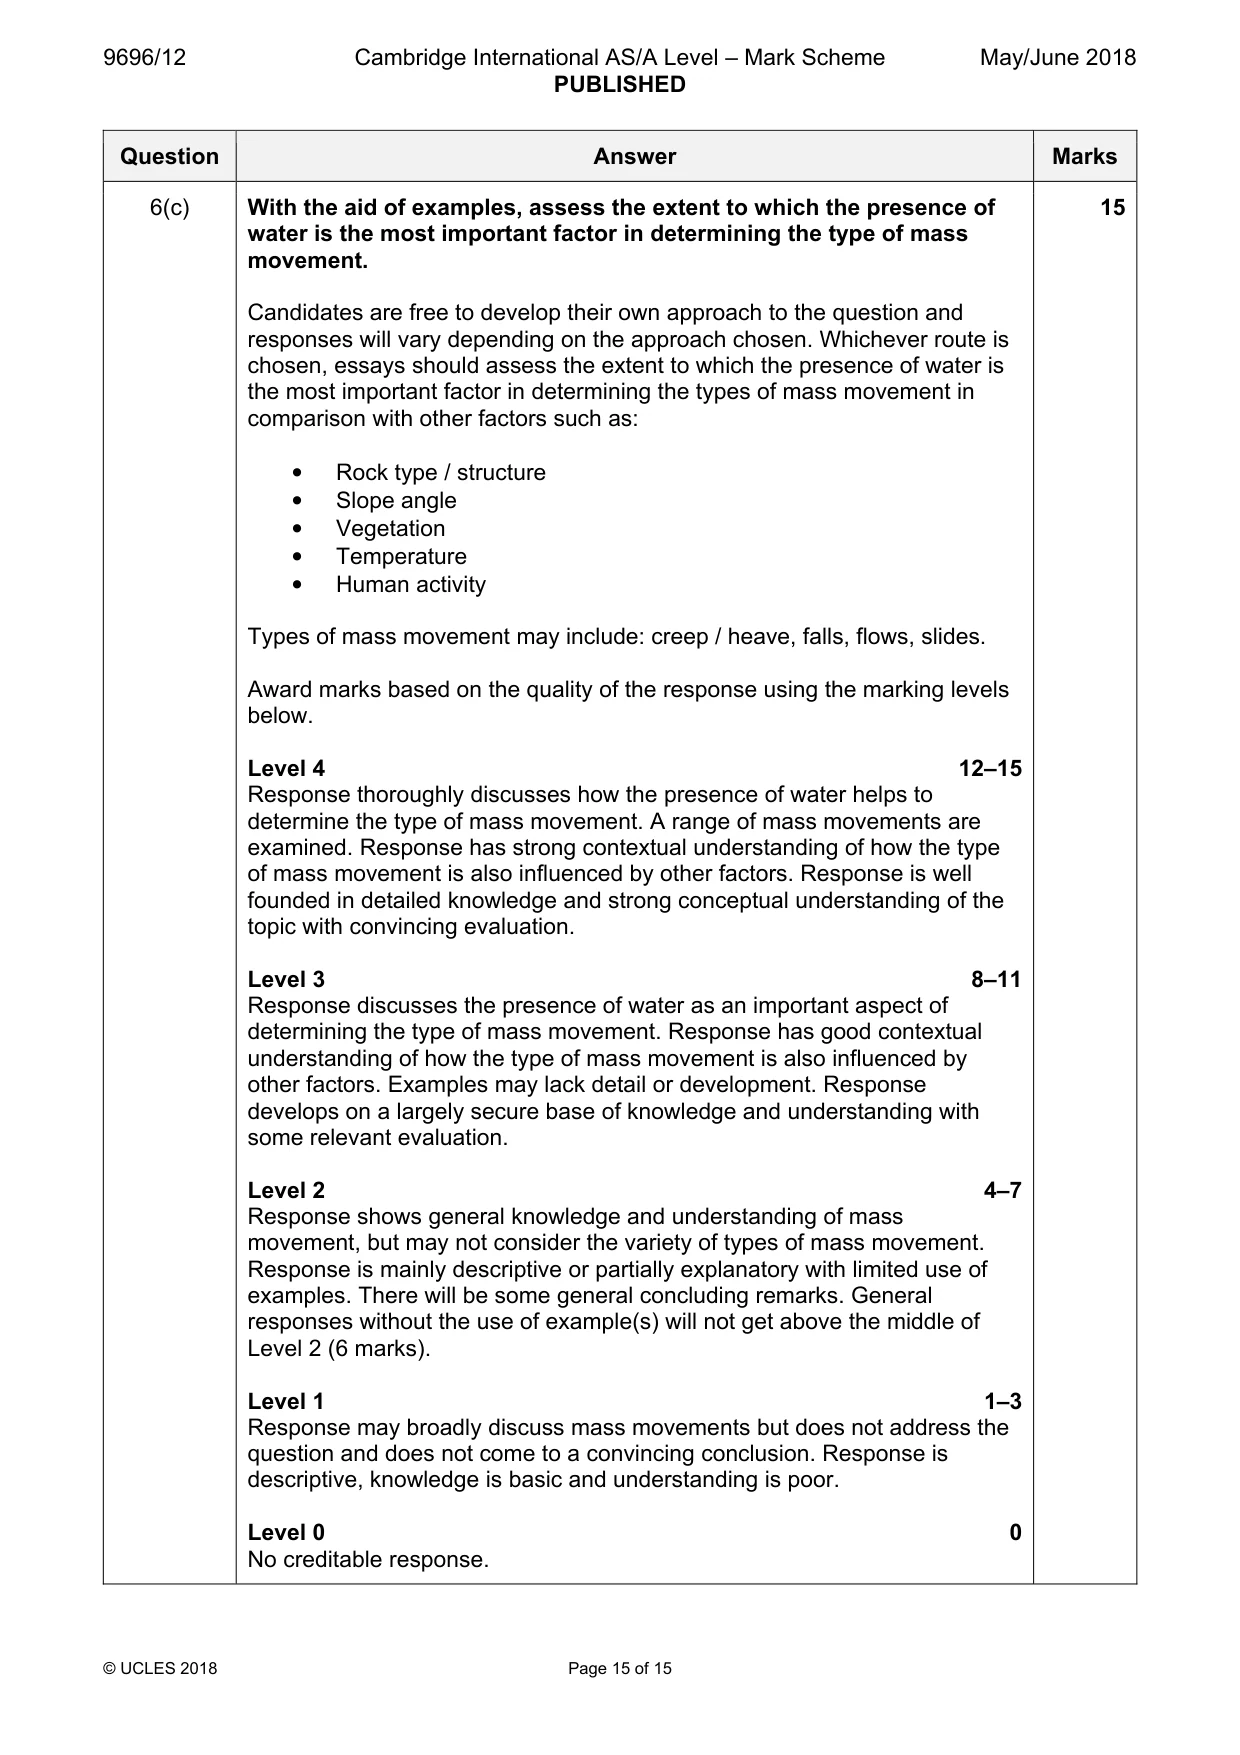
9696/12 Cambridge International AS/A Level – Mark Scheme PUBLISHED May/June 2018 © UCLES 2018 Page 15 of 15 Question Answer Marks 6(c) With the aid of examples, assess the extent to which the presence of water is the most important factor in determining the type of mass movement. Candidates are free to develop their own approach to the question and responses will vary depending on the approach chosen. Whichever route is chosen, essays should assess the extent to which the presence of water is the most important factor in determining the types of mass movement in comparison with other factors such as: • Rock type / structure • Slope angle • Vegetation • Temperature • Human activity Types of mass movement may include: creep / heave, falls, flows, slides. Award marks based on the quality of the response using the marking levels below. Level 4 12–15 Response thoroughly discusses how the presence of water helps to determine the type of mass movement. A range of mass movements are examined. Response has strong contextual understanding of how the type of mass movement is also influenced by other factors. Response is well founded in detailed knowledge and strong conceptual understanding of the topic with convincing evaluation. Level 3 8–11 Response discusses the presence of water as an important aspect of determining the type of mass movement. Response has good contextual understanding of how the type of mass movement is also influenced by other factors. Examples may lack detail or development. Response develops on a largely secure base of knowledge and understanding with some relevant evaluation. Level 2 4–7 Response shows general knowledge and understanding of mass movement, but may not consider the variety of types of mass movement. Response is mainly descriptive or partially explanatory with limited use of examples. There will be some general concluding remarks. General responses without the use of example(s) will not get above the middle of Level 2 (6 marks). Level 1 1–3 Response may broadly discuss mass movements but does not address the question and does not come to a convincing conclusion. Response is descriptive, knowledge is basic and understanding is poor. Level 0 0 No creditable response. 15
What you needed in this session
Cambridge’s own grade thresholds for 2018 May/June, Paper 1 · Variant 2. A higher threshold means an easier paper — the bar moves with how the cohort did.