Cambridge A Level Geography 9696 — 2017 Oct/Nov Paper 1 · Variant 1
9696/11/O/N/17 · 100 marks · ≈113 min
The question paper and its mark scheme, free to read here and free to download. This is Cambridge’s own paper, exactly as it was sat.
Question paper8 pages




Mark scheme17 pages
Answers below. Sit the paper first if you are practising.

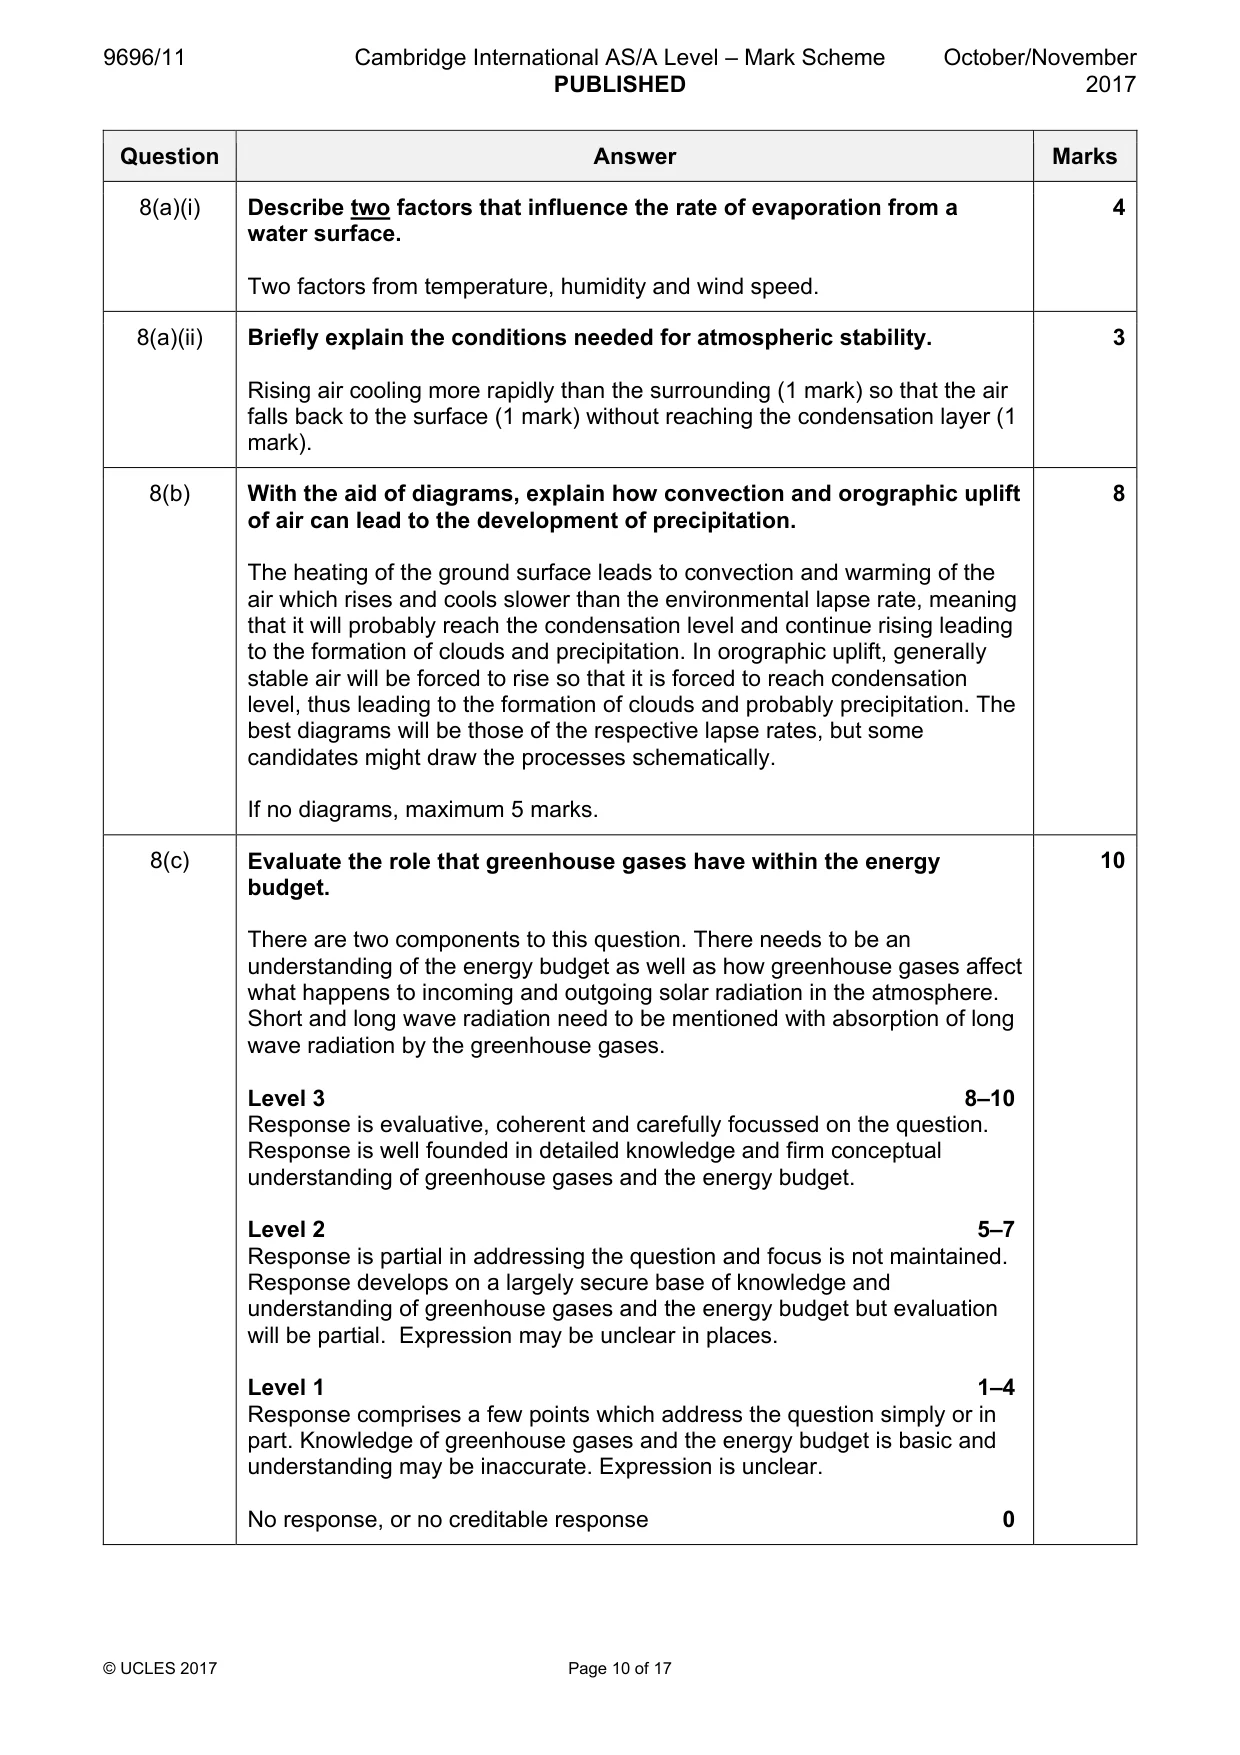
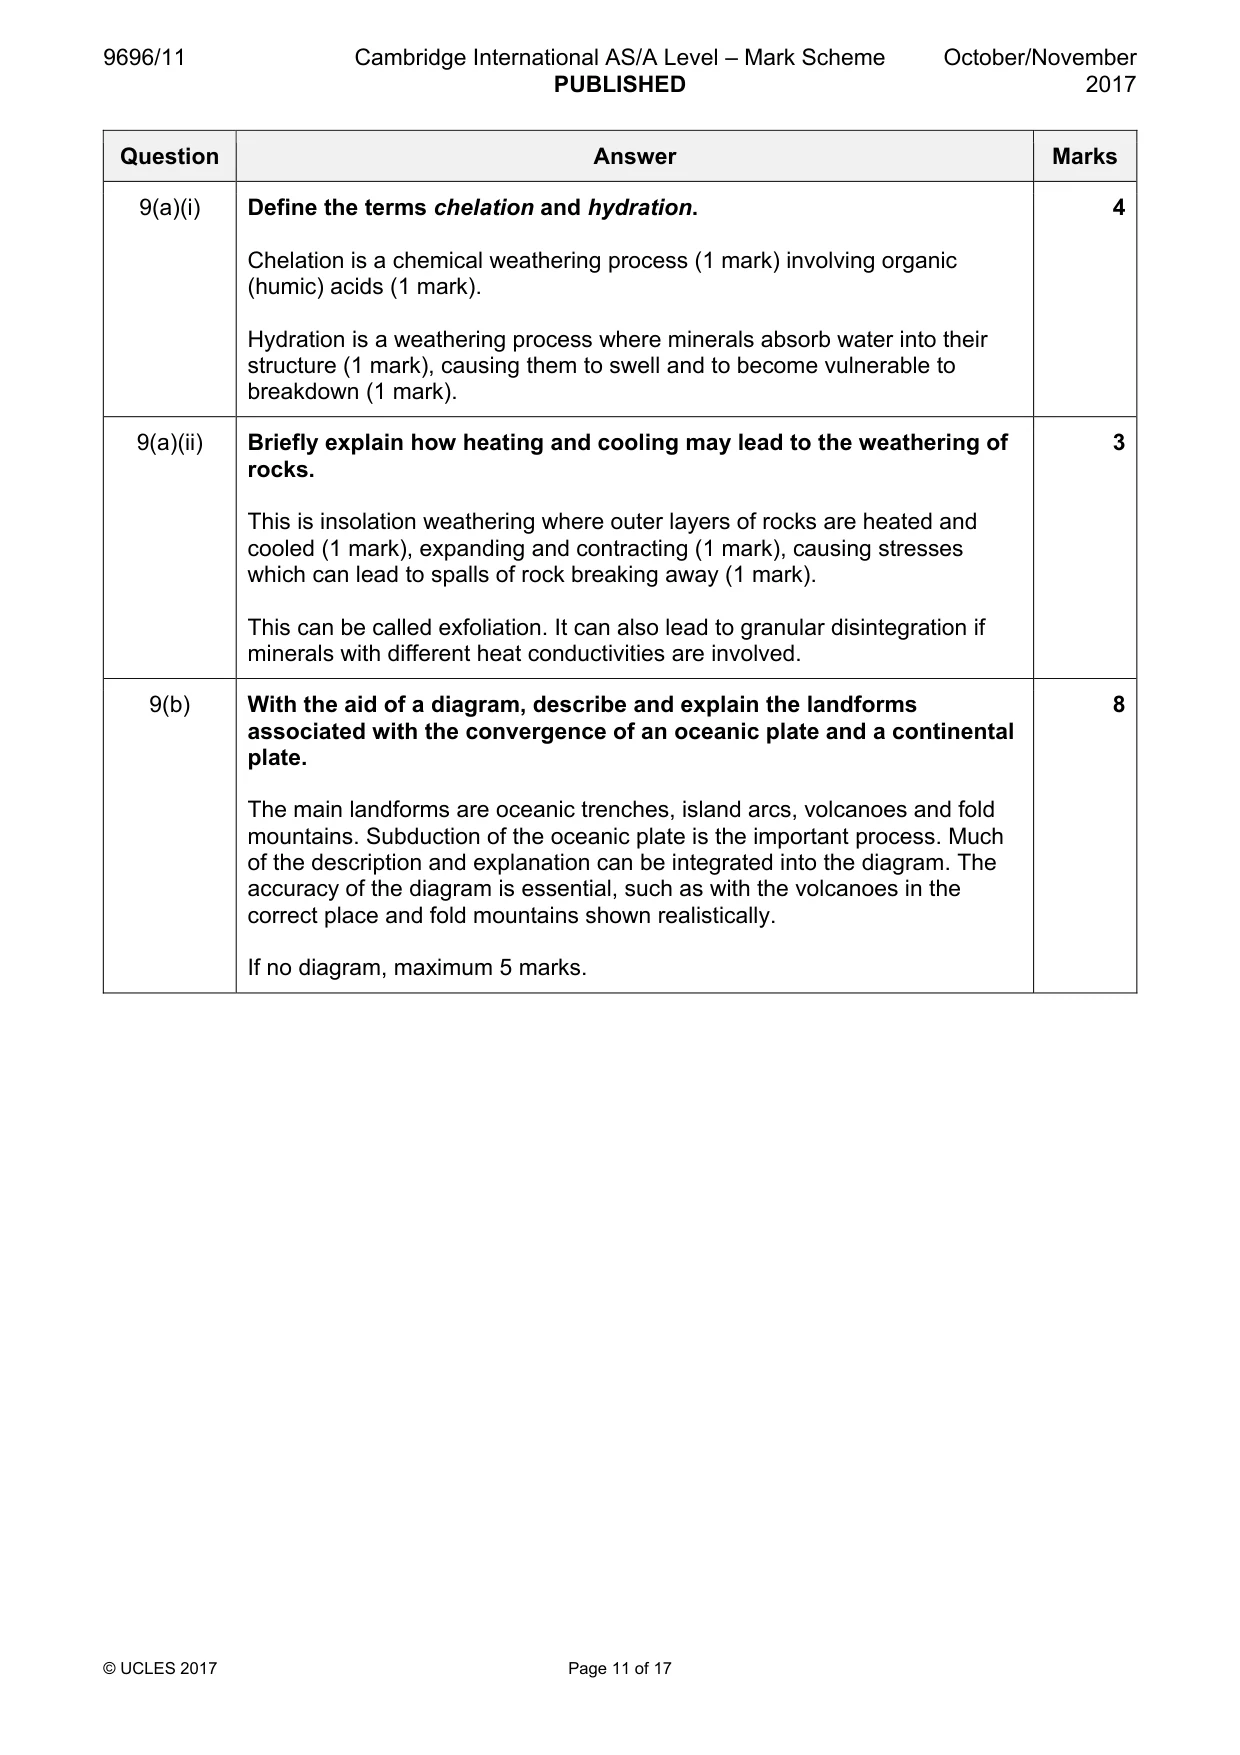
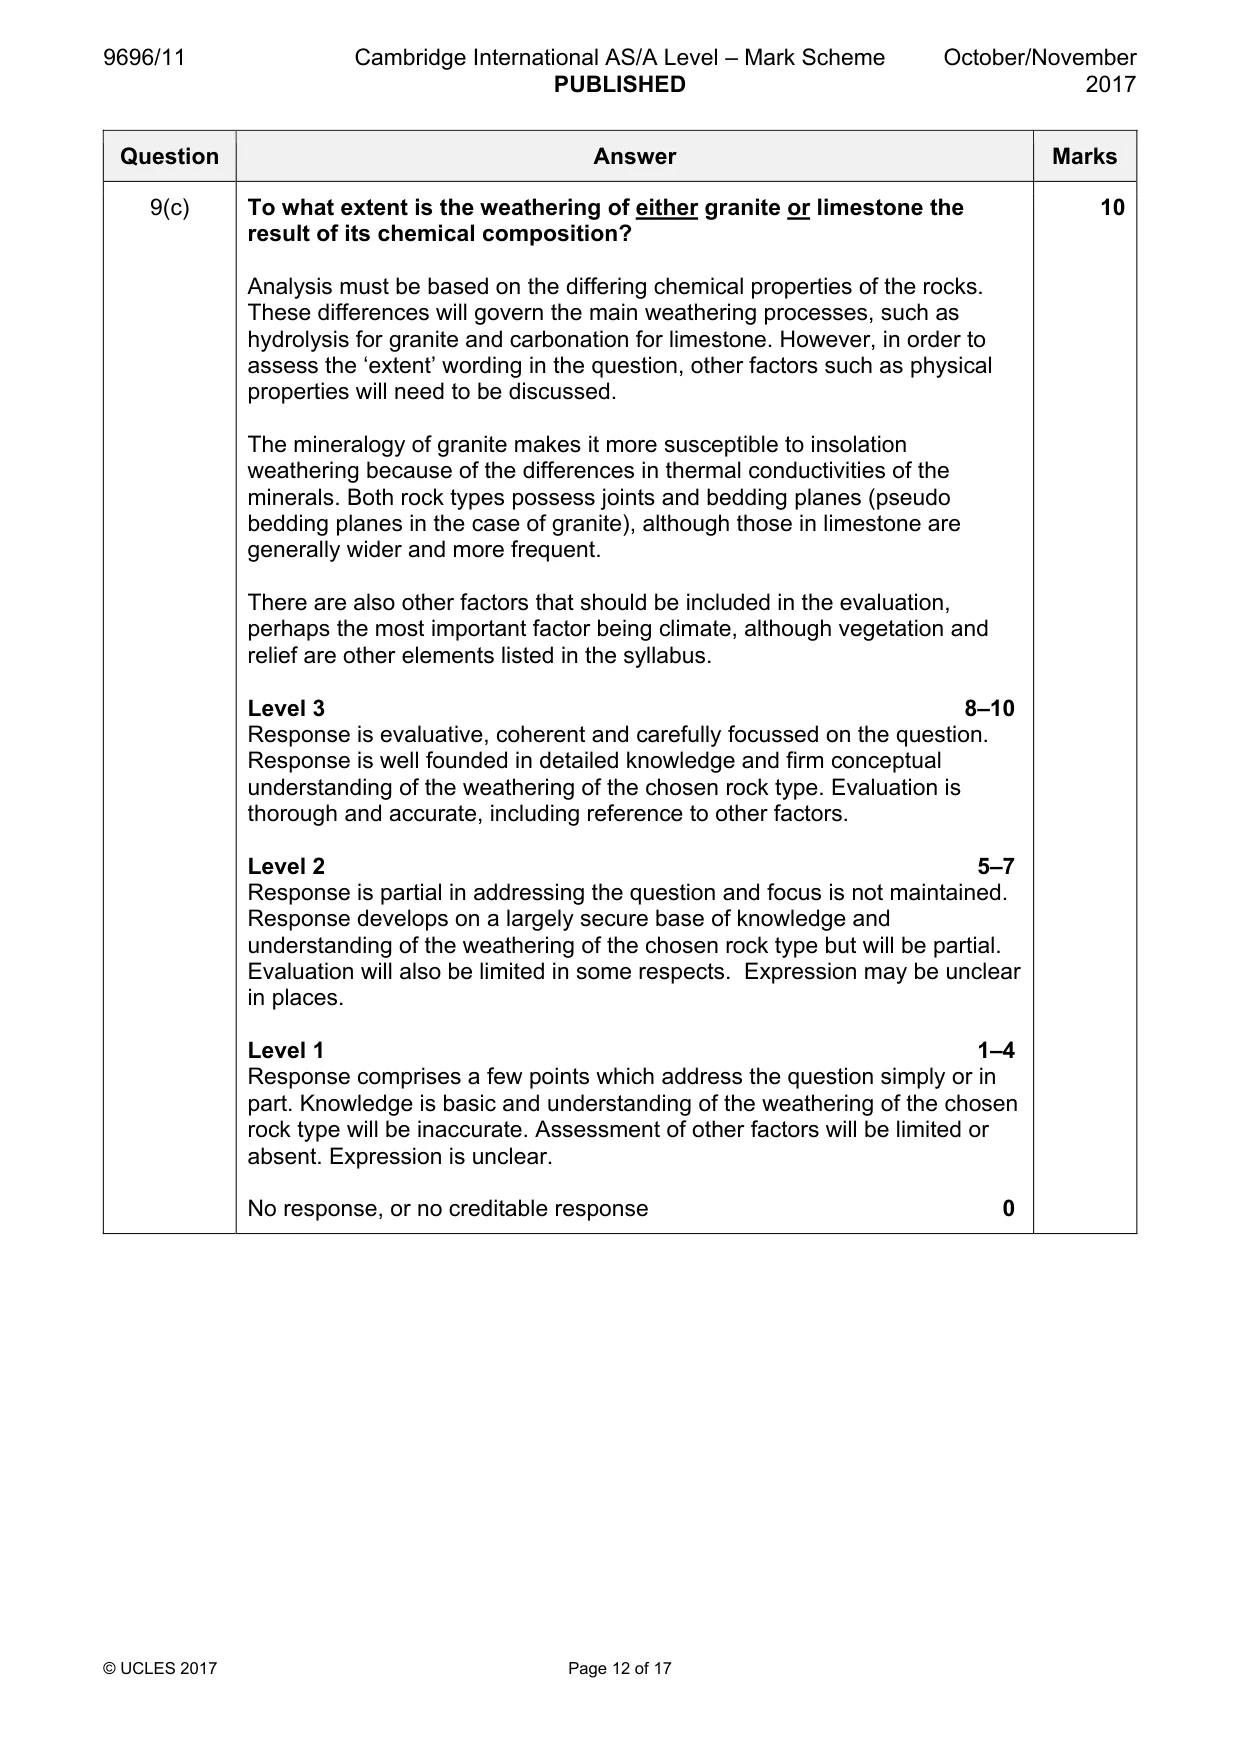
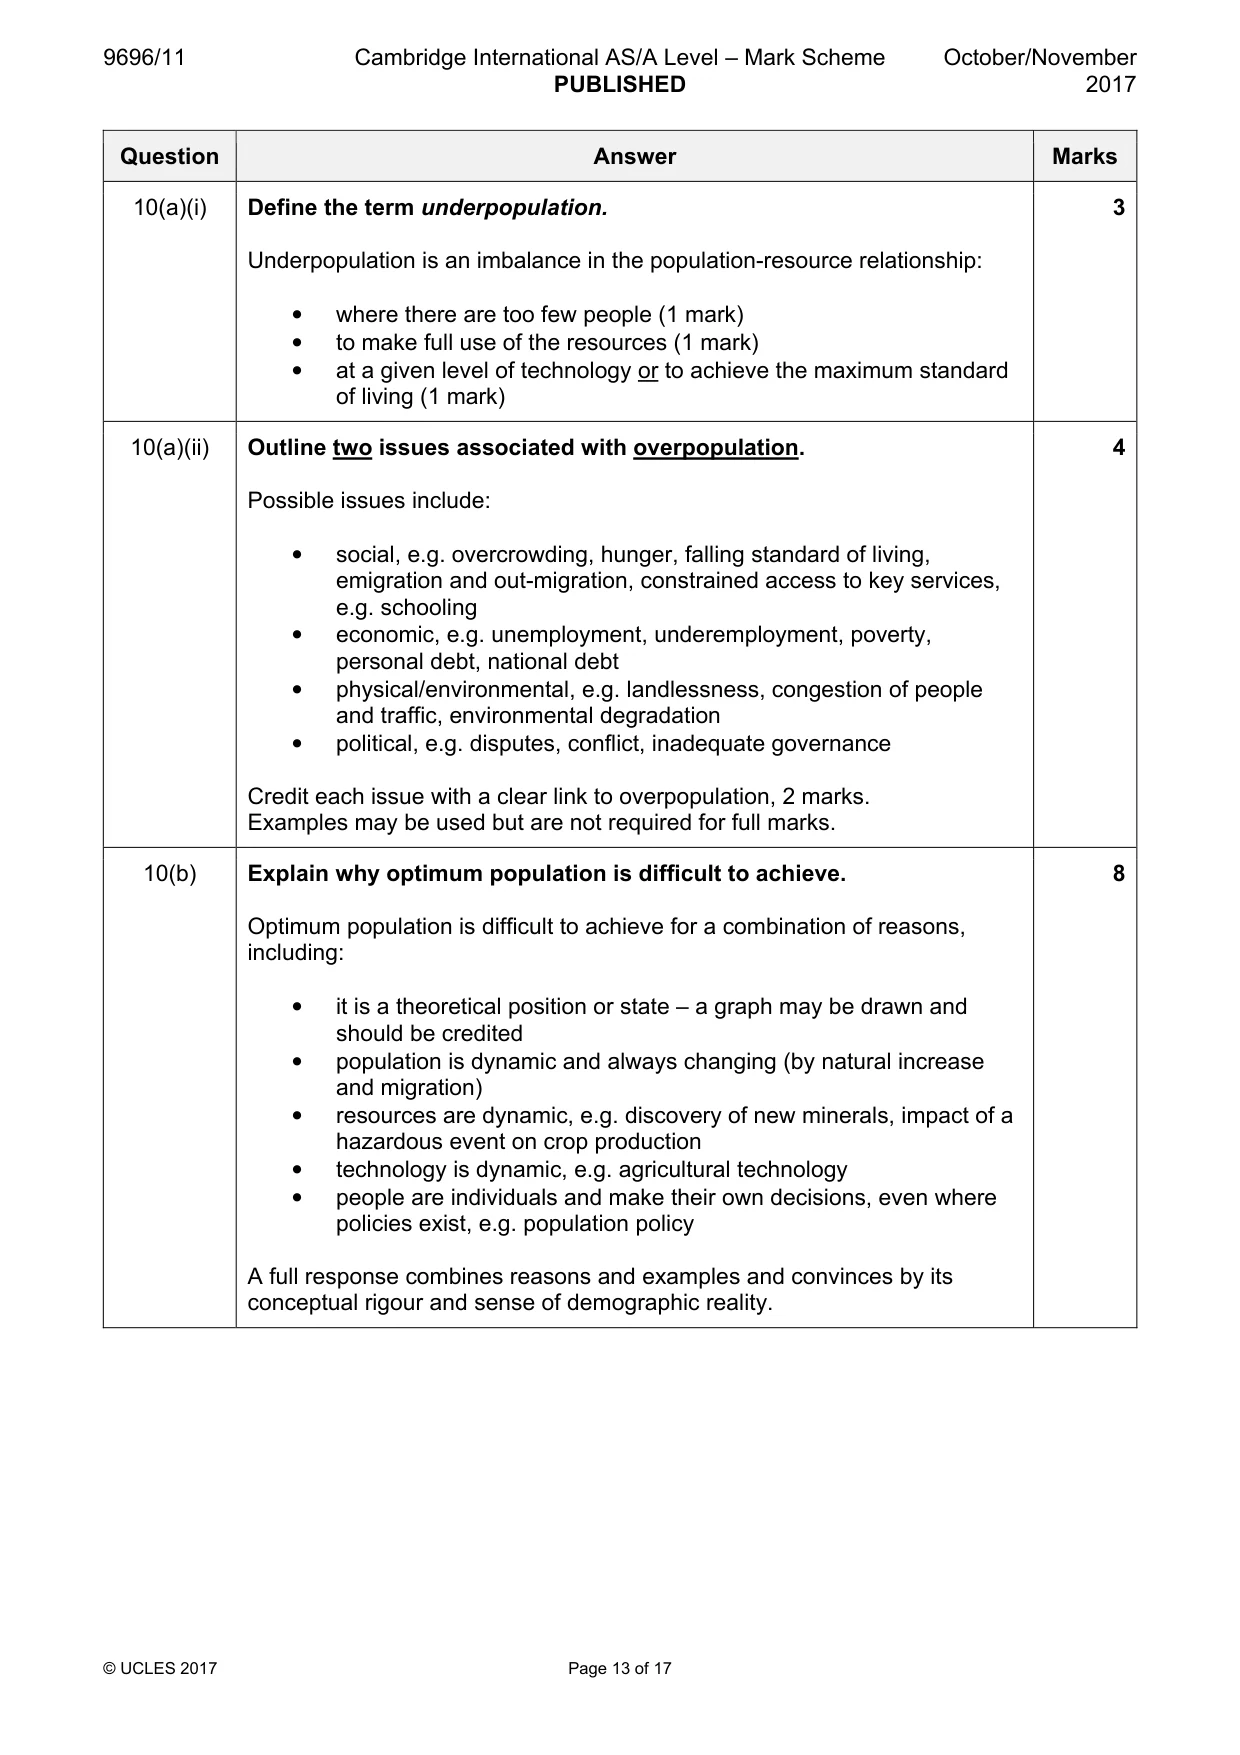
Paper as text
Question paper, page 1
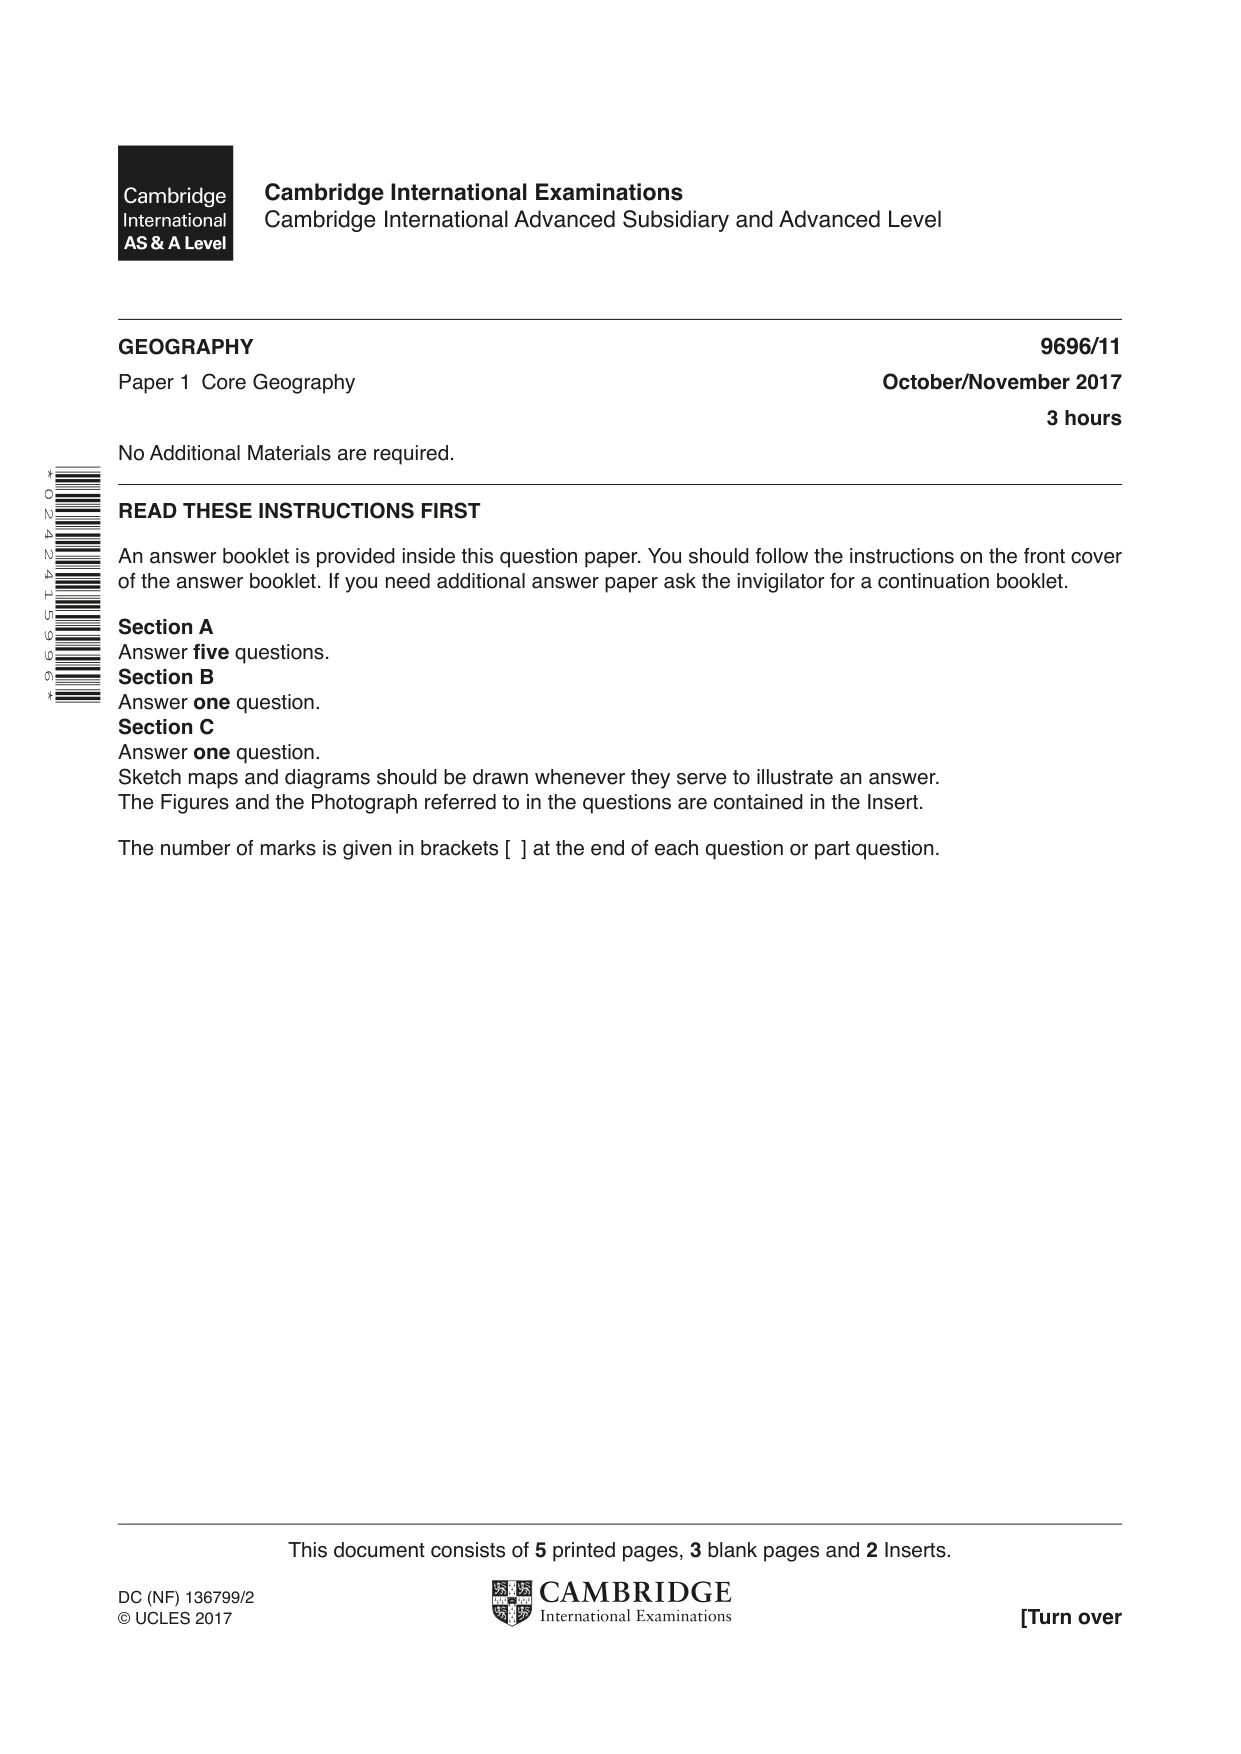
* 0 2 4 2 4 1 5 9 9 6 * This document consists of 5 printed pages, 3 blank pages and 2 Inserts. DC (NF) 136799/2 © UCLES 2017 [Turn over Cambridge International Examinations Cambridge International Advanced Subsidiary and Advanced Level GEOGRAPHY 9696/11 Paper 1 Core Geography October/November 2017 3 hours No Additional Materials are required. READ THESE INSTRUCTIONS FIRST An answer booklet is provided inside this question paper. You should follow the instructions on the front cover of the answer booklet. If you need additional answer paper ask the invigilator for a continuation booklet. Section A Answer five questions. Section B Answer one question. Section C Answer one question. Sketch maps and diagrams should be drawn whenever they serve to illustrate an answer. The Figures and the Photograph referred to in the questions are contained in the Insert. The number of marks is given in brackets [ ] at the end of each question or part question.
Question paper, page 2
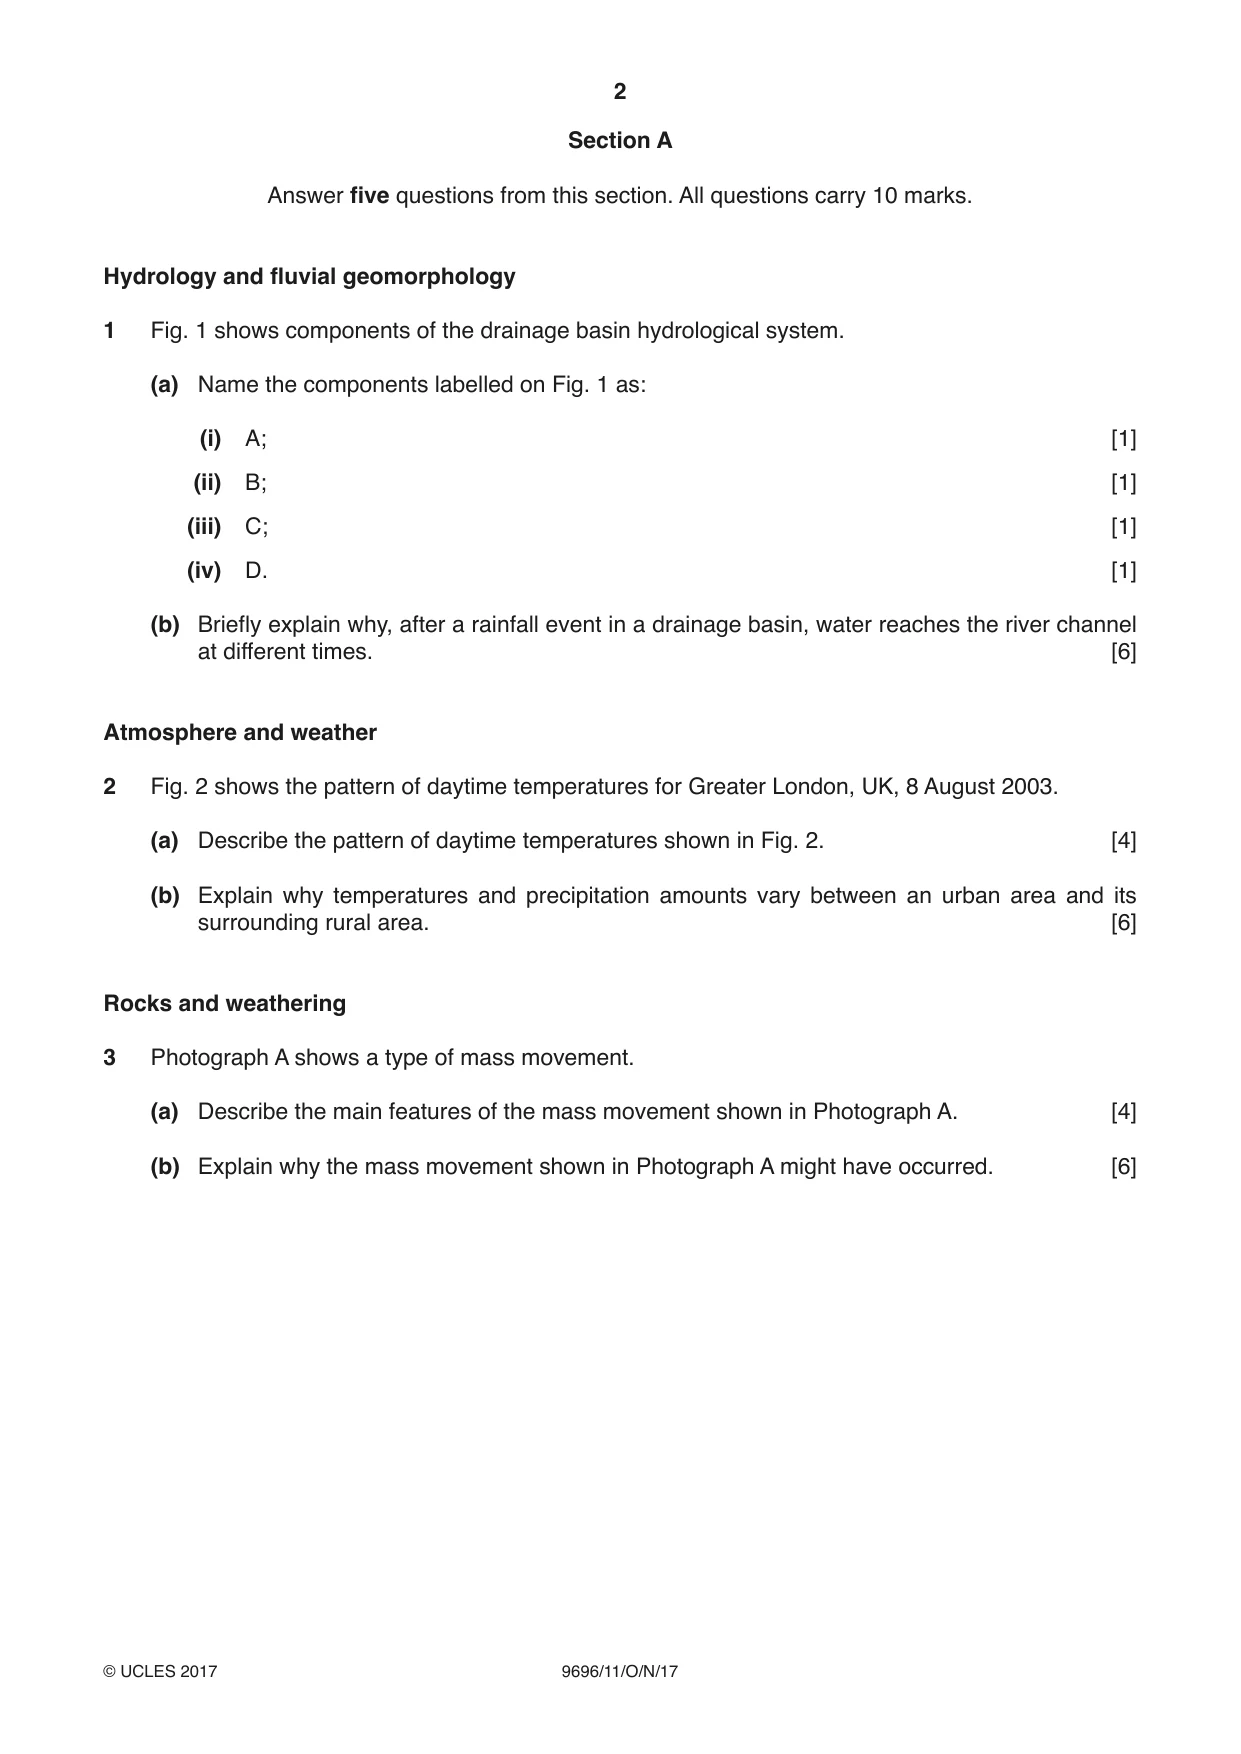
2 9696/11/O/N/17 © UCLES 2017 Section A Answer five questions from this section. All questions carry 10 marks. Hydrology and fluvial geomorphology 1 Fig. 1 shows components of the drainage basin hydrological system. (a) Name the components labelled on Fig. 1 as: (i) A; [1] (ii) B; [1] (iii) C; [1] (iv) D. [1] (b) Briefly explain why, after a rainfall event in a drainage basin, water reaches the river channel at different times. [6] Atmosphere and weather 2 Fig. 2 shows the pattern of daytime temperatures for Greater London, UK, 8 August 2003. (a) Describe the pattern of daytime temperatures shown in Fig. 2. [4] (b) Explain why temperatures and precipitation amounts vary between an urban area and its surrounding rural area. [6] Rocks and weathering 3 Photograph A shows a type of mass movement. (a) Describe the main features of the mass movement shown in Photograph A. [4] (b) Explain why the mass movement shown in Photograph A might have occurred. [6]
Question paper, page 3
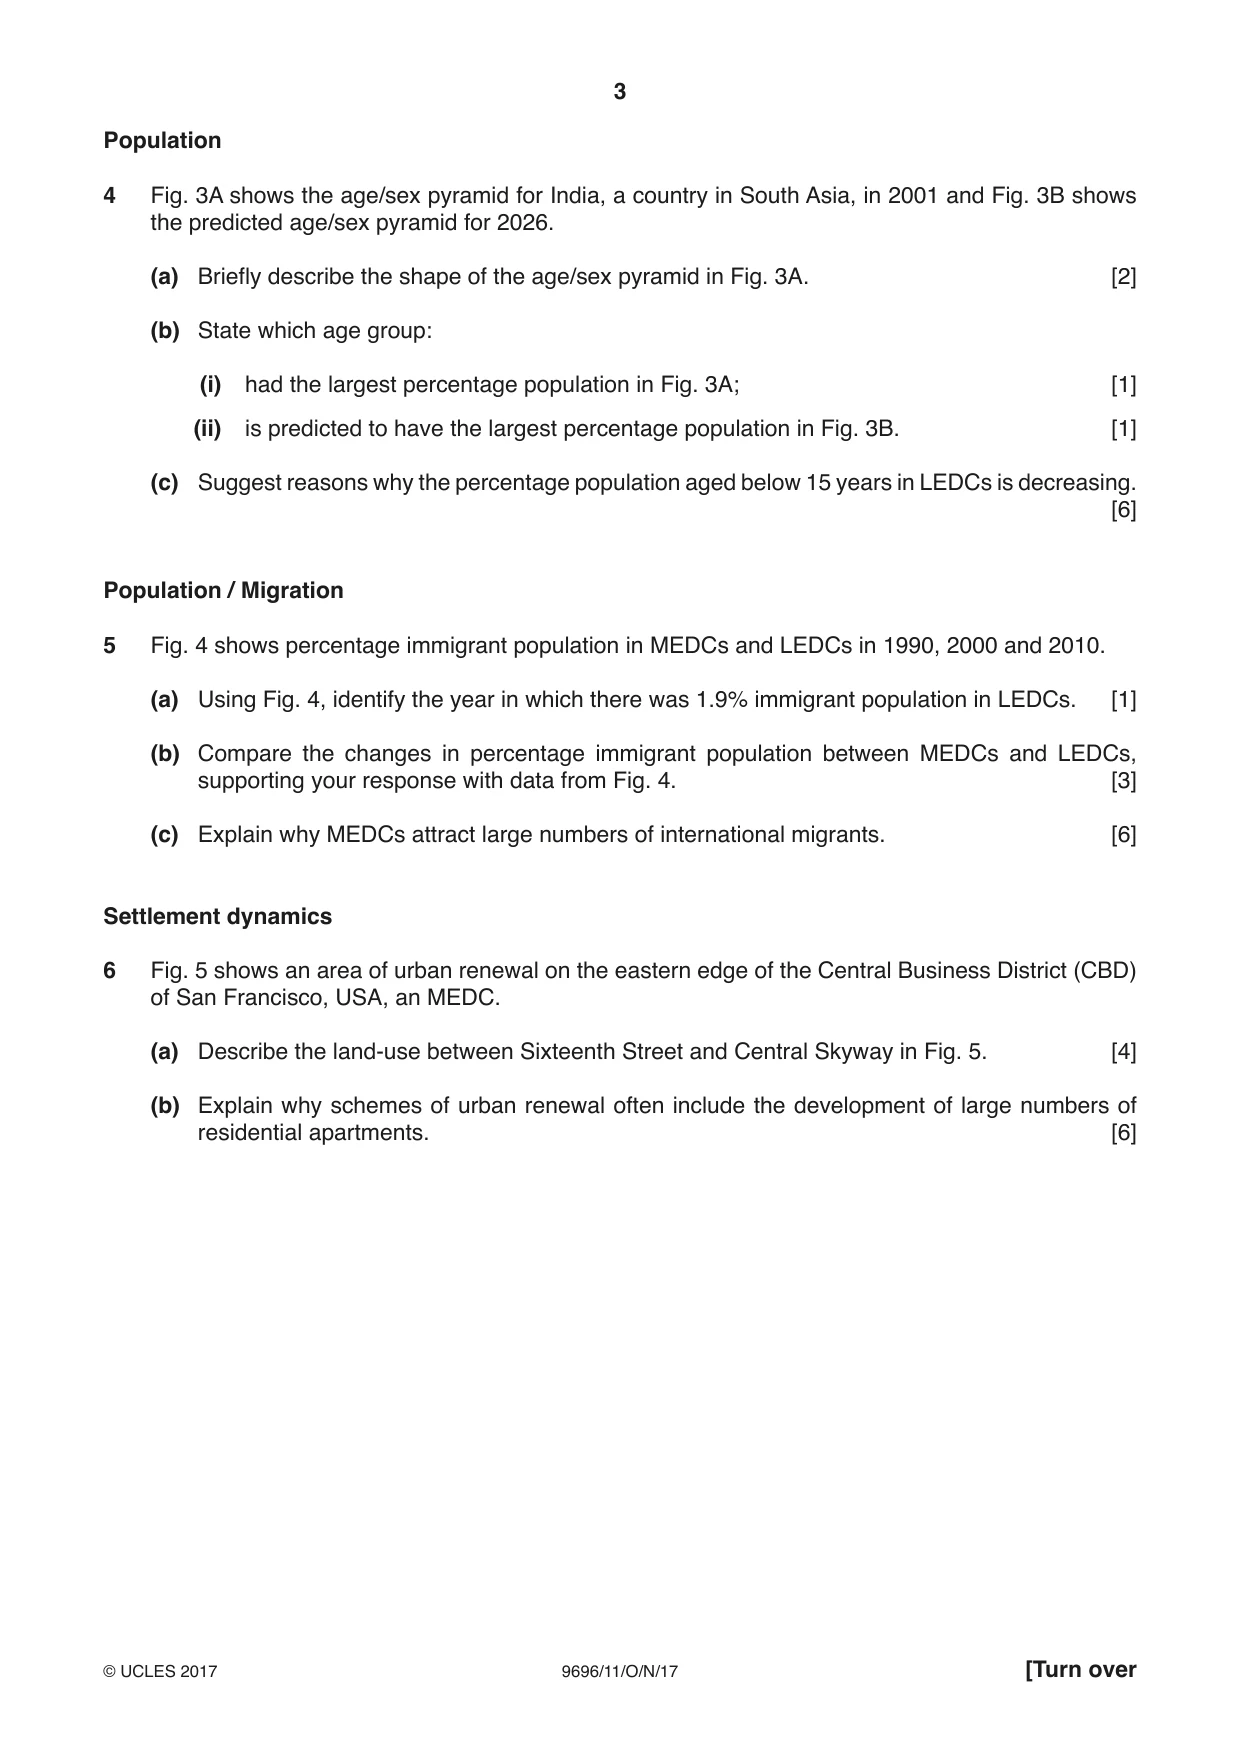
3 9696/11/O/N/17 © UCLES 2017 [Turn over Population 4 Fig. 3A shows the age/sex pyramid for India, a country in South Asia, in 2001 and Fig. 3B shows the predicted age/sex pyramid for 2026. (a) Briefly describe the shape of the age/sex pyramid in Fig. 3A. [2] (b) State which age group: (i) had the largest percentage population in Fig. 3A; [1] (ii) is predicted to have the largest percentage population in Fig. 3B. [1] (c) Suggest reasons why the percentage population aged below 15 years in LEDCs is decreasing. [6] Population / Migration 5 Fig. 4 shows percentage immigrant population in MEDCs and LEDCs in 1990, 2000 and 2010. (a) Using Fig. 4, identify the year in which there was 1.9% immigrant population in LEDCs. [1] (b) Compare the changes in percentage immigrant population between MEDCs and LEDCs, supporting your response with data from Fig. 4. [3] (c) Explain why MEDCs attract large numbers of international migrants. [6] Settlement dynamics 6 Fig. 5 shows an area of urban renewal on the eastern edge of the Central Business District (CBD) of San Francisco, USA, an MEDC. (a) Describe the land-use between Sixteenth Street and Central Skyway in Fig. 5. [4] (b) Explain why schemes of urban renewal often include the development of large numbers of residential apartments. [6]
Question paper, page 4
4 9696/11/O/N/17 © UCLES 2017 Section B: The Physical Core Answer one question from this section. All questions carry 25 marks. Hydrology and fluvial geomorphology 7 (a) (i) Define the fluvial terms traction and suspension. [4] (ii) Briefly explain helicoidal flow in rivers. [3] (b) With the aid of diagrams, explain the formation of deltas and alluvial fans. [8] (c) Assess the extent to which the Hjulstrom curve explains the erosion, transportation and deposition of material in a river channel. [10] Atmosphere and weather 8 (a) (i) Describe two factors that influence the rate of evaporation from a water surface. [4] (ii) Briefly explain the conditions needed for atmospheric stability. [3] (b) With the aid of diagrams, explain how convection and orographic uplift of air can lead to the development of precipitation. [8] (c) Evaluate the role that greenhouse gases have within the energy budget. [10] Rocks and weathering 9 (a) (i) Define the terms chelation and hydration. [4] (ii) Briefly explain how heating and cooling may lead to the weathering of rocks. [3] (b) With the aid of a diagram, describe and explain the landforms associated with the convergence of an oceanic plate and a continental plate. [8] (c) To what extent is the weathering of either granite or limestone the result of its chemical composition? [10]
Question paper, page 5
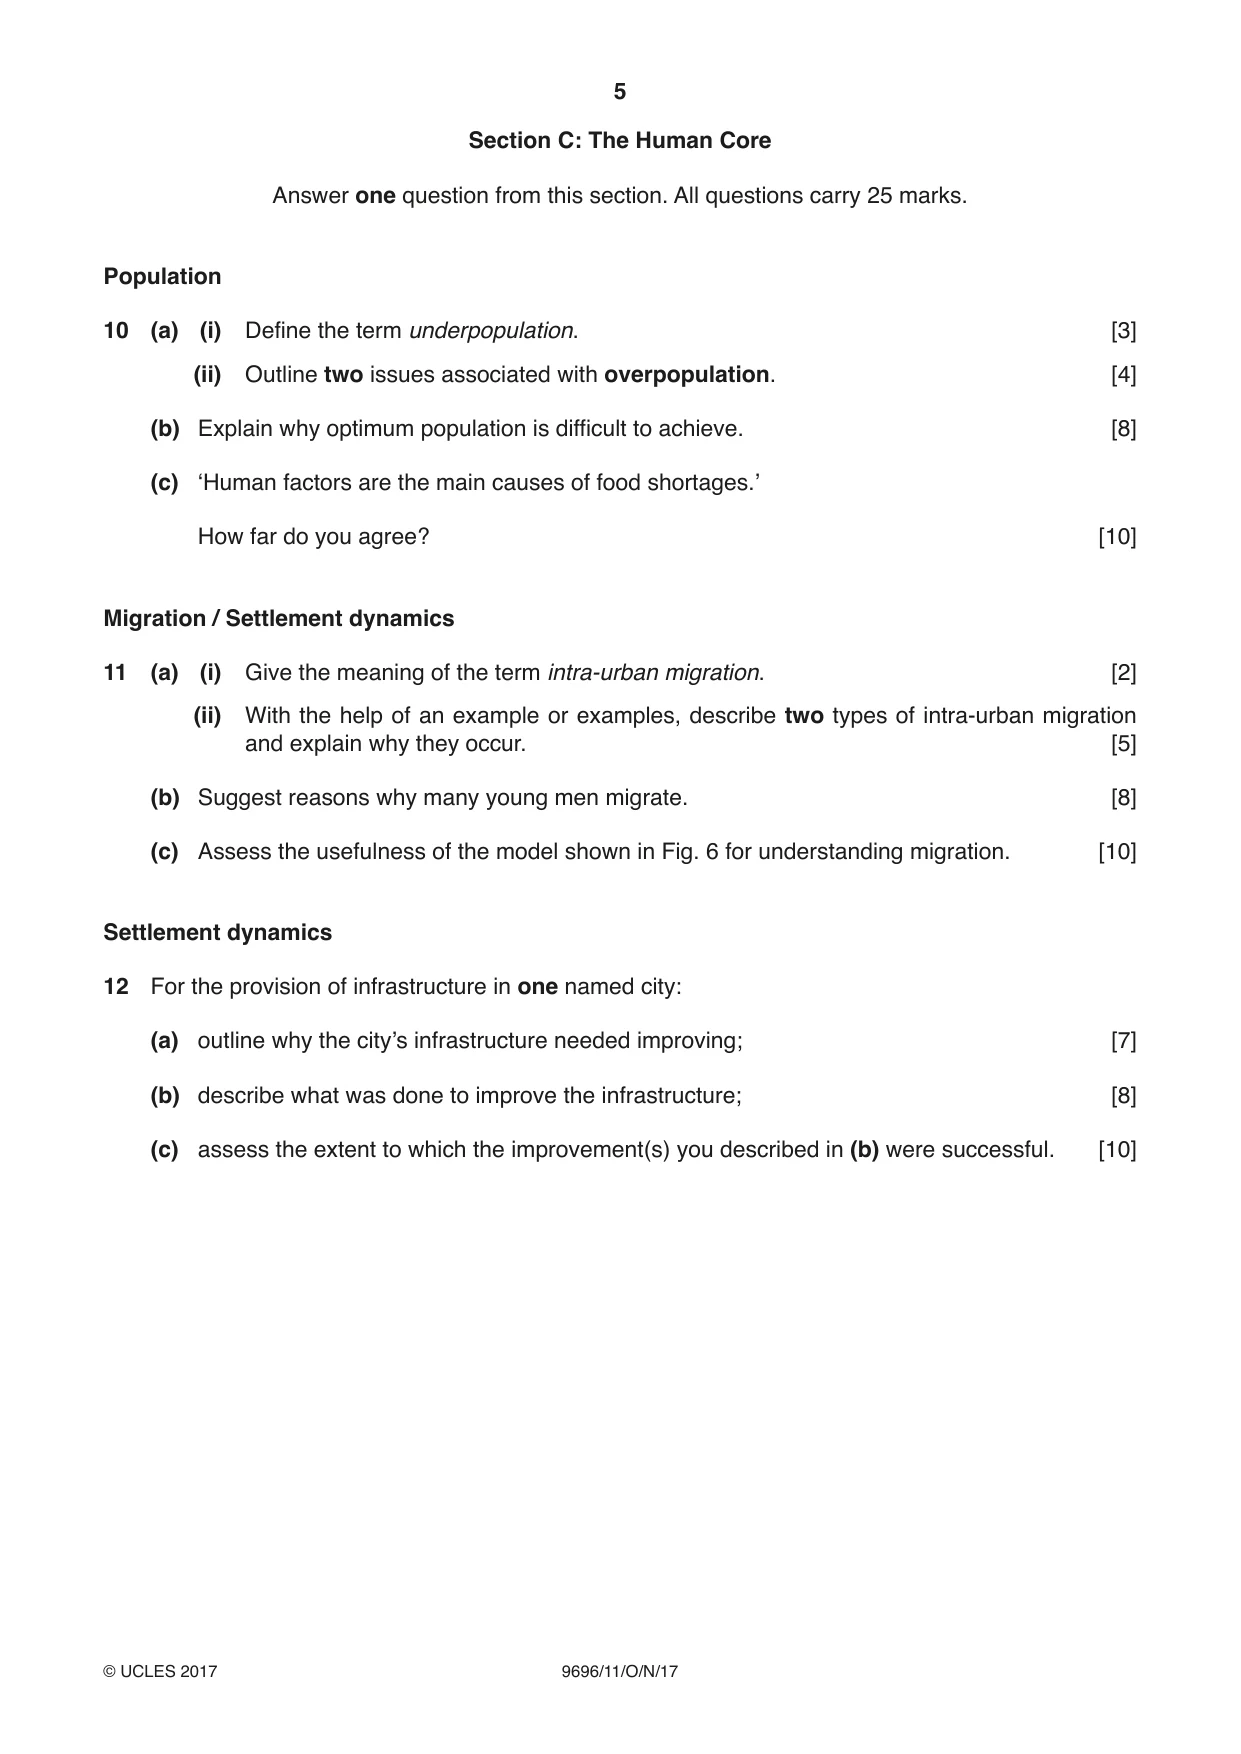
5 9696/11/O/N/17 © UCLES 2017 Section C: The Human Core Answer one question from this section. All questions carry 25 marks. Population 10 (a) (i) Define the term underpopulation. [3] (ii) Outline two issues associated with overpopulation. [4] (b) Explain why optimum population is difficult to achieve. [8] (c) ‘Human factors are the main causes of food shortages.’ How far do you agree? [10] Migration / Settlement dynamics 11 (a) (i) Give the meaning of the term intra-urban migration. [2] (ii) With the help of an example or examples, describe two types of intra-urban migration and explain why they occur. [5] (b) Suggest reasons why many young men migrate. [8] (c) Assess the usefulness of the model shown in Fig. 6 for understanding migration. [10] Settlement dynamics 12 For the provision of infrastructure in one named city: (a) outline why the city’s infrastructure needed improving; [7] (b) describe what was done to improve the infrastructure; [8] (c) assess the extent to which the improvement(s) you described in (b) were successful. [10]
Question paper, page 6
6 9696/11/O/N/17 © UCLES 2017 BLANK PAGE
Question paper, page 7
7 9696/11/O/N/17 © UCLES 2017 BLANK PAGE
Question paper, page 8
8 9696/11/O/N/17 © UCLES 2017 BLANK PAGE Permission to reproduce items where third-party owned material protected by copyright is included has been sought and cleared where possible. Every reasonable effort has been made by the publisher (UCLES) to trace copyright holders, but if any items requiring clearance have unwittingly been included, the publisher will be pleased to make amends at the earliest possible opportunity. To avoid the issue of disclosure of answer-related information to candidates, all copyright acknowledgements are reproduced online in the Cambridge International Examinations Copyright Acknowledgements Booklet. This is produced for each series of examinations and is freely available to download at www.cie.org.uk after the live examination series. Cambridge International Examinations is part of the Cambridge Assessment Group. Cambridge Assessment is the brand name of University of Cambridge Local Examinations Syndicate (UCLES), which is itself a department of the University of Cambridge.
Mark scheme, page 1
® IGCSE is a registered trademark. This document consists of 17 printed pages. © UCLES 2017 [Turn over Cambridge Assessment International Education Cambridge International Advanced Subsidiary and Advanced Level GEOGRAPHY 9696/11 Paper 1 Core Geography October/November 2017 MARK SCHEME Maximum Mark: 100 Published This mark scheme is published as an aid to teachers and candidates, to indicate the requirements of the examination. It shows the basis on which Examiners were instructed to award marks. It does not indicate the details of the discussions that took place at an Examiners’ meeting before marking began, which would have considered the acceptability of alternative answers. Mark schemes should be read in conjunction with the question paper and the Principal Examiner Report for Teachers. Cambridge International will not enter into discussions about these mark schemes. Cambridge International is publishing the mark schemes for the October/November 2017 series for most Cambridge IGCSE®, Cambridge International A and AS Level components and some Cambridge O Level components.
Mark scheme, page 2
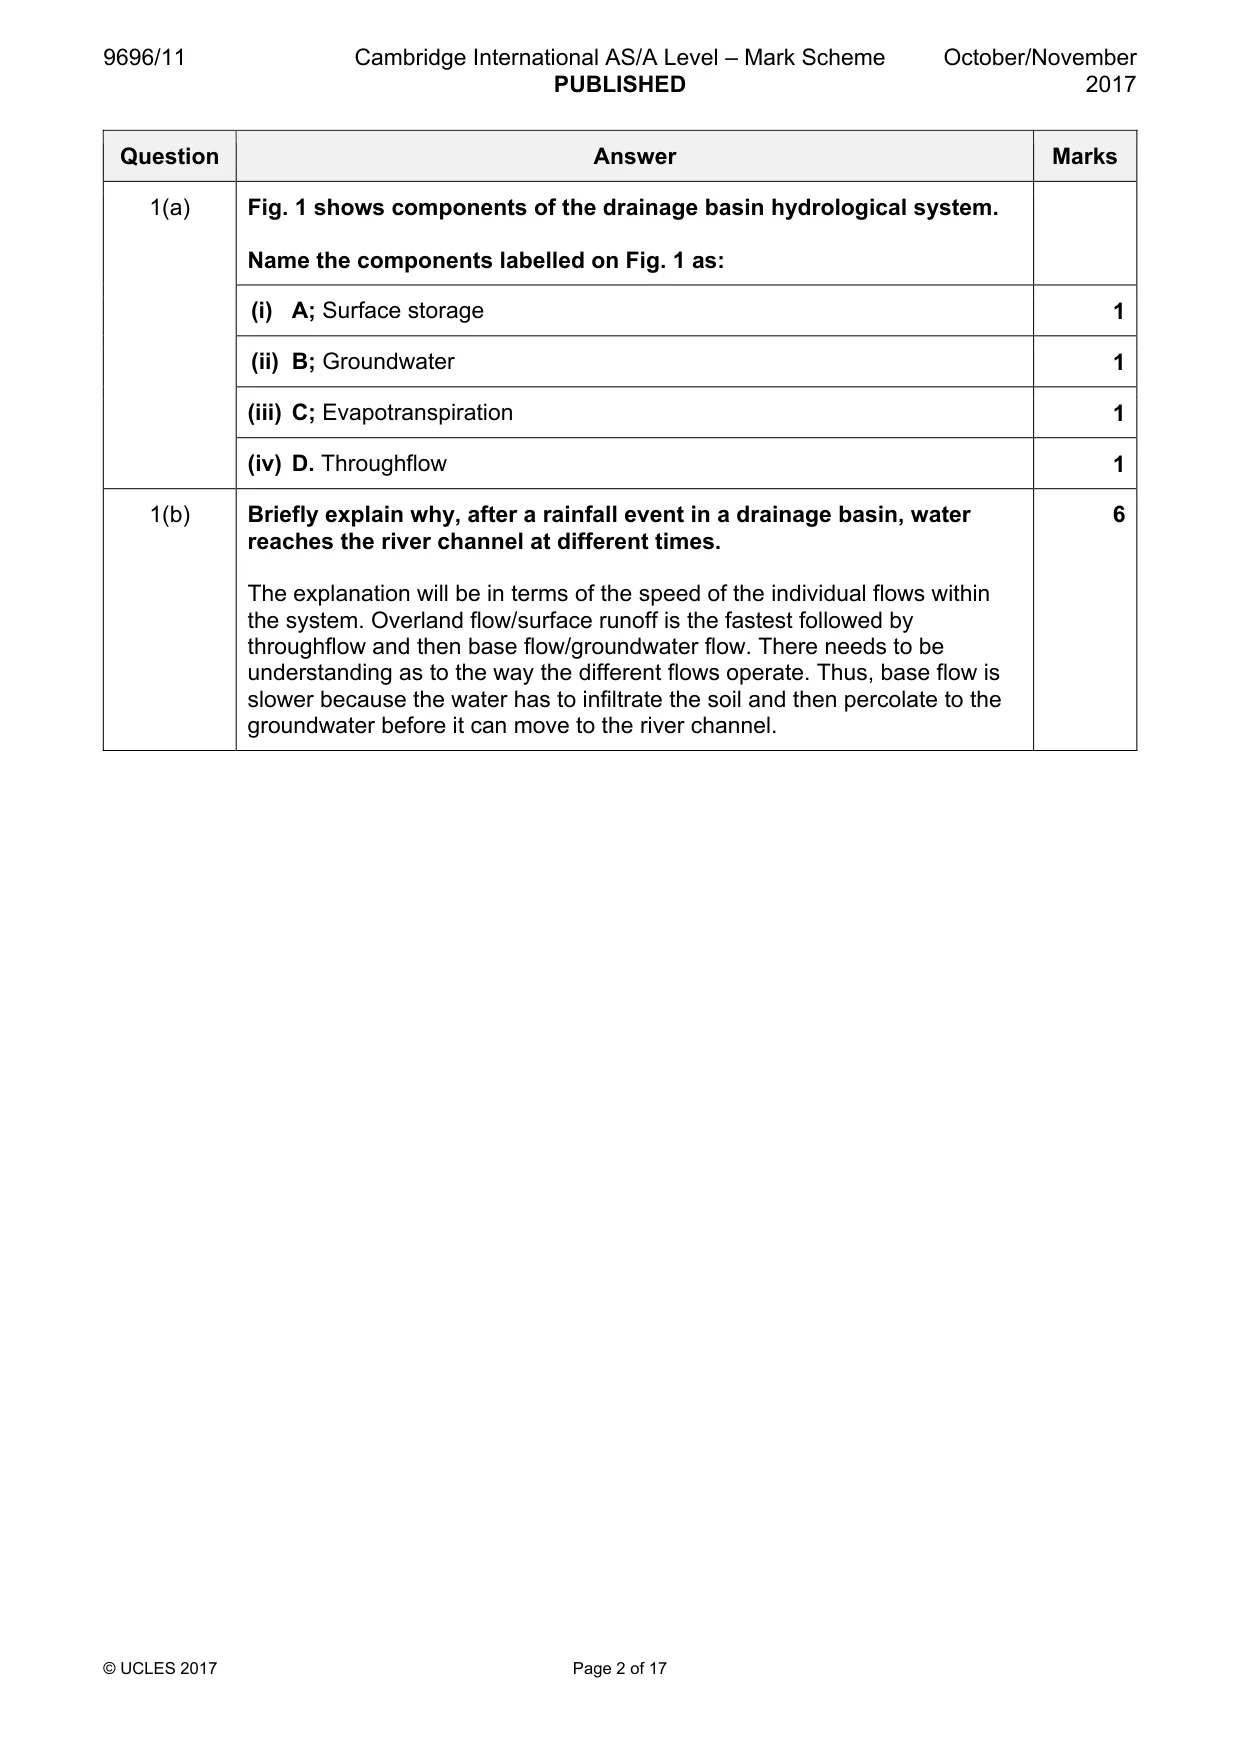
9696/11 Cambridge International AS/A Level – Mark Scheme PUBLISHED October/November 2017 © UCLES 2017 Page 2 of 17 Question Answer Marks 1(a) Fig. 1 shows components of the drainage basin hydrological system. Name the components labelled on Fig. 1 as: (i) A; Surface storage 1 (ii) B; Groundwater 1 (iii) C; Evapotranspiration 1 (iv) D. Throughflow 1 1(b) Briefly explain why, after a rainfall event in a drainage basin, water reaches the river channel at different times. The explanation will be in terms of the speed of the individual flows within the system. Overland flow/surface runoff is the fastest followed by throughflow and then base flow/groundwater flow. There needs to be understanding as to the way the different flows operate. Thus, base flow is slower because the water has to infiltrate the soil and then percolate to the groundwater before it can move to the river channel. 6
Mark scheme, page 3
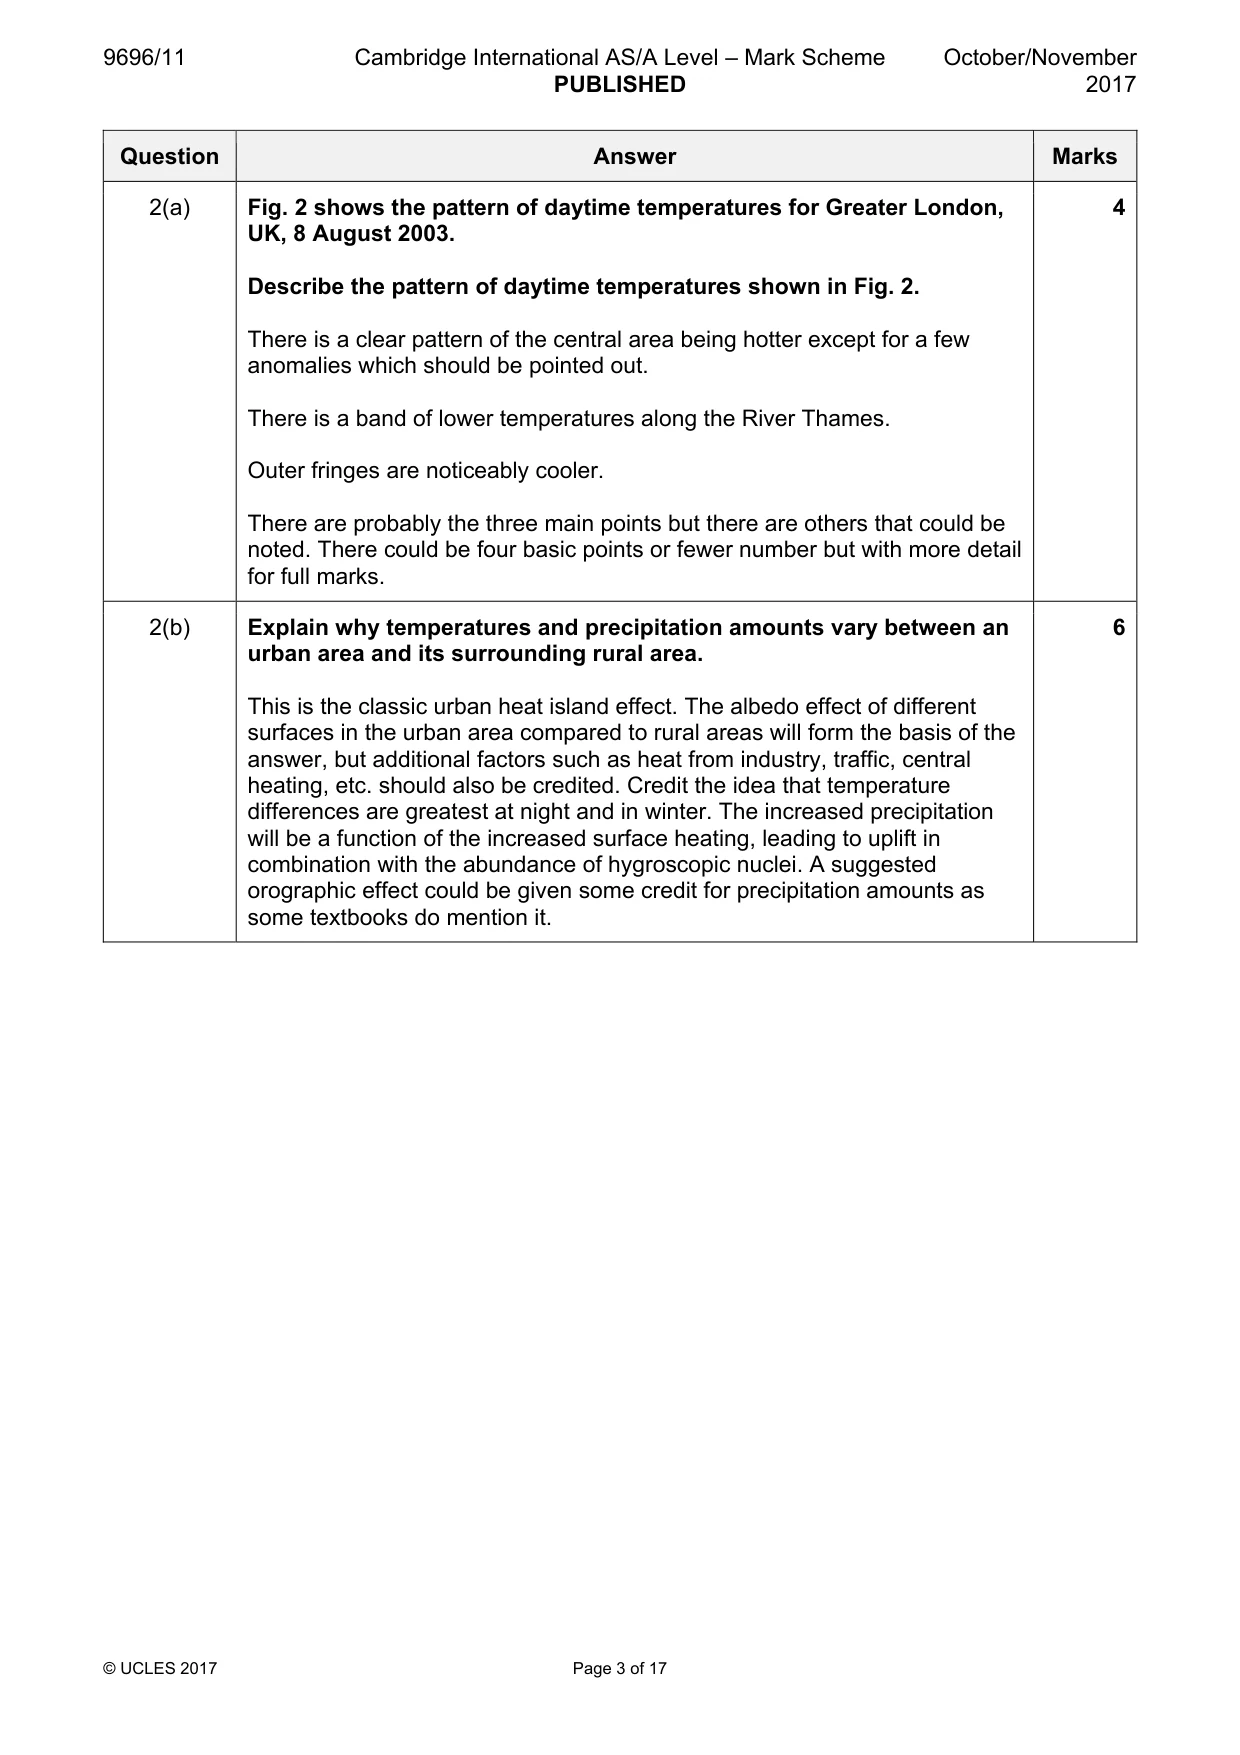
9696/11 Cambridge International AS/A Level – Mark Scheme PUBLISHED October/November 2017 © UCLES 2017 Page 3 of 17 Question Answer Marks 2(a) Fig. 2 shows the pattern of daytime temperatures for Greater London, UK, 8 August 2003. Describe the pattern of daytime temperatures shown in Fig. 2. There is a clear pattern of the central area being hotter except for a few anomalies which should be pointed out. There is a band of lower temperatures along the River Thames. Outer fringes are noticeably cooler. There are probably the three main points but there are others that could be noted. There could be four basic points or fewer number but with more detail for full marks. 4 2(b) Explain why temperatures and precipitation amounts vary between an urban area and its surrounding rural area. This is the classic urban heat island effect. The albedo effect of different surfaces in the urban area compared to rural areas will form the basis of the answer, but additional factors such as heat from industry, traffic, central heating, etc. should also be credited. Credit the idea that temperature differences are greatest at night and in winter. The increased precipitation will be a function of the increased surface heating, leading to uplift in combination with the abundance of hygroscopic nuclei. A suggested orographic effect could be given some credit for precipitation amounts as some textbooks do mention it. 6
Mark scheme, page 4
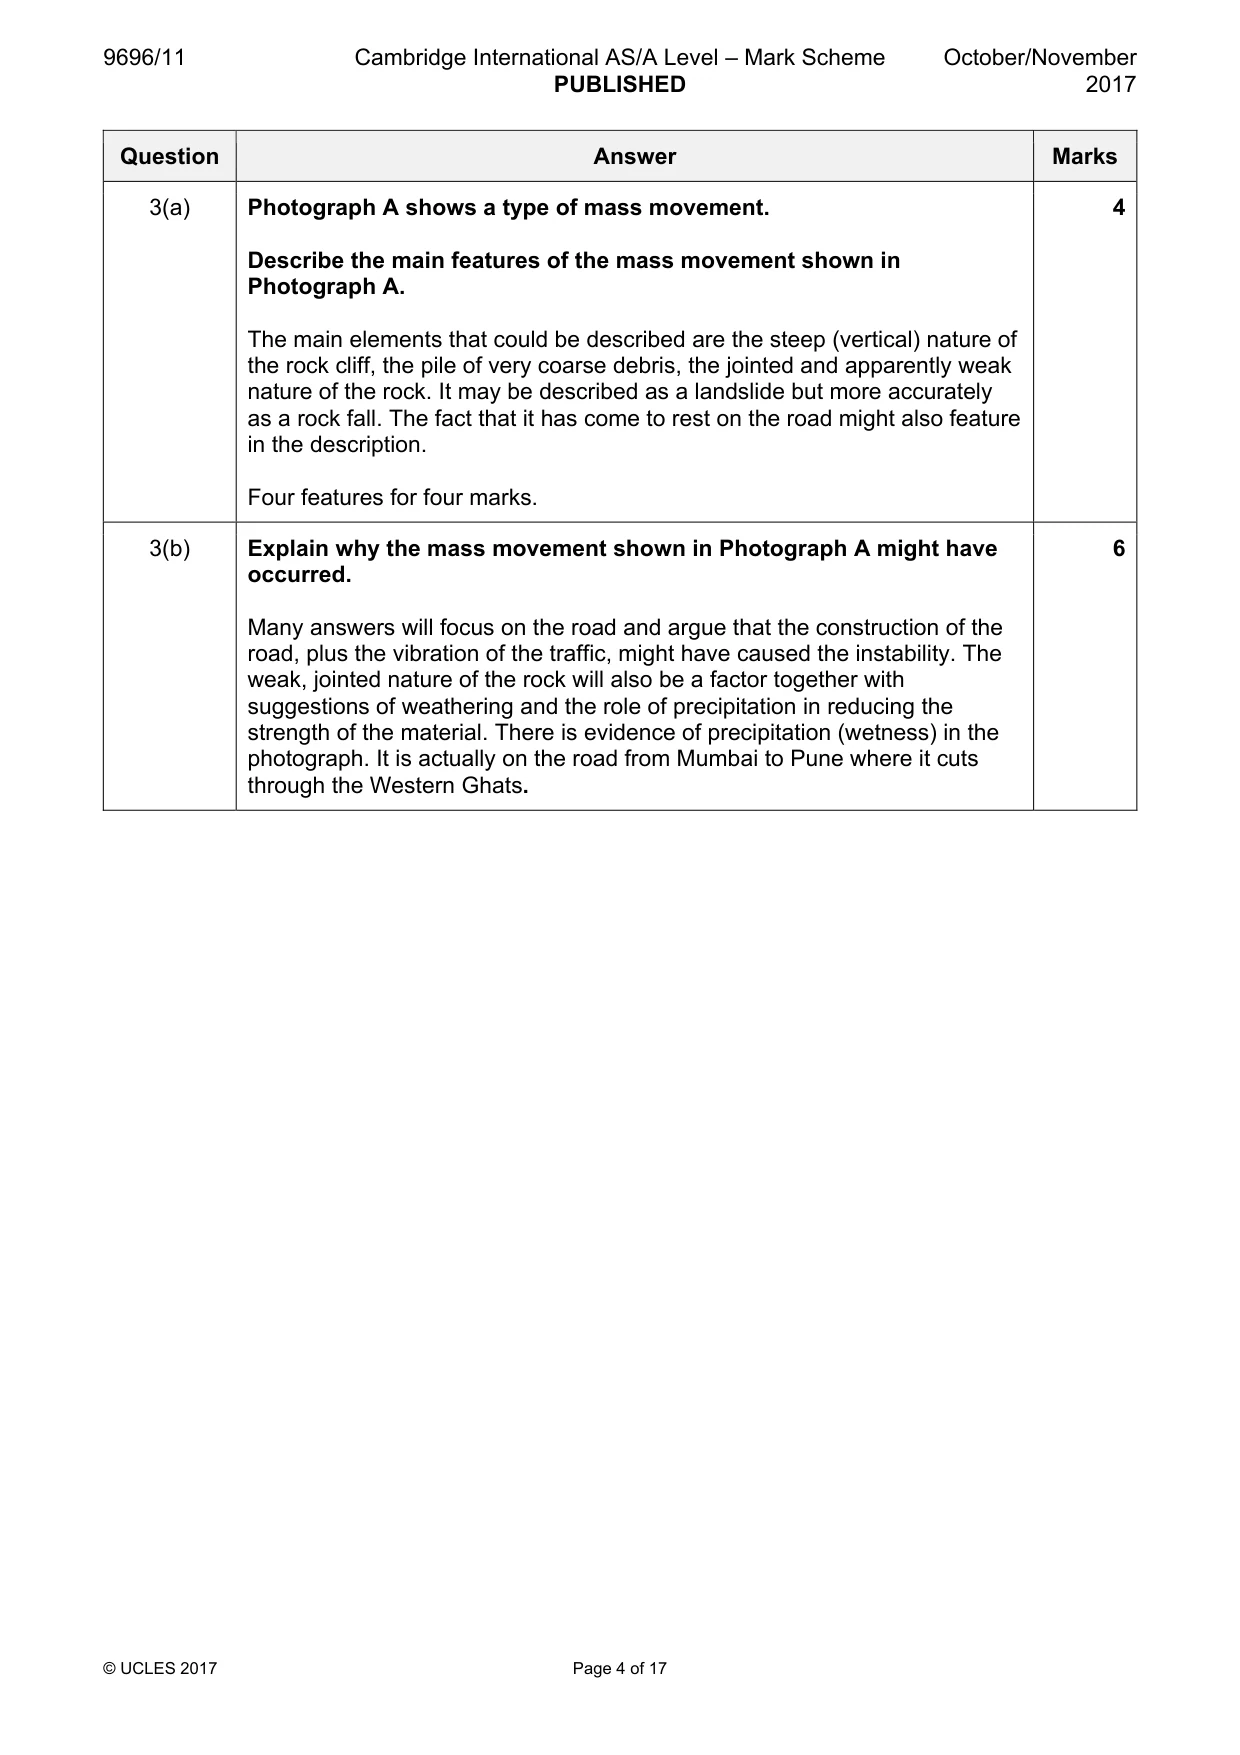
9696/11 Cambridge International AS/A Level – Mark Scheme PUBLISHED October/November 2017 © UCLES 2017 Page 4 of 17 Question Answer Marks 3(a) Photograph A shows a type of mass movement. Describe the main features of the mass movement shown in Photograph A. The main elements that could be described are the steep (vertical) nature of the rock cliff, the pile of very coarse debris, the jointed and apparently weak nature of the rock. It may be described as a landslide but more accurately as a rock fall. The fact that it has come to rest on the road might also feature in the description. Four features for four marks. 4 3(b) Explain why the mass movement shown in Photograph A might have occurred. Many answers will focus on the road and argue that the construction of the road, plus the vibration of the traffic, might have caused the instability. The weak, jointed nature of the rock will also be a factor together with suggestions of weathering and the role of precipitation in reducing the strength of the material. There is evidence of precipitation (wetness) in the photograph. It is actually on the road from Mumbai to Pune where it cuts through the Western Ghats. 6
Mark scheme, page 5
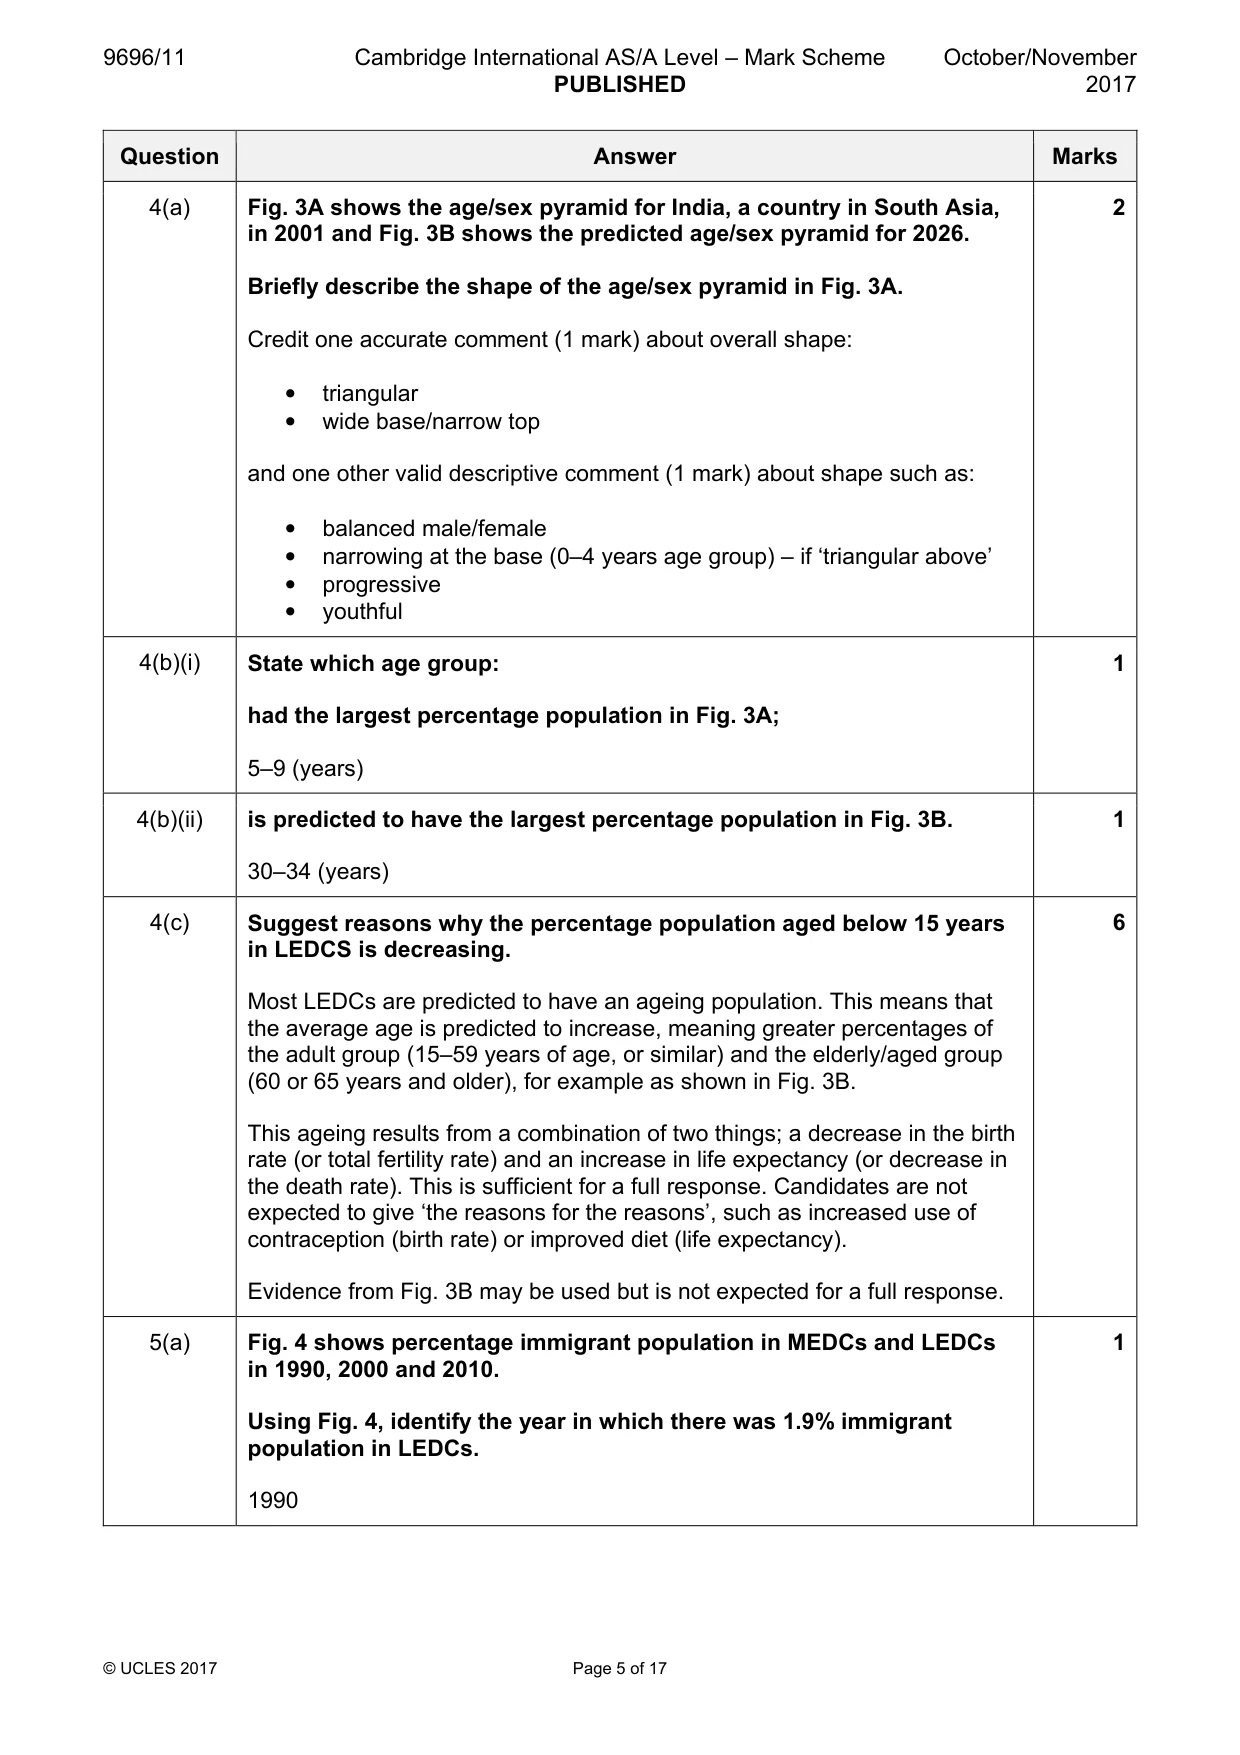
9696/11 Cambridge International AS/A Level – Mark Scheme PUBLISHED October/November 2017 © UCLES 2017 Page 5 of 17 Question Answer Marks 4(a) Fig. 3A shows the age/sex pyramid for India, a country in South Asia, in 2001 and Fig. 3B shows the predicted age/sex pyramid for 2026. Briefly describe the shape of the age/sex pyramid in Fig. 3A. Credit one accurate comment (1 mark) about overall shape: • triangular • wide base/narrow top and one other valid descriptive comment (1 mark) about shape such as: • balanced male/female • narrowing at the base (0–4 years age group) – if ‘triangular above’ • progressive • youthful 2 4(b)(i) State which age group: had the largest percentage population in Fig. 3A; 5–9 (years) 1 4(b)(ii) is predicted to have the largest percentage population in Fig. 3B. 30–34 (years) 1 4(c) Suggest reasons why the percentage population aged below 15 years in LEDCS is decreasing. Most LEDCs are predicted to have an ageing population. This means that the average age is predicted to increase, meaning greater percentages of the adult group (15–59 years of age, or similar) and the elderly/aged group (60 or 65 years and older), for example as shown in Fig. 3B. This ageing results from a combination of two things; a decrease in the birth rate (or total fertility rate) and an increase in life expectancy (or decrease in the death rate). This is sufficient for a full response. Candidates are not expected to give ‘the reasons for the reasons’, such as increased use of contraception (birth rate) or improved diet (life expectancy). Evidence from Fig. 3B may be used but is not expected for a full response. 6 5(a) Fig. 4 shows percentage immigrant population in MEDCs and LEDCs in 1990, 2000 and 2010. Using Fig. 4, identify the year in which there was 1.9% immigrant population in LEDCs. 1990 1
Mark scheme, page 6
9696/11 Cambridge International AS/A Level – Mark Scheme PUBLISHED October/November 2017 © UCLES 2017 Page 6 of 17 Question Answer Marks 5(b) Compare the changes in percentage immigrant population between MEDCs and LEDCs, supporting your response with data from Fig. 4. Percentage immigrant population in MEDCs was increasing strongly, from approx. 7% in 1990 to approx. 10% in 2010, whereas in LEDCs percentage immigrant population fell by approx. 0.2% between 1990 and 2000 and was stable between 2000 and 2010 at approx. 1.7%. For two separate trends with data support without an element of comparison, or for two accurate trends without data support, maximum 2. 3 5(c) Explain why MEDCs attract large numbers of international migrants. MEDCs attract large numbers of international migrants for a number of reasons, the main motive for migration being betterment. Factors include: • prospect of employment, better paid employment or promotion • prospect of improved standard of living • prospect of better access to services, e.g. health care and education • prospect of safety and security (e.g. refugees) • information – media, news from migrants in destination • perception • in a globalised world, many people lead international lives • other Response may assume migration from LEDCs or acknowledge the complexity of global migration flows, work patterns, retirement migration, etc. A full response comprises three developed factors with exemplar support or may be more broadly based with some exemplification. 6
Mark scheme, page 7
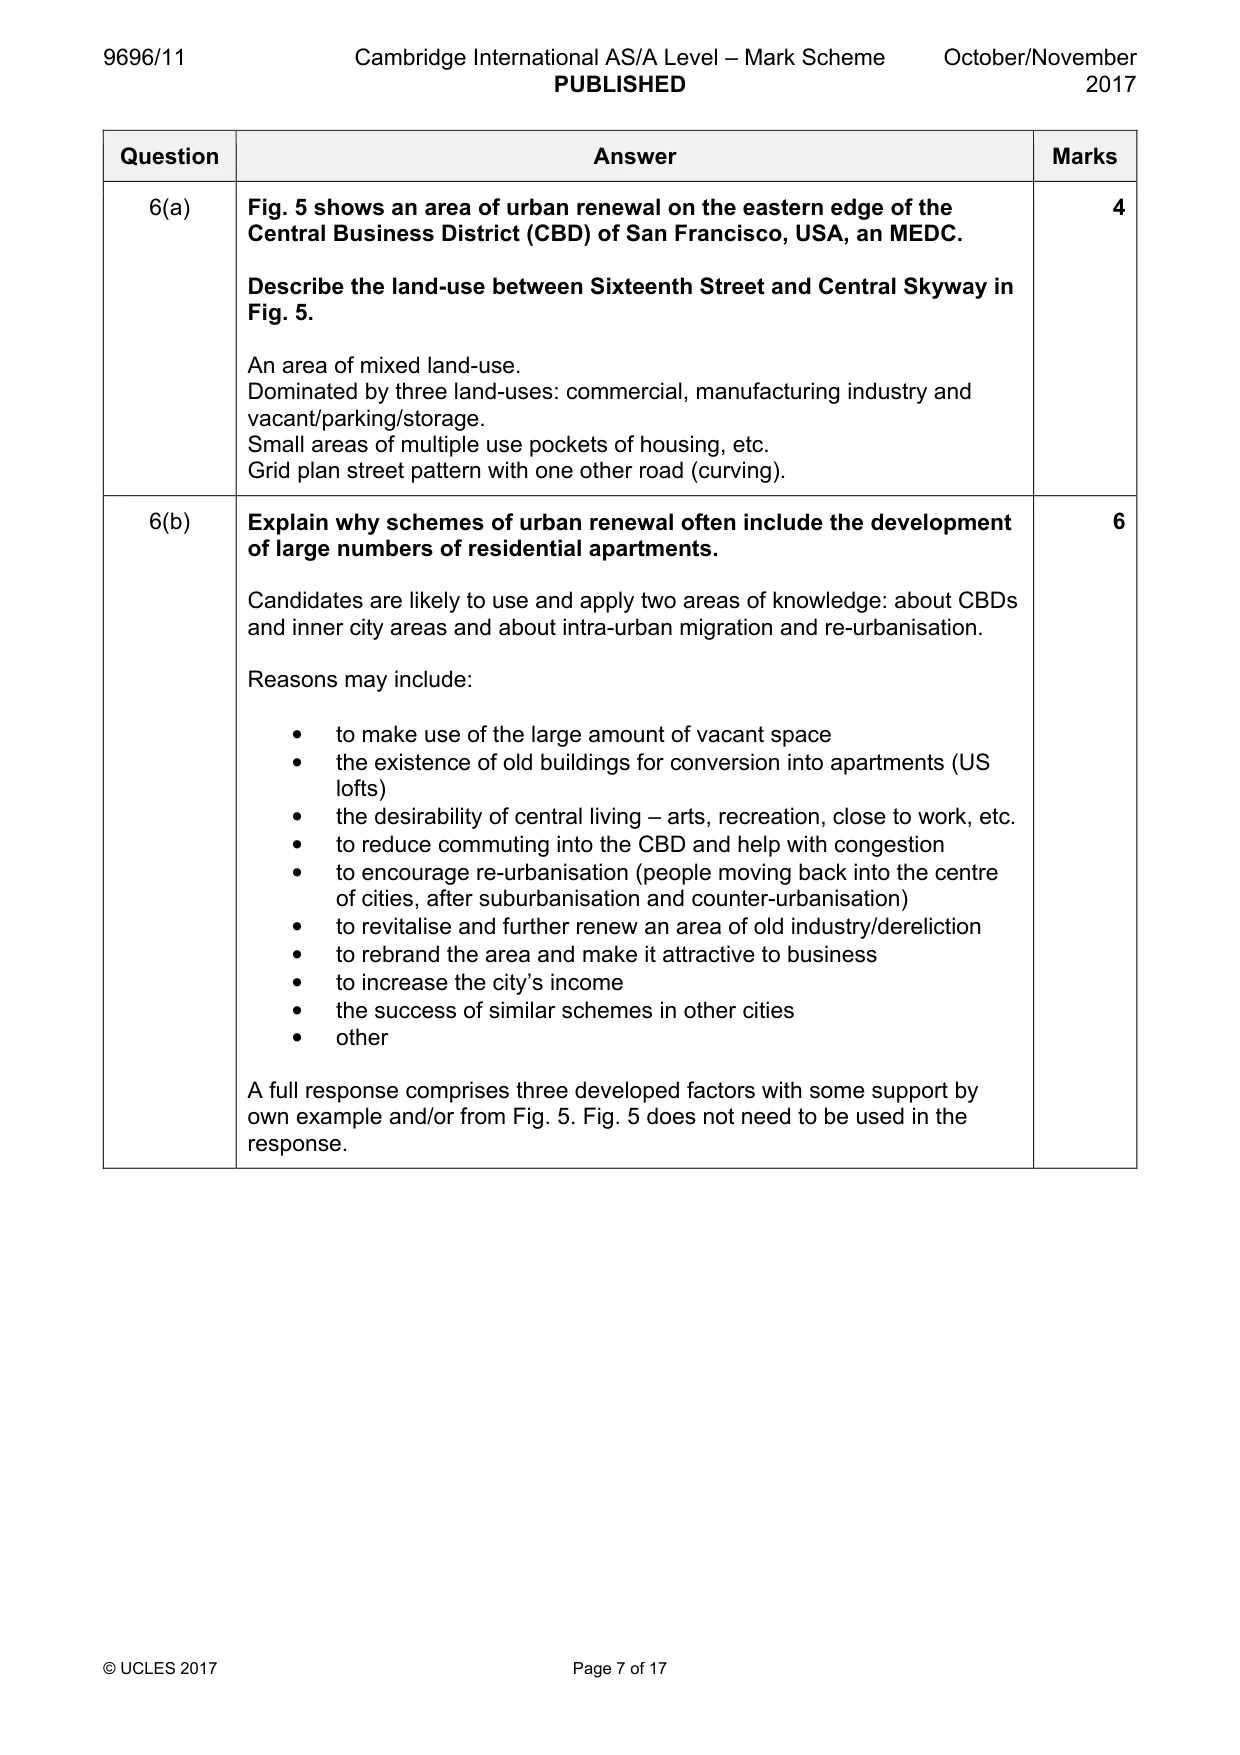
9696/11 Cambridge International AS/A Level – Mark Scheme PUBLISHED October/November 2017 © UCLES 2017 Page 7 of 17 Question Answer Marks 6(a) Fig. 5 shows an area of urban renewal on the eastern edge of the Central Business District (CBD) of San Francisco, USA, an MEDC. Describe the land-use between Sixteenth Street and Central Skyway in Fig. 5. An area of mixed land-use. Dominated by three land-uses: commercial, manufacturing industry and vacant/parking/storage. Small areas of multiple use pockets of housing, etc. Grid plan street pattern with one other road (curving). 4 6(b) Explain why schemes of urban renewal often include the development of large numbers of residential apartments. Candidates are likely to use and apply two areas of knowledge: about CBDs and inner city areas and about intra-urban migration and re-urbanisation. Reasons may include: • to make use of the large amount of vacant space • the existence of old buildings for conversion into apartments (US lofts) • the desirability of central living – arts, recreation, close to work, etc. • to reduce commuting into the CBD and help with congestion • to encourage re-urbanisation (people moving back into the centre of cities, after suburbanisation and counter-urbanisation) • to revitalise and further renew an area of old industry/dereliction • to rebrand the area and make it attractive to business • to increase the city’s income • the success of similar schemes in other cities • other A full response comprises three developed factors with some support by own example and/or from Fig. 5. Fig. 5 does not need to be used in the response. 6
Mark scheme, page 8
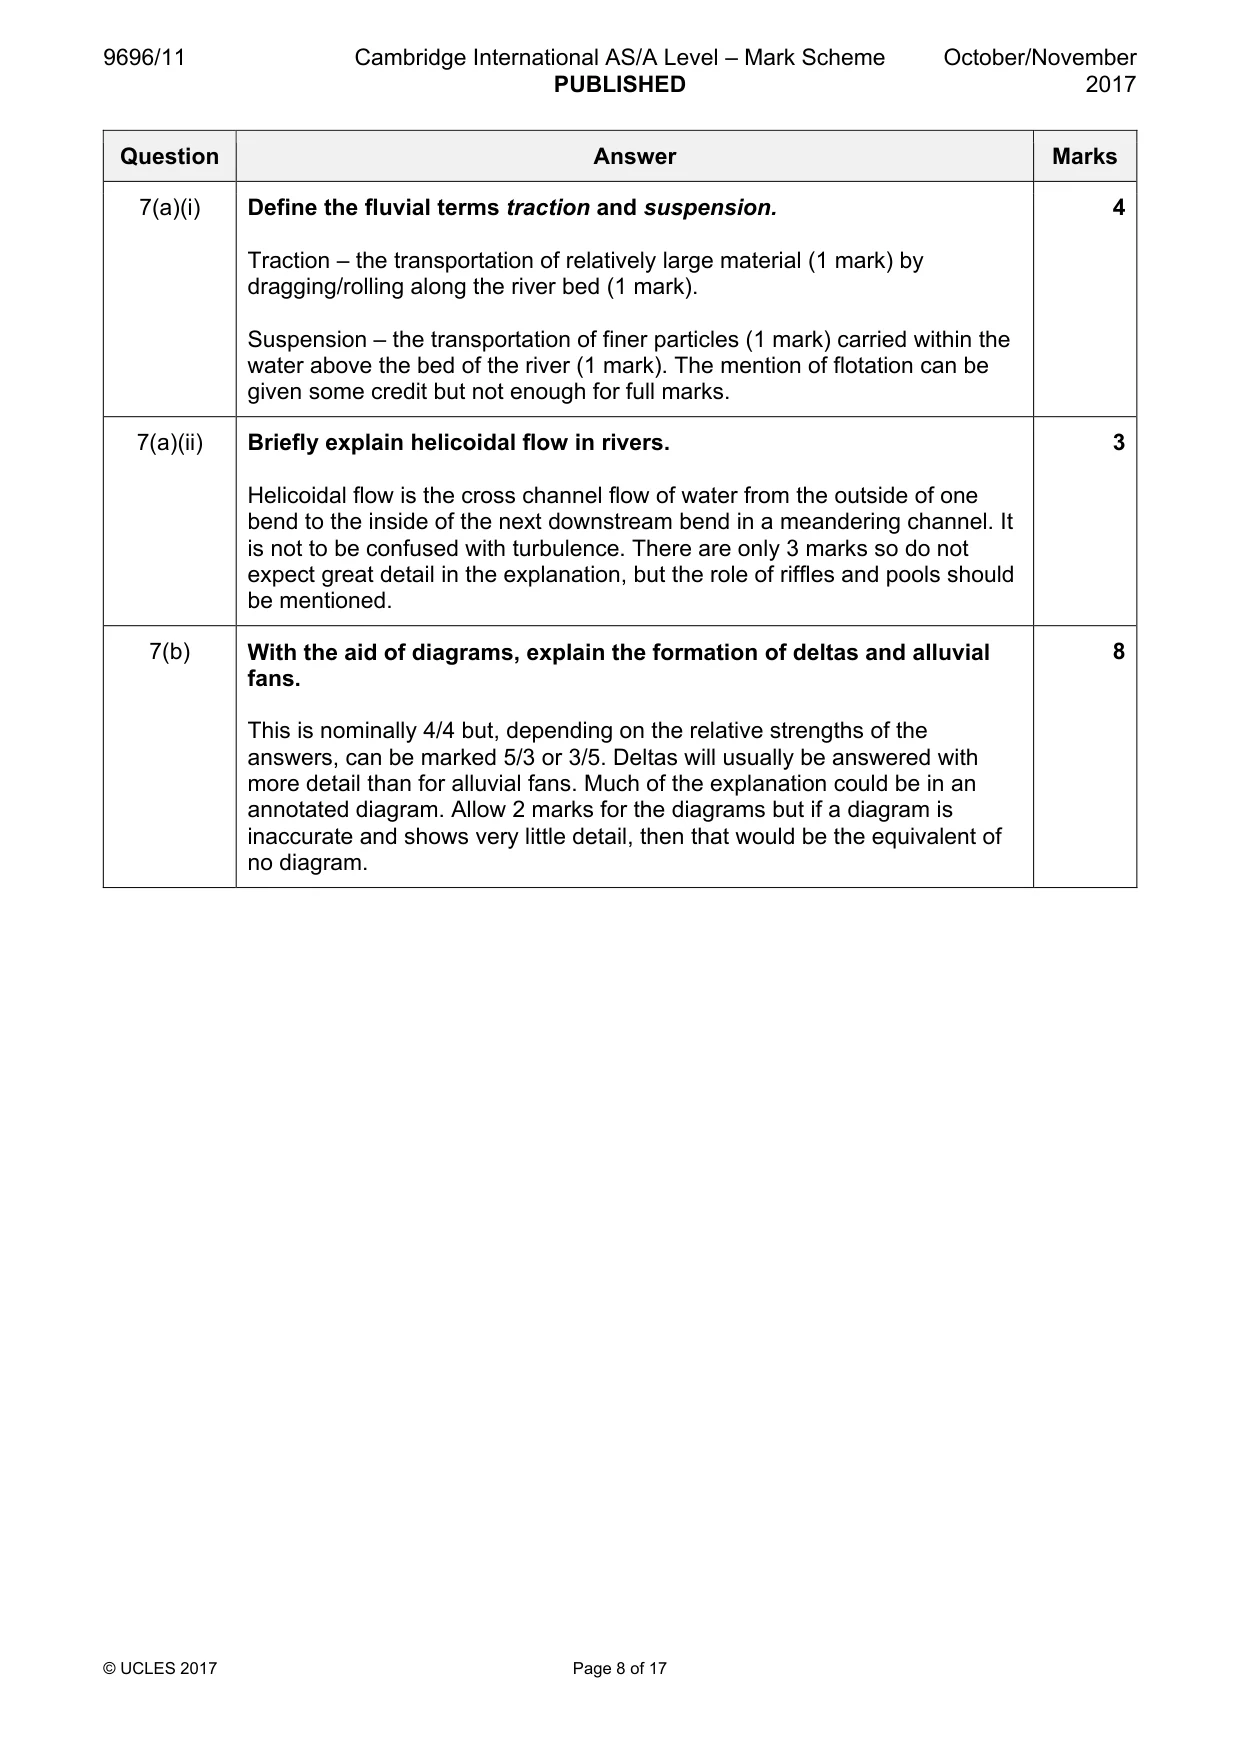
9696/11 Cambridge International AS/A Level – Mark Scheme PUBLISHED October/November 2017 © UCLES 2017 Page 8 of 17 Question Answer Marks 7(a)(i) Define the fluvial terms traction and suspension. Traction – the transportation of relatively large material (1 mark) by dragging/rolling along the river bed (1 mark). Suspension – the transportation of finer particles (1 mark) carried within the water above the bed of the river (1 mark). The mention of flotation can be given some credit but not enough for full marks. 4 7(a)(ii) Briefly explain helicoidal flow in rivers. Helicoidal flow is the cross channel flow of water from the outside of one bend to the inside of the next downstream bend in a meandering channel. It is not to be confused with turbulence. There are only 3 marks so do not expect great detail in the explanation, but the role of riffles and pools should be mentioned. 3 7(b) With the aid of diagrams, explain the formation of deltas and alluvial fans. This is nominally 4/4 but, depending on the relative strengths of the answers, can be marked 5/3 or 3/5. Deltas will usually be answered with more detail than for alluvial fans. Much of the explanation could be in an annotated diagram. Allow 2 marks for the diagrams but if a diagram is inaccurate and shows very little detail, then that would be the equivalent of no diagram. 8
Mark scheme, page 9
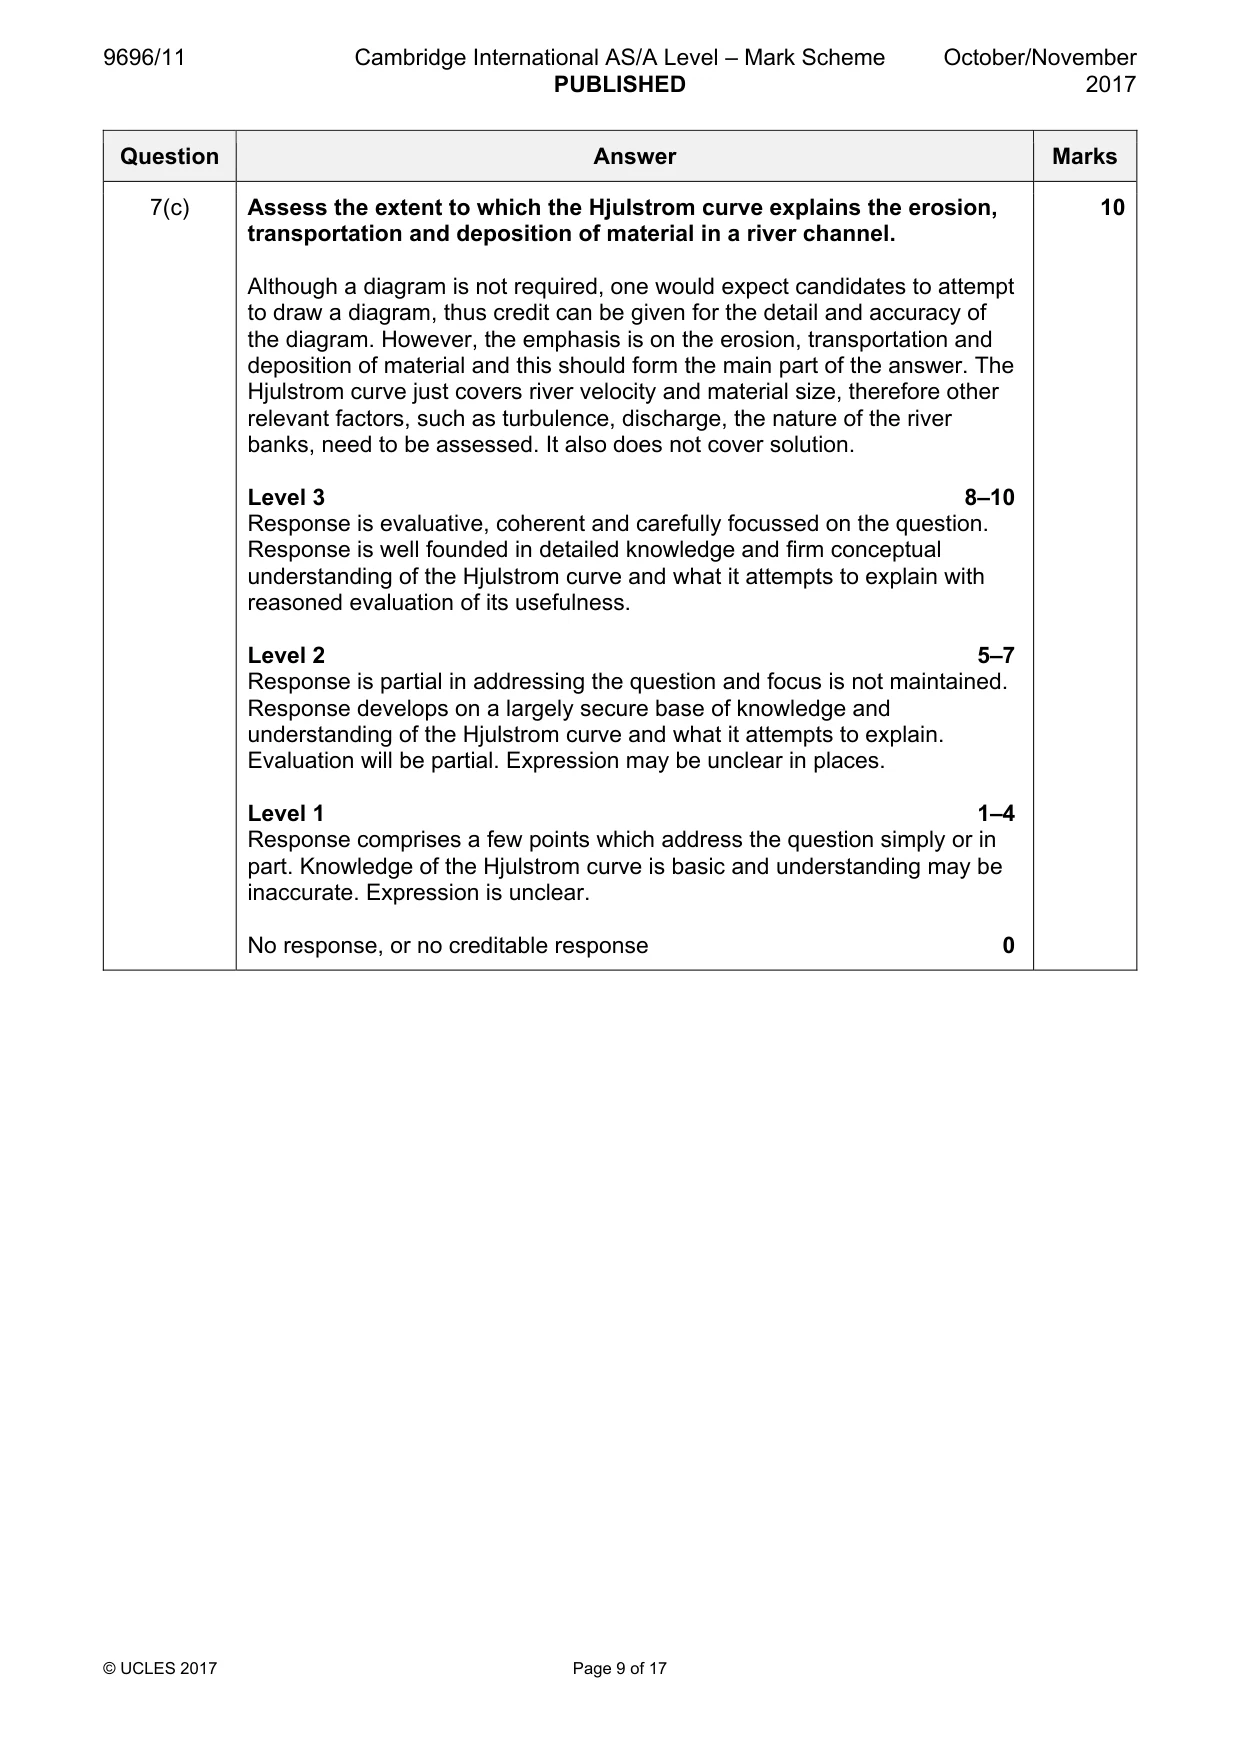
9696/11 Cambridge International AS/A Level – Mark Scheme PUBLISHED October/November 2017 © UCLES 2017 Page 9 of 17 Question Answer Marks 7(c) Assess the extent to which the Hjulstrom curve explains the erosion, transportation and deposition of material in a river channel. Although a diagram is not required, one would expect candidates to attempt to draw a diagram, thus credit can be given for the detail and accuracy of the diagram. However, the emphasis is on the erosion, transportation and deposition of material and this should form the main part of the answer. The Hjulstrom curve just covers river velocity and material size, therefore other relevant factors, such as turbulence, discharge, the nature of the river banks, need to be assessed. It also does not cover solution. Level 3 8–10 Response is evaluative, coherent and carefully focussed on the question. Response is well founded in detailed knowledge and firm conceptual understanding of the Hjulstrom curve and what it attempts to explain with reasoned evaluation of its usefulness. Level 2 5–7 Response is partial in addressing the question and focus is not maintained. Response develops on a largely secure base of knowledge and understanding of the Hjulstrom curve and what it attempts to explain. Evaluation will be partial. Expression may be unclear in places. Level 1 1–4 Response comprises a few points which address the question simply or in part. Knowledge of the Hjulstrom curve is basic and understanding may be inaccurate. Expression is unclear. No response, or no creditable response 0 10
Mark scheme, page 10
9696/11 Cambridge International AS/A Level – Mark Scheme PUBLISHED October/November 2017 © UCLES 2017 Page 10 of 17 Question Answer Marks 8(a)(i) Describe two factors that influence the rate of evaporation from a water surface. Two factors from temperature, humidity and wind speed. 4 8(a)(ii) Briefly explain the conditions needed for atmospheric stability. Rising air cooling more rapidly than the surrounding (1 mark) so that the air falls back to the surface (1 mark) without reaching the condensation layer (1 mark). 3 8(b) With the aid of diagrams, explain how convection and orographic uplift of air can lead to the development of precipitation. The heating of the ground surface leads to convection and warming of the air which rises and cools slower than the environmental lapse rate, meaning that it will probably reach the condensation level and continue rising leading to the formation of clouds and precipitation. In orographic uplift, generally stable air will be forced to rise so that it is forced to reach condensation level, thus leading to the formation of clouds and probably precipitation. The best diagrams will be those of the respective lapse rates, but some candidates might draw the processes schematically. If no diagrams, maximum 5 marks. 8 8(c) Evaluate the role that greenhouse gases have within the energy budget. There are two components to this question. There needs to be an understanding of the energy budget as well as how greenhouse gases affect what happens to incoming and outgoing solar radiation in the atmosphere. Short and long wave radiation need to be mentioned with absorption of long wave radiation by the greenhouse gases. Level 3 8–10 Response is evaluative, coherent and carefully focussed on the question. Response is well founded in detailed knowledge and firm conceptual understanding of greenhouse gases and the energy budget. Level 2 5–7 Response is partial in addressing the question and focus is not maintained. Response develops on a largely secure base of knowledge and understanding of greenhouse gases and the energy budget but evaluation will be partial. Expression may be unclear in places. Level 1 1–4 Response comprises a few points which address the question simply or in part. Knowledge of greenhouse gases and the energy budget is basic and understanding may be inaccurate. Expression is unclear. No response, or no creditable response 0 10
Mark scheme, page 11
9696/11 Cambridge International AS/A Level – Mark Scheme PUBLISHED October/November 2017 © UCLES 2017 Page 11 of 17 Question Answer Marks 9(a)(i) Define the terms chelation and hydration. Chelation is a chemical weathering process (1 mark) involving organic (humic) acids (1 mark). Hydration is a weathering process where minerals absorb water into their structure (1 mark), causing them to swell and to become vulnerable to breakdown (1 mark). 4 9(a)(ii) Briefly explain how heating and cooling may lead to the weathering of rocks. This is insolation weathering where outer layers of rocks are heated and cooled (1 mark), expanding and contracting (1 mark), causing stresses which can lead to spalls of rock breaking away (1 mark). This can be called exfoliation. It can also lead to granular disintegration if minerals with different heat conductivities are involved. 3 9(b) With the aid of a diagram, describe and explain the landforms associated with the convergence of an oceanic plate and a continental plate. The main landforms are oceanic trenches, island arcs, volcanoes and fold mountains. Subduction of the oceanic plate is the important process. Much of the description and explanation can be integrated into the diagram. The accuracy of the diagram is essential, such as with the volcanoes in the correct place and fold mountains shown realistically. If no diagram, maximum 5 marks. 8
Mark scheme, page 12
9696/11 Cambridge International AS/A Level – Mark Scheme PUBLISHED October/November 2017 © UCLES 2017 Page 12 of 17 Question Answer Marks 9(c) To what extent is the weathering of either granite or limestone the result of its chemical composition? Analysis must be based on the differing chemical properties of the rocks. These differences will govern the main weathering processes, such as hydrolysis for granite and carbonation for limestone. However, in order to assess the ‘extent’ wording in the question, other factors such as physical properties will need to be discussed. The mineralogy of granite makes it more susceptible to insolation weathering because of the differences in thermal conductivities of the minerals. Both rock types possess joints and bedding planes (pseudo bedding planes in the case of granite), although those in limestone are generally wider and more frequent. There are also other factors that should be included in the evaluation, perhaps the most important factor being climate, although vegetation and relief are other elements listed in the syllabus. Level 3 8–10 Response is evaluative, coherent and carefully focussed on the question. Response is well founded in detailed knowledge and firm conceptual understanding of the weathering of the chosen rock type. Evaluation is thorough and accurate, including reference to other factors. Level 2 5–7 Response is partial in addressing the question and focus is not maintained. Response develops on a largely secure base of knowledge and understanding of the weathering of the chosen rock type but will be partial. Evaluation will also be limited in some respects. Expression may be unclear in places. Level 1 1–4 Response comprises a few points which address the question simply or in part. Knowledge is basic and understanding of the weathering of the chosen rock type will be inaccurate. Assessment of other factors will be limited or absent. Expression is unclear. No response, or no creditable response 0 10
Mark scheme, page 13
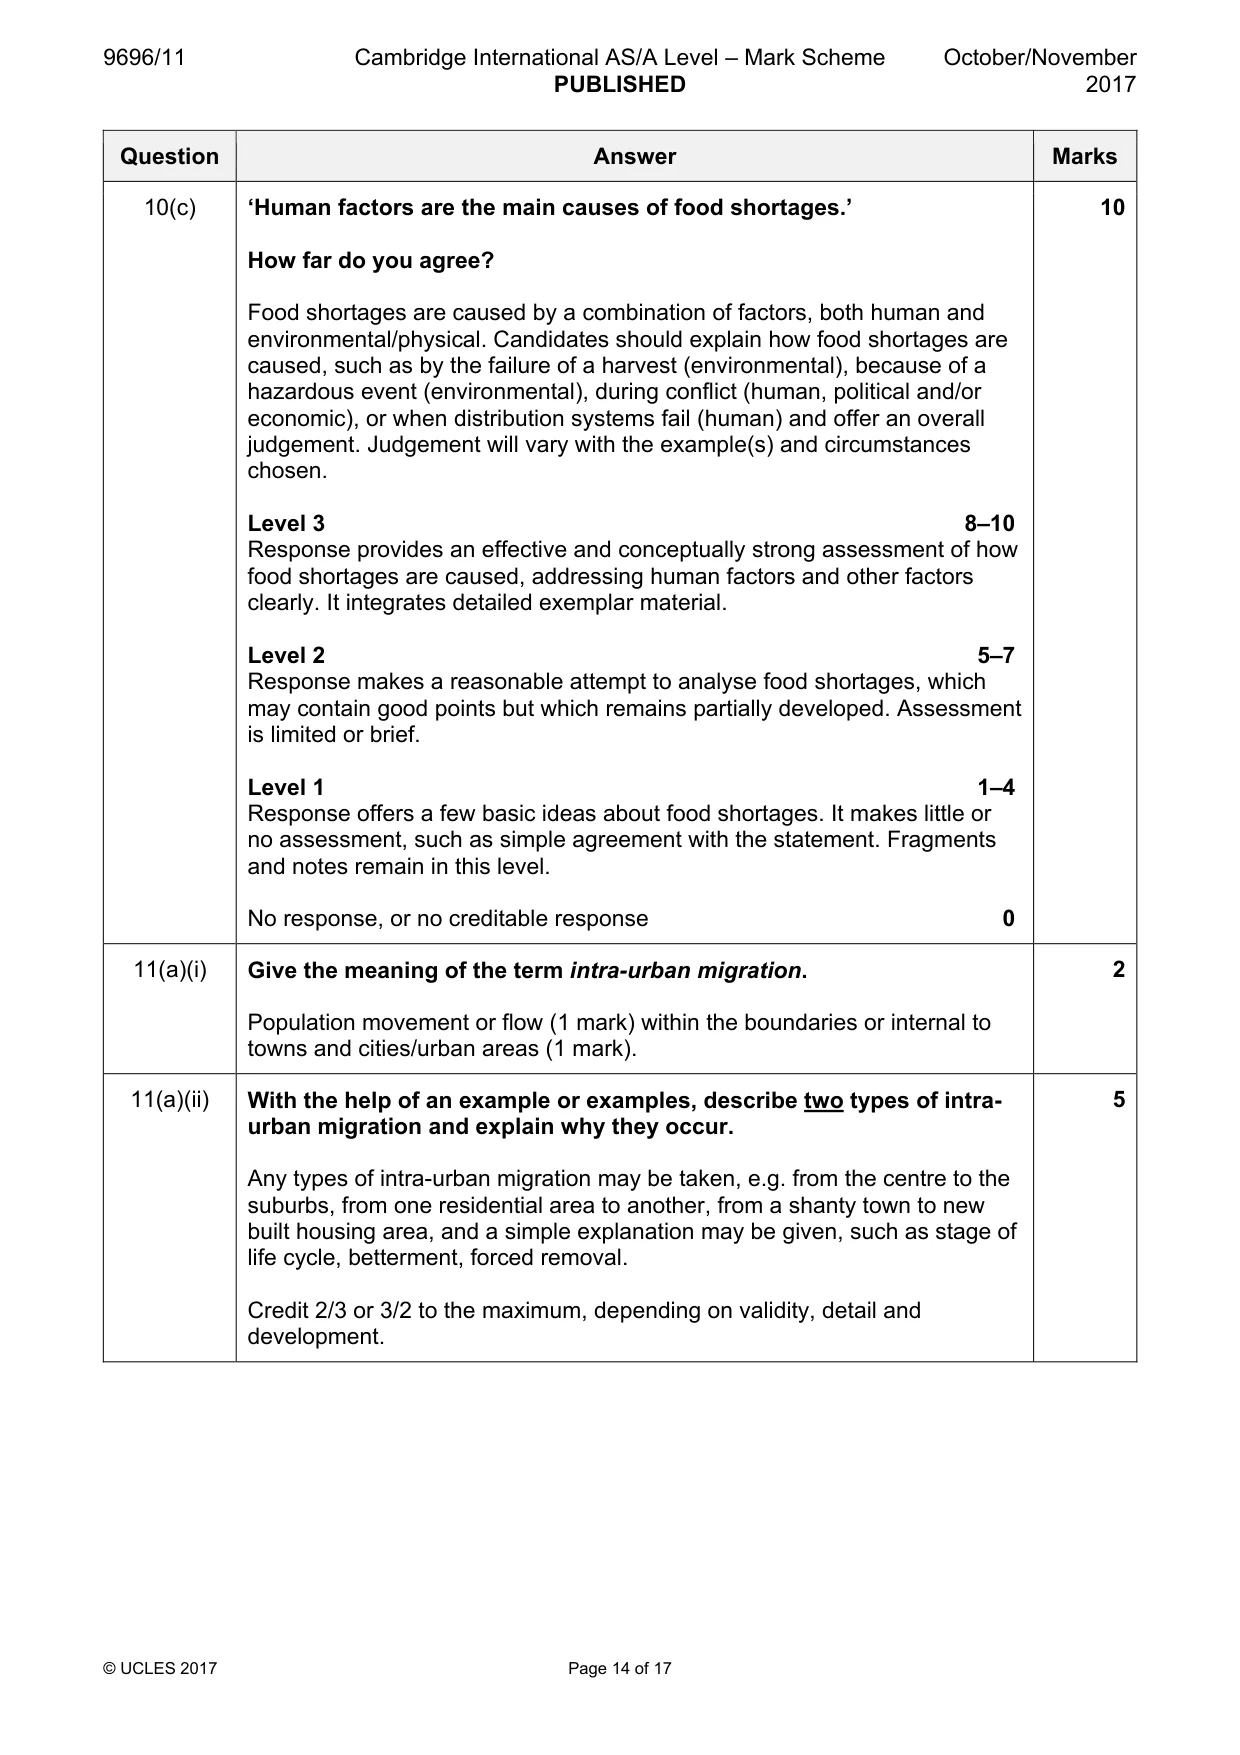
9696/11 Cambridge International AS/A Level – Mark Scheme PUBLISHED October/November 2017 © UCLES 2017 Page 13 of 17 Question Answer Marks 10(a)(i) Define the term underpopulation. Underpopulation is an imbalance in the population-resource relationship: • where there are too few people (1 mark) • to make full use of the resources (1 mark) • at a given level of technology or to achieve the maximum standard of living (1 mark) 3 10(a)(ii) Outline two issues associated with overpopulation. Possible issues include: • social, e.g. overcrowding, hunger, falling standard of living, emigration and out-migration, constrained access to key services, e.g. schooling • economic, e.g. unemployment, underemployment, poverty, personal debt, national debt • physical/environmental, e.g. landlessness, congestion of people and traffic, environmental degradation • political, e.g. disputes, conflict, inadequate governance Credit each issue with a clear link to overpopulation, 2 marks. Examples may be used but are not required for full marks. 4 10(b) Explain why optimum population is difficult to achieve. Optimum population is difficult to achieve for a combination of reasons, including: • it is a theoretical position or state – a graph may be drawn and should be credited • population is dynamic and always changing (by natural increase and migration) • resources are dynamic, e.g. discovery of new minerals, impact of a hazardous event on crop production • technology is dynamic, e.g. agricultural technology • people are individuals and make their own decisions, even where policies exist, e.g. population policy A full response combines reasons and examples and convinces by its conceptual rigour and sense of demographic reality. 8
Mark scheme, page 14
9696/11 Cambridge International AS/A Level – Mark Scheme PUBLISHED October/November 2017 © UCLES 2017 Page 14 of 17 Question Answer Marks 10(c) ‘Human factors are the main causes of food shortages.’ How far do you agree? Food shortages are caused by a combination of factors, both human and environmental/physical. Candidates should explain how food shortages are caused, such as by the failure of a harvest (environmental), because of a hazardous event (environmental), during conflict (human, political and/or economic), or when distribution systems fail (human) and offer an overall judgement. Judgement will vary with the example(s) and circumstances chosen. Level 3 8–10 Response provides an effective and conceptually strong assessment of how food shortages are caused, addressing human factors and other factors clearly. It integrates detailed exemplar material. Level 2 5–7 Response makes a reasonable attempt to analyse food shortages, which may contain good points but which remains partially developed. Assessment is limited or brief. Level 1 1–4 Response offers a few basic ideas about food shortages. It makes little or no assessment, such as simple agreement with the statement. Fragments and notes remain in this level. No response, or no creditable response 0 10 11(a)(i) Give the meaning of the term intra-urban migration. Population movement or flow (1 mark) within the boundaries or internal to towns and cities/urban areas (1 mark). 2 11(a)(ii) With the help of an example or examples, describe two types of intra- urban migration and explain why they occur. Any types of intra-urban migration may be taken, e.g. from the centre to the suburbs, from one residential area to another, from a shanty town to new built housing area, and a simple explanation may be given, such as stage of life cycle, betterment, forced removal. Credit 2/3 or 3/2 to the maximum, depending on validity, detail and development. 5
Mark scheme, page 15
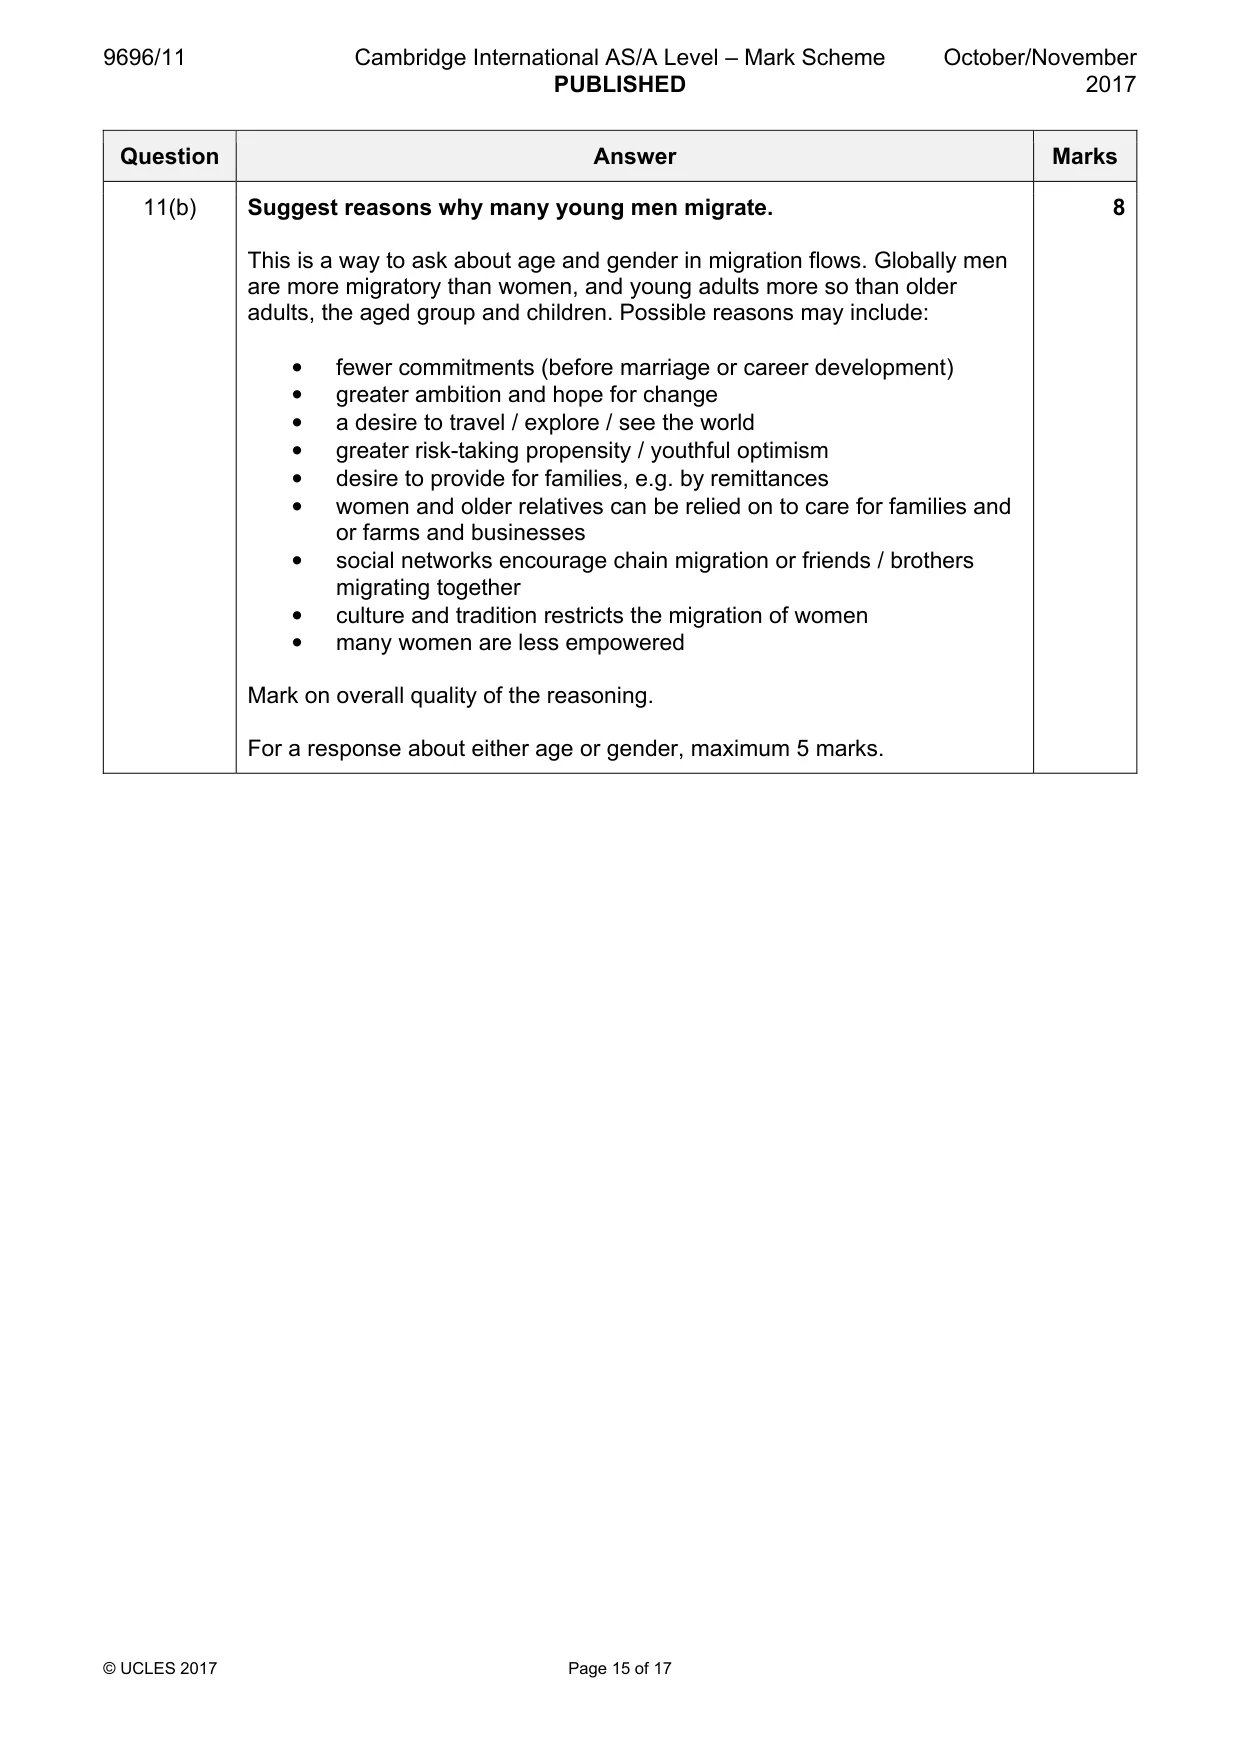
9696/11 Cambridge International AS/A Level – Mark Scheme PUBLISHED October/November 2017 © UCLES 2017 Page 15 of 17 Question Answer Marks 11(b) Suggest reasons why many young men migrate. This is a way to ask about age and gender in migration flows. Globally men are more migratory than women, and young adults more so than older adults, the aged group and children. Possible reasons may include: • fewer commitments (before marriage or career development) • greater ambition and hope for change • a desire to travel / explore / see the world • greater risk-taking propensity / youthful optimism • desire to provide for families, e.g. by remittances • women and older relatives can be relied on to care for families and or farms and businesses • social networks encourage chain migration or friends / brothers migrating together • culture and tradition restricts the migration of women • many women are less empowered Mark on overall quality of the reasoning. For a response about either age or gender, maximum 5 marks. 8
Mark scheme, page 16
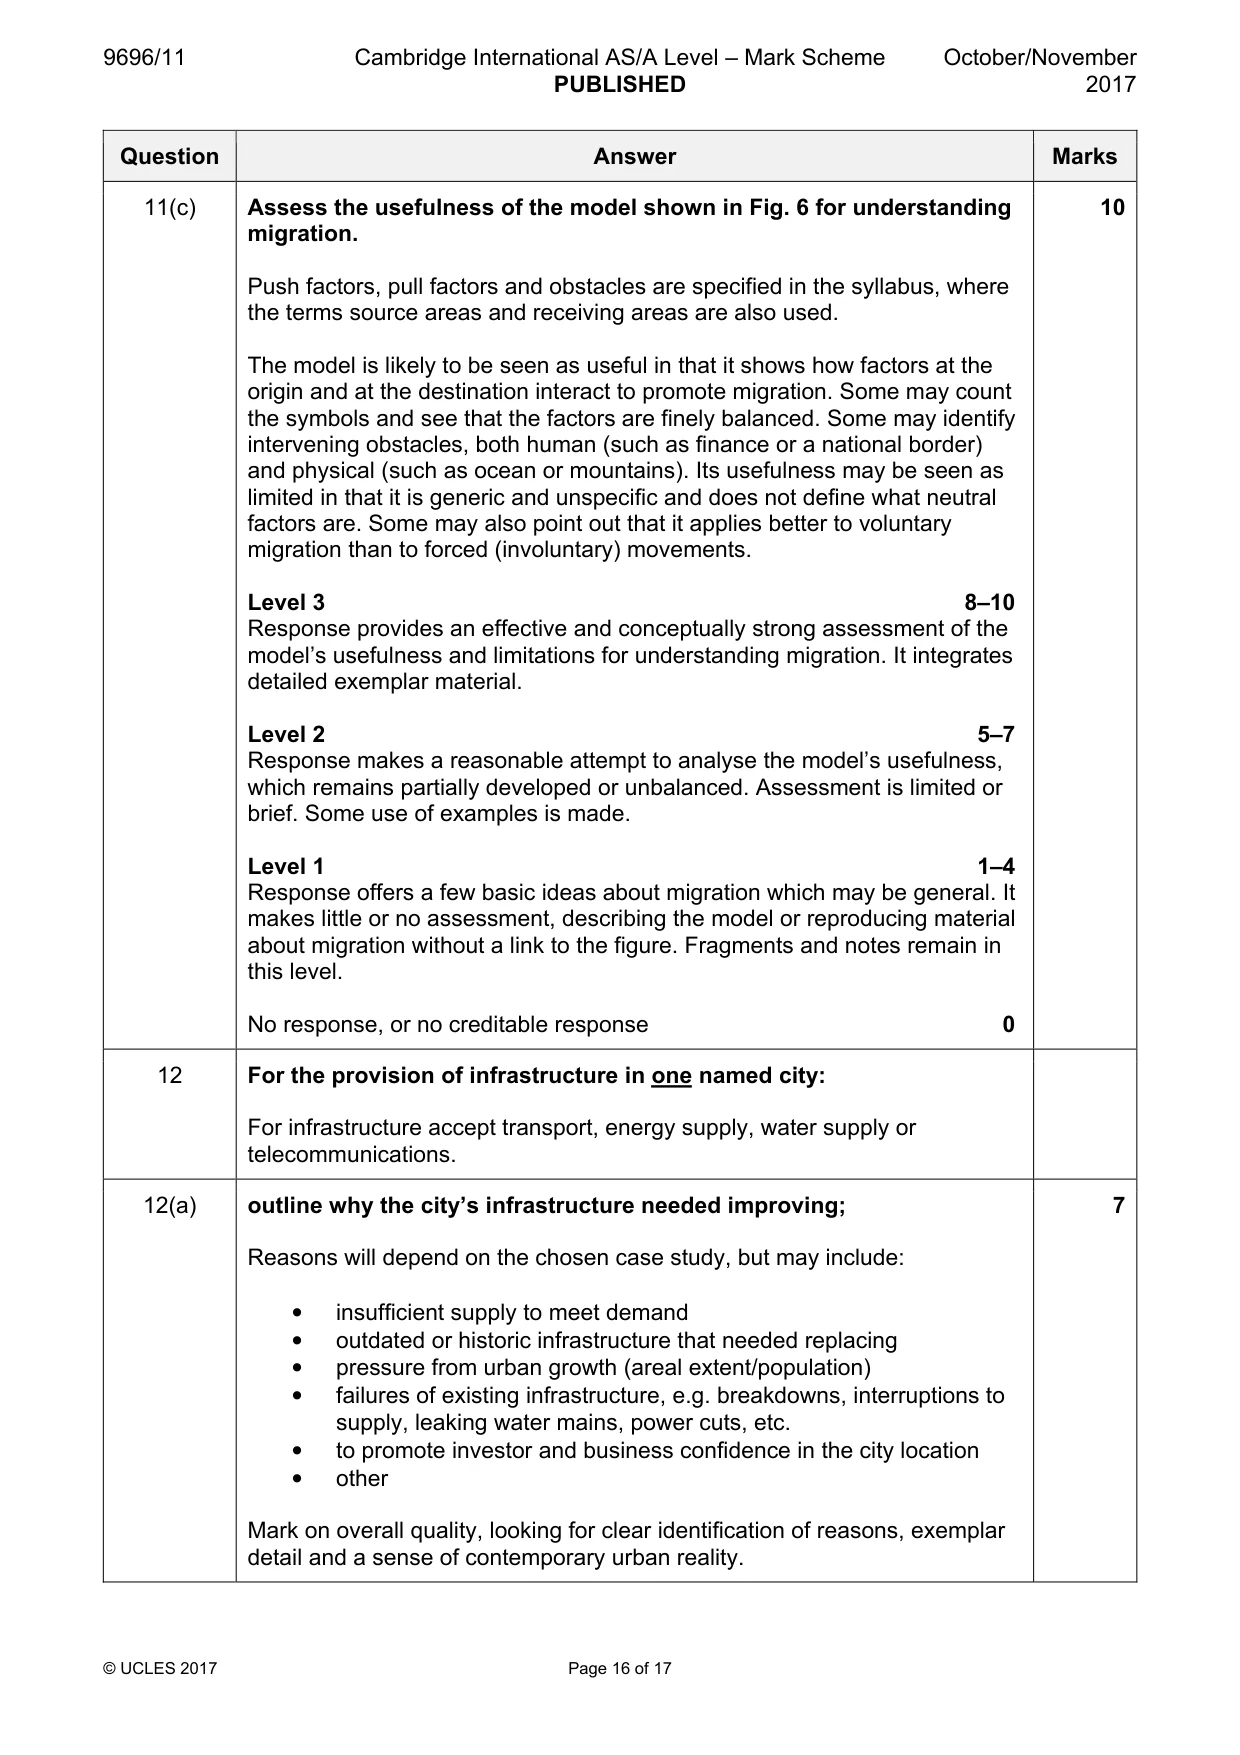
9696/11 Cambridge International AS/A Level – Mark Scheme PUBLISHED October/November 2017 © UCLES 2017 Page 16 of 17 Question Answer Marks 11(c) Assess the usefulness of the model shown in Fig. 6 for understanding migration. Push factors, pull factors and obstacles are specified in the syllabus, where the terms source areas and receiving areas are also used. The model is likely to be seen as useful in that it shows how factors at the origin and at the destination interact to promote migration. Some may count the symbols and see that the factors are finely balanced. Some may identify intervening obstacles, both human (such as finance or a national border) and physical (such as ocean or mountains). Its usefulness may be seen as limited in that it is generic and unspecific and does not define what neutral factors are. Some may also point out that it applies better to voluntary migration than to forced (involuntary) movements. Level 3 8–10 Response provides an effective and conceptually strong assessment of the model’s usefulness and limitations for understanding migration. It integrates detailed exemplar material. Level 2 5–7 Response makes a reasonable attempt to analyse the model’s usefulness, which remains partially developed or unbalanced. Assessment is limited or brief. Some use of examples is made. Level 1 1–4 Response offers a few basic ideas about migration which may be general. It makes little or no assessment, describing the model or reproducing material about migration without a link to the figure. Fragments and notes remain in this level. No response, or no creditable response 0 10 12 For the provision of infrastructure in one named city: For infrastructure accept transport, energy supply, water supply or telecommunications. 12(a) outline why the city’s infrastructure needed improving; Reasons will depend on the chosen case study, but may include: • insufficient supply to meet demand • outdated or historic infrastructure that needed replacing • pressure from urban growth (areal extent/population) • failures of existing infrastructure, e.g. breakdowns, interruptions to supply, leaking water mains, power cuts, etc. • to promote investor and business confidence in the city location • other Mark on overall quality, looking for clear identification of reasons, exemplar detail and a sense of contemporary urban reality. 7
Mark scheme, page 17
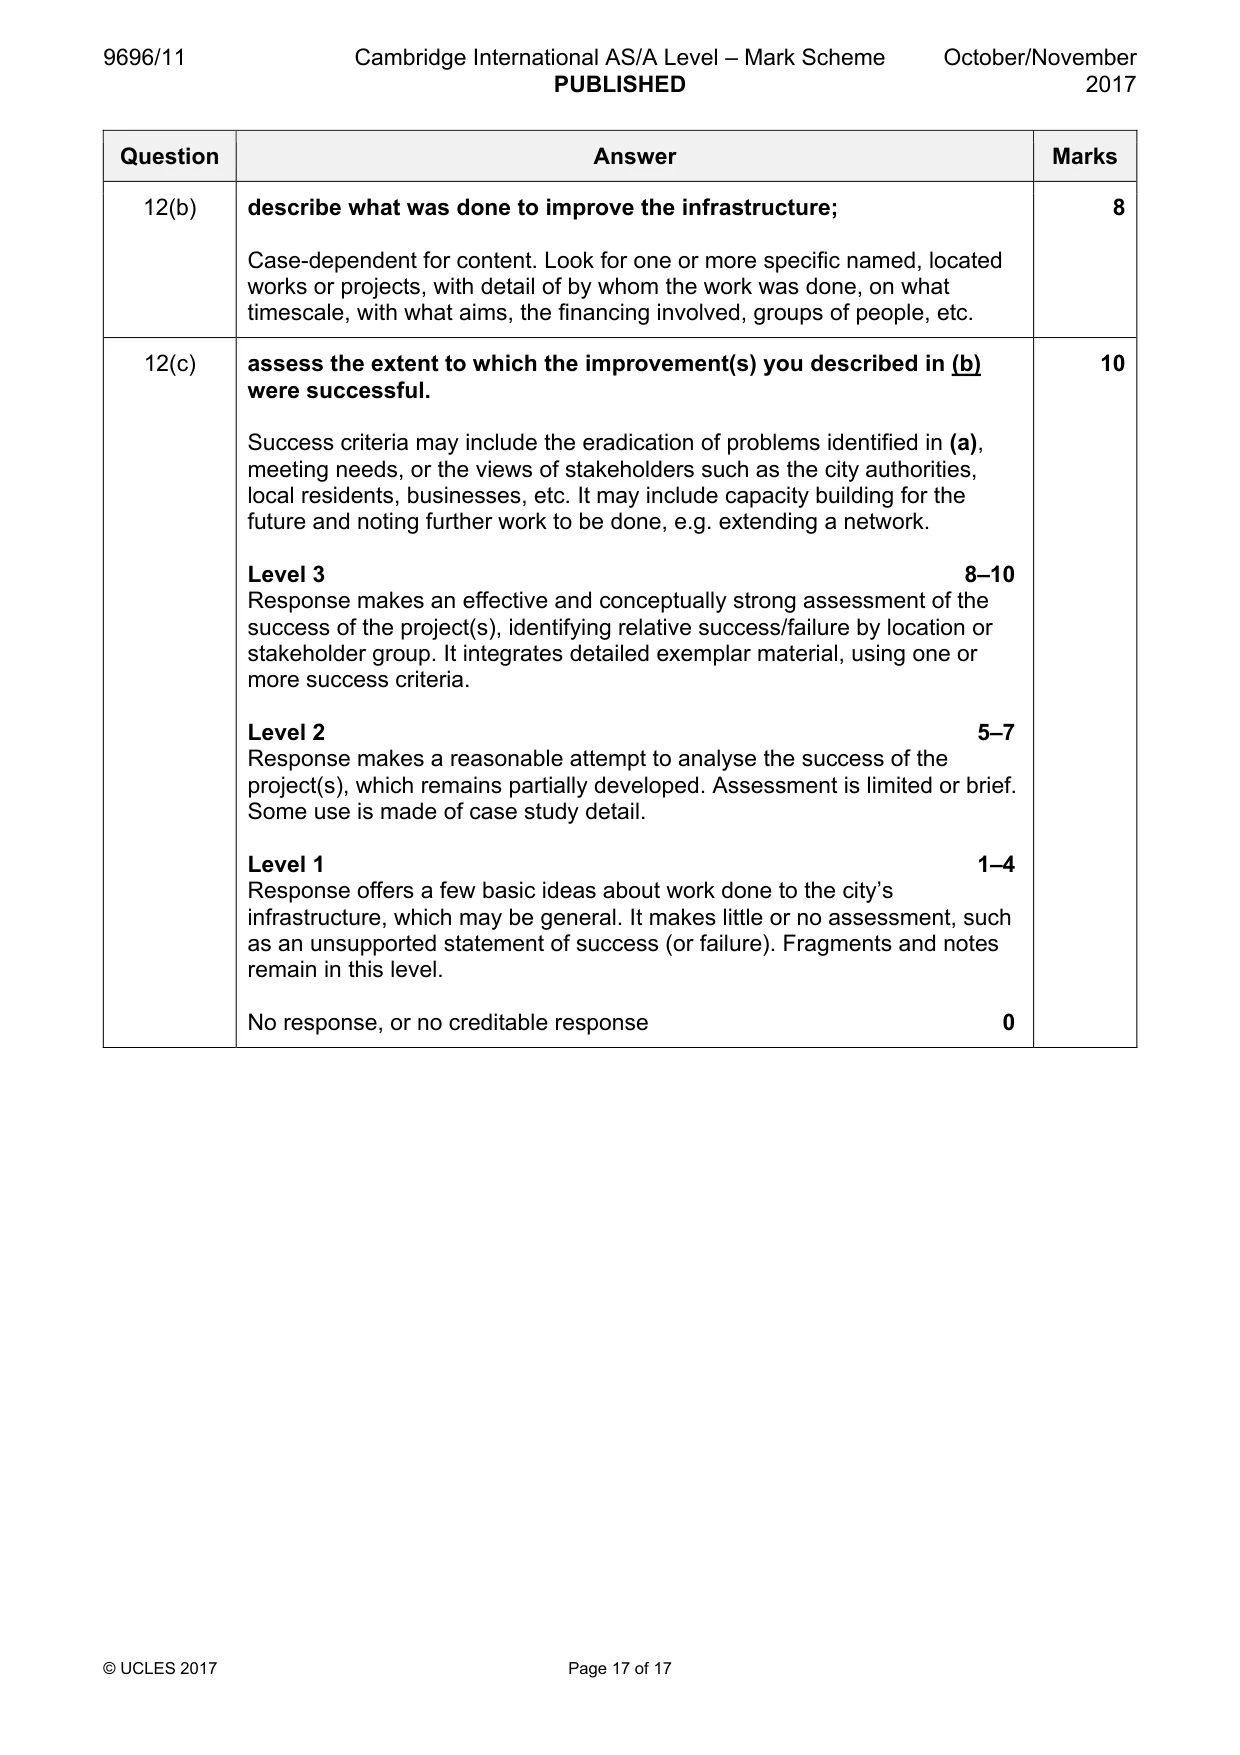
9696/11 Cambridge International AS/A Level – Mark Scheme PUBLISHED October/November 2017 © UCLES 2017 Page 17 of 17 Question Answer Marks 12(b) describe what was done to improve the infrastructure; Case-dependent for content. Look for one or more specific named, located works or projects, with detail of by whom the work was done, on what timescale, with what aims, the financing involved, groups of people, etc. 8 12(c) assess the extent to which the improvement(s) you described in (b) were successful. Success criteria may include the eradication of problems identified in (a), meeting needs, or the views of stakeholders such as the city authorities, local residents, businesses, etc. It may include capacity building for the future and noting further work to be done, e.g. extending a network. Level 3 8–10 Response makes an effective and conceptually strong assessment of the success of the project(s), identifying relative success/failure by location or stakeholder group. It integrates detailed exemplar material, using one or more success criteria. Level 2 5–7 Response makes a reasonable attempt to analyse the success of the project(s), which remains partially developed. Assessment is limited or brief. Some use is made of case study detail. Level 1 1–4 Response offers a few basic ideas about work done to the city’s infrastructure, which may be general. It makes little or no assessment, such as an unsupported statement of success (or failure). Fragments and notes remain in this level. No response, or no creditable response 0 10
What you needed in this session
Cambridge’s own grade thresholds for 2017 Oct/Nov, Paper 1 · Variant 1. A higher threshold means an easier paper — the bar moves with how the cohort did.