Cambridge A Level Geography 9696 — 2017 Oct/Nov Paper 1 · Variant 2
9696/12/O/N/17 · 100 marks · ≈113 min
The question paper and its mark scheme, free to read here and free to download. This is Cambridge’s own paper, exactly as it was sat.
Question paper8 pages



Mark scheme20 pages
Answers below. Sit the paper first if you are practising.



Paper as text
Question paper, page 1
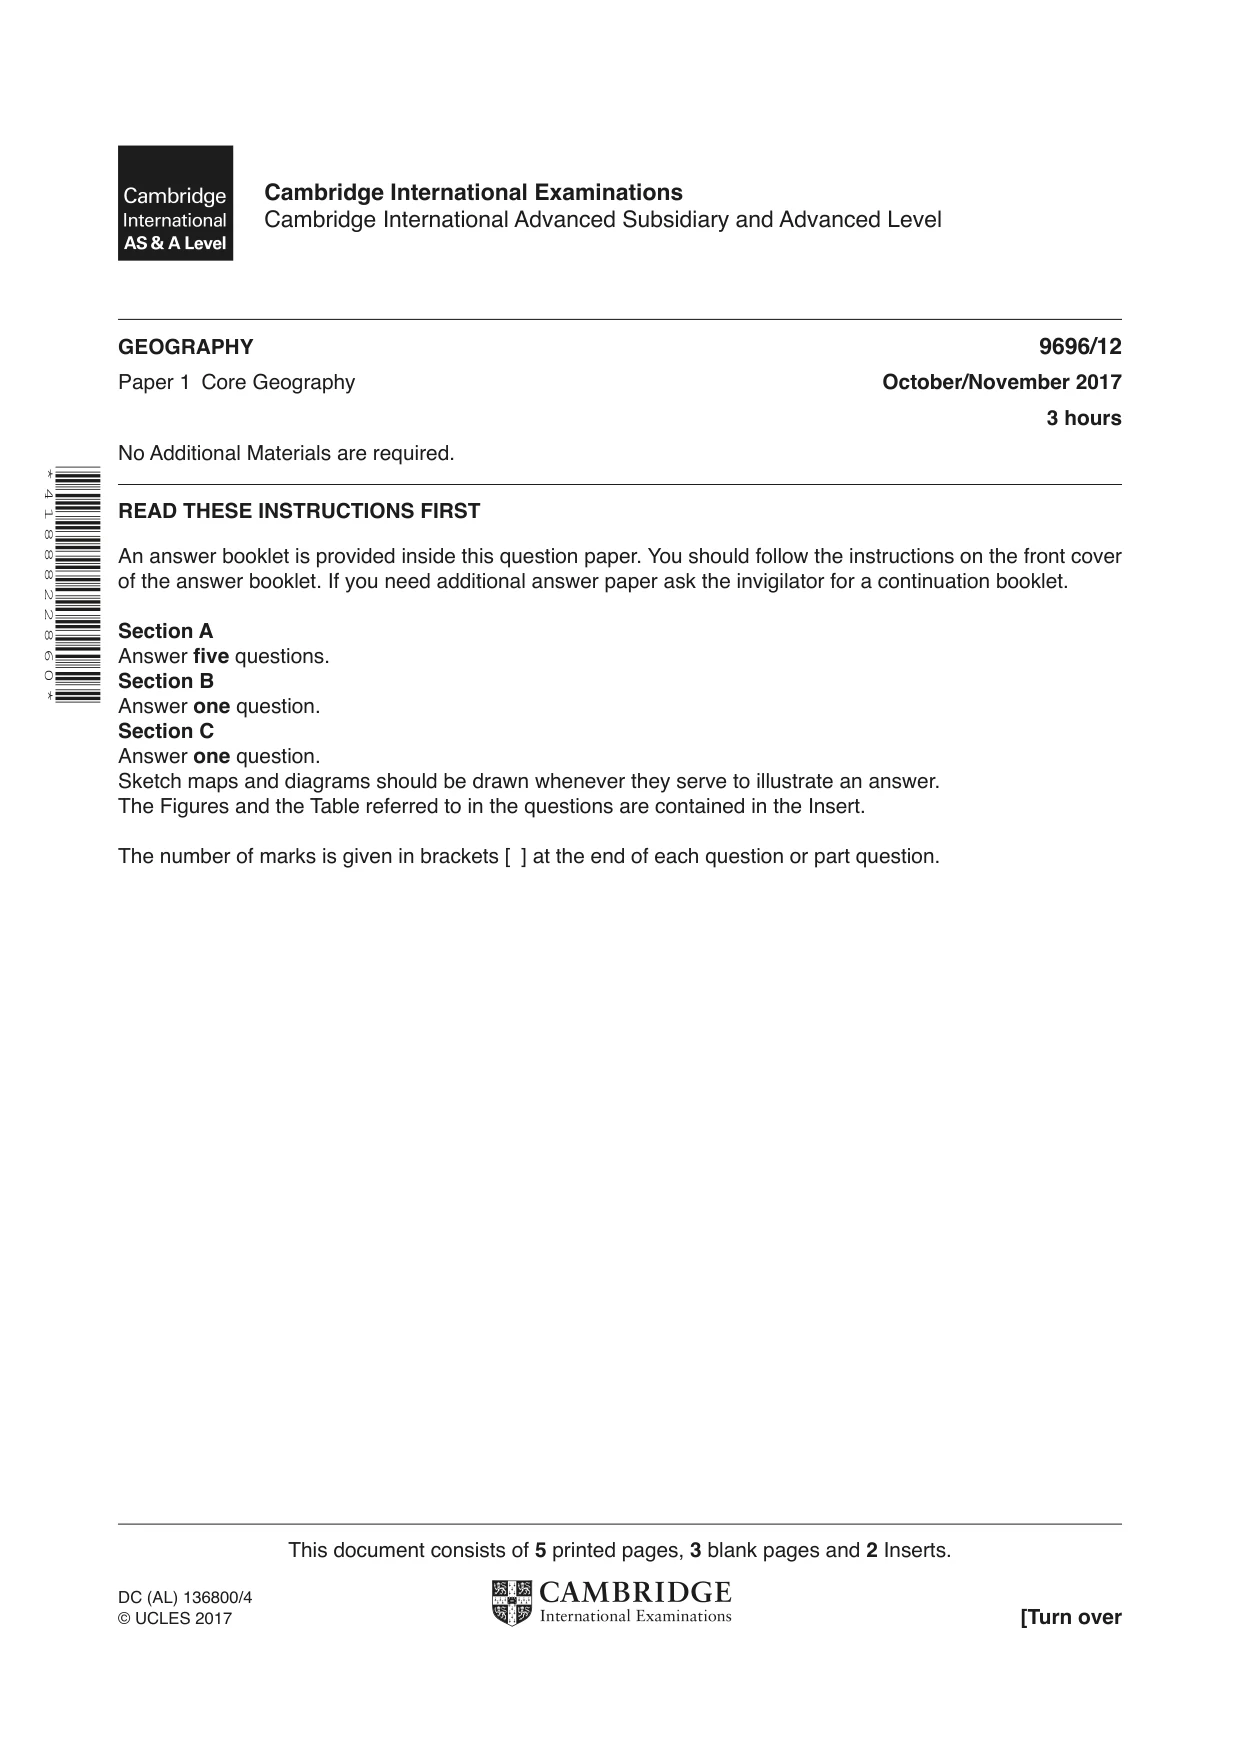
* 4 1 8 8 8 2 2 8 6 0 * This document consists of 5 printed pages, 3 blank pages and 2 Inserts. DC (AL) 136800/4 © UCLES 2017 [Turn over Cambridge International Examinations Cambridge International Advanced Subsidiary and Advanced Level GEOGRAPHY 9696/12 Paper 1 Core Geography October/November 2017 3 hours No Additional Materials are required. READ THESE INSTRUCTIONS FIRST An answer booklet is provided inside this question paper. You should follow the instructions on the front cover of the answer booklet. If you need additional answer paper ask the invigilator for a continuation booklet. Section A Answer five questions. Section B Answer one question. Section C Answer one question. Sketch maps and diagrams should be drawn whenever they serve to illustrate an answer. The Figures and the Table referred to in the questions are contained in the Insert. The number of marks is given in brackets [ ] at the end of each question or part question.
Question paper, page 2
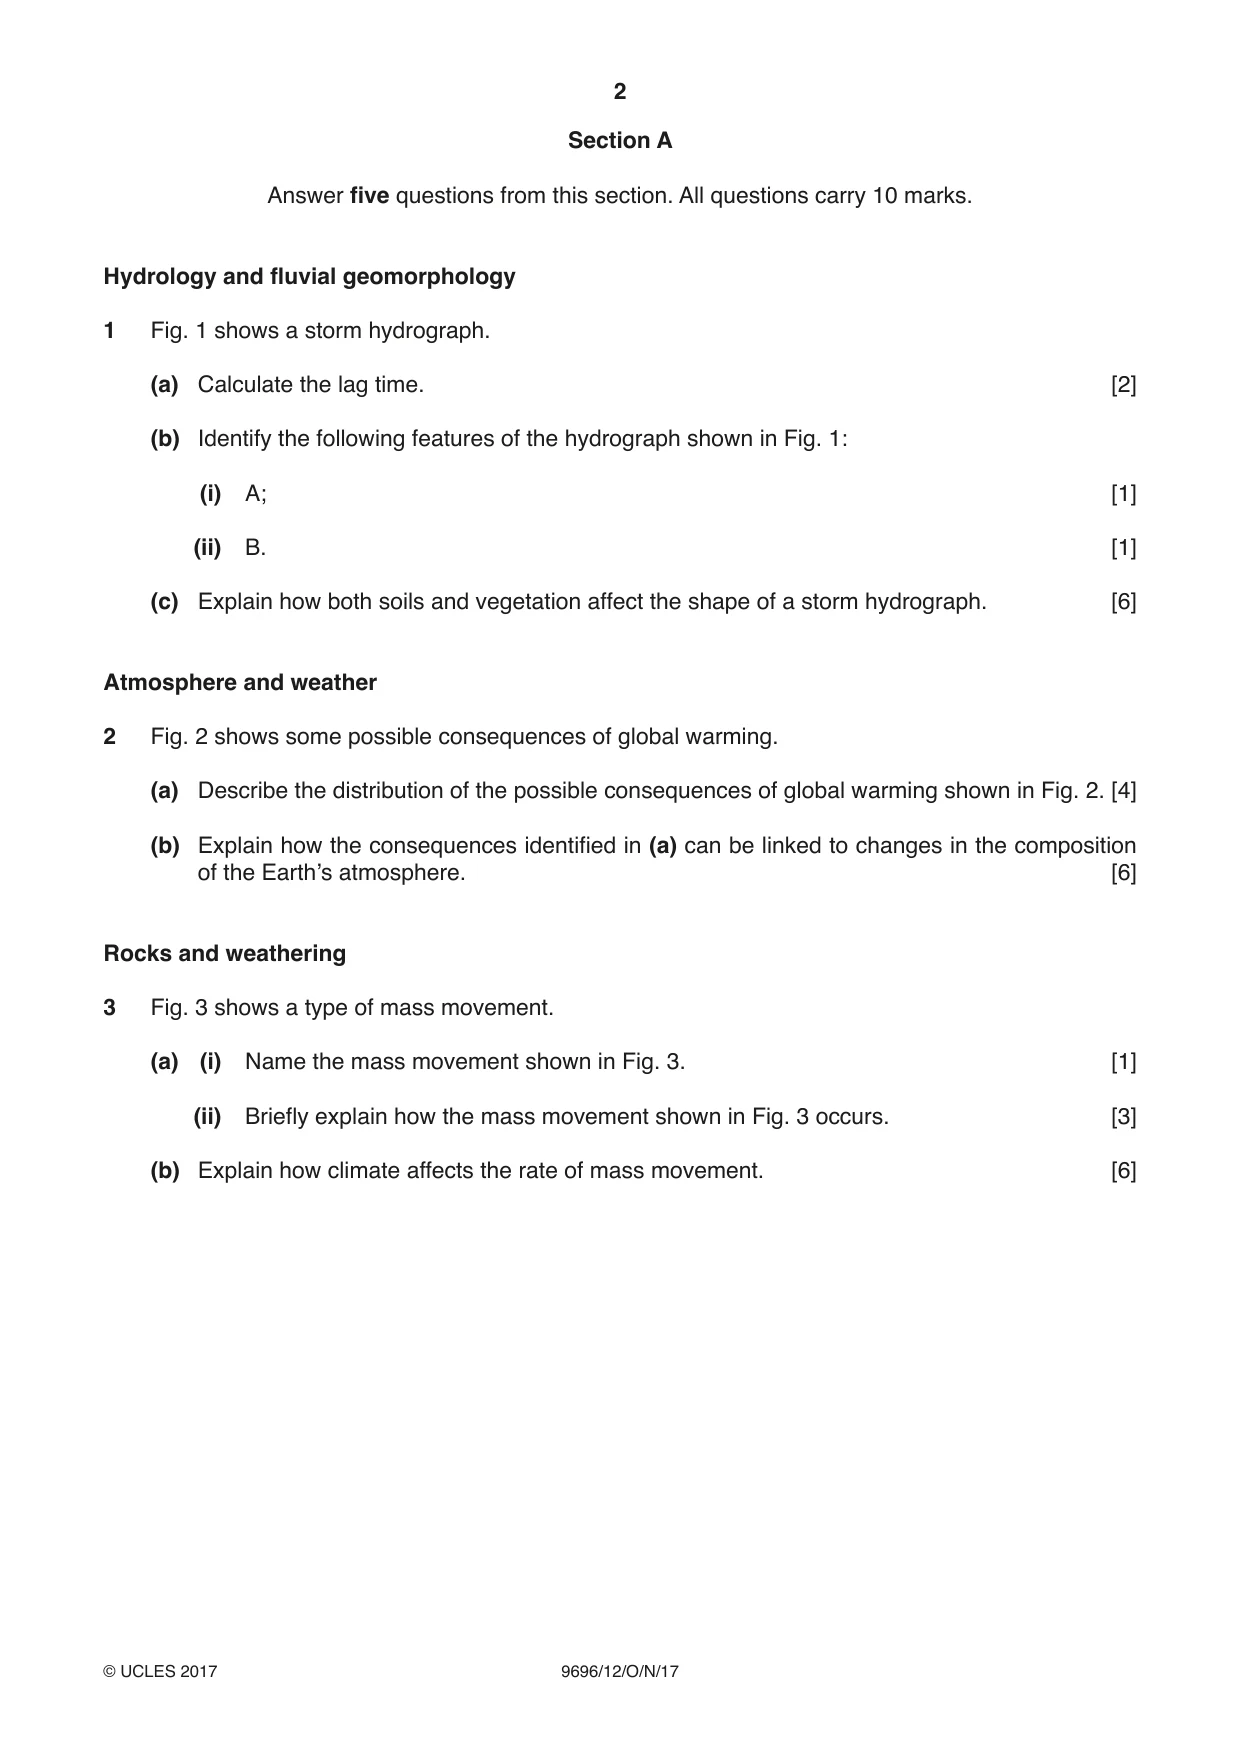
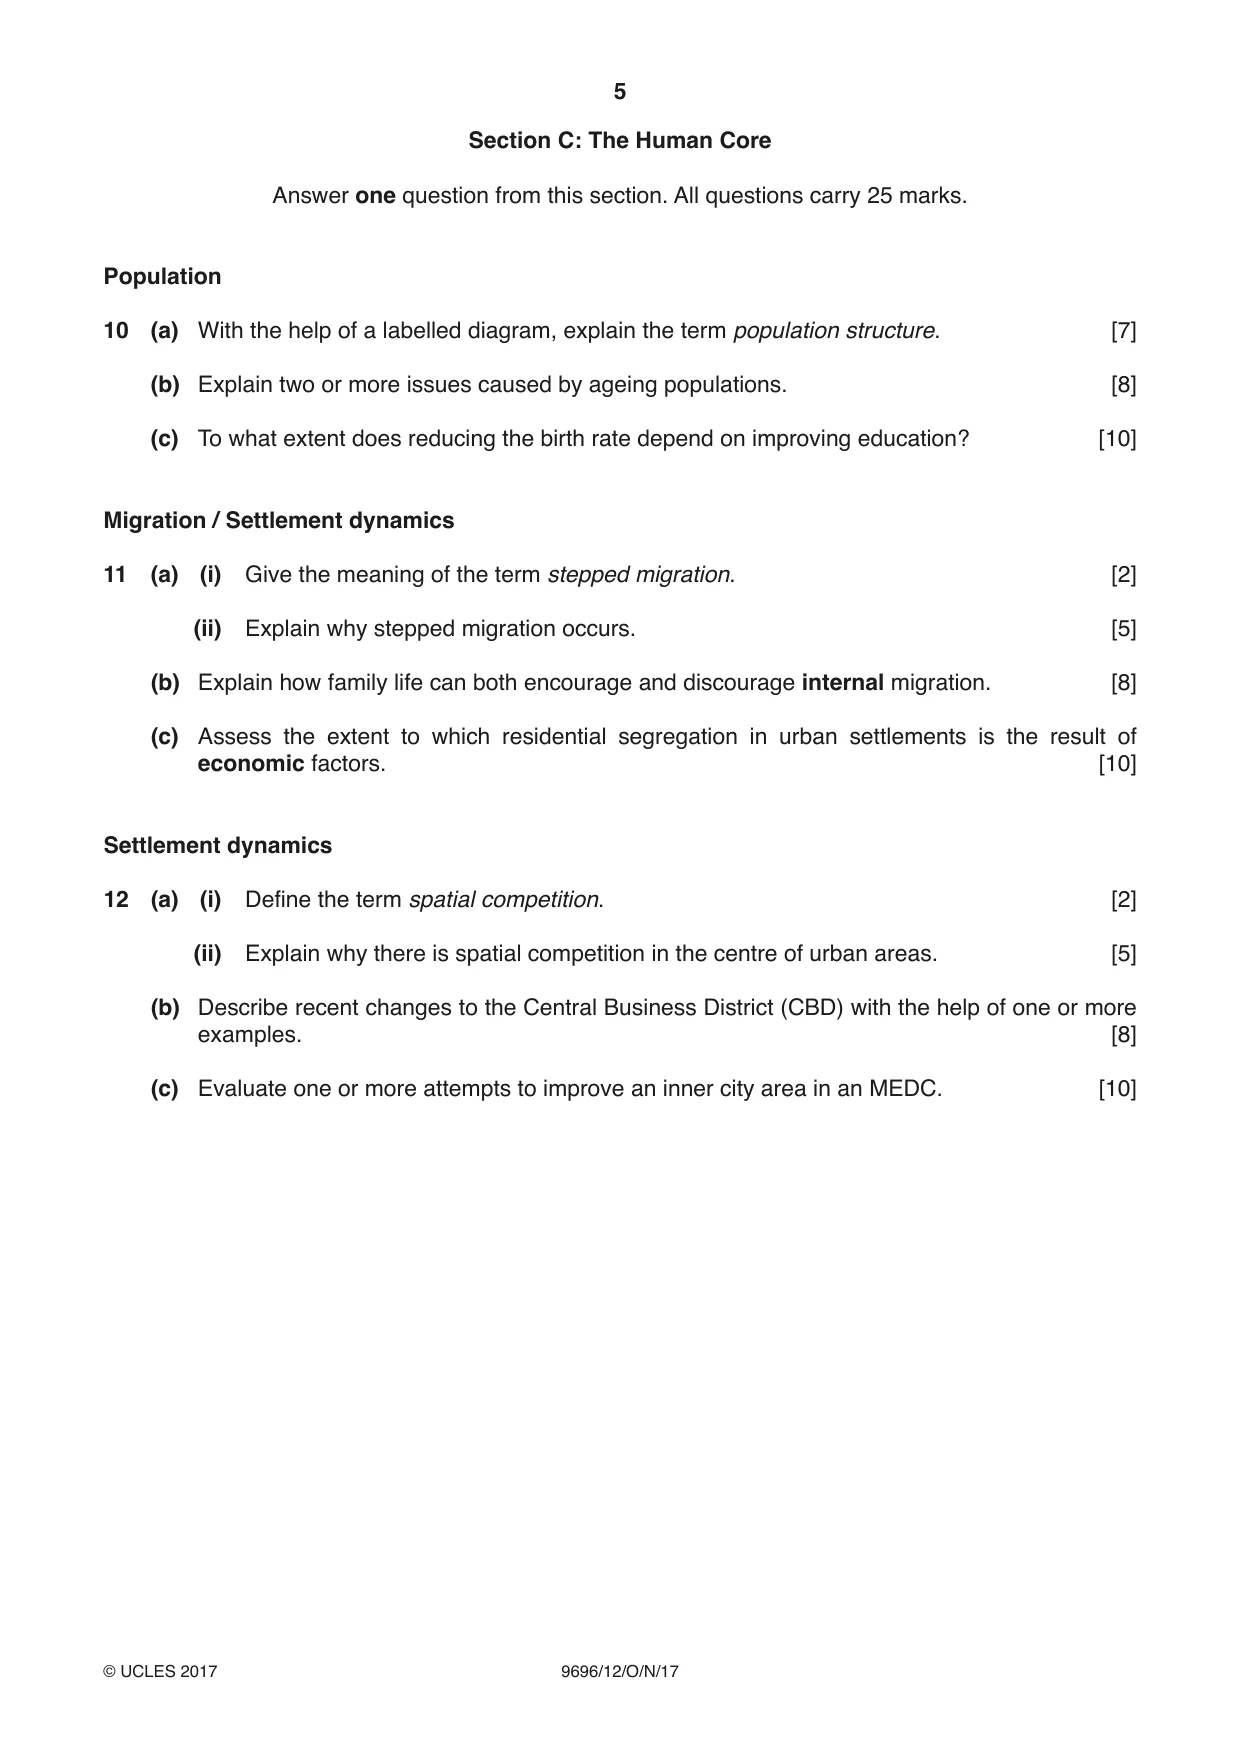
2 9696/12/O/N/17 © UCLES 2017 Section A Answer five questions from this section. All questions carry 10 marks. Hydrology and fluvial geomorphology 1 Fig. 1 shows a storm hydrograph. (a) Calculate the lag time. [2] (b) Identify the following features of the hydrograph shown in Fig. 1: (i) A; [1] (ii) B. [1] (c) Explain how both soils and vegetation affect the shape of a storm hydrograph. [6] Atmosphere and weather 2 Fig. 2 shows some possible consequences of global warming. (a) Describe the distribution of the possible consequences of global warming shown in Fig. 2. [4] (b) Explain how the consequences identified in (a) can be linked to changes in the composition of the Earth’s atmosphere. [6] Rocks and weathering 3 Fig. 3 shows a type of mass movement. (a) (i) Name the mass movement shown in Fig. 3. [1] (ii) Briefly explain how the mass movement shown in Fig. 3 occurs. [3] (b) Explain how climate affects the rate of mass movement. [6]
Question paper, page 3
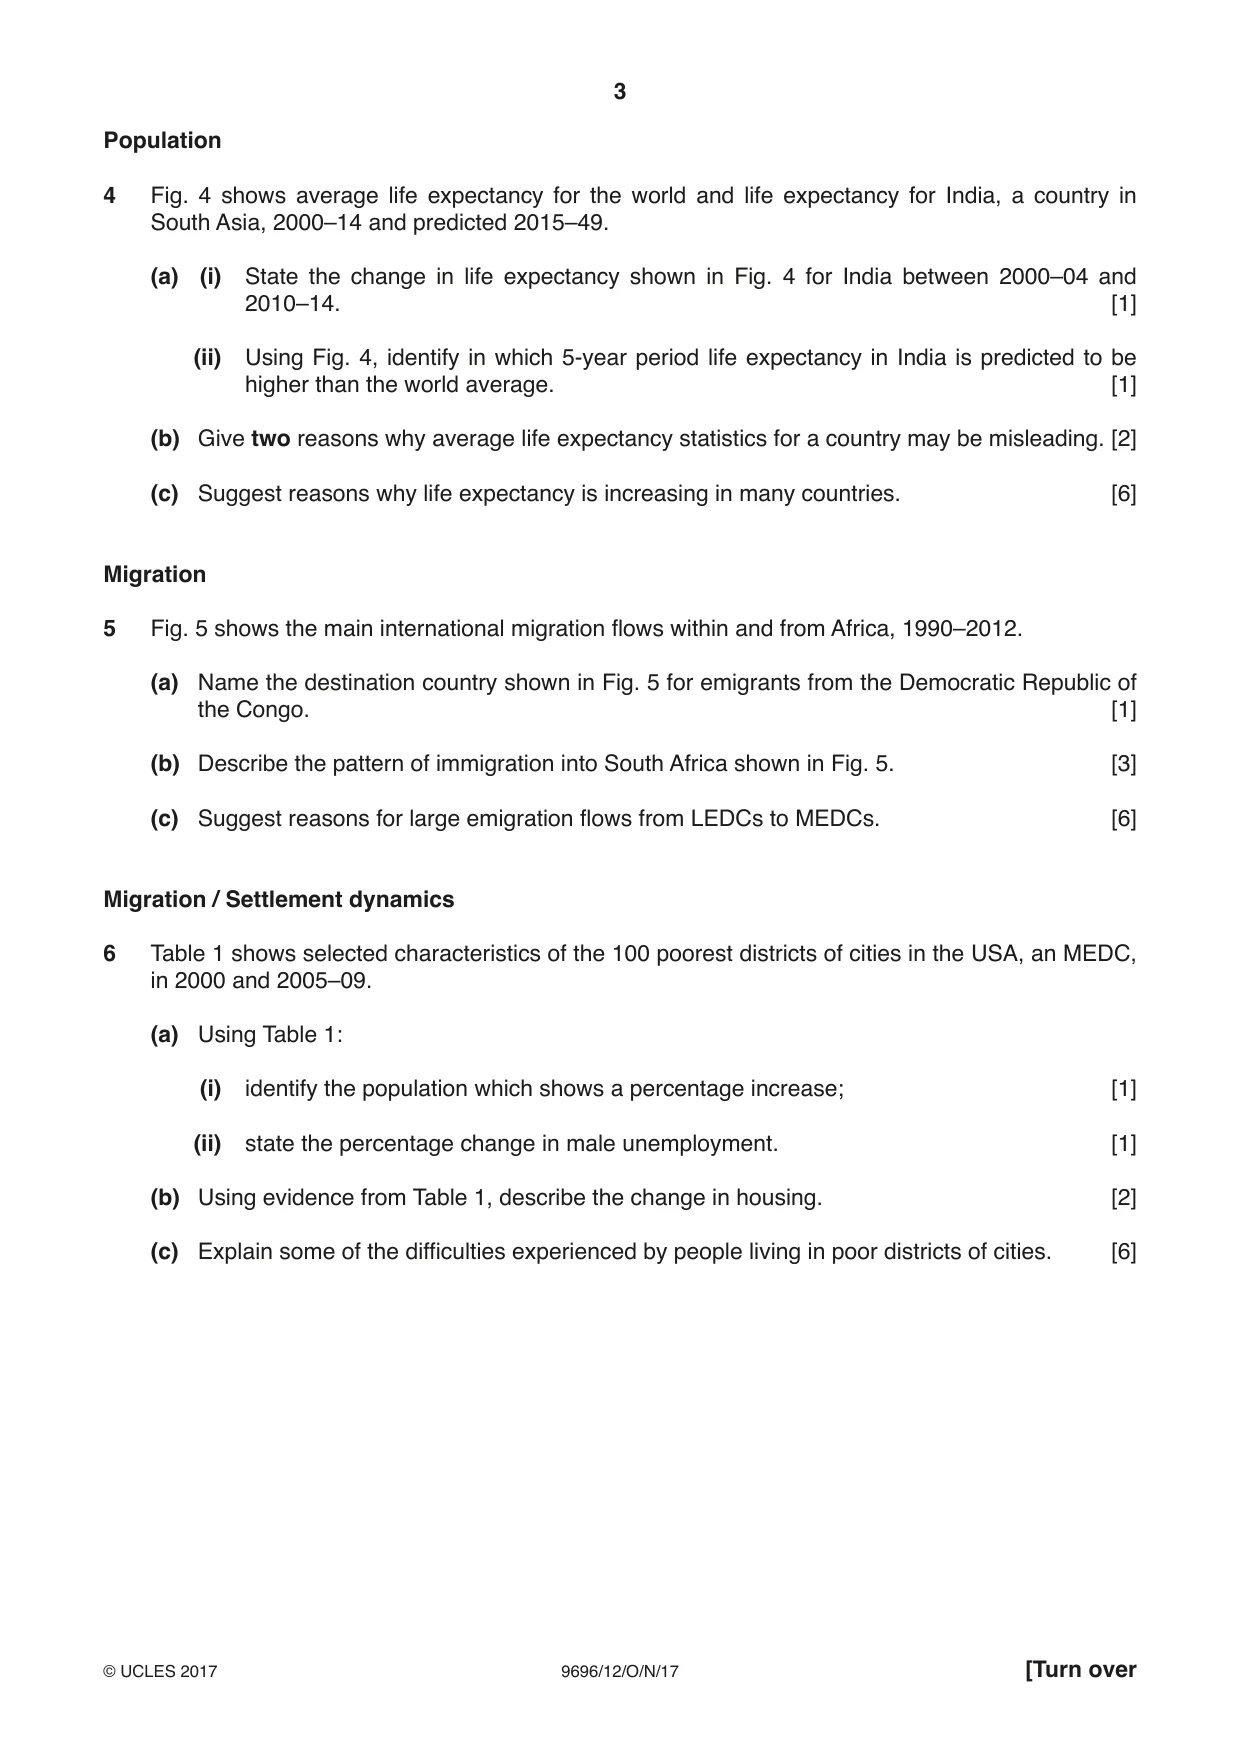
3 9696/12/O/N/17 © UCLES 2017 [Turn over Population 4 Fig. 4 shows average life expectancy for the world and life expectancy for India, a country in South Asia, 2000–14 and predicted 2015–49. (a) (i) State the change in life expectancy shown in Fig. 4 for India between 2000–04 and 2010–14. [1] (ii) Using Fig. 4, identify in which 5-year period life expectancy in India is predicted to be higher than the world average. [1] (b) Give two reasons why average life expectancy statistics for a country may be misleading. [2] (c) Suggest reasons why life expectancy is increasing in many countries. [6] Migration 5 Fig. 5 shows the main international migration flows within and from Africa, 1990–2012. (a) Name the destination country shown in Fig. 5 for emigrants from the Democratic Republic of the Congo. [1] (b) Describe the pattern of immigration into South Africa shown in Fig. 5. [3] (c) Suggest reasons for large emigration flows from LEDCs to MEDCs. [6] Migration / Settlement dynamics 6 Table 1 shows selected characteristics of the 100 poorest districts of cities in the USA, an MEDC, in 2000 and 2005–09. (a) Using Table 1: (i) identify the population which shows a percentage increase; [1] (ii) state the percentage change in male unemployment. [1] (b) Using evidence from Table 1, describe the change in housing. [2] (c) Explain some of the difficulties experienced by people living in poor districts of cities. [6]
Question paper, page 4
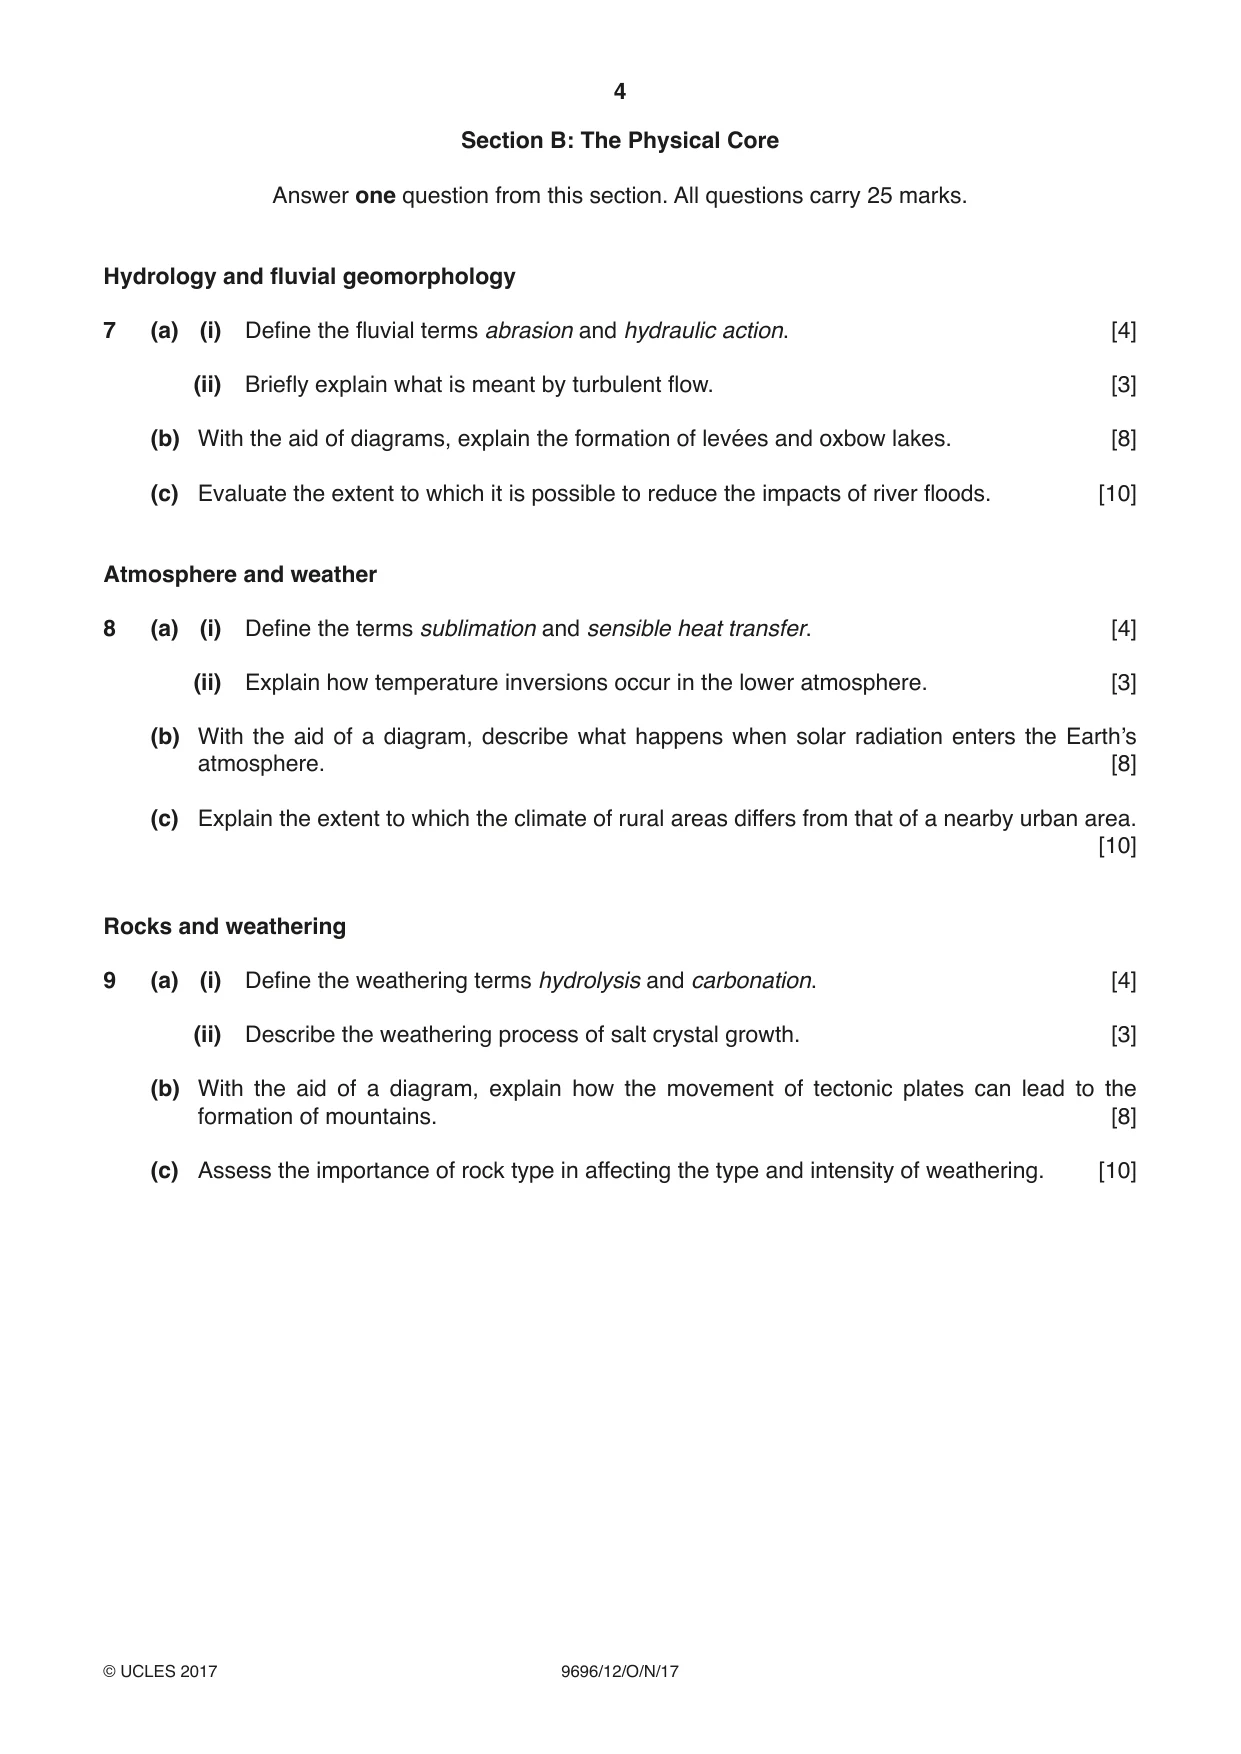
4 9696/12/O/N/17 © UCLES 2017 Section B: The Physical Core Answer one question from this section. All questions carry 25 marks. Hydrology and fluvial geomorphology 7 (a) (i) Define the fluvial terms abrasion and hydraulic action. [4] (ii) Briefly explain what is meant by turbulent flow. [3] (b) With the aid of diagrams, explain the formation of levées and oxbow lakes. [8] (c) Evaluate the extent to which it is possible to reduce the impacts of river floods. [10] Atmosphere and weather 8 (a) (i) Define the terms sublimation and sensible heat transfer. [4] (ii) Explain how temperature inversions occur in the lower atmosphere. [3] (b) With the aid of a diagram, describe what happens when solar radiation enters the Earth’s atmosphere. [8] (c) Explain the extent to which the climate of rural areas differs from that of a nearby urban area. [10] Rocks and weathering 9 (a) (i) Define the weathering terms hydrolysis and carbonation. [4] (ii) Describe the weathering process of salt crystal growth. [3] (b) With the aid of a diagram, explain how the movement of tectonic plates can lead to the formation of mountains. [8] (c) Assess the importance of rock type in affecting the type and intensity of weathering. [10]
Question paper, page 5
5 9696/12/O/N/17 © UCLES 2017 Section C: The Human Core Answer one question from this section. All questions carry 25 marks. Population 10 (a) With the help of a labelled diagram, explain the term population structure. [7] (b) Explain two or more issues caused by ageing populations. [8] (c) To what extent does reducing the birth rate depend on improving education? [10] Migration / Settlement dynamics 11 (a) (i) Give the meaning of the term stepped migration. [2] (ii) Explain why stepped migration occurs. [5] (b) Explain how family life can both encourage and discourage internal migration. [8] (c) Assess the extent to which residential segregation in urban settlements is the result of economic factors. [10] Settlement dynamics 12 (a) (i) Define the term spatial competition. [2] (ii) Explain why there is spatial competition in the centre of urban areas. [5] (b) Describe recent changes to the Central Business District (CBD) with the help of one or more examples. [8] (c) Evaluate one or more attempts to improve an inner city area in an MEDC. [10]
Question paper, page 6
6 9696/12/O/N/17 © UCLES 2017 BLANK PAGE
Question paper, page 7
7 9696/12/O/N/17 © UCLES 2017 BLANK PAGE
Question paper, page 8
8 9696/12/O/N/17 © UCLES 2017 BLANK PAGE Permission to reproduce items where third-party owned material protected by copyright is included has been sought and cleared where possible. Every reasonable effort has been made by the publisher (UCLES) to trace copyright holders, but if any items requiring clearance have unwittingly been included, the publisher will be pleased to make amends at the earliest possible opportunity. To avoid the issue of disclosure of answer-related information to candidates, all copyright acknowledgements are reproduced online in the Cambridge International Examinations Copyright Acknowledgements Booklet. This is produced for each series of examinations and is freely available to download at www.cie.org.uk after the live examination series. Cambridge International Examinations is part of the Cambridge Assessment Group. Cambridge Assessment is the brand name of University of Cambridge Local Examinations Syndicate (UCLES), which is itself a department of the University of Cambridge.
Mark scheme, page 1
® IGCSE is a registered trademark. This document consists of 20 printed pages. © UCLES 2017 [Turn over Cambridge Assessment International Education Cambridge International Advanced Subsidiary and Advanced Level GEOGRAPHY 9696/12 Paper 1 Core Geography October/November 2017 MARK SCHEME Maximum Mark: 100 Published This mark scheme is published as an aid to teachers and candidates, to indicate the requirements of the examination. It shows the basis on which Examiners were instructed to award marks. It does not indicate the details of the discussions that took place at an Examiners’ meeting before marking began, which would have considered the acceptability of alternative answers. Mark schemes should be read in conjunction with the question paper and the Principal Examiner Report for Teachers. Cambridge International will not enter into discussions about these mark schemes. Cambridge International is publishing the mark schemes for the October/November 2017 series for most Cambridge IGCSE®, Cambridge International A and AS Level components and some Cambridge O Level components.
Mark scheme, page 2
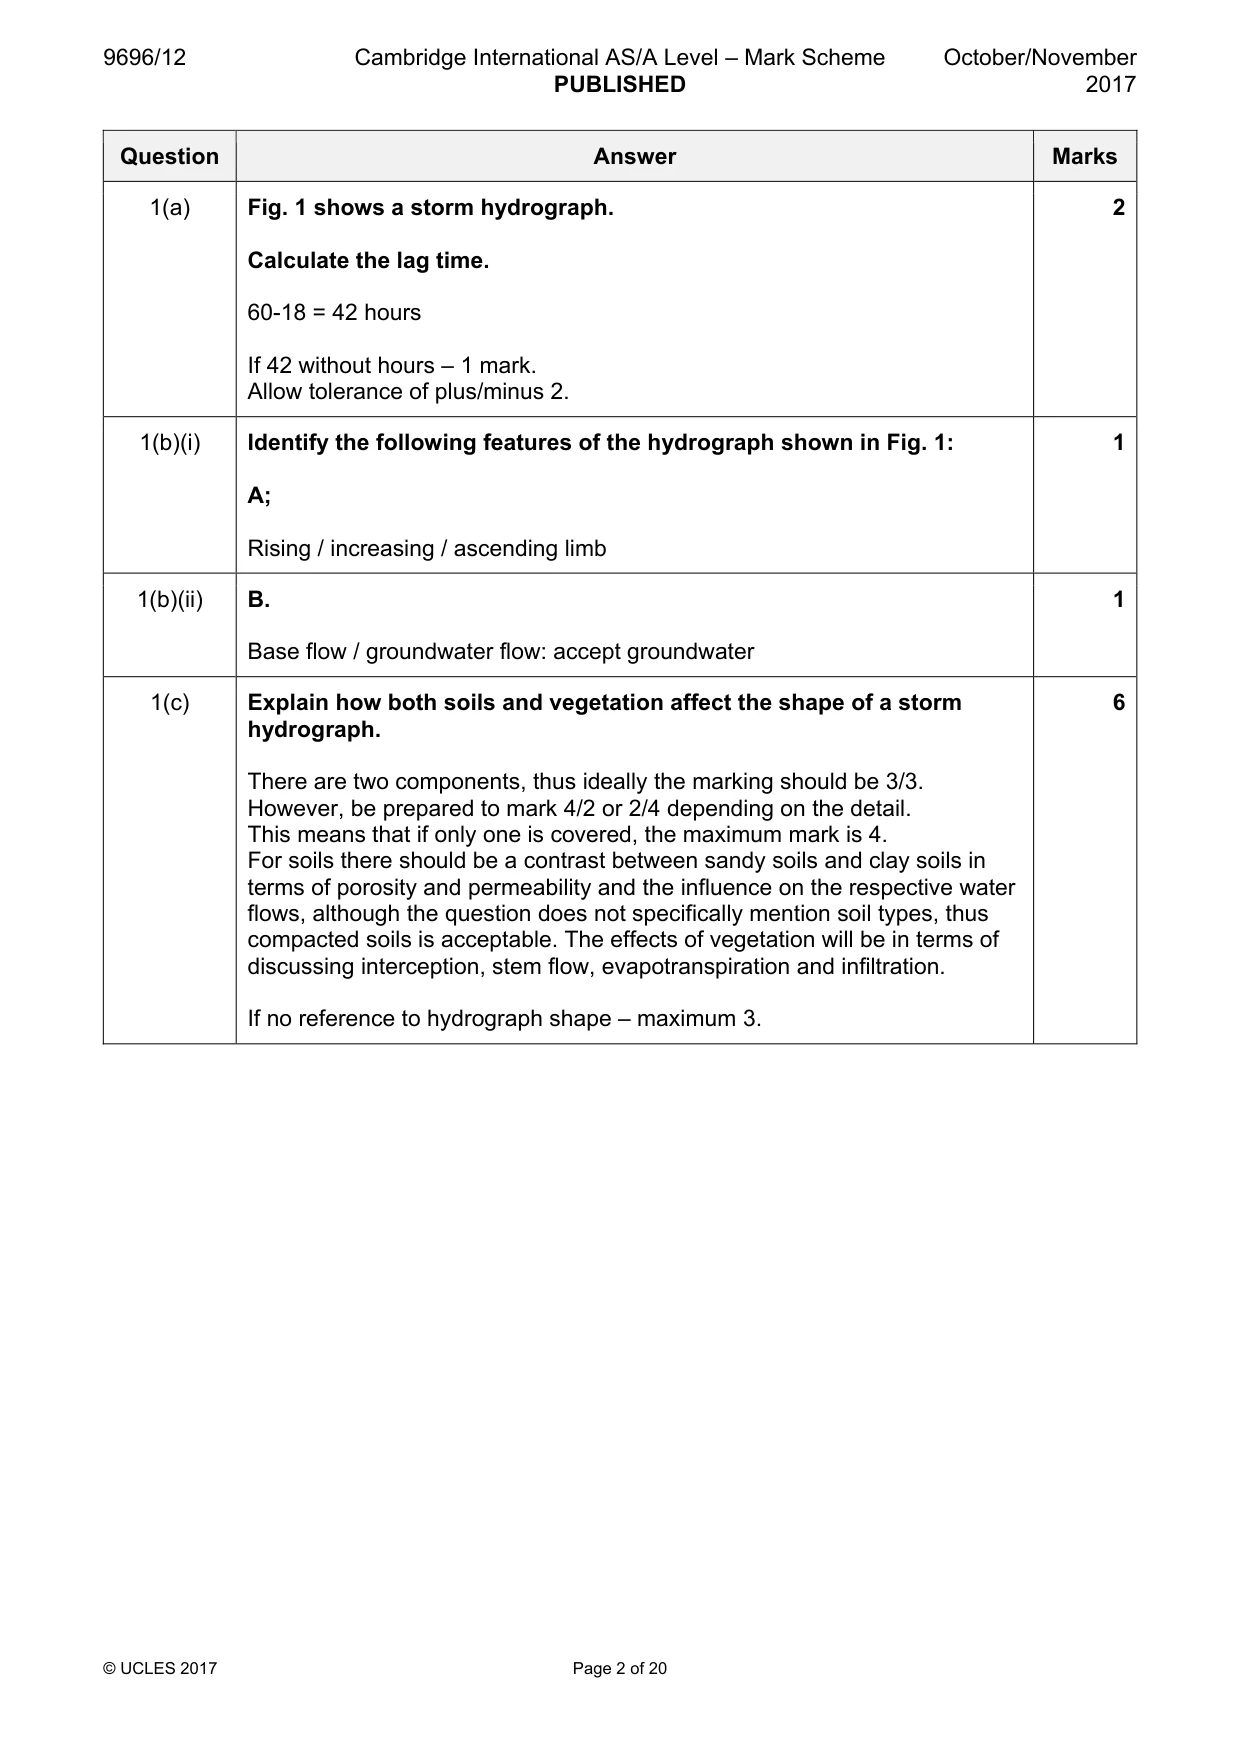
9696/12 Cambridge International AS/A Level – Mark Scheme PUBLISHED October/November 2017 © UCLES 2017 Page 2 of 20 Question Answer Marks 1(a) Fig. 1 shows a storm hydrograph. Calculate the lag time. 60-18 = 42 hours If 42 without hours – 1 mark. Allow tolerance of plus/minus 2. 2 1(b)(i) Identify the following features of the hydrograph shown in Fig. 1: A; Rising / increasing / ascending limb 1 1(b)(ii) B. Base flow / groundwater flow: accept groundwater 1 1(c) Explain how both soils and vegetation affect the shape of a storm hydrograph. There are two components, thus ideally the marking should be 3/3. However, be prepared to mark 4/2 or 2/4 depending on the detail. This means that if only one is covered, the maximum mark is 4. For soils there should be a contrast between sandy soils and clay soils in terms of porosity and permeability and the influence on the respective water flows, although the question does not specifically mention soil types, thus compacted soils is acceptable. The effects of vegetation will be in terms of discussing interception, stem flow, evapotranspiration and infiltration. If no reference to hydrograph shape – maximum 3. 6
Mark scheme, page 3
9696/12 Cambridge International AS/A Level – Mark Scheme PUBLISHED October/November 2017 © UCLES 2017 Page 3 of 20 Question Answer Marks 2(a) Fig. 2 shows some possible consequences of global warming. Describe the distribution of the possible consequences of global warming shown in Fig. 2. The question just requires a brief description of the distribution of the possible consequences. Mark on level of detail and global coverage. All elements need to be covered. 4 2(b) Explain how the consequences identified in (a) can be linked to changes in the composition of the Earth’s atmosphere. It requires a discussion of the enhanced greenhouse effect and its relationship to the increased concentration of greenhouse gases. For good marks (5–6) there should be reference to a range of gases and their effect on incoming short wave radiation and outgoing long wave radiation. The emphasis will be on global warming with the melting of ice caps, rising sea levels and possible change to the climate leading to drought and water scarcity. Suggest 3 marks for discussion of greenhouse effect and 3 marks for explaining the consequences. 6
Mark scheme, page 4
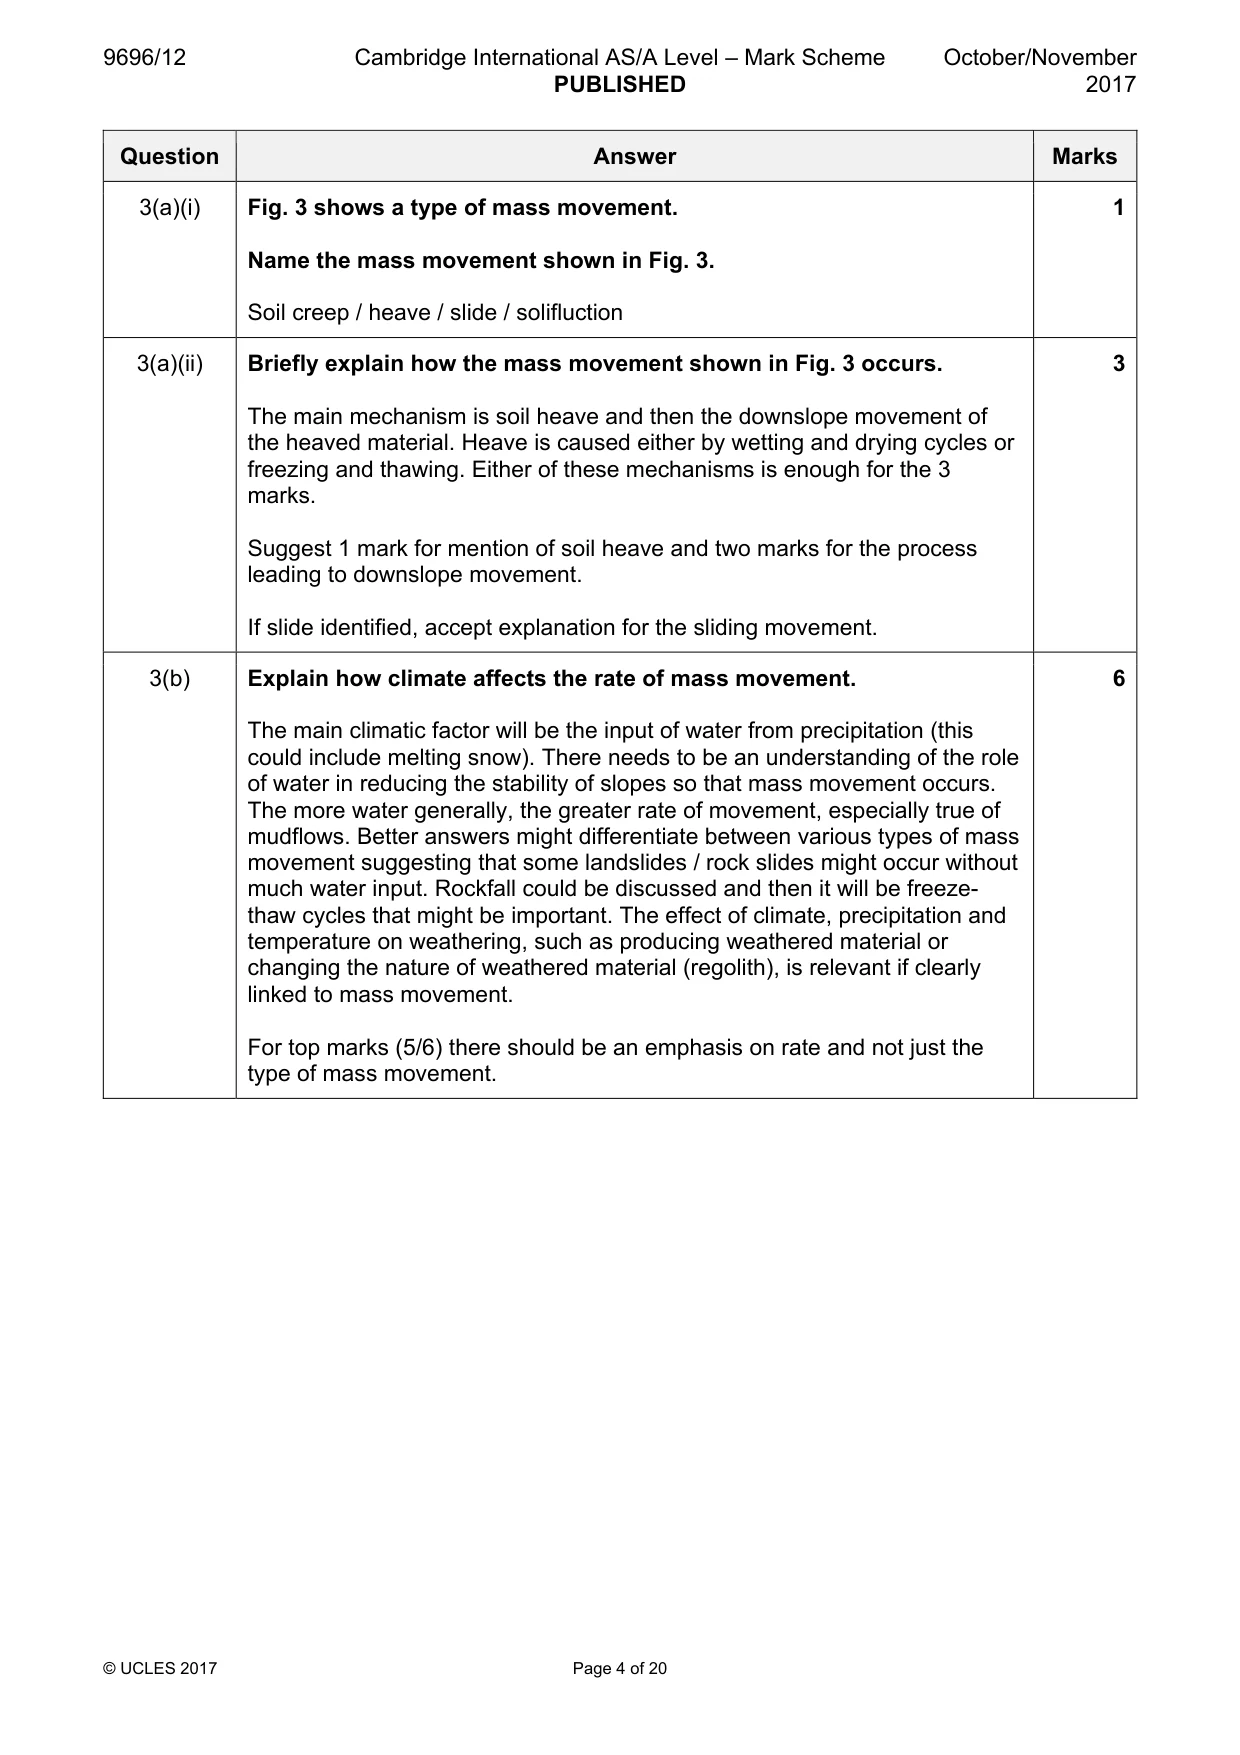
9696/12 Cambridge International AS/A Level – Mark Scheme PUBLISHED October/November 2017 © UCLES 2017 Page 4 of 20 Question Answer Marks 3(a)(i) Fig. 3 shows a type of mass movement. Name the mass movement shown in Fig. 3. Soil creep / heave / slide / solifluction 1 3(a)(ii) Briefly explain how the mass movement shown in Fig. 3 occurs. The main mechanism is soil heave and then the downslope movement of the heaved material. Heave is caused either by wetting and drying cycles or freezing and thawing. Either of these mechanisms is enough for the 3 marks. Suggest 1 mark for mention of soil heave and two marks for the process leading to downslope movement. If slide identified, accept explanation for the sliding movement. 3 3(b) Explain how climate affects the rate of mass movement. The main climatic factor will be the input of water from precipitation (this could include melting snow). There needs to be an understanding of the role of water in reducing the stability of slopes so that mass movement occurs. The more water generally, the greater rate of movement, especially true of mudflows. Better answers might differentiate between various types of mass movement suggesting that some landslides / rock slides might occur without much water input. Rockfall could be discussed and then it will be freeze- thaw cycles that might be important. The effect of climate, precipitation and temperature on weathering, such as producing weathered material or changing the nature of weathered material (regolith), is relevant if clearly linked to mass movement. For top marks (5/6) there should be an emphasis on rate and not just the type of mass movement. 6
Mark scheme, page 5
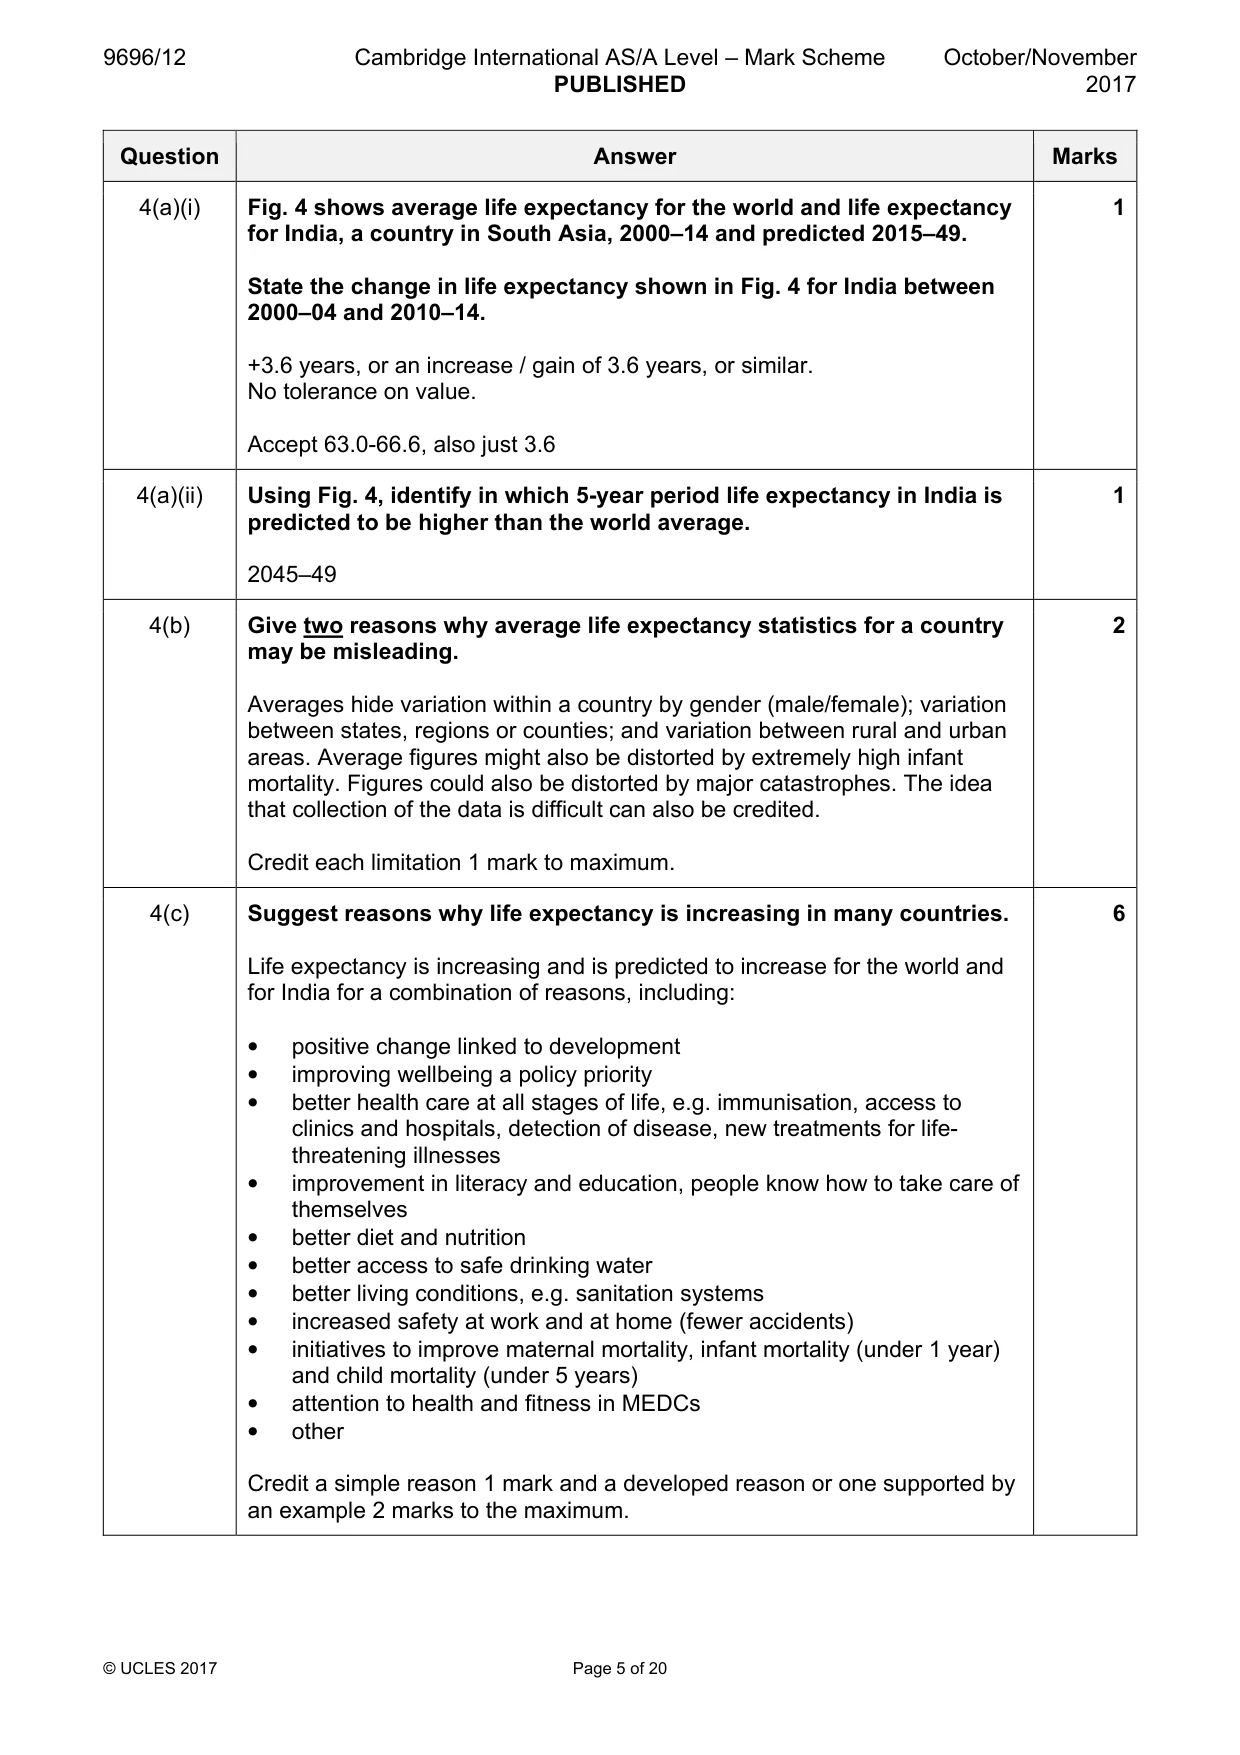
9696/12 Cambridge International AS/A Level – Mark Scheme PUBLISHED October/November 2017 © UCLES 2017 Page 5 of 20 Question Answer Marks 4(a)(i) Fig. 4 shows average life expectancy for the world and life expectancy for India, a country in South Asia, 2000–14 and predicted 2015–49. State the change in life expectancy shown in Fig. 4 for India between 2000–04 and 2010–14. +3.6 years, or an increase / gain of 3.6 years, or similar. No tolerance on value. Accept 63.0-66.6, also just 3.6 1 4(a)(ii) Using Fig. 4, identify in which 5-year period life expectancy in India is predicted to be higher than the world average. 2045–49 1 4(b) Give two reasons why average life expectancy statistics for a country may be misleading. Averages hide variation within a country by gender (male/female); variation between states, regions or counties; and variation between rural and urban areas. Average figures might also be distorted by extremely high infant mortality. Figures could also be distorted by major catastrophes. The idea that collection of the data is difficult can also be credited. Credit each limitation 1 mark to maximum. 2 4(c) Suggest reasons why life expectancy is increasing in many countries. Life expectancy is increasing and is predicted to increase for the world and for India for a combination of reasons, including: • positive change linked to development • improving wellbeing a policy priority • better health care at all stages of life, e.g. immunisation, access to clinics and hospitals, detection of disease, new treatments for life- threatening illnesses • improvement in literacy and education, people know how to take care of themselves • better diet and nutrition • better access to safe drinking water • better living conditions, e.g. sanitation systems • increased safety at work and at home (fewer accidents) • initiatives to improve maternal mortality, infant mortality (under 1 year) and child mortality (under 5 years) • attention to health and fitness in MEDCs • other Credit a simple reason 1 mark and a developed reason or one supported by an example 2 marks to the maximum. 6
Mark scheme, page 6
9696/12 Cambridge International AS/A Level – Mark Scheme PUBLISHED October/November 2017 © UCLES 2017 Page 6 of 20 Question Answer Marks 5(a) Fig. 5 shows the main international migration flows within and from Africa, 1990–2012. Name the destination country shown in Fig. 5 for emigrants from the Democratic Republic of the Congo. Angola 1 5(b) Describe the pattern of immigration into South Africa shown in Fig. 5. The description of immigration into South Africa should cover scale and spatial origins/distance. For a description of one element, maximum 2. Scale: strong immigration to South Africa (total of 7 flows, 3 of which are large – Lesotho, Mozambique, Zimbabwe) Spatial origins/distance: 1 from Swaziland and Lesotho, within the country’s borders 2 from neighbouring countries – Namibia, Zimbabwe, Mozambique (but no significant flow from Botswana) 3 longer distance flows: from East Africa (Kenya / Malawi arrow) and from West Africa (Nigeria / Ghana arrow) 3
Mark scheme, page 7
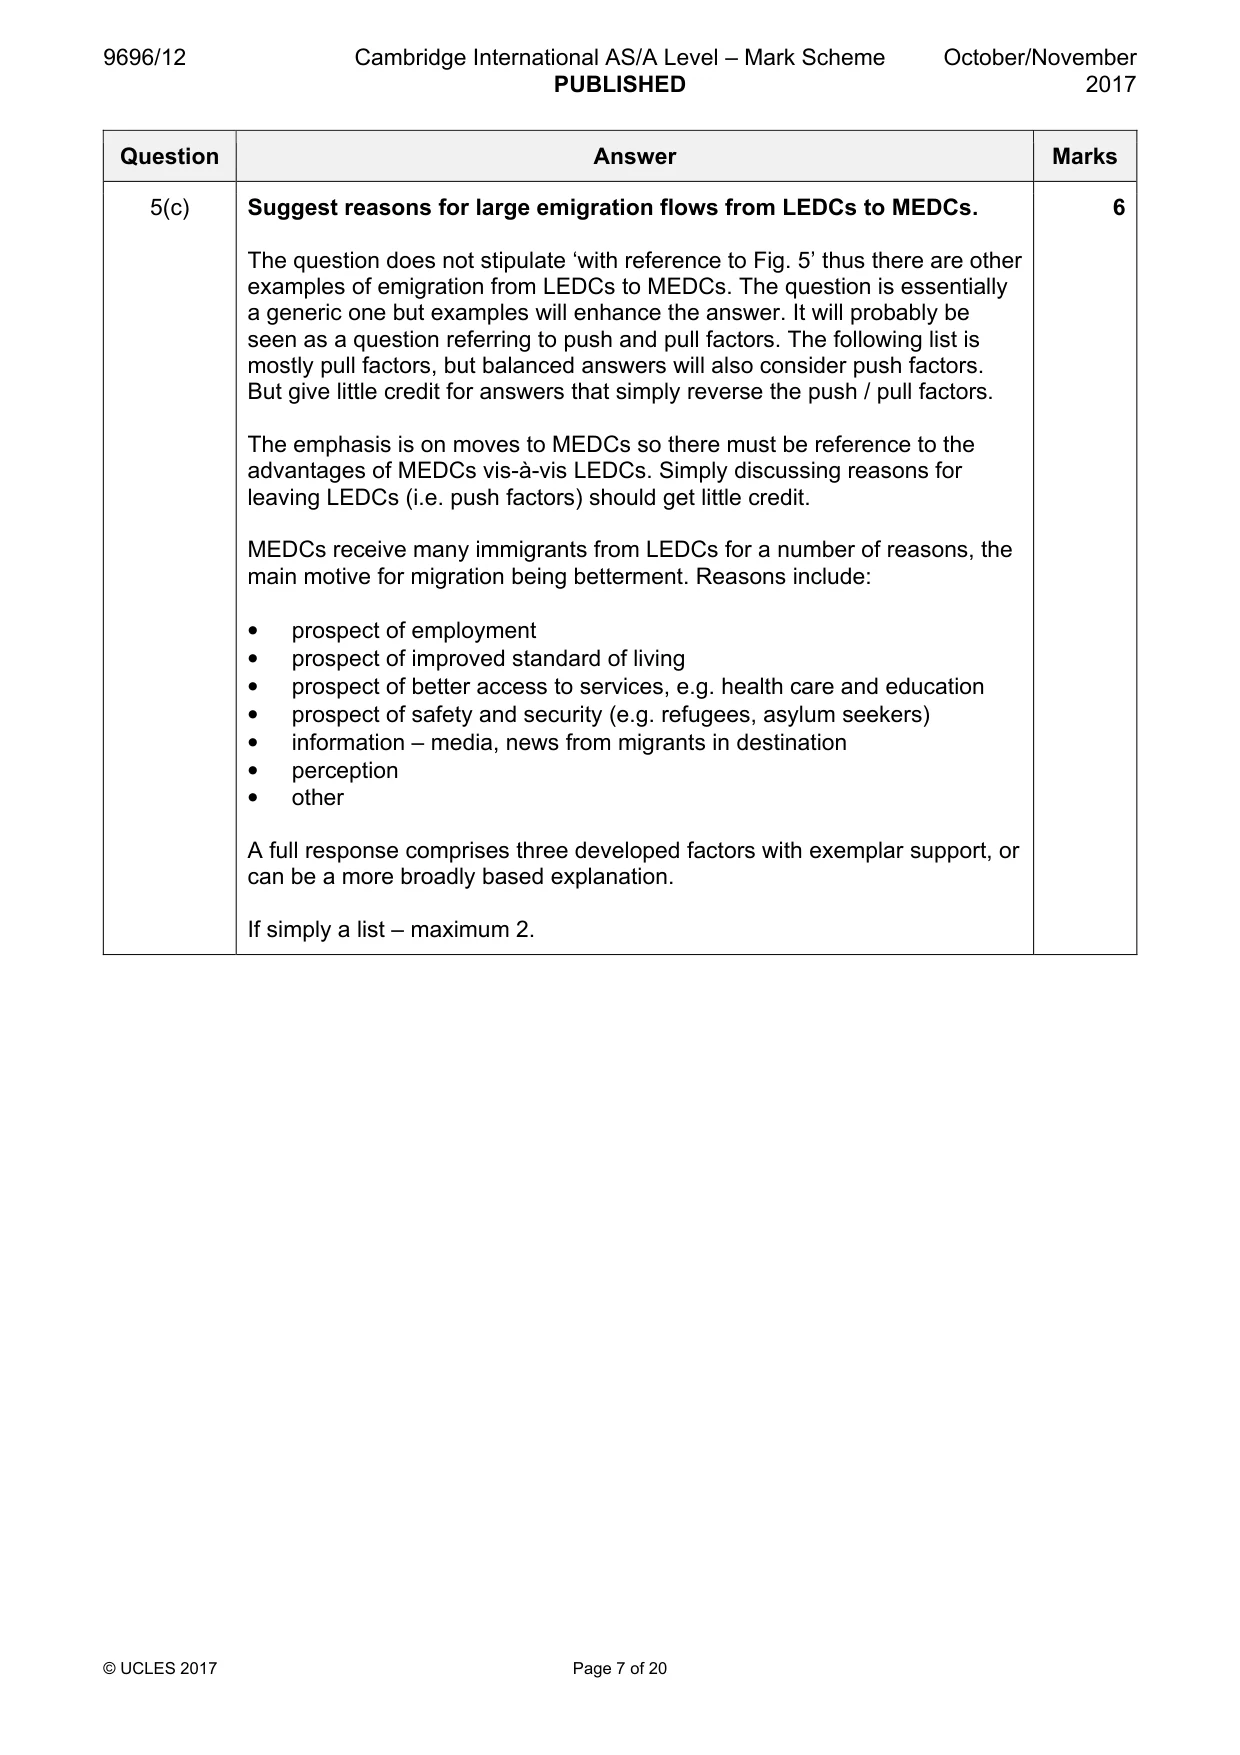
9696/12 Cambridge International AS/A Level – Mark Scheme PUBLISHED October/November 2017 © UCLES 2017 Page 7 of 20 Question Answer Marks 5(c) Suggest reasons for large emigration flows from LEDCs to MEDCs. The question does not stipulate ‘with reference to Fig. 5’ thus there are other examples of emigration from LEDCs to MEDCs. The question is essentially a generic one but examples will enhance the answer. It will probably be seen as a question referring to push and pull factors. The following list is mostly pull factors, but balanced answers will also consider push factors. But give little credit for answers that simply reverse the push / pull factors. The emphasis is on moves to MEDCs so there must be reference to the advantages of MEDCs vis-à-vis LEDCs. Simply discussing reasons for leaving LEDCs (i.e. push factors) should get little credit. MEDCs receive many immigrants from LEDCs for a number of reasons, the main motive for migration being betterment. Reasons include: • prospect of employment • prospect of improved standard of living • prospect of better access to services, e.g. health care and education • prospect of safety and security (e.g. refugees, asylum seekers) • information – media, news from migrants in destination • perception • other A full response comprises three developed factors with exemplar support, or can be a more broadly based explanation. If simply a list – maximum 2. 6
Mark scheme, page 8
9696/12 Cambridge International AS/A Level – Mark Scheme PUBLISHED October/November 2017 © UCLES 2017 Page 8 of 20 Question Answer Marks 6(a)(i) Table 1 shows selected characteristics of the 100 poorest districts of cities in the USA, an MEDC, in 2000 and 2005–09. Using Table 1: identify the population which shows a percentage increase; White (data support not needed) 1 6(a)(ii) Using Table 1: state the percentage change in male unemployment. 7.4 1 6(b) Using evidence from Table 1, describe the change in housing. Increase in owner occupancy (4.9%) [1] an associated decrease in rented property (-4.2%) [1] Accept the raw figures. For a valid description of both changes without data support or with inaccurate data, 1 mark. 2 6(c) Explain some of the difficulties experienced by people living in poor districts of cities. This can be in an MEDC, such as living in an area of low income or an industrial suburb, or in an LEDC, such as living in a squatter settlement or shanty town. In both, poverty tends to be associated with a number of characteristics which may make difficulties for people. These include: • low quality housing, e.g. old, poorly built, leaking roofs • poor living conditions, e.g. basic sanitation, dangerous electricity supply • overcrowding in district and in households • communication of disease, health problems • poor access to services / limited service provision, e.g. school, clinic, transport • crime and illegal activities / fear • lack of investment from city authorities • bad reputation restricts opportunities and may make getting a job more difficult, etc. • conflict between immigrant groups • unemployment A full response would usually comprise three developed difficulties with exemplar support but two difficulties done well are acceptable. Or can be a more broadly based explanation. Maximum 3 if simply a list with no explanation. 6
Mark scheme, page 9
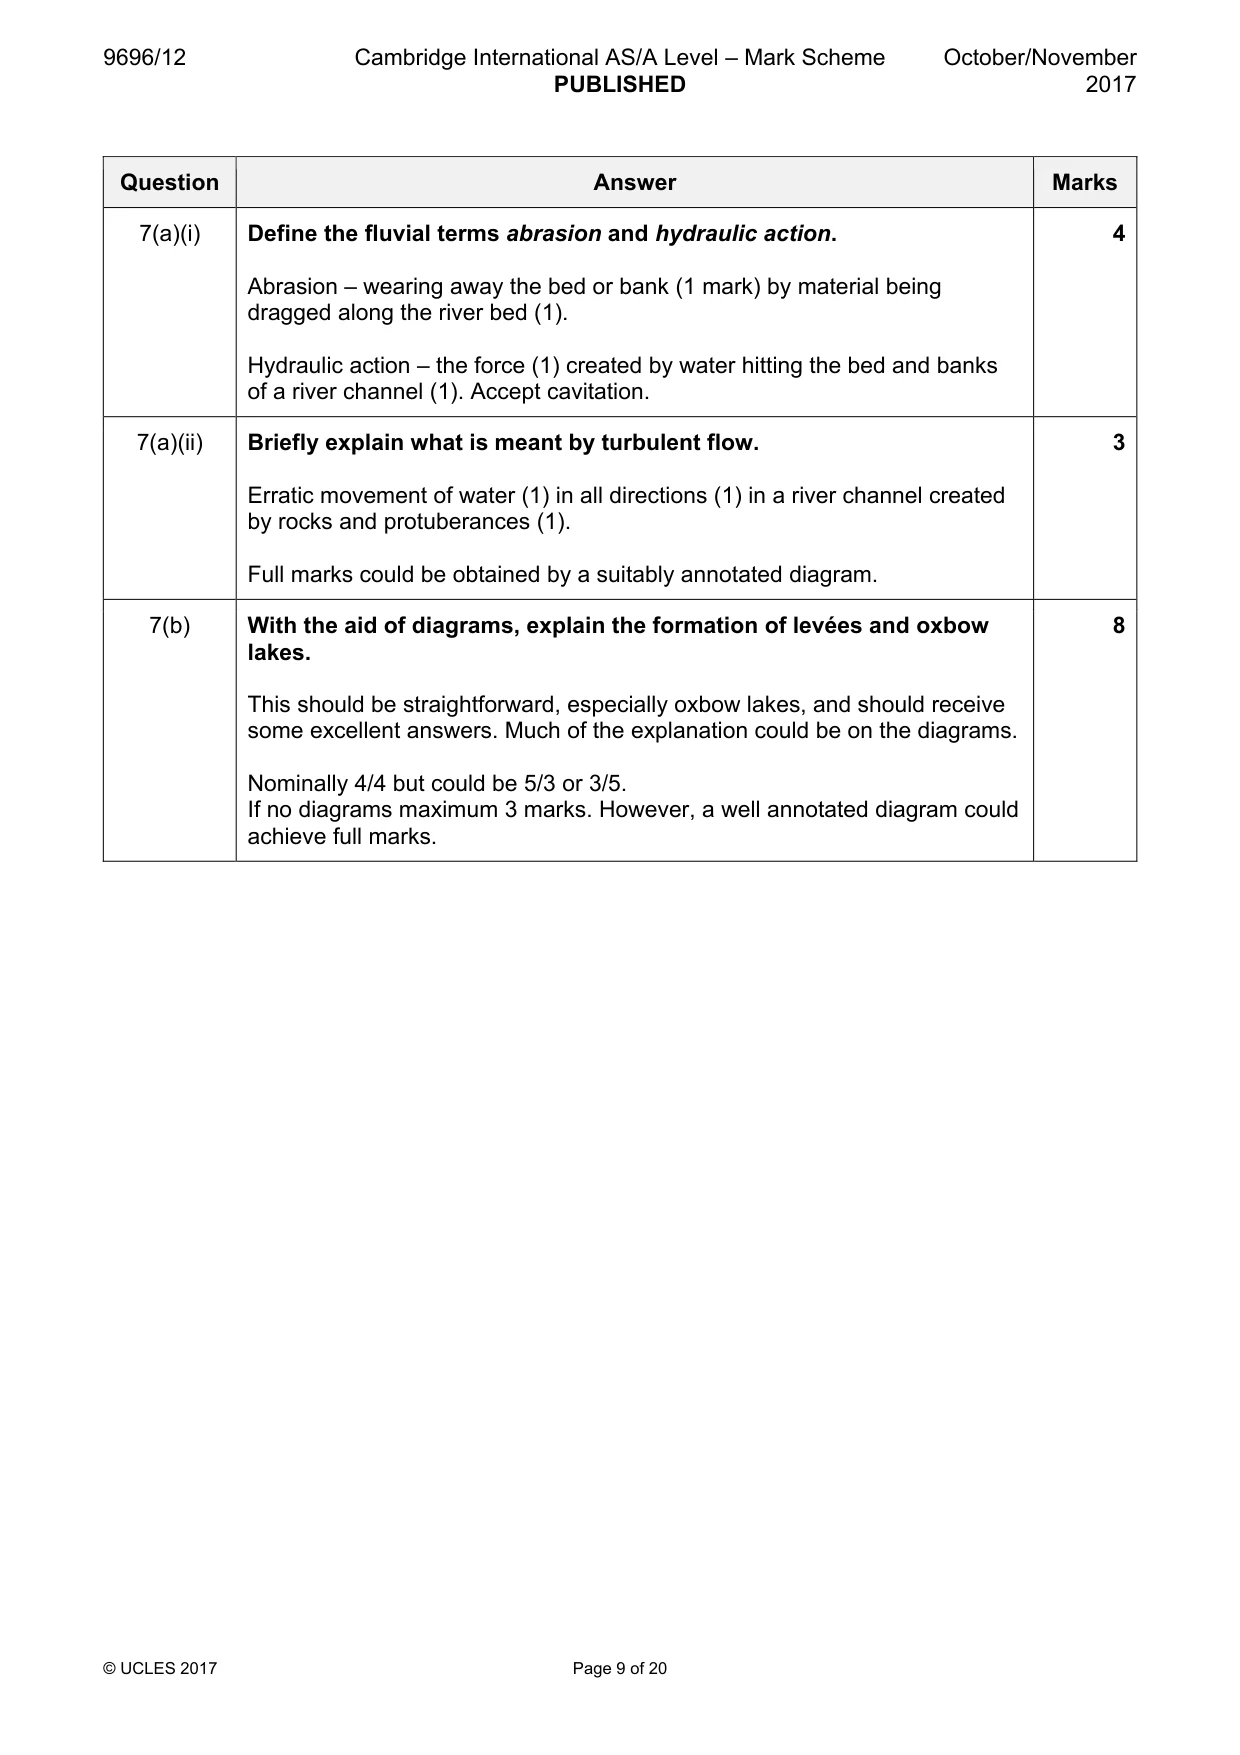
9696/12 Cambridge International AS/A Level – Mark Scheme PUBLISHED October/November 2017 © UCLES 2017 Page 9 of 20 Question Answer Marks 7(a)(i) Define the fluvial terms abrasion and hydraulic action. Abrasion – wearing away the bed or bank (1 mark) by material being dragged along the river bed (1). Hydraulic action – the force (1) created by water hitting the bed and banks of a river channel (1). Accept cavitation. 4 7(a)(ii) Briefly explain what is meant by turbulent flow. Erratic movement of water (1) in all directions (1) in a river channel created by rocks and protuberances (1). Full marks could be obtained by a suitably annotated diagram. 3 7(b) With the aid of diagrams, explain the formation of levées and oxbow lakes. This should be straightforward, especially oxbow lakes, and should receive some excellent answers. Much of the explanation could be on the diagrams. Nominally 4/4 but could be 5/3 or 3/5. If no diagrams maximum 3 marks. However, a well annotated diagram could achieve full marks. 8
Mark scheme, page 10
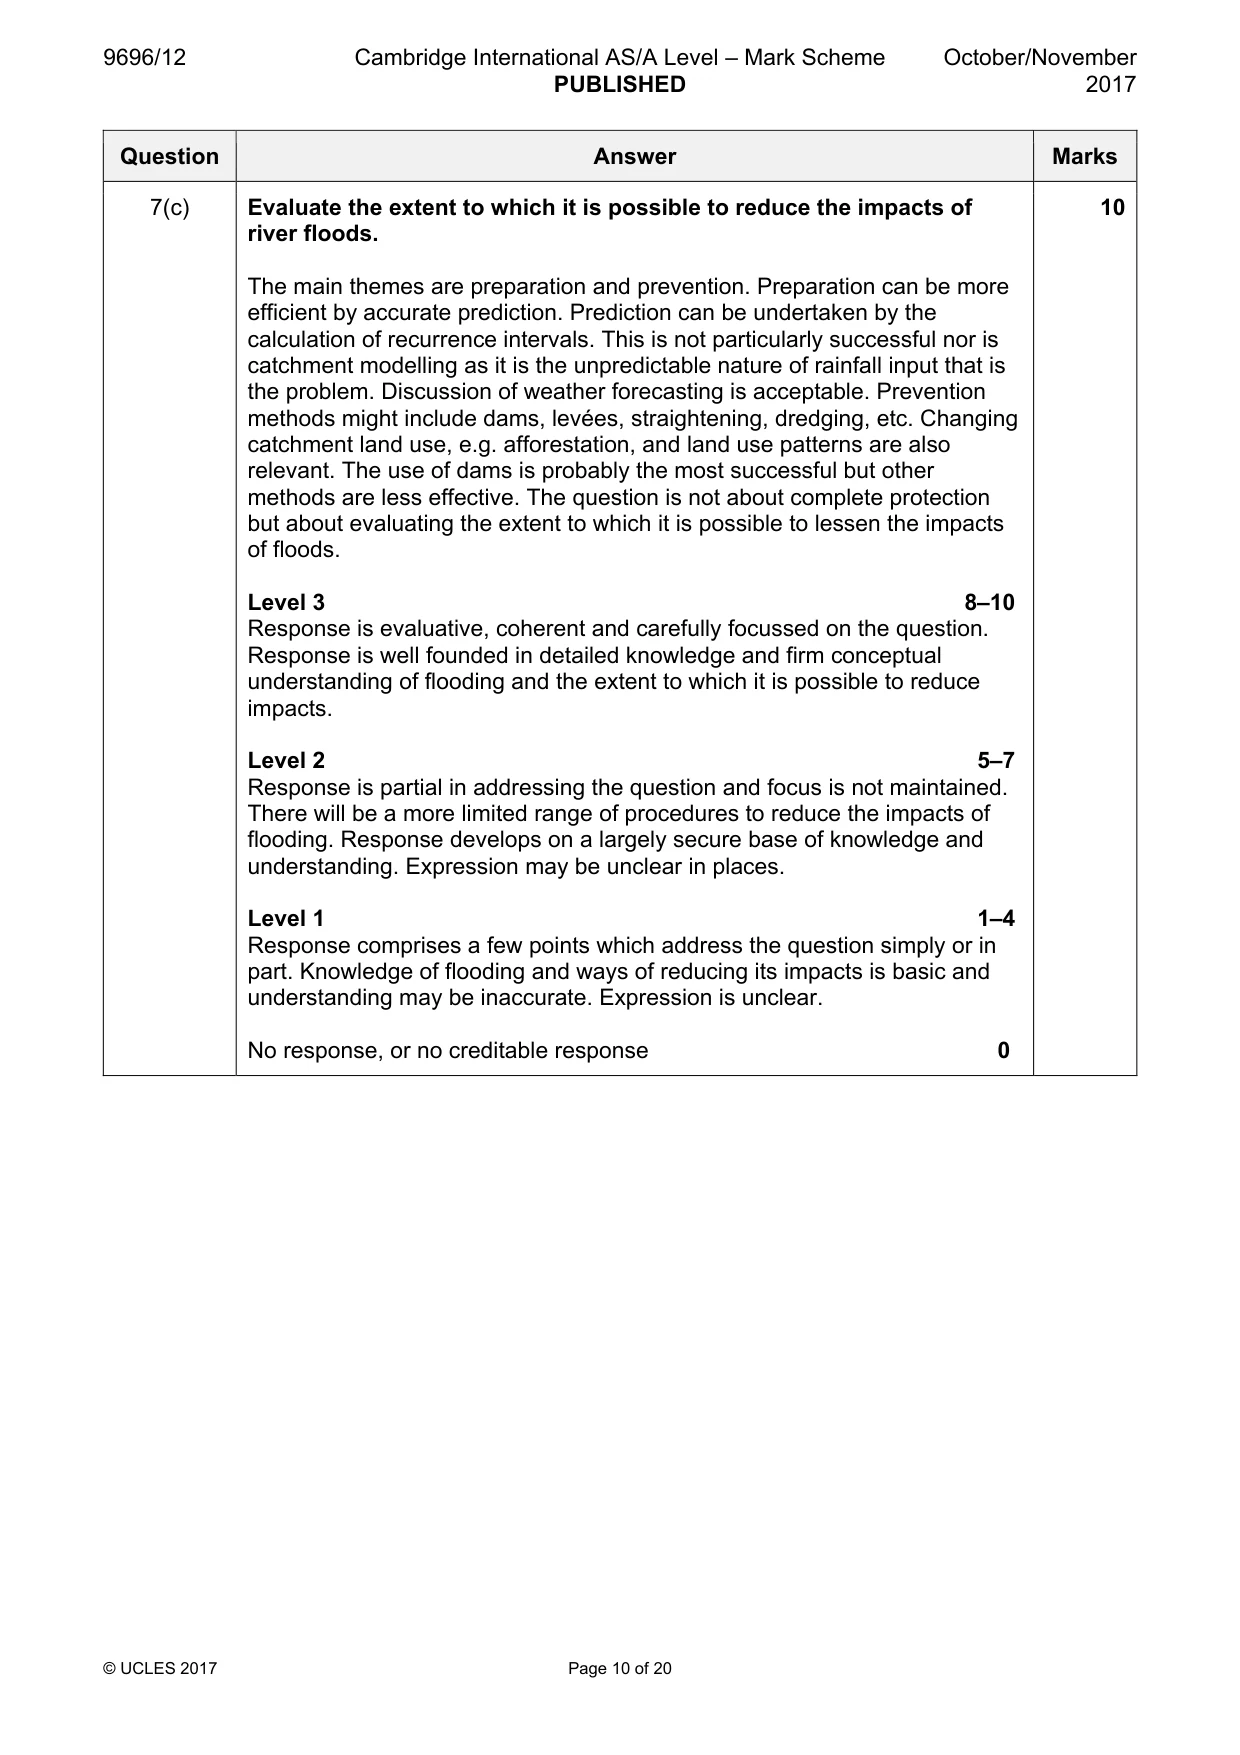
9696/12 Cambridge International AS/A Level – Mark Scheme PUBLISHED October/November 2017 © UCLES 2017 Page 10 of 20 Question Answer Marks 7(c) Evaluate the extent to which it is possible to reduce the impacts of river floods. The main themes are preparation and prevention. Preparation can be more efficient by accurate prediction. Prediction can be undertaken by the calculation of recurrence intervals. This is not particularly successful nor is catchment modelling as it is the unpredictable nature of rainfall input that is the problem. Discussion of weather forecasting is acceptable. Prevention methods might include dams, levées, straightening, dredging, etc. Changing catchment land use, e.g. afforestation, and land use patterns are also relevant. The use of dams is probably the most successful but other methods are less effective. The question is not about complete protection but about evaluating the extent to which it is possible to lessen the impacts of floods. Level 3 8–10 Response is evaluative, coherent and carefully focussed on the question. Response is well founded in detailed knowledge and firm conceptual understanding of flooding and the extent to which it is possible to reduce impacts. Level 2 5–7 Response is partial in addressing the question and focus is not maintained. There will be a more limited range of procedures to reduce the impacts of flooding. Response develops on a largely secure base of knowledge and understanding. Expression may be unclear in places. Level 1 1–4 Response comprises a few points which address the question simply or in part. Knowledge of flooding and ways of reducing its impacts is basic and understanding may be inaccurate. Expression is unclear. No response, or no creditable response 0 10
Mark scheme, page 11
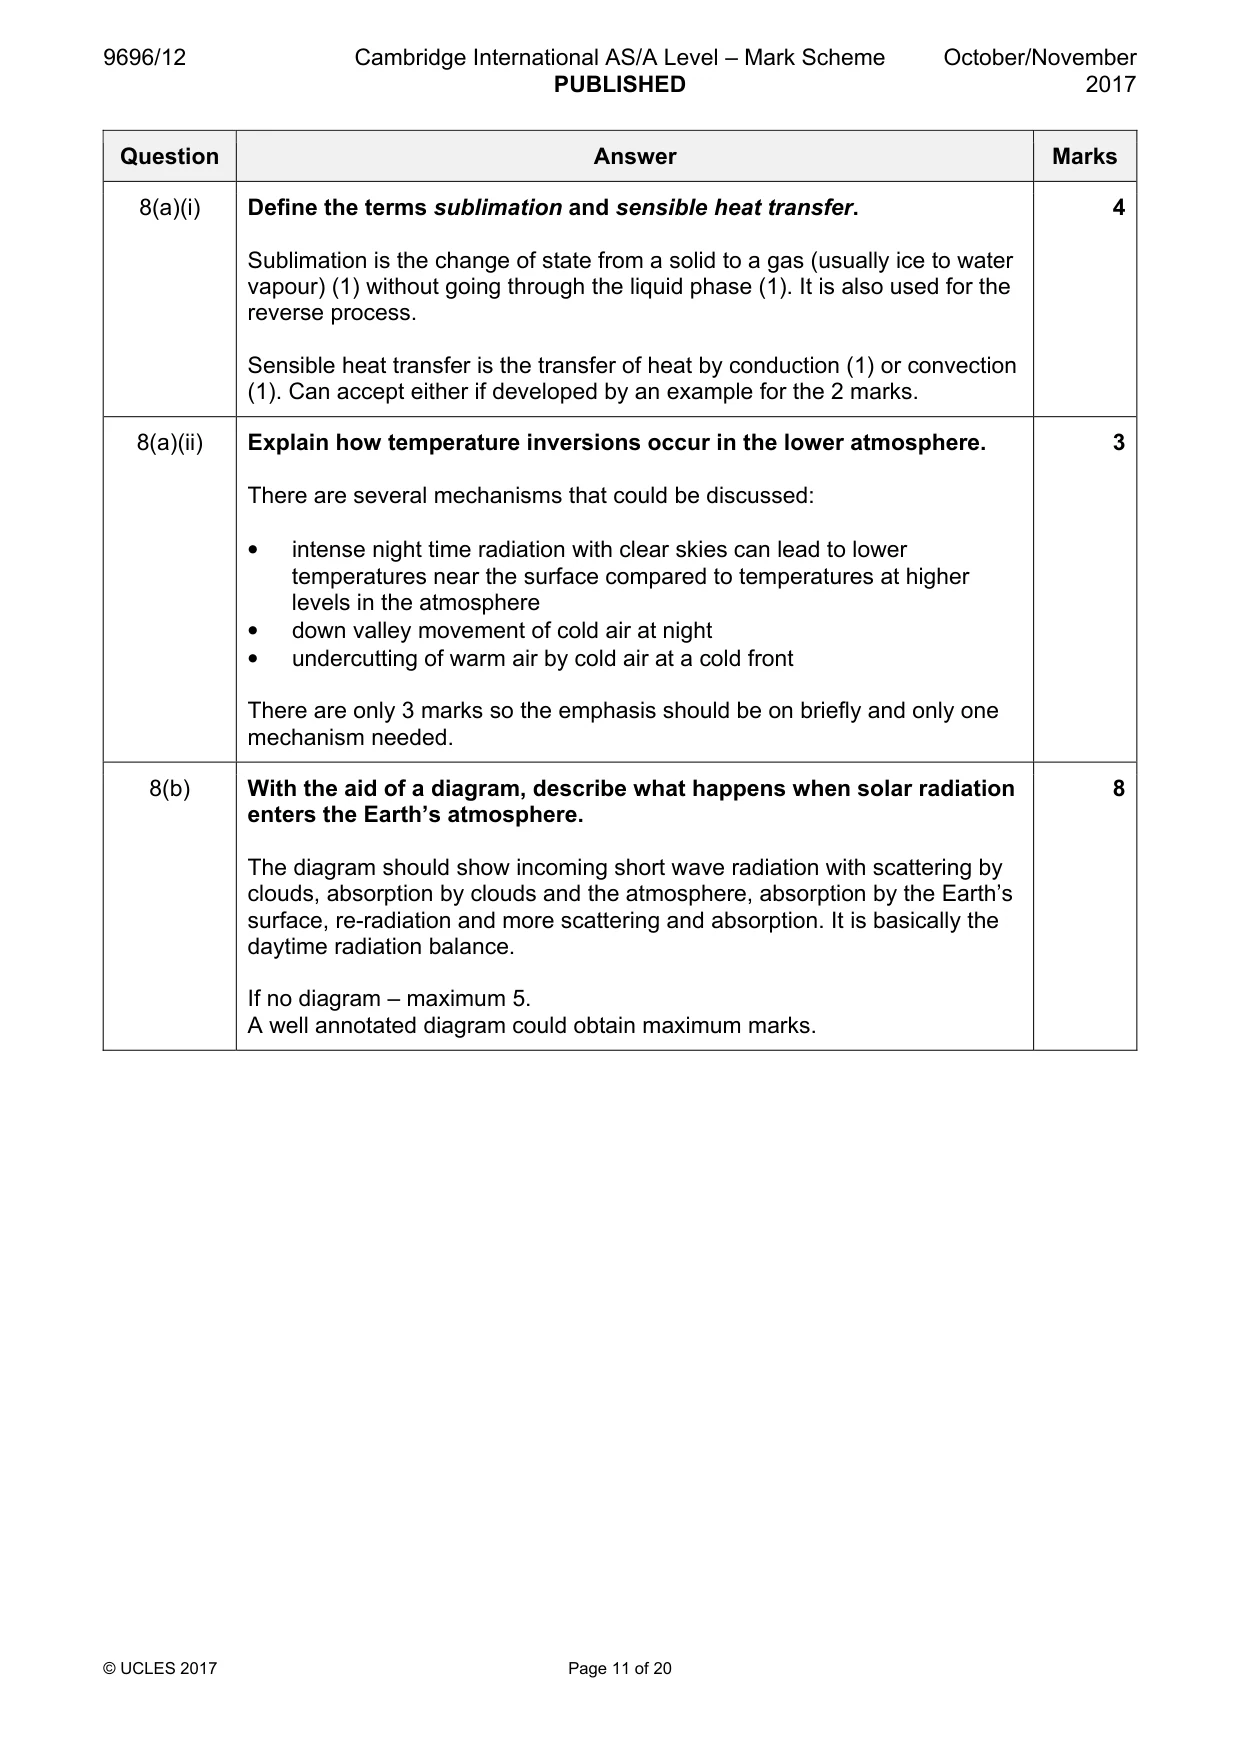
9696/12 Cambridge International AS/A Level – Mark Scheme PUBLISHED October/November 2017 © UCLES 2017 Page 11 of 20 Question Answer Marks 8(a)(i) Define the terms sublimation and sensible heat transfer. Sublimation is the change of state from a solid to a gas (usually ice to water vapour) (1) without going through the liquid phase (1). It is also used for the reverse process. Sensible heat transfer is the transfer of heat by conduction (1) or convection (1). Can accept either if developed by an example for the 2 marks. 4 8(a)(ii) Explain how temperature inversions occur in the lower atmosphere. There are several mechanisms that could be discussed: • intense night time radiation with clear skies can lead to lower temperatures near the surface compared to temperatures at higher levels in the atmosphere • down valley movement of cold air at night • undercutting of warm air by cold air at a cold front There are only 3 marks so the emphasis should be on briefly and only one mechanism needed. 3 8(b) With the aid of a diagram, describe what happens when solar radiation enters the Earth’s atmosphere. The diagram should show incoming short wave radiation with scattering by clouds, absorption by clouds and the atmosphere, absorption by the Earth’s surface, re-radiation and more scattering and absorption. It is basically the daytime radiation balance. If no diagram – maximum 5. A well annotated diagram could obtain maximum marks. 8
Mark scheme, page 12
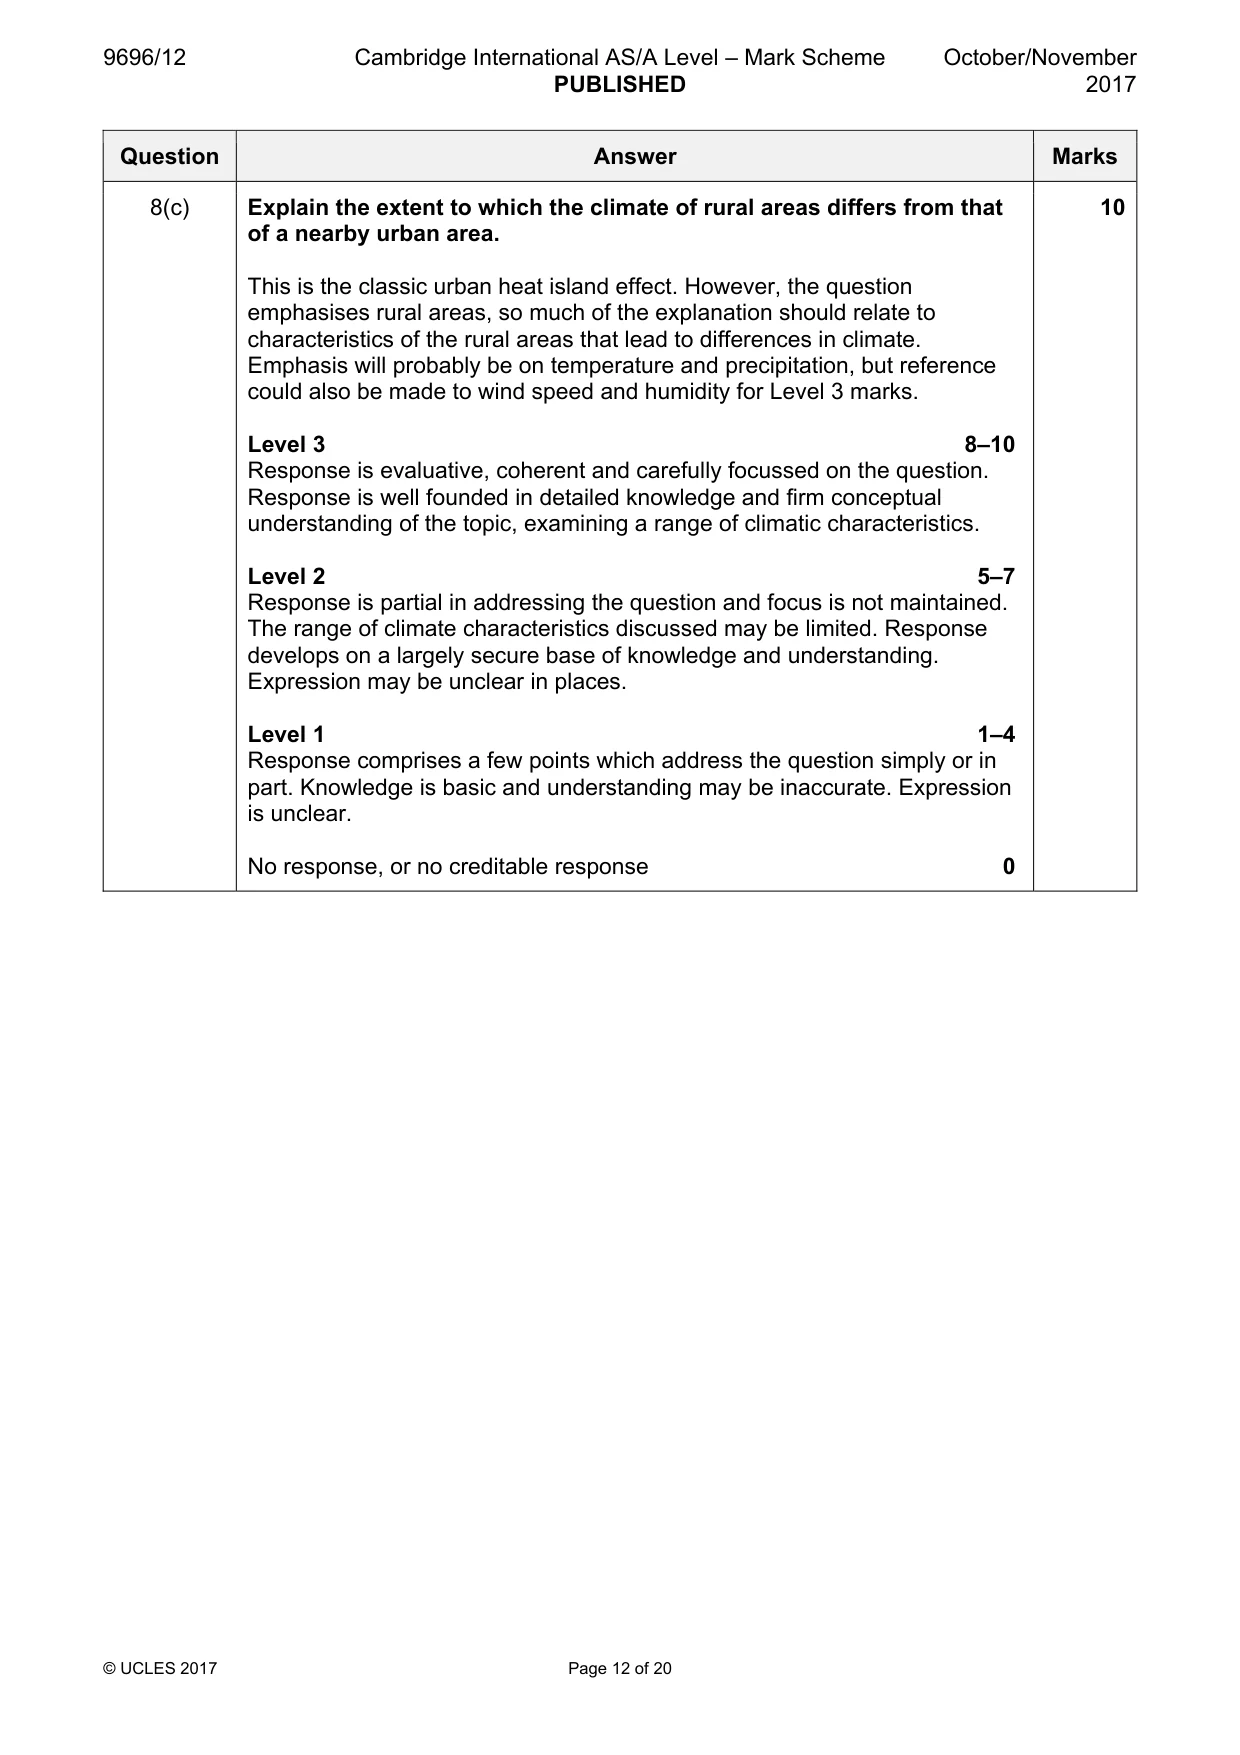
9696/12 Cambridge International AS/A Level – Mark Scheme PUBLISHED October/November 2017 © UCLES 2017 Page 12 of 20 Question Answer Marks 8(c) Explain the extent to which the climate of rural areas differs from that of a nearby urban area. This is the classic urban heat island effect. However, the question emphasises rural areas, so much of the explanation should relate to characteristics of the rural areas that lead to differences in climate. Emphasis will probably be on temperature and precipitation, but reference could also be made to wind speed and humidity for Level 3 marks. Level 3 8–10 Response is evaluative, coherent and carefully focussed on the question. Response is well founded in detailed knowledge and firm conceptual understanding of the topic, examining a range of climatic characteristics. Level 2 5–7 Response is partial in addressing the question and focus is not maintained. The range of climate characteristics discussed may be limited. Response develops on a largely secure base of knowledge and understanding. Expression may be unclear in places. Level 1 1–4 Response comprises a few points which address the question simply or in part. Knowledge is basic and understanding may be inaccurate. Expression is unclear. No response, or no creditable response 0 10
Mark scheme, page 13
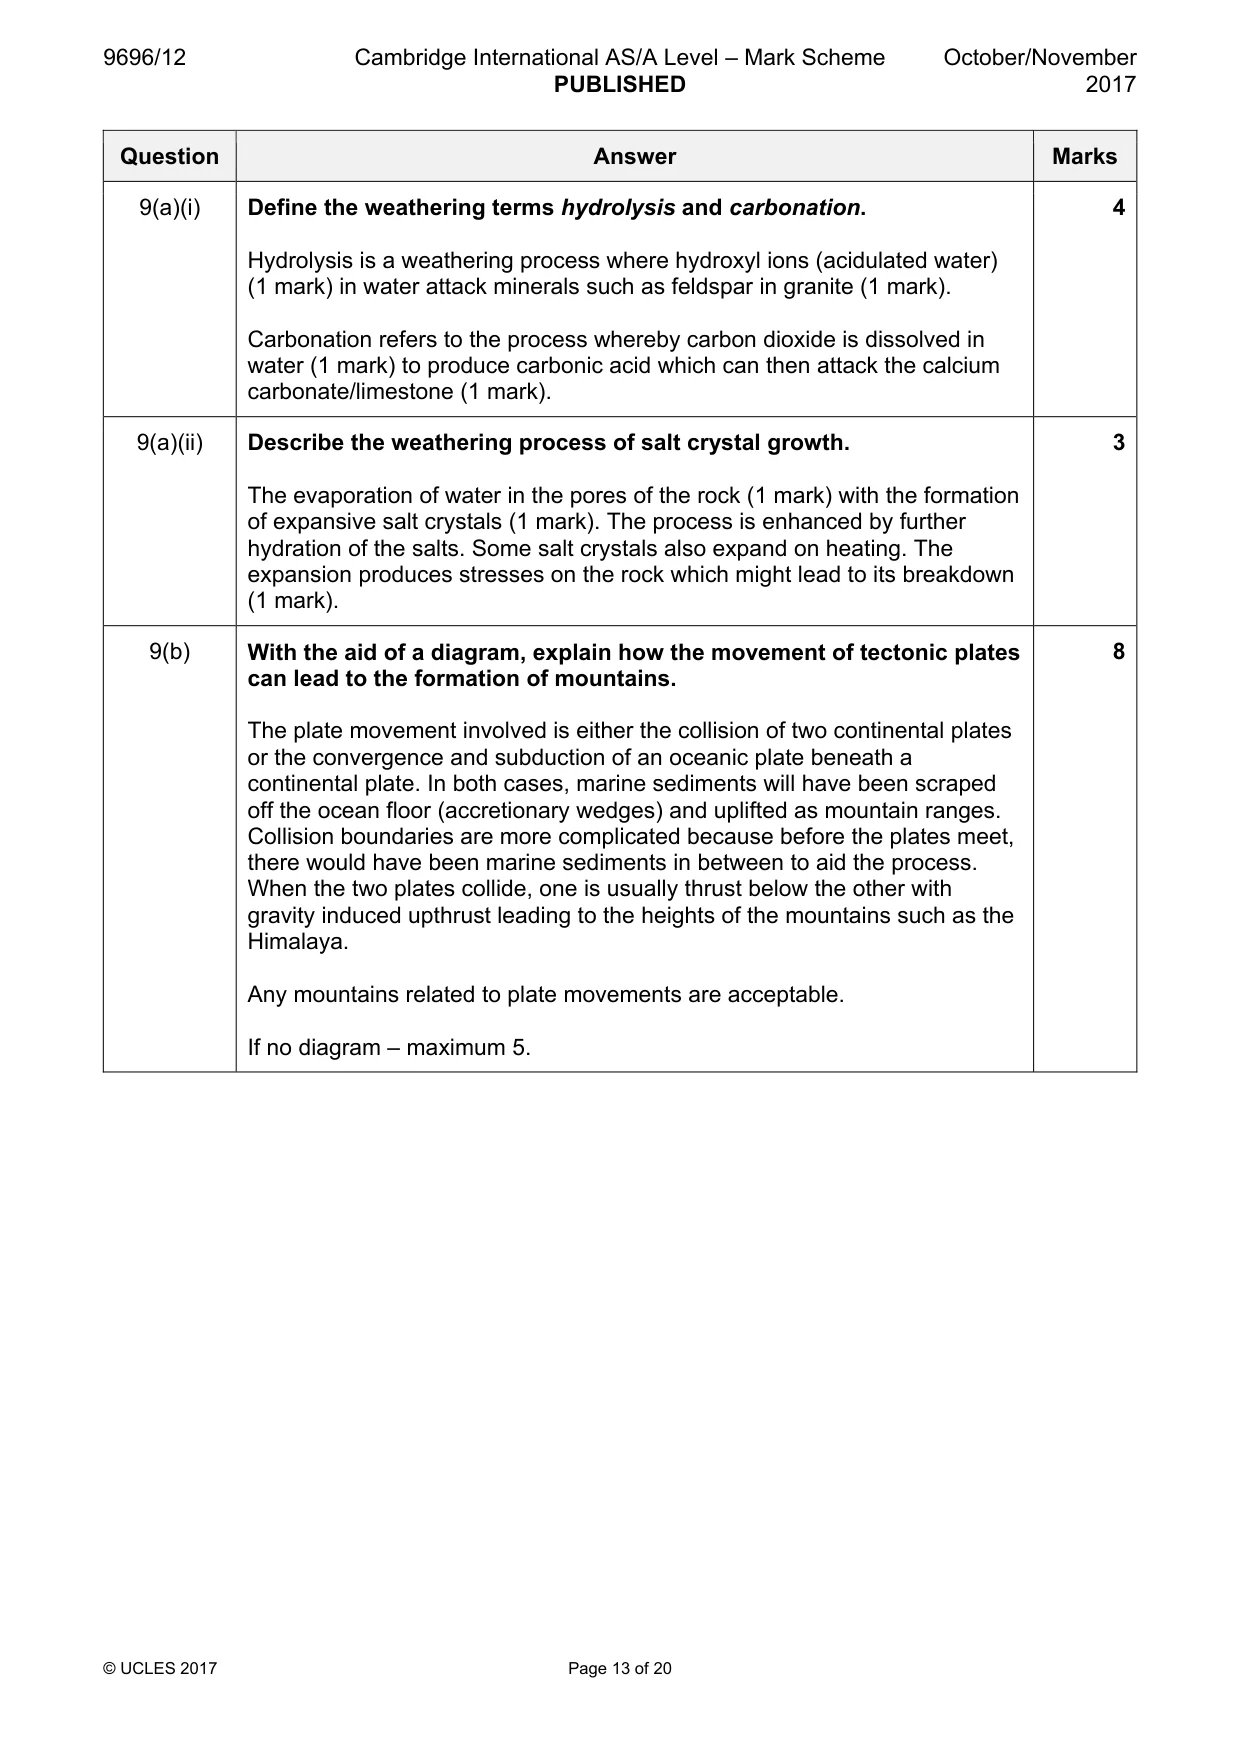
9696/12 Cambridge International AS/A Level – Mark Scheme PUBLISHED October/November 2017 © UCLES 2017 Page 13 of 20 Question Answer Marks 9(a)(i) Define the weathering terms hydrolysis and carbonation. Hydrolysis is a weathering process where hydroxyl ions (acidulated water) (1 mark) in water attack minerals such as feldspar in granite (1 mark). Carbonation refers to the process whereby carbon dioxide is dissolved in water (1 mark) to produce carbonic acid which can then attack the calcium carbonate/limestone (1 mark). 4 9(a)(ii) Describe the weathering process of salt crystal growth. The evaporation of water in the pores of the rock (1 mark) with the formation of expansive salt crystals (1 mark). The process is enhanced by further hydration of the salts. Some salt crystals also expand on heating. The expansion produces stresses on the rock which might lead to its breakdown (1 mark). 3 9(b) With the aid of a diagram, explain how the movement of tectonic plates can lead to the formation of mountains. The plate movement involved is either the collision of two continental plates or the convergence and subduction of an oceanic plate beneath a continental plate. In both cases, marine sediments will have been scraped off the ocean floor (accretionary wedges) and uplifted as mountain ranges. Collision boundaries are more complicated because before the plates meet, there would have been marine sediments in between to aid the process. When the two plates collide, one is usually thrust below the other with gravity induced upthrust leading to the heights of the mountains such as the Himalaya. Any mountains related to plate movements are acceptable. If no diagram – maximum 5. 8
Mark scheme, page 14
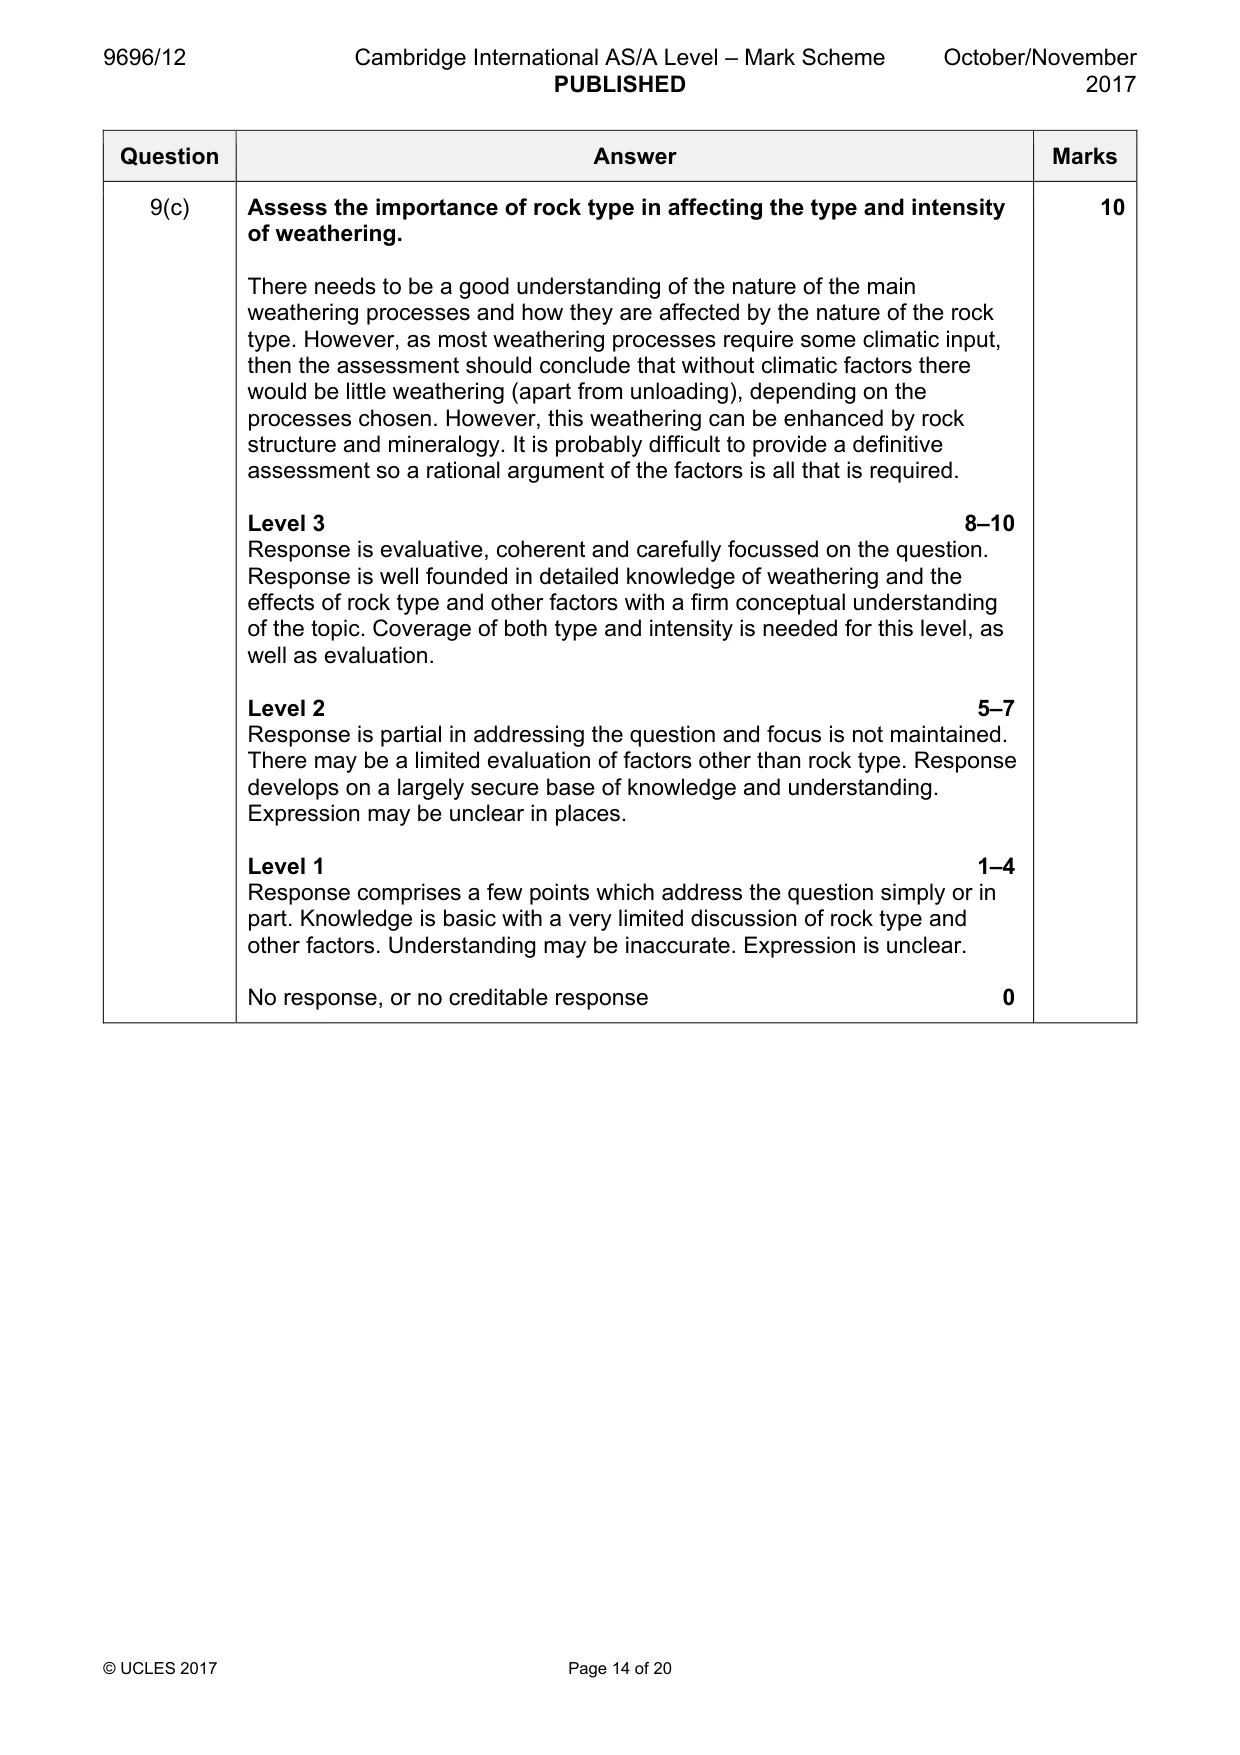
9696/12 Cambridge International AS/A Level – Mark Scheme PUBLISHED October/November 2017 © UCLES 2017 Page 14 of 20 Question Answer Marks 9(c) Assess the importance of rock type in affecting the type and intensity of weathering. There needs to be a good understanding of the nature of the main weathering processes and how they are affected by the nature of the rock type. However, as most weathering processes require some climatic input, then the assessment should conclude that without climatic factors there would be little weathering (apart from unloading), depending on the processes chosen. However, this weathering can be enhanced by rock structure and mineralogy. It is probably difficult to provide a definitive assessment so a rational argument of the factors is all that is required. Level 3 8–10 Response is evaluative, coherent and carefully focussed on the question. Response is well founded in detailed knowledge of weathering and the effects of rock type and other factors with a firm conceptual understanding of the topic. Coverage of both type and intensity is needed for this level, as well as evaluation. Level 2 5–7 Response is partial in addressing the question and focus is not maintained. There may be a limited evaluation of factors other than rock type. Response develops on a largely secure base of knowledge and understanding. Expression may be unclear in places. Level 1 1–4 Response comprises a few points which address the question simply or in part. Knowledge is basic with a very limited discussion of rock type and other factors. Understanding may be inaccurate. Expression is unclear. No response, or no creditable response 0 10
Mark scheme, page 15
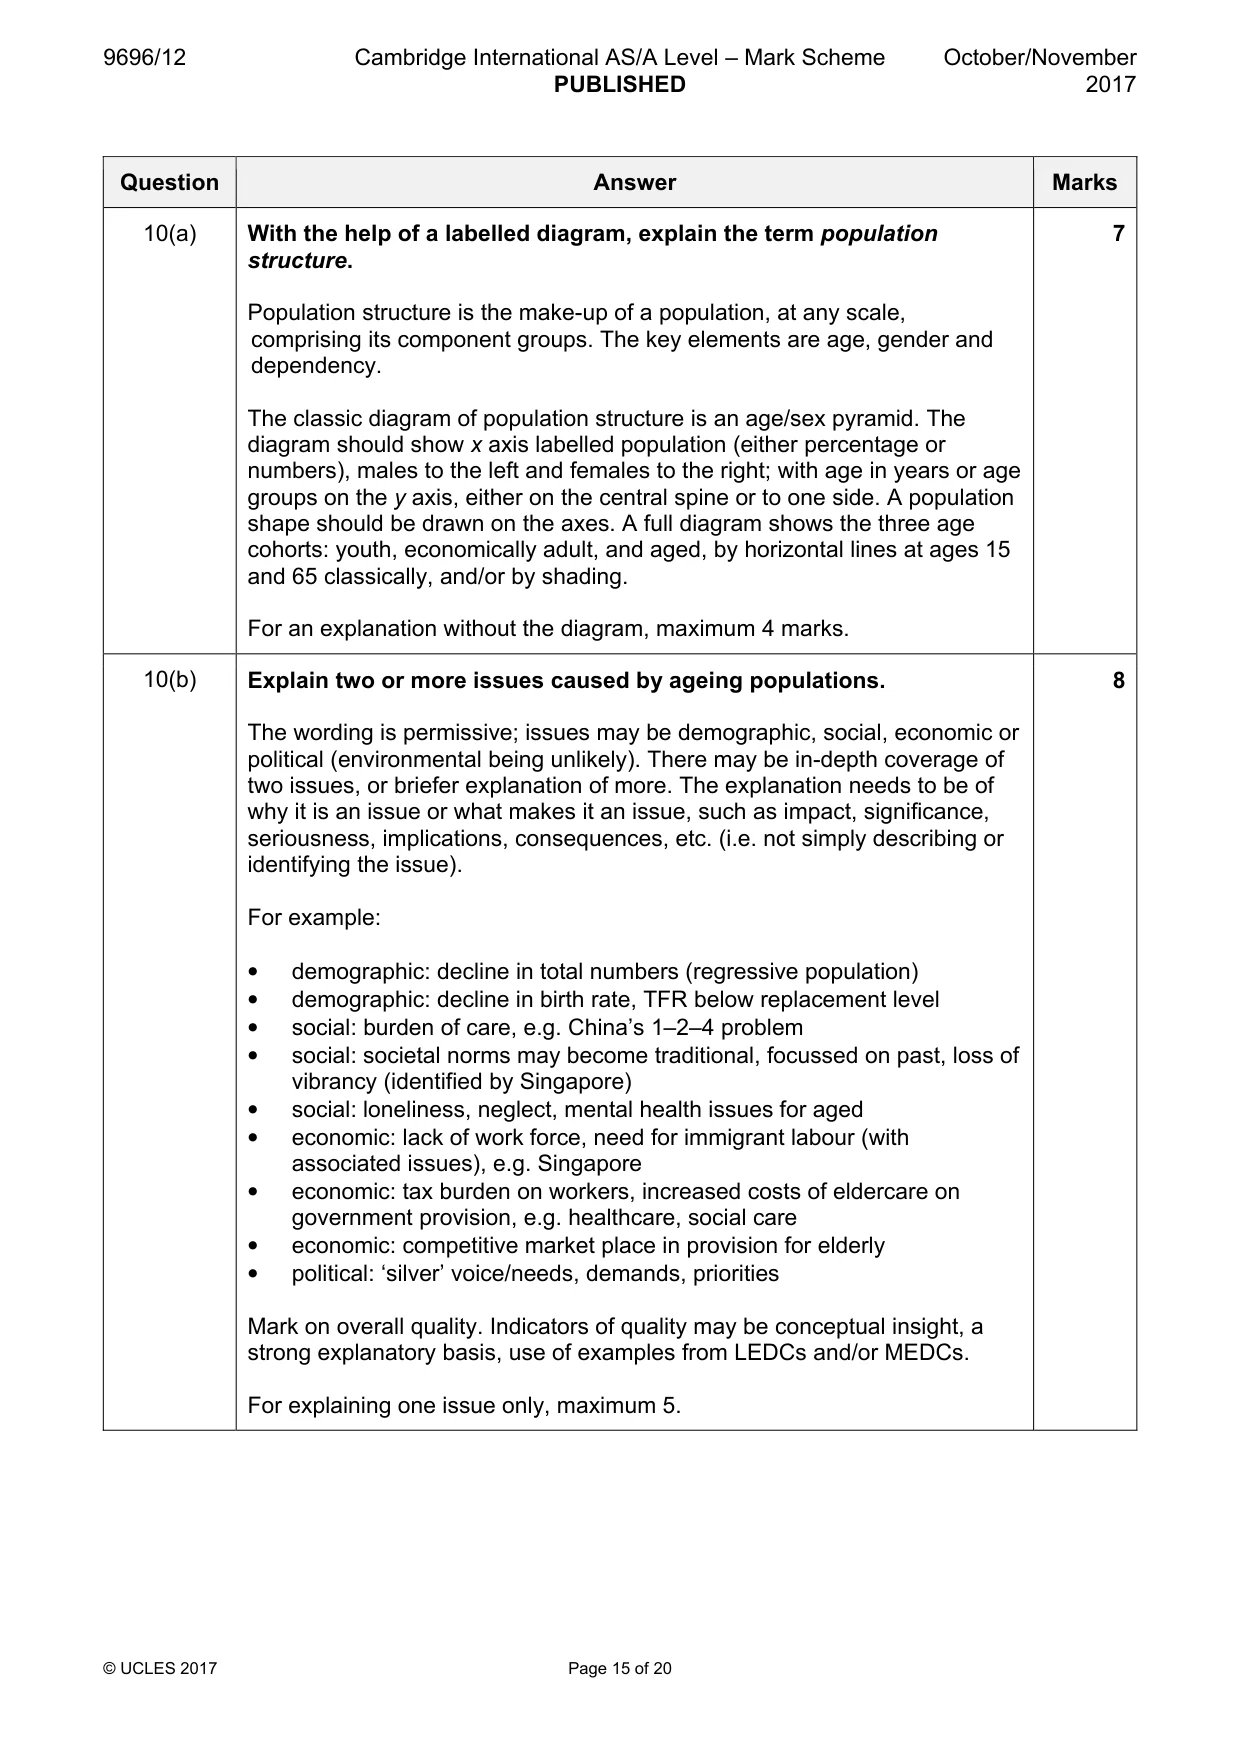
9696/12 Cambridge International AS/A Level – Mark Scheme PUBLISHED October/November 2017 © UCLES 2017 Page 15 of 20 Question Answer Marks 10(a) With the help of a labelled diagram, explain the term population structure. Population structure is the make-up of a population, at any scale, comprising its component groups. The key elements are age, gender and dependency. The classic diagram of population structure is an age/sex pyramid. The diagram should show x axis labelled population (either percentage or numbers), males to the left and females to the right; with age in years or age groups on the y axis, either on the central spine or to one side. A population shape should be drawn on the axes. A full diagram shows the three age cohorts: youth, economically adult, and aged, by horizontal lines at ages 15 and 65 classically, and/or by shading. For an explanation without the diagram, maximum 4 marks. 7 10(b) Explain two or more issues caused by ageing populations. The wording is permissive; issues may be demographic, social, economic or political (environmental being unlikely). There may be in-depth coverage of two issues, or briefer explanation of more. The explanation needs to be of why it is an issue or what makes it an issue, such as impact, significance, seriousness, implications, consequences, etc. (i.e. not simply describing or identifying the issue). For example: • demographic: decline in total numbers (regressive population) • demographic: decline in birth rate, TFR below replacement level • social: burden of care, e.g. China’s 1–2–4 problem • social: societal norms may become traditional, focussed on past, loss of vibrancy (identified by Singapore) • social: loneliness, neglect, mental health issues for aged • economic: lack of work force, need for immigrant labour (with associated issues), e.g. Singapore • economic: tax burden on workers, increased costs of eldercare on government provision, e.g. healthcare, social care • economic: competitive market place in provision for elderly • political: ‘silver’ voice/needs, demands, priorities Mark on overall quality. Indicators of quality may be conceptual insight, a strong explanatory basis, use of examples from LEDCs and/or MEDCs. For explaining one issue only, maximum 5. 8
Mark scheme, page 16
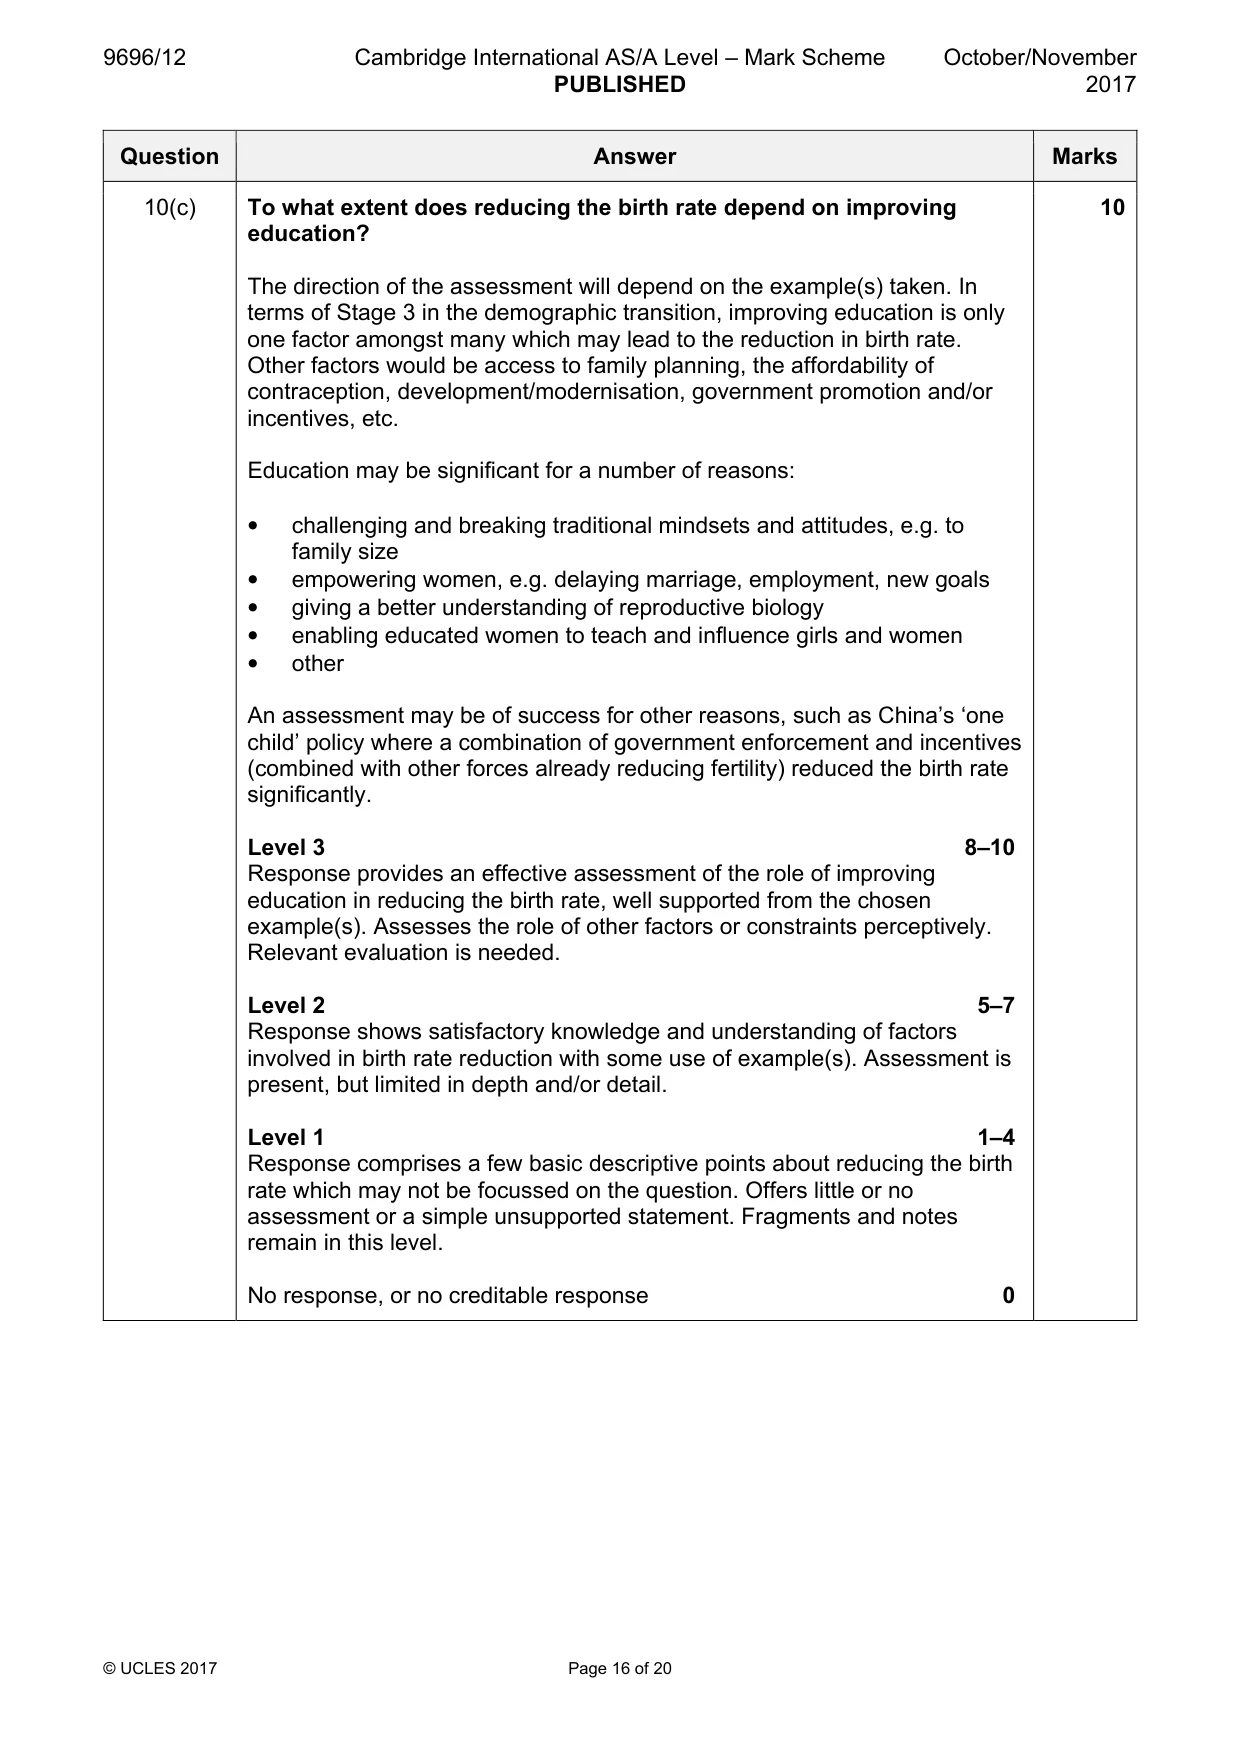
9696/12 Cambridge International AS/A Level – Mark Scheme PUBLISHED October/November 2017 © UCLES 2017 Page 16 of 20 Question Answer Marks 10(c) To what extent does reducing the birth rate depend on improving education? The direction of the assessment will depend on the example(s) taken. In terms of Stage 3 in the demographic transition, improving education is only one factor amongst many which may lead to the reduction in birth rate. Other factors would be access to family planning, the affordability of contraception, development/modernisation, government promotion and/or incentives, etc. Education may be significant for a number of reasons: • challenging and breaking traditional mindsets and attitudes, e.g. to family size • empowering women, e.g. delaying marriage, employment, new goals • giving a better understanding of reproductive biology • enabling educated women to teach and influence girls and women • other An assessment may be of success for other reasons, such as China’s ‘one child’ policy where a combination of government enforcement and incentives (combined with other forces already reducing fertility) reduced the birth rate significantly. Level 3 8–10 Response provides an effective assessment of the role of improving education in reducing the birth rate, well supported from the chosen example(s). Assesses the role of other factors or constraints perceptively. Relevant evaluation is needed. Level 2 5–7 Response shows satisfactory knowledge and understanding of factors involved in birth rate reduction with some use of example(s). Assessment is present, but limited in depth and/or detail. Level 1 1–4 Response comprises a few basic descriptive points about reducing the birth rate which may not be focussed on the question. Offers little or no assessment or a simple unsupported statement. Fragments and notes remain in this level. No response, or no creditable response 0 10
Mark scheme, page 17
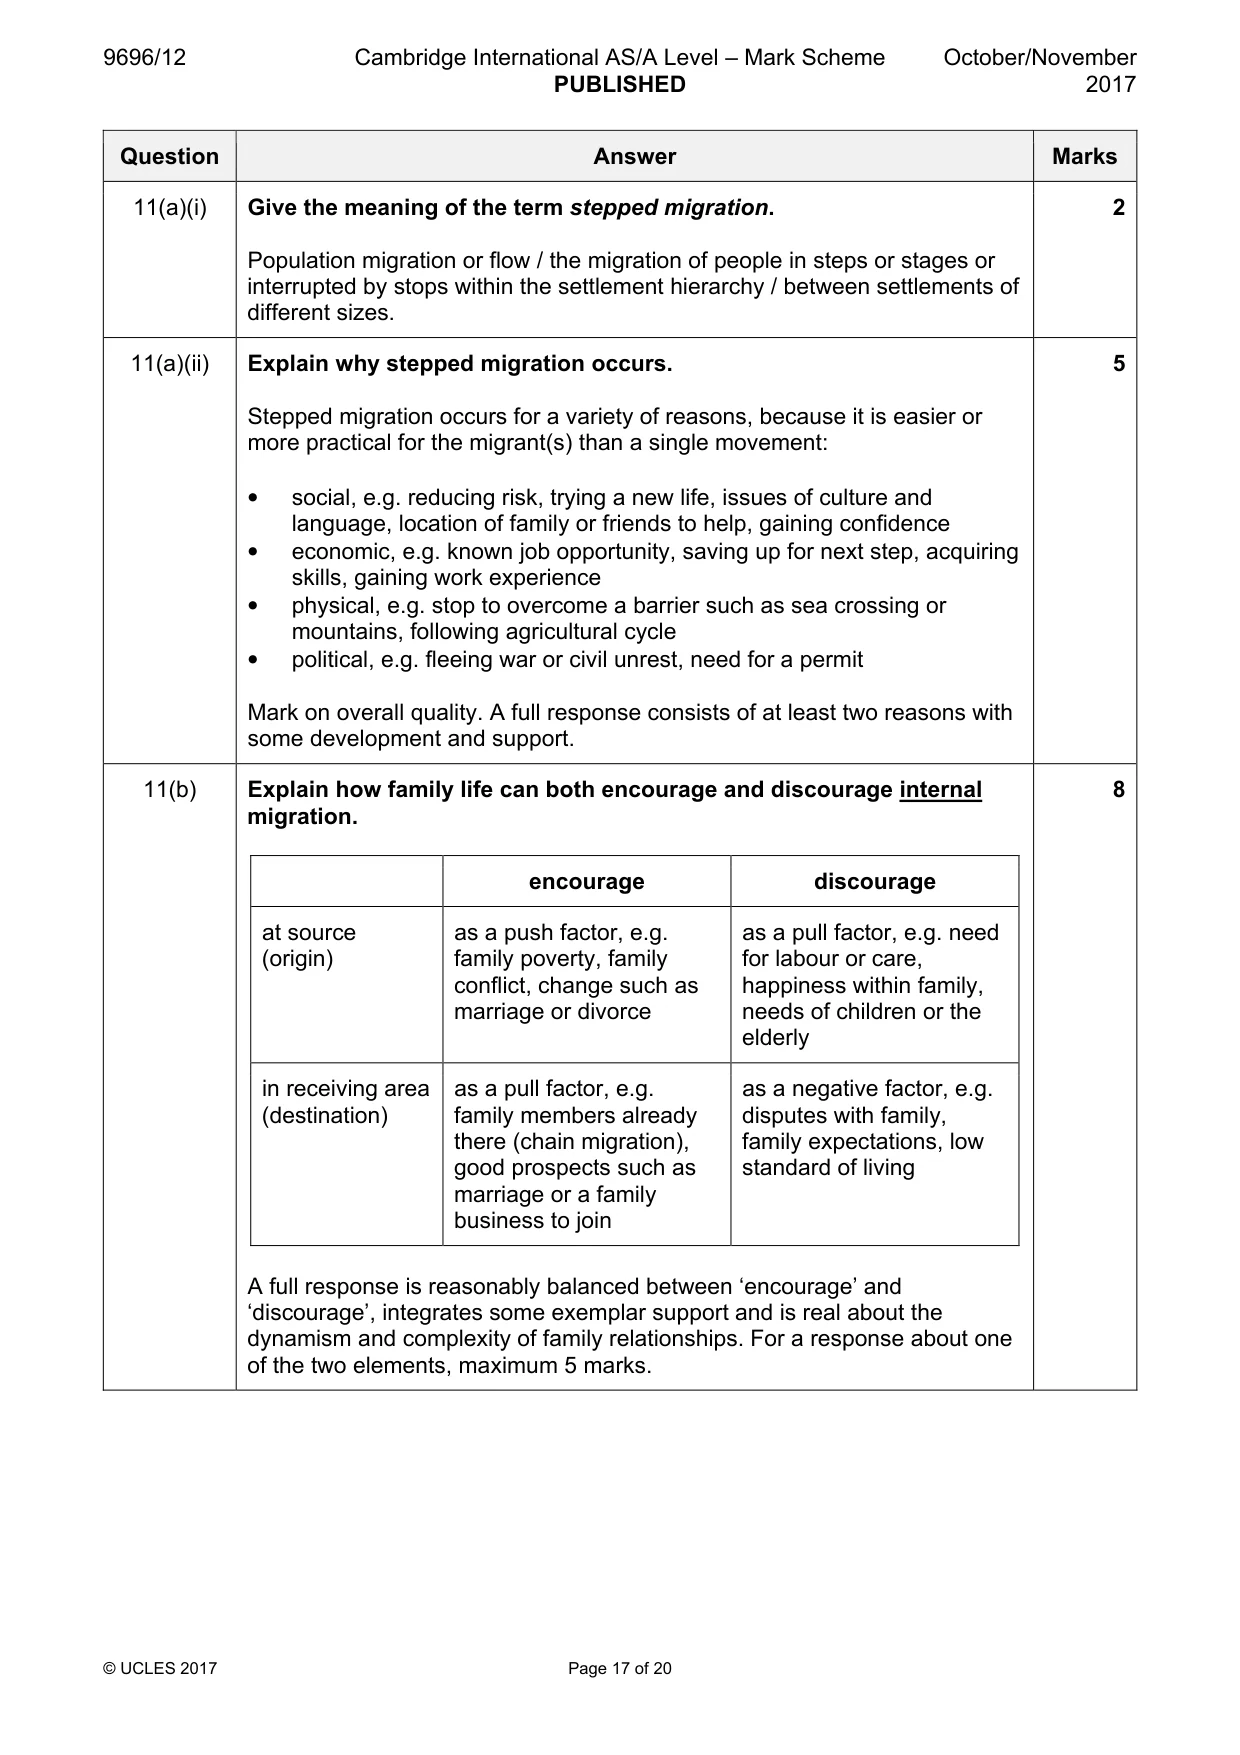
9696/12 Cambridge International AS/A Level – Mark Scheme PUBLISHED October/November 2017 © UCLES 2017 Page 17 of 20 Question Answer Marks 11(a)(i) Give the meaning of the term stepped migration. Population migration or flow / the migration of people in steps or stages or interrupted by stops within the settlement hierarchy / between settlements of different sizes. 2 11(a)(ii) Explain why stepped migration occurs. Stepped migration occurs for a variety of reasons, because it is easier or more practical for the migrant(s) than a single movement: • social, e.g. reducing risk, trying a new life, issues of culture and language, location of family or friends to help, gaining confidence • economic, e.g. known job opportunity, saving up for next step, acquiring skills, gaining work experience • physical, e.g. stop to overcome a barrier such as sea crossing or mountains, following agricultural cycle • political, e.g. fleeing war or civil unrest, need for a permit Mark on overall quality. A full response consists of at least two reasons with some development and support. 5 11(b) Explain how family life can both encourage and discourage internal migration. encourage discourage at source (origin) as a push factor, e.g. family poverty, family conflict, change such as marriage or divorce as a pull factor, e.g. need for labour or care, happiness within family, needs of children or the elderly in receiving area (destination) as a pull factor, e.g. family members already there (chain migration), good prospects such as marriage or a family business to join as a negative factor, e.g. disputes with family, family expectations, low standard of living A full response is reasonably balanced between ‘encourage’ and ‘discourage’, integrates some exemplar support and is real about the dynamism and complexity of family relationships. For a response about one of the two elements, maximum 5 marks. 8
Mark scheme, page 18
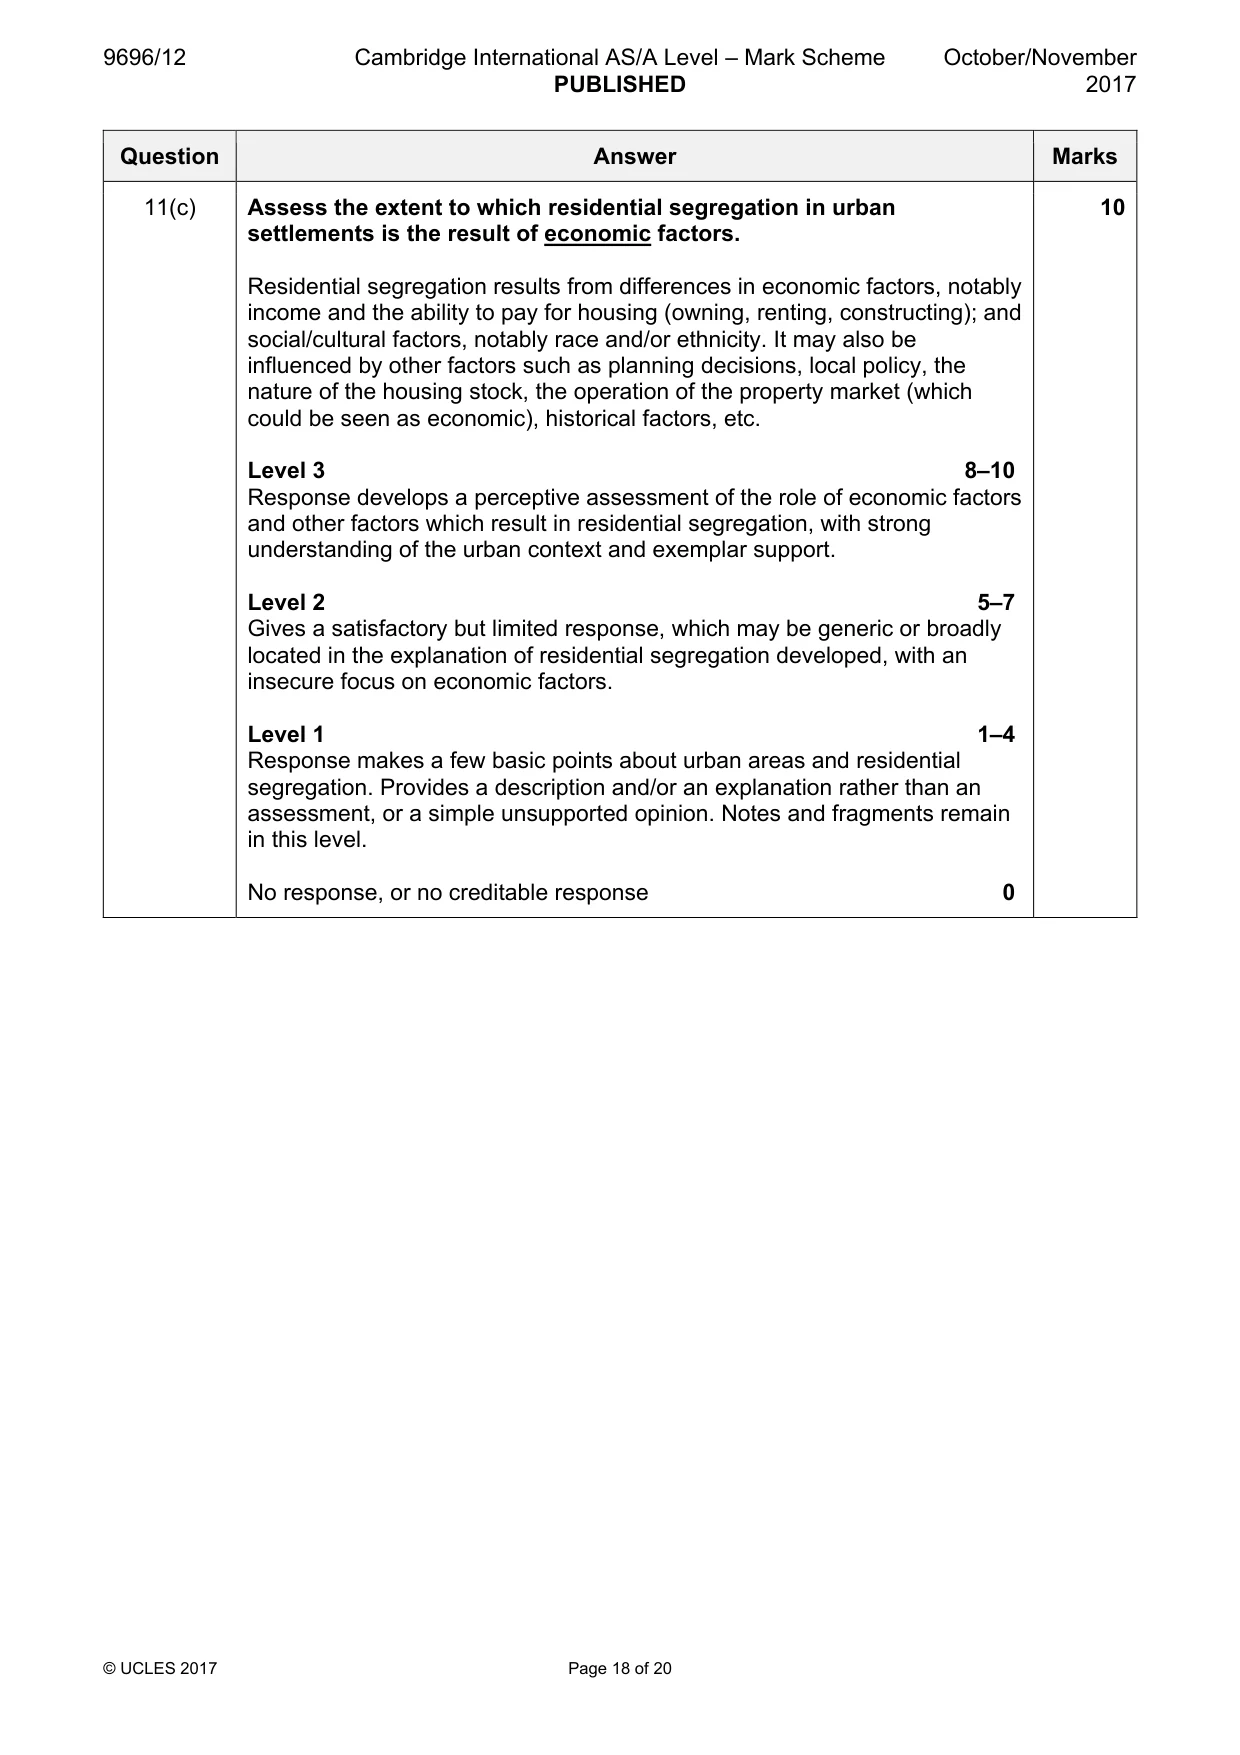
9696/12 Cambridge International AS/A Level – Mark Scheme PUBLISHED October/November 2017 © UCLES 2017 Page 18 of 20 Question Answer Marks 11(c) Assess the extent to which residential segregation in urban settlements is the result of economic factors. Residential segregation results from differences in economic factors, notably income and the ability to pay for housing (owning, renting, constructing); and social/cultural factors, notably race and/or ethnicity. It may also be influenced by other factors such as planning decisions, local policy, the nature of the housing stock, the operation of the property market (which could be seen as economic), historical factors, etc. Level 3 8–10 Response develops a perceptive assessment of the role of economic factors and other factors which result in residential segregation, with strong understanding of the urban context and exemplar support. Level 2 5–7 Gives a satisfactory but limited response, which may be generic or broadly located in the explanation of residential segregation developed, with an insecure focus on economic factors. Level 1 1–4 Response makes a few basic points about urban areas and residential segregation. Provides a description and/or an explanation rather than an assessment, or a simple unsupported opinion. Notes and fragments remain in this level. No response, or no creditable response 0 10
Mark scheme, page 19
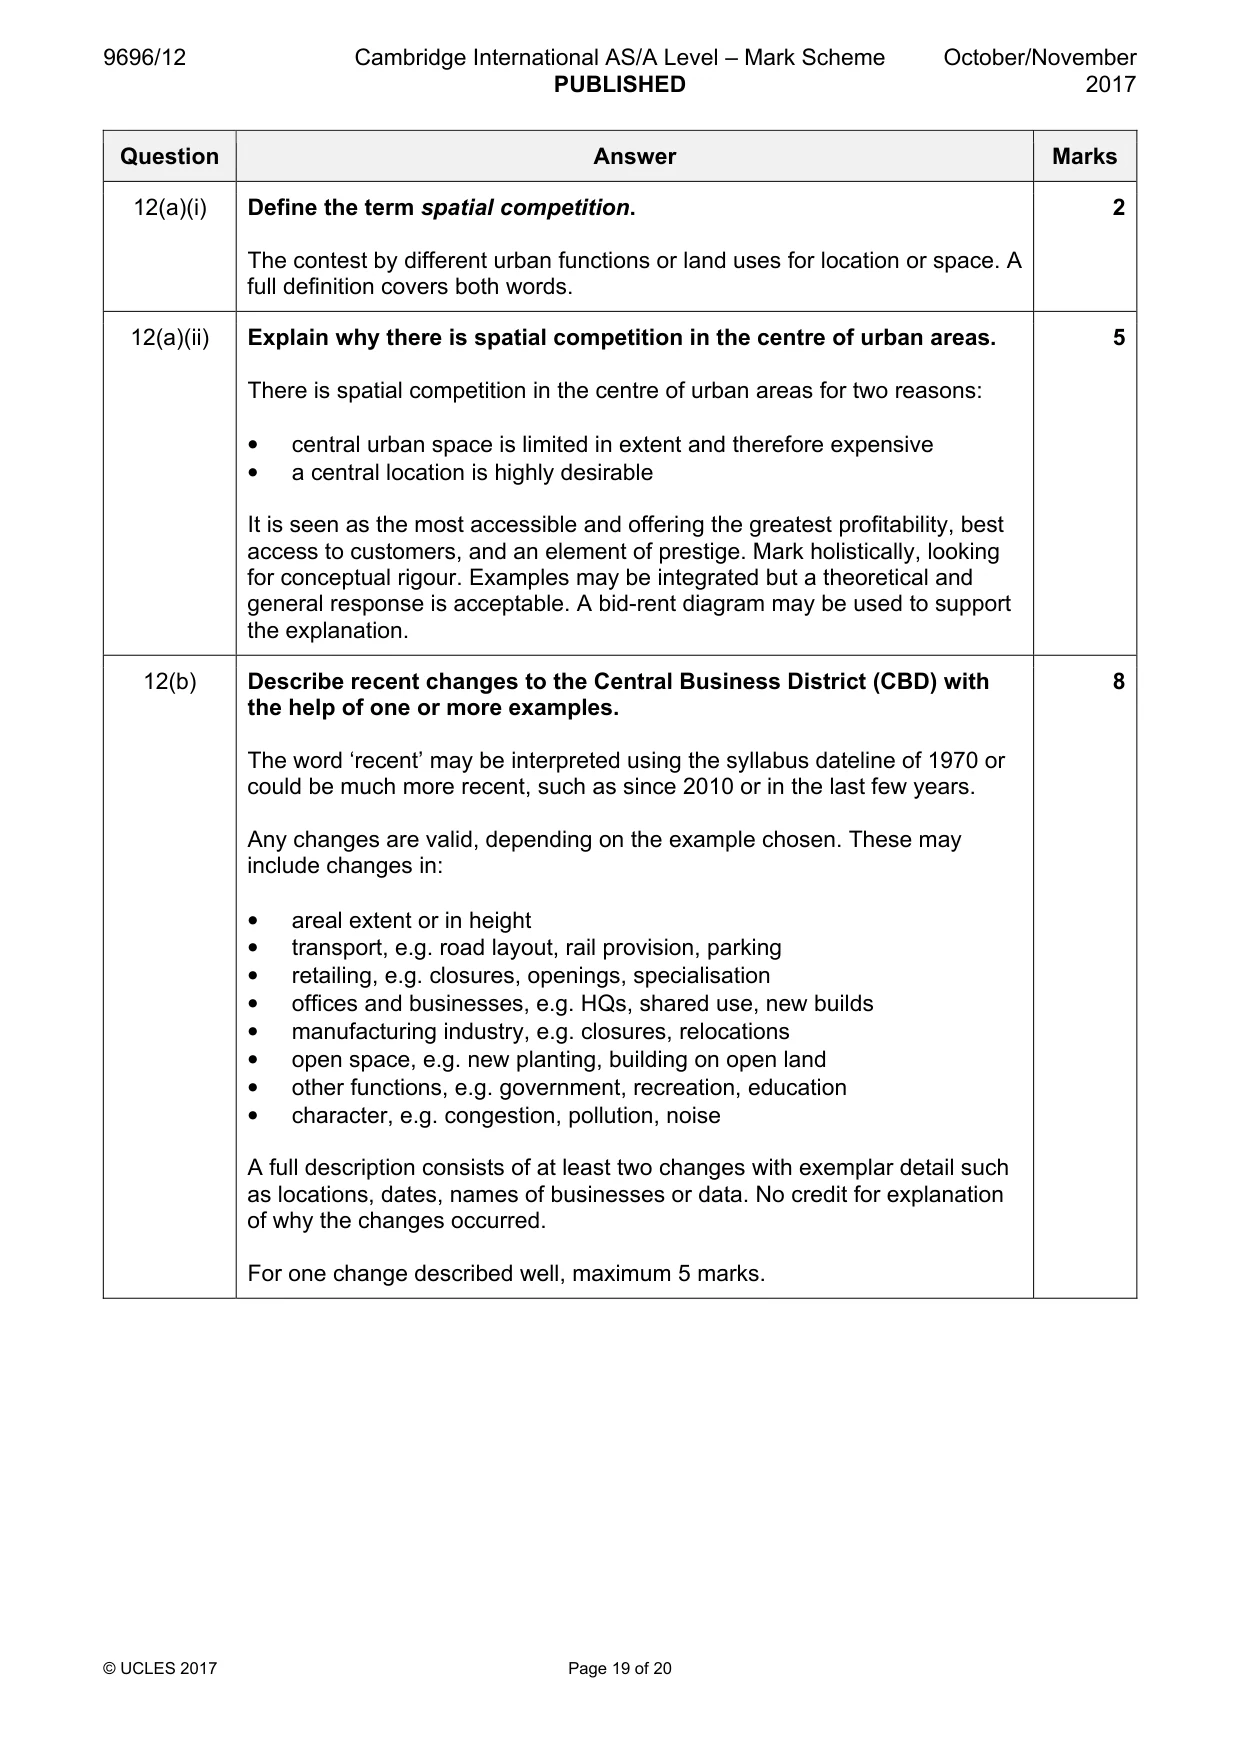
9696/12 Cambridge International AS/A Level – Mark Scheme PUBLISHED October/November 2017 © UCLES 2017 Page 19 of 20 Question Answer Marks 12(a)(i) Define the term spatial competition. The contest by different urban functions or land uses for location or space. A full definition covers both words. 2 12(a)(ii) Explain why there is spatial competition in the centre of urban areas. There is spatial competition in the centre of urban areas for two reasons: • central urban space is limited in extent and therefore expensive • a central location is highly desirable It is seen as the most accessible and offering the greatest profitability, best access to customers, and an element of prestige. Mark holistically, looking for conceptual rigour. Examples may be integrated but a theoretical and general response is acceptable. A bid-rent diagram may be used to support the explanation. 5 12(b) Describe recent changes to the Central Business District (CBD) with the help of one or more examples. The word ‘recent’ may be interpreted using the syllabus dateline of 1970 or could be much more recent, such as since 2010 or in the last few years. Any changes are valid, depending on the example chosen. These may include changes in: • areal extent or in height • transport, e.g. road layout, rail provision, parking • retailing, e.g. closures, openings, specialisation • offices and businesses, e.g. HQs, shared use, new builds • manufacturing industry, e.g. closures, relocations • open space, e.g. new planting, building on open land • other functions, e.g. government, recreation, education • character, e.g. congestion, pollution, noise A full description consists of at least two changes with exemplar detail such as locations, dates, names of businesses or data. No credit for explanation of why the changes occurred. For one change described well, maximum 5 marks. 8
Mark scheme, page 20
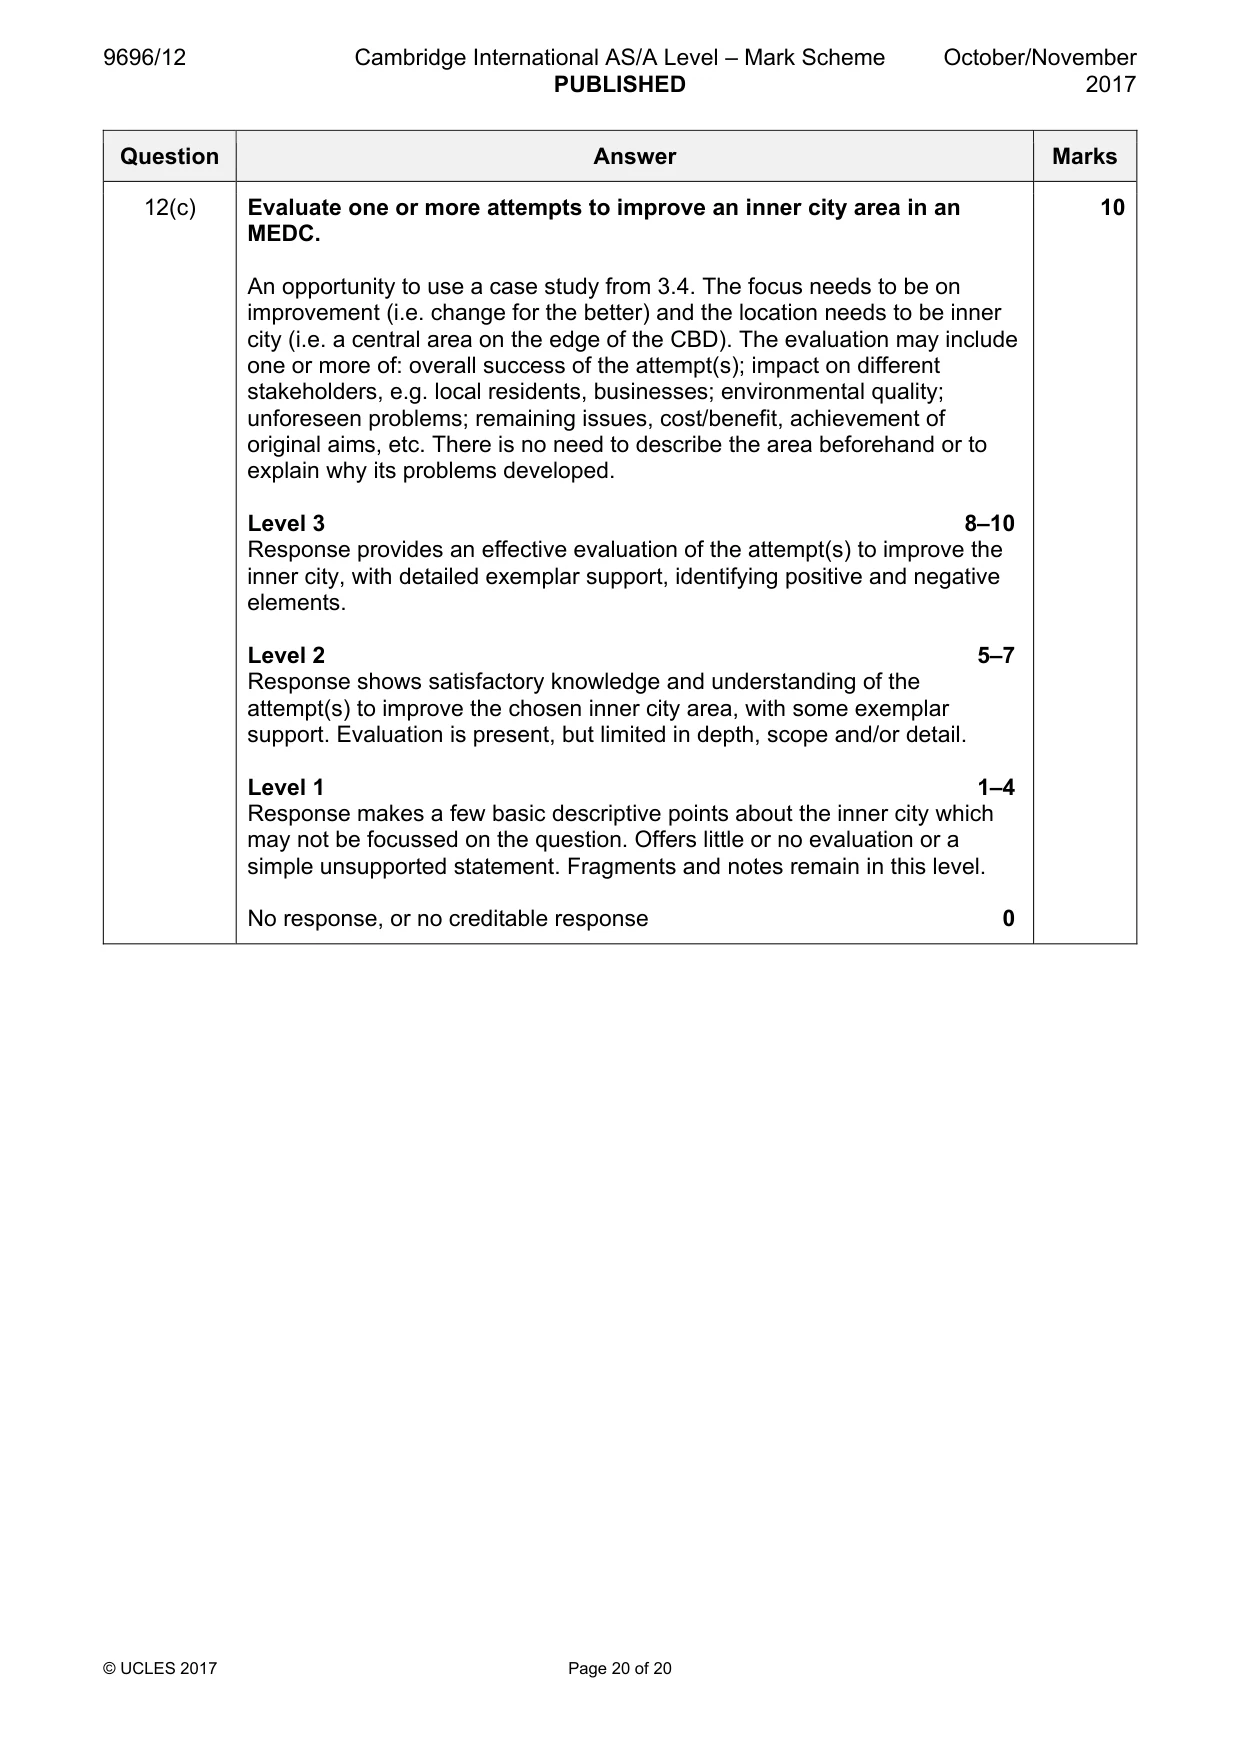
9696/12 Cambridge International AS/A Level – Mark Scheme PUBLISHED October/November 2017 © UCLES 2017 Page 20 of 20 Question Answer Marks 12(c) Evaluate one or more attempts to improve an inner city area in an MEDC. An opportunity to use a case study from 3.4. The focus needs to be on improvement (i.e. change for the better) and the location needs to be inner city (i.e. a central area on the edge of the CBD). The evaluation may include one or more of: overall success of the attempt(s); impact on different stakeholders, e.g. local residents, businesses; environmental quality; unforeseen problems; remaining issues, cost/benefit, achievement of original aims, etc. There is no need to describe the area beforehand or to explain why its problems developed. Level 3 8–10 Response provides an effective evaluation of the attempt(s) to improve the inner city, with detailed exemplar support, identifying positive and negative elements. Level 2 5–7 Response shows satisfactory knowledge and understanding of the attempt(s) to improve the chosen inner city area, with some exemplar support. Evaluation is present, but limited in depth, scope and/or detail. Level 1 1–4 Response makes a few basic descriptive points about the inner city which may not be focussed on the question. Offers little or no evaluation or a simple unsupported statement. Fragments and notes remain in this level. No response, or no creditable response 0 10
What you needed in this session
Cambridge’s own grade thresholds for 2017 Oct/Nov, Paper 1 · Variant 2. A higher threshold means an easier paper — the bar moves with how the cohort did.