Cambridge A Level Geography 9696 — 2016 May/June Paper 3 · Variant 3
9696/33/M/J/16 · 50 marks · ≈56 min
The question paper and its mark scheme, free to read here and free to download. This is Cambridge’s own paper, exactly as it was sat.
Question paper4 pages

Mark scheme14 pages
Answers below. Sit the paper first if you are practising.

Paper as text
Question paper, page 1
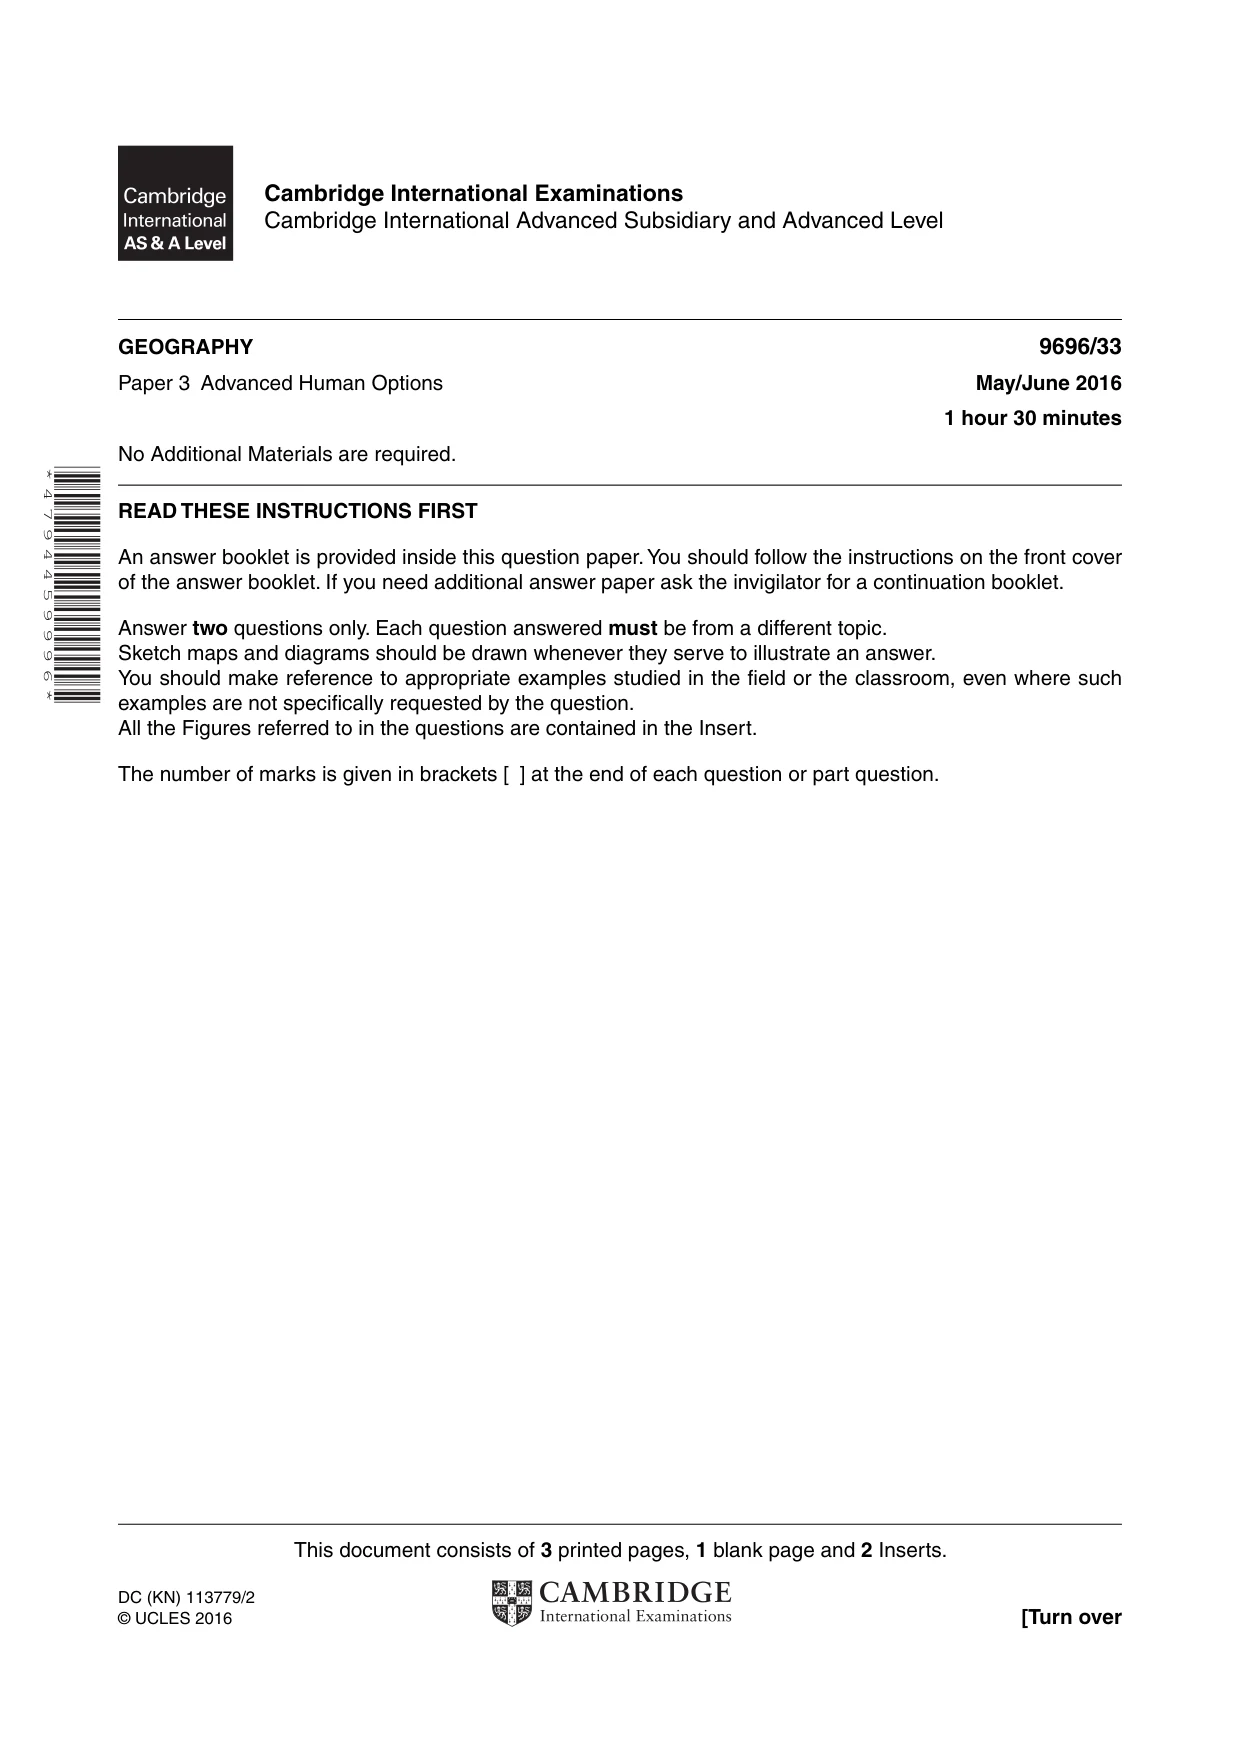
This document consists of 3 printed pages, 1 blank page and 2 Inserts. DC (KN) 113779/2 © UCLES 2016 [Turn over Cambridge International Examinations Cambridge International Advanced Subsidiary and Advanced Level * 4 7 9 4 4 5 9 9 9 6 * GEOGRAPHY 9696/33 Paper 3 Advanced Human Options May/June 2016 1 hour 30 minutes No Additional Materials are required. READ THESE INSTRUCTIONS FIRST An answer booklet is provided inside this question paper. You should follow the instructions on the front cover of the answer booklet. If you need additional answer paper ask the invigilator for a continuation booklet. Answer two questions only. Each question answered must be from a different topic. Sketch maps and diagrams should be drawn whenever they serve to illustrate an answer. You should make reference to appropriate examples studied in the field or the classroom, even where such examples are not specifically requested by the question. All the Figures referred to in the questions are contained in the Insert. The number of marks is given in brackets [ ] at the end of each question or part question.
Question paper, page 2
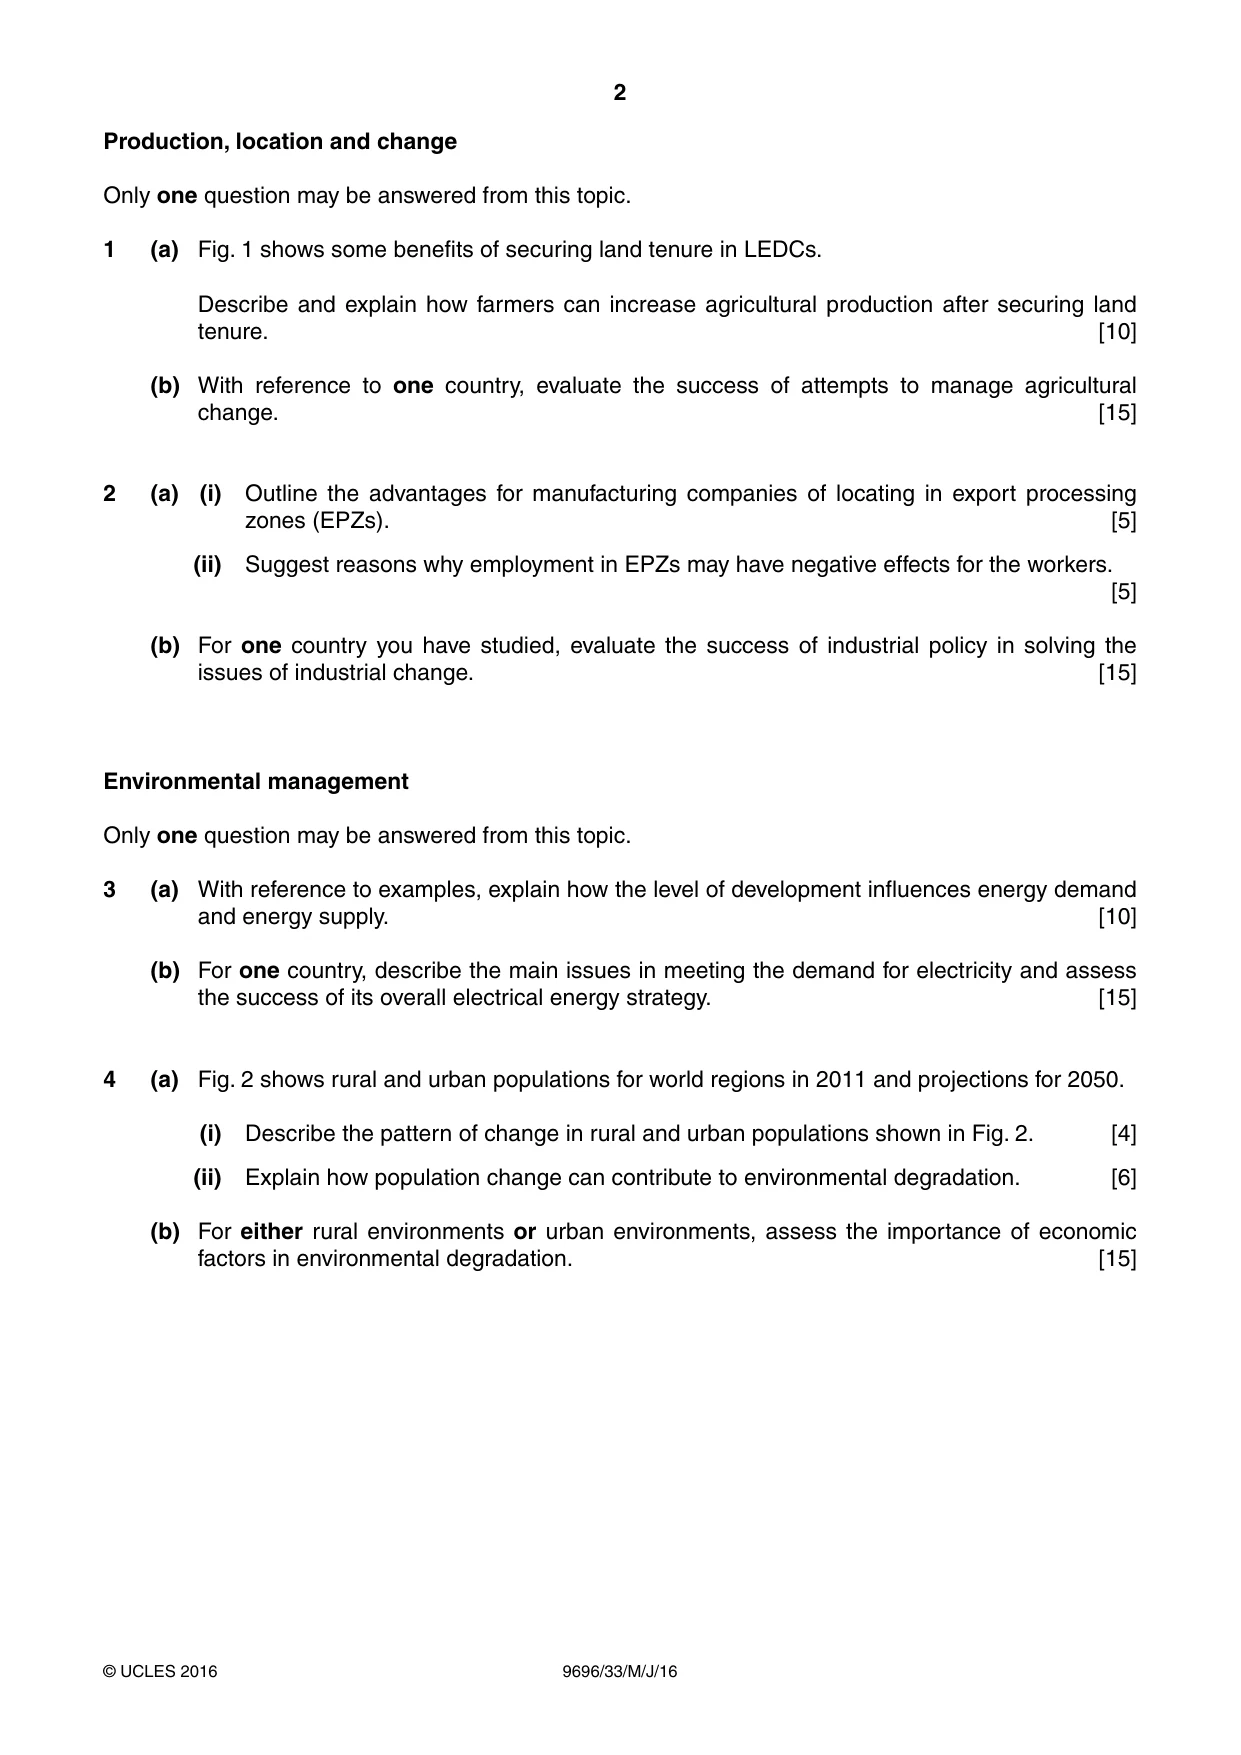
2 9696/33/M/J/16 © UCLES 2016 Production, location and change Only one question may be answered from this topic. 1 (a) Fig. 1 shows some benefits of securing land tenure in LEDCs. Describe and explain how farmers can increase agricultural production after securing land tenure. [10] (b) With reference to one country, evaluate the success of attempts to manage agricultural change. [15] 2 (a) (i) Outline the advantages for manufacturing companies of locating in export processing zones (EPZs). [5] (ii) Suggest reasons why employment in EPZs may have negative effects for the workers. [5] (b) For one country you have studied, evaluate the success of industrial policy in solving the issues of industrial change. [15] Environmental management Only one question may be answered from this topic. 3 (a) With reference to examples, explain how the level of development influences energy demand and energy supply. [10] (b) For one country, describe the main issues in meeting the demand for electricity and assess the success of its overall electrical energy strategy. [15] 4 (a) Fig. 2 shows rural and urban populations for world regions in 2011 and projections for 2050. (i) Describe the pattern of change in rural and urban populations shown in Fig. 2. [4] (ii) Explain how population change can contribute to environmental degradation. [6] (b) For either rural environments or urban environments, assess the importance of economic factors in environmental degradation. [15]
Question paper, page 3
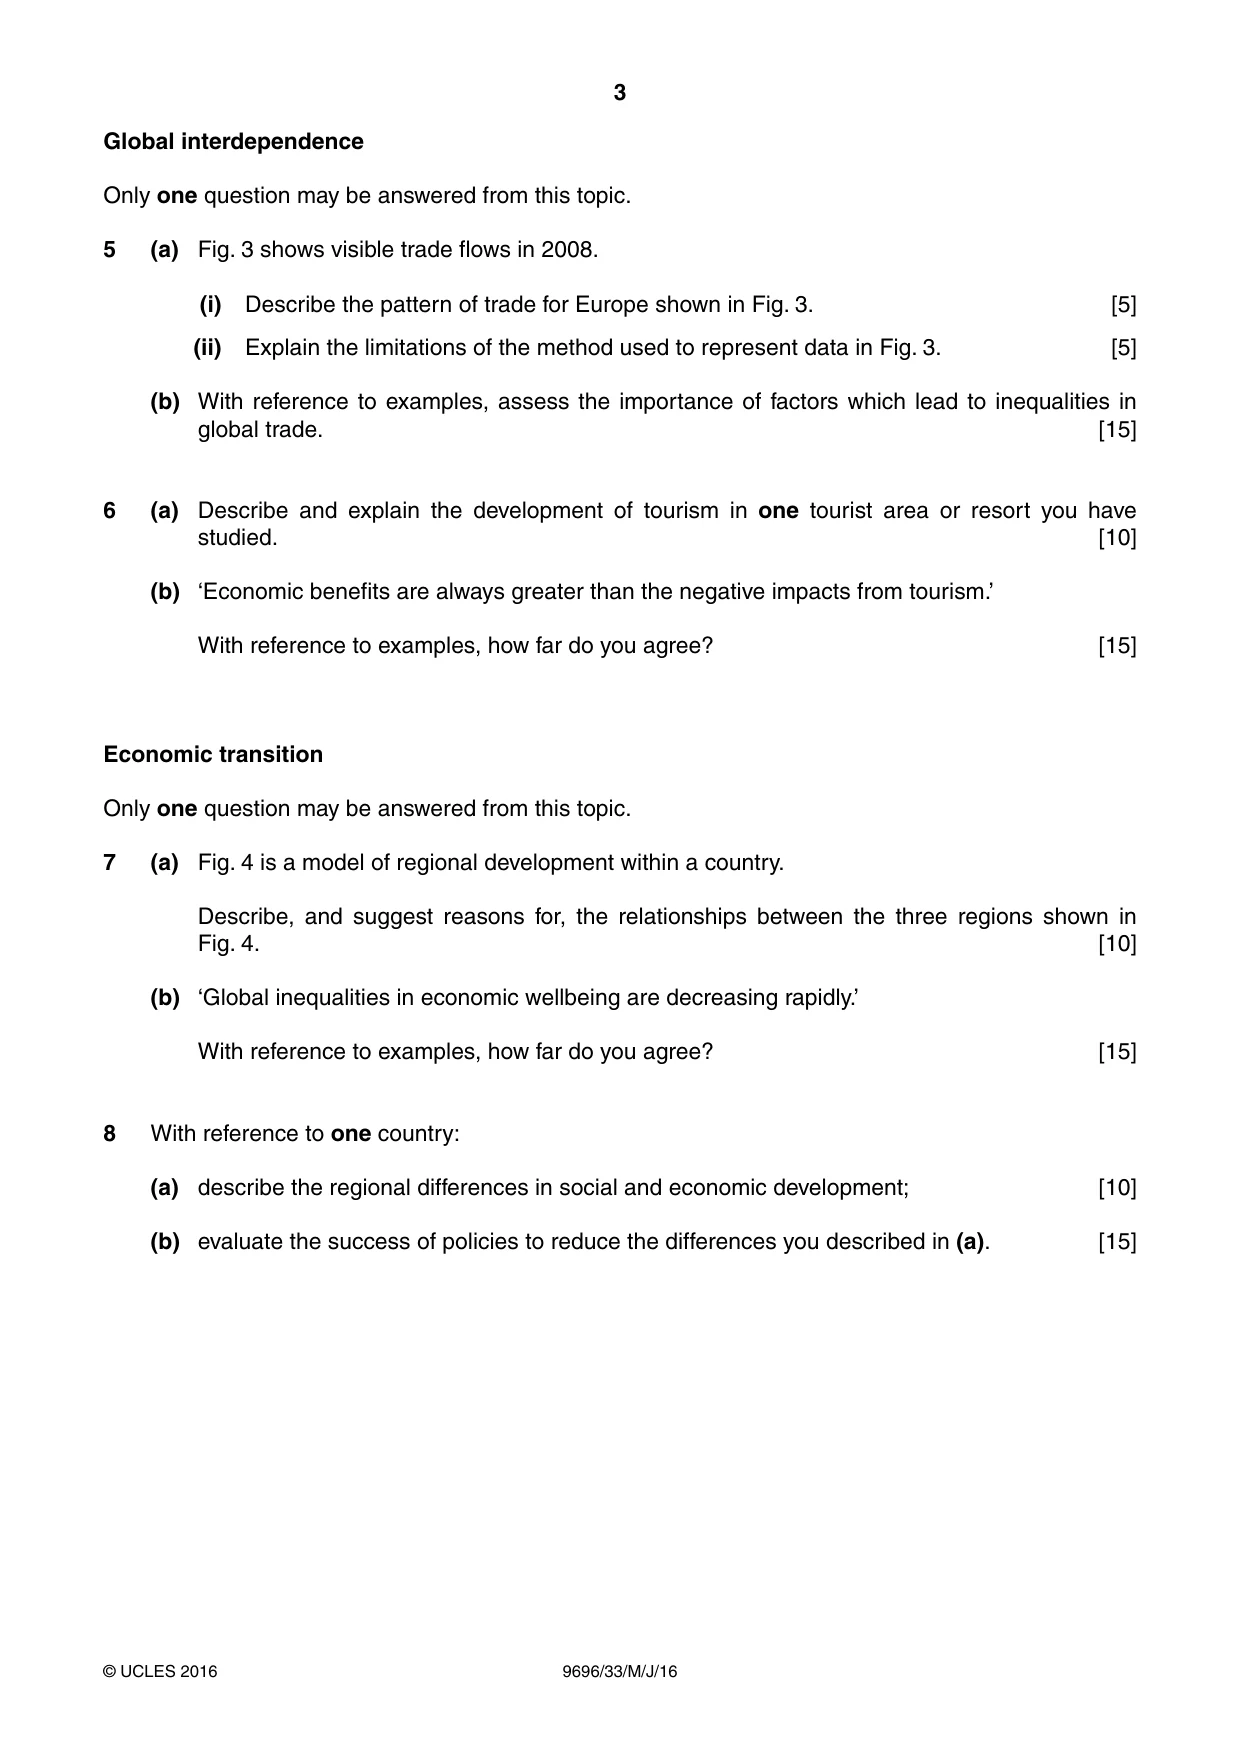
3 9696/33/M/J/16 © UCLES 2016 Global interdependence Only one question may be answered from this topic. 5 (a) Fig. 3 shows visible trade flows in 2008. (i) Describe the pattern of trade for Europe shown in Fig. 3. [5] (ii) Explain the limitations of the method used to represent data in Fig. 3. [5] (b) With reference to examples, assess the importance of factors which lead to inequalities in global trade. [15] 6 (a) Describe and explain the development of tourism in one tourist area or resort you have studied. [10] (b) ‘Economic benefits are always greater than the negative impacts from tourism.’ With reference to examples, how far do you agree? [15] Economic transition Only one question may be answered from this topic. 7 (a) Fig. 4 is a model of regional development within a country. Describe, and suggest reasons for, the relationships between the three regions shown in Fig. 4. [10] (b) ‘Global inequalities in economic wellbeing are decreasing rapidly.’ With reference to examples, how far do you agree? [15] 8 With reference to one country: (a) describe the regional differences in social and economic development; [10] (b) evaluate the success of policies to reduce the differences you described in (a). [15]
Question paper, page 4
4 9696/33/M/J/16 © UCLES 2016 BLANK PAGE Permission to reproduce items where third-party owned material protected by copyright is included has been sought and cleared where possible. Every reasonable effort has been made by the publisher (UCLES) to trace copyright holders, but if any items requiring clearance have unwittingly been included, the publisher will be pleased to make amends at the earliest possible opportunity. To avoid the issue of disclosure of answer-related information to candidates, all copyright acknowledgements are reproduced online in the Cambridge International Examinations Copyright Acknowledgements Booklet. This is produced for each series of examinations and is freely available to download at www.cie.org.uk after the live examination series. Cambridge International Examinations is part of the Cambridge Assessment Group. Cambridge Assessment is the brand name of University of Cambridge Local Examinations Syndicate (UCLES), which is itself a department of the University of Cambridge.
Mark scheme, page 1
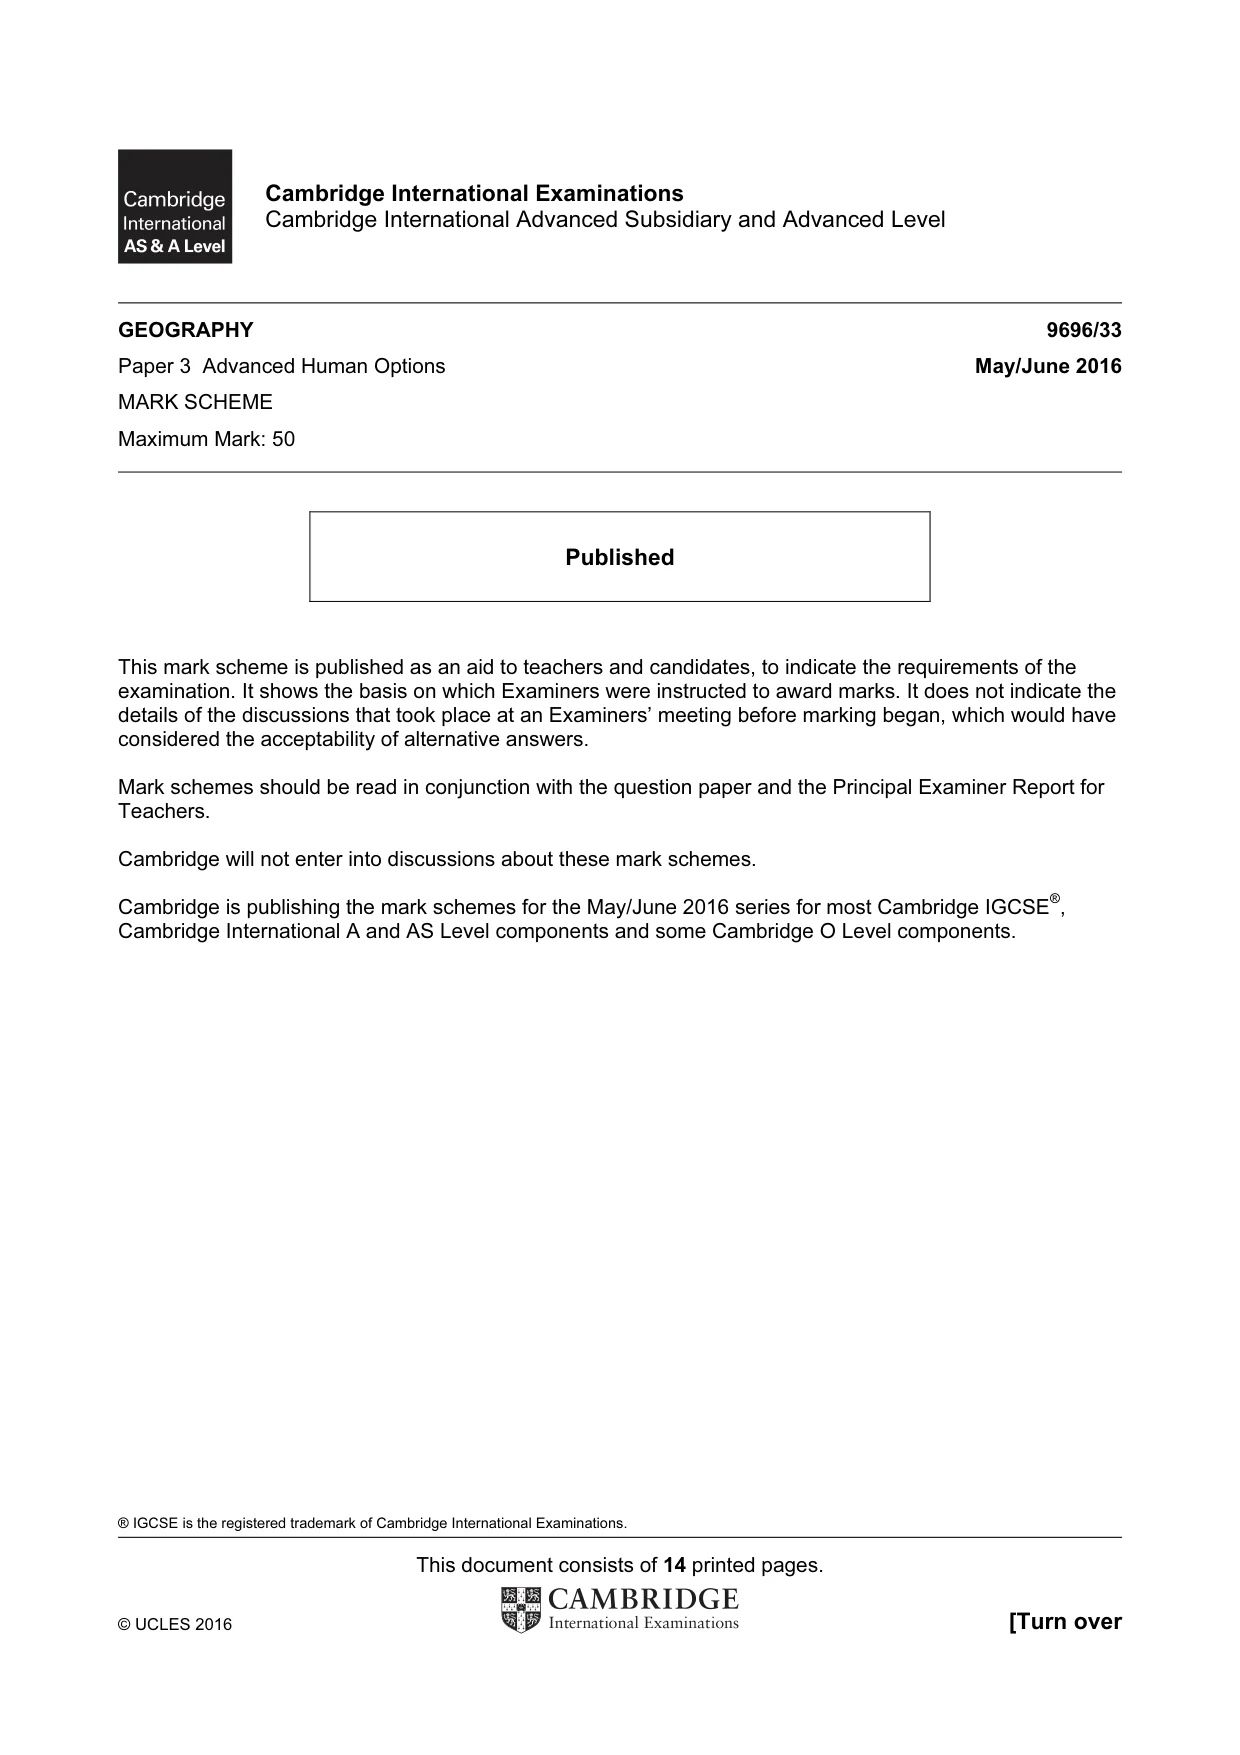
® IGCSE is the registered trademark of Cambridge International Examinations. This document consists of 14 printed pages. © UCLES 2016 [Turn over Cambridge International Examinations Cambridge International Advanced Subsidiary and Advanced Level GEOGRAPHY 9696/33 Paper 3 Advanced Human Options May/June 2016 MARK SCHEME Maximum Mark: 50 Published This mark scheme is published as an aid to teachers and candidates, to indicate the requirements of the examination. It shows the basis on which Examiners were instructed to award marks. It does not indicate the details of the discussions that took place at an Examiners’ meeting before marking began, which would have considered the acceptability of alternative answers. Mark schemes should be read in conjunction with the question paper and the Principal Examiner Report for Teachers. Cambridge will not enter into discussions about these mark schemes. Cambridge is publishing the mark schemes for the May/June 2016 series for most Cambridge IGCSE®, Cambridge International A and AS Level components and some Cambridge O Level components.
Mark scheme, page 2
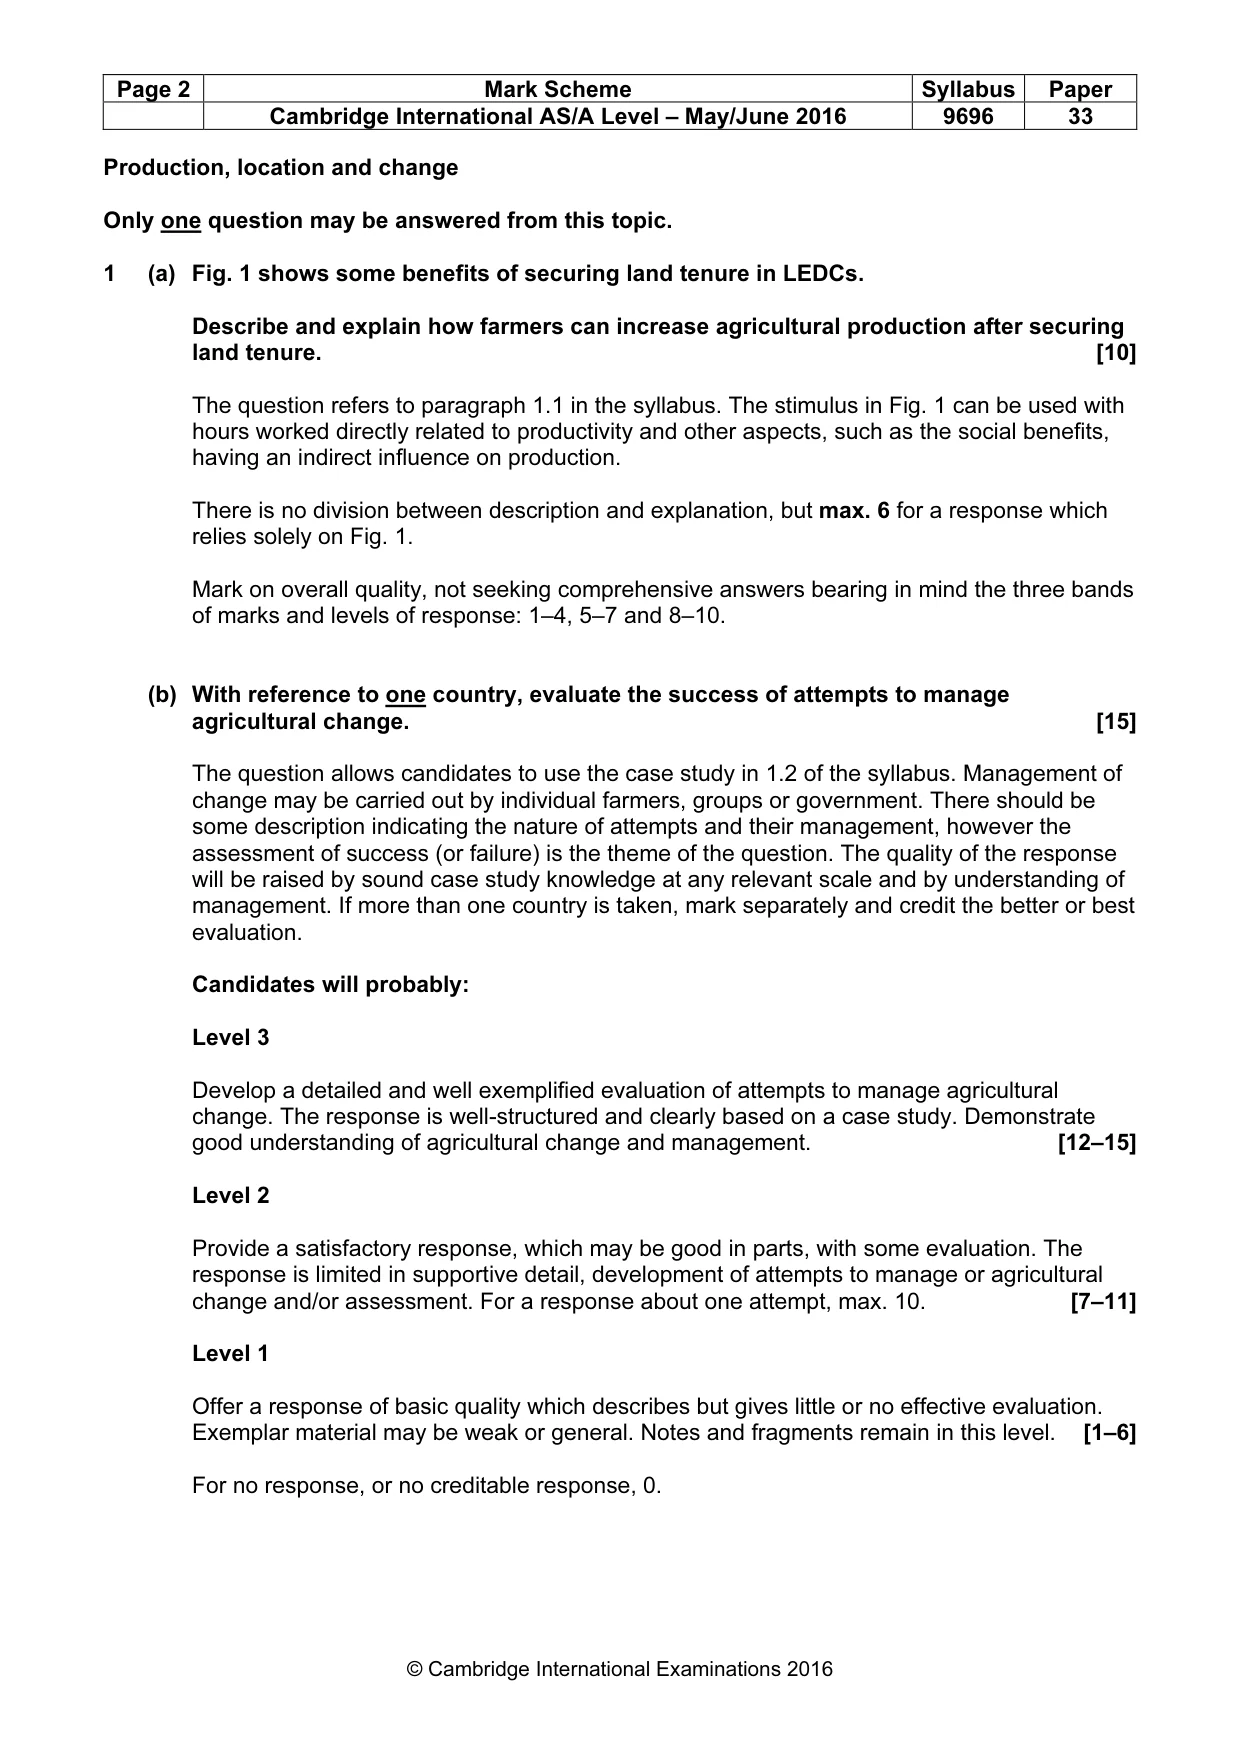
Page 2 Mark Scheme Syllabus Paper Cambridge International AS/A Level – May/June 2016 9696 33 © Cambridge International Examinations 2016 Production, location and change Only one question may be answered from this topic. 1 (a) Fig. 1 shows some benefits of securing land tenure in LEDCs. Describe and explain how farmers can increase agricultural production after securing land tenure. [10] The question refers to paragraph 1.1 in the syllabus. The stimulus in Fig. 1 can be used with hours worked directly related to productivity and other aspects, such as the social benefits, having an indirect influence on production. There is no division between description and explanation, but max. 6 for a response which relies solely on Fig. 1. Mark on overall quality, not seeking comprehensive answers bearing in mind the three bands of marks and levels of response: 1–4, 5–7 and 8–10. (b) With reference to one country, evaluate the success of attempts to manage agricultural change. [15] The question allows candidates to use the case study in 1.2 of the syllabus. Management of change may be carried out by individual farmers, groups or government. There should be some description indicating the nature of attempts and their management, however the assessment of success (or failure) is the theme of the question. The quality of the response will be raised by sound case study knowledge at any relevant scale and by understanding of management. If more than one country is taken, mark separately and credit the better or best evaluation. Candidates will probably: Level 3 Develop a detailed and well exemplified evaluation of attempts to manage agricultural change. The response is well-structured and clearly based on a case study. Demonstrate good understanding of agricultural change and management. [12–15] Level 2 Provide a satisfactory response, which may be good in parts, with some evaluation. The response is limited in supportive detail, development of attempts to manage or agricultural change and/or assessment. For a response about one attempt, max. 10. [7–11] Level 1 Offer a response of basic quality which describes but gives little or no effective evaluation. Exemplar material may be weak or general. Notes and fragments remain in this level. [1–6] For no response, or no creditable response, 0.
Mark scheme, page 3
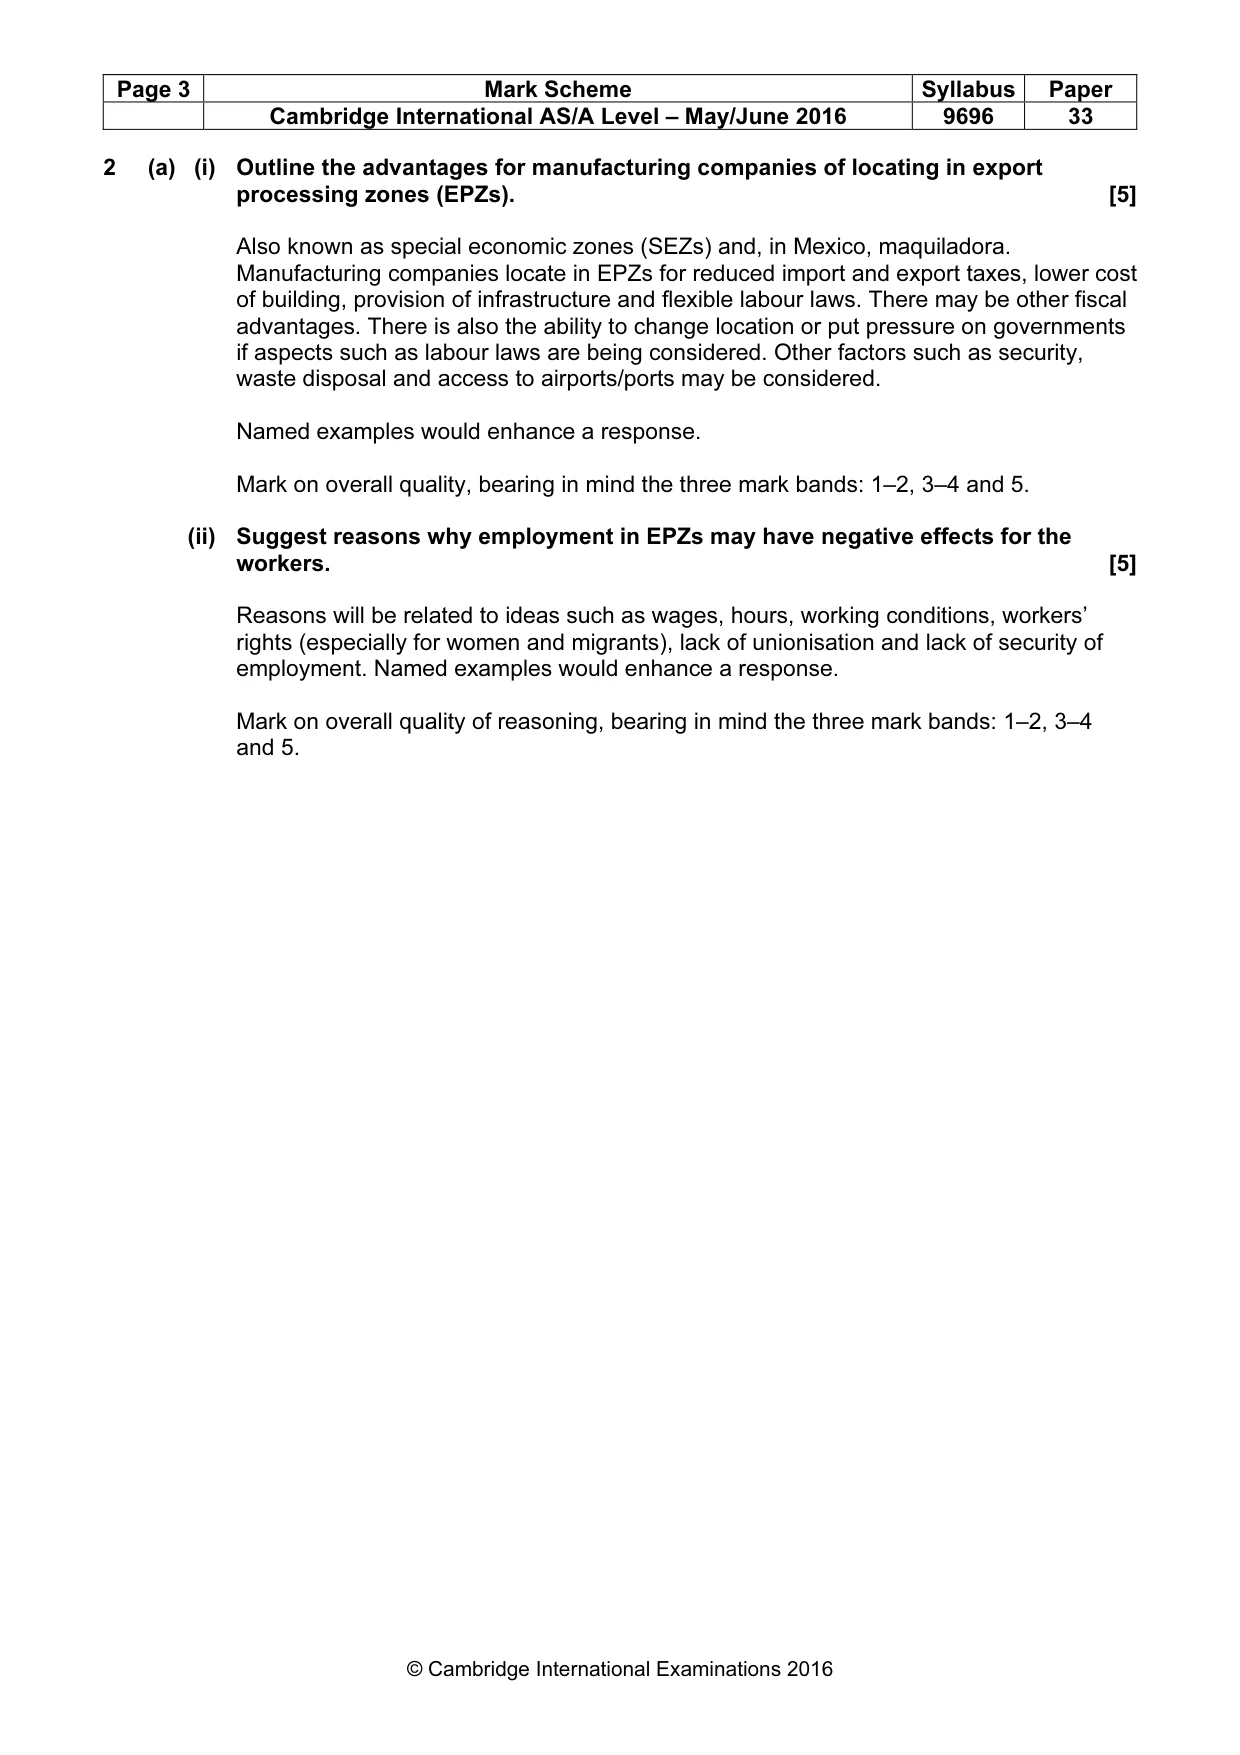
Page 3 Mark Scheme Syllabus Paper Cambridge International AS/A Level – May/June 2016 9696 33 © Cambridge International Examinations 2016 2 (a) (i) Outline the advantages for manufacturing companies of locating in export processing zones (EPZs). [5] Also known as special economic zones (SEZs) and, in Mexico, maquiladora. Manufacturing companies locate in EPZs for reduced import and export taxes, lower cost of building, provision of infrastructure and flexible labour laws. There may be other fiscal advantages. There is also the ability to change location or put pressure on governments if aspects such as labour laws are being considered. Other factors such as security, waste disposal and access to airports/ports may be considered. Named examples would enhance a response. Mark on overall quality, bearing in mind the three mark bands: 1–2, 3–4 and 5. (ii) Suggest reasons why employment in EPZs may have negative effects for the workers. [5] Reasons will be related to ideas such as wages, hours, working conditions, workers’ rights (especially for women and migrants), lack of unionisation and lack of security of employment. Named examples would enhance a response. Mark on overall quality of reasoning, bearing in mind the three mark bands: 1–2, 3–4 and 5.
Mark scheme, page 4
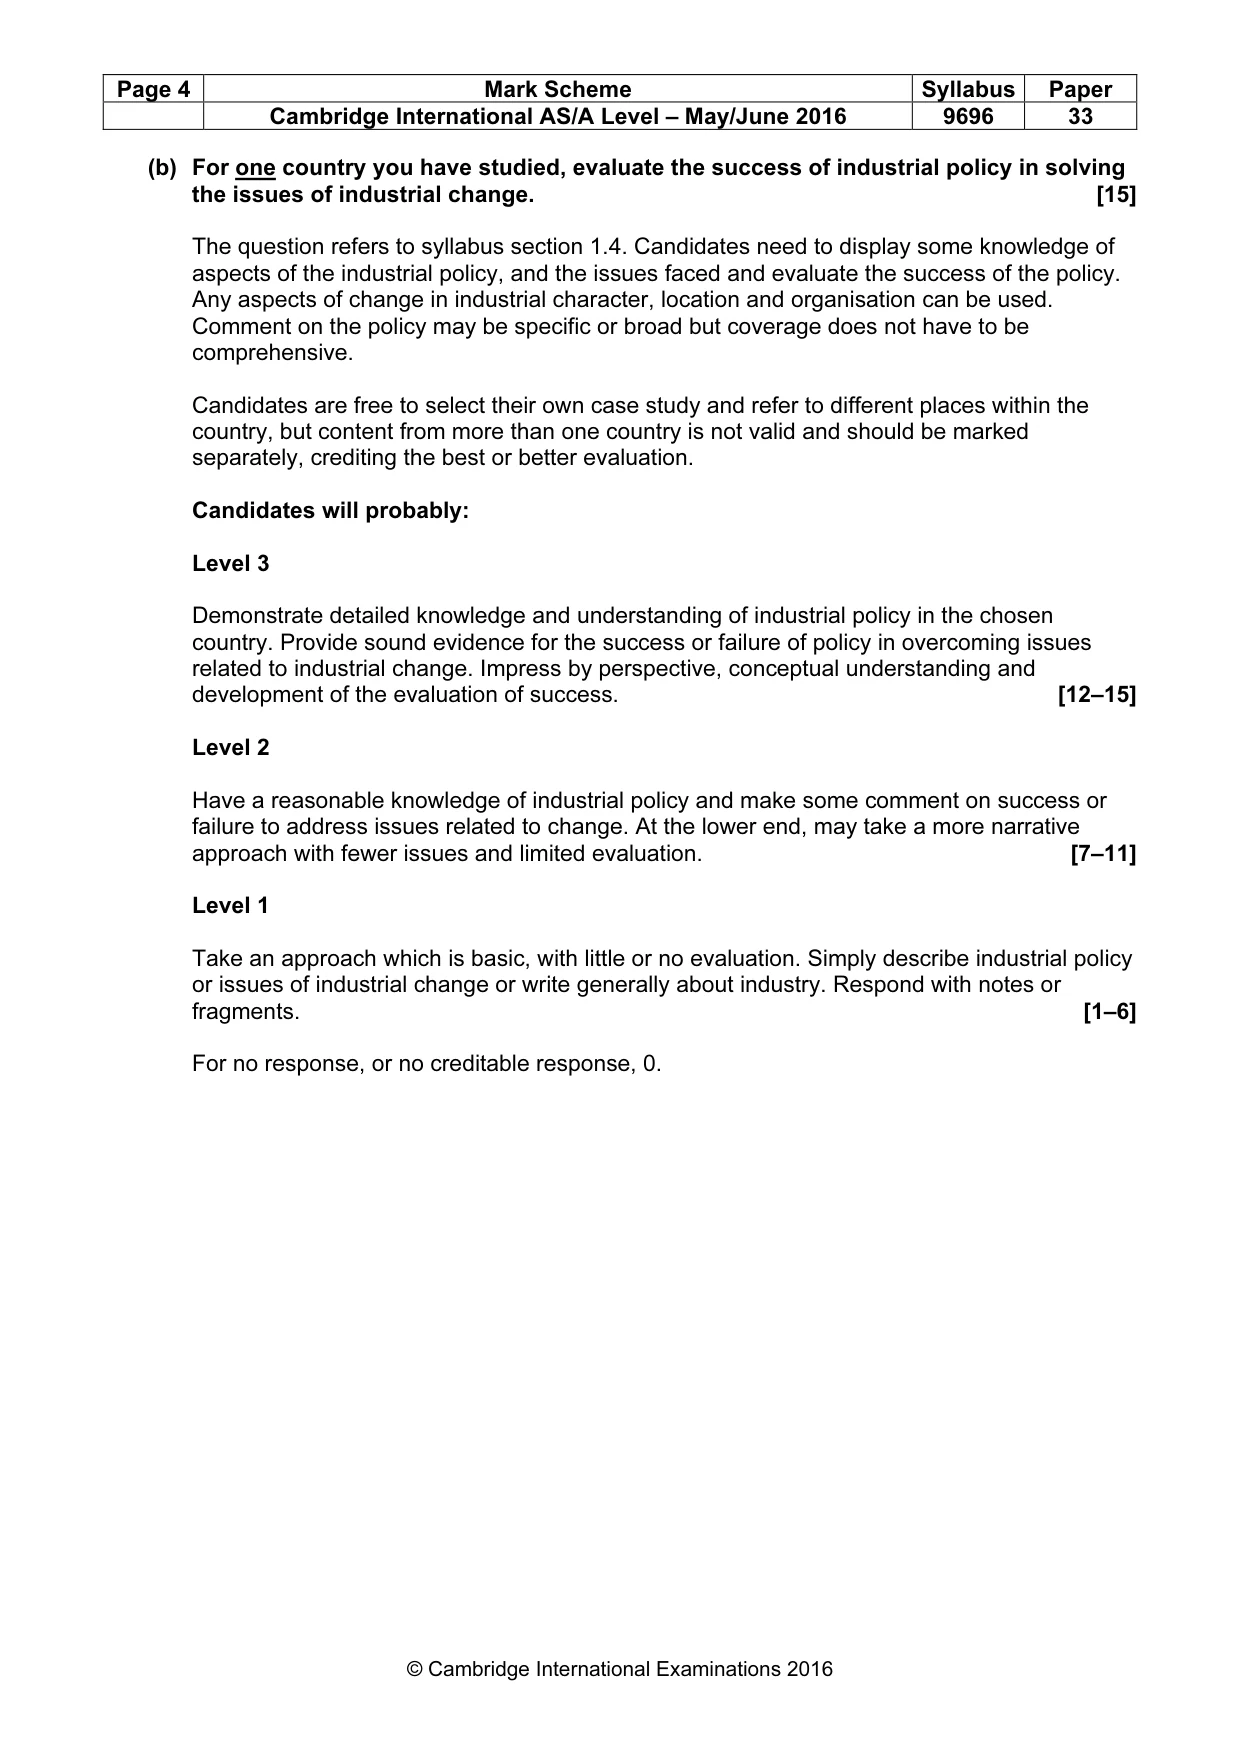
Page 4 Mark Scheme Syllabus Paper Cambridge International AS/A Level – May/June 2016 9696 33 © Cambridge International Examinations 2016 (b) For one country you have studied, evaluate the success of industrial policy in solving the issues of industrial change. [15] The question refers to syllabus section 1.4. Candidates need to display some knowledge of aspects of the industrial policy, and the issues faced and evaluate the success of the policy. Any aspects of change in industrial character, location and organisation can be used. Comment on the policy may be specific or broad but coverage does not have to be comprehensive. Candidates are free to select their own case study and refer to different places within the country, but content from more than one country is not valid and should be marked separately, crediting the best or better evaluation. Candidates will probably: Level 3 Demonstrate detailed knowledge and understanding of industrial policy in the chosen country. Provide sound evidence for the success or failure of policy in overcoming issues related to industrial change. Impress by perspective, conceptual understanding and development of the evaluation of success. [12–15] Level 2 Have a reasonable knowledge of industrial policy and make some comment on success or failure to address issues related to change. At the lower end, may take a more narrative approach with fewer issues and limited evaluation. [7–11] Level 1 Take an approach which is basic, with little or no evaluation. Simply describe industrial policy or issues of industrial change or write generally about industry. Respond with notes or fragments. [1–6] For no response, or no creditable response, 0.
Mark scheme, page 5
Page 5 Mark Scheme Syllabus Paper Cambridge International AS/A Level – May/June 2016 9696 33 © Cambridge International Examinations 2016 Environmental management Only one question may be answered from this topic. 3 (a) With reference to examples, explain how the level of development influences energy demand and energy supply. [10] The question refers to paragraph 2.1 in the syllabus. Energy demand is increasing worldwide. Demand could be seen as being linked to the desire for economic and social development in all economies (MEDCs, NICs and LEDCs). Expect a simple contrast between LEDCs and MEDCs with reference to NICs enhancing a response. A development approach, where energy demand and energy supply are considered on a continuum of development, is also valid. Energy demand increases with development. In 2016, large numbers of the world population have no access to electricity (est. 2 billion). For example, in rural India an estimated 400 million (57%) have access, with an ambitious target of 100% in the near future. Demand in MEDCs is driven by consumerism and the need to remain competitive. Energy saving, conservation and technological advancement influence demand and supply in MEDCs. Energy supply is ubiquitous and reliable in MEDCs and there are more varied sources of energy. Globally, most energy supply is from fossil fuels and will remain so in the near future. Mark on overall quality, not seeking comprehensive answers and bearing in mind the three bands of marks and levels of response: 1–4, 5–7 and 8–10. For a response without examples, or a response which considers only demand or supply, max 6.
Mark scheme, page 6
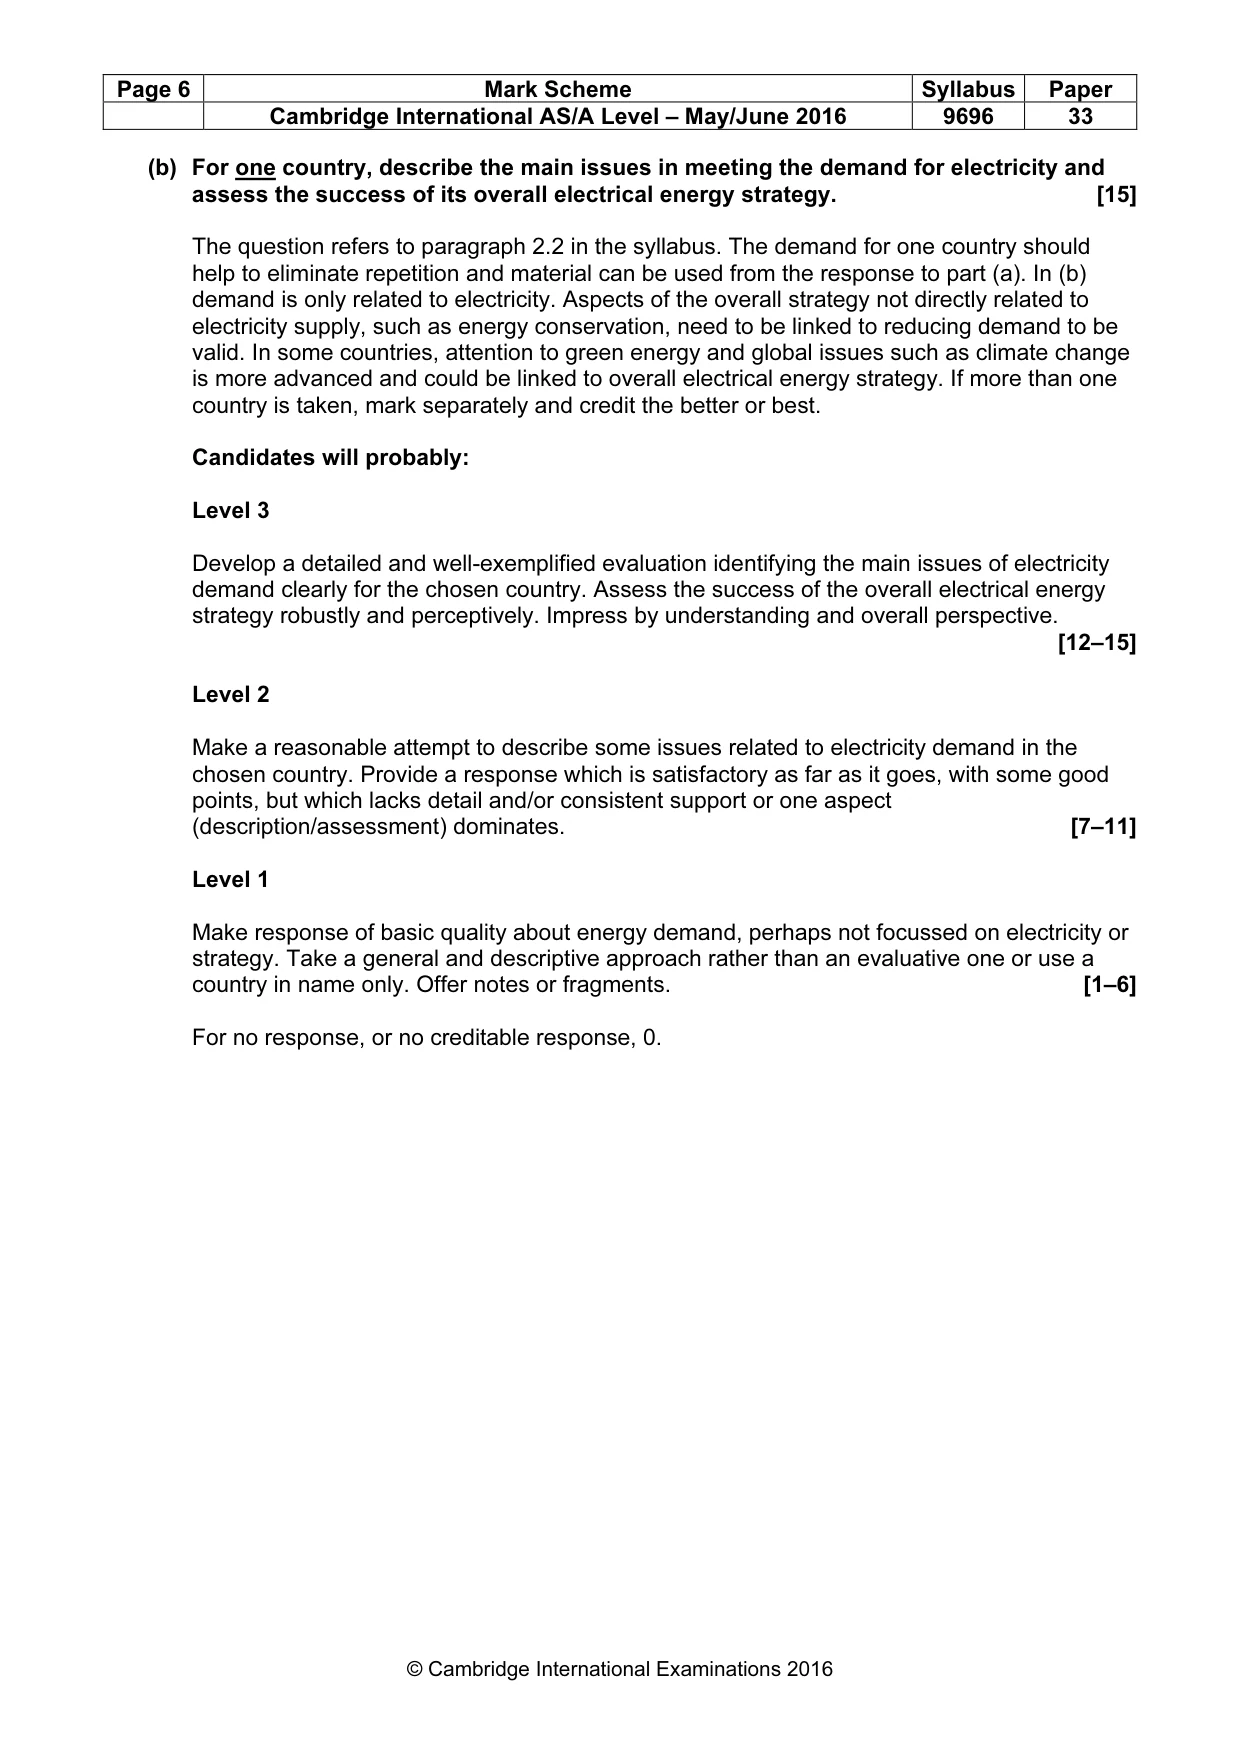
Page 6 Mark Scheme Syllabus Paper Cambridge International AS/A Level – May/June 2016 9696 33 © Cambridge International Examinations 2016 (b) For one country, describe the main issues in meeting the demand for electricity and assess the success of its overall electrical energy strategy. [15] The question refers to paragraph 2.2 in the syllabus. The demand for one country should help to eliminate repetition and material can be used from the response to part (a). In (b) demand is only related to electricity. Aspects of the overall strategy not directly related to electricity supply, such as energy conservation, need to be linked to reducing demand to be valid. In some countries, attention to green energy and global issues such as climate change is more advanced and could be linked to overall electrical energy strategy. If more than one country is taken, mark separately and credit the better or best. Candidates will probably: Level 3 Develop a detailed and well-exemplified evaluation identifying the main issues of electricity demand clearly for the chosen country. Assess the success of the overall electrical energy strategy robustly and perceptively. Impress by understanding and overall perspective. [12–15] Level 2 Make a reasonable attempt to describe some issues related to electricity demand in the chosen country. Provide a response which is satisfactory as far as it goes, with some good points, but which lacks detail and/or consistent support or one aspect (description/assessment) dominates. [7–11] Level 1 Make response of basic quality about energy demand, perhaps not focussed on electricity or strategy. Take a general and descriptive approach rather than an evaluative one or use a country in name only. Offer notes or fragments. [1–6] For no response, or no creditable response, 0.
Mark scheme, page 7
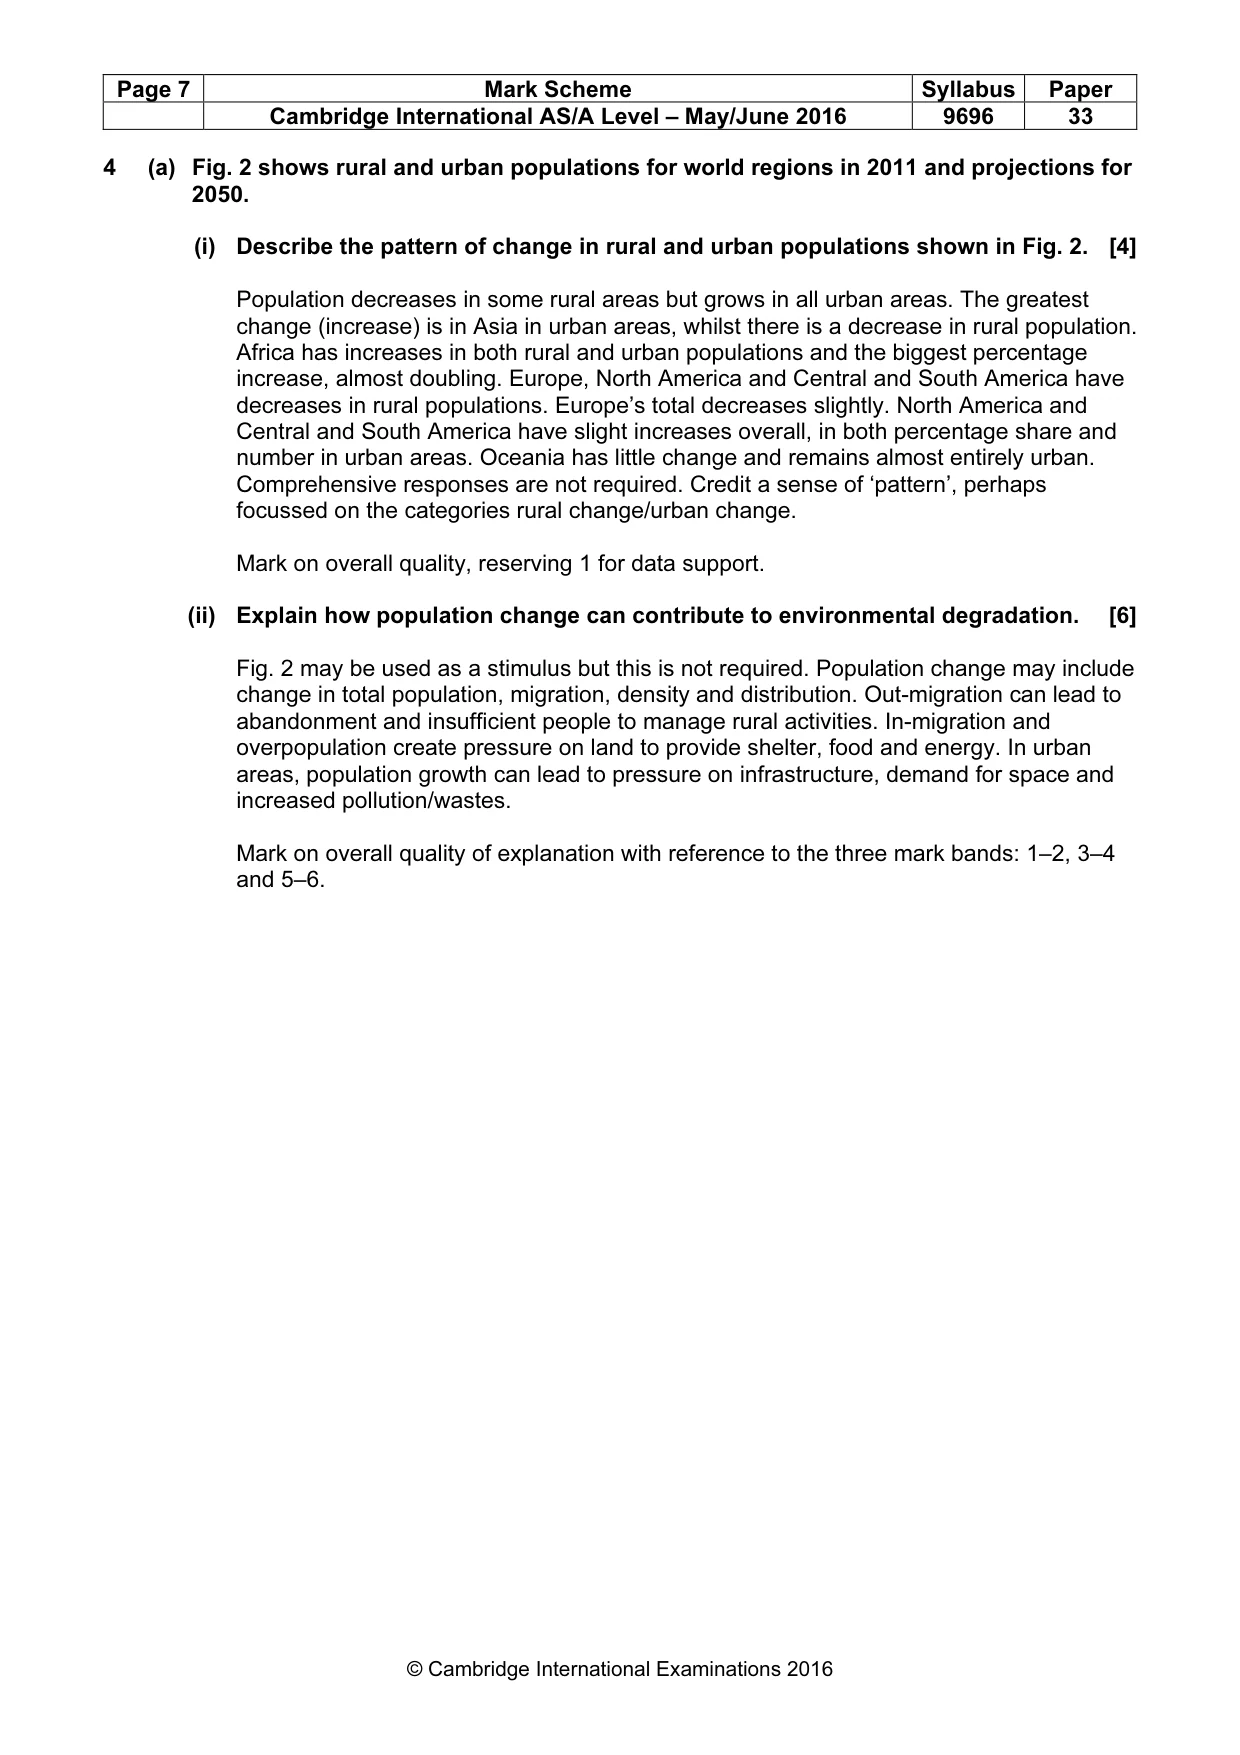
Page 7 Mark Scheme Syllabus Paper Cambridge International AS/A Level – May/June 2016 9696 33 © Cambridge International Examinations 2016 4 (a) Fig. 2 shows rural and urban populations for world regions in 2011 and projections for 2050. (i) Describe the pattern of change in rural and urban populations shown in Fig. 2. [4] Population decreases in some rural areas but grows in all urban areas. The greatest change (increase) is in Asia in urban areas, whilst there is a decrease in rural population. Africa has increases in both rural and urban populations and the biggest percentage increase, almost doubling. Europe, North America and Central and South America have decreases in rural populations. Europe’s total decreases slightly. North America and Central and South America have slight increases overall, in both percentage share and number in urban areas. Oceania has little change and remains almost entirely urban. Comprehensive responses are not required. Credit a sense of ‘pattern’, perhaps focussed on the categories rural change/urban change. Mark on overall quality, reserving 1 for data support. (ii) Explain how population change can contribute to environmental degradation. [6] Fig. 2 may be used as a stimulus but this is not required. Population change may include change in total population, migration, density and distribution. Out-migration can lead to abandonment and insufficient people to manage rural activities. In-migration and overpopulation create pressure on land to provide shelter, food and energy. In urban areas, population growth can lead to pressure on infrastructure, demand for space and increased pollution/wastes. Mark on overall quality of explanation with reference to the three mark bands: 1–2, 3–4 and 5–6.
Mark scheme, page 8
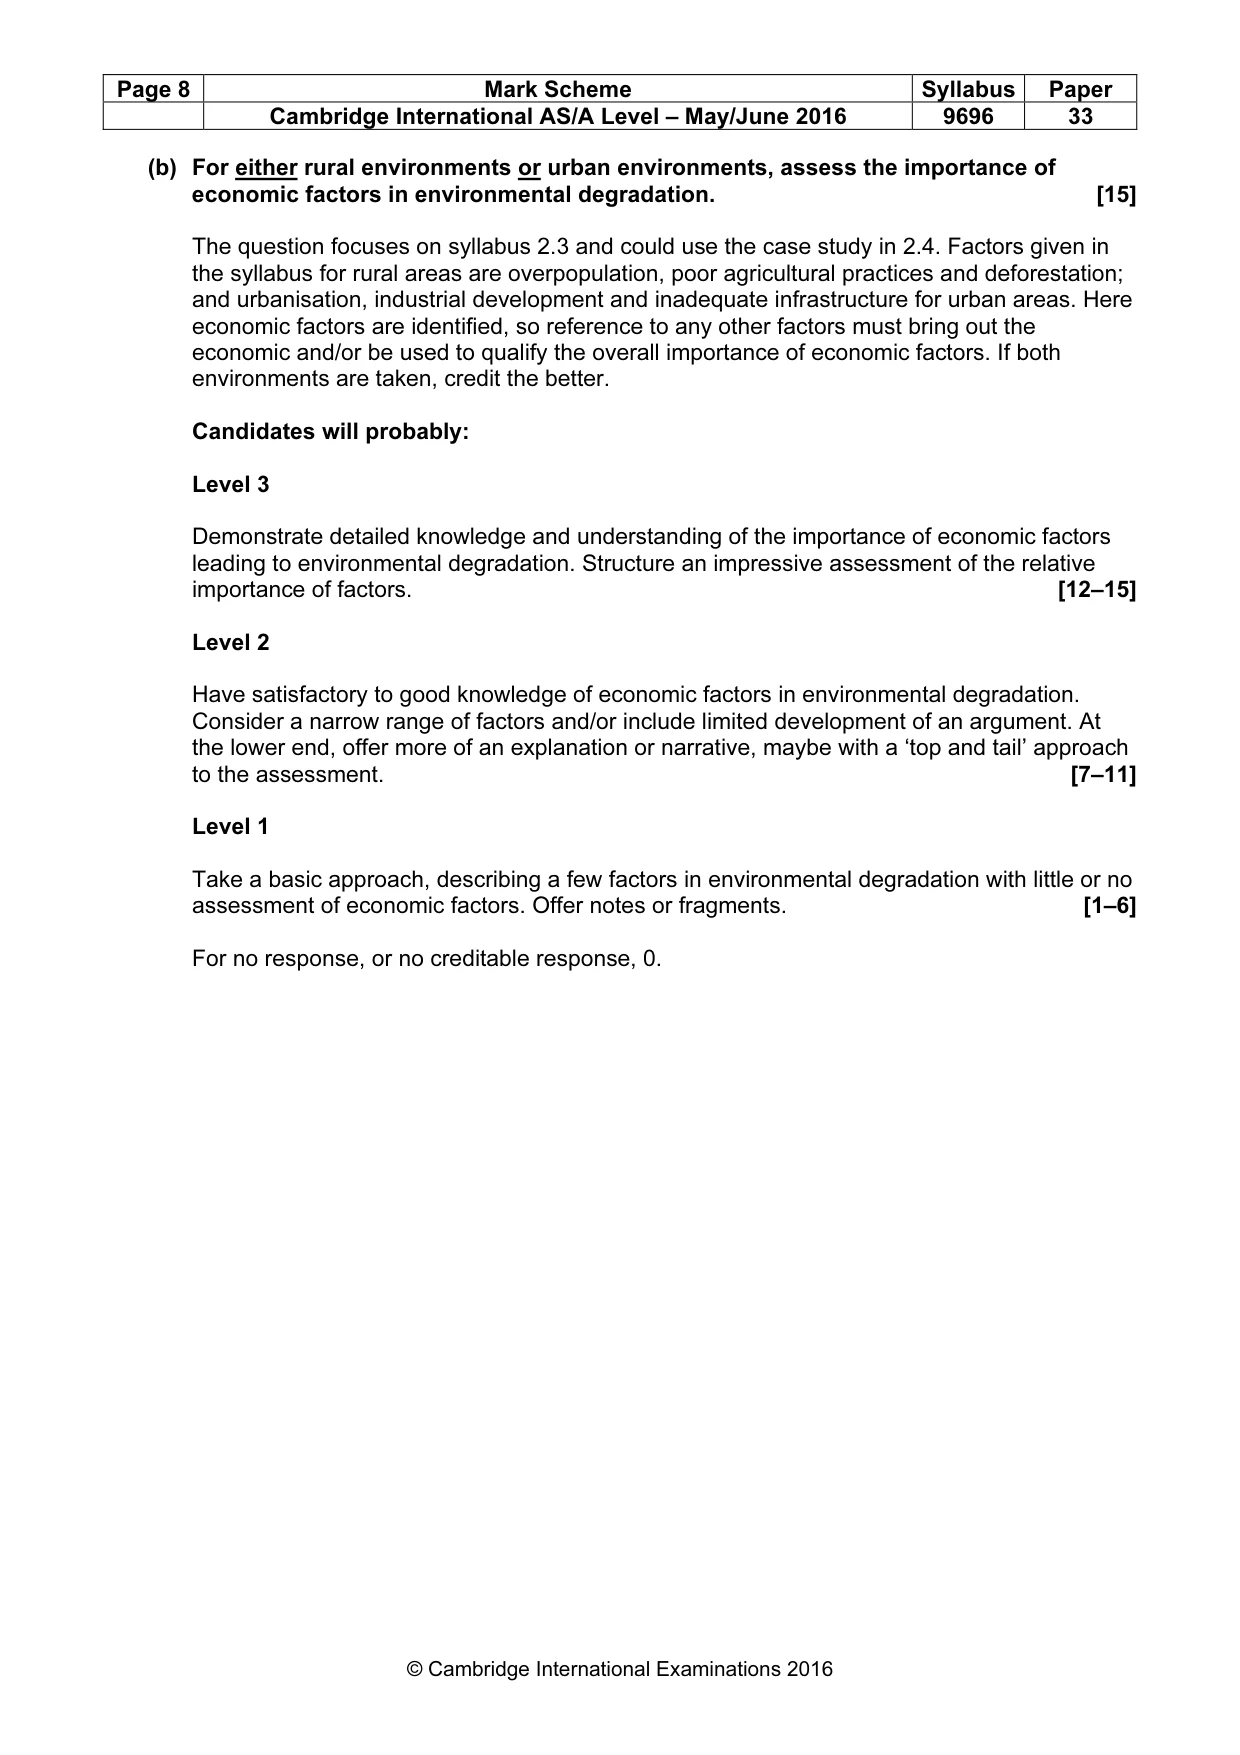
Page 8 Mark Scheme Syllabus Paper Cambridge International AS/A Level – May/June 2016 9696 33 © Cambridge International Examinations 2016 (b) For either rural environments or urban environments, assess the importance of economic factors in environmental degradation. [15] The question focuses on syllabus 2.3 and could use the case study in 2.4. Factors given in the syllabus for rural areas are overpopulation, poor agricultural practices and deforestation; and urbanisation, industrial development and inadequate infrastructure for urban areas. Here economic factors are identified, so reference to any other factors must bring out the economic and/or be used to qualify the overall importance of economic factors. If both environments are taken, credit the better. Candidates will probably: Level 3 Demonstrate detailed knowledge and understanding of the importance of economic factors leading to environmental degradation. Structure an impressive assessment of the relative importance of factors. [12–15] Level 2 Have satisfactory to good knowledge of economic factors in environmental degradation. Consider a narrow range of factors and/or include limited development of an argument. At the lower end, offer more of an explanation or narrative, maybe with a ‘top and tail’ approach to the assessment. [7–11] Level 1 Take a basic approach, describing a few factors in environmental degradation with little or no assessment of economic factors. Offer notes or fragments. [1–6] For no response, or no creditable response, 0.
Mark scheme, page 9
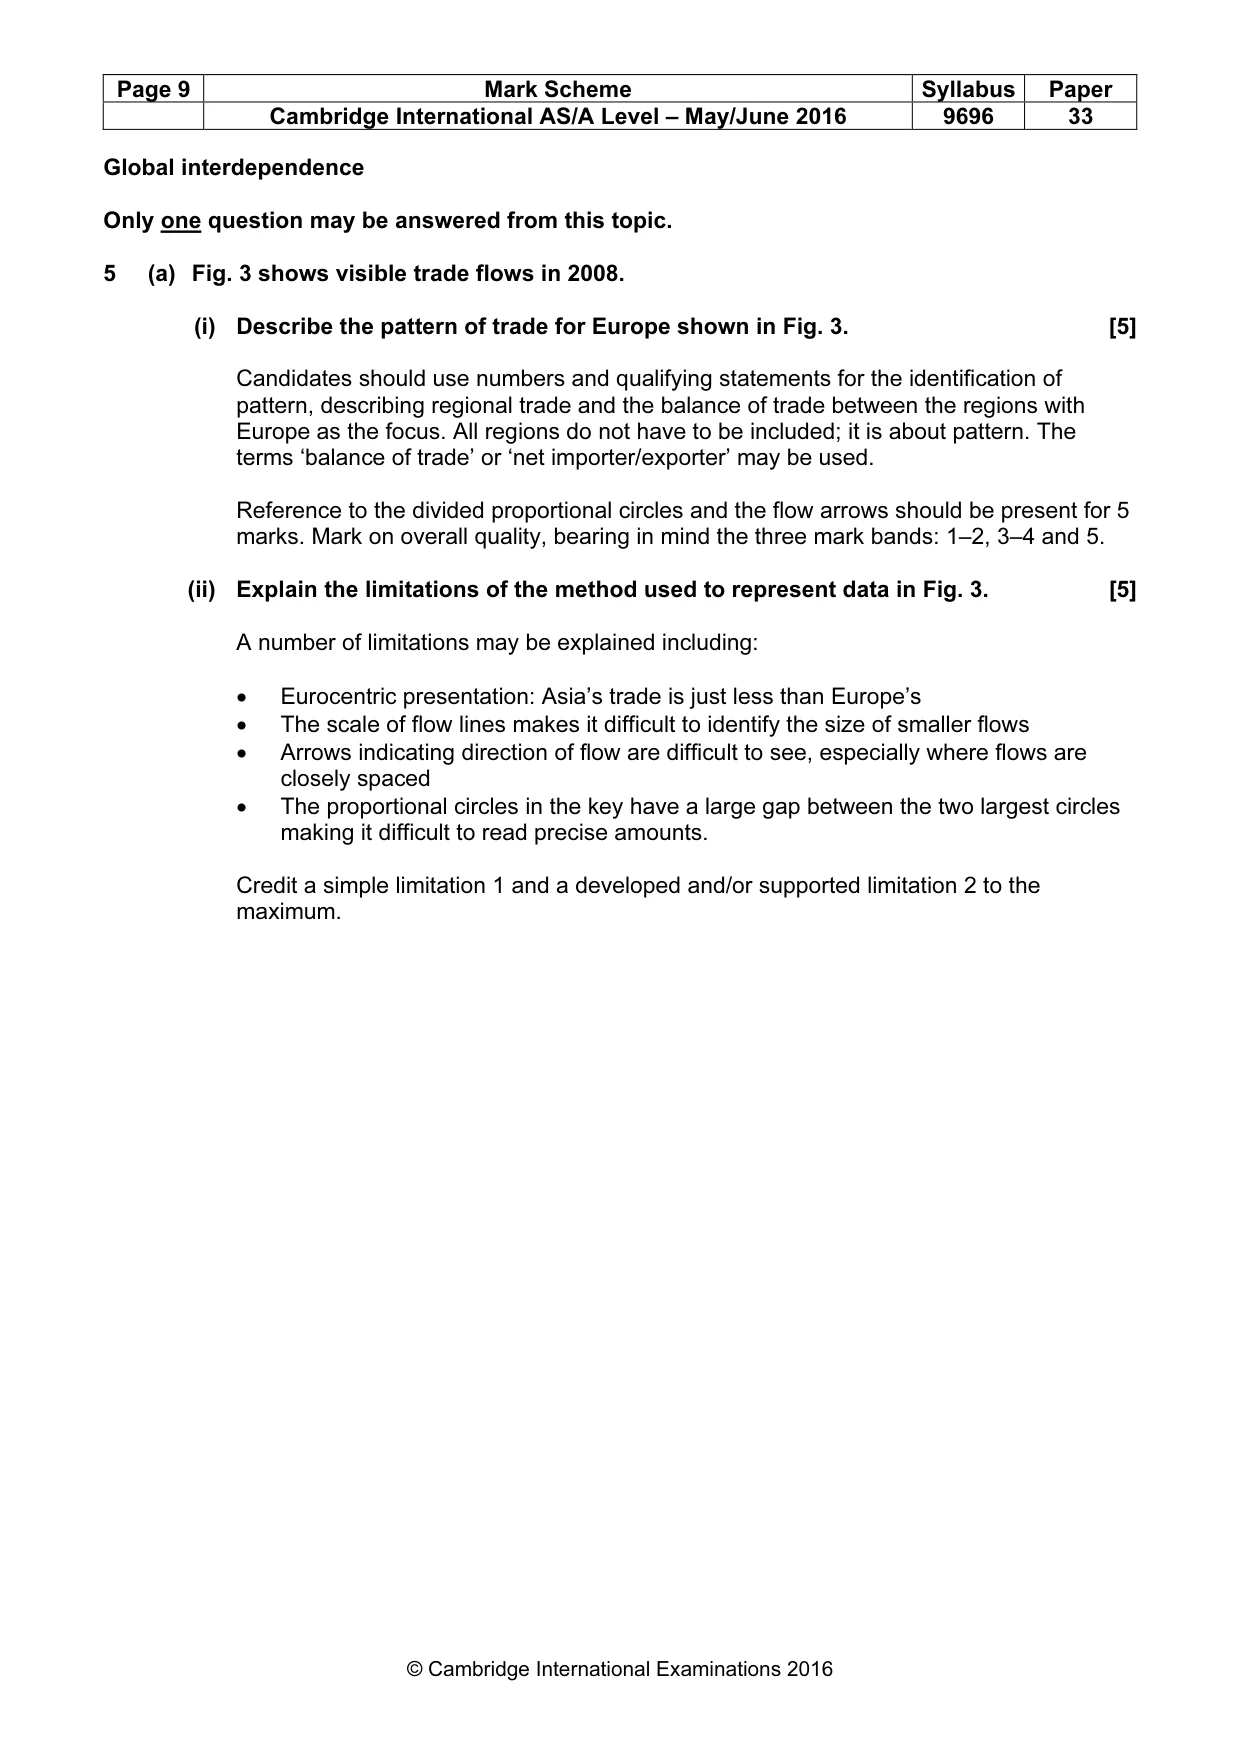
Page 9 Mark Scheme Syllabus Paper Cambridge International AS/A Level – May/June 2016 9696 33 © Cambridge International Examinations 2016 Global interdependence Only one question may be answered from this topic. 5 (a) Fig. 3 shows visible trade flows in 2008. (i) Describe the pattern of trade for Europe shown in Fig. 3. [5] Candidates should use numbers and qualifying statements for the identification of pattern, describing regional trade and the balance of trade between the regions with Europe as the focus. All regions do not have to be included; it is about pattern. The terms ‘balance of trade’ or ‘net importer/exporter’ may be used. Reference to the divided proportional circles and the flow arrows should be present for 5 marks. Mark on overall quality, bearing in mind the three mark bands: 1–2, 3–4 and 5. (ii) Explain the limitations of the method used to represent data in Fig. 3. [5] A number of limitations may be explained including: • Eurocentric presentation: Asia’s trade is just less than Europe’s • The scale of flow lines makes it difficult to identify the size of smaller flows • Arrows indicating direction of flow are difficult to see, especially where flows are closely spaced • The proportional circles in the key have a large gap between the two largest circles making it difficult to read precise amounts. Credit a simple limitation 1 and a developed and/or supported limitation 2 to the maximum.
Mark scheme, page 10
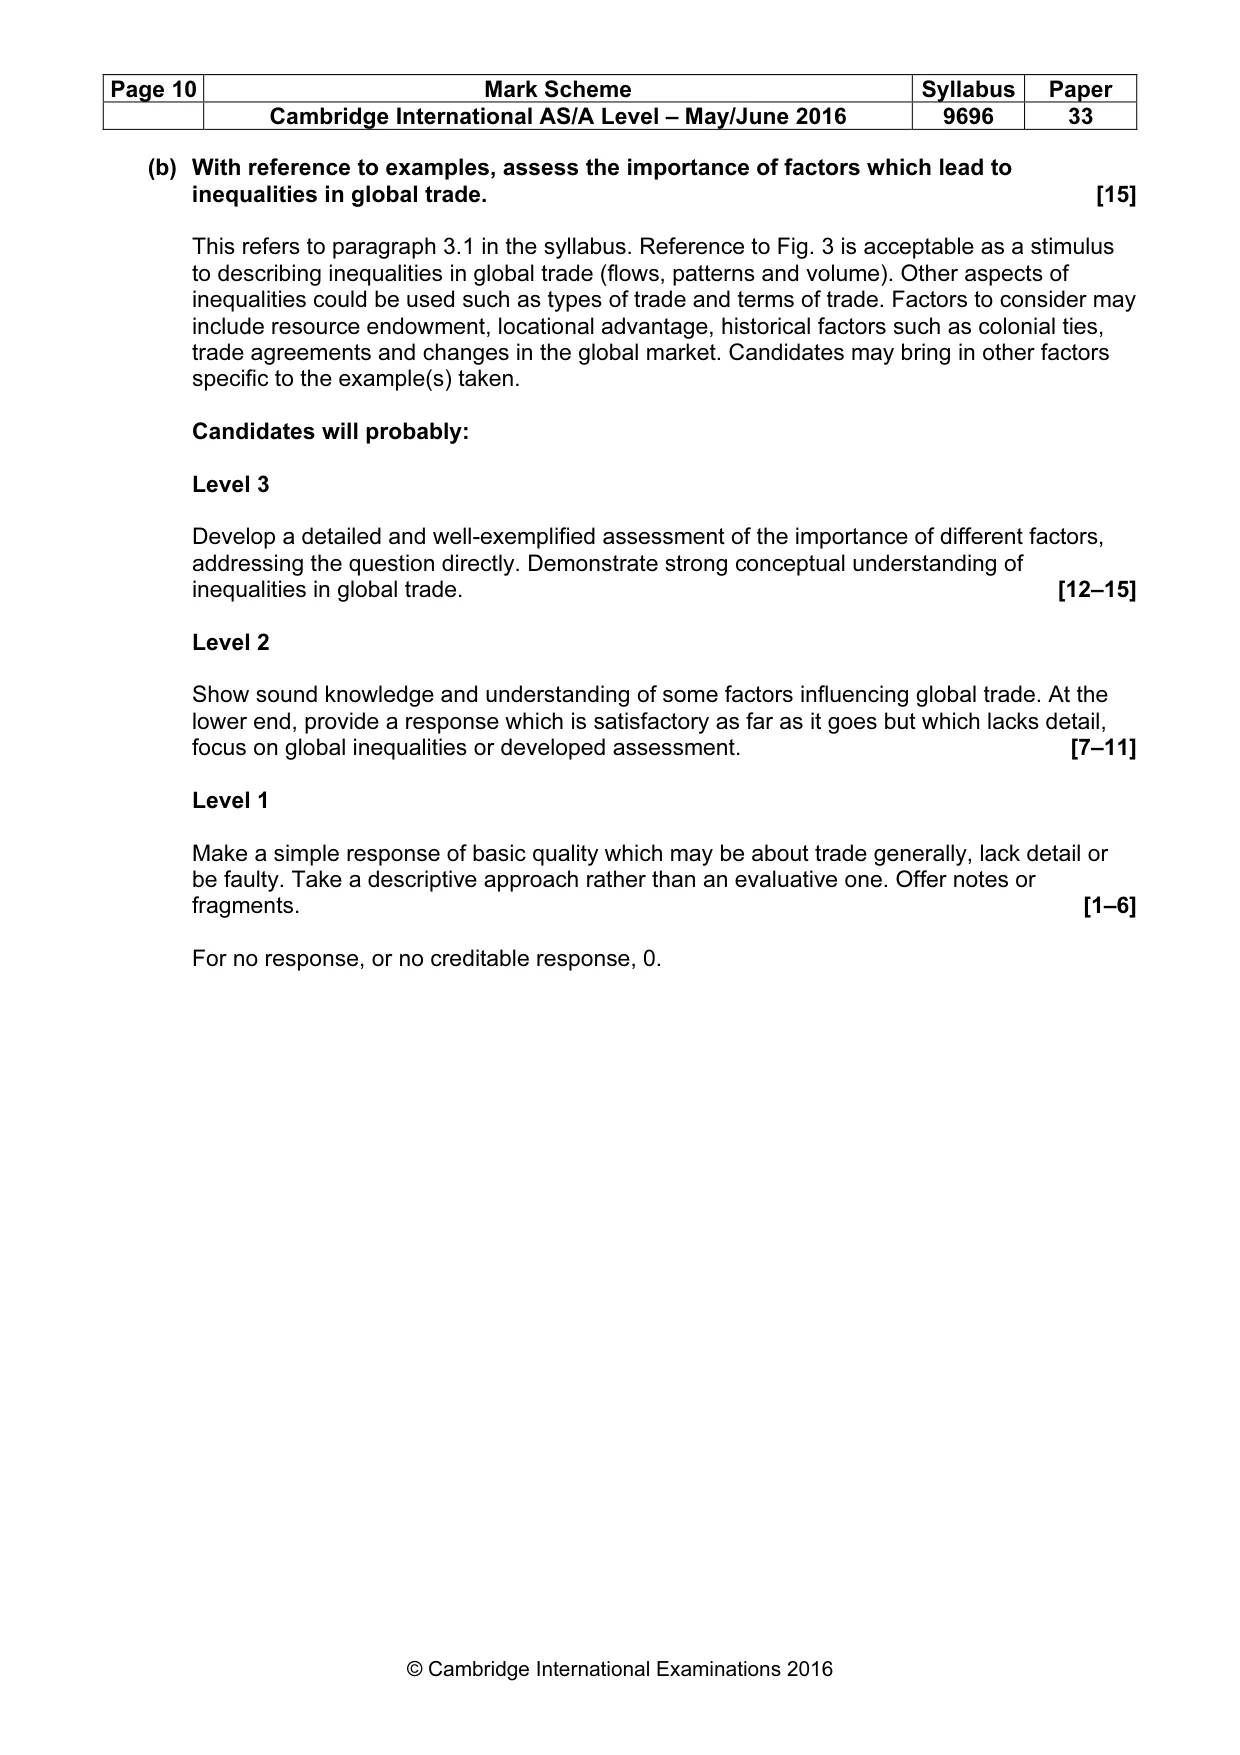
Page 10 Mark Scheme Syllabus Paper Cambridge International AS/A Level – May/June 2016 9696 33 © Cambridge International Examinations 2016 (b) With reference to examples, assess the importance of factors which lead to inequalities in global trade. [15] This refers to paragraph 3.1 in the syllabus. Reference to Fig. 3 is acceptable as a stimulus to describing inequalities in global trade (flows, patterns and volume). Other aspects of inequalities could be used such as types of trade and terms of trade. Factors to consider may include resource endowment, locational advantage, historical factors such as colonial ties, trade agreements and changes in the global market. Candidates may bring in other factors specific to the example(s) taken. Candidates will probably: Level 3 Develop a detailed and well-exemplified assessment of the importance of different factors, addressing the question directly. Demonstrate strong conceptual understanding of inequalities in global trade. [12–15] Level 2 Show sound knowledge and understanding of some factors influencing global trade. At the lower end, provide a response which is satisfactory as far as it goes but which lacks detail, focus on global inequalities or developed assessment. [7–11] Level 1 Make a simple response of basic quality which may be about trade generally, lack detail or be faulty. Take a descriptive approach rather than an evaluative one. Offer notes or fragments. [1–6] For no response, or no creditable response, 0.
Mark scheme, page 11
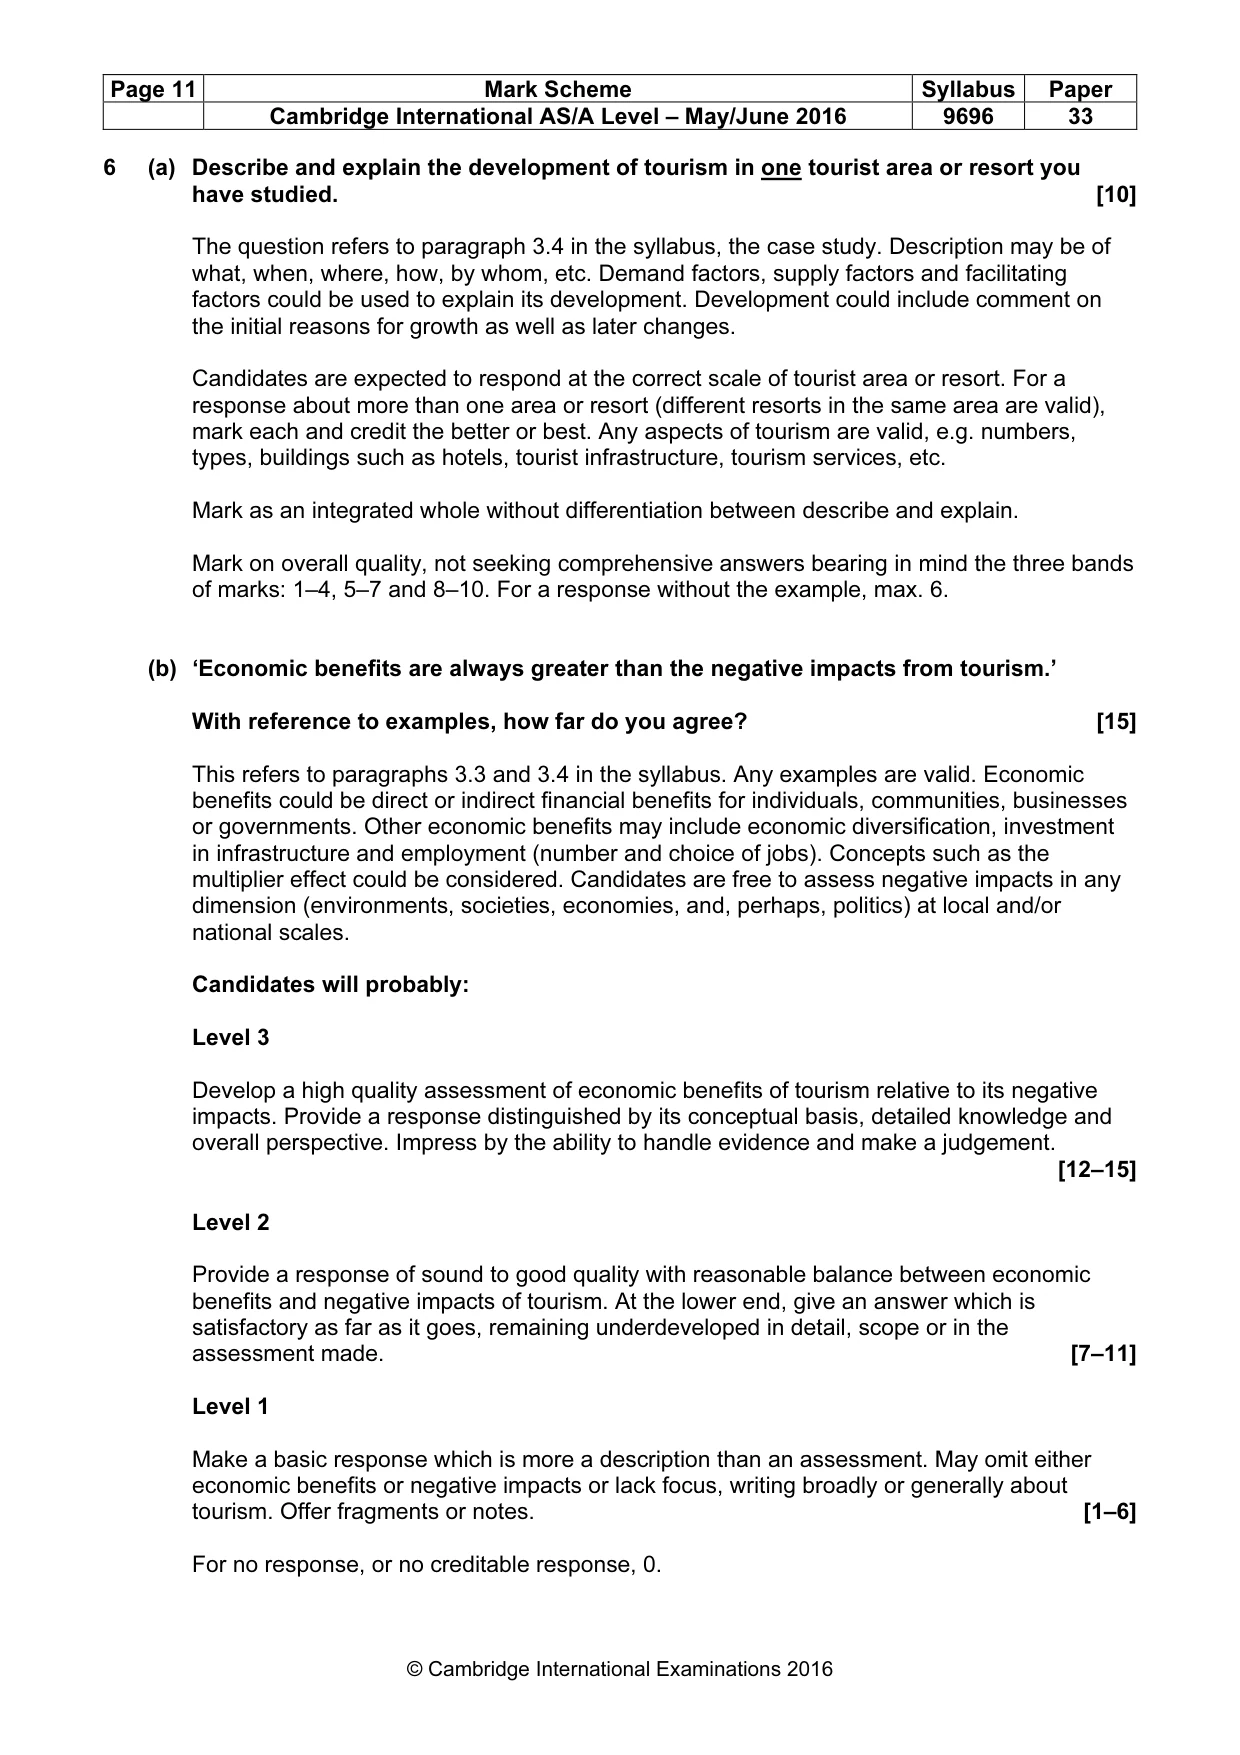
Page 11 Mark Scheme Syllabus Paper Cambridge International AS/A Level – May/June 2016 9696 33 © Cambridge International Examinations 2016 6 (a) Describe and explain the development of tourism in one tourist area or resort you have studied. [10] The question refers to paragraph 3.4 in the syllabus, the case study. Description may be of what, when, where, how, by whom, etc. Demand factors, supply factors and facilitating factors could be used to explain its development. Development could include comment on the initial reasons for growth as well as later changes. Candidates are expected to respond at the correct scale of tourist area or resort. For a response about more than one area or resort (different resorts in the same area are valid), mark each and credit the better or best. Any aspects of tourism are valid, e.g. numbers, types, buildings such as hotels, tourist infrastructure, tourism services, etc. Mark as an integrated whole without differentiation between describe and explain. Mark on overall quality, not seeking comprehensive answers bearing in mind the three bands of marks: 1–4, 5–7 and 8–10. For a response without the example, max. 6. (b) ‘Economic benefits are always greater than the negative impacts from tourism.’ With reference to examples, how far do you agree? [15] This refers to paragraphs 3.3 and 3.4 in the syllabus. Any examples are valid. Economic benefits could be direct or indirect financial benefits for individuals, communities, businesses or governments. Other economic benefits may include economic diversification, investment in infrastructure and employment (number and choice of jobs). Concepts such as the multiplier effect could be considered. Candidates are free to assess negative impacts in any dimension (environments, societies, economies, and, perhaps, politics) at local and/or national scales. Candidates will probably: Level 3 Develop a high quality assessment of economic benefits of tourism relative to its negative impacts. Provide a response distinguished by its conceptual basis, detailed knowledge and overall perspective. Impress by the ability to handle evidence and make a judgement. [12–15] Level 2 Provide a response of sound to good quality with reasonable balance between economic benefits and negative impacts of tourism. At the lower end, give an answer which is satisfactory as far as it goes, remaining underdeveloped in detail, scope or in the assessment made. [7–11] Level 1 Make a basic response which is more a description than an assessment. May omit either economic benefits or negative impacts or lack focus, writing broadly or generally about tourism. Offer fragments or notes. [1–6] For no response, or no creditable response, 0.
Mark scheme, page 12
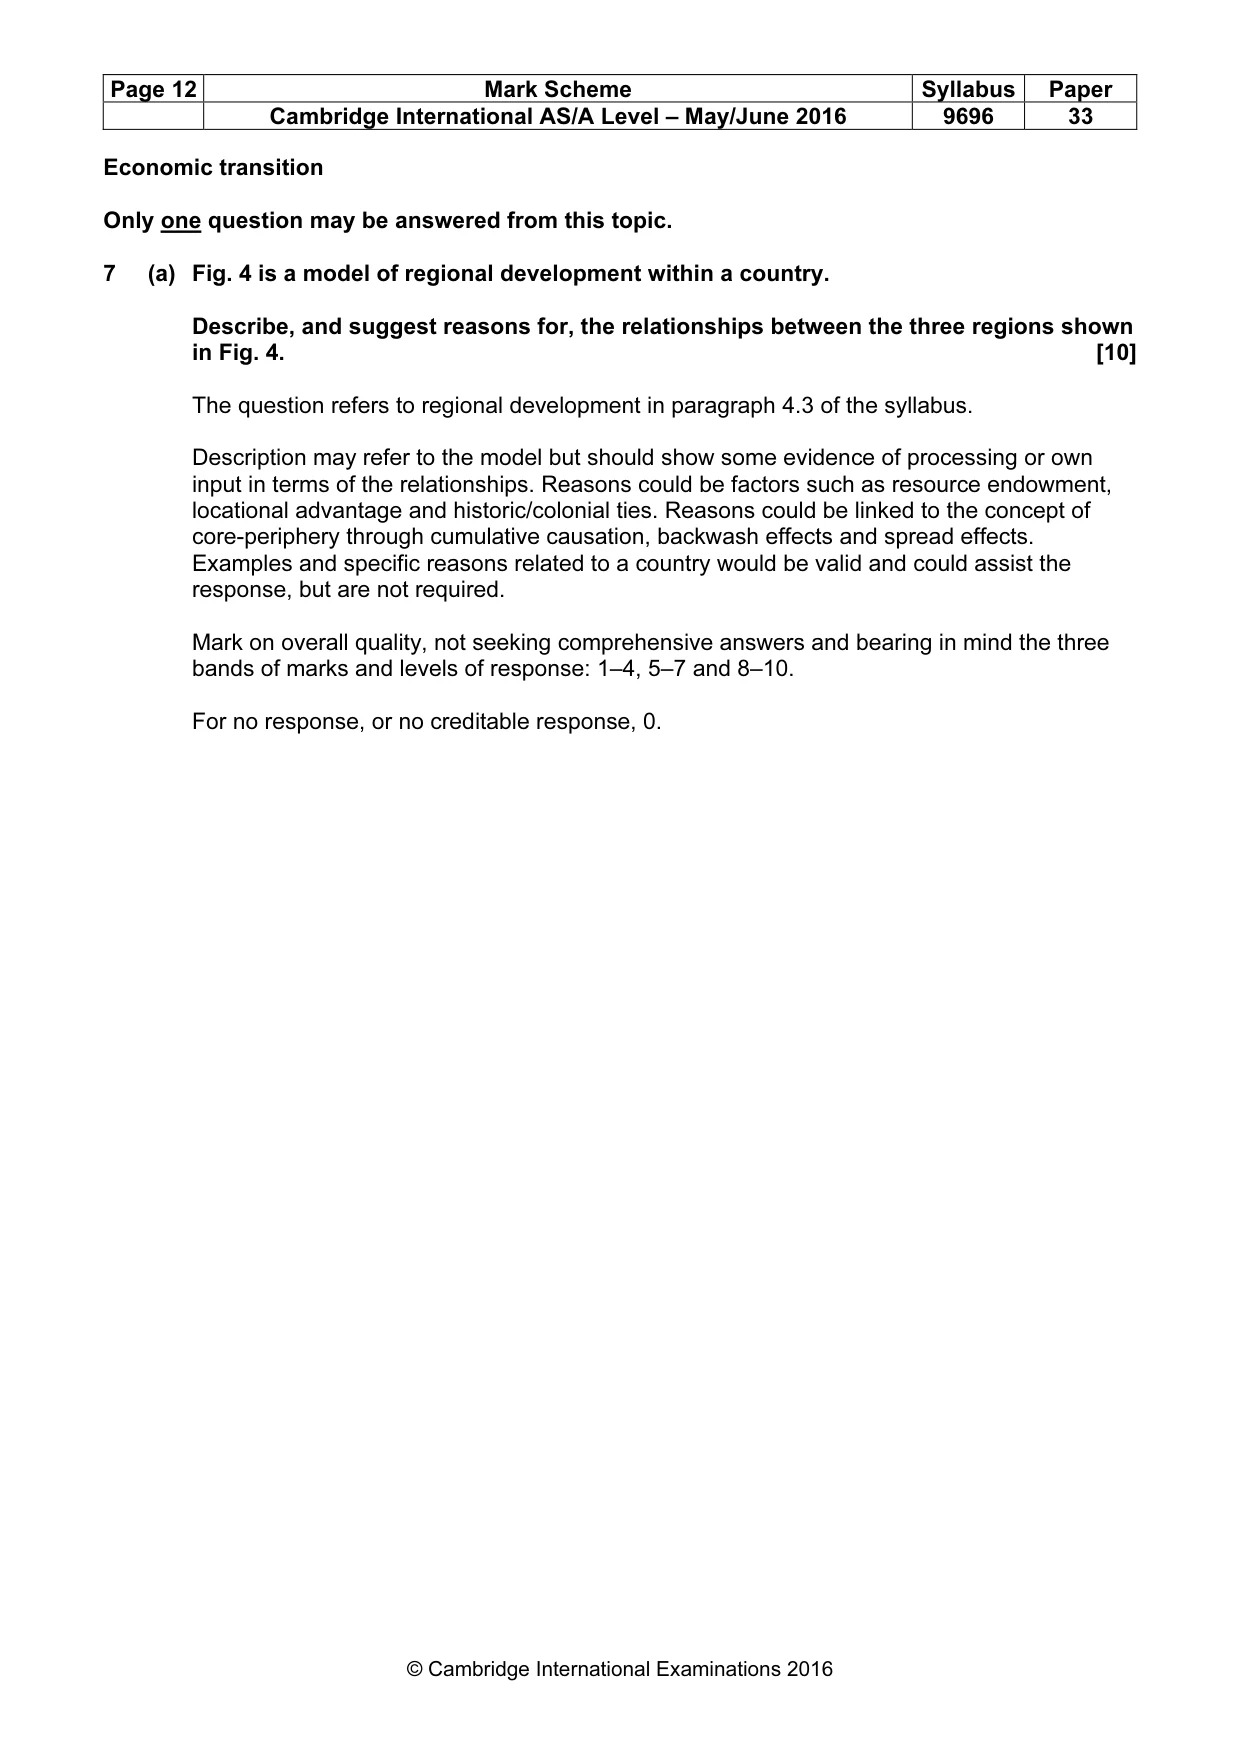
Page 12 Mark Scheme Syllabus Paper Cambridge International AS/A Level – May/June 2016 9696 33 © Cambridge International Examinations 2016 Economic transition Only one question may be answered from this topic. 7 (a) Fig. 4 is a model of regional development within a country. Describe, and suggest reasons for, the relationships between the three regions shown in Fig. 4. [10] The question refers to regional development in paragraph 4.3 of the syllabus. Description may refer to the model but should show some evidence of processing or own input in terms of the relationships. Reasons could be factors such as resource endowment, locational advantage and historic/colonial ties. Reasons could be linked to the concept of core-periphery through cumulative causation, backwash effects and spread effects. Examples and specific reasons related to a country would be valid and could assist the response, but are not required. Mark on overall quality, not seeking comprehensive answers and bearing in mind the three bands of marks and levels of response: 1–4, 5–7 and 8–10. For no response, or no creditable response, 0.
Mark scheme, page 13
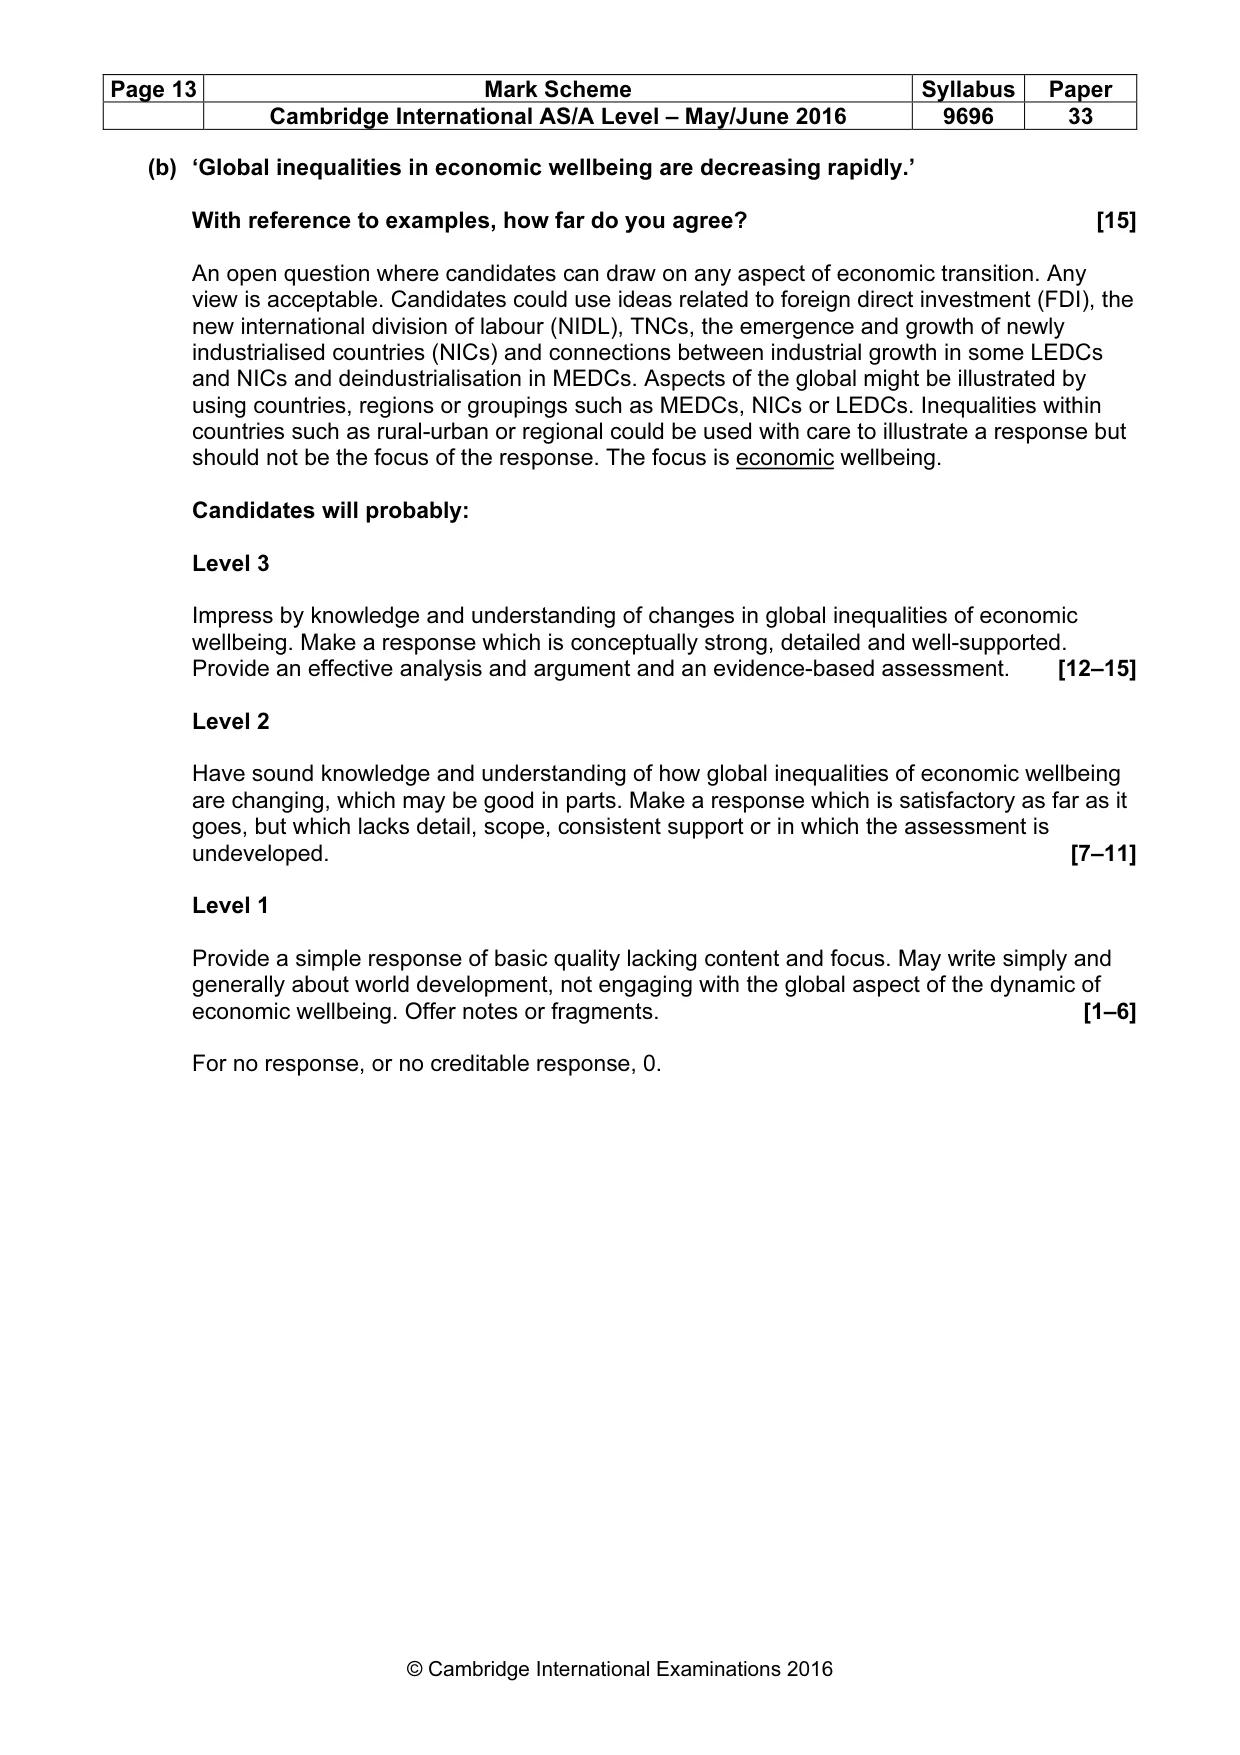
Page 13 Mark Scheme Syllabus Paper Cambridge International AS/A Level – May/June 2016 9696 33 © Cambridge International Examinations 2016 (b) ‘Global inequalities in economic wellbeing are decreasing rapidly.’ With reference to examples, how far do you agree? [15] An open question where candidates can draw on any aspect of economic transition. Any view is acceptable. Candidates could use ideas related to foreign direct investment (FDI), the new international division of labour (NIDL), TNCs, the emergence and growth of newly industrialised countries (NICs) and connections between industrial growth in some LEDCs and NICs and deindustrialisation in MEDCs. Aspects of the global might be illustrated by using countries, regions or groupings such as MEDCs, NICs or LEDCs. Inequalities within countries such as rural-urban or regional could be used with care to illustrate a response but should not be the focus of the response. The focus is economic wellbeing. Candidates will probably: Level 3 Impress by knowledge and understanding of changes in global inequalities of economic wellbeing. Make a response which is conceptually strong, detailed and well-supported. Provide an effective analysis and argument and an evidence-based assessment. [12–15] Level 2 Have sound knowledge and understanding of how global inequalities of economic wellbeing are changing, which may be good in parts. Make a response which is satisfactory as far as it goes, but which lacks detail, scope, consistent support or in which the assessment is undeveloped. [7–11] Level 1 Provide a simple response of basic quality lacking content and focus. May write simply and generally about world development, not engaging with the global aspect of the dynamic of economic wellbeing. Offer notes or fragments. [1–6] For no response, or no creditable response, 0.
Mark scheme, page 14
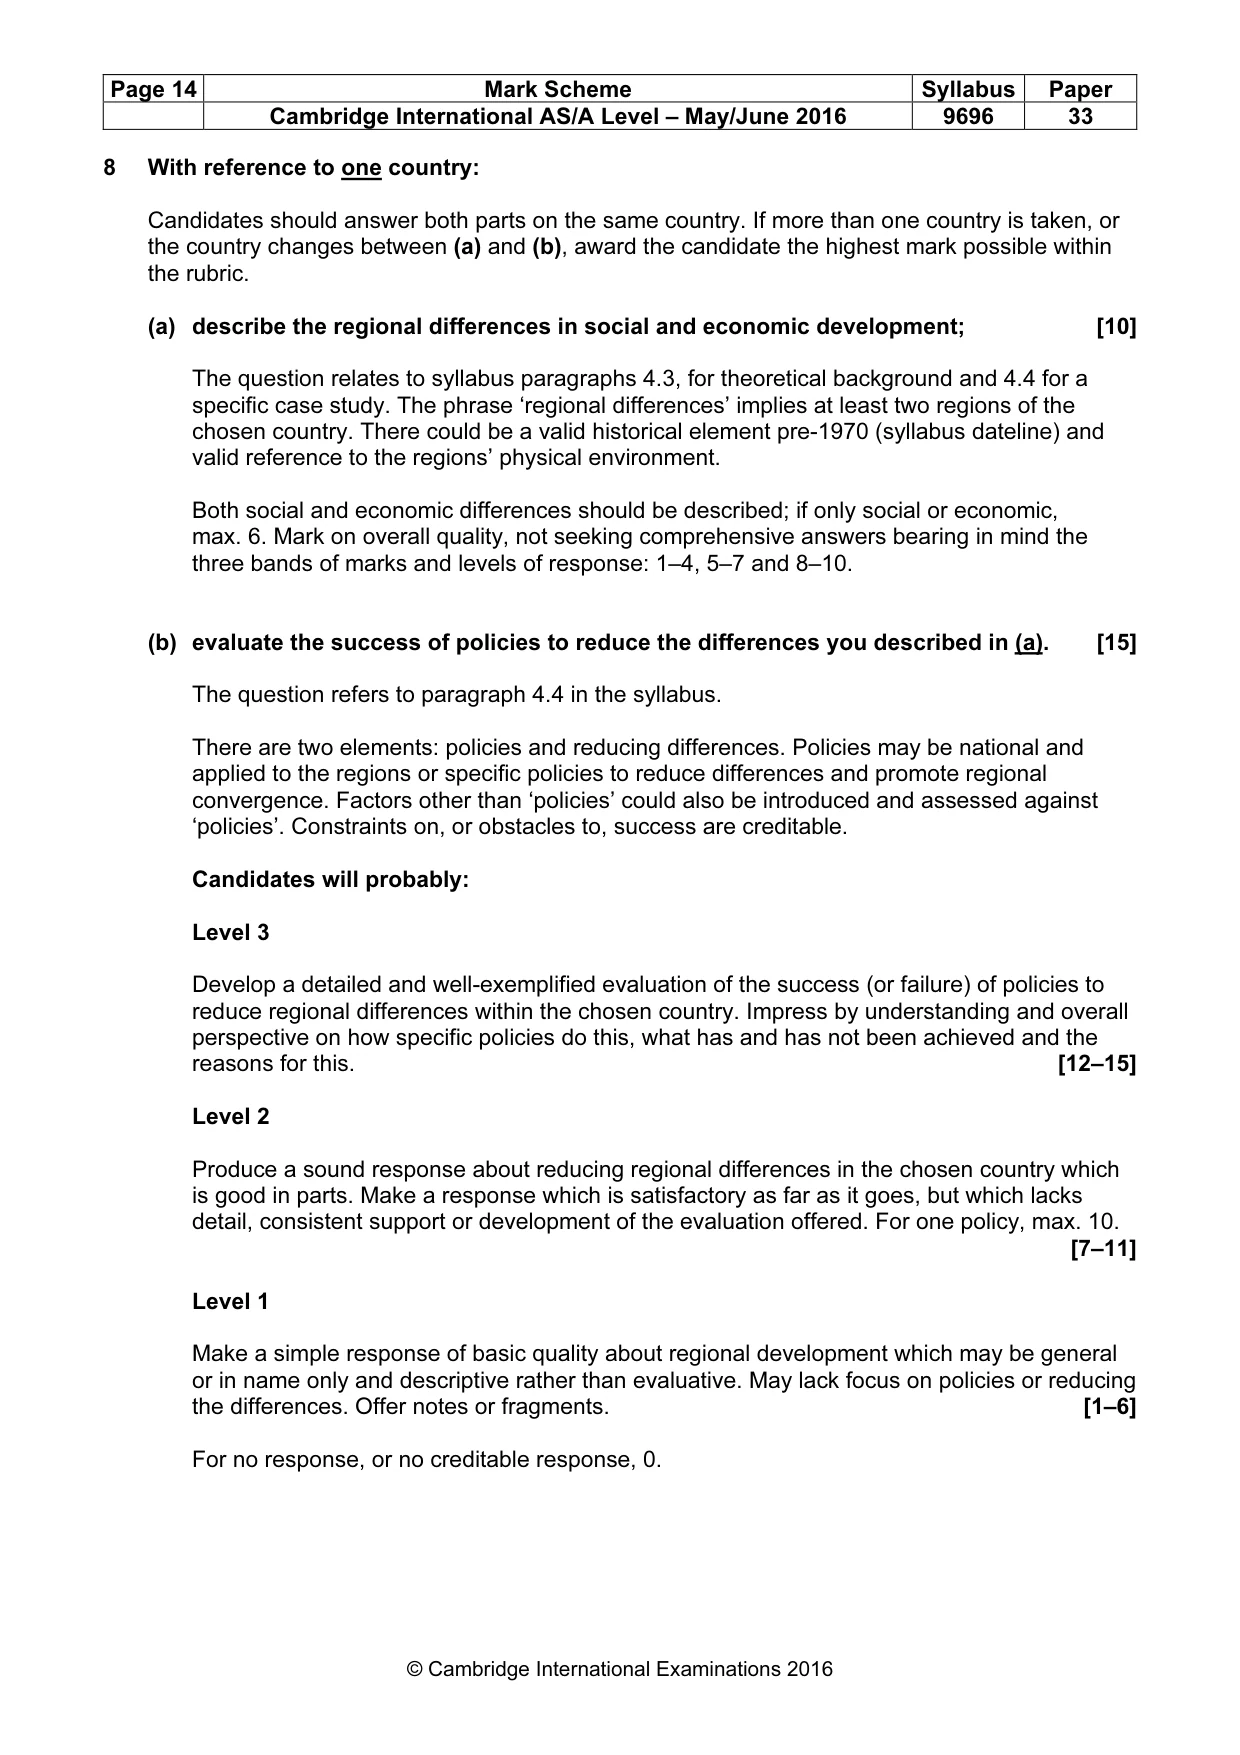
Page 14 Mark Scheme Syllabus Paper Cambridge International AS/A Level – May/June 2016 9696 33 © Cambridge International Examinations 2016 8 With reference to one country: Candidates should answer both parts on the same country. If more than one country is taken, or the country changes between (a) and (b), award the candidate the highest mark possible within the rubric. (a) describe the regional differences in social and economic development; [10] The question relates to syllabus paragraphs 4.3, for theoretical background and 4.4 for a specific case study. The phrase ‘regional differences’ implies at least two regions of the chosen country. There could be a valid historical element pre-1970 (syllabus dateline) and valid reference to the regions’ physical environment. Both social and economic differences should be described; if only social or economic, max. 6. Mark on overall quality, not seeking comprehensive answers bearing in mind the three bands of marks and levels of response: 1–4, 5–7 and 8–10. (b) evaluate the success of policies to reduce the differences you described in (a). [15] The question refers to paragraph 4.4 in the syllabus. There are two elements: policies and reducing differences. Policies may be national and applied to the regions or specific policies to reduce differences and promote regional convergence. Factors other than ‘policies’ could also be introduced and assessed against ‘policies’. Constraints on, or obstacles to, success are creditable. Candidates will probably: Level 3 Develop a detailed and well-exemplified evaluation of the success (or failure) of policies to reduce regional differences within the chosen country. Impress by understanding and overall perspective on how specific policies do this, what has and has not been achieved and the reasons for this. [12–15] Level 2 Produce a sound response about reducing regional differences in the chosen country which is good in parts. Make a response which is satisfactory as far as it goes, but which lacks detail, consistent support or development of the evaluation offered. For one policy, max. 10. [7–11] Level 1 Make a simple response of basic quality about regional development which may be general or in name only and descriptive rather than evaluative. May lack focus on policies or reducing the differences. Offer notes or fragments. [1–6] For no response, or no creditable response, 0.
What you needed in this session
Cambridge’s own grade thresholds for 2016 May/June, Paper 3 · Variant 3. A higher threshold means an easier paper — the bar moves with how the cohort did.