Cambridge A Level Geography 9696 — 2014 May/June Paper 1 · Variant 1
9696/11/M/J/14 · 100 marks · ≈113 min
The question paper and its mark scheme, free to read here and free to download. This is Cambridge’s own paper, exactly as it was sat.
Question paper8 pages




Mark scheme13 pages
Answers below. Sit the paper first if you are practising.
Paper as text
Question paper, page 1
This document consists of 5 printed pages, 3 blank pages and 2 Inserts. DC (LK) 81397/4 © UCLES 2014 [Turn over Cambridge International Examinations Cambridge International Advanced Subsidiary and Advanced Level * 9 3 0 3 5 3 1 3 5 2 * GEOGRAPHY 9696/11 Paper 1 Core Geography May/June 2014 3 hours No Additional Materials are required. READ THESE INSTRUCTIONS FIRST An answer booklet is provided inside this question paper. You should follow the instructions on the front cover of the answer booklet. If you need additional answer paper ask the invigilator for a continuation booklet. Section A Answer five questions. Section B Answer one question. Section C Answer one question. Sketch maps and diagrams should be drawn whenever they serve to illustrate an answer. All the Figures referred to in the questions are contained in the Insert. The number of marks is given in brackets [ ] at the end of each question or part question.
Question paper, page 2
2 9696/11/M/J/14 © UCLES 2014 Section A Answer five questions from this section. All questions carry 10 marks. Hydrology and fluvial geomorphology 1 Fig.1 shows some features of a river valley. (a) Identify the features marked: (i) A, [1] (ii) B, [1] (iii) C, [1] (iv) D. [1] (b) Describe three features you identified in (a) and explain how each was formed. [6] Atmosphere and weather 2 Fig. 2 shows the summer and winter temperatures for the central business district (CBD) and rural areas of Melbourne, Australia. (a) State the highest temperature recorded in Melbourne’s CBD. [1] (b) Using Fig. 2, describe the pattern of the temperatures in summer and in winter for the CBD and the rural areas. [4] (c) Explain why temperatures are different between the CBD and the surrounding rural areas. [5] Rocks and weathering 3 Fig. 3 shows the relationships between weathering, climate and depth of weathered material. (a) (i) State the difference in metres between the greatest depth of weathered material in the area of strong physical weathering and in the area of strong chemical weathering. [1] (ii) State the range of mean annual precipitation shown in the area of strong chemical weathering. [1] (b) Briefly describe one type of weathering process that might occur in the area of strong physical weathering. [3] (c) Explain why the greatest depth of weathered material is found in the area of strong chemical weathering. [5]
Question paper, page 3
3 9696/11/M/J/14 © UCLES 2014 [Turn over Population 4 Fig. 4 shows the percentage of married women using modern contraception and the total fertility rate, by country, in 2012. (a) State the total fertility rate for India shown in Fig. 4. [1] (b) Describe the relationship between the two variables, using data from Fig. 4. [4] (c) Explain three other factors, apart from contraception, which influence fertility rates. [5] Population / Migration 5 Fig. 5 shows an age/sex pyramid of immigrants to an MEDC in one year. (a) Describe the main features of the population structure shown in Fig. 5, supporting your answer with data from the figure. [5] (b) Suggest reasons for the features you described in (a). [5] Population / Migration / Settlement dynamics 6 Fig. 6 is a diagram of the development of Seoul urban region, South Korea, between 1970 and 2000. South Korea is an NIC in East Asia. (a) Using Figs 6A and 6B, identify two changes to Seoul between 1970 and 1980. [2] (b) Describe Seoul urban region as shown in Fig. 6C. [3] (c) The population of Seoul decreased from 10.4 million in 2000 to 9.8 million in 2010. Suggest reasons why the total population of some cities is decreasing. [5]
Question paper, page 4
4 9696/11/M/J/14 © UCLES 2014 Section B: The Physical Core Answer one question from this section. All questions carry 25 marks. Hydrology and fluvial geomorphology 7 (a) (i) Define the hydrological terms surface storage and groundwater storage. [4] (ii) Describe how saturated overland flow occurs. [3] (b) For a similar rainfall event, draw a storm hydrograph for an urbanised catchment area and a storm hydrograph for a forested catchment area. Explain the differences between the two hydrographs. [8] (c) To what extent does flooding in a catchment area only result from storm rainfall? [10] Atmosphere and weather 8 (a) (i) Define the terms fog and dew. [4] (ii) Briefly describe the albedo effect at the earth’s surface. [3] (b) With the aid of a diagram, explain why some parts of the earth have an excess of radiation energy and other areas have a deficit of radiation energy. [8] (c) Explain how clouds and rainfall are produced. Suggest reasons why not all clouds produce rainfall. [10] Rocks and weathering 9 (a) (i) Define the terms heave and slide as they apply to mass movements. [4] (ii) Describe how a mud flow occurs. [3] (b) With the aid of diagrams, explain how ocean ridges and ocean trenches are formed. [8] (c) To what extent do rock type, vegetation and human activities affect the shape of slopes? [10]
Question paper, page 5
5 9696/11/M/J/14 © UCLES 2014 Section C: The Human Core Answer one question from this section. All questions carry 25 marks. Population 10 (a) (i) Give the meaning of the term death rate. [2] (ii) Describe how the death rate changes in the demographic transition model. [5] (b) Suggest reasons for the recent increases in mortality rates in some LEDCs and MEDCs. [8] (c) Explain why it is easier for government action to decrease the death rate rather than decrease the birth rate. [10] Migration 11 (a) (i) Give the meaning of the term rural-urban migration. [2] (ii) Describe two circumstances in which rural-urban migration may occur. [5] (b) With the help of one or more examples, describe what stepped migration is and explain why it occurs. [8] (c) ‘International migration causes more problems than it solves.’ How far do you agree? [10] Settlement dynamics 12 With the help of a case study of one or more shanty towns (squatter settlements) in an LEDC: (a) outline reasons why people live in the chosen shanty town(s) (squatter settlement(s)); [7] (b) describe one or more attempts to improve living conditions in your chosen shanty town(s) (squatter settlement(s)); [8] (c) evaluate the success of the attempt(s) you described in (b). [10]
Question paper, page 6
6 9696/11/M/J/14 © UCLES 2014 BLANK PAGE
Question paper, page 7
7 9696/11/M/J/14 © UCLES 2014 BLANK PAGE
Question paper, page 8
8 9696/11/M/J/14 © UCLES 2014 Copyright Acknowledgements: Question 4 Fig. 4 © John R Weeks; Population: An Introduction to Concepts and Issues; Thomson Wadsworth; 2008; ISBN 9780495096375. Question 4 Fig. 4 © Population Reference Bureau; http://www.prb.org/Publications/Datasheets/2012/world-population-data-sheet/data-sheet.aspx. Question 5 Fig. 5 © John R Weeks; Population: An Introduction to Concepts and Issues; Thomson Wadsworth; 2008; ISBN 9780495096375. Question 6 Fig. 6 © Joochul Kim & Sang-Chuel Choe; Seoul: The Making of a Metropolis; John Wiley and Sons Ltd; 1997; ISBN 0471949361. Permission to reproduce items where third-party owned material protected by copyright is included has been sought and cleared where possible. Every reasonable effort has been made by the publisher (UCLES) to trace copyright holders, but if any items requiring clearance have unwittingly been included, the publisher will be pleased to make amends at the earliest possible opportunity. Cambridge International Examinations is part of the Cambridge Assessment Group. Cambridge Assessment is the brand name of University of Cambridge Local Examinations Syndicate (UCLES), which is itself a department of the University of Cambridge. BLANK PAGE
Mark scheme, page 1
CAMBRIDGE INTERNATIONAL EXAMINATIONS GCE Advanced Subsidiary Level and GCE Advanced Level MARK SCHEME for the May/June 2014 series 9696 GEOGRAPHY 9696/11 Paper 1 (Core Geography), maximum raw mark 100 This mark scheme is published as an aid to teachers and candidates, to indicate the requirements of the examination. It shows the basis on which Examiners were instructed to award marks. It does not indicate the details of the discussions that took place at an Examiners’ meeting before marking began, which would have considered the acceptability of alternative answers. Mark schemes should be read in conjunction with the question paper and the Principal Examiner Report for Teachers. Cambridge will not enter into discussions about these mark schemes. Cambridge is publishing the mark schemes for the May/June 2014 series for most IGCSE, GCE Advanced Level and Advanced Subsidiary Level components and some Ordinary Level components.
Mark scheme, page 2
Page 2 Mark Scheme Syllabus Paper GCE AS/A LEVEL – May/June 2014 9696 11 © Cambridge International Examinations 2014 Section A Hydrology and fluvial geomorphology 1 Fig. 1 shows some features of a river valley. (a) Identify the features marked: (i) A, [1] (ii) B, [1] (iii) C, [1] (iv) D. [1] A – floodplain/marsh B – bluff/terrace/valley side C – levee/embankment D – channel cut off/straightened channel/channel (b) Describe three features you have identified in (a) and explain how each was formed. [6] A floodplain is composed of alluvium that is deposited when the channel has reached over bank full conditions. The slowing of the floodwaters produced deposition. The bluff marks the extent of the floodplain and is produced by the erosion of valley sides by the swinging of the channel in a series of meanders. Levees are depositional features composed of gravel that has been deposited first when the channel banks are exceeded during flooding. The channel cut off is produced by erosion of the meander neck to naturally straighten the river channel. Some credit for incorrect feature correctly explained. 3 × 2 marks Atmosphere and weather 2 Fig. 2 shows the summer and winter temperatures for the central business district (CBD) and rural areas of Melbourne, Australia. (a) State the highest temperature recorded in Melbourne’s CBD. [1] 25 °C
Mark scheme, page 3
Page 3 Mark Scheme Syllabus Paper GCE AS/A LEVEL – May/June 2014 9696 11 © Cambridge International Examinations 2014 (b) Using Fig. 2, describe the pattern of the temperatures in summer and in winter for the CBD and the rural areas. [4] Both summer and winter shows the same basic pattern with urban temperatures always higher than the rural ones. The differences in both summer and winter are most marked during night-time. The summer temperatures being close at around 1500 hours. In winter the rural temps are always 2/3 degrees lower than the urban. Candidates may produce data (i.e. ranges etc.) but it is the pattern that is most important. Direct comparison of CBD and Rural is not required. Answers simply describing the data can be credited, equally simple use of data. (c) Explain why temperatures are different between the CBD and the surrounding rural areas. [5] Clearly due to the urban heat island effect. This should be explained in terms of the specific heat capacity of urban building materials, which absorb more heat during the day and release it at night. This compares with the surrounding rural areas which will be characterised by vegetation that absorbs less short wave radiation and will release long wave radiation more quickly. Hence the urban areas display higher night-time temperatures as the buildings release stored heat. Anthropogenic heat generation. The heat island effect is more apparent in the winter as there is less difference between day and night time temps in the winter season as there is less solar radiation. Rocks and weathering 3 Fig. 3 shows the relationships between weathering, climate and depth of weathered material. (a) (i) State the difference in metres between the greatest depth of weathered material in the area of strong physical weathering and in the area of strong chemical weathering. [1] 40 (+/– 2) (ii) State the range of mean annual precipitation shown in the area of strong chemical weathering. [1] 1000 mm – 2000 mm (i.e. 1000 mm) (b) Briefly describe one type of weathering process that might occur in the area of strong physical weathering. [3] Despite the mean annual temp being above freezing, the most obvious choice is freeze thaw cycles. Frequent temp change above and below freezing induces the freezing and expansion of water in the interstices and cracks within rocks. The expansion of the frozen water produces stress leading to weathering. Insolation and Carbonation can gain some credit.
Mark scheme, page 4
Page 4 Mark Scheme Syllabus Paper GCE AS/A LEVEL – May/June 2014 9696 11 © Cambridge International Examinations 2014 (c) Explain why the greatest depth of weathered material is found in the area of strong chemical weathering. [5] High temperatures and plentiful rainfall (above 20 °C and 1000 mm) enhances the rate of chemical weathering as suggested by Van’t Hoff’s rule. Thus carbonation, hydrolysis and oxidation will be active in producing deep regoliths through the various actions of chemical weathering. In addition vegetation will allow the production of humic acids which will add to these processes. Population 4 Fig. 4 shows the percentage of married women using modern contraception and the total fertility rate, by country, in 2012. (a) State the total fertility rate for India shown in Fig. 4. [1] 2.9 (accept 2.8 to 3.0) (b) Describe the relationship between the two variables, using data from Fig. 4. [4] There is a close or strong relationship between the two, that the greater the percentage of married women using modern contraception, the lower the total fertility rate + data support or reference to the ‘best fit’ regression line, 3/2. However, the relationship is not perfect/there is a broad scatter of points/many anomalies exist, 1 or with data support 2. (c) Explain three other factors, apart from contraception, which influence fertility rates. [5] Any relevant factors may be credited, including: • demographic, e.g. infant mortality rate and a need to compensate for deaths • social/cultural, e.g. tradition, literacy, the education of women, religion • economic, e.g. children as asset or as burden, female employment, financial incentives linked to population policy • political, e.g. population policy pro-natalist or anti-natalist, empowerment of women. Credit three factors, a simple point 1 or developed point 2, to the maximum. These may be expressed positively or negatively in terms of the influence each has on fertility.
Mark scheme, page 5
Page 5 Mark Scheme Syllabus Paper GCE AS/A LEVEL – May/June 2014 9696 11 © Cambridge International Examinations 2014 Population/Migration 5 Fig. 5 shows an age/sex pyramid of immigrants to an MEDC in one year. (a) Describe the main features of the population structure shown in Fig. 5, supporting your answer with data from the figure. [5] Here main features may include, Gender: quite balanced, slightly more females overall, more females in some age groups/ cohorts e.g. 0–4 and 20–24. Shape: moderate base/widest in the middle/stepped taper from 30–34/narrow and top age some unevenness, e.g. a gap or indent in males age 20–24 and a bulge or exceptionally longer bar for females aged 25–29. Low numbers 60 onwards. Scale: large numbers involved (total approx. 820 000 as it is the USA). Credit each feature 1 or 2 if developed and supported with some data, to the maximum. Comprehensive answers are not required. For a response without data, max. 3. (b) Suggest reasons for the features you described in (a). [5] Only a brief explanation can be expected for this modest mark allocation. Content depends on what were described as main features in (a) and credited. For example, the age structure reflects the dominance of the migration of the economically active to this MEDC. This may reflect immigration policy, for example attracting workers to fill a skills gap or migrants needing to satisfy entry criteria. Those under 15 are dependents; they migrate because one or both parents do. The elderly are reluctant to migrate, and may have problems with visas etc. Few children because single people migrating. The dominance of single women aged 25–29 could reflect targeted recruitment for specific sectors including healthcare (doctors and nurses) and education (teachers), career moves, aspiration and the empowerment of women. The gap or indent in males aged 20–24 may not be significant, as immigration fluctuates from year to year.
Mark scheme, page 6
Page 6 Mark Scheme Syllabus Paper GCE AS/A LEVEL – May/June 2014 9696 11 © Cambridge International Examinations 2014 Population/Migration/Settlement dynamics 6 Fig. 6 is a diagram of the development of Seoul urban region, South Korea, between 1970 and 2000. South Korea is an NIC in East Asia. (a) Using Figs 6A and 6B, identify two changes to Seoul between 1970 and 1980. [2] • expansion of the built-up area • increase in number/doubling of expanded towns from 3 to 6 • introduction of greenbelt • growth of expanded towns south of river • Expansion of built up area south of river Credit 1 and 1. (b) Describe Seoul urban region as shown in Fig. 6C. [3] A congested urban area, fully built-up within the greenbelt; grown outwards beyond the greenbelt; noticeably heavier development south of the Han River; new towns (4); urban renewal inside the greenbelt, with more locations (3) to the north than to the south (1). Comprehensive answers are not needed, credit three points 1. (c) The population of Seoul decreased from 10.4 million in 2000 to 9.8 million in 2010. Suggest reasons why the total population of some cities is decreasing. [5] The centrifugal forces include counterurbanisation and the attraction of living environments which are perceived as better outside the city (new town, expanded town, rural settlements, surrounding rural areas). The decline in fertility/drop in natural increase rate accompanies economic development and the demographic transition (Stage 3 and later). In some MEDCs and NICs, including South Korea, fertility is below replacement level (2.2), so over time, population declines. (Allow 1 for the observation that city boundaries change and/or that the way that data is gathered may not be comparable, so shows a decrease, if offered.)
Mark scheme, page 7
Page 7 Mark Scheme Syllabus Paper GCE AS/A LEVEL – May/June 2014 9696 11 © Cambridge International Examinations 2014 Section B: The Physical Core Hydrology and fluvial geomorphology 7 (a) (i) Define the hydrological terms surface storage and groundwater storage. [4] Surface storage is water that has not infiltrated the surface and is stored on the surface in the form of puddles, lakes etc. (2) Groundwater storage is percolated water that is held within the aquifers below the water table. (2) No marks for simply repeating the terms. (ii) Describe how saturated overland flow occurs. [3] Water is not infiltrated on a slope due to the saturated nature of the soil, and flows across the surface. This most frequently occurs on the lower parts of slopes that have been saturated by water from above. (b) For a similar rainfall event, draw a storm hydrograph for an urbanised catchment area and a storm hydrograph for a forested catchment area. Explain the differences between the two hydrographs. [8] The urbanised hydrograph should have steep rising and falling limbs, high peak discharge and short lag times. The forested catchment should have gentle limbs, lower peak discharge and a longer lag time. The explanation for the flashier urban response is the greater amount of run off (quick flow) in the urban area, because of increased permeability. The forested area will allow greater interception of ppt by trees and the slower progress of water to the surface (stem flow, drip etc.) where it will be infiltrated. Percolation will allow through flow and hence a greater proportion of the water will arrive at the channel as the slower base flow. Suggest 4 for diagrams and 4 for explanation. (c) To what extent does flooding in a catchment area only result from storm rainfall? [10] Flooding is essentially a natural phenomenon as a result of a sudden excess of input, usually in the form of precipitation events. Rivers naturally develop flood plains to cope with such conditions. Sudden storms produce large amounts of overland flow which can produce a rapid rise in channel discharge and over bank full conditions. Most recent floods have been due to such causes as excessive monsoons or intense storm events. Spring snow melt can produce flooding. Flood conditions can be exacerbated by human activities such as land use changes, but these are rarely the prime causes. Some answers will see flooding as a response to catchment conditions.
Mark scheme, page 8
Page 8 Mark Scheme Syllabus Paper GCE AS/A LEVEL – May/June 2014 9696 11 © Cambridge International Examinations 2014 Level 3 Good appreciation of flooding as part of the catchment system (inputs–outputs). Some debate as to the impact of human and other catchment conditions, (such as land use, geology, etc.). [8–10] Level 2 Some appreciation of the role of ppt, but mainly a description of the catchment area conditions (such as urban, vegetation, geology, etc.), that can induce flashy responses in rivers. [5–7] Level 1 Scant reference to catchment conditions and virtually no reference to the role of precipitation input. [1–4] Atmosphere and weather 8 (a) (i) Define the terms fog and dew. [4] Fog is the suspended water droplets producing Fog of visibility less than 1 km. (2) Dew is water droplets that have condensed on vegetation and objects on the surface. (2) (ii) Briefly describe the albedo effect at the earth’s surface. [3] Albedo is an index of the ability of a surface to reflect incoming solar radiation. Thus snow has a high albedo, whilst black objects (e.g. tarmac) have a low albedo. (b) With the aid of a diagram, explain why some parts of the earth have an excess of radiation energy and other areas have a deficit of radiation energy. [8] The energy excess/deficit represents the balance between solar (swr) received and long wave radiation. Tropical and equatorial areas receive the most solar radiation due to the overhead sun and the earth’s tilt. The greater amount of atmosphere to heat at the poles plus the seasonal tilt away from the sun produces less solar radiation and hence an energy deficit. The most effective diagrams are those showing energy receipt with latitude and thus the energy balance, but many will use earth tilt diagrams. Max. 5 if no ref. to areas of deficit. Max. 6 if no diagram.
Mark scheme, page 9
Page 9 Mark Scheme Syllabus Paper GCE AS/A LEVEL – May/June 2014 9696 11 © Cambridge International Examinations 2014 (c) Explain how clouds and rainfall are produced. Suggest reasons why not all clouds produce rainfall. [10] Clouds are produced due to the uplift of air and its adiabatic cooling to dew point. Condensation occurs around hygroscopic nuclei. Further uplift at the SALR will produce a sufficient thickness of cloud to allow for the development of water particles and ice crystals that can coalesce within the up and down drafts. Clouds need some vertical development to allow this process to develop. Thin stratiform clouds will not allow for such processes to develop. Accept discussion of Hail and Snow. Level 3 Good understanding of the effects of uplift and adiabatic cooling. The processes of raindrop production will be understood as well as its limitations. Some discussion of why not all clouds lead to rainfall needed for Level 3. [8–10] Level 2 Uplift and cooling to dew point although limited understanding of lapse rates and of raindrop production. [5–7] Level 1 Orographic and convection producing rain and clouds. No real understanding of adiabatic processes. [1–4] Rocks and weathering 9 (a) (i) Define the terms heave and slide as they apply to mass movements. [4] Heave is the movement of soil particles by water or freezing, such that they fall back. Slide is the down slope movement of material en masse along a slide plane. Both could be shown by annotated diagrams. (ii) Describe how a mud flow occurs. [3] A mud flow is caused by high water content of the regolith, such that internal cohesion is reduced, and movement under gravity occurs downslope. (b) With the aid of diagrams, explain how ocean ridges and ocean trenches are formed. [8] Ocean ridges are formed at divergent plate margins. Diagrams should show sea floor spreading and the formation of a ridge through the rising of magma. Ocean trenches are formed at convergent margins and are produced as the crust is dragged down with the subducting plate. Explanation can be sought in the operation of convection currents. Max. 6 if no diagrams.
Mark scheme, page 10
Page 10 Mark Scheme Syllabus Paper GCE AS/A LEVEL – May/June 2014 9696 11 © Cambridge International Examinations 2014 (c) To what extent do rock type, vegetation and human activities affect the shape of slopes? [10] Rock type, in terms of its resistance and its structure, will affect slope shape. Hence resistant, blocky, rocks may produce free faces where rock fall has occurred. Less resistant rocks such as clays will not maintain such steep slopes. Vegetation has the effect of binding together soil and hence protecting the slope from weathering and erosion. Thus the slope is more stable. Human activities, such as undercutting, mining, waste dumping all will affect slope shape. The removal of vegetation can also destabilise slopes. The extent to which these factors affect slopes are influenced by climate. Natural processes, however, are generally more significant than human activities. Human activities can be positive as well as negative. Level 3 Good appreciation of the influence of each of the factors impact upon slope shape. A realistic assessment of all factors is required. [8–10] Level 2 A generalised cover of the factors with most emphasis on vegetation and human activities. Some idea of slope shape. [5–7] Level 1 Mostly human activities with little development of slope shape apart from quarrying and dumping of slag heaps. [1–4]
Mark scheme, page 11
Page 11 Mark Scheme Syllabus Paper GCE AS/A LEVEL – May/June 2014 9696 11 © Cambridge International Examinations 2014 Section C: The Human Core Population 10 (a) (i) Give the meaning of the term death rate. [2] Number of deaths or people who die/per 1000 or %/per year or annum. For one element 0, for two elements 1, for all three elements 2. (ii) Describe how the death rate changes in the demographic transition model. [5] Stage 1 death rate is high and fluctuating (approx. 40/1000); falls steeply throughout Stage 2 (to approx. 15/1000); falls slightly in Stage 3 (to approx. 10/1000); stays low throughout Stage 4, fluctuating slightly. Stage 5, death rate rises slightly. No credit for explanation. Max. 3 if no written description. (b) Suggest reasons for the recent increases in mortality rates in some LEDCs and MEDCs. [8] Comprehensive answers are not needed. Reference may be made to Stage 5 again, but the DTM is descriptive and does not, itself, give reasons. The main creditable reasons are: • the implications of an ageing population/regressive age structure • smoking (links to cardiovascular problems and cancers – the big killers) • obesity (wide health implications) • HIV/AIDS/and other diseases. • catastrophic events, e.g. famine, war, earthquakes, often combined. (c) Explain why it is easier for government action to decrease the death rate rather than decrease the birth rate. [10] This is largely because of governments’ direct influence and investment, e.g. in sanitation, water supply, healthcare, etc. rather than indirect work to influence people’s choices, values, attitudes to family size, etc. which takes more time. Candidates will probably: Level 3 Provide an effective explanation addressing both elements. Offer detailed exemplar support and structure the response well. [8–10] Level 2 Show satisfactory knowledge and understanding in a reasonable attempt which may contain good points. Explanation is valid, but limited. [5–7] Level 1 Give only a few basic ideas, struggle to deal with the issue, offer little or no explanation. Fragmentary responses and notes remain in this level. [1–4]
Mark scheme, page 12
Page 12 Mark Scheme Syllabus Paper GCE AS/A LEVEL – May/June 2014 9696 11 © Cambridge International Examinations 2014 Migration 11 (a) (i) Give the meaning of the term rural-urban migration. [2] Movement of population/people, from the countryside/villages, to the town and/or city, for one year or more. For two elements 1, three or four elements 2. (ii) Describe two circumstances in which rural-urban migration may occur. [5] Any relevant circumstances are valid, either simple, or complex/multi-factor, with or without the use of an example, MEDC or LEDC context, e.g. population pressure in rural area; or to seek a job and better living conditions in town. Credit 3/2 or 2/3. (b) With the help of one or more examples, describe what stepped migration is and explain why it occurs. [8] Stepped (or step) migration is when a rural migrant heads first for a familiar small town which is relatively close by, and makes one or more later moves up the settlement hierarchy, e.g. to a regional centre and then on to the capital city. It occurs to reduce the risks involved and to help the migrant on his/her way, by offering smaller steps which may be easier to achieve. It allows money to be saved up and information to be gathered for the next step, etc. (c) ‘International migration causes more problems than it solves.’ How far do you agree? [10] An open question allowing candidates to use the material they have. Much depends on the type of international migration, e.g. economic, refugee, etc. The problems may be located in source areas and/or receiving areas. Candidates will probably: Level 3 Make an effective assessment of the statement, covering problems caused and problems solved explicitly. Combine exemplar content with conceptual understanding well. [8–10] Level 2 Provide a sound response which may be good in parts, but which is limited through lack of detailed knowledge, restricted understanding of international migration or partial assessment. [5–7] Level 1 Make an answer which is more descriptive than evaluative. Lack the knowledge or time to make more than a basic or note-form response. [1–4]
Mark scheme, page 13
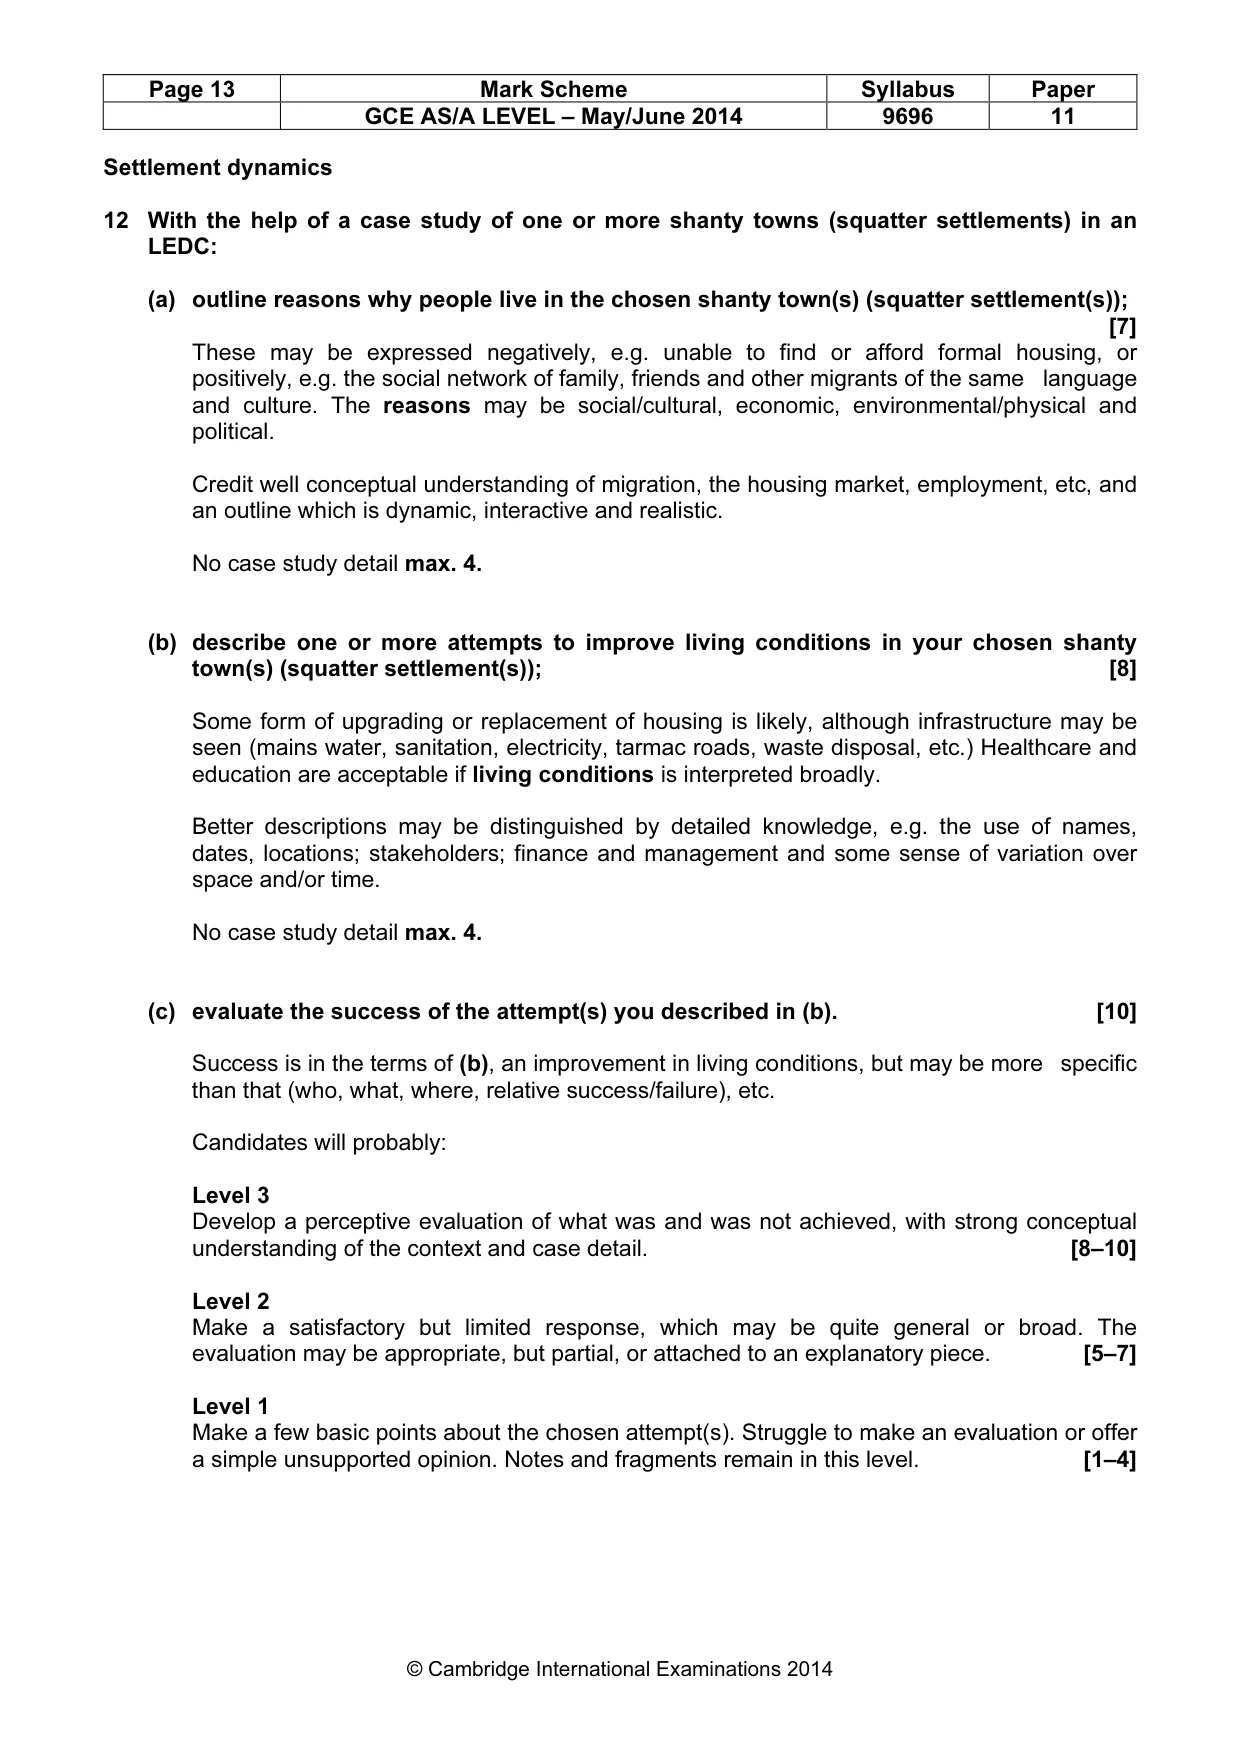
Page 13 Mark Scheme Syllabus Paper GCE AS/A LEVEL – May/June 2014 9696 11 © Cambridge International Examinations 2014 Settlement dynamics 12 With the help of a case study of one or more shanty towns (squatter settlements) in an LEDC: (a) outline reasons why people live in the chosen shanty town(s) (squatter settlement(s)); [7] These may be expressed negatively, e.g. unable to find or afford formal housing, or positively, e.g. the social network of family, friends and other migrants of the same language and culture. The reasons may be social/cultural, economic, environmental/physical and political. Credit well conceptual understanding of migration, the housing market, employment, etc, and an outline which is dynamic, interactive and realistic. No case study detail max. 4. (b) describe one or more attempts to improve living conditions in your chosen shanty town(s) (squatter settlement(s)); [8] Some form of upgrading or replacement of housing is likely, although infrastructure may be seen (mains water, sanitation, electricity, tarmac roads, waste disposal, etc.) Healthcare and education are acceptable if living conditions is interpreted broadly. Better descriptions may be distinguished by detailed knowledge, e.g. the use of names, dates, locations; stakeholders; finance and management and some sense of variation over space and/or time. No case study detail max. 4. (c) evaluate the success of the attempt(s) you described in (b). [10] Success is in the terms of (b), an improvement in living conditions, but may be more specific than that (who, what, where, relative success/failure), etc. Candidates will probably: Level 3 Develop a perceptive evaluation of what was and was not achieved, with strong conceptual understanding of the context and case detail. [8–10] Level 2 Make a satisfactory but limited response, which may be quite general or broad. The evaluation may be appropriate, but partial, or attached to an explanatory piece. [5–7] Level 1 Make a few basic points about the chosen attempt(s). Struggle to make an evaluation or offer a simple unsupported opinion. Notes and fragments remain in this level. [1–4]
What you needed in this session
Cambridge’s own grade thresholds for 2014 May/June, Paper 1 · Variant 1. A higher threshold means an easier paper — the bar moves with how the cohort did.