Cambridge A Level Geography 9696 — 2014 May/June Paper 1 · Variant 2
9696/12/M/J/14 · 100 marks · ≈113 min
The question paper and its mark scheme, free to read here and free to download. This is Cambridge’s own paper, exactly as it was sat.
Question paper8 pages



Mark scheme13 pages
Answers below. Sit the paper first if you are practising.
Paper as text
Question paper, page 1
This document consists of 5 printed pages, 3 blank pages and 2 inserts. DC (SJF/SW) 81399/4 © UCLES 2014 [Turn over Cambridge International Examinations Cambridge International Advanced Subsidiary and Advanced Level * 0 3 5 3 5 2 1 1 3 6 * GEOGRAPHY 9696/12 Paper 1 Core Geography May/June 2014 3 hours No Additional Materials are required. READ THESE INSTRUCTIONS FIRST An answer booklet is provided inside this question paper. You should follow the instructions on the front cover of the answer booklet. If you need additional answer paper ask the invigilator for a continuation booklet. Section A Answer five questions. Section B Answer one question. Section C Answer one question. Sketch maps and diagrams should be drawn whenever they serve to illustrate an answer. All the Figures referred to in the questions are contained in the Insert. The number of marks is given in brackets [ ] at the end of each question or part question.
Question paper, page 2
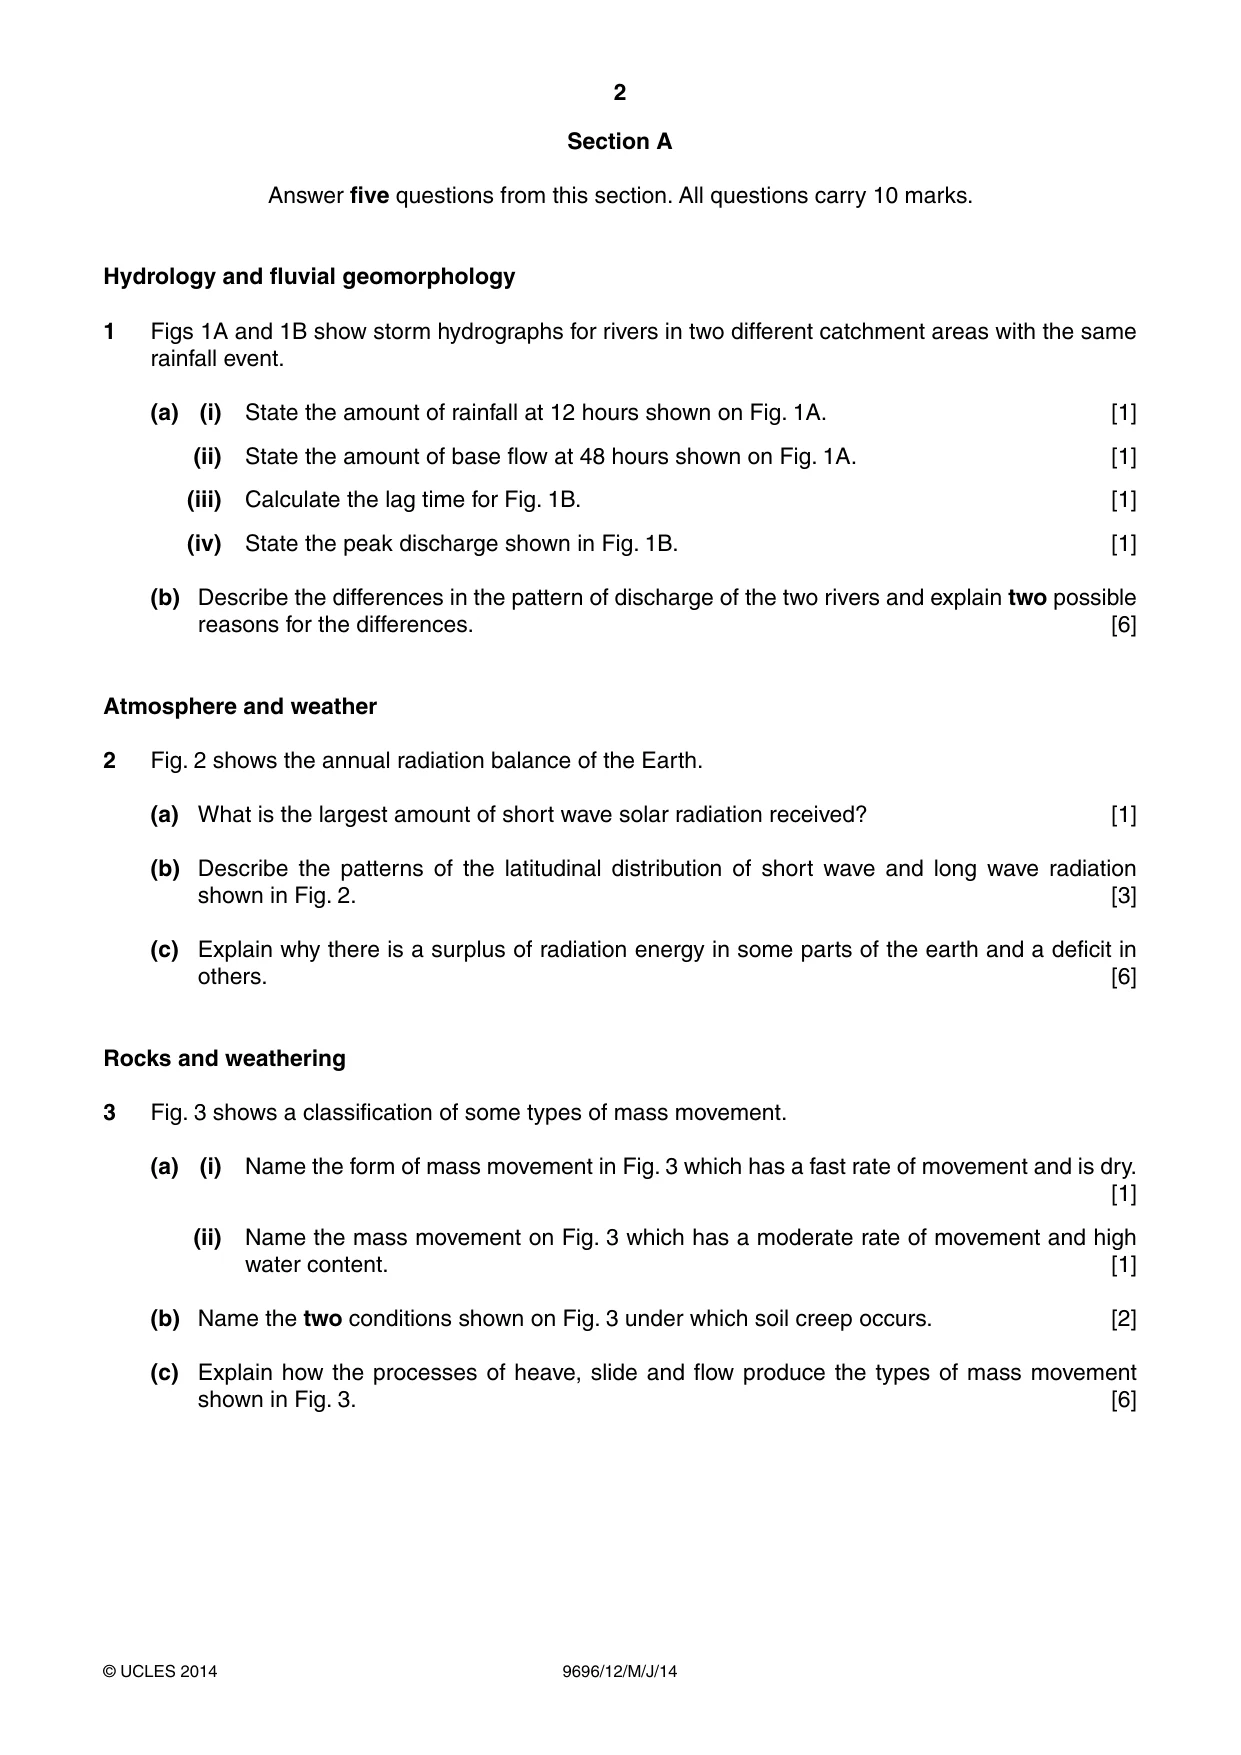
2 9696/12/M/J/14 © UCLES 2014 Section A Answer five questions from this section. All questions carry 10 marks. Hydrology and fluvial geomorphology 1 Figs 1A and 1B show storm hydrographs for rivers in two different catchment areas with the same rainfall event. (a) (i) State the amount of rainfall at 12 hours shown on Fig. 1A. [1] (ii) State the amount of base flow at 48 hours shown on Fig. 1A. [1] (iii) Calculate the lag time for Fig. 1B. [1] (iv) State the peak discharge shown in Fig. 1B. [1] (b) Describe the differences in the pattern of discharge of the two rivers and explain two possible reasons for the differences. [6] Atmosphere and weather 2 Fig. 2 shows the annual radiation balance of the Earth. (a) What is the largest amount of short wave solar radiation received? [1] (b) Describe the patterns of the latitudinal distribution of short wave and long wave radiation shown in Fig. 2. [3] (c) Explain why there is a surplus of radiation energy in some parts of the earth and a deficit in others. [6] Rocks and weathering 3 Fig. 3 shows a classification of some types of mass movement. (a) (i) Name the form of mass movement in Fig. 3 which has a fast rate of movement and is dry. [1] (ii) Name the mass movement on Fig. 3 which has a moderate rate of movement and high water content. [1] (b) Name the two conditions shown on Fig. 3 under which soil creep occurs. [2] (c) Explain how the processes of heave, slide and flow produce the types of mass movement shown in Fig. 3. [6]
Question paper, page 3
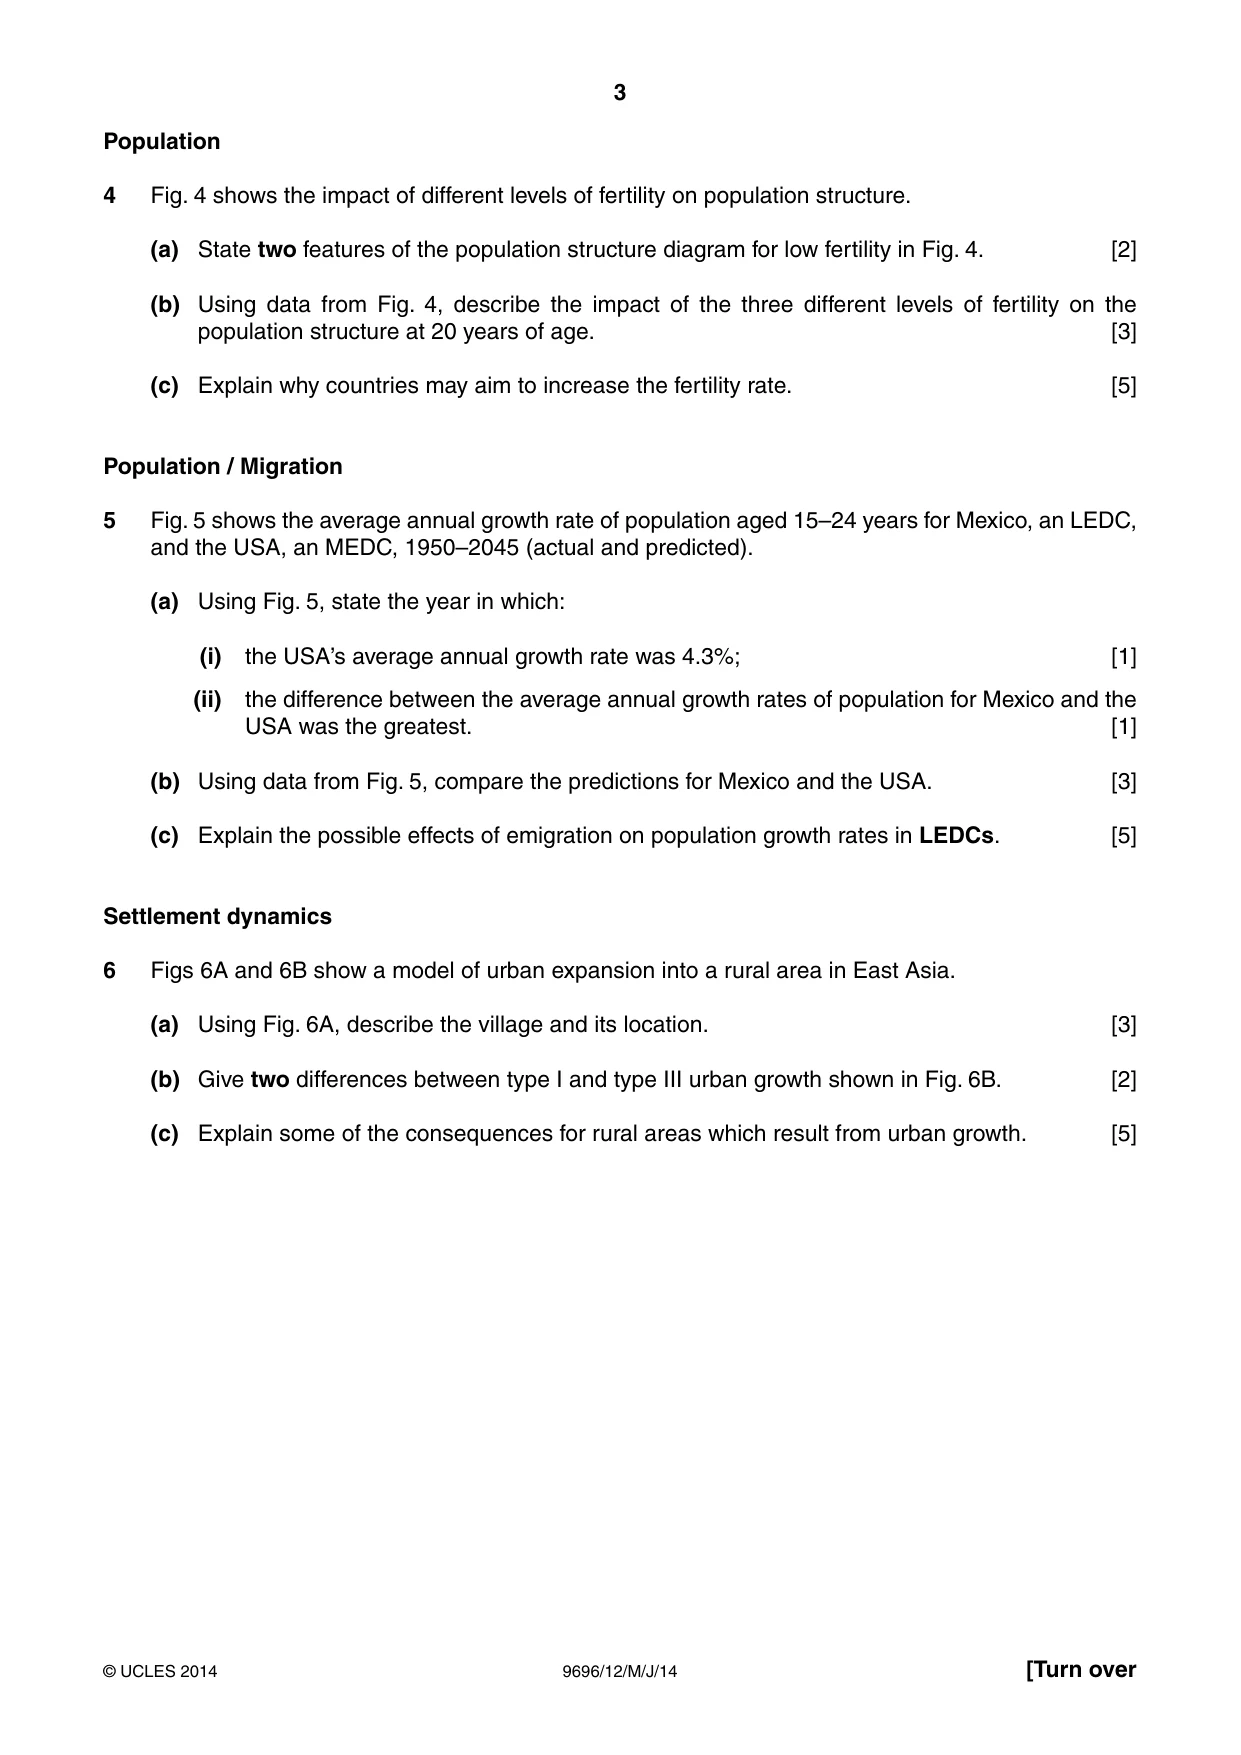
3 9696/12/M/J/14 © UCLES 2014 [Turn over Population 4 Fig. 4 shows the impact of different levels of fertility on population structure. (a) State two features of the population structure diagram for low fertility in Fig. 4. [2] (b) Using data from Fig. 4, describe the impact of the three different levels of fertility on the population structure at 20 years of age. [3] (c) Explain why countries may aim to increase the fertility rate. [5] Population / Migration 5 Fig. 5 shows the average annual growth rate of population aged 15–24 years for Mexico, an LEDC, and the USA, an MEDC, 1950–2045 (actual and predicted). (a) Using Fig. 5, state the year in which: (i) the USA’s average annual growth rate was 4.3%; [1] (ii) the difference between the average annual growth rates of population for Mexico and the USA was the greatest. [1] (b) Using data from Fig. 5, compare the predictions for Mexico and the USA. [3] (c) Explain the possible effects of emigration on population growth rates in LEDCs. [5] Settlement dynamics 6 Figs 6A and 6B show a model of urban expansion into a rural area in East Asia. (a) Using Fig. 6A, describe the village and its location. [3] (b) Give two differences between type I and type III urban growth shown in Fig. 6B. [2] (c) Explain some of the consequences for rural areas which result from urban growth. [5]
Question paper, page 4
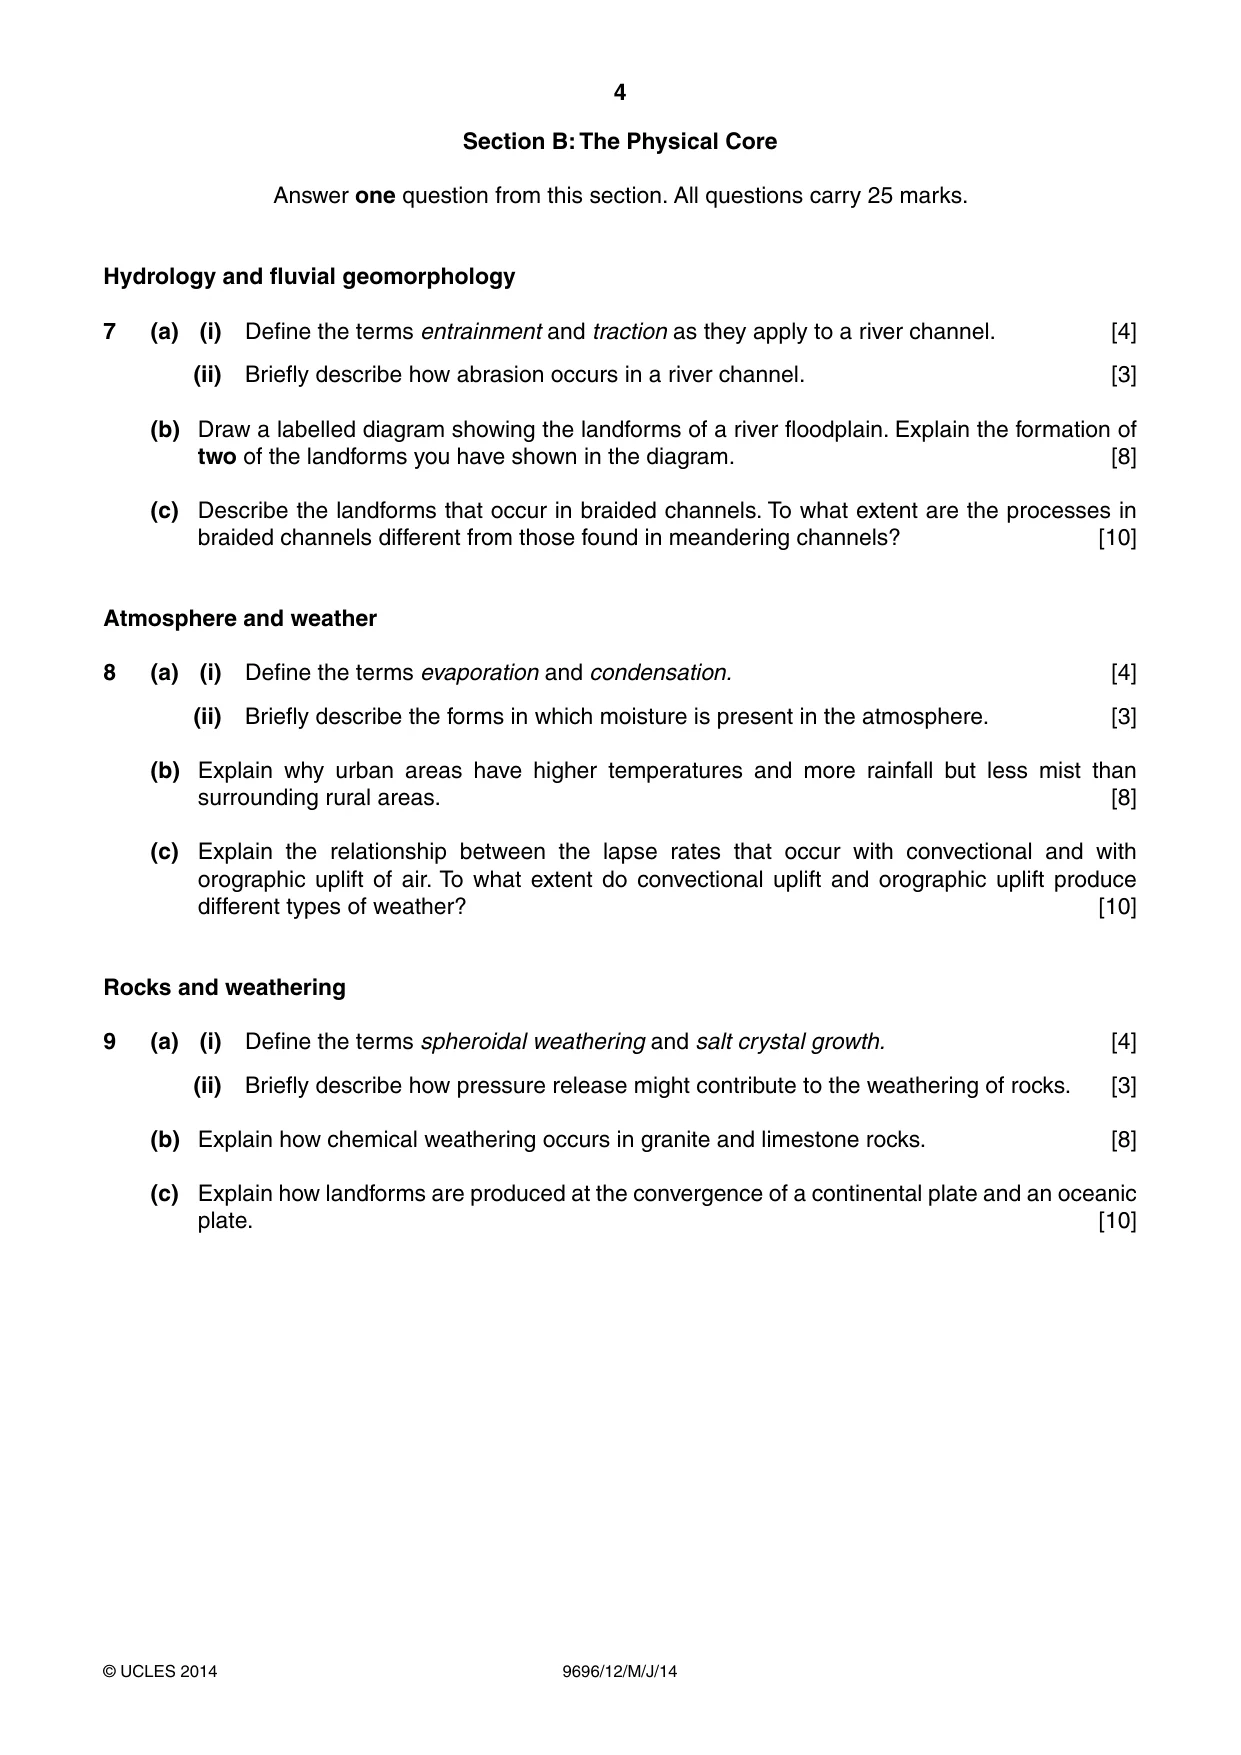
4 9696/12/M/J/14 © UCLES 2014 Section B: The Physical Core Answer one question from this section. All questions carry 25 marks. Hydrology and fluvial geomorphology 7 (a) (i) Define the terms entrainment and traction as they apply to a river channel. [4] (ii) Briefly describe how abrasion occurs in a river channel. [3] (b) Draw a labelled diagram showing the landforms of a river floodplain. Explain the formation of two of the landforms you have shown in the diagram. [8] (c) Describe the landforms that occur in braided channels. To what extent are the processes in braided channels different from those found in meandering channels? [10] Atmosphere and weather 8 (a) (i) Define the terms evaporation and condensation. [4] (ii) Briefly describe the forms in which moisture is present in the atmosphere. [3] (b) Explain why urban areas have higher temperatures and more rainfall but less mist than surrounding rural areas. [8] (c) Explain the relationship between the lapse rates that occur with convectional and with orographic uplift of air. To what extent do convectional uplift and orographic uplift produce different types of weather? [10] Rocks and weathering 9 (a) (i) Define the terms spheroidal weathering and salt crystal growth. [4] (ii) Briefly describe how pressure release might contribute to the weathering of rocks. [3] (b) Explain how chemical weathering occurs in granite and limestone rocks. [8] (c) Explain how landforms are produced at the convergence of a continental plate and an oceanic plate. [10]
Question paper, page 5
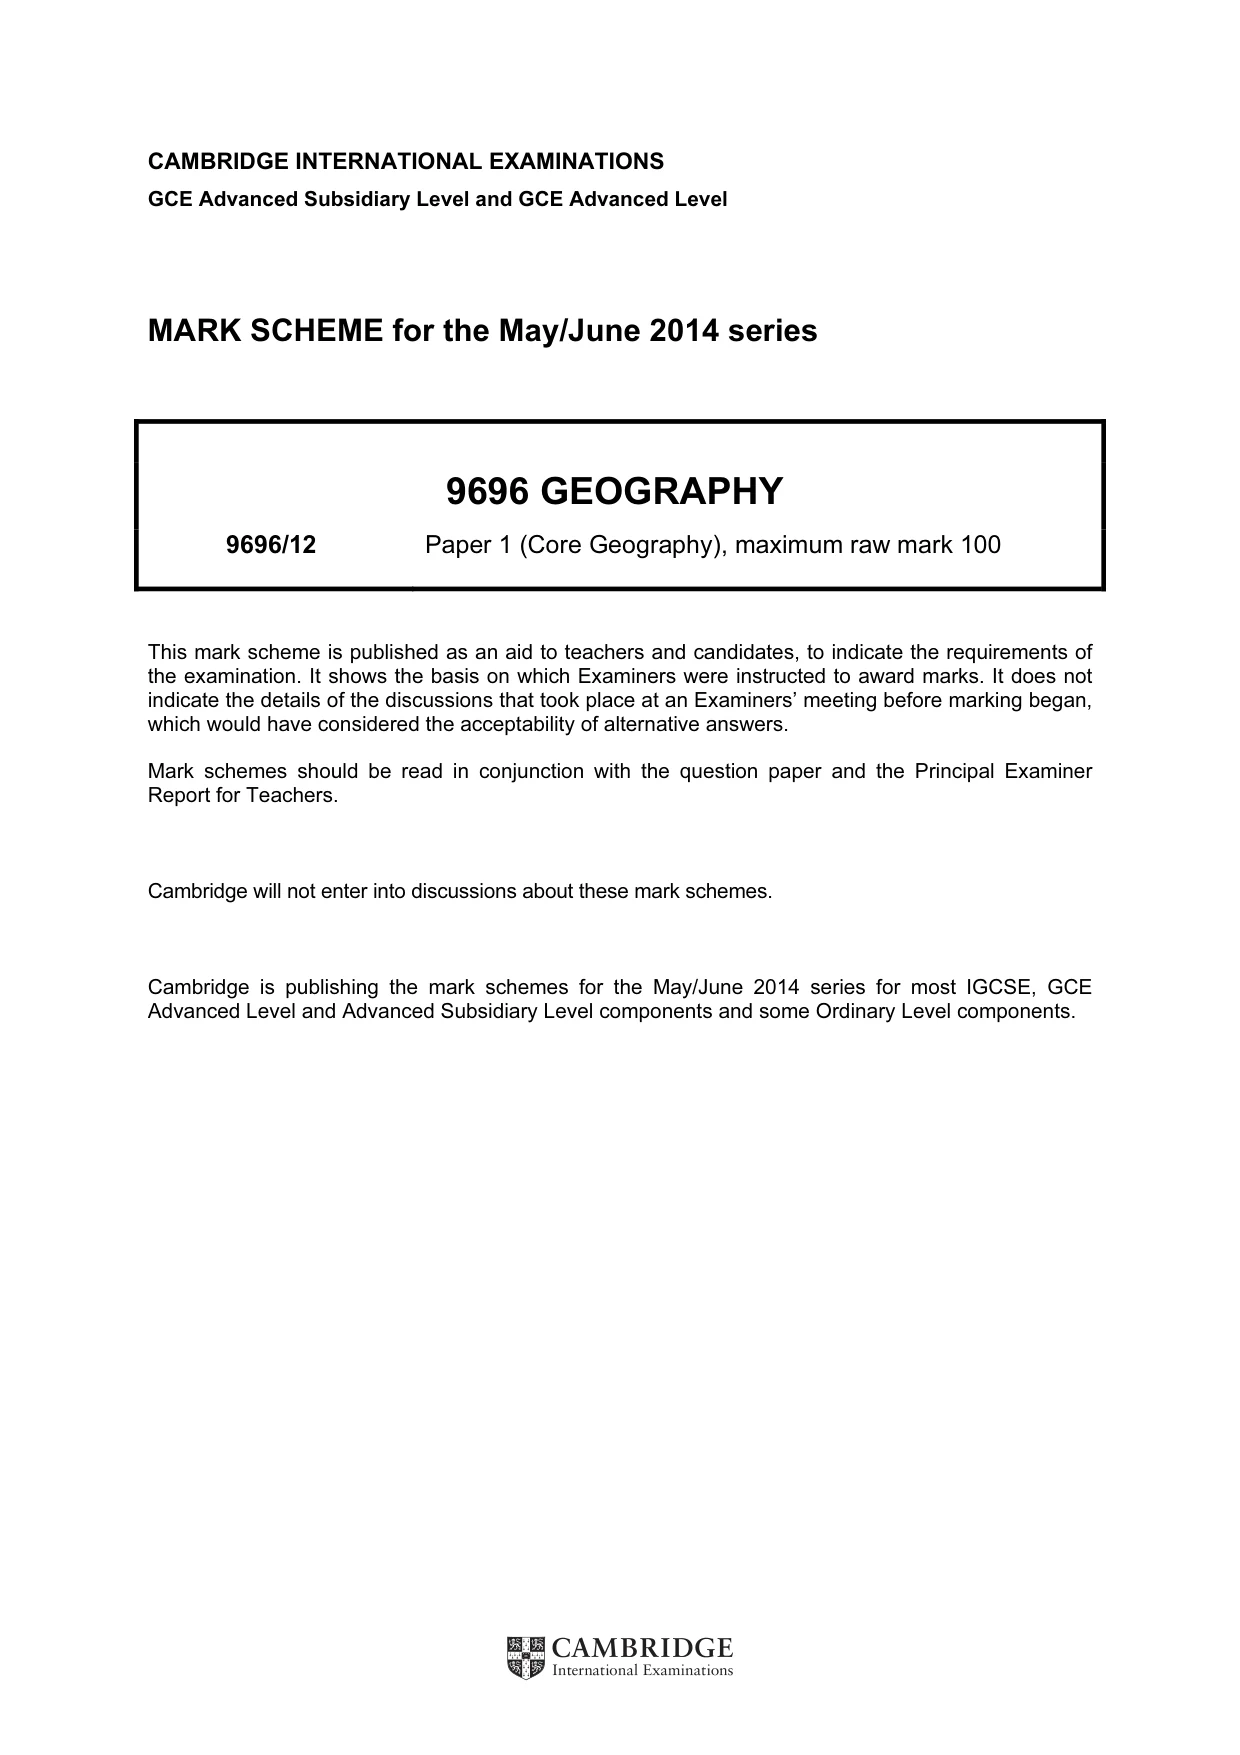
5 9696/12/M/J/14 © UCLES 2014 Section C: The Human Core Answer one question from this section. All questions carry 25 marks. Population 10 (a) (i) Define the term carrying capacity. [3] (ii) With the help of examples, give two ways that population may exceed carrying capacity. [4] (b) Explain the causes of food shortages. [8] (c) How far do you agree that the idea of a population ceiling is no longer useful? [10] Migration / Settlement dynamics 11 (a) (i) With the help of an example, give the meaning of the term urban-urban migration. [3] (ii) Outline two circumstances in which urban-urban migration occurs. [4] (b) Use examples to explain how push factors and pull factors work together to cause rural- urban migration. [8] (c) To what extent can movements within urban settlements (intra-urban migration) be explained by changes in family life? [10] Settlement dynamics 12 (a) Describe the characteristic functions of Central Business Districts (CBDs). [7] (b) With reference to one or more urban settlements, describe how the CBD is changing and give reasons for these changes. [8] (c) How far do you agree that effective management can solve the problems of urban settlements? [10]
Question paper, page 6
6 9696/12/M/J/14 © UCLES 2014 BLANK PAGE
Question paper, page 7
7 9696/12/M/J/14 © UCLES 2014 BLANK PAGE
Question paper, page 8
8 9696/12/M/J/14 © UCLES 2014 BLANK PAGE Copyright Acknowledgements: Question 4 Fig. 4 © John R Weeks; Population: An Introduction to Concepts and Issues; Wadsworth Publishing Company; 1996. Question 5 Fig. 5 © Gregory B Weeks & John R Weeks; Irresistable Forces; Latin American Migration to the United States and its Effects on the South; University of New Mexico Press; 2009. Question 6 Fig.6 © Gideon S Golany Et Al; Japanese Urban Environment; Elsevier Science LTD; 1998. Permission to reproduce items where third-party owned material protected by copyright is included has been sought and cleared where possible. Every reasonable effort has been made by the publisher (UCLES) to trace copyright holders, but if any items requiring clearance have unwittingly been included, the publisher will be pleased to make amends at the earliest possible opportunity. Cambridge International Examinations is part of the Cambridge Assessment Group. Cambridge Assessment is the brand name of University of Cambridge Local Examinations Syndicate (UCLES), which is itself a department of the University of Cambridge.
Mark scheme, page 1
CAMBRIDGE INTERNATIONAL EXAMINATIONS GCE Advanced Subsidiary Level and GCE Advanced Level MARK SCHEME for the May/June 2014 series 9696 GEOGRAPHY 9696/12 Paper 1 (Core Geography), maximum raw mark 100 This mark scheme is published as an aid to teachers and candidates, to indicate the requirements of the examination. It shows the basis on which Examiners were instructed to award marks. It does not indicate the details of the discussions that took place at an Examiners’ meeting before marking began, which would have considered the acceptability of alternative answers. Mark schemes should be read in conjunction with the question paper and the Principal Examiner Report for Teachers. Cambridge will not enter into discussions about these mark schemes. Cambridge is publishing the mark schemes for the May/June 2014 series for most IGCSE, GCE Advanced Level and Advanced Subsidiary Level components and some Ordinary Level components.
Mark scheme, page 2
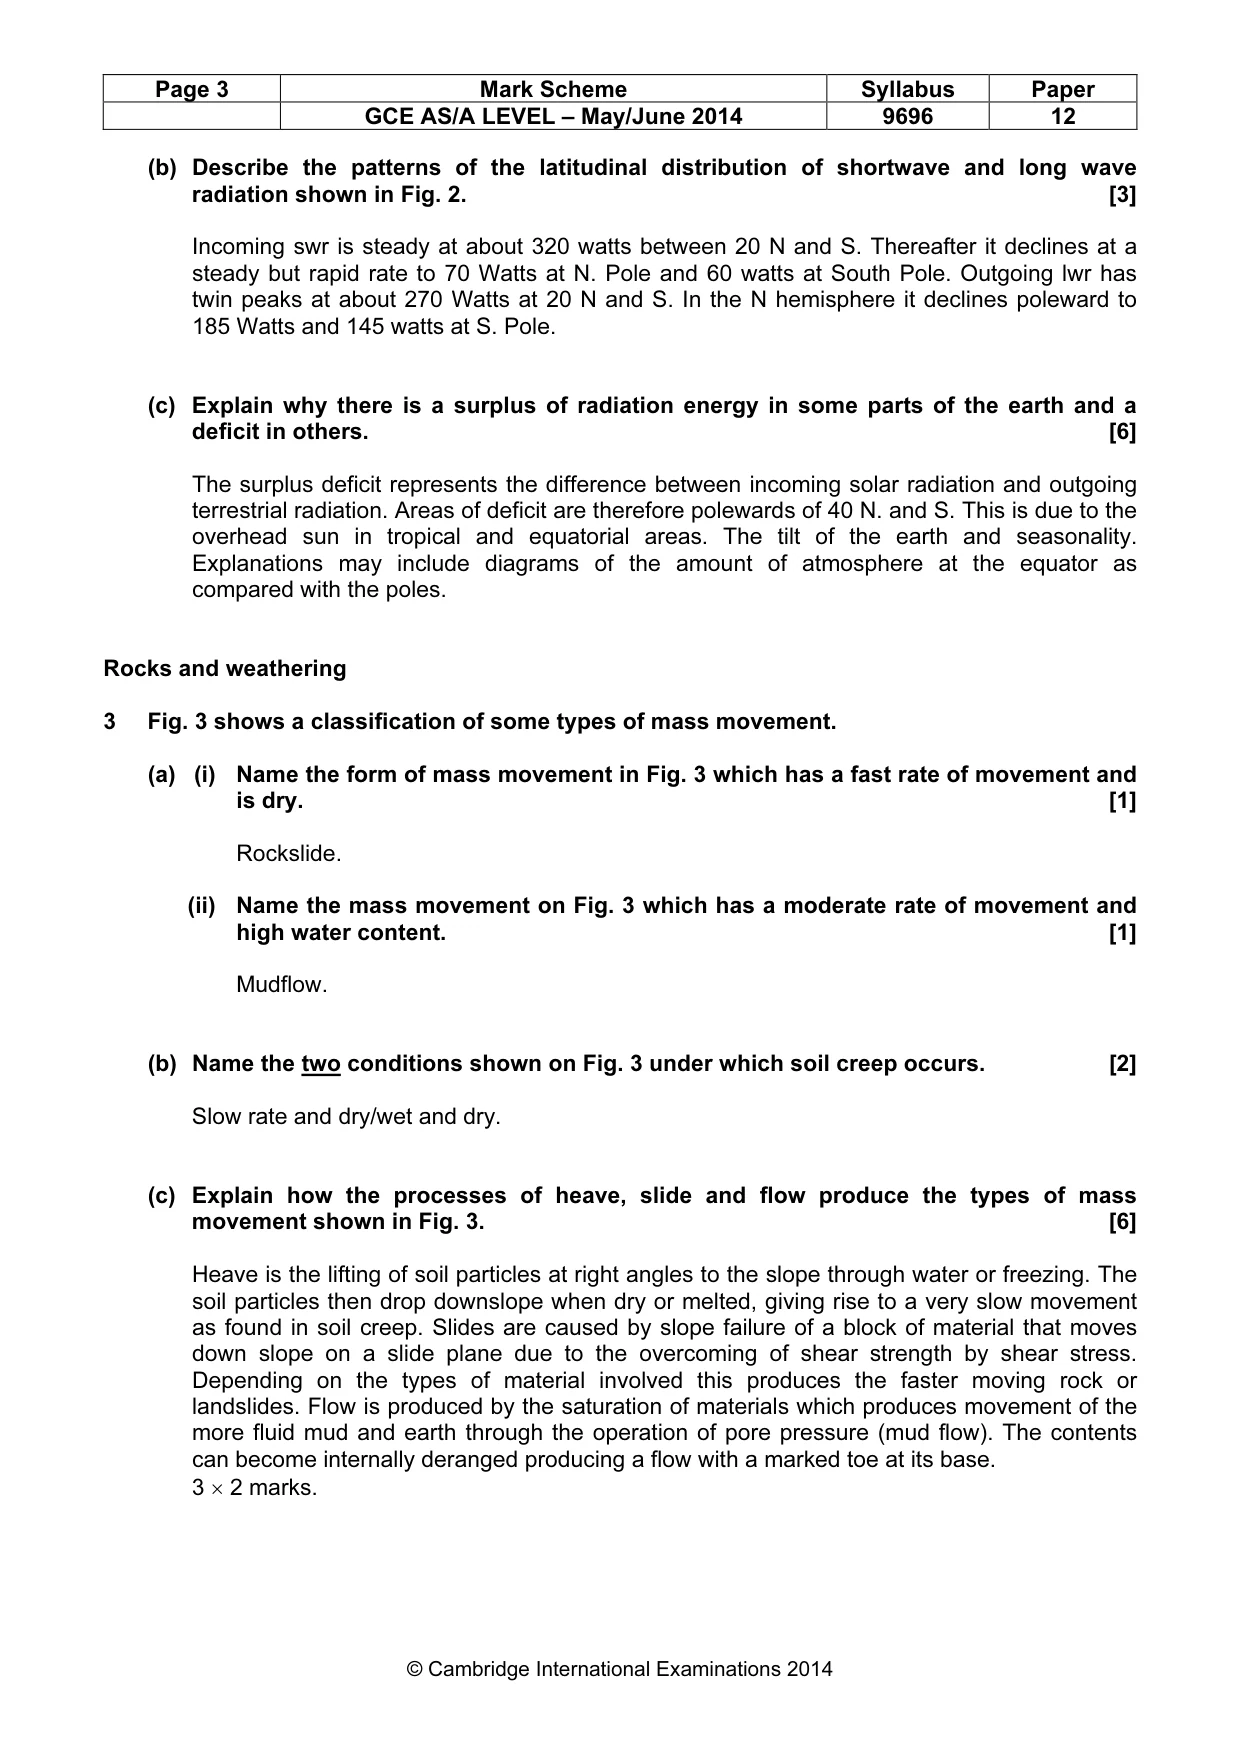
Page 2 Mark Scheme Syllabus Paper GCE AS/A LEVEL – May/June 2014 9696 12 © Cambridge International Examinations 2014 Section A Hydrology and fluvial geomorphology 1 Figs 1A and 1B show storm hydrographs for rivers in two different catchment areas with the same rainfall event. (a) (i) State the amount of rainfall at 12 hours shown on Fig.1A. [1] 50–52 mm. (ii) State the amount of base flow at 48 hours shown on Fig. 1A. [1] 5 cumecs. (iii) Calculate the lag time for Fig. 1B [1] 36 hours. (iv) State the peak discharge shown in Fig. 1B. [1] 20 cumecs. (b) Describe the differences in the pattern of discharge of the two rivers and explain two possible reasons for the differences. [6] The baseflow for both rivers remains the same. Fig. 1A has steep rising and falling limbs and a shorter lag time. In Fig. 1B the peak discharge is much lower and the lag time longer. The rising and falling limbs are gentle. Fig. 1A therefore represents a flashier regime. As the rainfall is the same, causes should be sought in catchment characteristics. Land use is one possibility, i.e. urban as against forested, which should be explained. Geology (clay/limestone), catchment shape (round/elongated) and slopes (steep/gentle). Distribution of marks – 2 for description and 2 each for the causes. Max. 3 for description only. Atmosphere and weather 2 Fig. 2 shows the annual radiation balance of the Earth. (a) What is the largest amount of short wave solar radiation received? [1] 320 Watts/m2.
Mark scheme, page 3
Page 3 Mark Scheme Syllabus Paper GCE AS/A LEVEL – May/June 2014 9696 12 © Cambridge International Examinations 2014 (b) Describe the patterns of the latitudinal distribution of shortwave and long wave radiation shown in Fig. 2. [3] Incoming swr is steady at about 320 watts between 20 N and S. Thereafter it declines at a steady but rapid rate to 70 Watts at N. Pole and 60 watts at South Pole. Outgoing lwr has twin peaks at about 270 Watts at 20 N and S. In the N hemisphere it declines poleward to 185 Watts and 145 watts at S. Pole. (c) Explain why there is a surplus of radiation energy in some parts of the earth and a deficit in others. [6] The surplus deficit represents the difference between incoming solar radiation and outgoing terrestrial radiation. Areas of deficit are therefore polewards of 40 N. and S. This is due to the overhead sun in tropical and equatorial areas. The tilt of the earth and seasonality. Explanations may include diagrams of the amount of atmosphere at the equator as compared with the poles. Rocks and weathering 3 Fig. 3 shows a classification of some types of mass movement. (a) (i) Name the form of mass movement in Fig. 3 which has a fast rate of movement and is dry. [1] Rockslide. (ii) Name the mass movement on Fig. 3 which has a moderate rate of movement and high water content. [1] Mudflow. (b) Name the two conditions shown on Fig. 3 under which soil creep occurs. [2] Slow rate and dry/wet and dry. (c) Explain how the processes of heave, slide and flow produce the types of mass movement shown in Fig. 3. [6] Heave is the lifting of soil particles at right angles to the slope through water or freezing. The soil particles then drop downslope when dry or melted, giving rise to a very slow movement as found in soil creep. Slides are caused by slope failure of a block of material that moves down slope on a slide plane due to the overcoming of shear strength by shear stress. Depending on the types of material involved this produces the faster moving rock or landslides. Flow is produced by the saturation of materials which produces movement of the more fluid mud and earth through the operation of pore pressure (mud flow). The contents can become internally deranged producing a flow with a marked toe at its base. 3 × 2 marks.
Mark scheme, page 4
Page 4 Mark Scheme Syllabus Paper GCE AS/A LEVEL – May/June 2014 9696 12 © Cambridge International Examinations 2014 Population 4 Fig. 4 shows the impact of different levels of fertility on population structure. (a) State two features of the population structure diagram for low fertility in Fig. 4. [2] Credit 1 each of two of the following observations: • straight-sided (7.5% M & F) up to approx. 65 years • gentle decrease/narrowing after 65 years, a rounded top • balanced M/F • beehive-shaped (or some other shape word, e.g. barrel, inverted U, etc.) • narrow base Do not credit comparisons. (b) Using data from Fig. 4, describe the impact of the three different levels of fertility on the population structure at 20 years of age. [3] With high fertility and medium fertility the impact at 20 years is the same, 11% male and female (accept 10%), 2. In contrast, with low fertility there are fewer 20 year olds, 7.5%, 1. (c) Explain why countries may aim to increase the fertility rate. [5] Candidates may write generally in terms of fertility, or fertility rate (the number of live births per 1000 women aged 15–49 years in a given year); or total fertility rate (the average number of children born alive to a woman in her lifetime). Likely reasons are those for pro-natalist population policies, they include: • population decrease, a population not replacing itself, a total fertility rate (TFR) below 2.2 (replacement level) • concerns about dependency, current and future, and the need to support the dependent population, especially the aged in an ageing population • lack of labour, an inability to fill jobs, the need for more economically active people in the medium term • concerns about the impact of high levels of immigration on national identity • concerns about national security and the need to ‘be strong’ • underpopulation A full answer consists of two or more developed reasons.
Mark scheme, page 5
Page 5 Mark Scheme Syllabus Paper GCE AS/A LEVEL – May/June 2014 9696 12 © Cambridge International Examinations 2014 Population / Migration 5 Fig. 5 shows the average annual growth rate of population aged 15–24 years for Mexico, an LEDC, and the USA, an MEDC, 1950–2045 (actual and predicted). (a) Using Fig. 5, state the year in which: (i) the USA’s average annual growth rate was 4.3%; [1] 1960. (ii) the difference between the average annual growth rates of population for Mexico and the USA was the greatest. [1] 1985. (b) Using data from Fig. 5, compare the predictions for Mexico and the USA. [3] The key characteristic is the trends relative to the zero percent (no growth/stable) line on the graph. Mexico’s growth rate for 15–24 year olds is negative (around –1%) except briefly, 2010–12, whereas the trend for the USA is more complex with periods on, above, and slightly below the zero percent line. This alone done well, is worth full marks, or the crossover point in 2012, where Mexico’s average annual growth rate falls below that of the USA, could be credited 1. No explanations required. No comparisons – max 1 mark. (c) Explain the possible effects of emigration on population growth rates in LEDCs. [5] Emigration is age-specific in that young adults and the economically active/working age/ independent groups more generally, are more likely to emigrate (leave the country) than older or younger, dependent, age groups. The effect of this is to remove some of the reproductive cohort, with the direct effect of a fall in population growth rates. This may be enhanced if the migrant stream is imbalanced in terms of either gender. This also works to reduce population growth rates, for example as families are split, with one parent out of the country, or by delaying marriages. This explanation, done well, is worth full credit. Other points to credit may, however, include: • a longer term reducing effect in the next generation (from population momentum) • the influence of return migration, if it occurs • a compensatory upswing in birth rates to ‘replace’ emigrants
Mark scheme, page 6
Page 6 Mark Scheme Syllabus Paper GCE AS/A LEVEL – May/June 2014 9696 12 © Cambridge International Examinations 2014 Settlement dynamics 6 Figs 6A and 6B show a model of urban expansion into a rural area in East Asia. (a) Using Fig. 6A, describe the village and its location. [3] • traditional style houses mixed with trees • no visible services or infrastructure • on lower slopes of hillside, on terraces near the base of the hill • close to rice field (staple) below • sheltered by woodland on slopes above (source of fuelwood, food, etc.) Credit three characteristics, each 1, or three ‘soft’ points, total 2. (b) Give two differences between type I and type III urban growth shown in Fig. 6B. [2] I III low lying land/foot of hill upslope/middle of hill houses (5), all the same mixed: apartment blocks (2) and housing (1) low density/low rise higher density/some high rise uses available flat land requires levelling or site preparation on edge of built-up area higher amenity, woodland on both sides For each difference, clearly stated 1. (c) Explain some of the consequences for rural areas which result from urban growth. [5] This could be located anywhere in the world, MEDC or LEDC, so responses will vary in character, and also approach. Consequences for rural areas may be seen in terms of the consequences of rural-urban migration, or the encroachment of urban growth into rural areas. Likely discussion points include: • loss of community and traditional social fabric • population change • outmigration of some of the original rural residents • increase in pollution (air, water, land, noise) • environmental degradation, e.g. removal of trees, loss of wildlife • shift in values from rural/traditional to urban/modern • conservation of landmarks and traditional buildings • change in employment structure • change in services and infrastructure These may be positive or negative or both. A full answer consists of at least three developed consequences 5.
Mark scheme, page 7
Page 7 Mark Scheme Syllabus Paper GCE AS/A LEVEL – May/June 2014 9696 12 © Cambridge International Examinations 2014 Section B: The Physical Core Hydrology and fluvial geomorphology 7 (a) (i) Define the terms entrainment and traction as they apply to a river channel. [4] Entrainment is the process whereby sediment is picked up by the channel flow and is dependent upon the balance between the velocity and size of particle. (2) Traction is the rolling of larger material along the bed of the channel by the velocity of the channel flow. (2) (ii) Briefly describe how abrasion occurs in a river channel. [3] Abrasion occurs when the channel load is being transported and comes into contact with the channel bed and sides. This can produce erosion that widens and deepens the channel. (b) Draw a labelled diagram showing the landforms of a river floodplain. Explain the formation of two of the landforms you have shown in the diagram. [8] Flood plains are broad alluvial areas bounded by bluffs usually found in the lower parts of river courses. The channel meanders across the low gradient valley and may be characterised by cut off and ox bow lakes. The channel may be fringed by sand and gravel levees. Excess of ppt input higher up the river valley can induce over bank full conditions whereby silt laden water will spread across the flood plain depositing its sediment. The bluffs are the result of erosion induced by the meandering channel. Levees represent the initial deposit of coarser material on the river banks. Meandering produces cut offs and oxbow lakes through the usual mechanisms. Max. 4 marks without diagram. (c) Describe the landforms that occur in braided channels. To what extent are the processes in braided channels different from those found in meandering channels? [10] Braided channels are broad and characterised by a number of different diverging channels. In between are eyots and temporary unvegetated island of gravel and sand. These channels are developed in areas of relatively high channel slope and banks of unconsolidated materials. Braided channels are produced by changes in the level of discharge of streams that are heavily laden with sediment. Hence they are often found in areas of glacial melt water. The sides of the channel as well as the islands are easily eroded during times of high discharge and sediment is re-deposited when discharge declines. The energy levels are therefore different from meandering streams although the processes of deposition and erosion are the same. It is the context, velocity and discharge that are different and give rise to different channel forms and landforms.
Mark scheme, page 8
Page 8 Mark Scheme Syllabus Paper GCE AS/A LEVEL – May/June 2014 9696 12 © Cambridge International Examinations 2014 Level 3 Good account of braided channels and their landforms. Some assessment of processes (not landforms) that characterise the two types of channel. [8–10] Level 2 Probably utilises a diagram to show the features of a braided channel, but explanation more limited. Little emphasis on processes and more on things like thalweg and channel shape. [5–7] Level 1 Some account of depositional features within a braided channel but little explanation or description. No real attempt at differentiation with meandering beyond a straight/meandering contrast. [0–4] Atmosphere and weather 8 (a) (i) Define the terms evaporation and condensation. [4] Evaporation is the change of a liquid (water) to a gas (water vapour) due to heating. Condensation is the change of vapour (water vapour) to a liquid (ppt) due to cooling. (ii) Briefly describe the forms in which moisture is present in the atmosphere. [3] Moisture exists as a gas i.e. water vapour. As a liquid in the form of rain, dew, mist, fog (i.e. droplets suspended in the air). As a solid in the form of ice, frost, snowflakes. 1 × 3 marks. (b) Explain why urban areas have higher temperatures and more rainfall but less mist than surrounding rural areas. [8] All due to the urban heat island effect which can be explained in terms of the specific heat capacity of urban structures as compared with rural vegetation (also cooled by evapotranspiration). This leads to higher night time urban temperatures which can be exacerbated by anthropogenic heat sources. Higher urban temperatures encourage convectional uplift which together with hygroscopic nuclei allow the development of cumuliform clouds and hence rainfall. Rural areas display higher humidity levels which coupled with greater night time cooling will encourage the development of mist.
Mark scheme, page 9
Page 9 Mark Scheme Syllabus Paper GCE AS/A LEVEL – May/June 2014 9696 12 © Cambridge International Examinations 2014 (c) Explain the relationship between the lapse rates that occur with convectional and with orographic uplift of air. To what extent do convectional uplift and orographic uplift produce different types of weather? [10] Heating of an air parcel by convection will mean that air will rise and cool adiabatically at the DALR. So long as the DALR is less that the ELR, the air pocket will remain warmer than surrounding air and hence continue to rise and cooled to dew point. Condensation will occur and air will become saturated and further rise would be at the SALR. Orographic rise involves the forced ascent of air which may well have been stable i.e. the DALR is greater than the ELR such that the air parcel is cooler than the surrounding air. As long as the air is forced to rise dew point could be reached and further ascent allowed by the latent heat of vaporisation making the air warmer than its surrounding air, and hence continue to rise at the SALR. This is conditional instability. If the air is no longer forced to rise over hills or descends on the lee side, little condensation might occur. Should it continue to rise at the SALR then the weather effects will be the same as convectional uplift and may result in cumuliform clouds and possible rainfall. Level 3 Clear understanding of lapse rates, probably illustrated by appropriate diagrams. Distinction made between conditional and absolute instability. Weather implications simply described. [8–10] Level 2 A basic grasp of adiabatic cooling and its representation in terms of lapse rates. A somewhat hazy distinction between the lapse rates appropriate to conditional instability although weather implications will be described only in terms of clouds and rain. [5–7] Level 1 Little grasp of lapse rates and the response will mainly concern the production of orographic rainfall and convectional rainfall shown by simple diagrams. [0–4] Rocks and weathering 9 (a) (i) Define the terms spheroidal weathering and salt crystal growth. [4] Spheroidal weathering is the rounding of detached blocks of rock through chemical weathering at depth. Some credit for exfoliation. Crystal growth is development of salt crystals in pores, cracks in rock which then put pressure on the rock structure. 2 × 2 marks. (ii) Briefly describe how pressure release might contribute to the weathering of rocks. [3] Pressure release is brought about by the removal of overburden that then allows the rock structure to expand upwards producing weaknesses such as joints and cracks.
Mark scheme, page 10
Page 10 Mark Scheme Syllabus Paper GCE AS/A LEVEL – May/June 2014 9696 12 © Cambridge International Examinations 2014 (b) Explain how chemical weathering occurs in granite and limestone rocks. [8] Essentially through the processes of hydrolysis in the case of granite and carbonation in the case of limestone. Both should be explained. For good marks attention should be given to the nature and structures of the two rock types and mention should be made of climatic influences. Allow 3/5 or 5/3. (c) Explain how landforms are produced at the convergence of a continental plate and an oceanic plate. [10] The convergence of a continental and oceanic plate usually results in the subduction of the denser oceanic plate. This produces an oceanic trench where the crust is dragged down into the subduction zone. The melting of the subducted plate will produce magma which may be extruded through faults and cracks in the continental plate to form volcanoes. The sediments carried on the continental plate may be crushed and folded upwards to produce fold mountains. The mechanisms of convection currents and the process of subduction and crustal destruction should be explained. Much can be achieved through well annotated diagrams. Level 3 Good understanding of convergent plate margins and the processes. This may be achieved by accurate diagrams, attention should be paid to the formation of the landforms. [8–10] Level 2 Recognition of the landforms at convergent margins, but less clear as to their formation, particularly in the case of fold mountains. Subduction described, but with more limited processes. [5–7] Level 1 Rather poor diagrams with less than accurate landforms. Processes not well understood. [0–4]
Mark scheme, page 11
Page 11 Mark Scheme Syllabus Paper GCE AS/A LEVEL – May/June 2014 9696 12 © Cambridge International Examinations 2014 Section C: The Human Core Population 10 (a) (i) Define the term carrying capacity. [3] Carrying capacity is an ecological concept, it can be defined as, • the largest or maximum number of people 1 • that can be supported or sustained by 1 (if just ‘carried’ 0) • (the resources of) a given environment or place 1 (ii) With the help of examples, give two ways that population may exceed carrying capacity. [4] The dynamics are of population increase; where birth rate exceeds death rate, and where there is net migration gain, or both. Credit also where resources fail (e.g. food harvest) or become exhausted. Examples need to be identifiable, and not of the “e.g. Africa” sort. Credit 2/2 to 3/1. (b) Explain the causes of food shortages. [8] A combination of reasons, both physical/environmental and human, would perform well. Candidates may develop causes including: • physical/environmental e.g. drought, flood, pests, soil exhaustion • social/cultural e.g. rapid population increase, low farming skills • economic e.g. lack of investment, indebtedness, crops for export rather than food, transport issues • political e.g. government policy, war/conflict, governance (c) How far do you agree that the idea of a population ceiling is no longer useful? [10] An open opportunity for candidates to develop their own answer, such as by looking at Malthus and Boserup, J-curves and S-curves, etc. Candidates will probably: Level 3 Provide an effective assessment, identifying ways in which the idea is and is not useful today. Offer detailed exemplar support and structure the response well. [8–10] Level 2 Make a reasonable attempt which may contain good points, but remains partially developed. May only consider one side of the population-resource relationship. Assessment may be limited or brief. [5–7] Level 1 Offer only a few basic ideas, struggle to deal with the idea robustly, make little or no assessment. Fragments and notes remain in this level. [1–4]
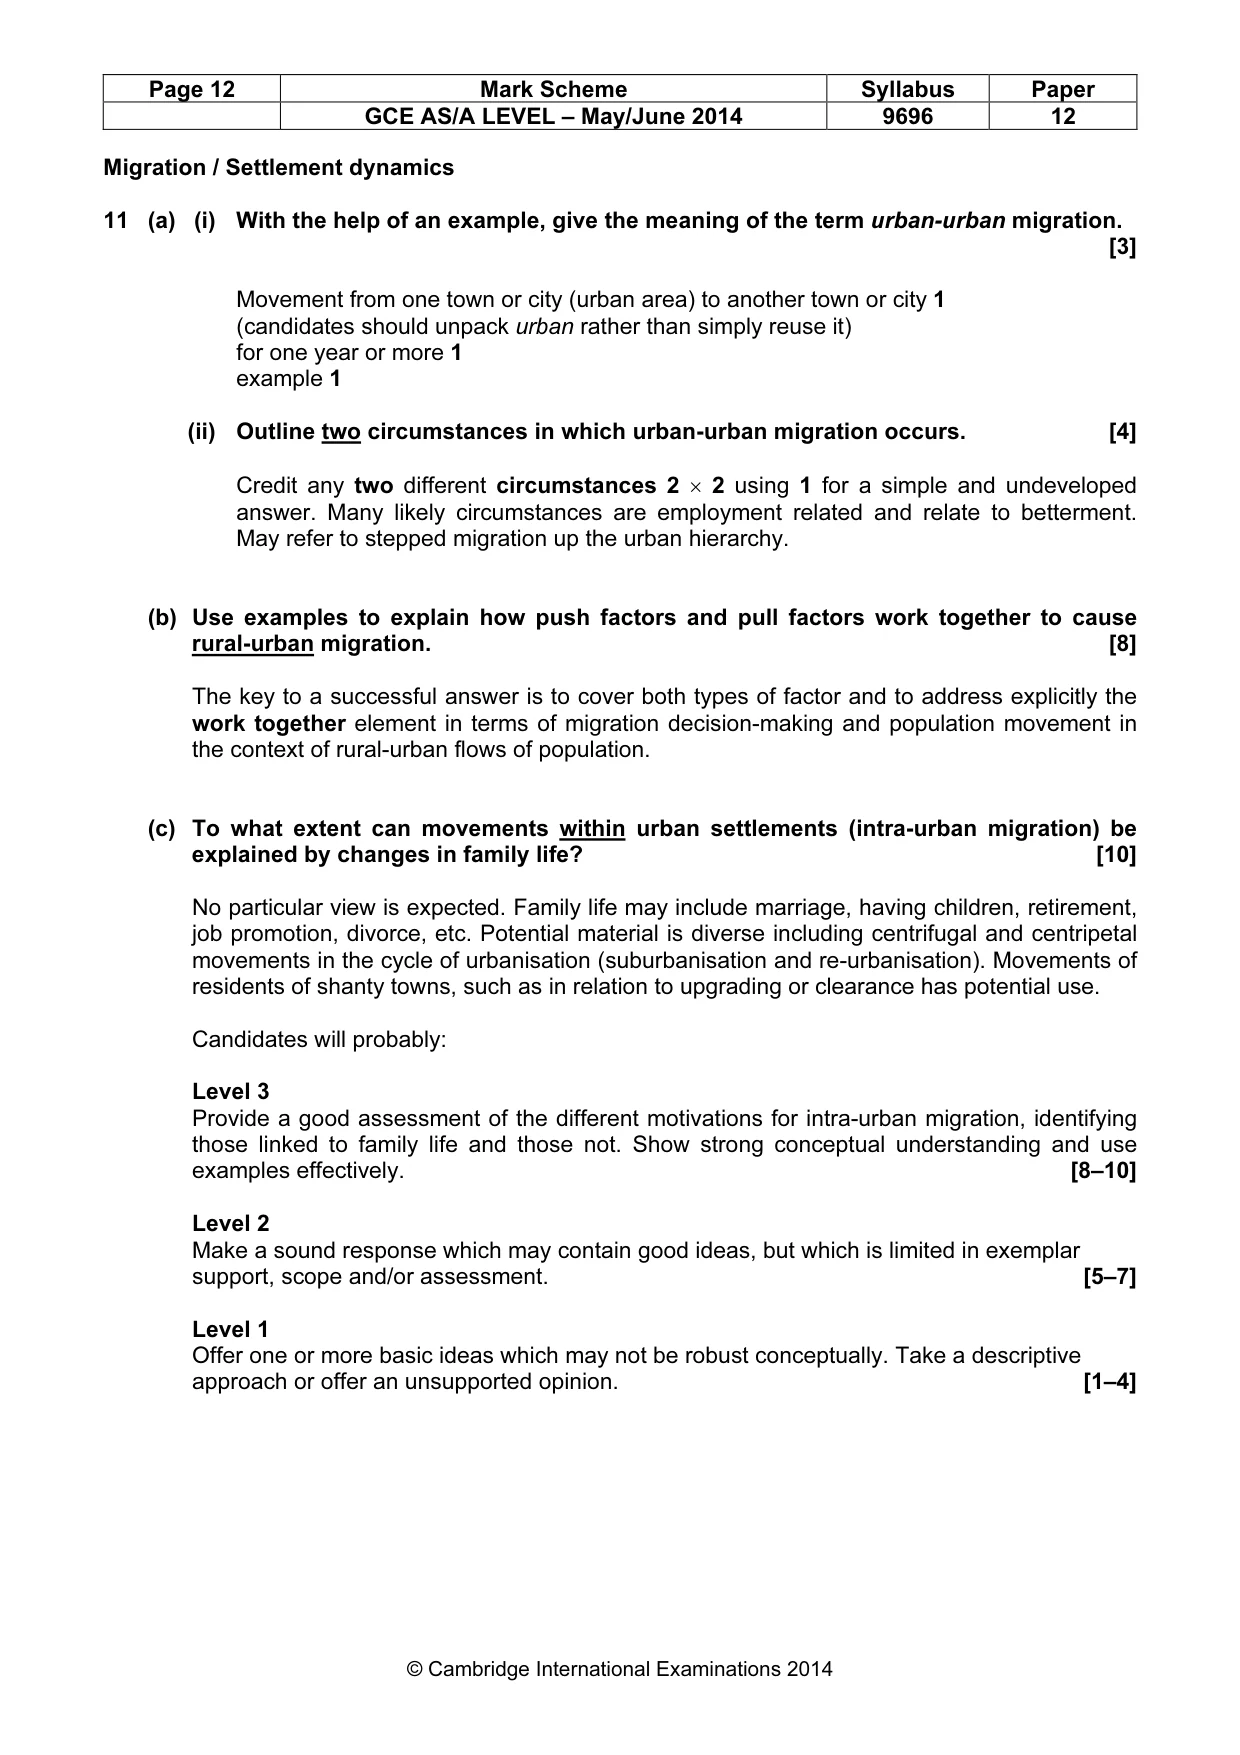
Mark scheme, page 12
Page 12 Mark Scheme Syllabus Paper GCE AS/A LEVEL – May/June 2014 9696 12 © Cambridge International Examinations 2014 Migration / Settlement dynamics 11 (a) (i) With the help of an example, give the meaning of the term urban-urban migration. [3] Movement from one town or city (urban area) to another town or city 1 (candidates should unpack urban rather than simply reuse it) for one year or more 1 example 1 (ii) Outline two circumstances in which urban-urban migration occurs. [4] Credit any two different circumstances 2 × 2 using 1 for a simple and undeveloped answer. Many likely circumstances are employment related and relate to betterment. May refer to stepped migration up the urban hierarchy. (b) Use examples to explain how push factors and pull factors work together to cause rural-urban migration. [8] The key to a successful answer is to cover both types of factor and to address explicitly the work together element in terms of migration decision-making and population movement in the context of rural-urban flows of population. (c) To what extent can movements within urban settlements (intra-urban migration) be explained by changes in family life? [10] No particular view is expected. Family life may include marriage, having children, retirement, job promotion, divorce, etc. Potential material is diverse including centrifugal and centripetal movements in the cycle of urbanisation (suburbanisation and re-urbanisation). Movements of residents of shanty towns, such as in relation to upgrading or clearance has potential use. Candidates will probably: Level 3 Provide a good assessment of the different motivations for intra-urban migration, identifying those linked to family life and those not. Show strong conceptual understanding and use examples effectively. [8–10] Level 2 Make a sound response which may contain good ideas, but which is limited in exemplar support, scope and/or assessment. [5–7] Level 1 Offer one or more basic ideas which may not be robust conceptually. Take a descriptive approach or offer an unsupported opinion. [1–4]
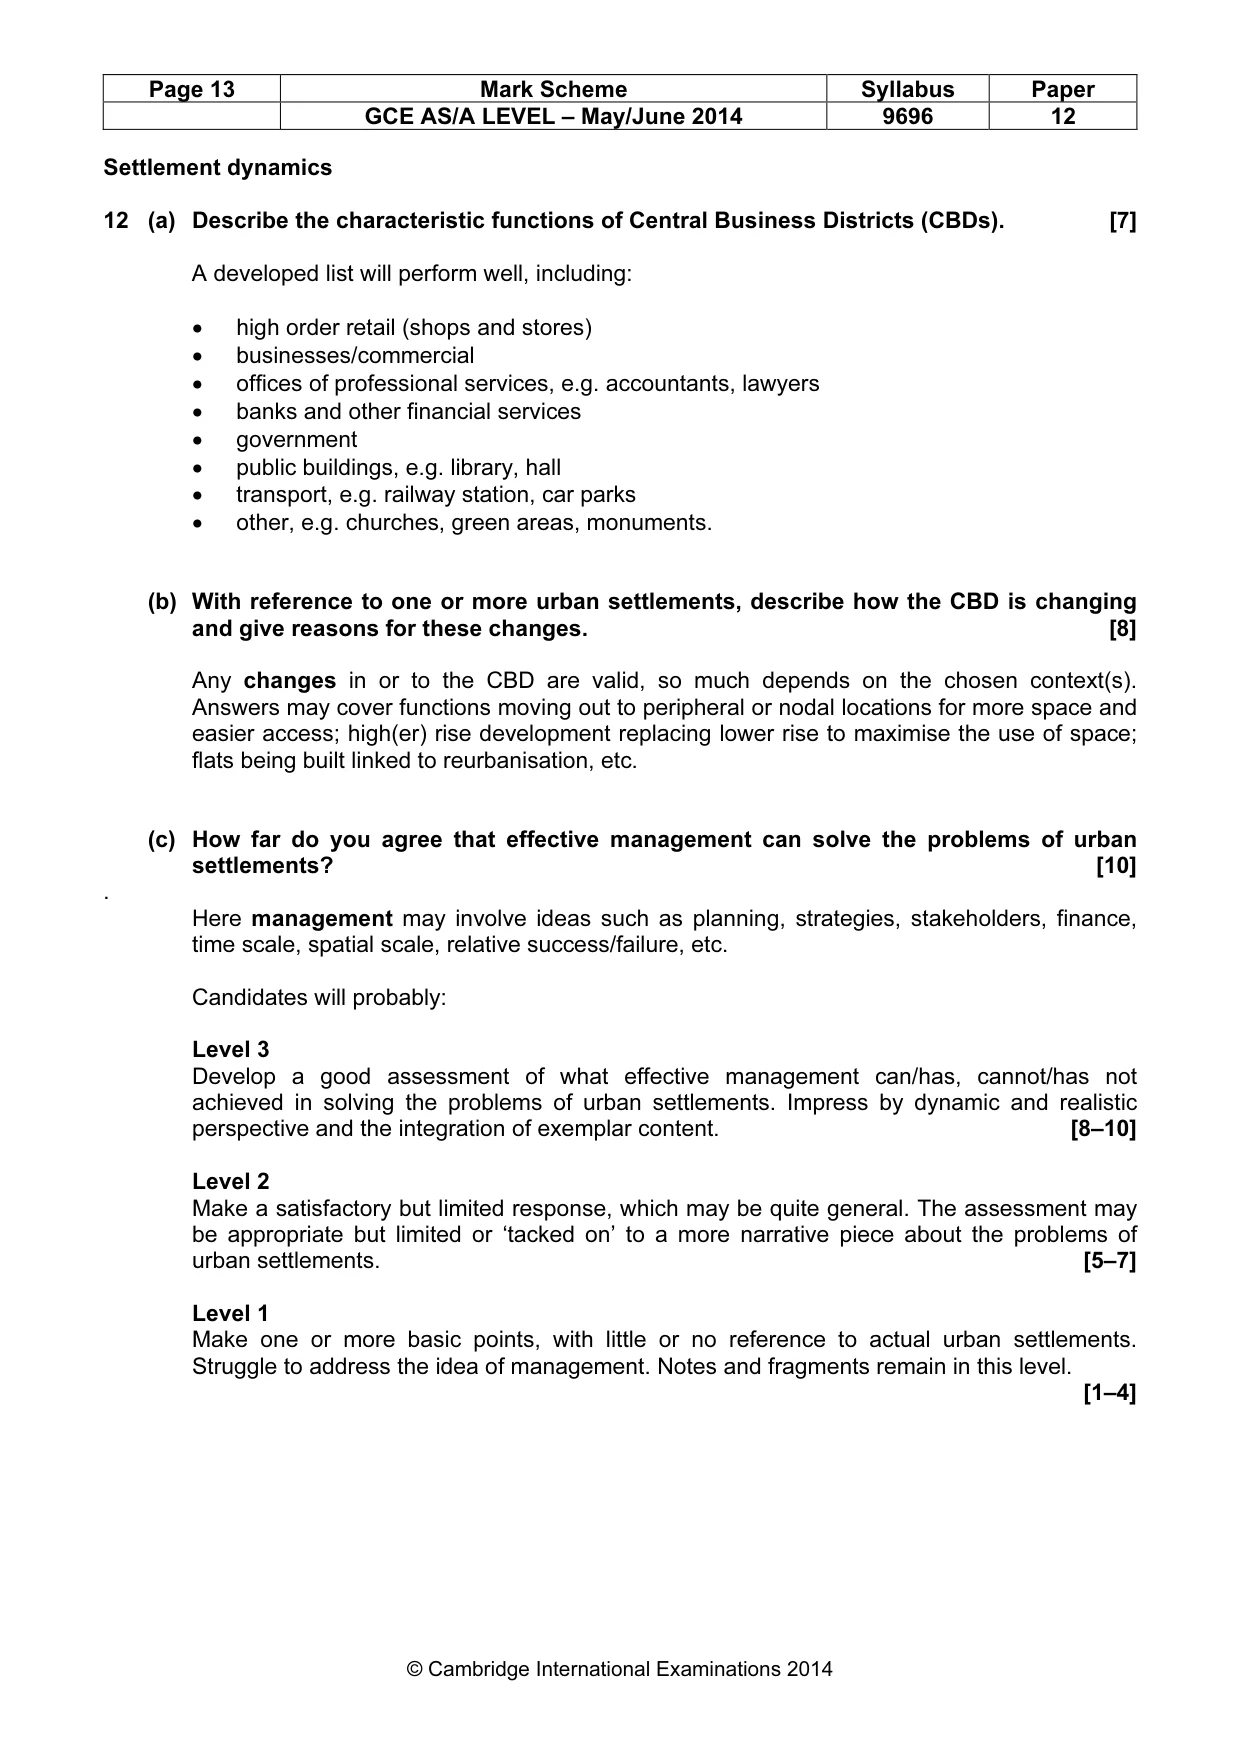
Mark scheme, page 13
Page 13 Mark Scheme Syllabus Paper GCE AS/A LEVEL – May/June 2014 9696 12 © Cambridge International Examinations 2014 Settlement dynamics 12 (a) Describe the characteristic functions of Central Business Districts (CBDs). [7] A developed list will perform well, including: • high order retail (shops and stores) • businesses/commercial • offices of professional services, e.g. accountants, lawyers • banks and other financial services • government • public buildings, e.g. library, hall • transport, e.g. railway station, car parks • other, e.g. churches, green areas, monuments. (b) With reference to one or more urban settlements, describe how the CBD is changing and give reasons for these changes. [8] Any changes in or to the CBD are valid, so much depends on the chosen context(s). Answers may cover functions moving out to peripheral or nodal locations for more space and easier access; high(er) rise development replacing lower rise to maximise the use of space; flats being built linked to reurbanisation, etc. (c) How far do you agree that effective management can solve the problems of urban settlements? [10] . Here management may involve ideas such as planning, strategies, stakeholders, finance, time scale, spatial scale, relative success/failure, etc. Candidates will probably: Level 3 Develop a good assessment of what effective management can/has, cannot/has not achieved in solving the problems of urban settlements. Impress by dynamic and realistic perspective and the integration of exemplar content. [8–10] Level 2 Make a satisfactory but limited response, which may be quite general. The assessment may be appropriate but limited or ‘tacked on’ to a more narrative piece about the problems of urban settlements. [5–7] Level 1 Make one or more basic points, with little or no reference to actual urban settlements. Struggle to address the idea of management. Notes and fragments remain in this level. [1–4]
What you needed in this session
Cambridge’s own grade thresholds for 2014 May/June, Paper 1 · Variant 2. A higher threshold means an easier paper — the bar moves with how the cohort did.