Cambridge A Level Environmental Management (AS only) 8291 — 2018 Oct/Nov Paper 2 · Variant 1
8291/21/O/N/18 · 5 questions · 160 marks · ≈180 min
The question paper and its mark scheme, free to read here and free to download. This is Cambridge’s own paper, exactly as it was sat.
Question paper16 pages

Mark scheme19 pages
Answers below. Sit the paper first if you are practising.
Questions as text
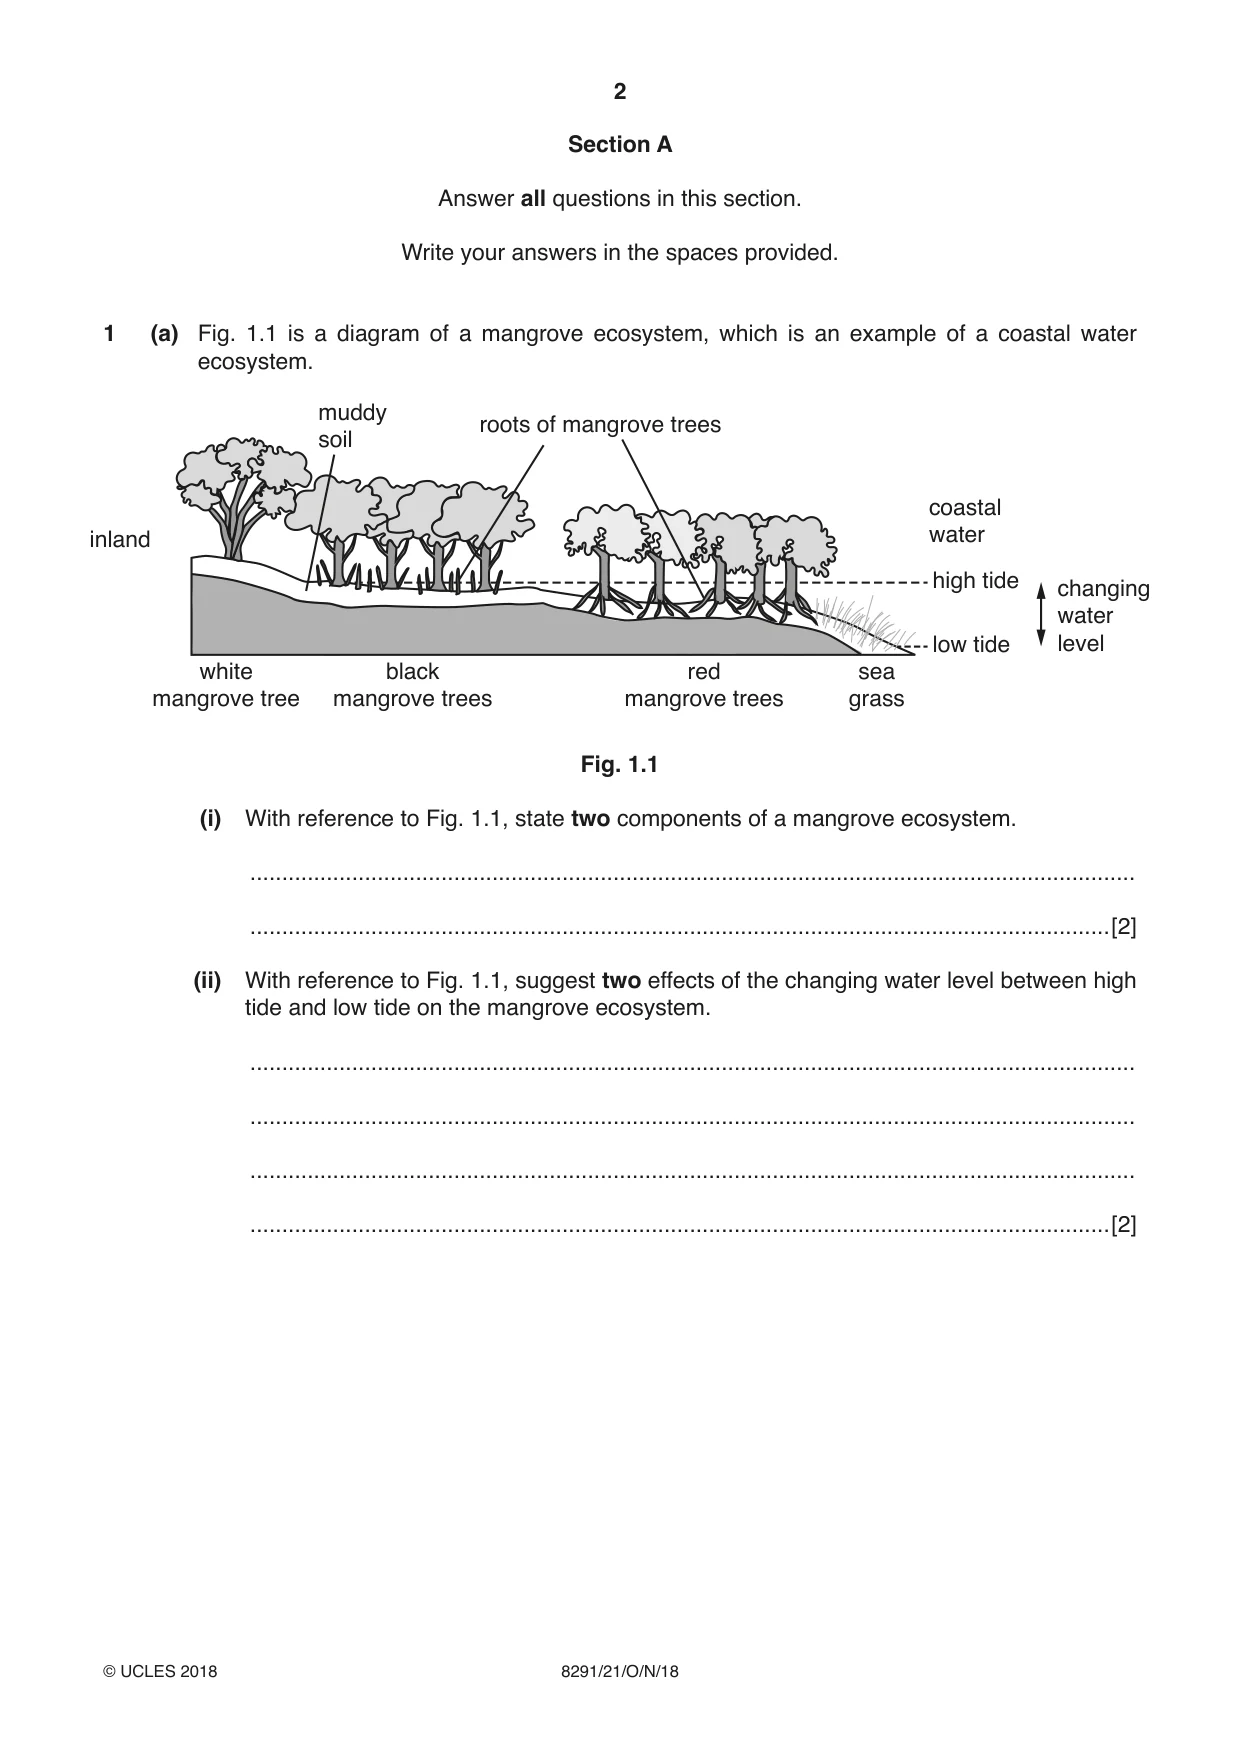
Q1 · A diagram of a mangrove ecosystem, which is an example of a coastal water ecosystem
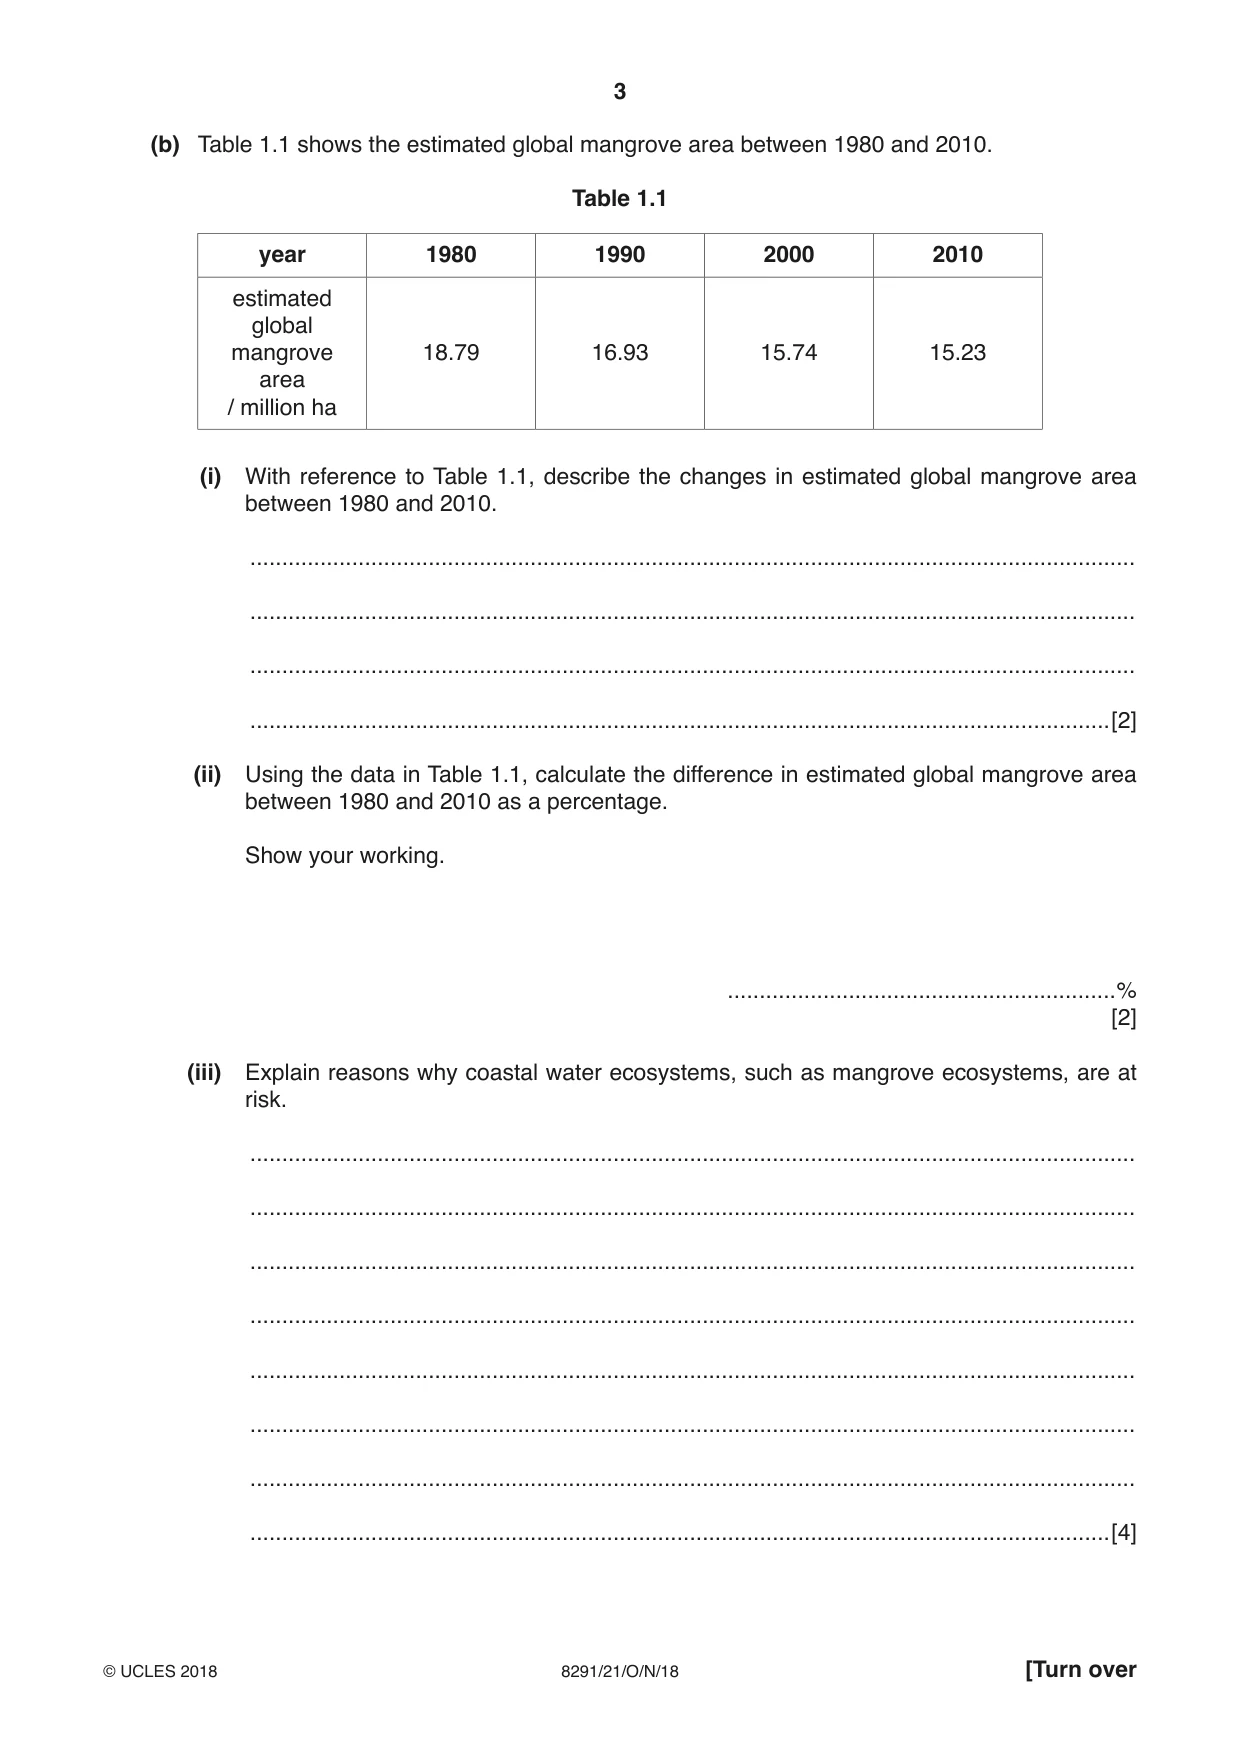
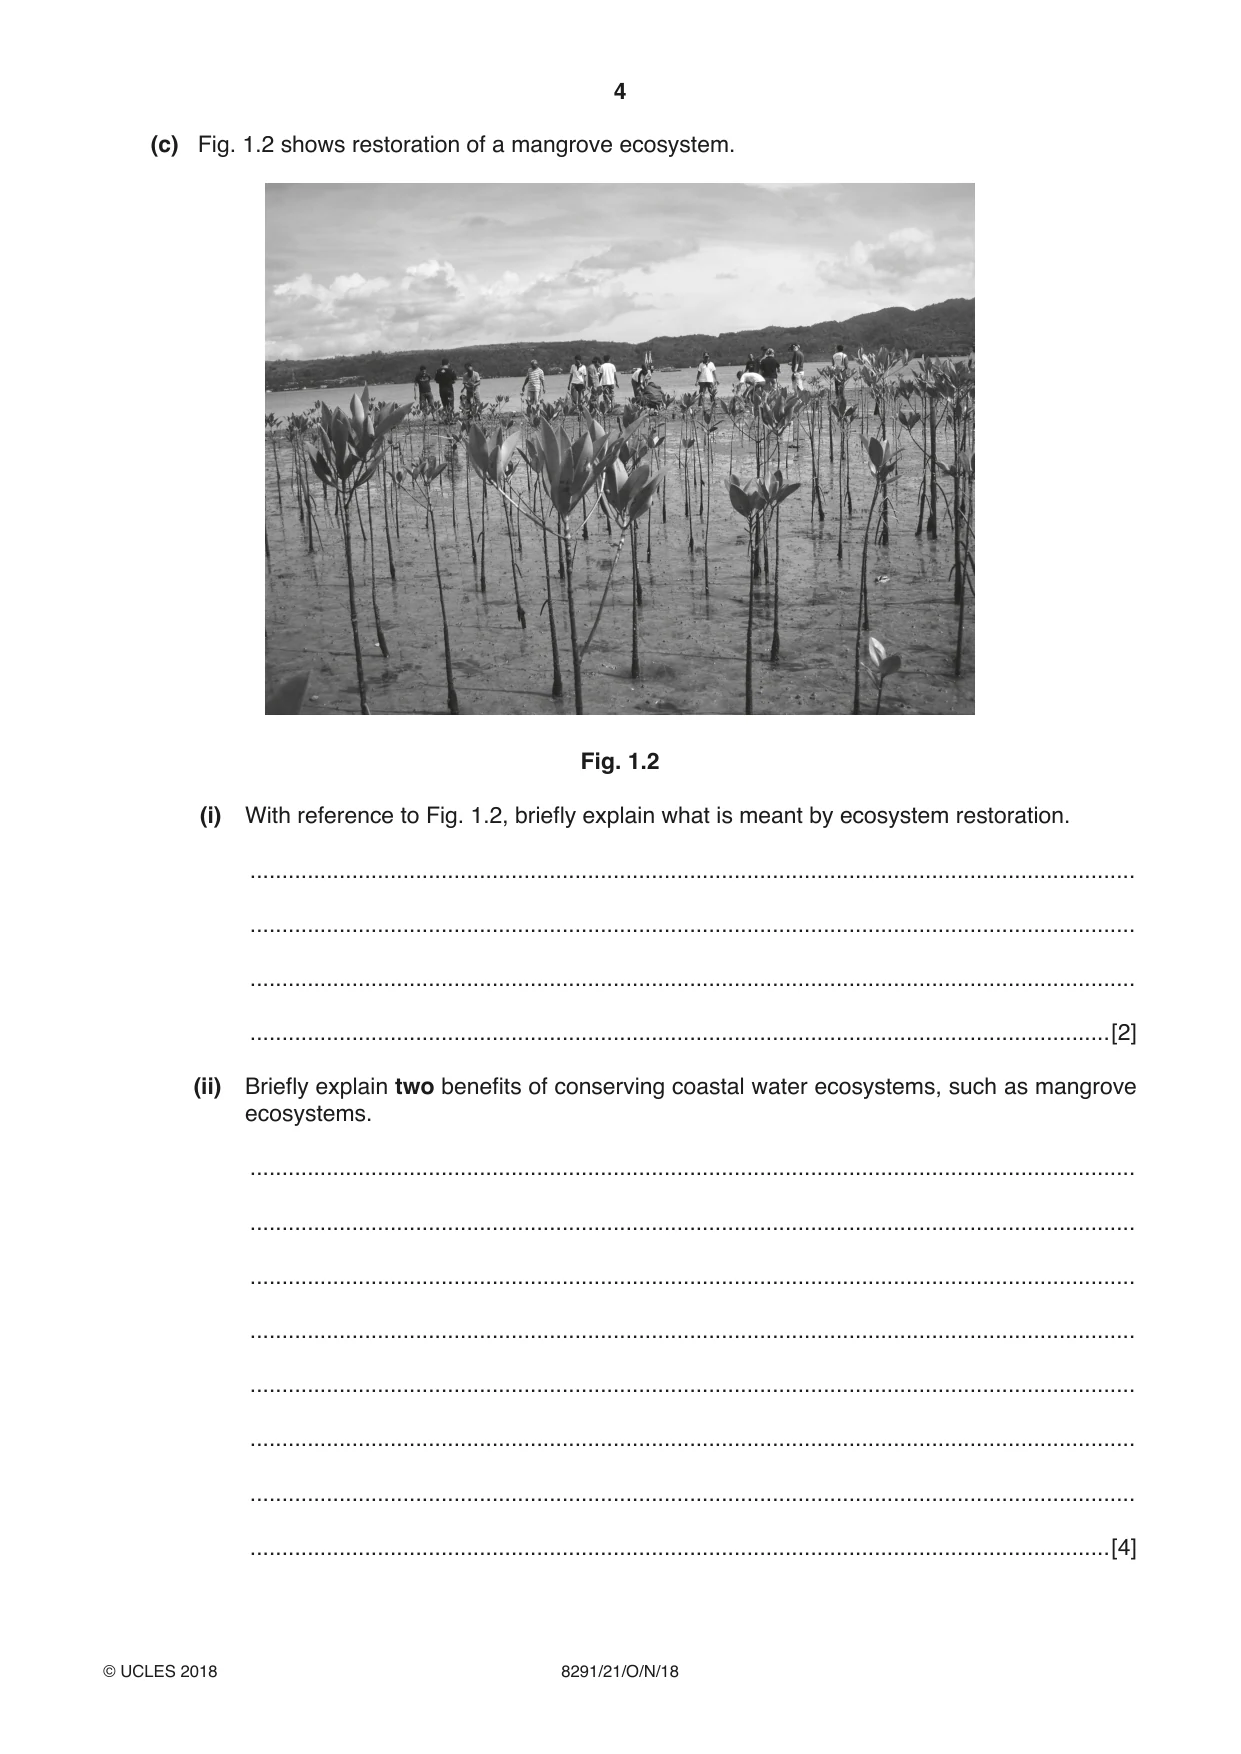
1 (a) Fig. 1.1 is a diagram of a mangrove ecosystem, which is an example of a coastal water ecosystem. muddy roots of mangrove trees soil coastal inland water high tide changing water low tide level white black red sea mangrove tree mangrove trees mangrove trees grass Fig. 1.1 (i) With reference to Fig. 1.1, state two components of a mangrove ecosystem. ........................................................................................................................................... .......................................................................................................................................[2] (ii) With reference to Fig. 1.1, suggest two effects of the changing water level between high tide and low tide on the mangrove ecosystem. ........................................................................................................................................... ........................................................................................................................................... ........................................................................................................................................... .......................................................................................................................................[2] (b) Table 1.1 shows the estimated global mangrove area between 1980 and 2010. Table 1.1 year 1980 1990 2000 2010 estimated global mangrove 18.79 16.93 15.74 15.23 area / million ha (i) With reference to Table 1.1, describe the changes in estimated global mangrove area between 1980 and 2010. ........................................................................................................................................... ........................................................................................................................................... ........................................................................................................................................... .......................................................................................................................................[2] (ii) Using the data in Table 1.1, calculate the difference in estimated global mangrove area between 1980 and 2010 as a percentage. Show your working. .............................................................% [2] (iii) Explain reasons why coastal water ecosystems, such as mangrove ecosystems, are at risk. ........................................................................................................................................... ........................................................................................................................................... ........................................................................................................................................... ........................................................................................................................................... ........................................................................................................................................... ........................................................................................................................................... ........................................................................................................................................... .......................................................................................................................................[4] (c) Fig. 1.2 shows restoration of a mangrove ecosystem. Fig. 1.2 (i) With reference to Fig. 1.2, briefly explain what is meant by ecosystem restoration. ........................................................................................................................................... ........................................................................................................................................... ........................................................................................................................................... .......................................................................................................................................[2] (ii) Briefly explain two benefits of conserving coastal water ecosystems, such as mangrove ecosystems. ........................................................................................................................................... ........................................................................................................................................... ........................................................................................................................................... ........................................................................................................................................... ........................................................................................................................................... ........................................................................................................................................... ........................................................................................................................................... .......................................................................................................................................[4] (iii) Suggest one benefit of community involvement in conservation of ecosystems. ........................................................................................................................................... ........................................................................................................................................... ........................................................................................................................................... .......................................................................................................................................[2] [Total: 20]
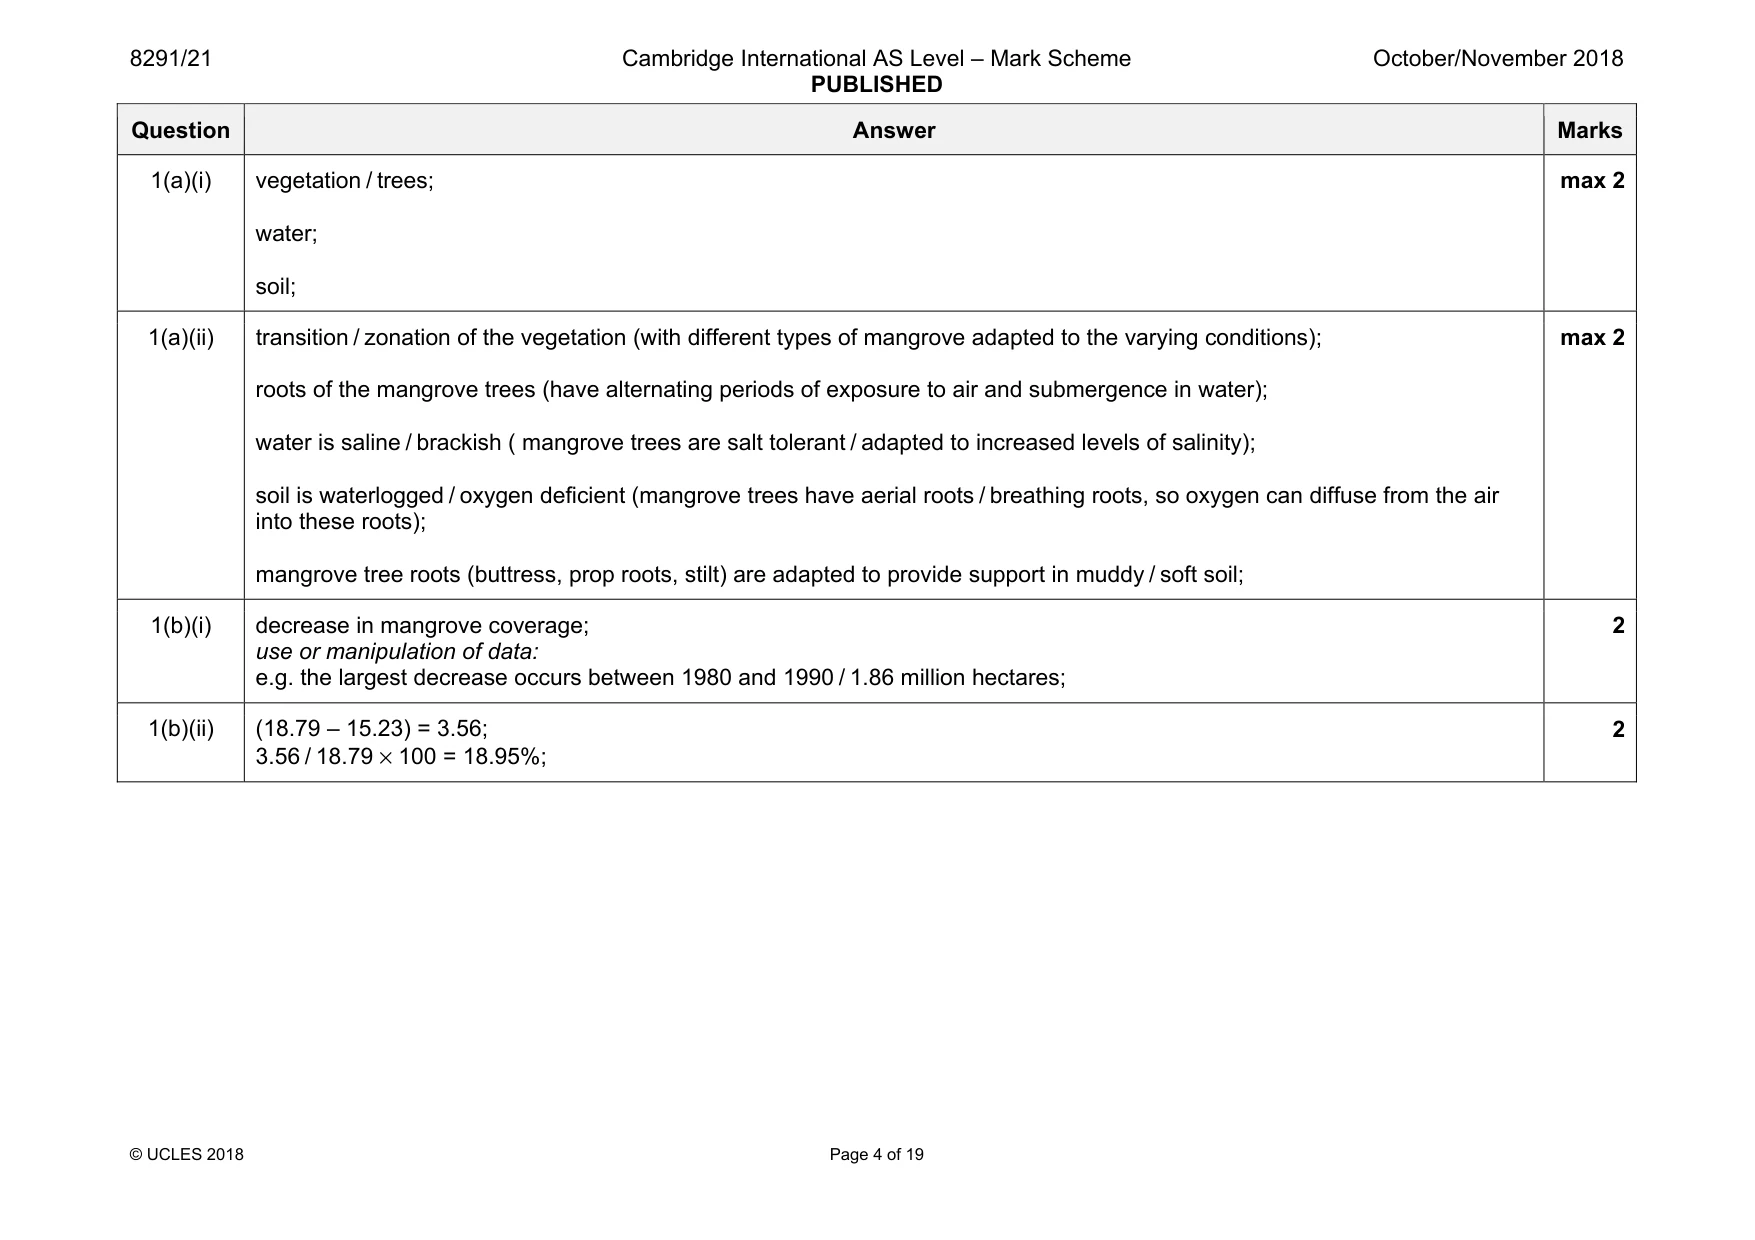
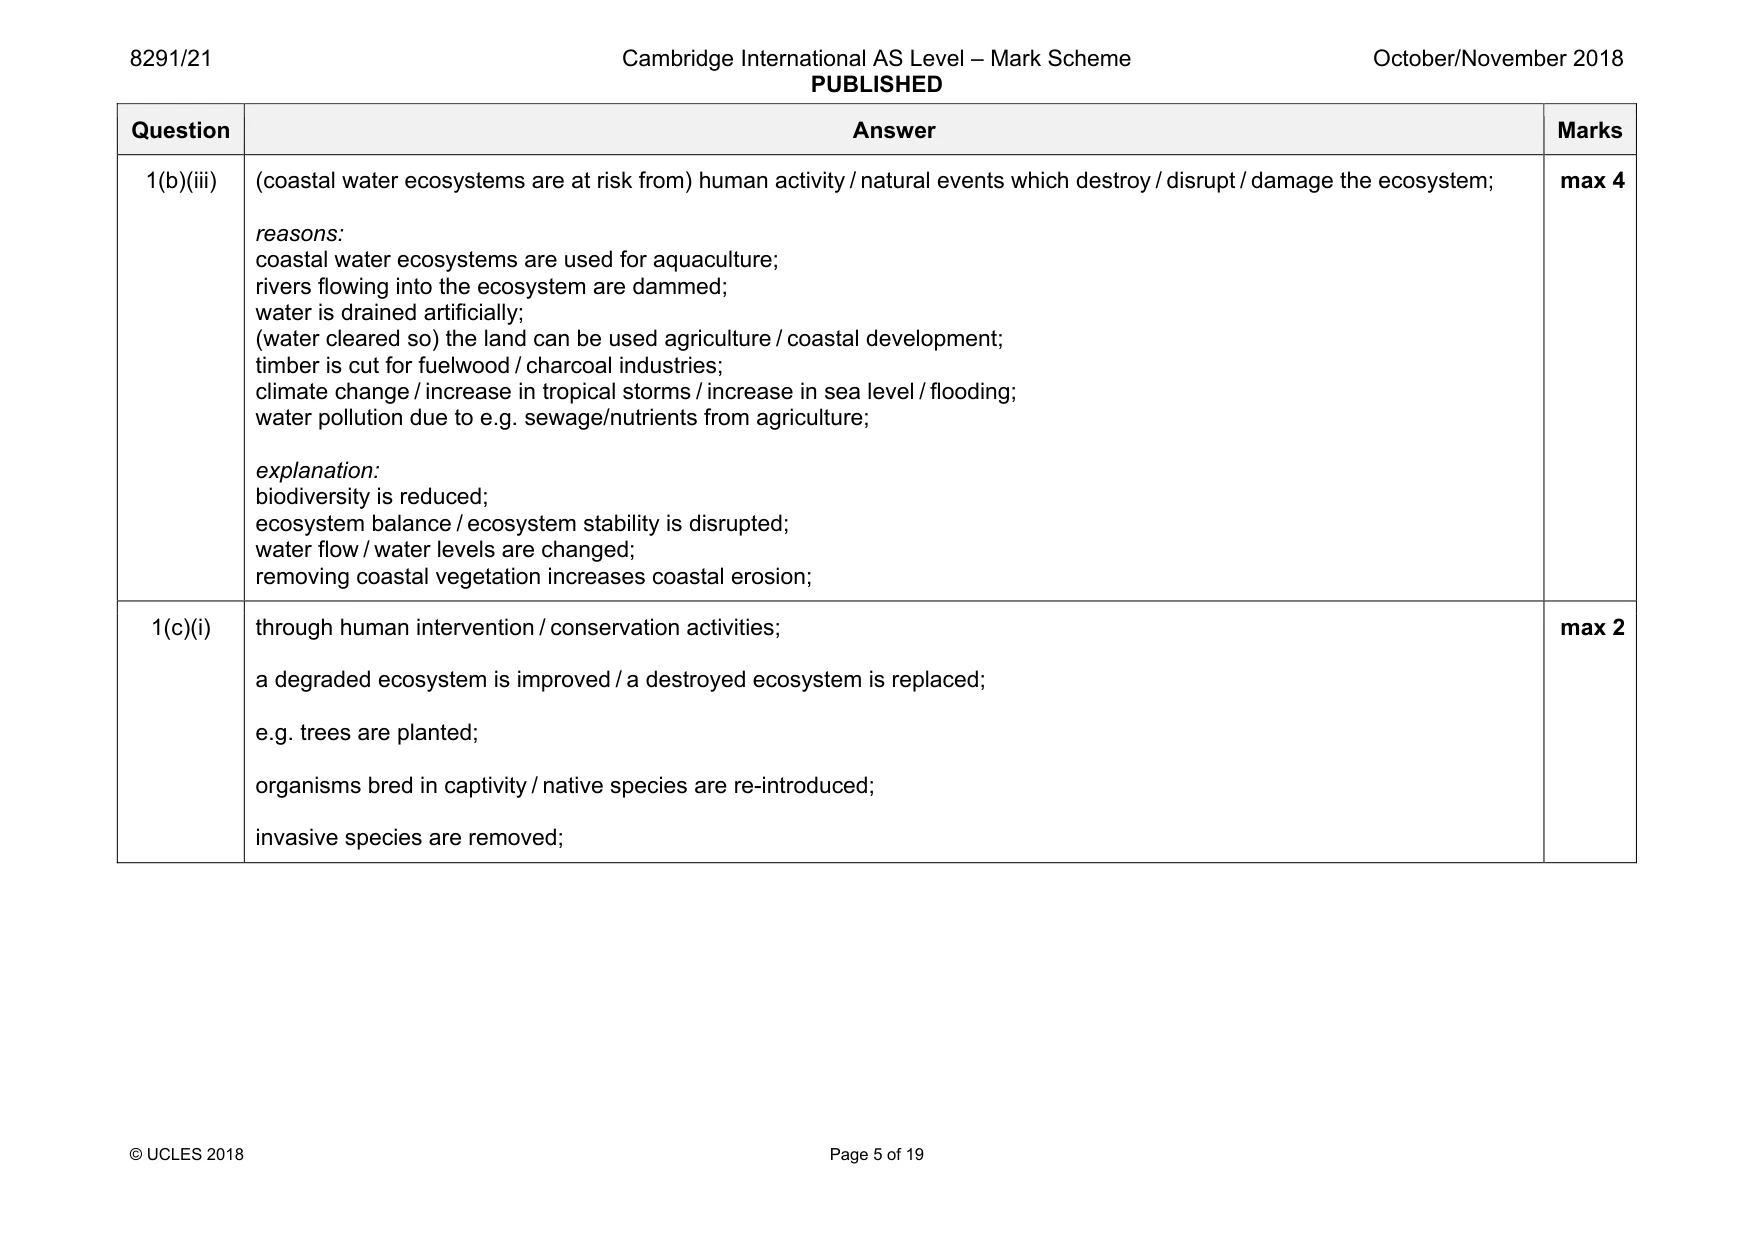
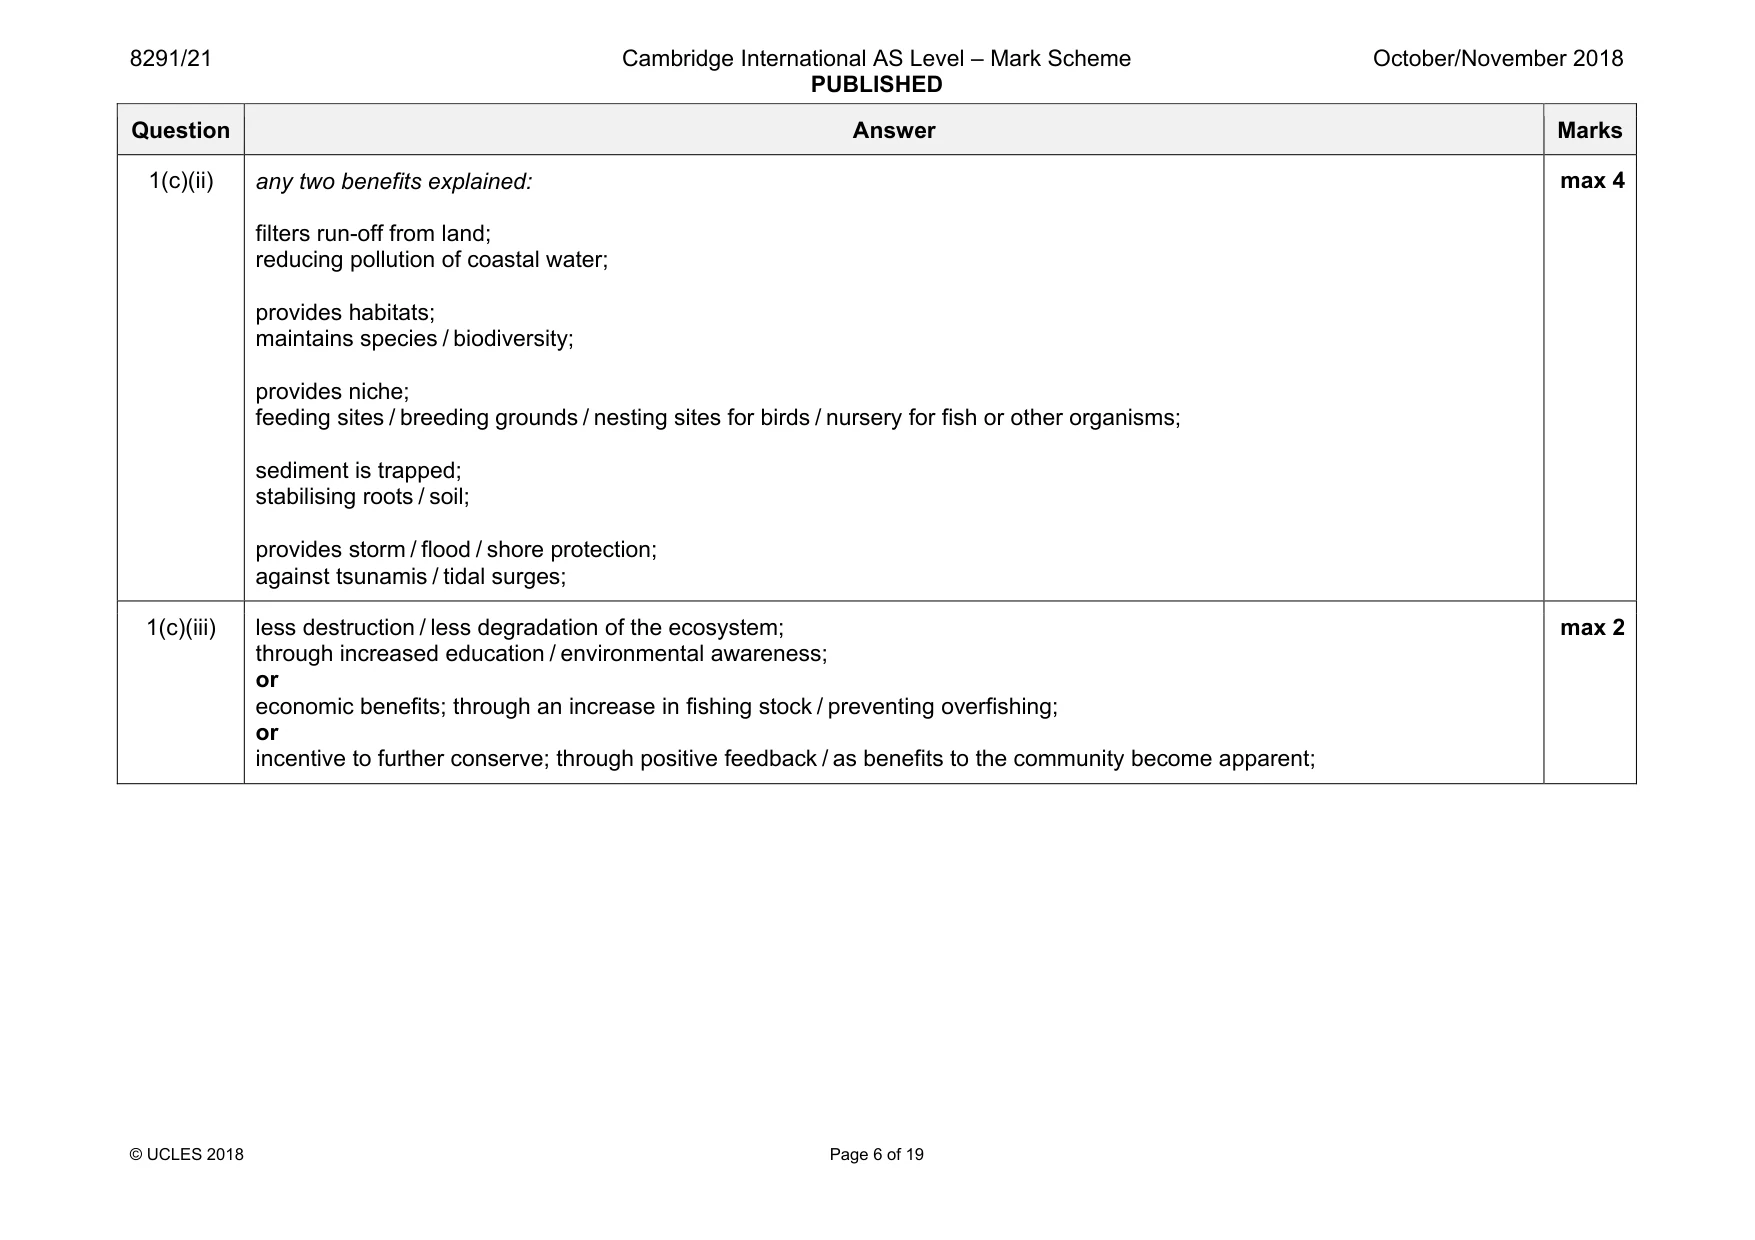
Mark scheme: 1(a)(i) vegetation / trees; water; soil; max 2 1(a)(ii) transition / zonation of the vegetation (with different types of mangrove adapted to the varying conditions); roots of the mangrove trees (have alternating periods of exposure to air and submergence in water); water is saline / brackish ( mangrove trees are salt tolerant / adapted to increased levels of salinity); soil is waterlogged / oxygen deficient (mangrove trees have aerial roots / breathing roots, so oxygen can diffuse from the air into these roots); mangrove tree roots (buttress, prop roots, stilt) are adapted to provide support in muddy / soft soil; max 2 1(b)(i) decrease in mangrove coverage; use or manipulation of data: e.g. the largest decrease occurs between 1980 and 1990 / 1.86 million hectares; 2 1(b)(ii) (18.79 – 15.23) = 3.56; 3.56 / 18.79 × 100 = 18.95%; 2 Question Answer Marks 1(b)(iii) (coastal water ecosystems are at risk from) human activity / natural events which destroy / disrupt / damage the ecosystem; reasons: coastal water ecosystems are used for aquaculture; rivers flowing into the ecosystem are dammed; water is drained artificially; (water cleared so) the land can be used agriculture / coastal development; timber is cut for fuelwood / charcoal industries; climate change / increase in tropical storms / increase in sea level / flooding; water pollution due to e.g. sewage/nutrients from agriculture; explanation: biodiversity is reduced; ecosystem balance / ecosystem stability is disrupted; water flow / water levels are changed; removing coastal vegetation increases coastal erosion; max 4 1(c)(i) through human intervention / conservation activities; a degraded ecosystem is improved / a destroyed ecosystem is replaced; e.g. trees are planted; organisms bred in captivity / native species are re-introduced; invasive species are removed; max 2 Question Answer Marks 1(c)(ii) any two benefits explained: filters run-off from land; reducing pollution of coastal water; provides habitats; maintains species / biodiversity; provides niche; feeding sites / breeding grounds / nesting sites for birds / nursery for fish or other organisms; sediment is trapped; stabilising roots / soil; provides storm / flood / shore protection; against tsunamis / tidal surges; max 4 1(c)(iii) less destruction / less degradation of the ecosystem; through increased education / environmental awareness; or economic benefits; through an increase in fishing stock / preventing overfishing; or incentive to further conserve; through positive feedback / as benefits to the community become apparent; max 2
Q2 · Two types of aquifer
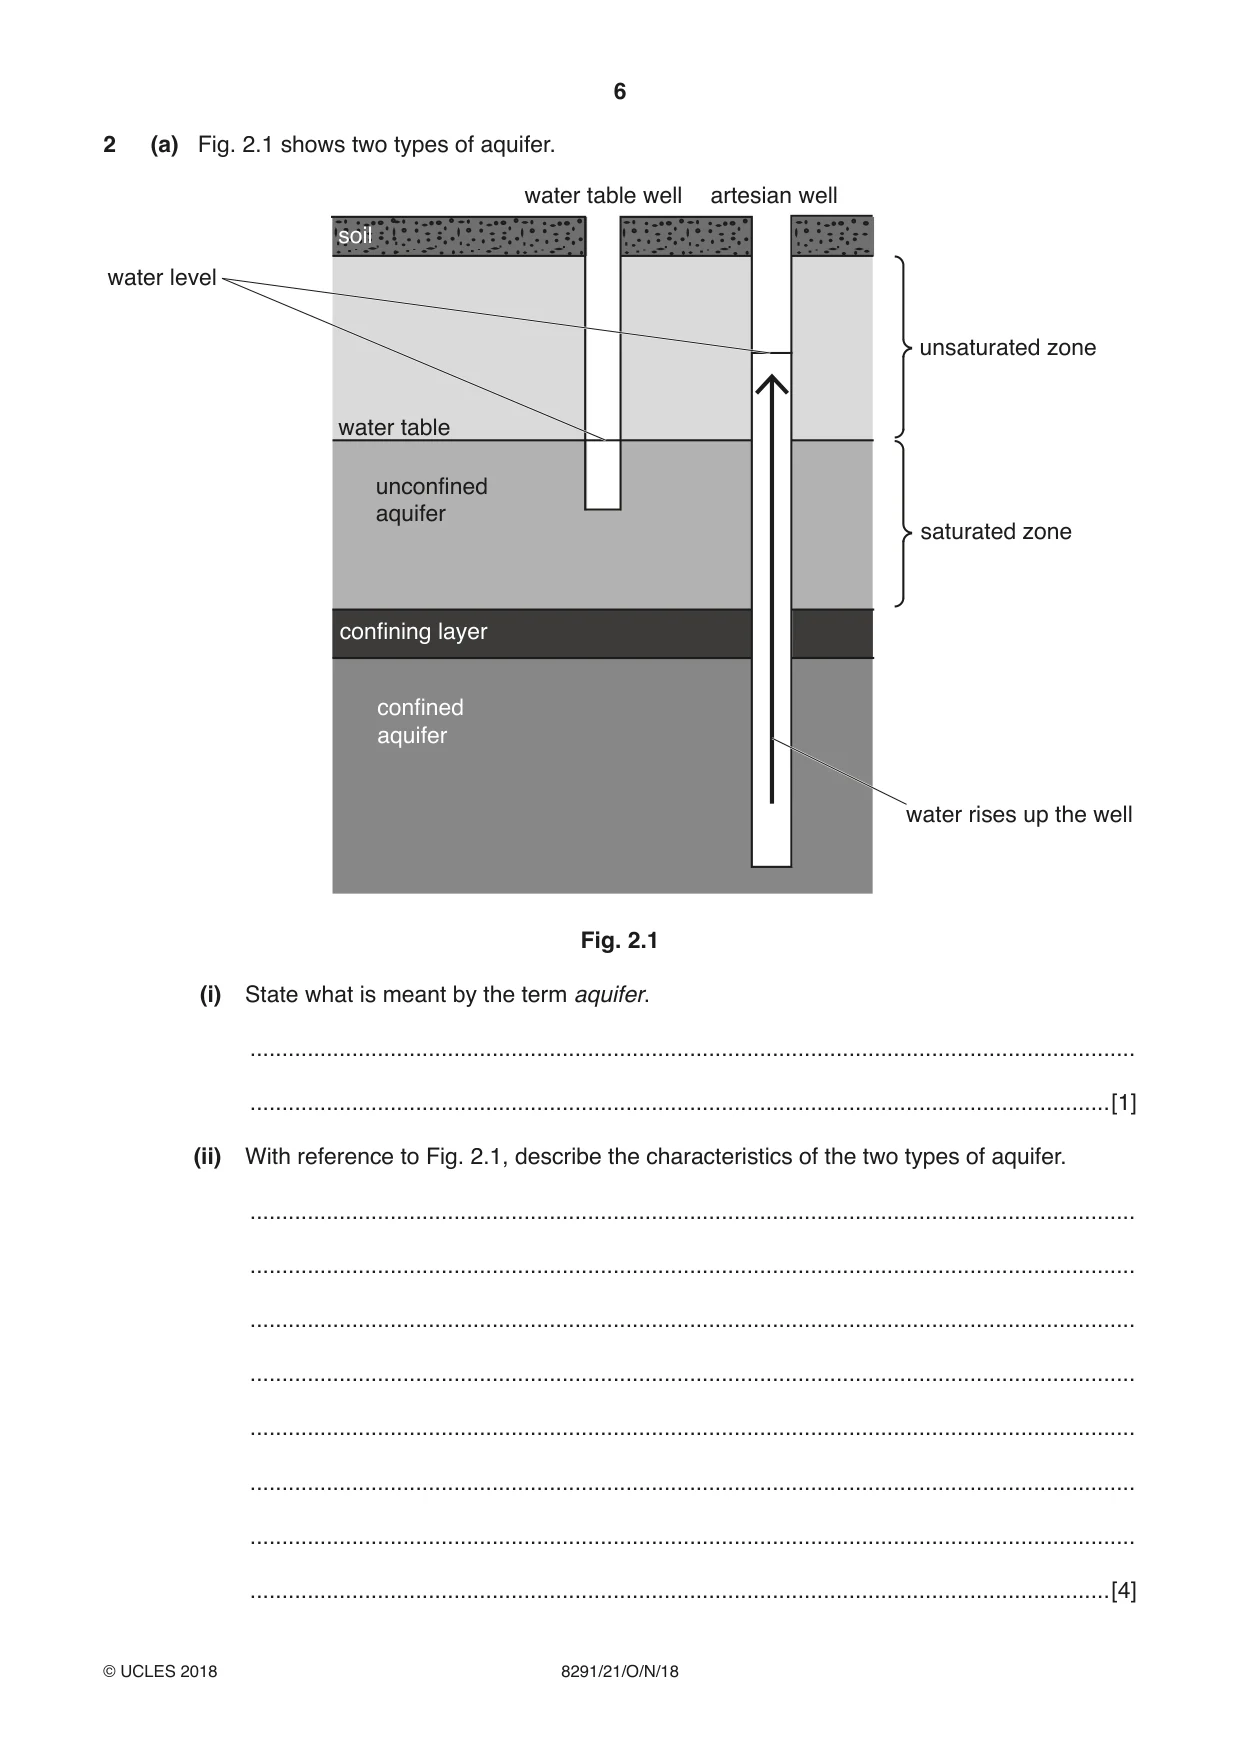
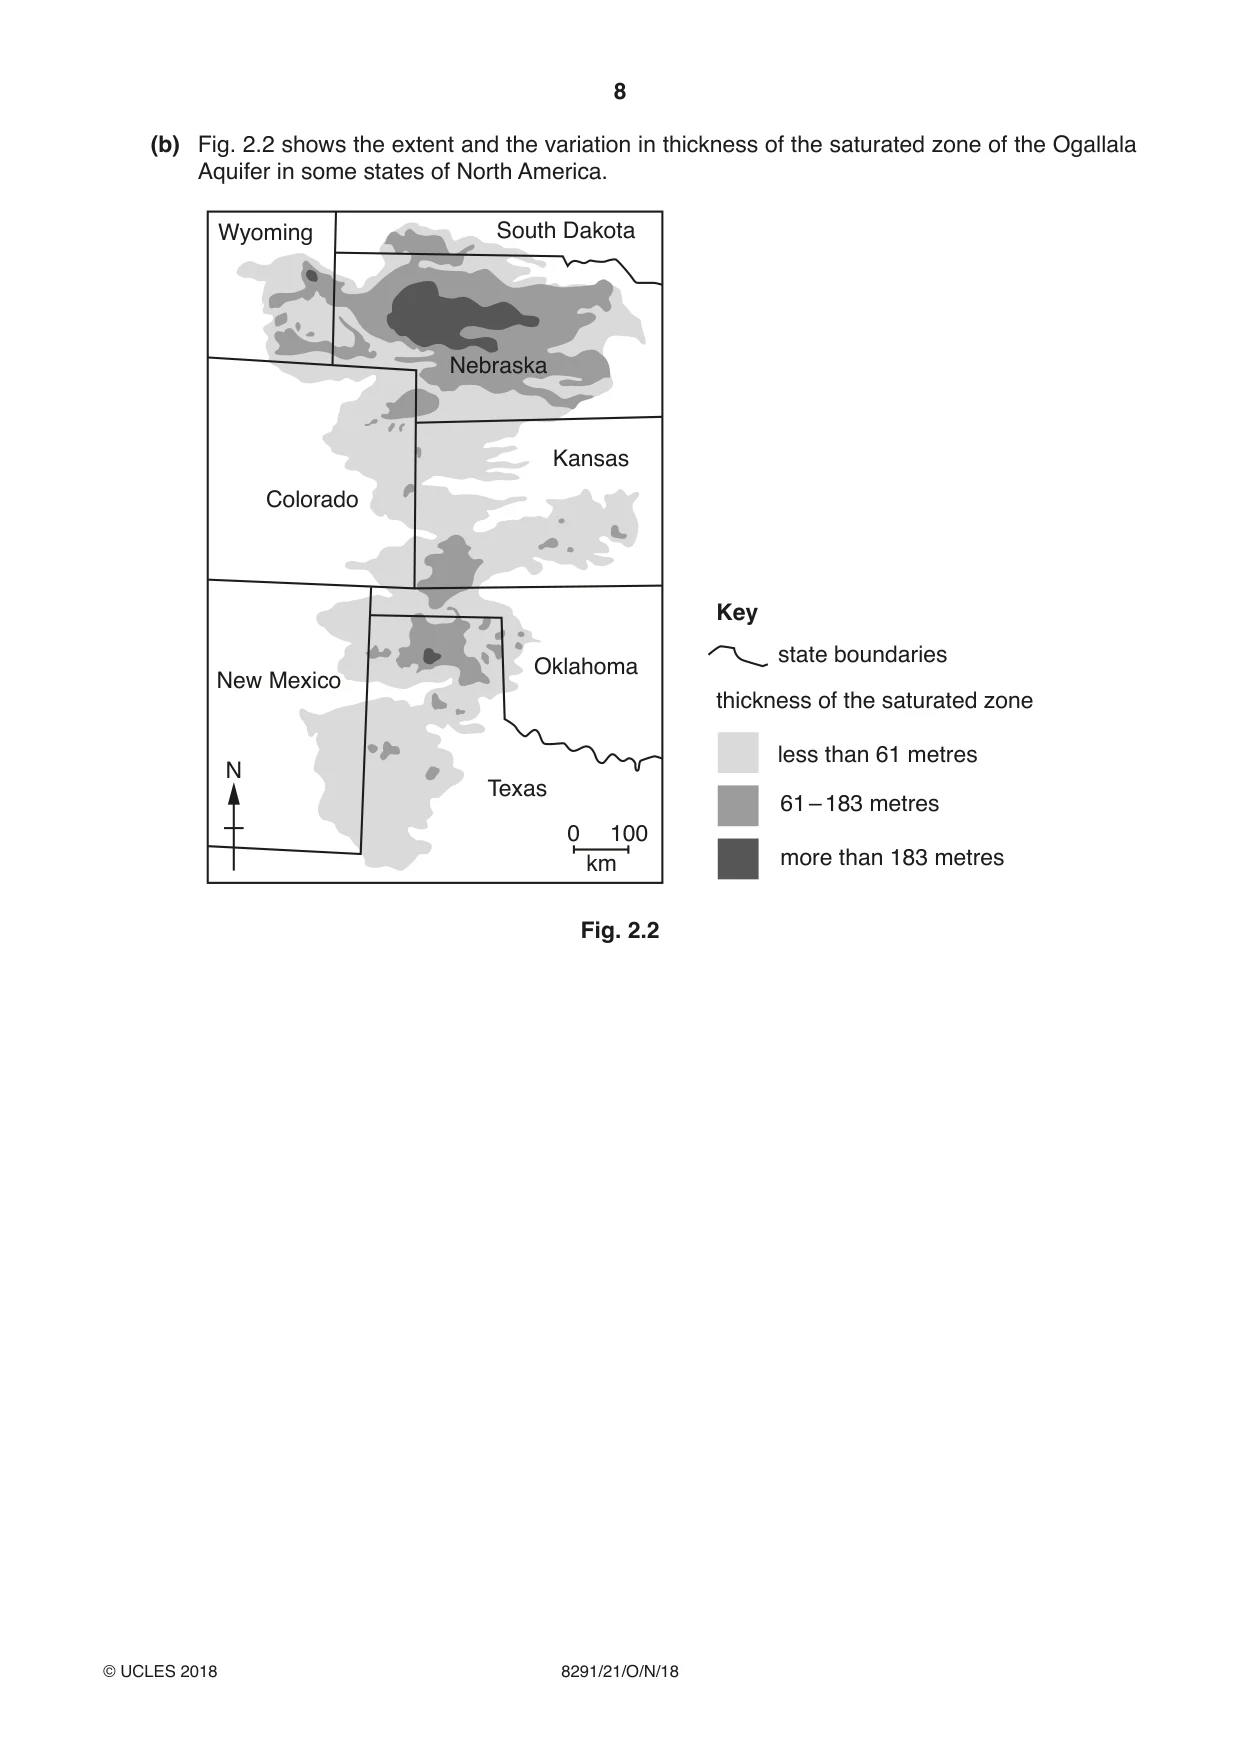
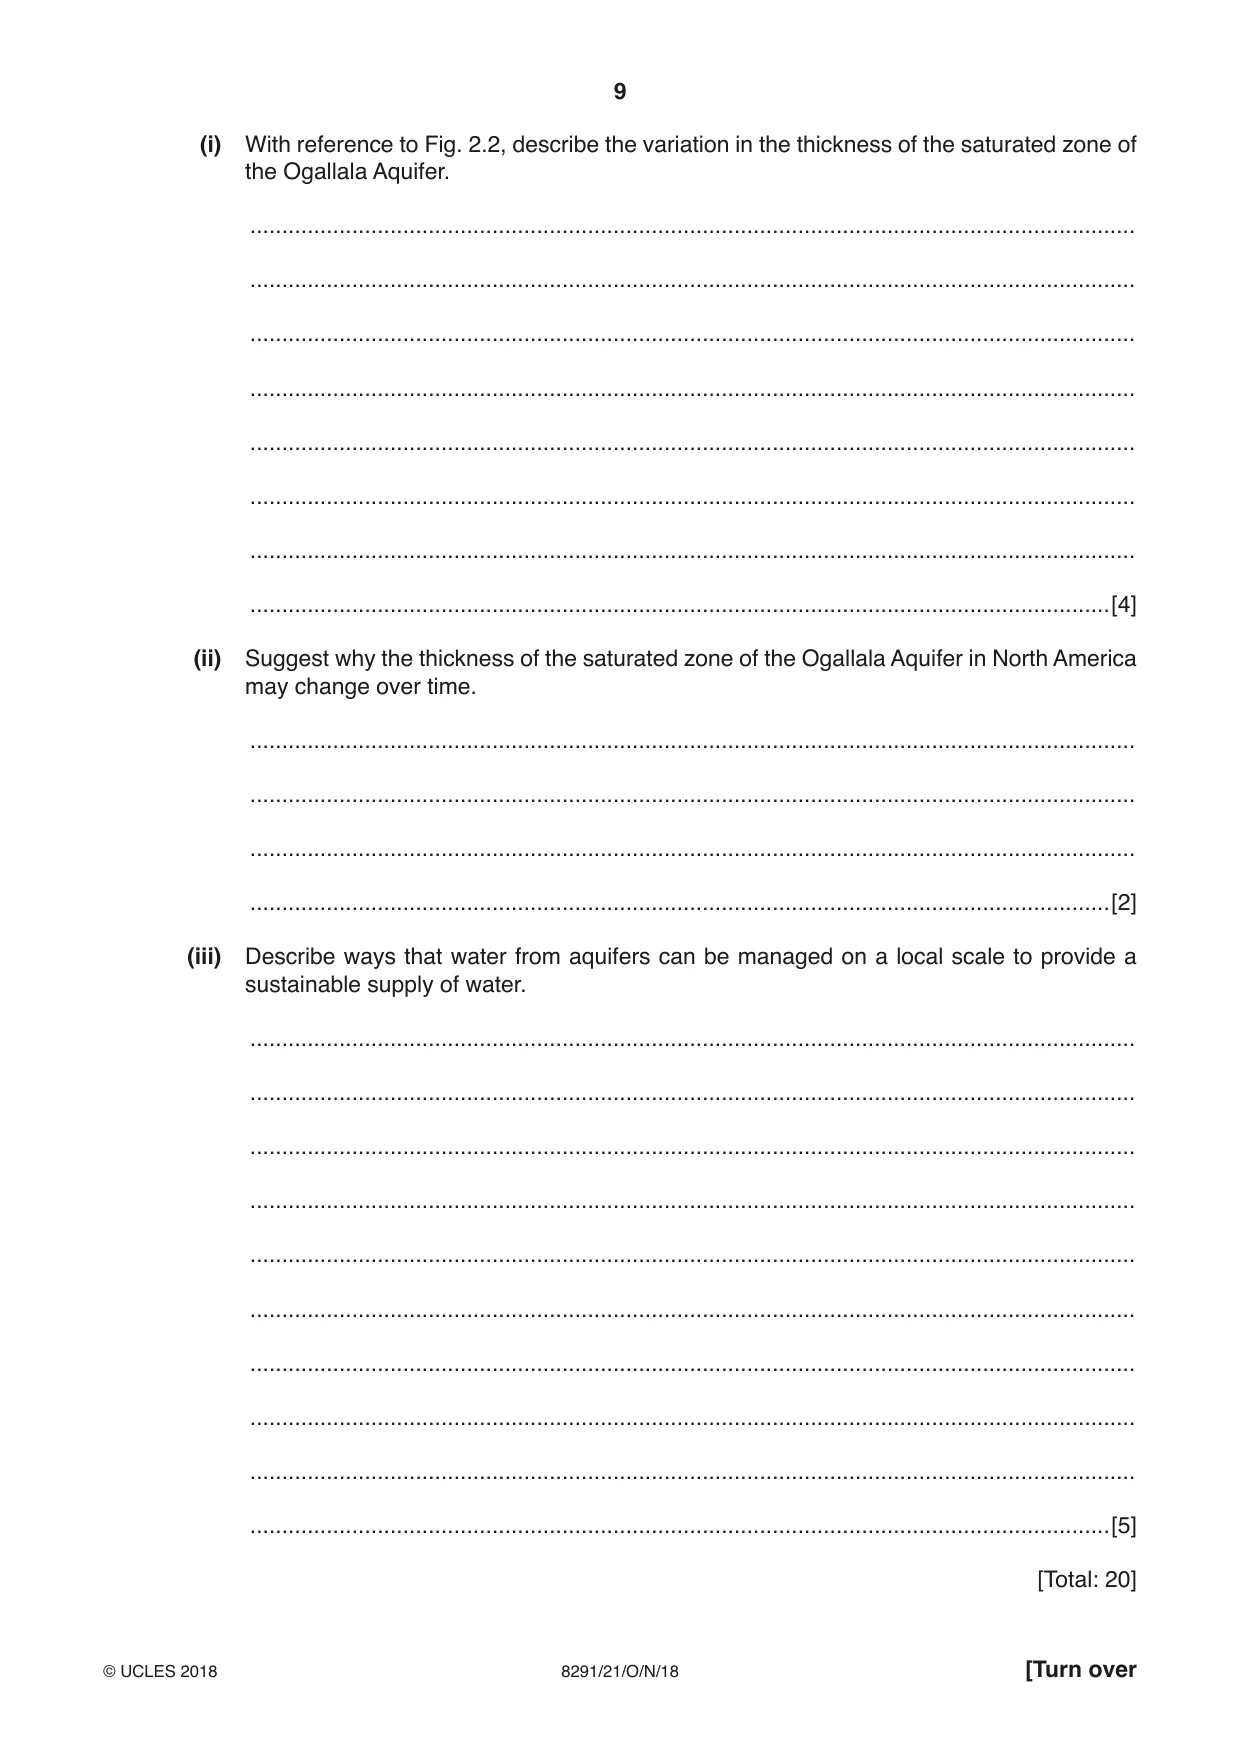
2 (a) Fig. 2.1 shows two types of aquifer. water table well artesian well soil water level unsaturated zone water table unconfined aquifer saturated zone confining layer confined aquifer water rises up the well Fig. 2.1 (i) State what is meant by the term aquifer. ........................................................................................................................................... .......................................................................................................................................[1] (ii) With reference to Fig. 2.1, describe the characteristics of the two types of aquifer. ........................................................................................................................................... ........................................................................................................................................... ........................................................................................................................................... ........................................................................................................................................... ........................................................................................................................................... ........................................................................................................................................... ........................................................................................................................................... .......................................................................................................................................[4] (iii) Explain the different water levels in the two types of well shown in Fig. 2.1. ........................................................................................................................................... ........................................................................................................................................... ........................................................................................................................................... ........................................................................................................................................... ........................................................................................................................................... ........................................................................................................................................... ........................................................................................................................................... .......................................................................................................................................[4] (b) Fig. 2.2 shows the extent and the variation in thickness of the saturated zone of the Ogallala Aquifer in some states of North America. Wyoming South Dakota Nebraska Kansas Colorado Key state boundaries Oklahoma New Mexico thickness of the saturated zone less than 61 metres N Texas 61 – 183 metres 0 100 km more than 183 metres Fig. 2.2 (i) With reference to Fig. 2.2, describe the variation in the thickness of the saturated zone of the Ogallala Aquifer. ........................................................................................................................................... ........................................................................................................................................... ........................................................................................................................................... ........................................................................................................................................... ........................................................................................................................................... ........................................................................................................................................... ........................................................................................................................................... .......................................................................................................................................[4] (ii) Suggest why the thickness of the saturated zone of the Ogallala Aquifer in North America may change over time. ........................................................................................................................................... ........................................................................................................................................... ........................................................................................................................................... .......................................................................................................................................[2] (iii) Describe ways that water from aquifers can be managed on a local scale to provide a sustainable supply of water. ........................................................................................................................................... ........................................................................................................................................... ........................................................................................................................................... ........................................................................................................................................... ........................................................................................................................................... ........................................................................................................................................... ........................................................................................................................................... ........................................................................................................................................... ........................................................................................................................................... .......................................................................................................................................[5] [Total: 20]
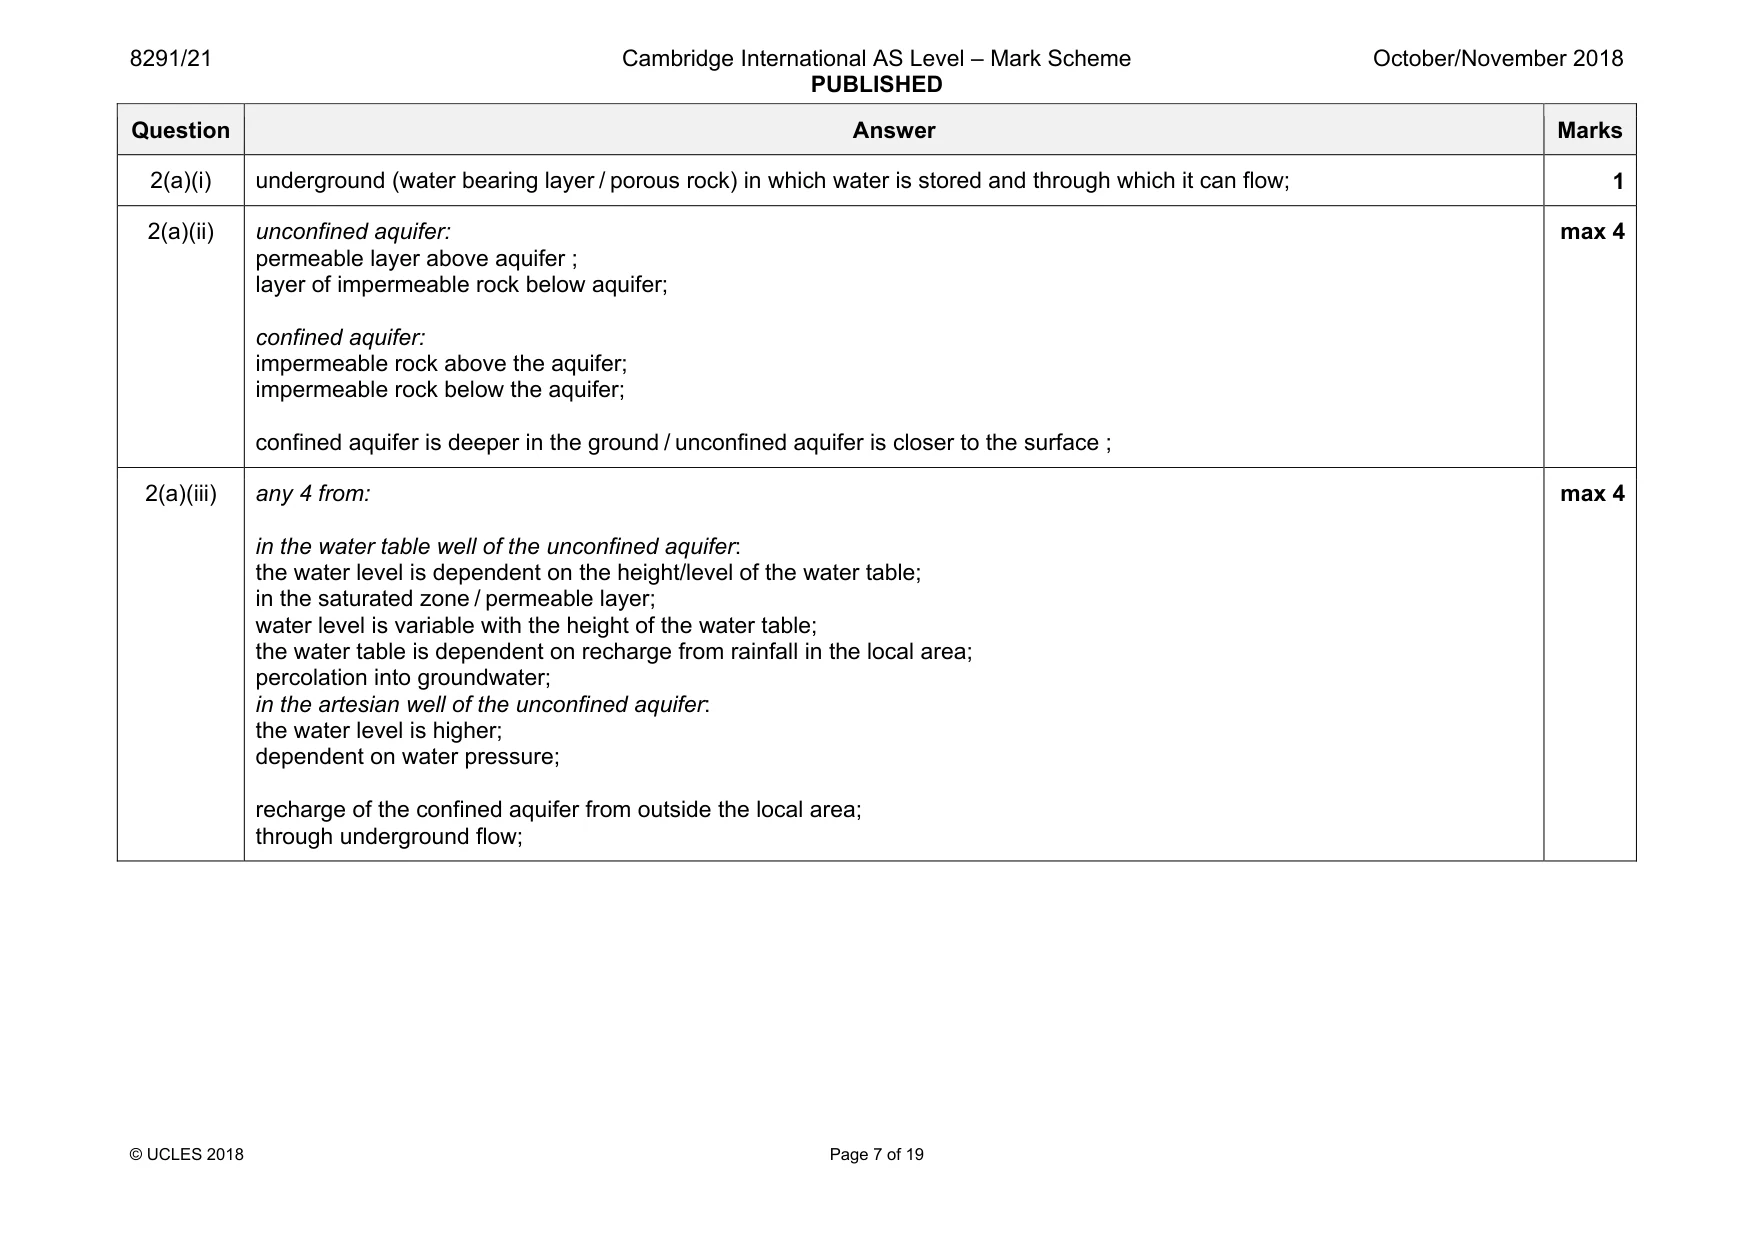
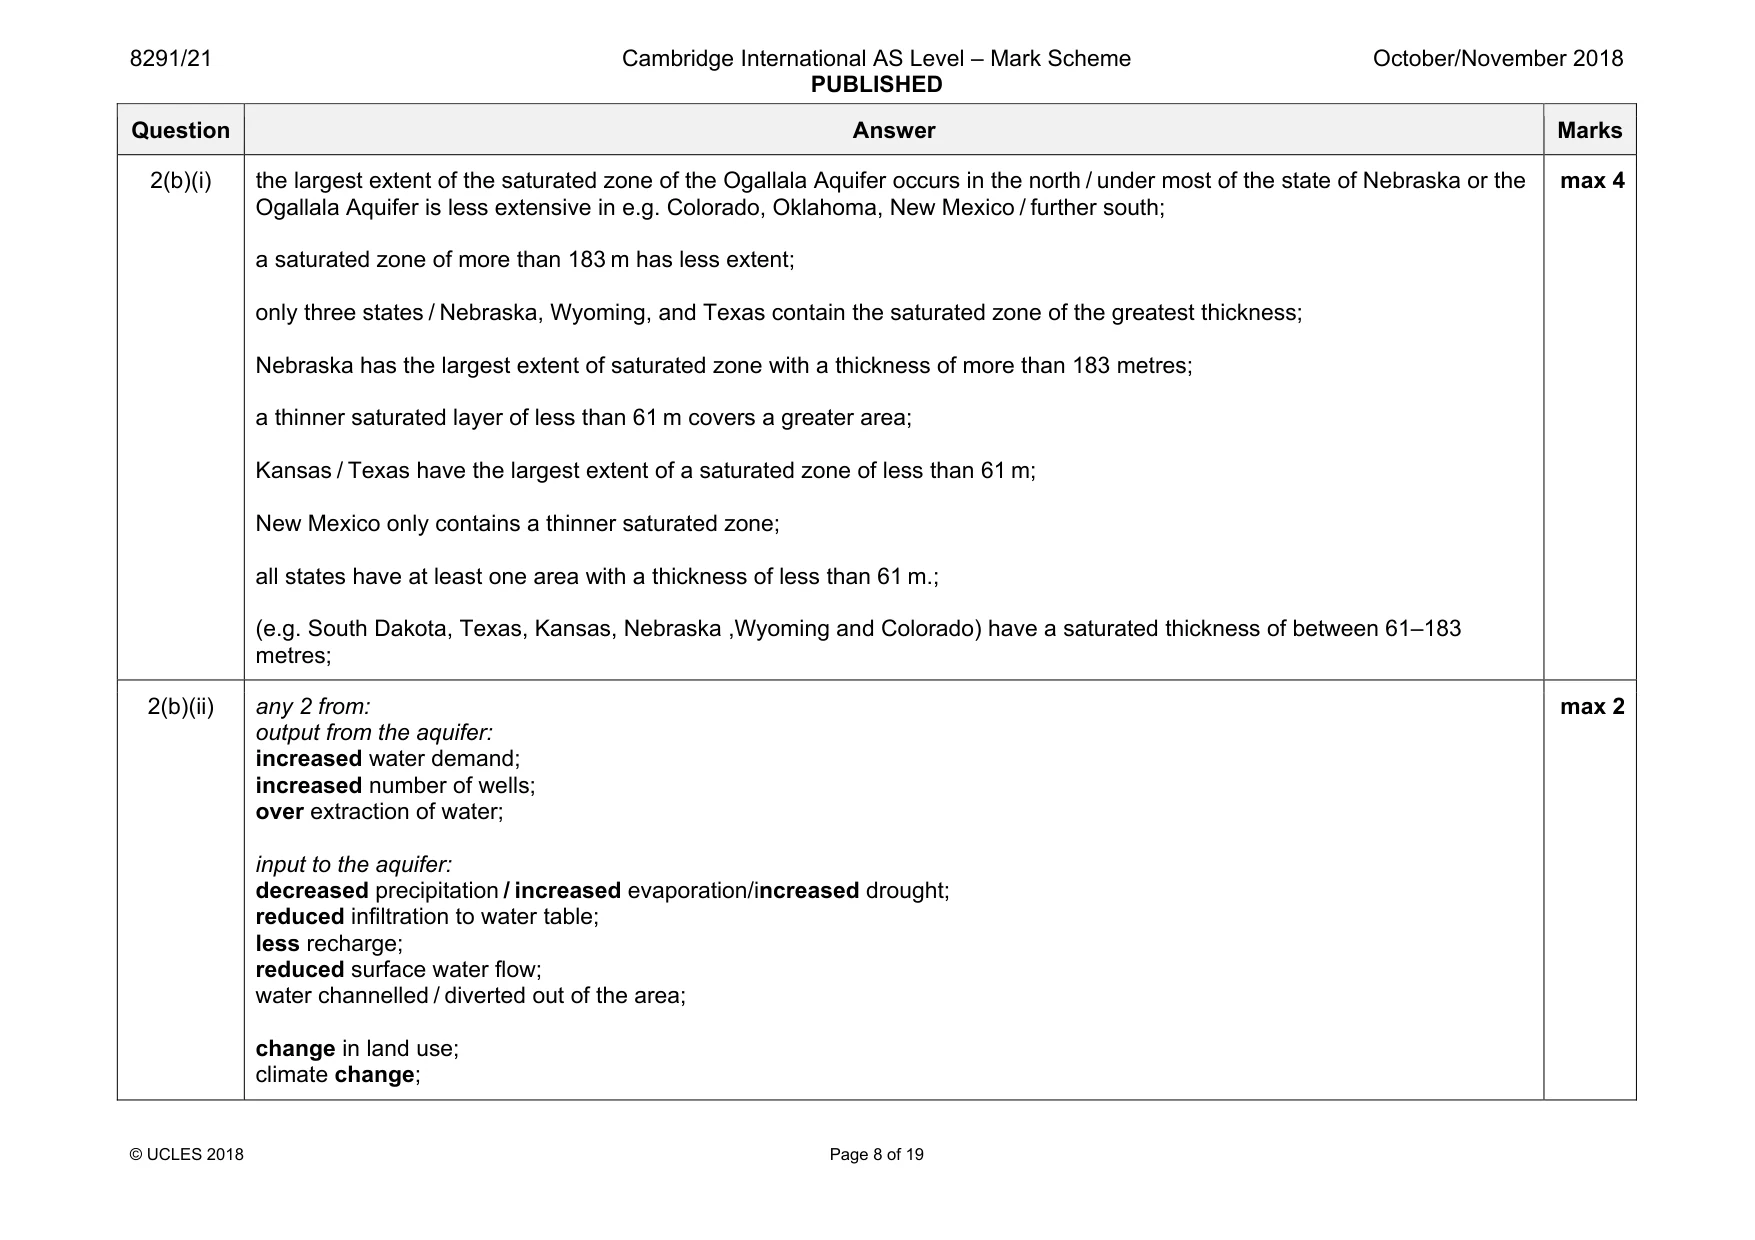
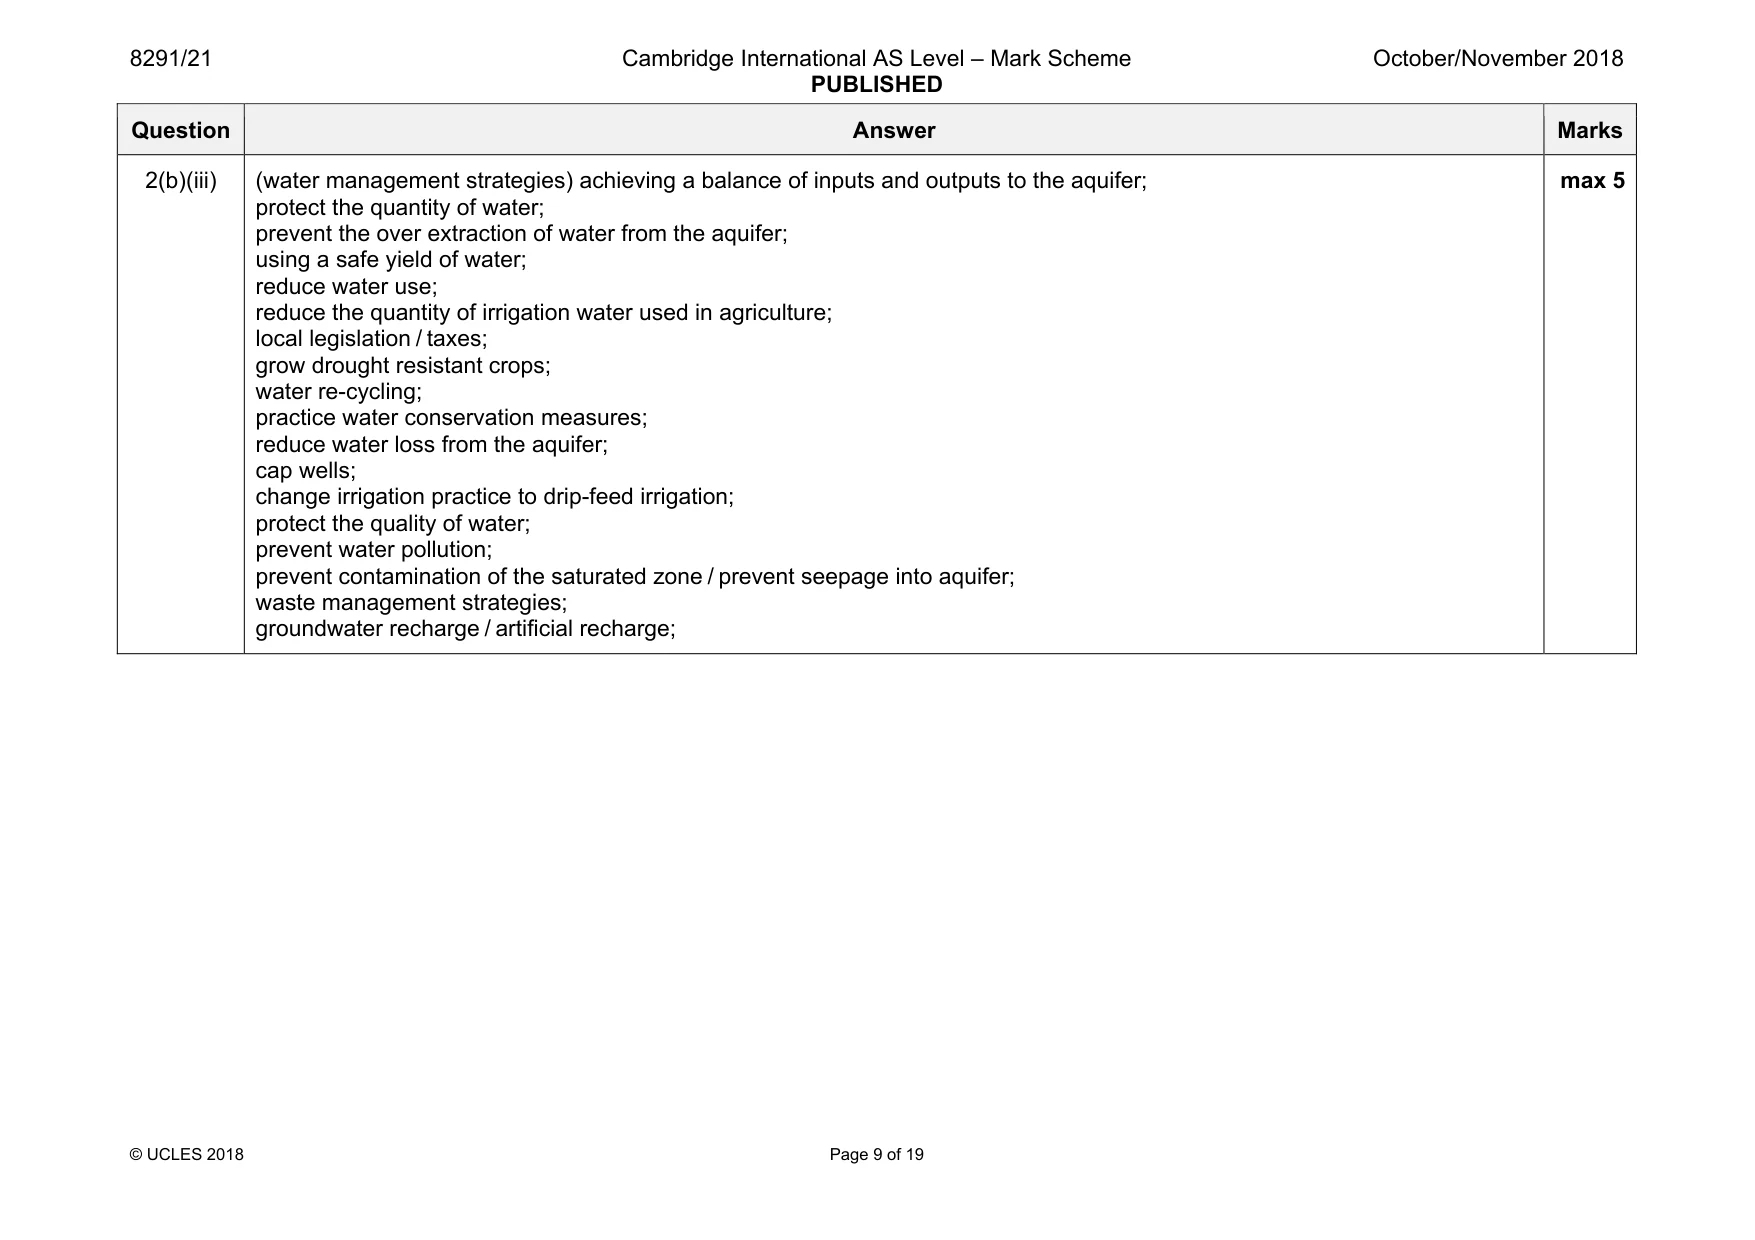
Mark scheme: 2(a)(i) underground (water bearing layer / porous rock) in which water is stored and through which it can flow; 1 2(a)(ii) unconfined aquifer: permeable layer above aquifer ; layer of impermeable rock below aquifer; confined aquifer: impermeable rock above the aquifer; impermeable rock below the aquifer; confined aquifer is deeper in the ground / unconfined aquifer is closer to the surface ; max 4 2(a)(iii) any 4 from: in the water table well of the unconfined aquifer: the water level is dependent on the height/level of the water table; in the saturated zone / permeable layer; water level is variable with the height of the water table; the water table is dependent on recharge from rainfall in the local area; percolation into groundwater; in the artesian well of the unconfined aquifer: the water level is higher; dependent on water pressure; recharge of the confined aquifer from outside the local area; through underground flow; max 4 Question Answer Marks 2(b)(i) the largest extent of the saturated zone of the Ogallala Aquifer occurs in the north / under most of the state of Nebraska or the Ogallala Aquifer is less extensive in e.g. Colorado, Oklahoma, New Mexico / further south; a saturated zone of more than 183 m has less extent; only three states / Nebraska, Wyoming, and Texas contain the saturated zone of the greatest thickness; Nebraska has the largest extent of saturated zone with a thickness of more than 183 metres; a thinner saturated layer of less than 61 m covers a greater area; Kansas / Texas have the largest extent of a saturated zone of less than 61 m; New Mexico only contains a thinner saturated zone; all states have at least one area with a thickness of less than 61 m.; (e.g. South Dakota, Texas, Kansas, Nebraska ,Wyoming and Colorado) have a saturated thickness of between 61–183 metres; max 4 2(b)(ii) any 2 from: output from the aquifer: increased water demand; increased number of wells; over extraction of water; input to the aquifer: decreased precipitation / increased evaporation/increased drought; reduced infiltration to water table; less recharge; reduced surface water flow; water channelled / diverted out of the area; change in land use; climate change; max 2 Question Answer Marks 2(b)(iii) (water management strategies) achieving a balance of inputs and outputs to the aquifer; protect the quantity of water; prevent the over extraction of water from the aquifer; using a safe yield of water; reduce water use; reduce the quantity of irrigation water used in agriculture; local legislation / taxes; grow drought resistant crops; water re-cycling; practice water conservation measures; reduce water loss from the aquifer; cap wells; change irrigation practice to drip-feed irrigation; protect the quality of water; prevent water pollution; prevent contamination of the saturated zone / prevent seepage into aquifer; waste management strategies; groundwater recharge / artificial recharge; max 5
Q3 · Global human population and estimated biodiversity from the year 1000 until 2015
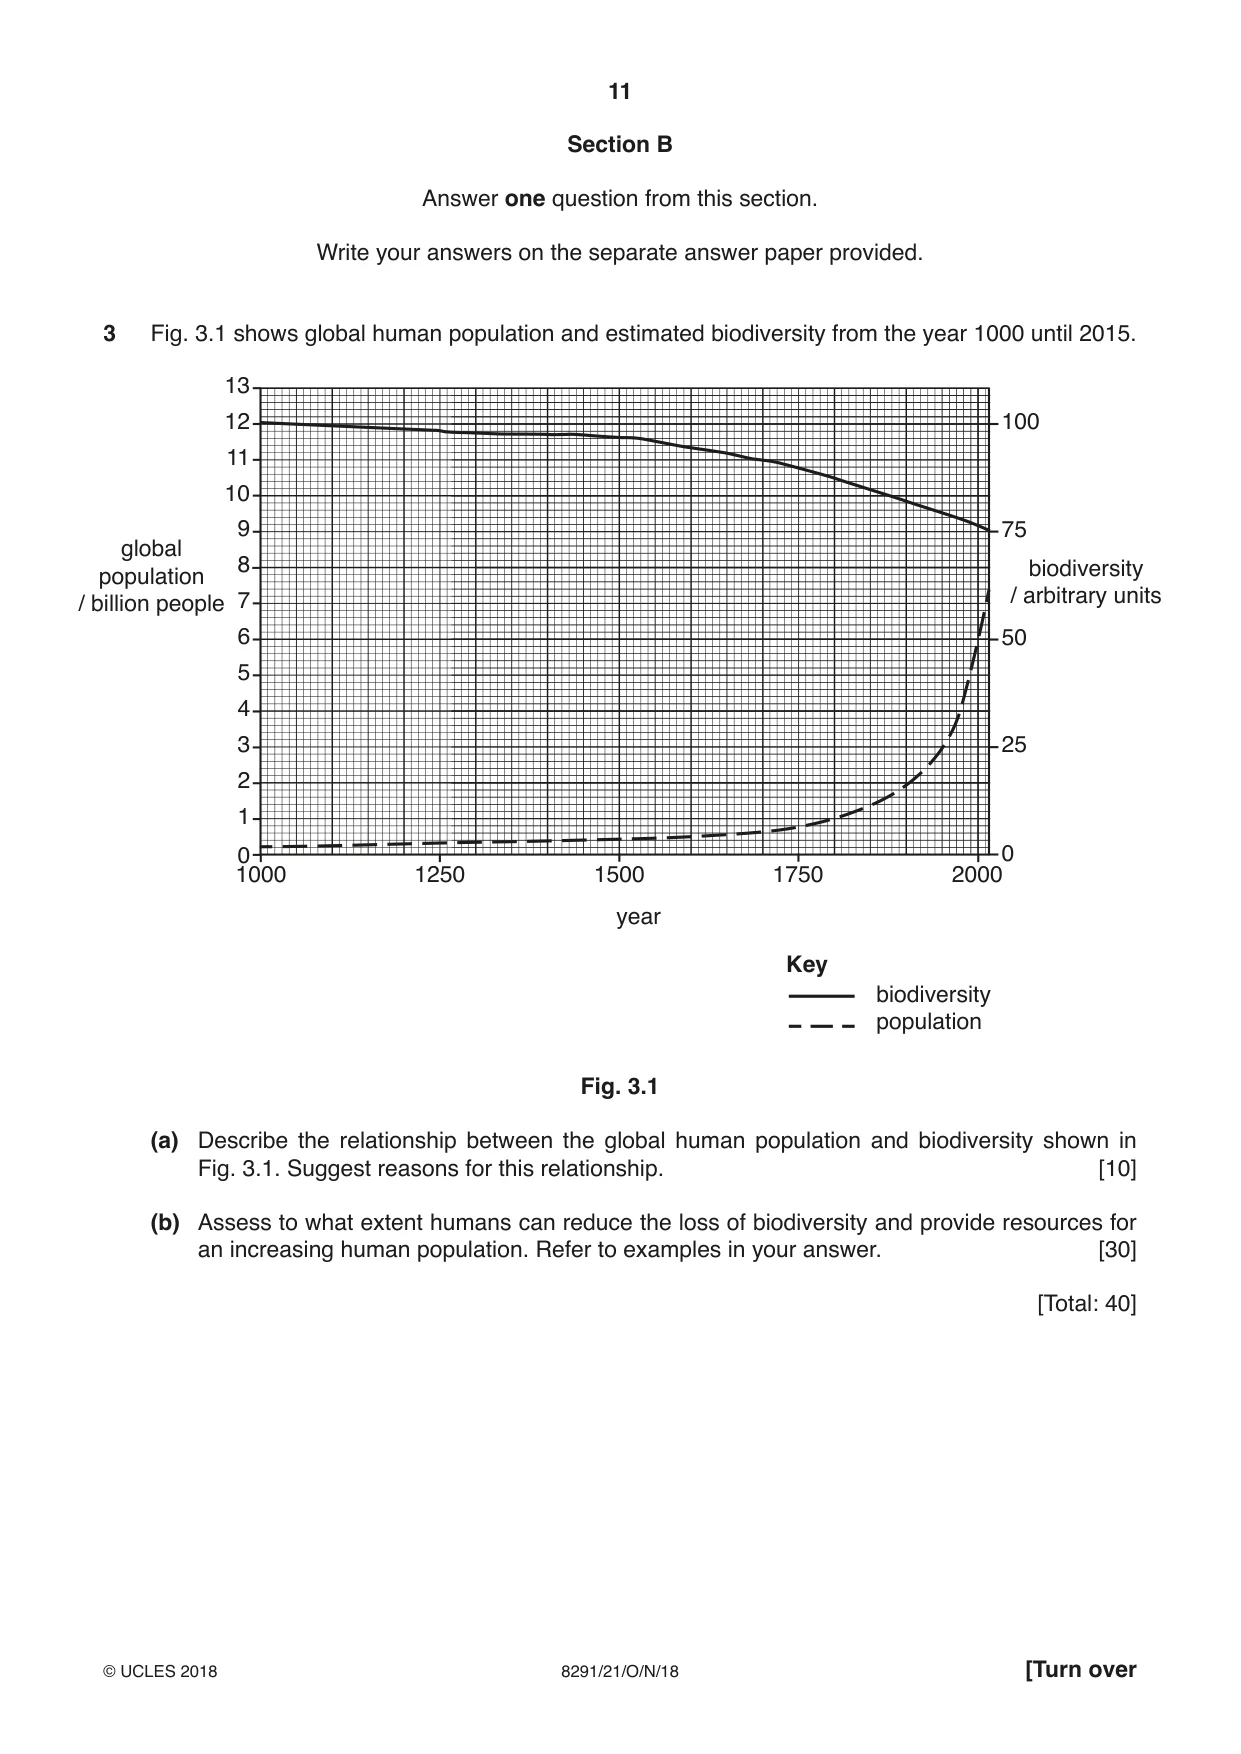
3 Fig. 3.1 shows global human population and estimated biodiversity from the year 1000 until 2015. 13 12 100 11 10 9 75 global 8 biodiversity population / billion people 7 / arbitrary units 6 50 5 4 3 25 2 1 0 0 1000 1250 1500 1750 2000 year Key biodiversity population Fig. 3.1 (a) Describe the relationship between the global human population and biodiversity shown in Fig. 3.1. Suggest reasons for this relationship. [10] (b) Assess to what extent humans can reduce the loss of biodiversity and provide resources for an increasing human population. Refer to examples in your answer. [30] [Total: 40]
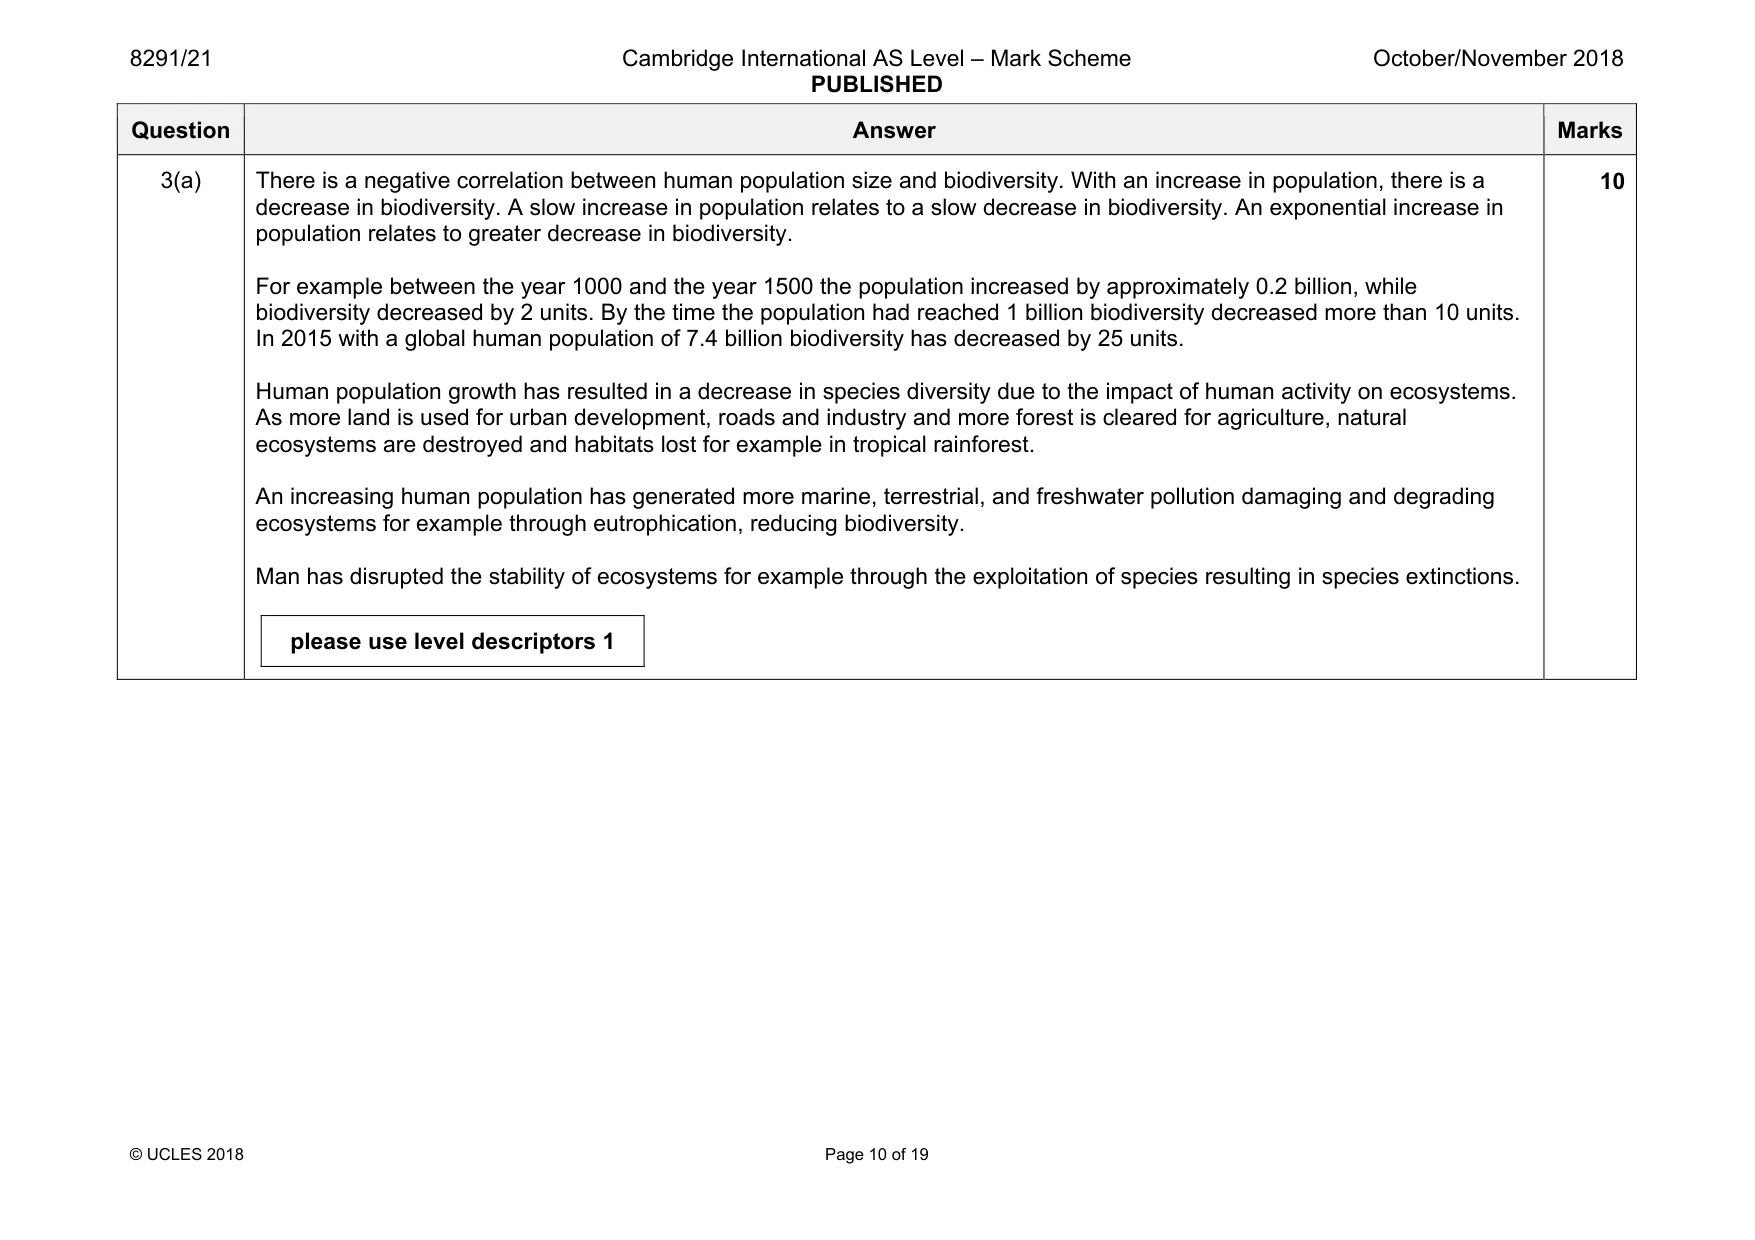
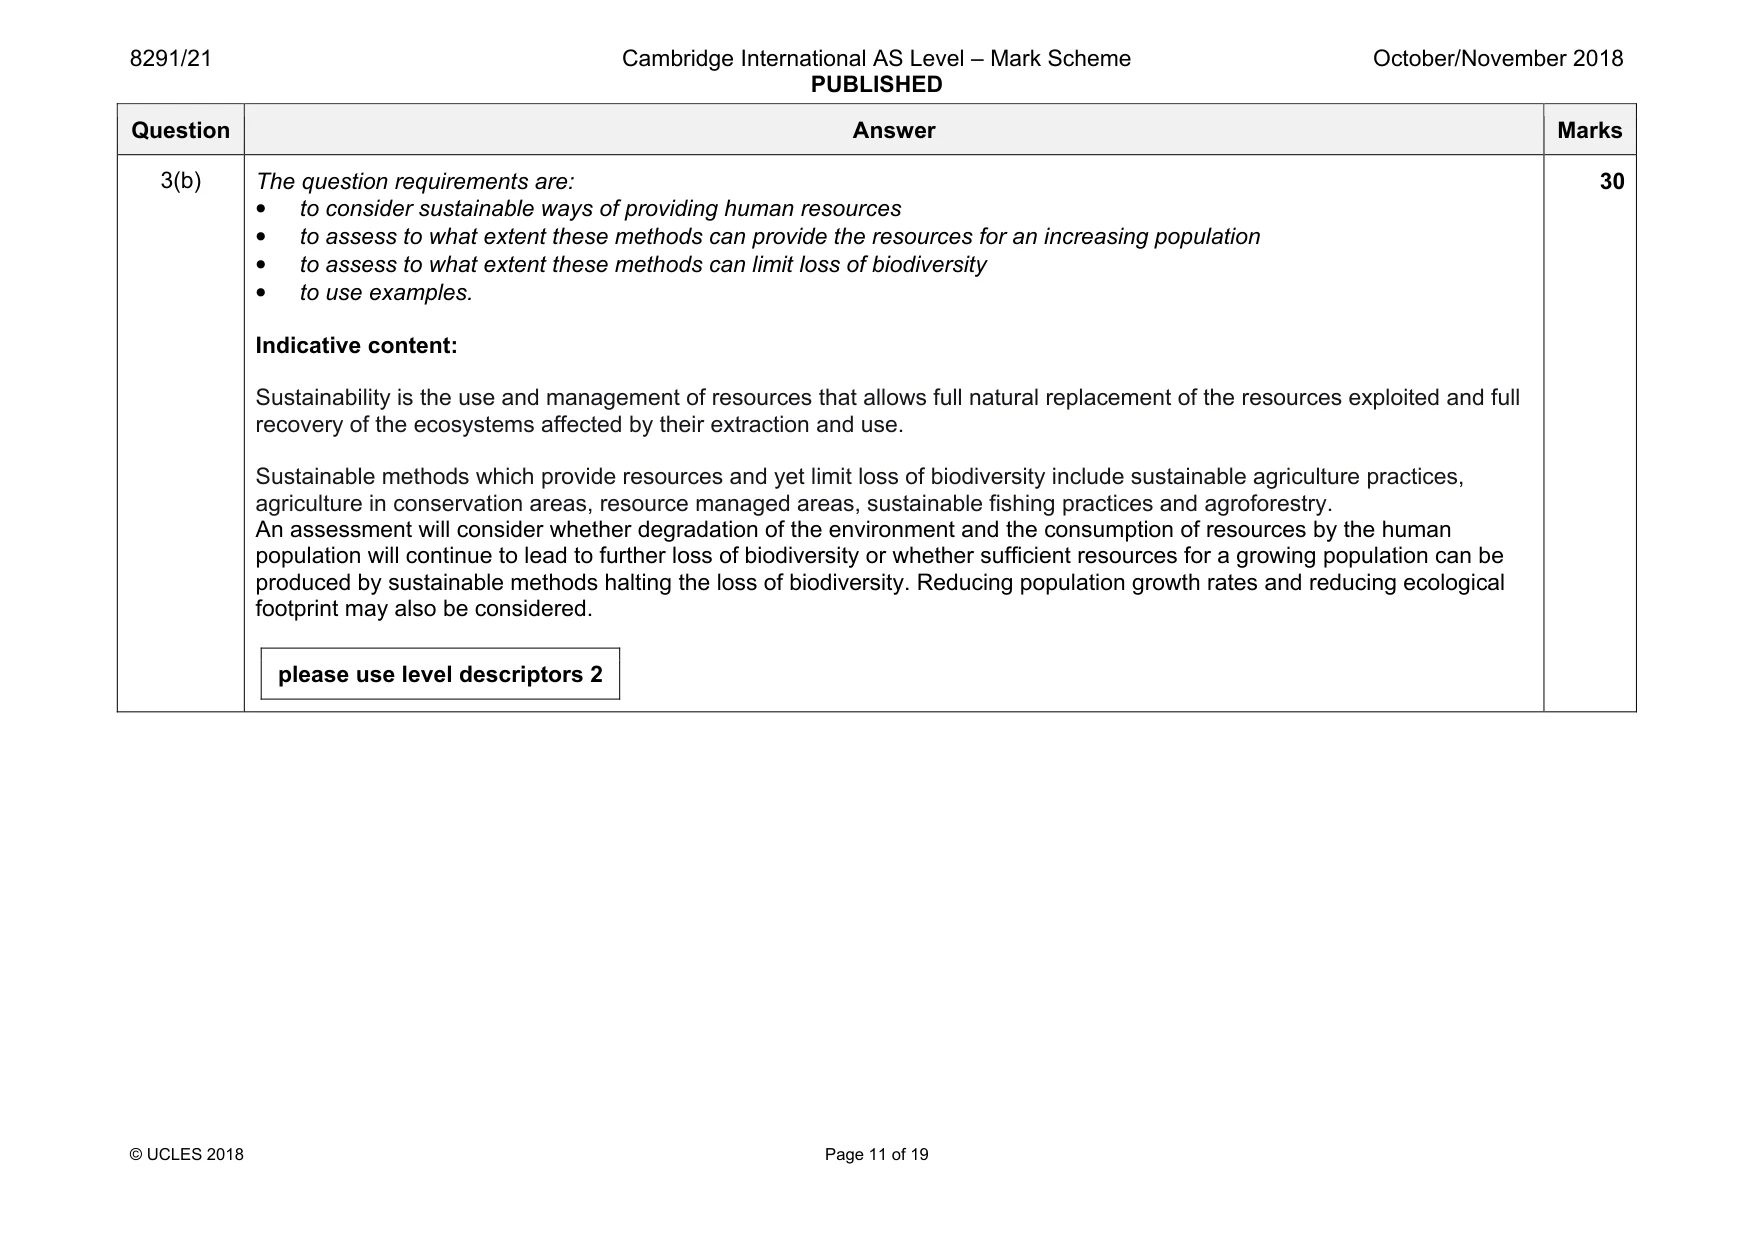
Mark scheme: 3(a) There is a negative correlation between human population size and biodiversity. With an increase in population, there is a decrease in biodiversity. A slow increase in population relates to a slow decrease in biodiversity. An exponential increase in population relates to greater decrease in biodiversity. For example between the year 1000 and the year 1500 the population increased by approximately 0.2 billion, while biodiversity decreased by 2 units. By the time the population had reached 1 billion biodiversity decreased more than 10 units. In 2015 with a global human population of 7.4 billion biodiversity has decreased by 25 units. Human population growth has resulted in a decrease in species diversity due to the impact of human activity on ecosystems. As more land is used for urban development, roads and industry and more forest is cleared for agriculture, natural ecosystems are destroyed and habitats lost for example in tropical rainforest. An increasing human population has generated more marine, terrestrial, and freshwater pollution damaging and degrading ecosystems for example through eutrophication, reducing biodiversity. Man has disrupted the stability of ecosystems for example through the exploitation of species resulting in species extinctions. please use level descriptors 1 10 Question Answer Marks 3(b) The question requirements are: • to consider sustainable ways of providing human resources • to assess to what extent these methods can provide the resources for an increasing population • to assess to what extent these methods can limit loss of biodiversity • to use examples. Indicative content: Sustainability is the use and management of resources that allows full natural replacement of the resources exploited and full recovery of the ecosystems affected by their extraction and use. Sustainable methods which provide resources and yet limit loss of biodiversity include sustainable agriculture practices, agriculture in conservation areas, resource managed areas, sustainable fishing practices and agroforestry. An assessment will consider whether degradation of the environment and the consumption of resources by the human population will continue to lead to further loss of biodiversity or whether sufficient resources for a growing population can be produced by sustainable methods halting the loss of biodiversity. Reducing population growth rates and reducing ecological footprint may also be considered. please use level descriptors 2 30
Q4 · The changes in the extent of the Aral Sea between 1957 and 2015
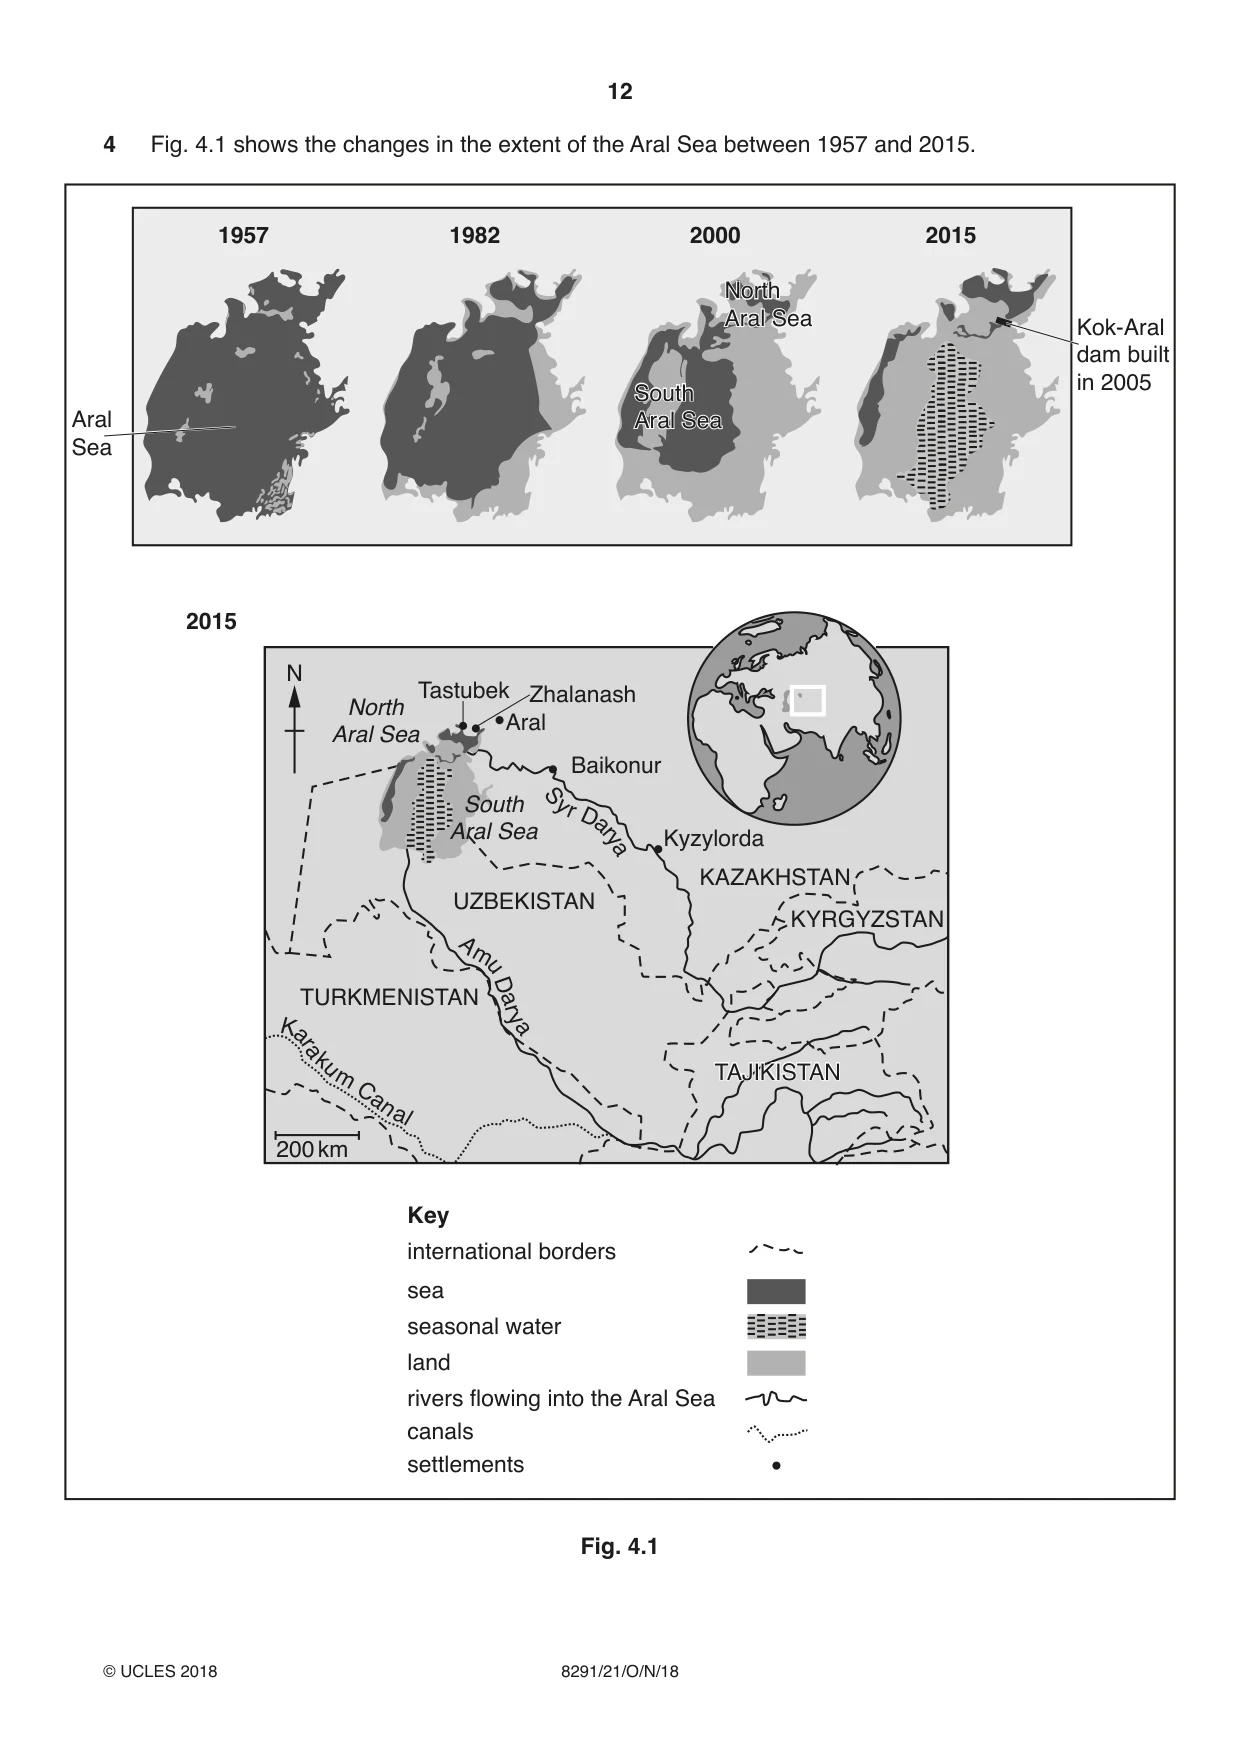
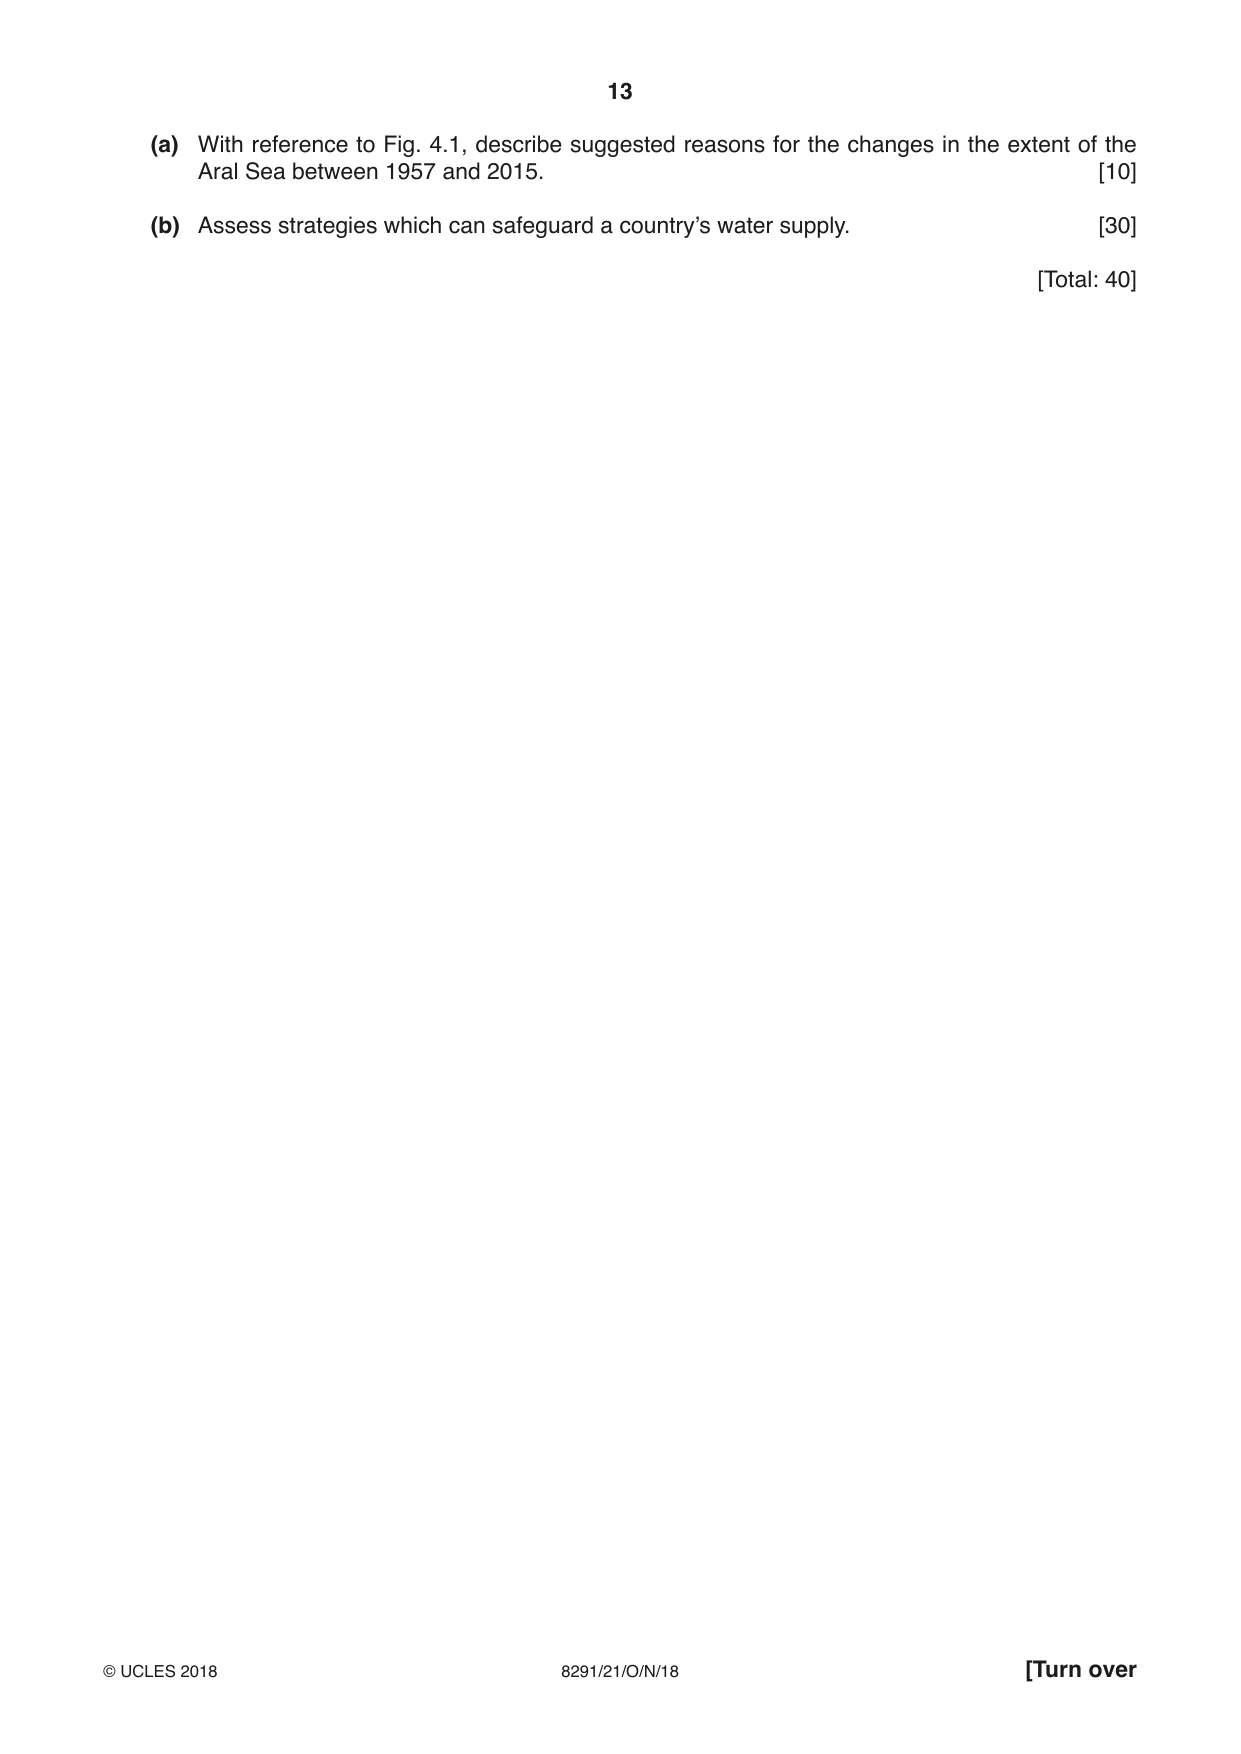
4 Fig. 4.1 shows the changes in the extent of the Aral Sea between 1957 and 2015. 1957 1982 2000 2015 NorthNorth AralAral SeaSea Kok-Aral dam built in 2005 SouthSouth Aral AralAral SeaSea Sea 2015 N Tastubek Zhalanash North Aral Aral Sea Baikonur S South yr Dar Aral Sea y Kyzylorda a KAZAKHSTAN UZBEKISTAN KYRGYZSTAN A mu TURKMENISTAN Dar a Ka y ra k um TAJIKISTANTAJIKISTAN C an al 200 km Key international borders sea seasonal water land rivers flowing into the Aral Sea canals settlements Fig. 4.1 (a) With reference to Fig. 4.1, describe suggested reasons for the changes in the extent of the Aral Sea between 1957 and 2015. [10] (b) Assess strategies which can safeguard a country’s water supply. [30] [Total: 40]
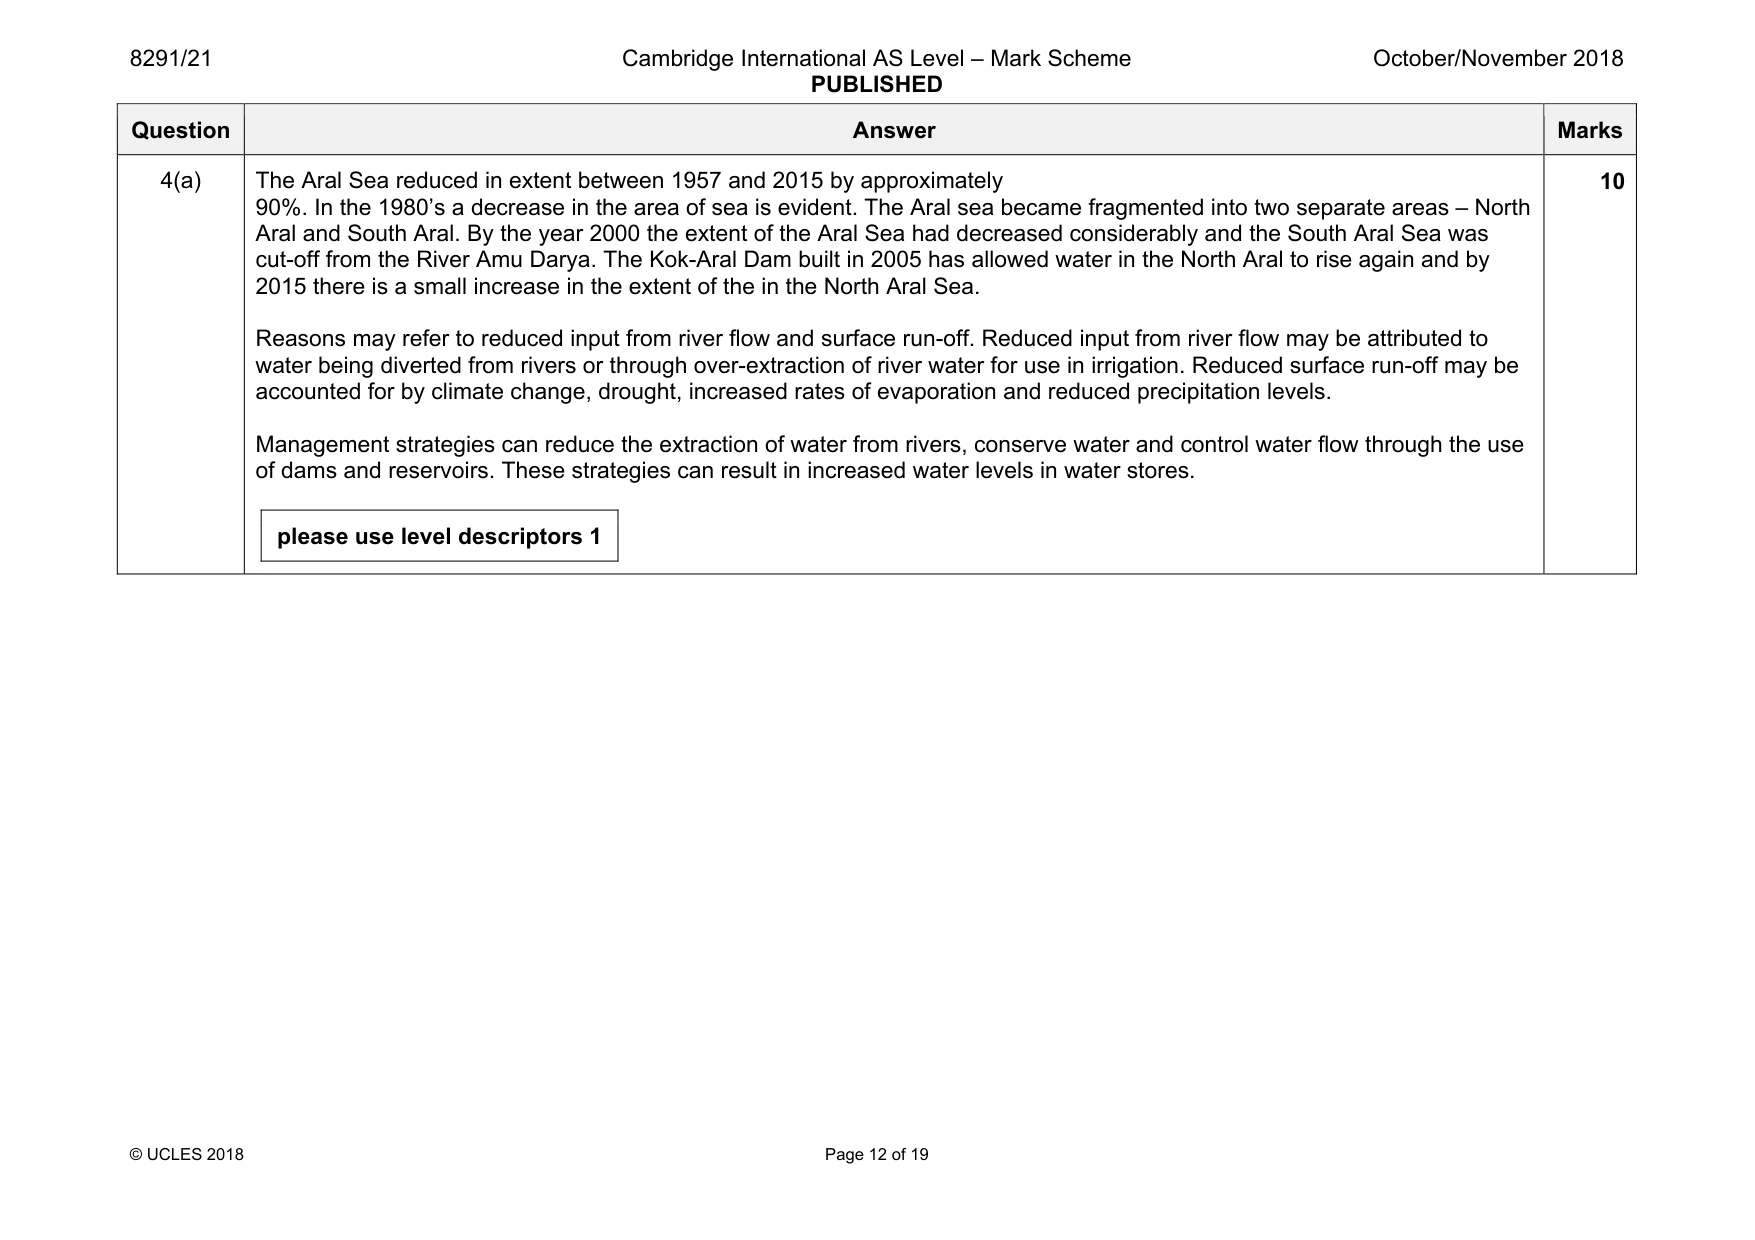
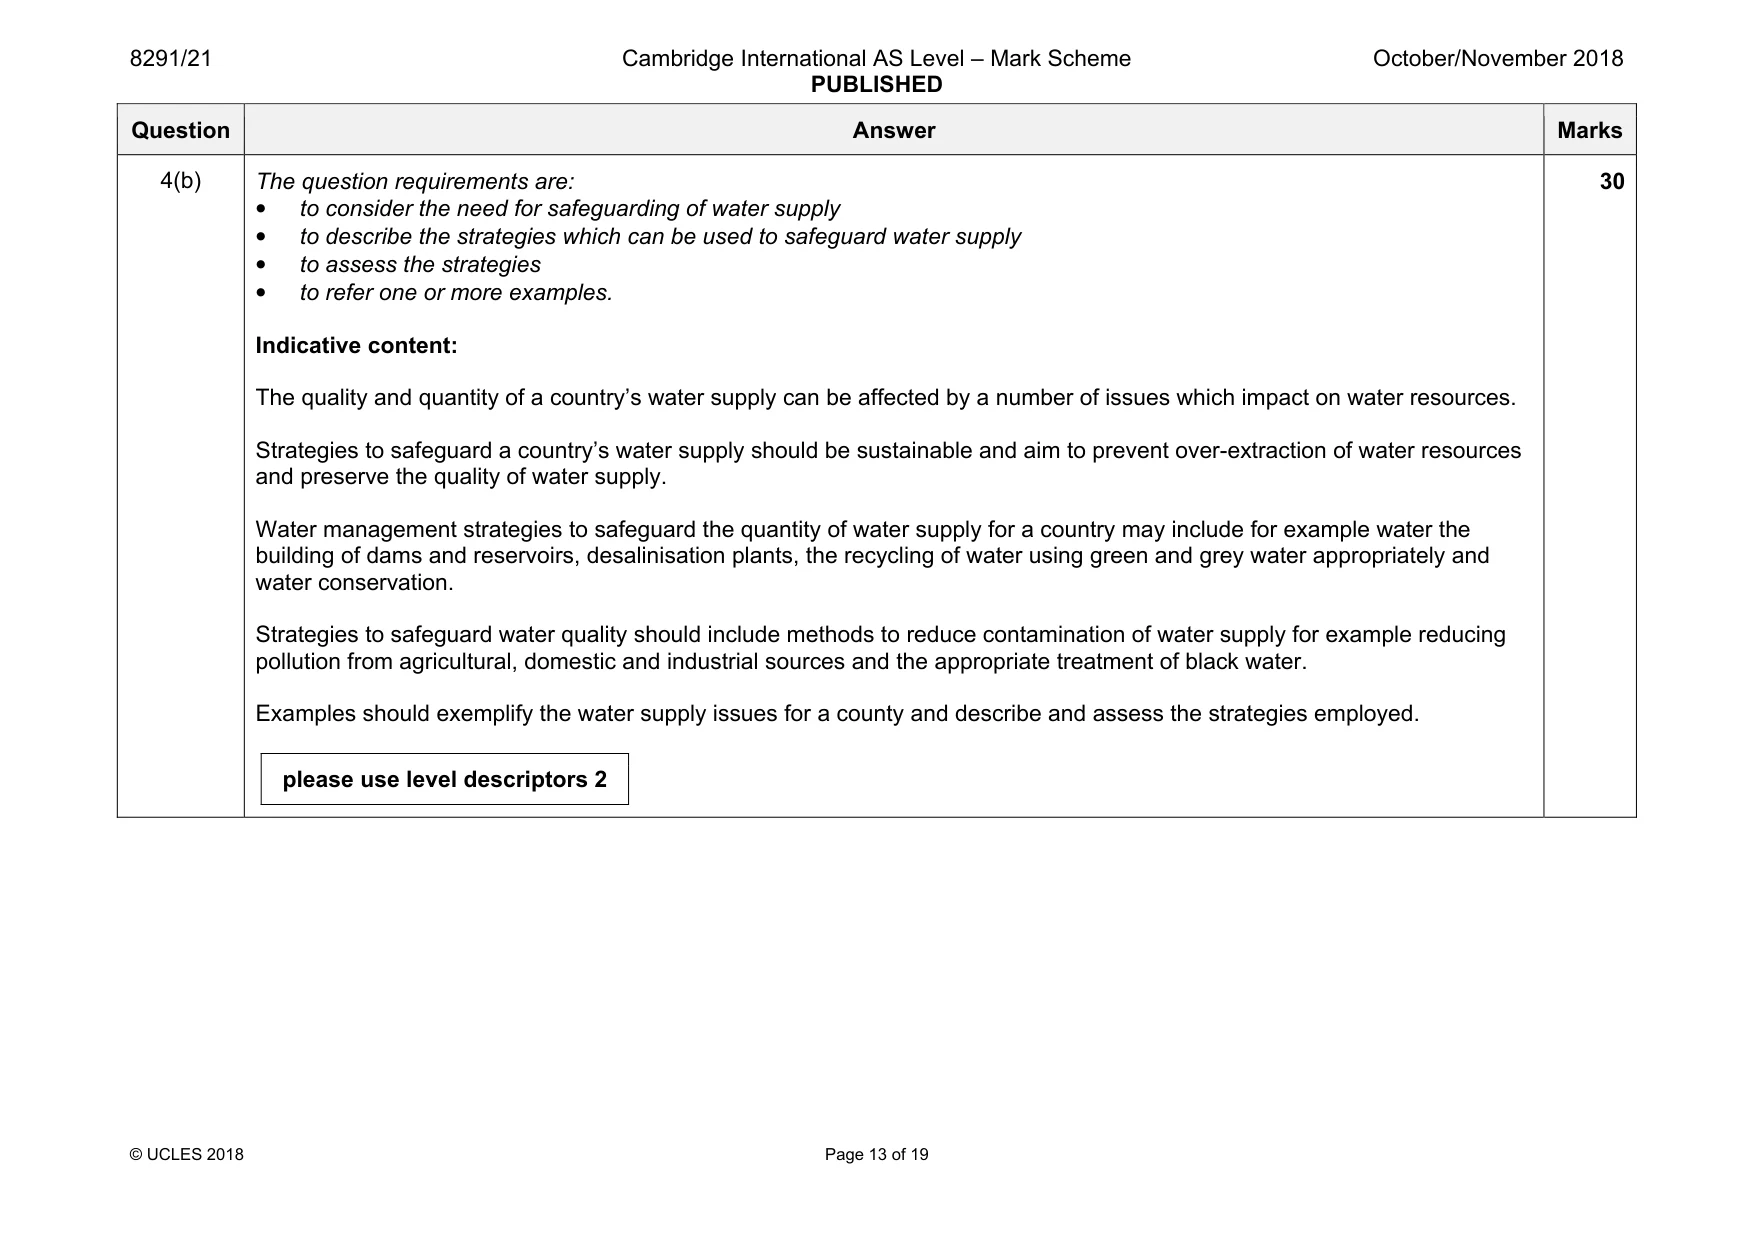
Mark scheme: 4(a) The Aral Sea reduced in extent between 1957 and 2015 by approximately 90%. In the 1980’s a decrease in the area of sea is evident. The Aral sea became fragmented into two separate areas – North Aral and South Aral. By the year 2000 the extent of the Aral Sea had decreased considerably and the South Aral Sea was cut-off from the River Amu Darya. The Kok-Aral Dam built in 2005 has allowed water in the North Aral to rise again and by 2015 there is a small increase in the extent of the in the North Aral Sea. Reasons may refer to reduced input from river flow and surface run-off. Reduced input from river flow may be attributed to water being diverted from rivers or through over-extraction of river water for use in irrigation. Reduced surface run-off may be accounted for by climate change, drought, increased rates of evaporation and reduced precipitation levels. Management strategies can reduce the extraction of water from rivers, conserve water and control water flow through the use of dams and reservoirs. These strategies can result in increased water levels in water stores. please use level descriptors 1 10 Question Answer Marks 4(b) The question requirements are: • to consider the need for safeguarding of water supply • to describe the strategies which can be used to safeguard water supply • to assess the strategies • to refer one or more examples. Indicative content: The quality and quantity of a country’s water supply can be affected by a number of issues which impact on water resources. Strategies to safeguard a country’s water supply should be sustainable and aim to prevent over-extraction of water resources and preserve the quality of water supply. Water management strategies to safeguard the quantity of water supply for a country may include for example water the building of dams and reservoirs, desalinisation plants, the recycling of water using green and grey water appropriately and water conservation. Strategies to safeguard water quality should include methods to reduce contamination of water supply for example reducing pollution from agricultural, domestic and industrial sources and the appropriate treatment of black water. Examples should exemplify the water supply issues for a county and describe and assess the strategies employed. please use level descriptors 2 30
Q5 · The numbers of two species of rhinoceros in South Africa between 1960 and 2010
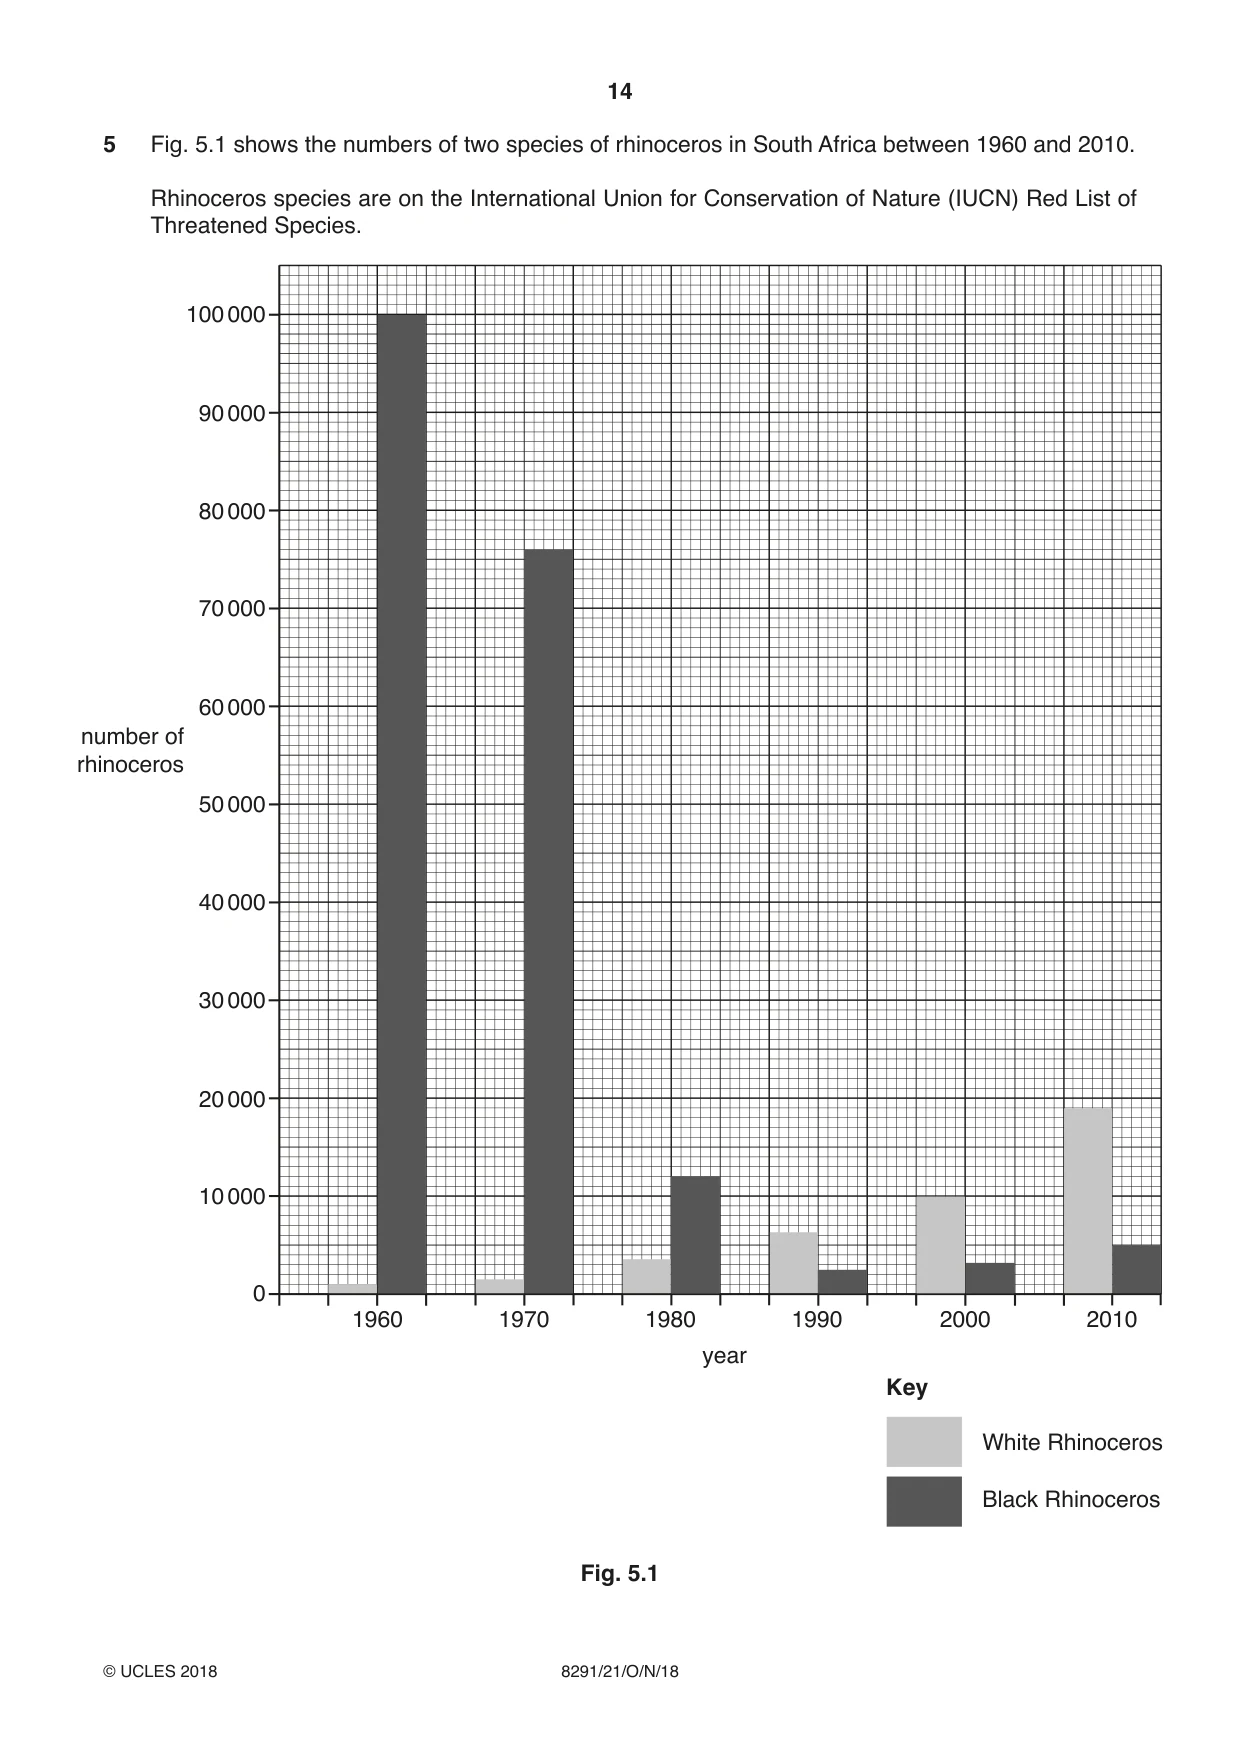
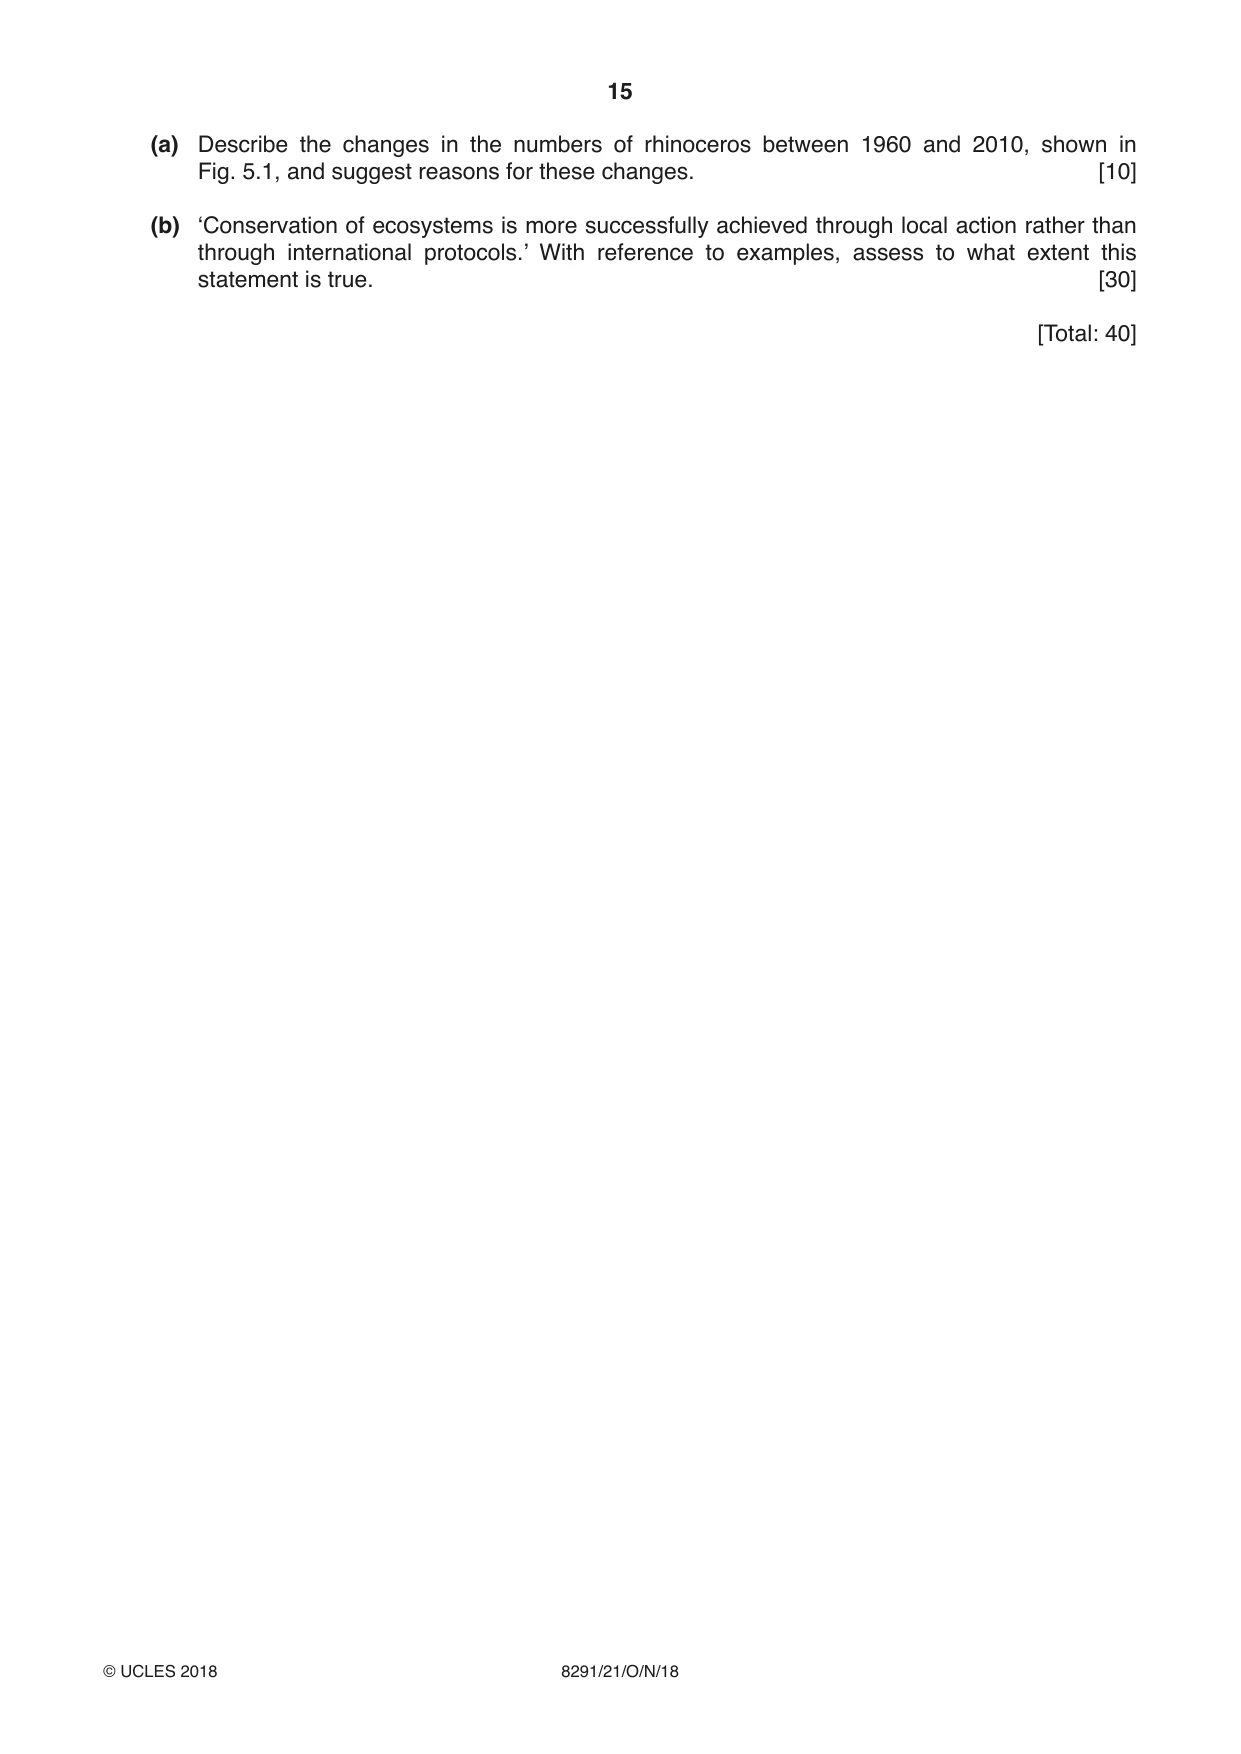
5 Fig. 5.1 shows the numbers of two species of rhinoceros in South Africa between 1960 and 2010. Rhinoceros species are on the International Union for Conservation of Nature (IUCN) Red List of Threatened Species. 100 000 90 000 80 000 70 000 60 000 number of rhinoceros 50 000 40 000 30 000 20 000 10 000 0 1960 1970 1980 1990 2000 2010 year Key White Rhinoceros Black Rhinoceros Fig. 5.1 (a) Describe the changes in the numbers of rhinoceros between 1960 and 2010, shown in Fig. 5.1, and suggest reasons for these changes. [10] (b) ‘Conservation of ecosystems is more successfully achieved through local action rather than through international protocols.’ With reference to examples, assess to what extent this statement is true. [30] [Total: 40]
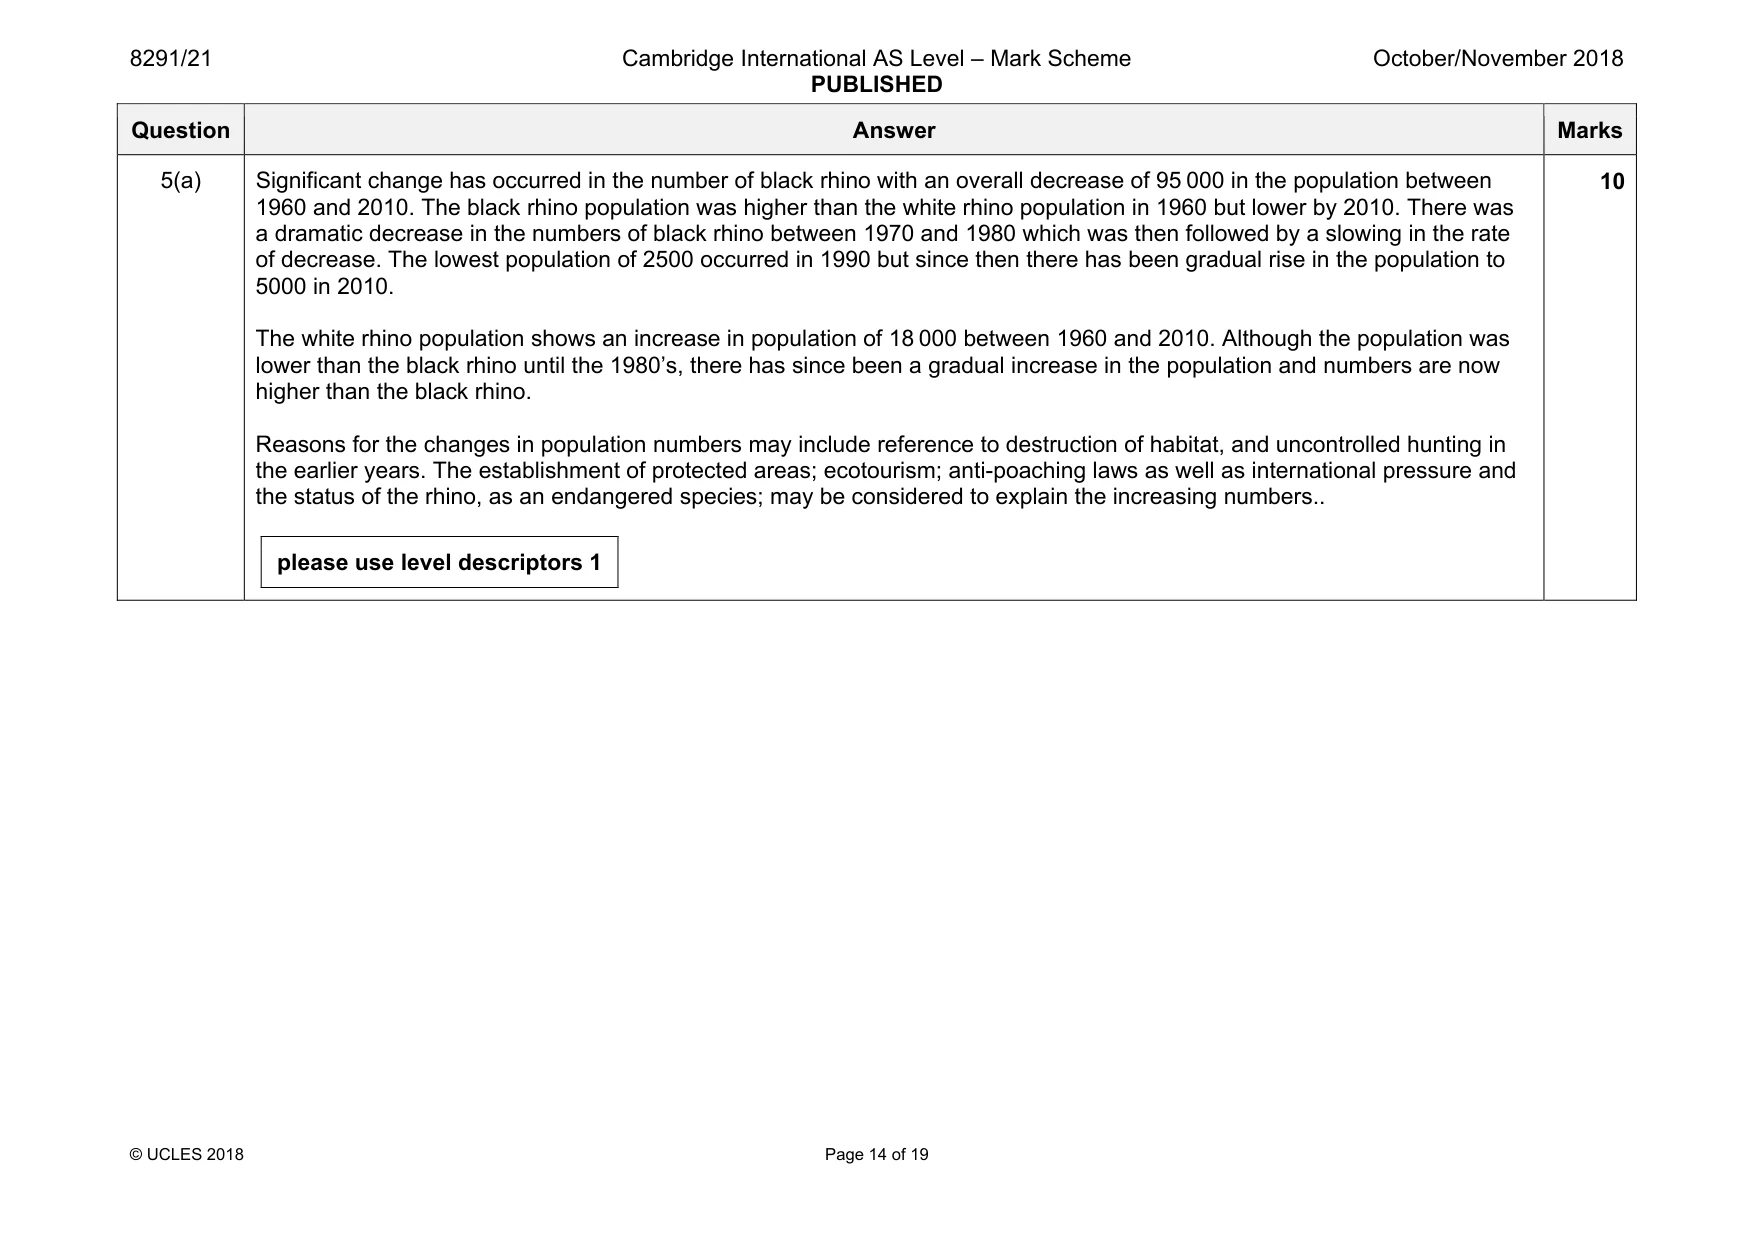
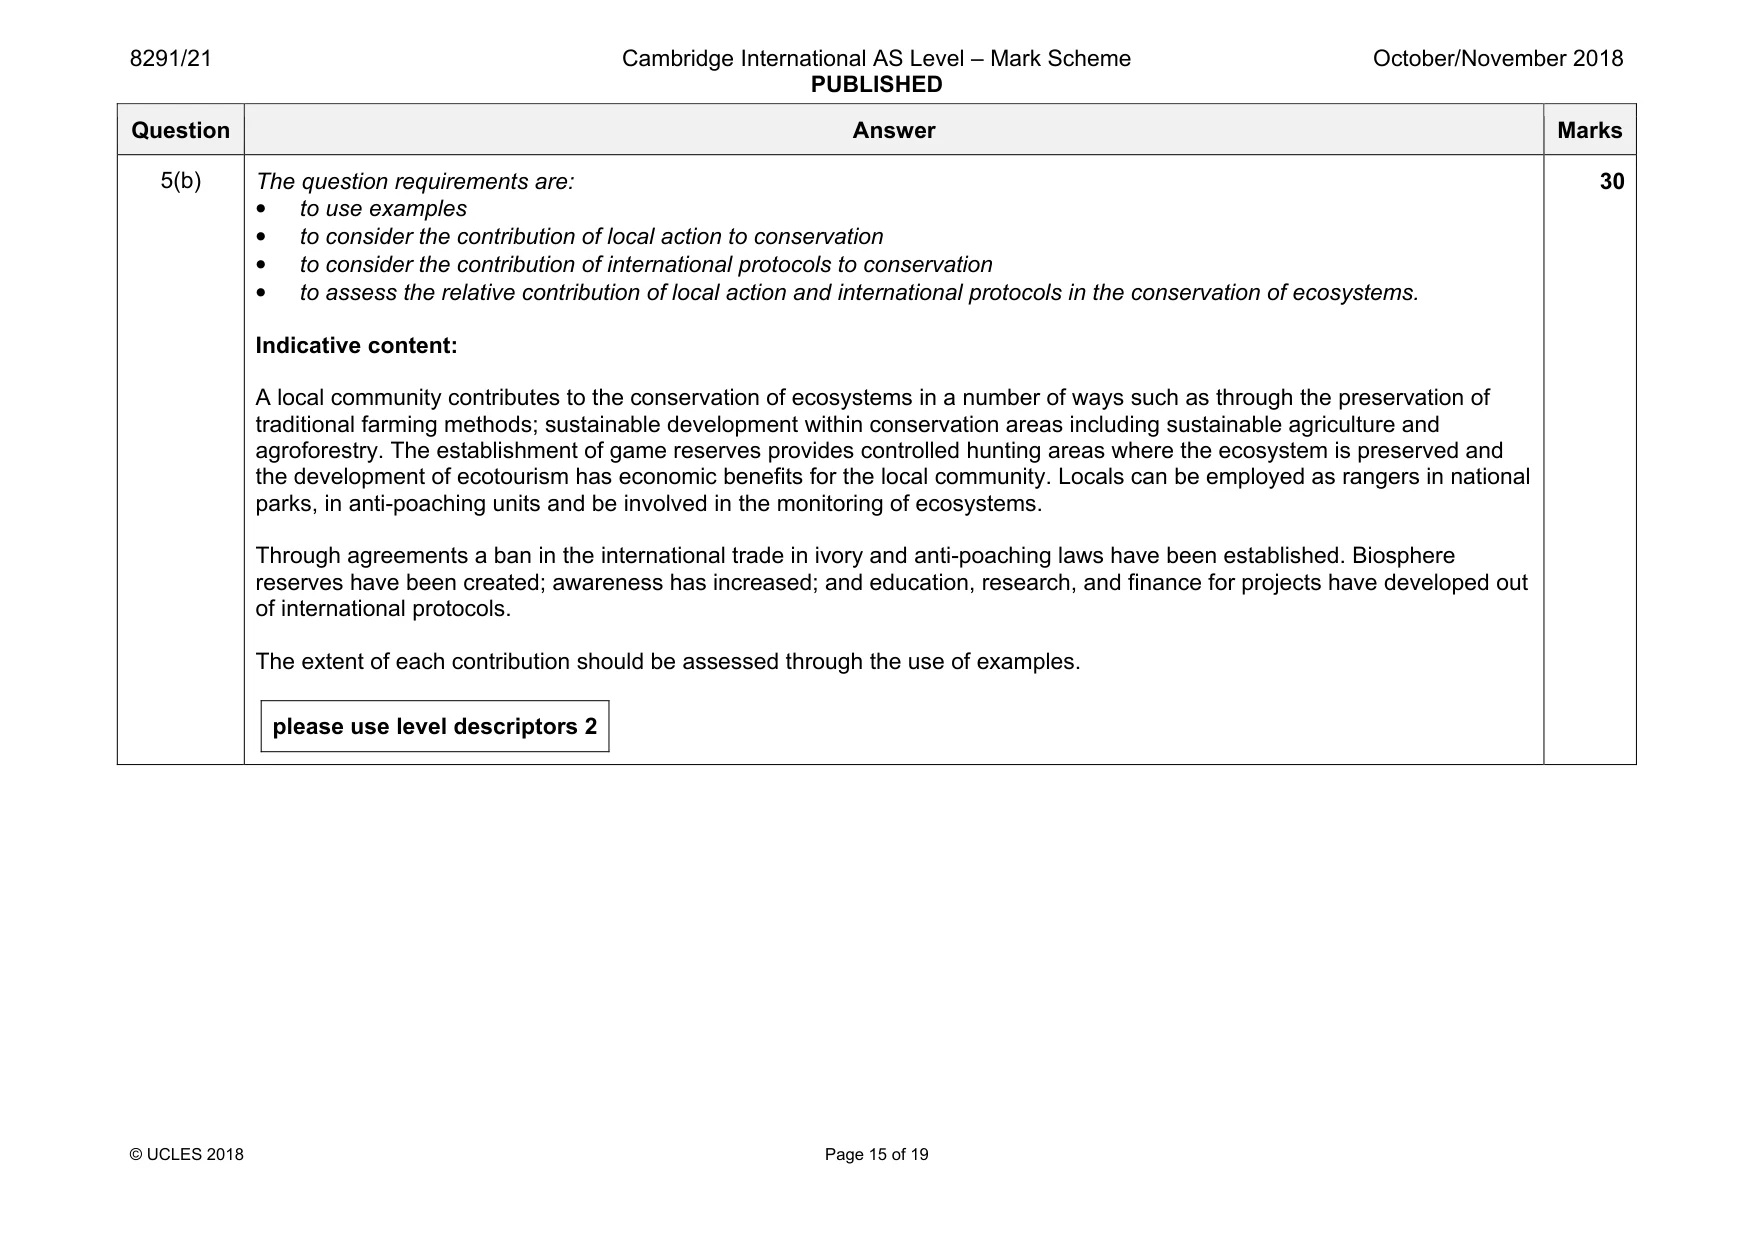
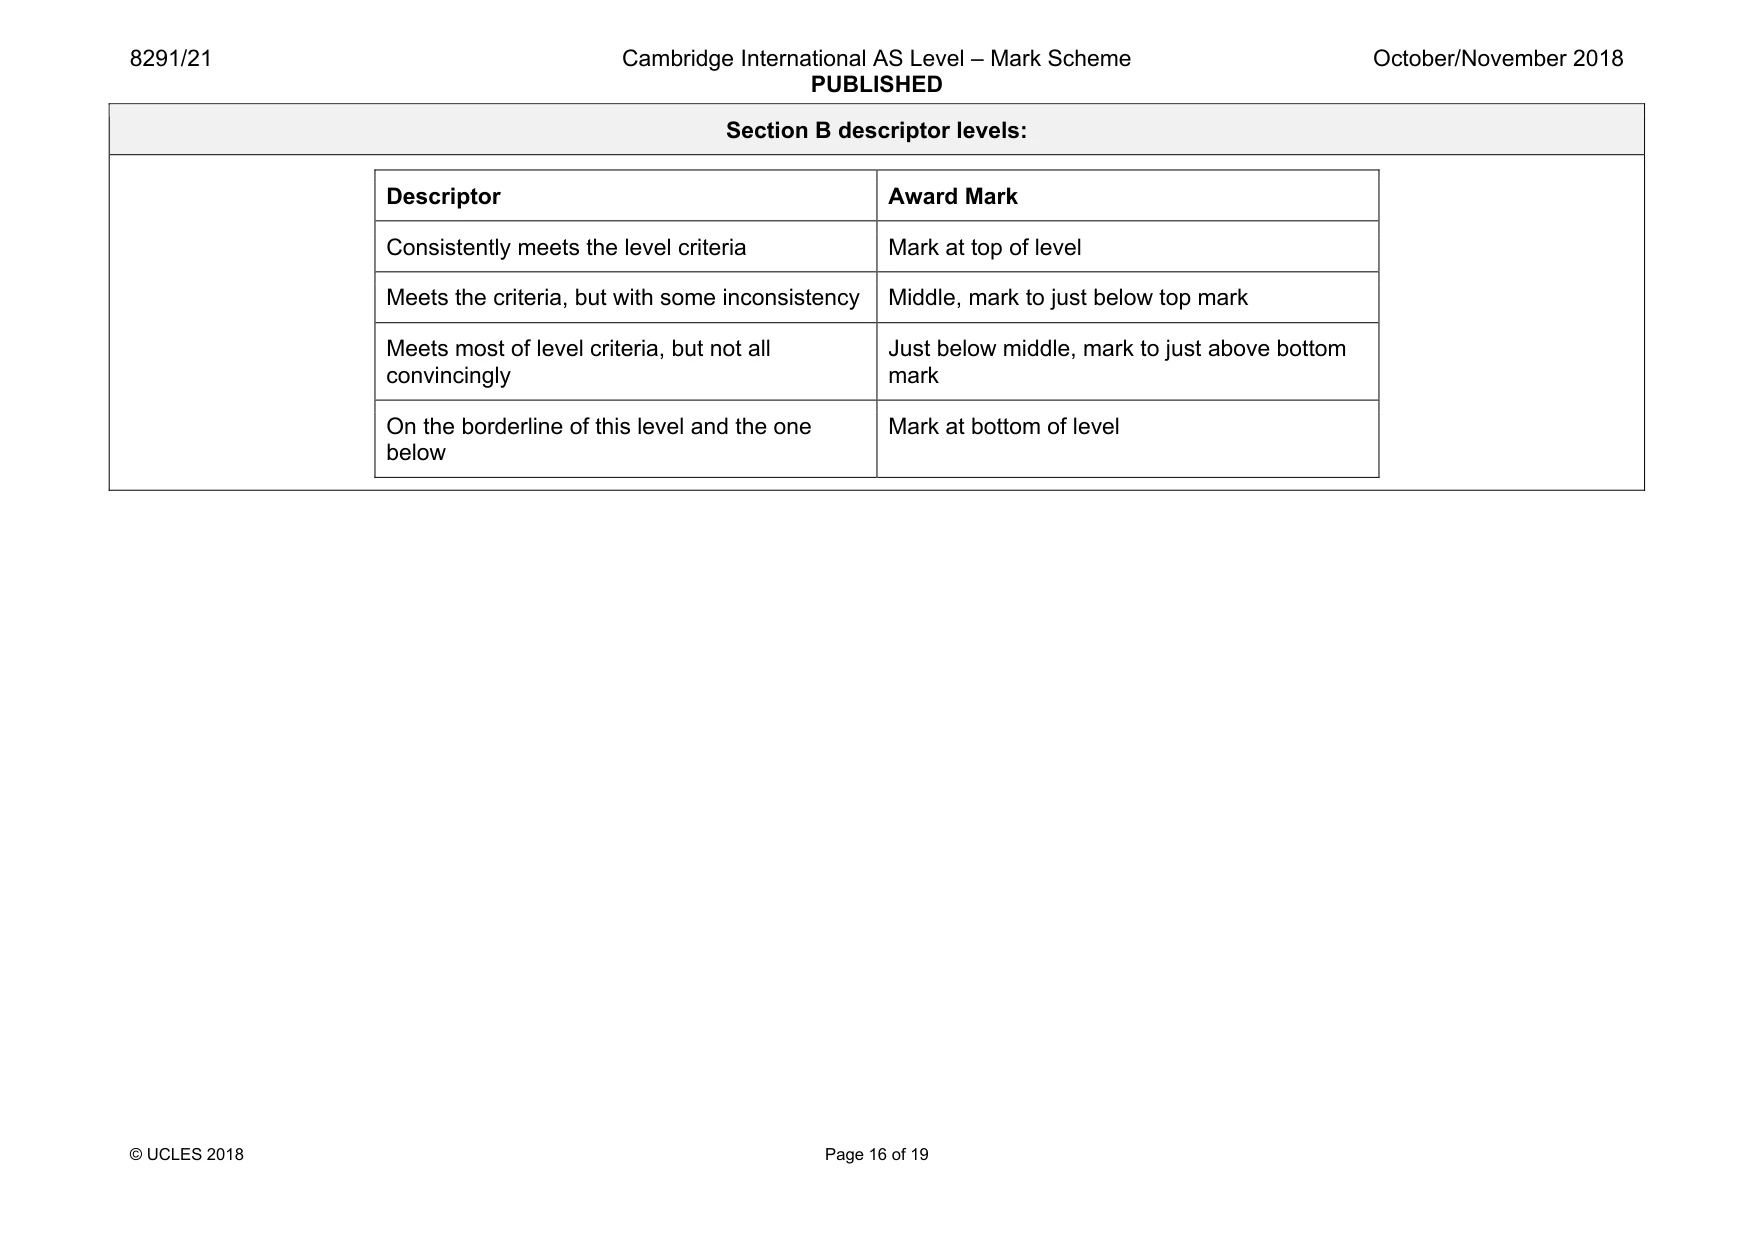
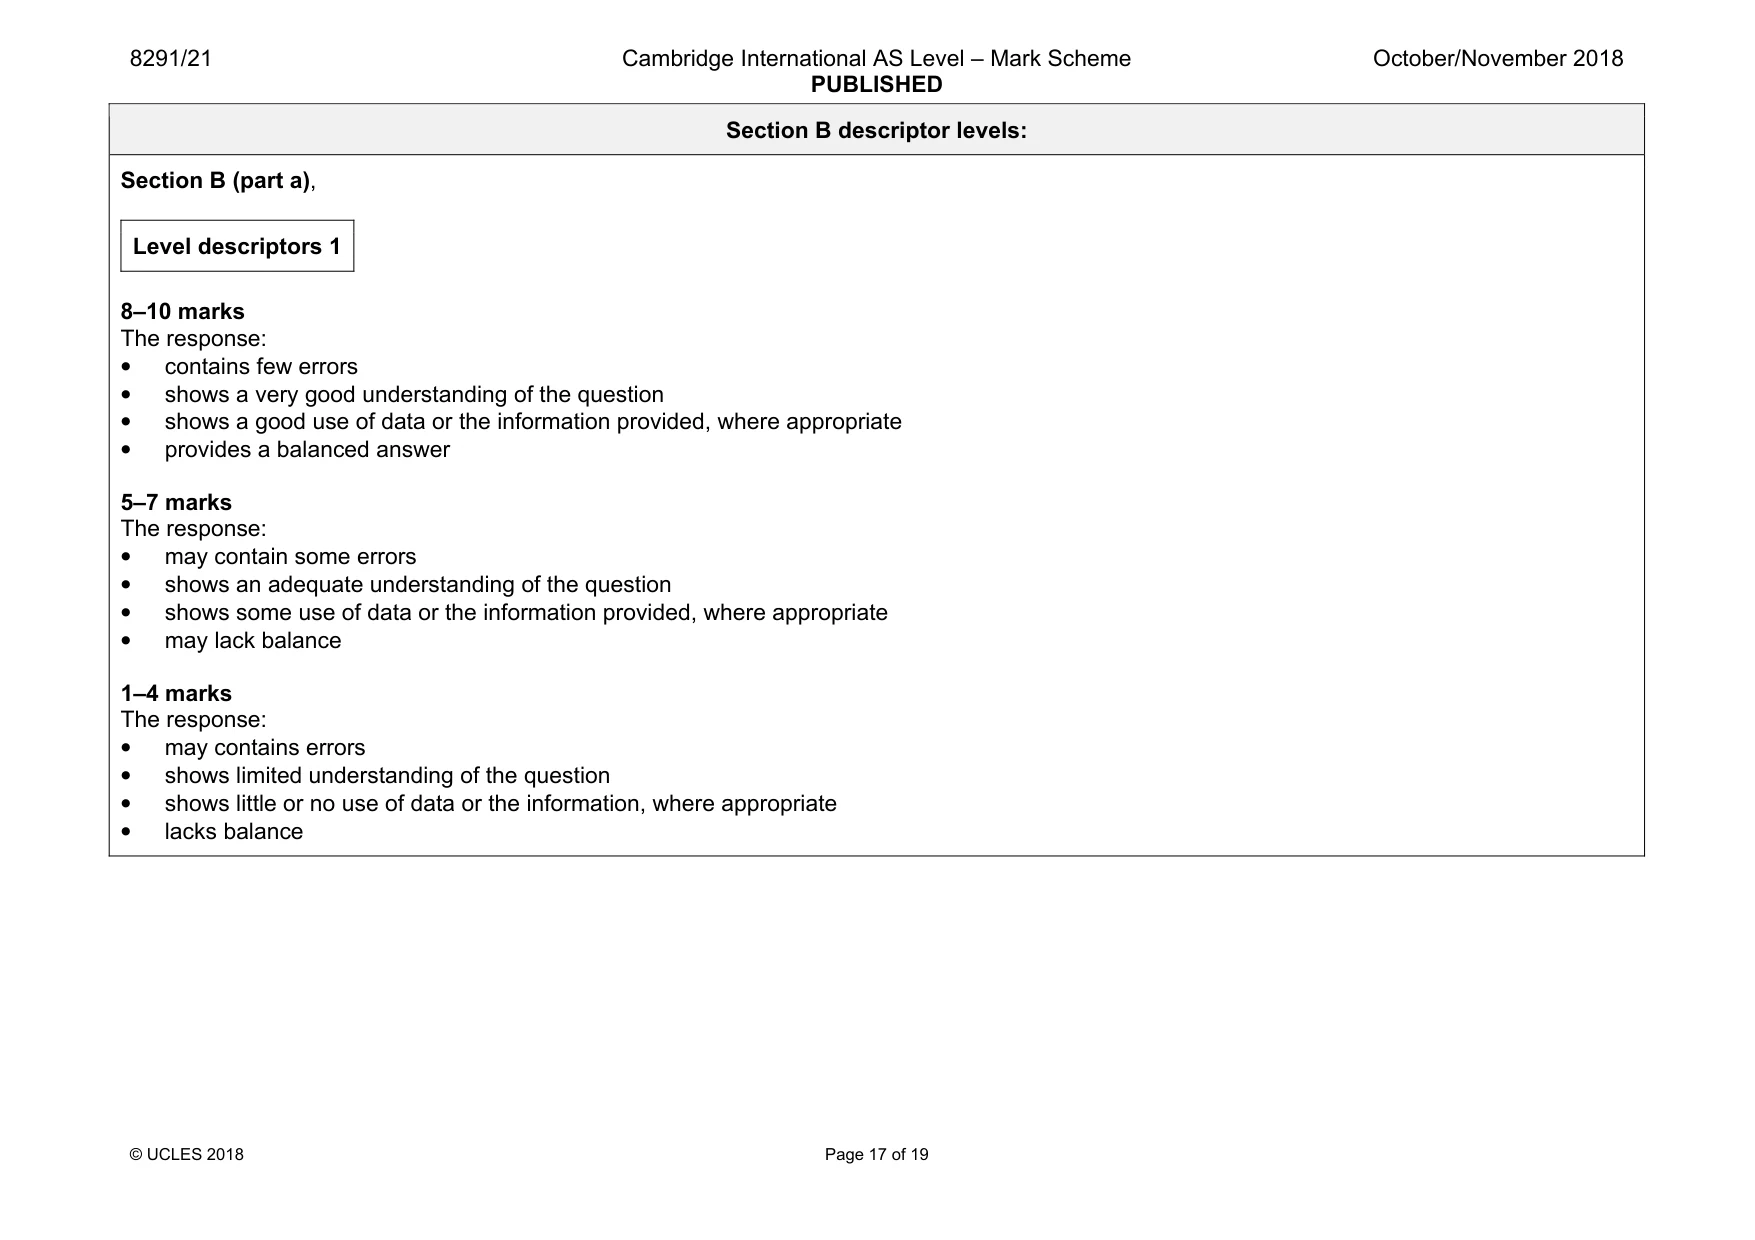
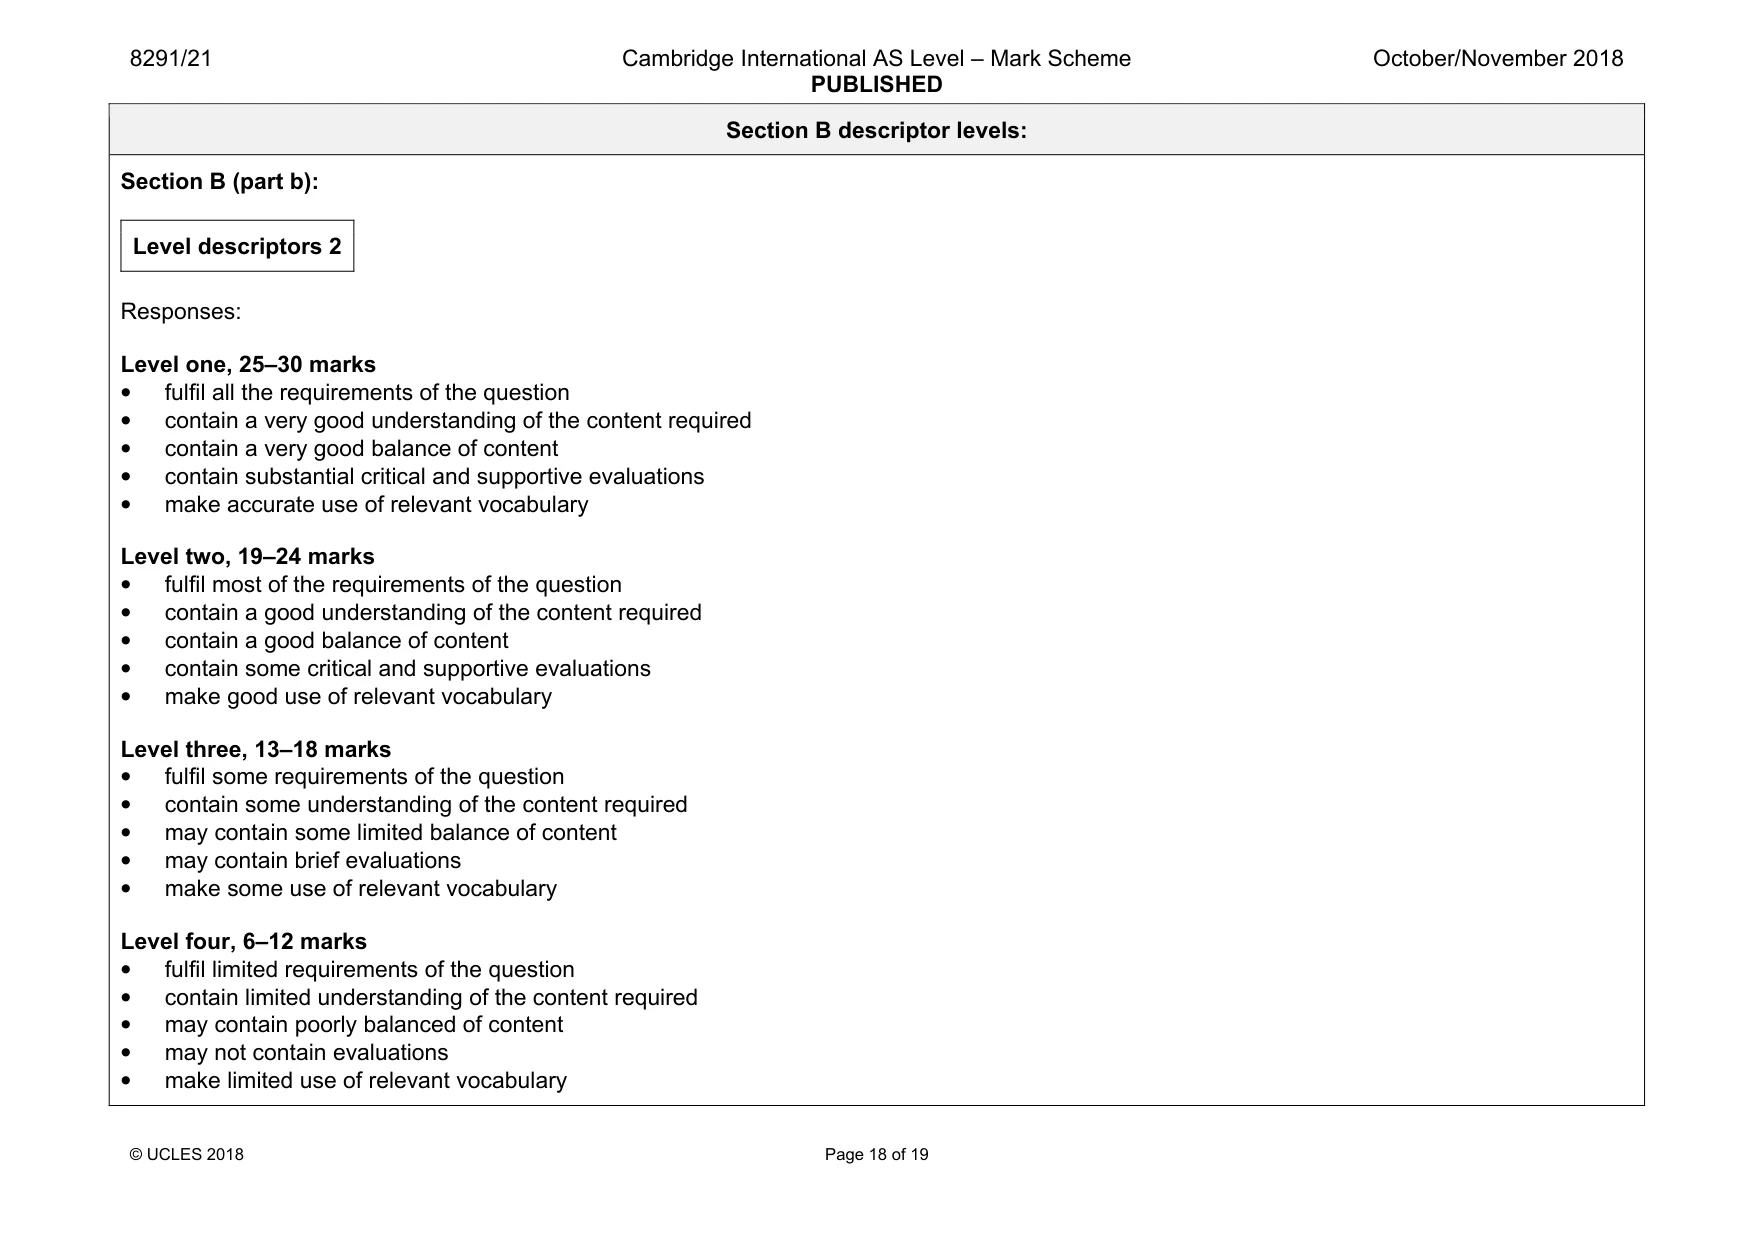
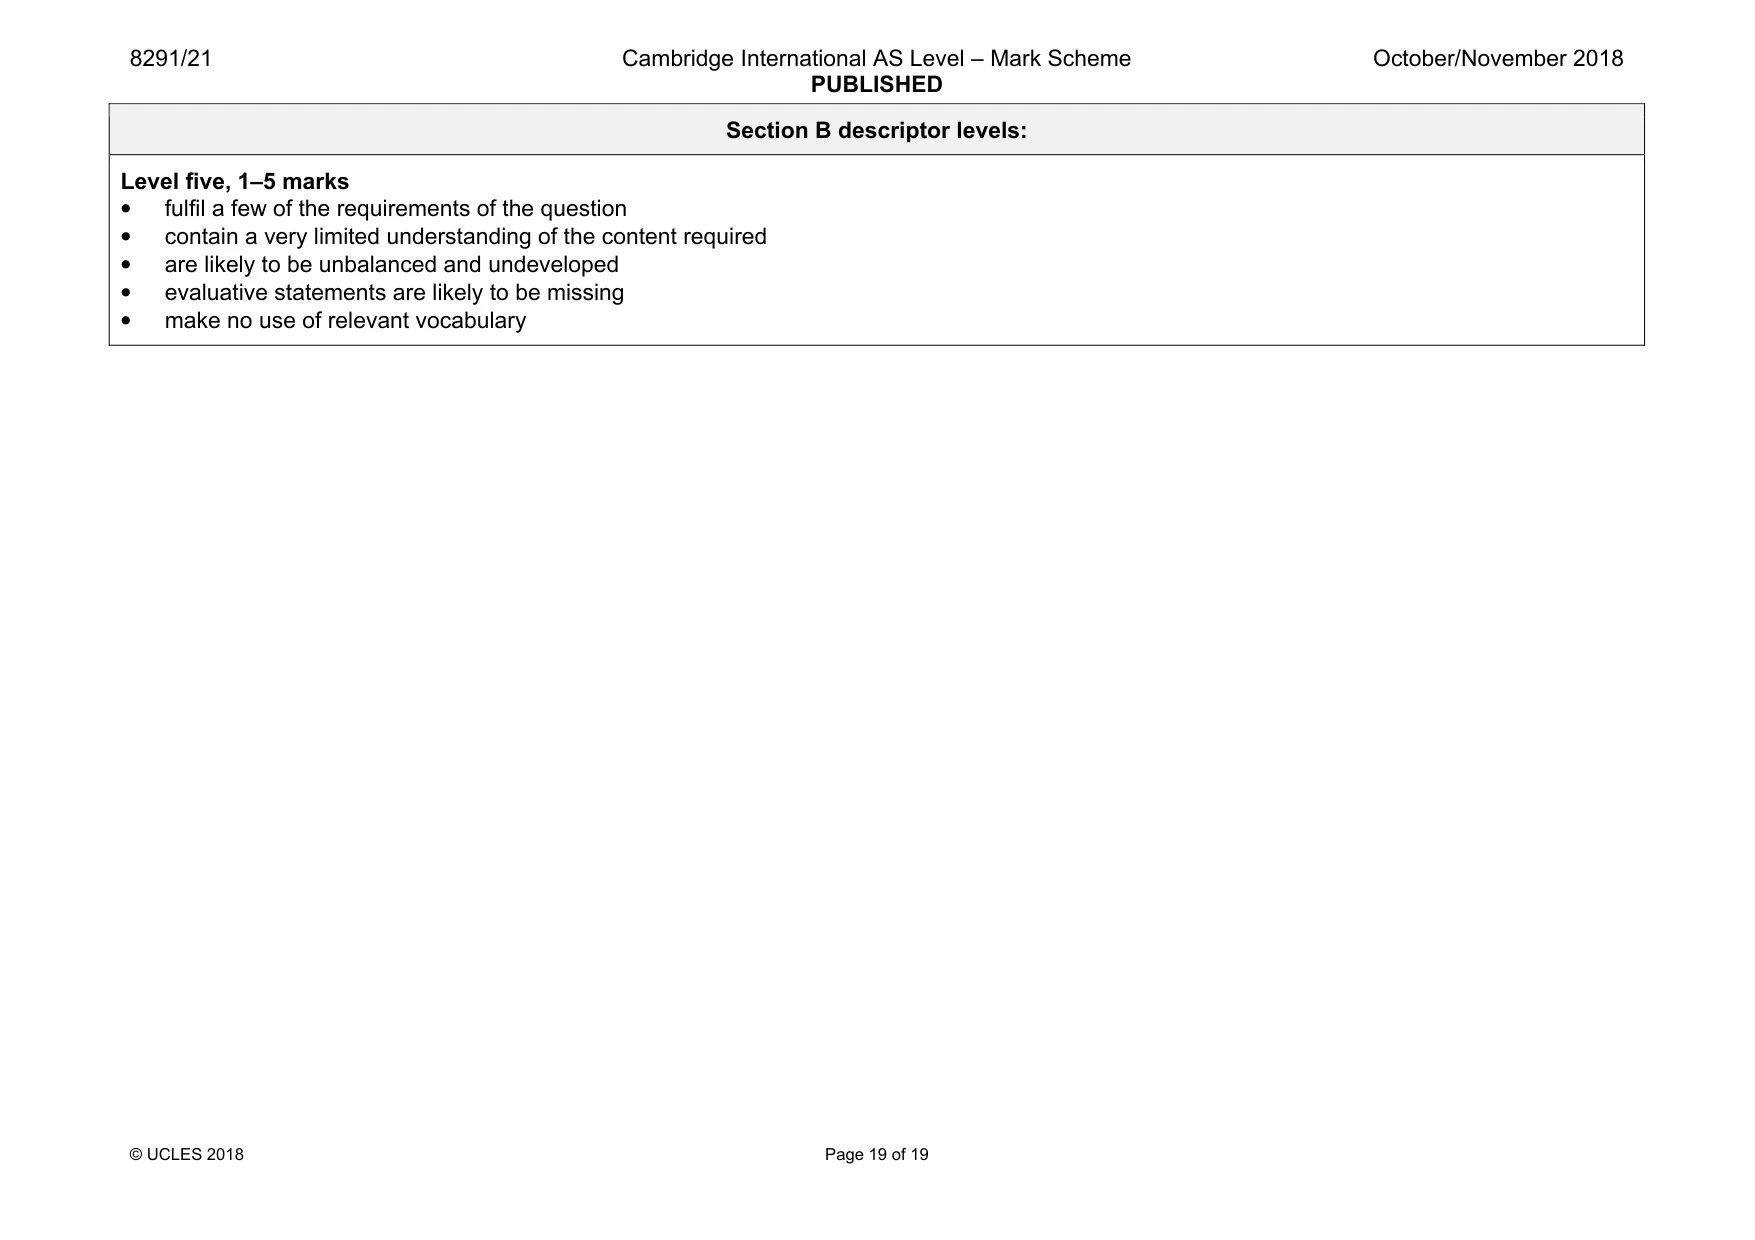
Mark scheme: 5(a) Significant change has occurred in the number of black rhino with an overall decrease of 95 000 in the population between 1960 and 2010. The black rhino population was higher than the white rhino population in 1960 but lower by 2010. There was a dramatic decrease in the numbers of black rhino between 1970 and 1980 which was then followed by a slowing in the rate of decrease. The lowest population of 2500 occurred in 1990 but since then there has been gradual rise in the population to 5000 in 2010. The white rhino population shows an increase in population of 18 000 between 1960 and 2010. Although the population was lower than the black rhino until the 1980’s, there has since been a gradual increase in the population and numbers are now higher than the black rhino. Reasons for the changes in population numbers may include reference to destruction of habitat, and uncontrolled hunting in the earlier years. The establishment of protected areas; ecotourism; anti-poaching laws as well as international pressure and the status of the rhino, as an endangered species; may be considered to explain the increasing numbers.. please use level descriptors 1 10 Question Answer Marks 5(b) The question requirements are: • to use examples • to consider the contribution of local action to conservation • to consider the contribution of international protocols to conservation • to assess the relative contribution of local action and international protocols in the conservation of ecosystems. Indicative content: A local community contributes to the conservation of ecosystems in a number of ways such as through the preservation of traditional farming methods; sustainable development within conservation areas including sustainable agriculture and agroforestry. The establishment of game reserves provides controlled hunting areas where the ecosystem is preserved and the development of ecotourism has economic benefits for the local community. Locals can be employed as rangers in national parks, in anti-poaching units and be involved in the monitoring of ecosystems. Through agreements a ban in the international trade in ivory and anti-poaching laws have been established. Biosphere reserves have been created; awareness has increased; and education, research, and finance for projects have developed out of international protocols. The extent of each contribution should be assessed through the use of examples. please use level descriptors 2 30 Section B descriptor levels: Descriptor Award Mark Consistently meets the level criteria Mark at top of level Meets the criteria, but with some inconsistency Middle, mark to just below top mark Meets most of level criteria, but not all convincingly Just below middle, mark to just above bottom mark On the borderline of this level and the one below Mark at bottom of level Section B descriptor levels: Section B (part a), Level descriptors 1 8–10 marks The response: • contains few errors • shows a very good understanding of the question • shows a good use of data or the information provided, where appropriate • provides a balanced answer 5–7 marks The response: • may contain some errors • shows an adequate understanding of the question • shows some use of data or the information provided, where appropriate • may lack balance 1–4 marks The response: • may contains errors • shows limited understanding of the question • shows little or no use of data or the information, where appropriate • lacks balance Section B descriptor levels: Section B (part b): Level descriptors 2 Responses: Level one, 25–30 marks • fulfil all the requirements of the question • contain a very good understanding of the content required • contain a very good balance of content • contain substantial critical and supportive evaluations • make accurate use of relevant vocabulary Level two, 19–24 marks • fulfil most of the requirements of the question • contain a good understanding of the content required • contain a good balance of content • contain some critical and supportive evaluations • make good use of relevant vocabulary Level three, 13–18 marks • fulfil some requirements of the question • contain some understanding of the content required • may contain some limited balance of content • may contain brief evaluations • make some use of relevant vocabulary Level four, 6–12 marks • fulfil limited requirements of the question • contain limited understanding of the content required • may contain poorly balanced of content • may not contain evaluations • make limited use of relevant vocabulary Section B descriptor levels: Level five, 1–5 marks • fulfil a few of the requirements of the question • contain a very limited understanding of the content required • are likely to be unbalanced and undeveloped • evaluative statements are likely to be missing • make no use of relevant vocabulary
What was in this paper
The subtopics covered by these 5 questions, and how many questions each got. Open one in a new tab to see every Cambridge question on it.