Cambridge A Level Environmental Management (AS only) 8291 — 2018 Oct/Nov Paper 1 · Variant 2
8291/12/O/N/18
The question paper and its mark scheme, free to read here and free to download. This is Cambridge’s own paper, exactly as it was sat.
Question paper16 pages







Mark scheme13 pages
Answers below. Sit the paper first if you are practising.
Paper as text
Question paper, page 1
* 9 1 4 6 0 1 3 8 7 5 * This document consists of 13 printed pages and 3 blank pages. DC (NF/CGW) 153683/4 © UCLES 2018 [Turn over Cambridge International Examinations Cambridge International Advanced Subsidiary Level ENVIRONMENTAL MANAGEMENT 8291/12 Paper 1 Lithosphere and Atmosphere October/November 2018 1 hour 30 minutes Additional Materials: Answer Booklet/Paper READ THESE INSTRUCTIONS FIRST Write your Centre number, candidate number and name on all the work you hand in. Write in dark blue or black pen. You may use an HB pencil for any diagrams or graphs. Do not use staples, paper clips, glue or correction fluid. DO NOT WRITE IN ANY BARCODES. Electronic calculators may be used. You may lose marks if you do not show your working or if you do not use appropriate units. Section A Answer all questions in this section. Write your answers in the spaces provided on the question paper. Section B Answer one question from this section. Write your answers on the separate answer paper provided. At the end of the examination, 1. fasten all separate answer paper securely to the question paper; 2. enter the question number from Section B in the grid. For Examiner’s Use Section A 1 2 Section B Total
Question paper, page 2
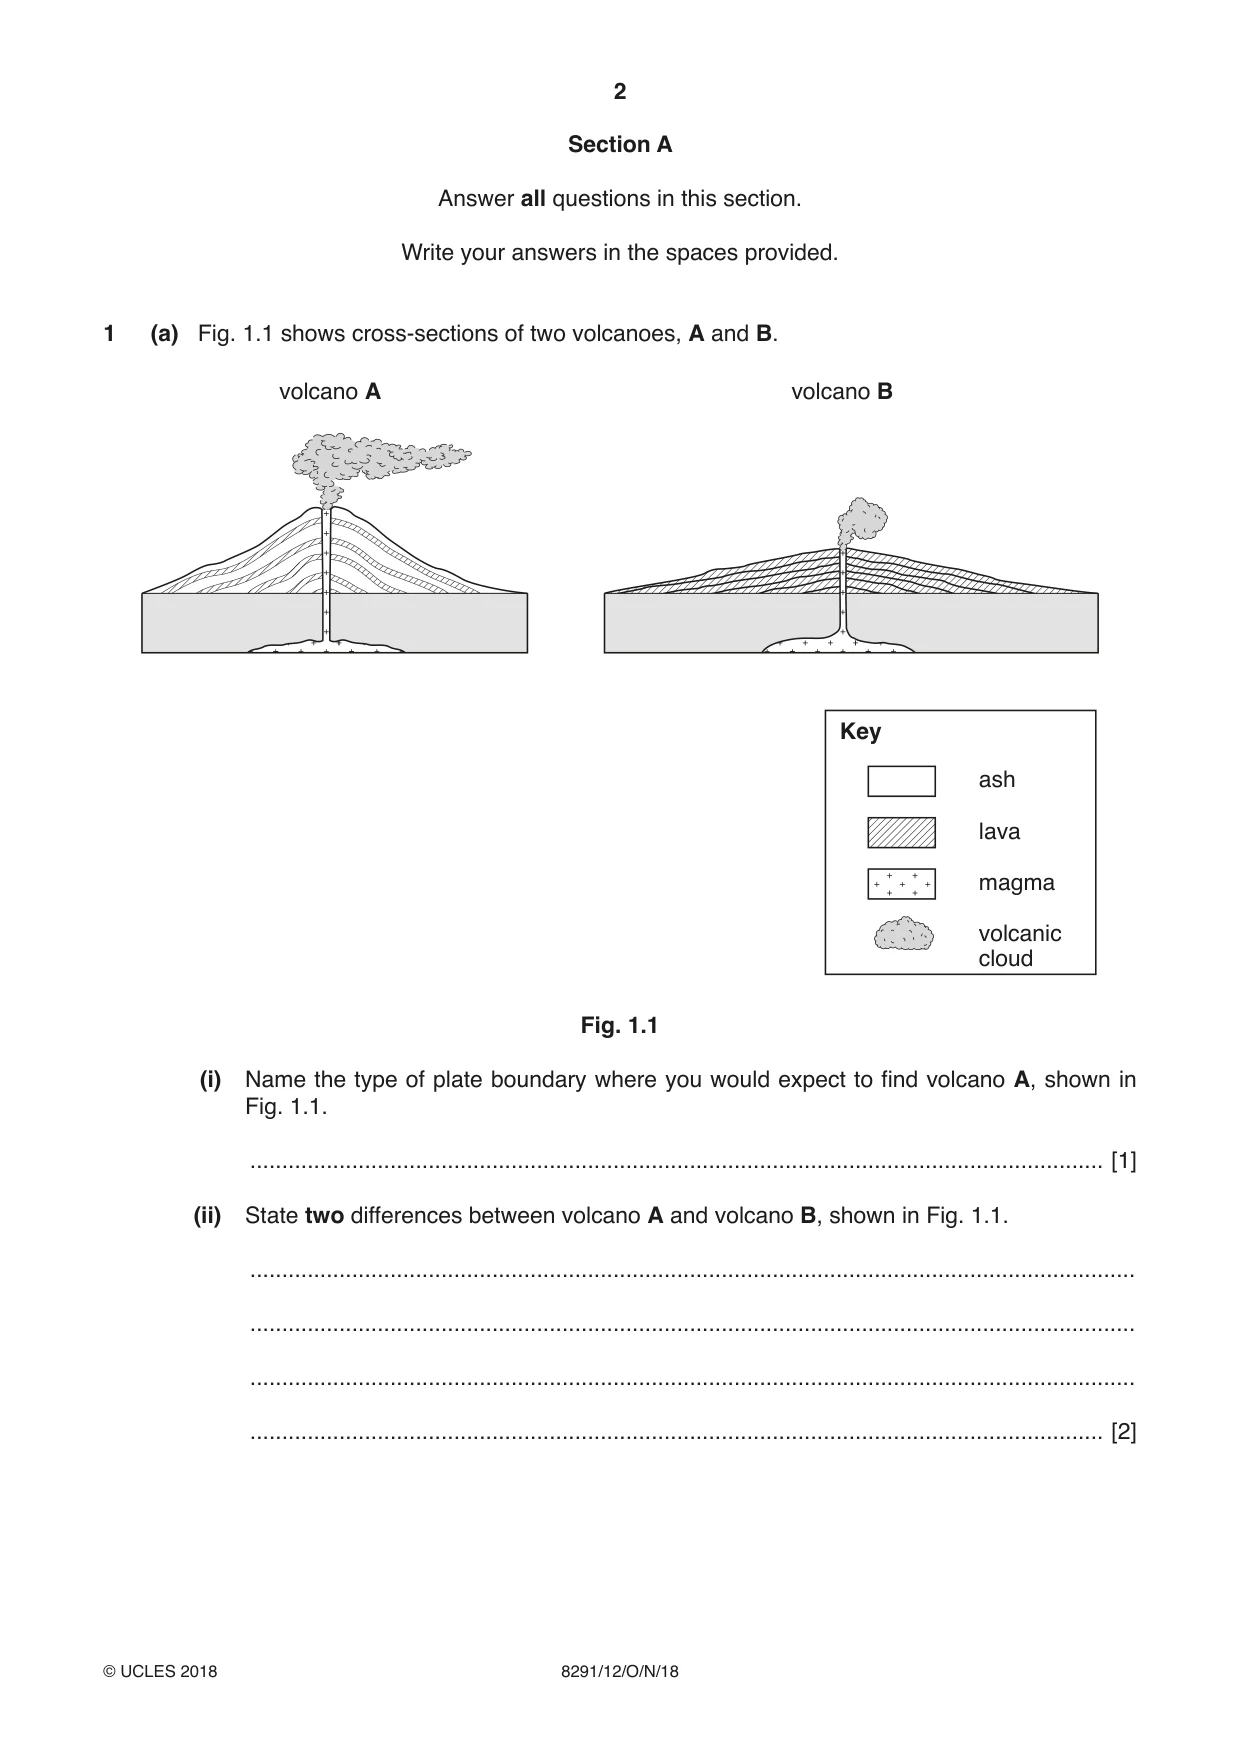
2 8291/12/O/N/18 © UCLES 2018 Section A Answer all questions in this section. Write your answers in the spaces provided. 1 (a) Fig. 1.1 shows cross-sections of two volcanoes, A and B. Key ash volcano A volcano B lava magma volcanic cloud Fig. 1.1 (i) Name the type of plate boundary where you would expect to find volcano A, shown in Fig. 1.1. … [1] (ii) State two differences between volcano A and volcano B, shown in Fig. 1.1. … … … … [2]
Question paper, page 3
3 8291/12/O/N/18 © UCLES 2018 [Turn over (iii) Describe how three hazards associated with the eruption of volcano A, shown in Fig. 1.1, can affect people. … … … … … … … … … … … … [6]
Question paper, page 4
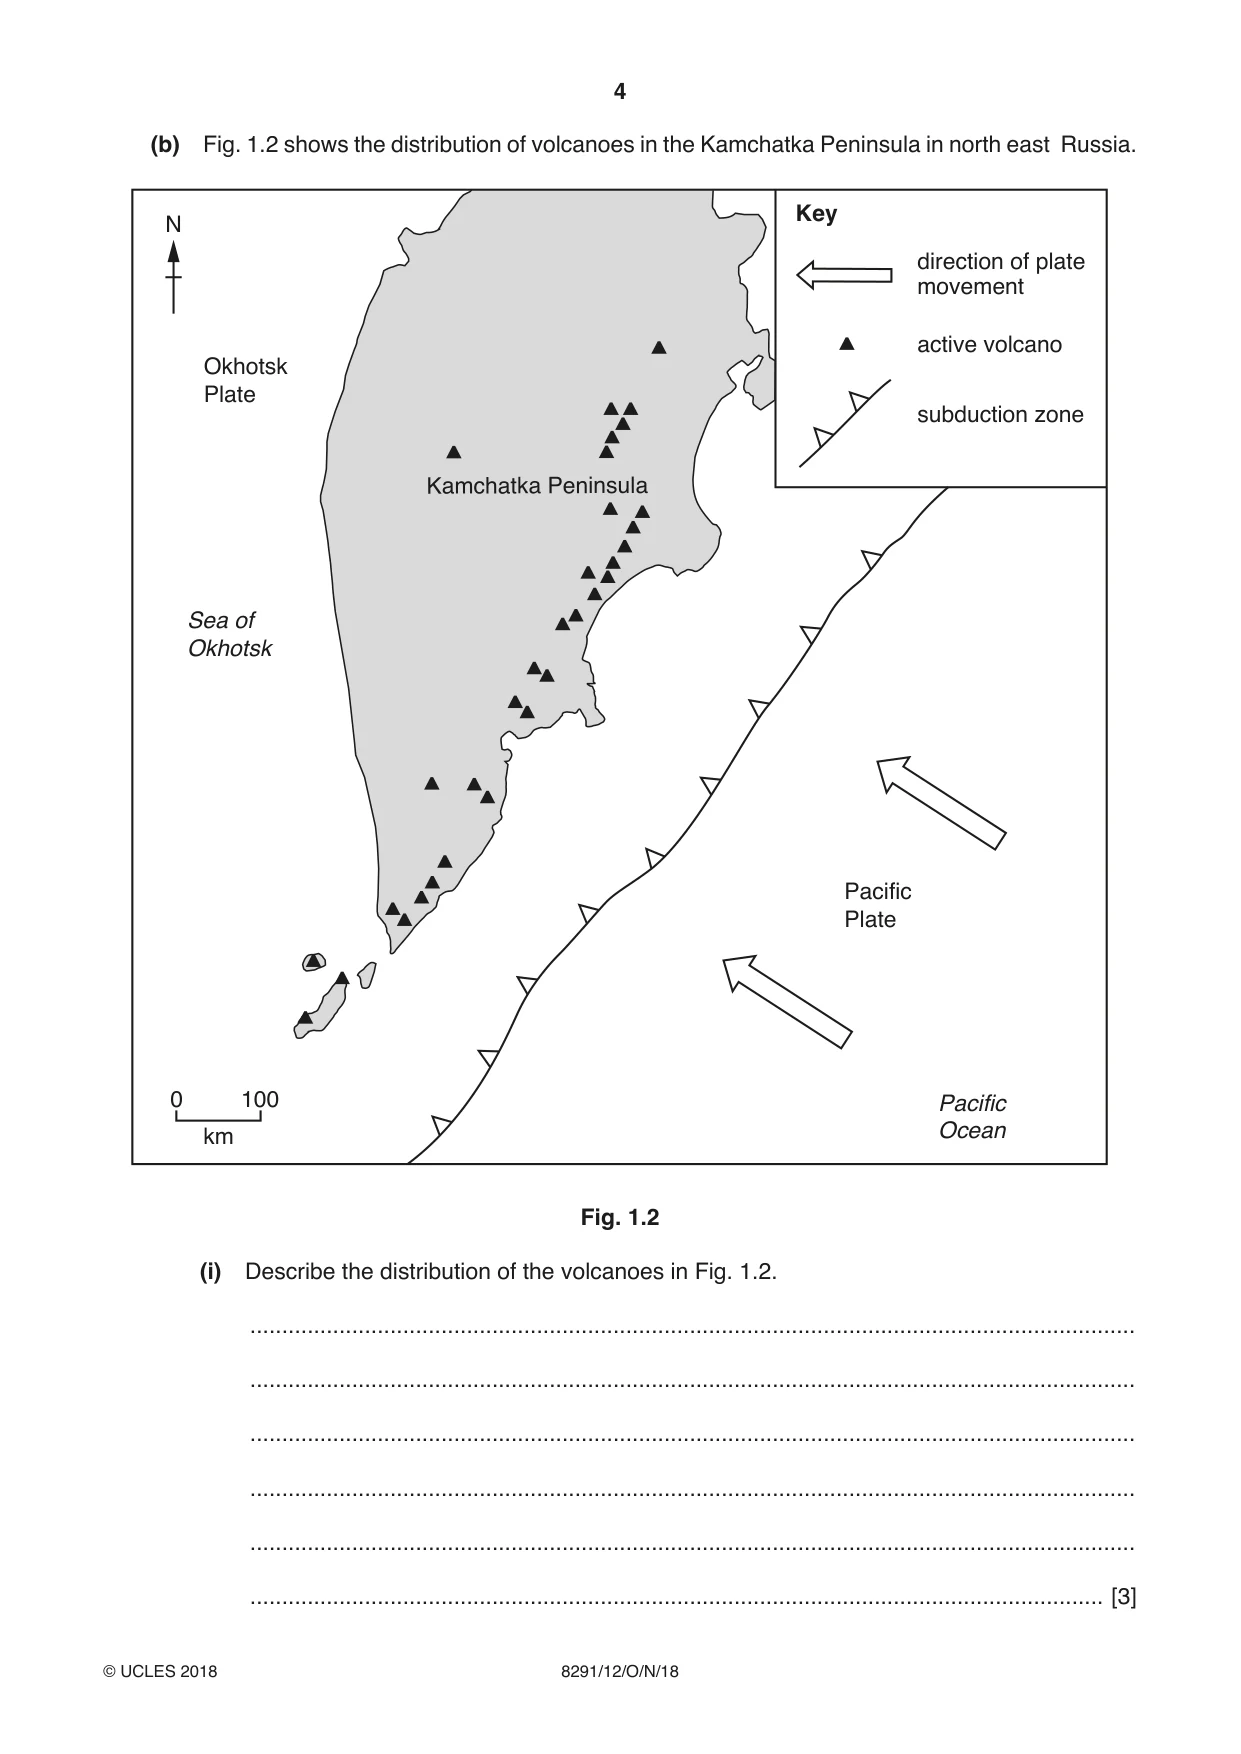
4 8291/12/O/N/18 © UCLES 2018 (b) Fig. 1.2 shows the distribution of volcanoes in the Kamchatka Peninsula in north east Russia. Key direction of plate movement N active volcano Kamchatka Peninsula subduction zone Pacific Plate 0 100 km Pacific Ocean Sea of Okhotsk Okhotsk Plate Fig. 1.2 (i) Describe the distribution of the volcanoes in Fig. 1.2. … … … … … … [3]
Question paper, page 5
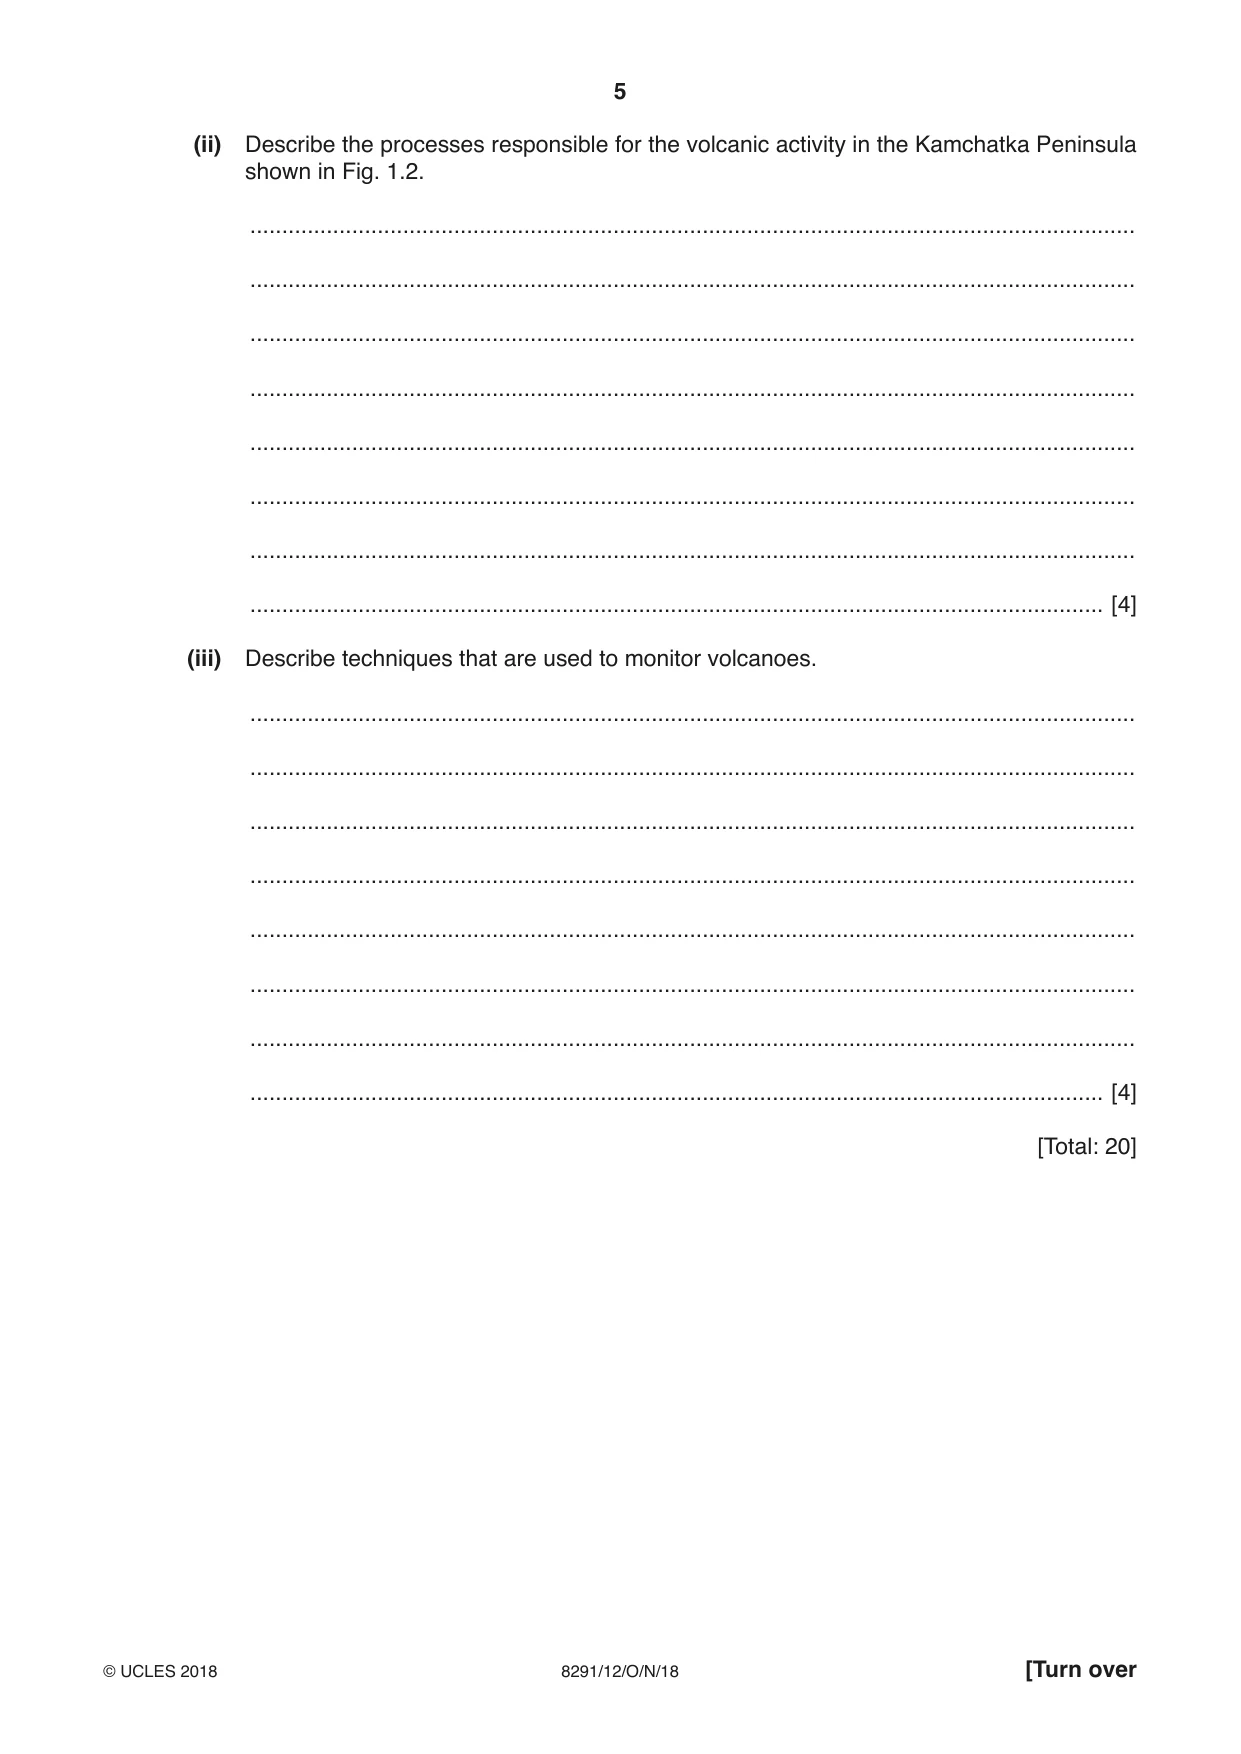
5 8291/12/O/N/18 © UCLES 2018 [Turn over (ii) Describe the processes responsible for the volcanic activity in the Kamchatka Peninsula shown in Fig. 1.2. … … … … … … … … [4] (iii) Describe techniques that are used to monitor volcanoes. … … … … … … … … [4] [Total: 20]
Question paper, page 6
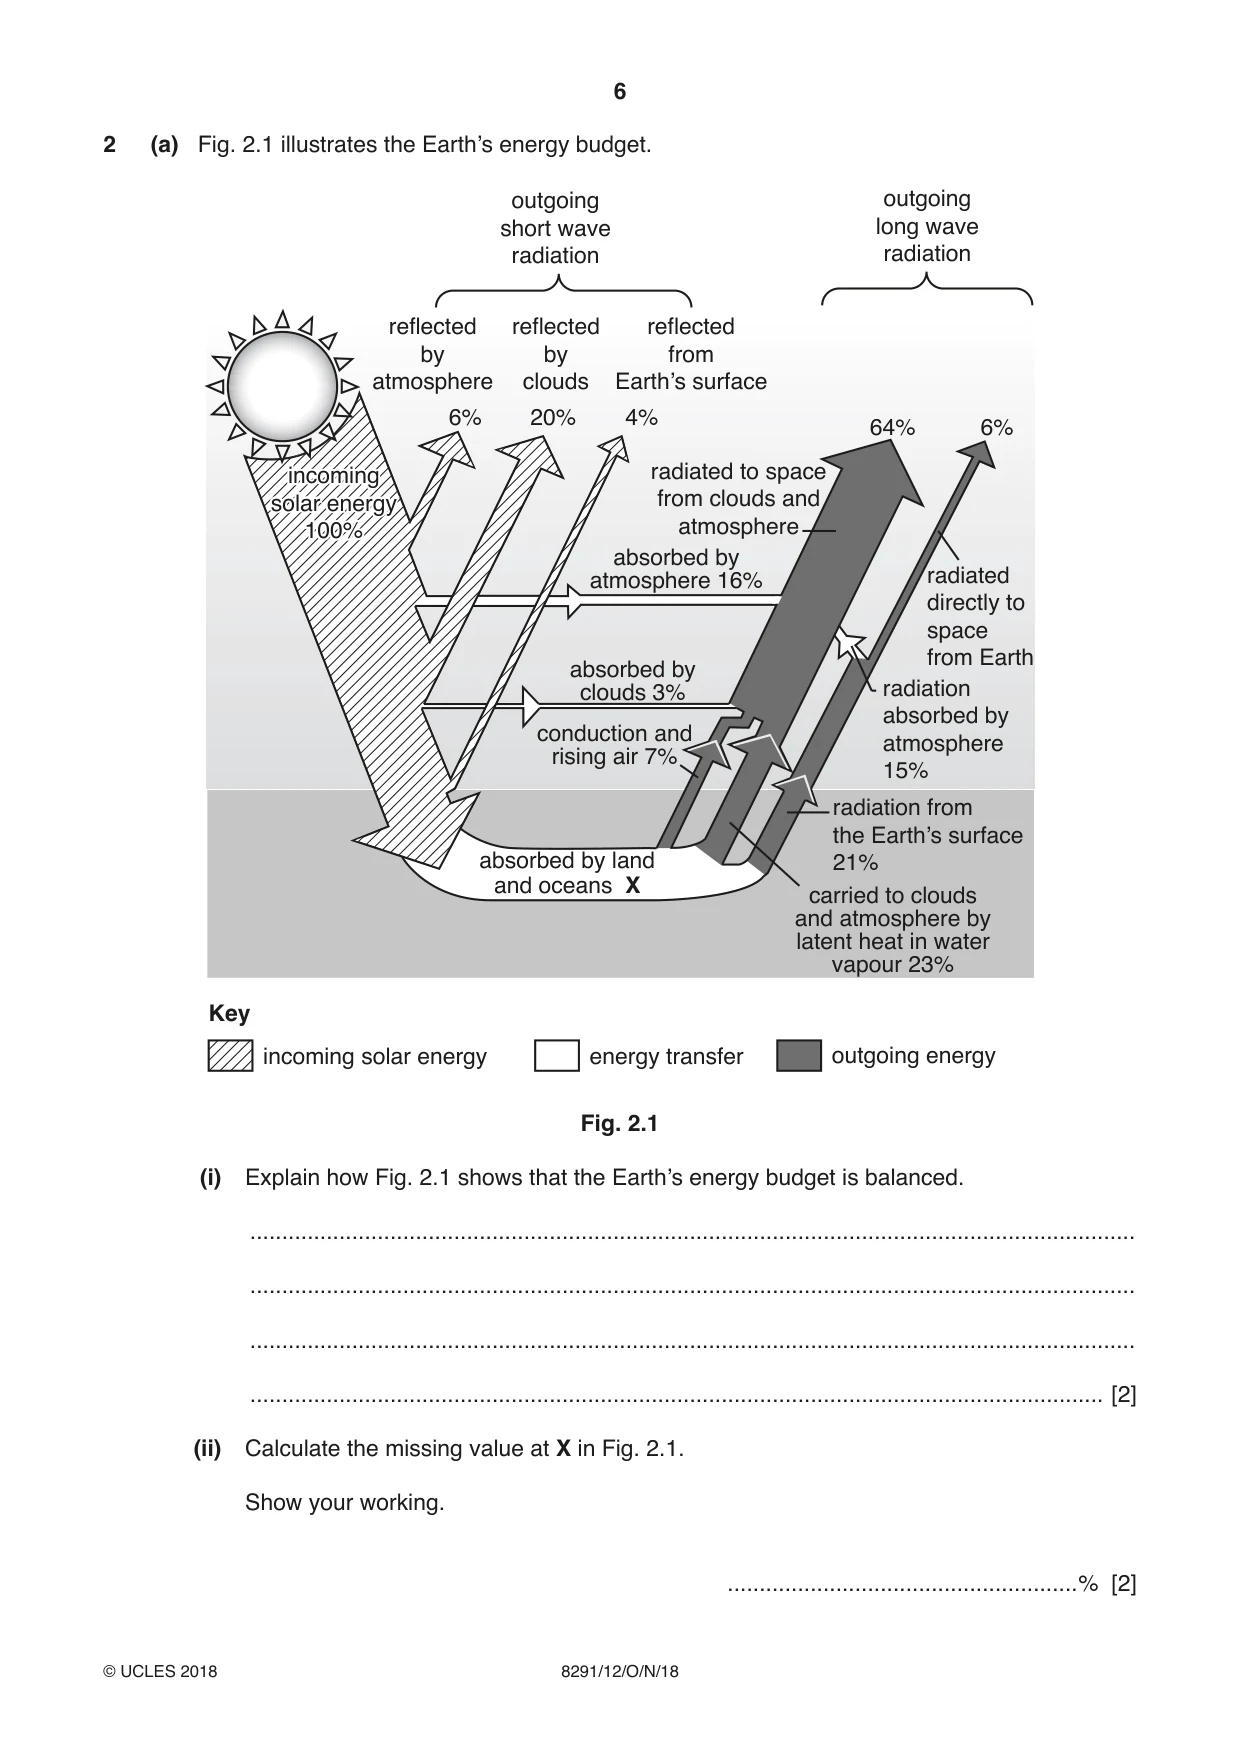
6 8291/12/O/N/18 © UCLES 2018 2 (a) Fig. 2.1 illustrates the Earth’s energy budget. radiated to space from clouds and atmosphere absorbed by atmosphere 16% absorbed by clouds 3% conduction and rising air 7% 64% 6% reflected by atmosphere radiation absorbed by atmosphere 15% radiation from the Earth’s surface 21% radiated directly to space from Earth reflected by clouds reflected from Earth’s surface outgoing short wave radiation outgoing long wave radiation carried to clouds and atmosphere by latent heat in water vapour 23% 6% 20% 4% Key incoming solar energy energy transfer outgoing energy absorbed by land and oceans X incoming solar energy 100% incoming solar energy 100% Fig. 2.1 (i) Explain how Fig. 2.1 shows that the Earth’s energy budget is balanced. … … … … [2] (ii) Calculate the missing value at X in Fig. 2.1. Show your working. …% [2]
Question paper, page 7
7 8291/12/O/N/18 © UCLES 2018 [Turn over (iii) Explain two ways in which clouds affect transfers of energy within the Earth’s energy budget as illustrated in Fig. 2.1. … … … … … … … … [4] (iv) Suggest ways in which human activity might influence the Earth’s energy budget. … … … … … … … … … … … … [6]
Question paper, page 8
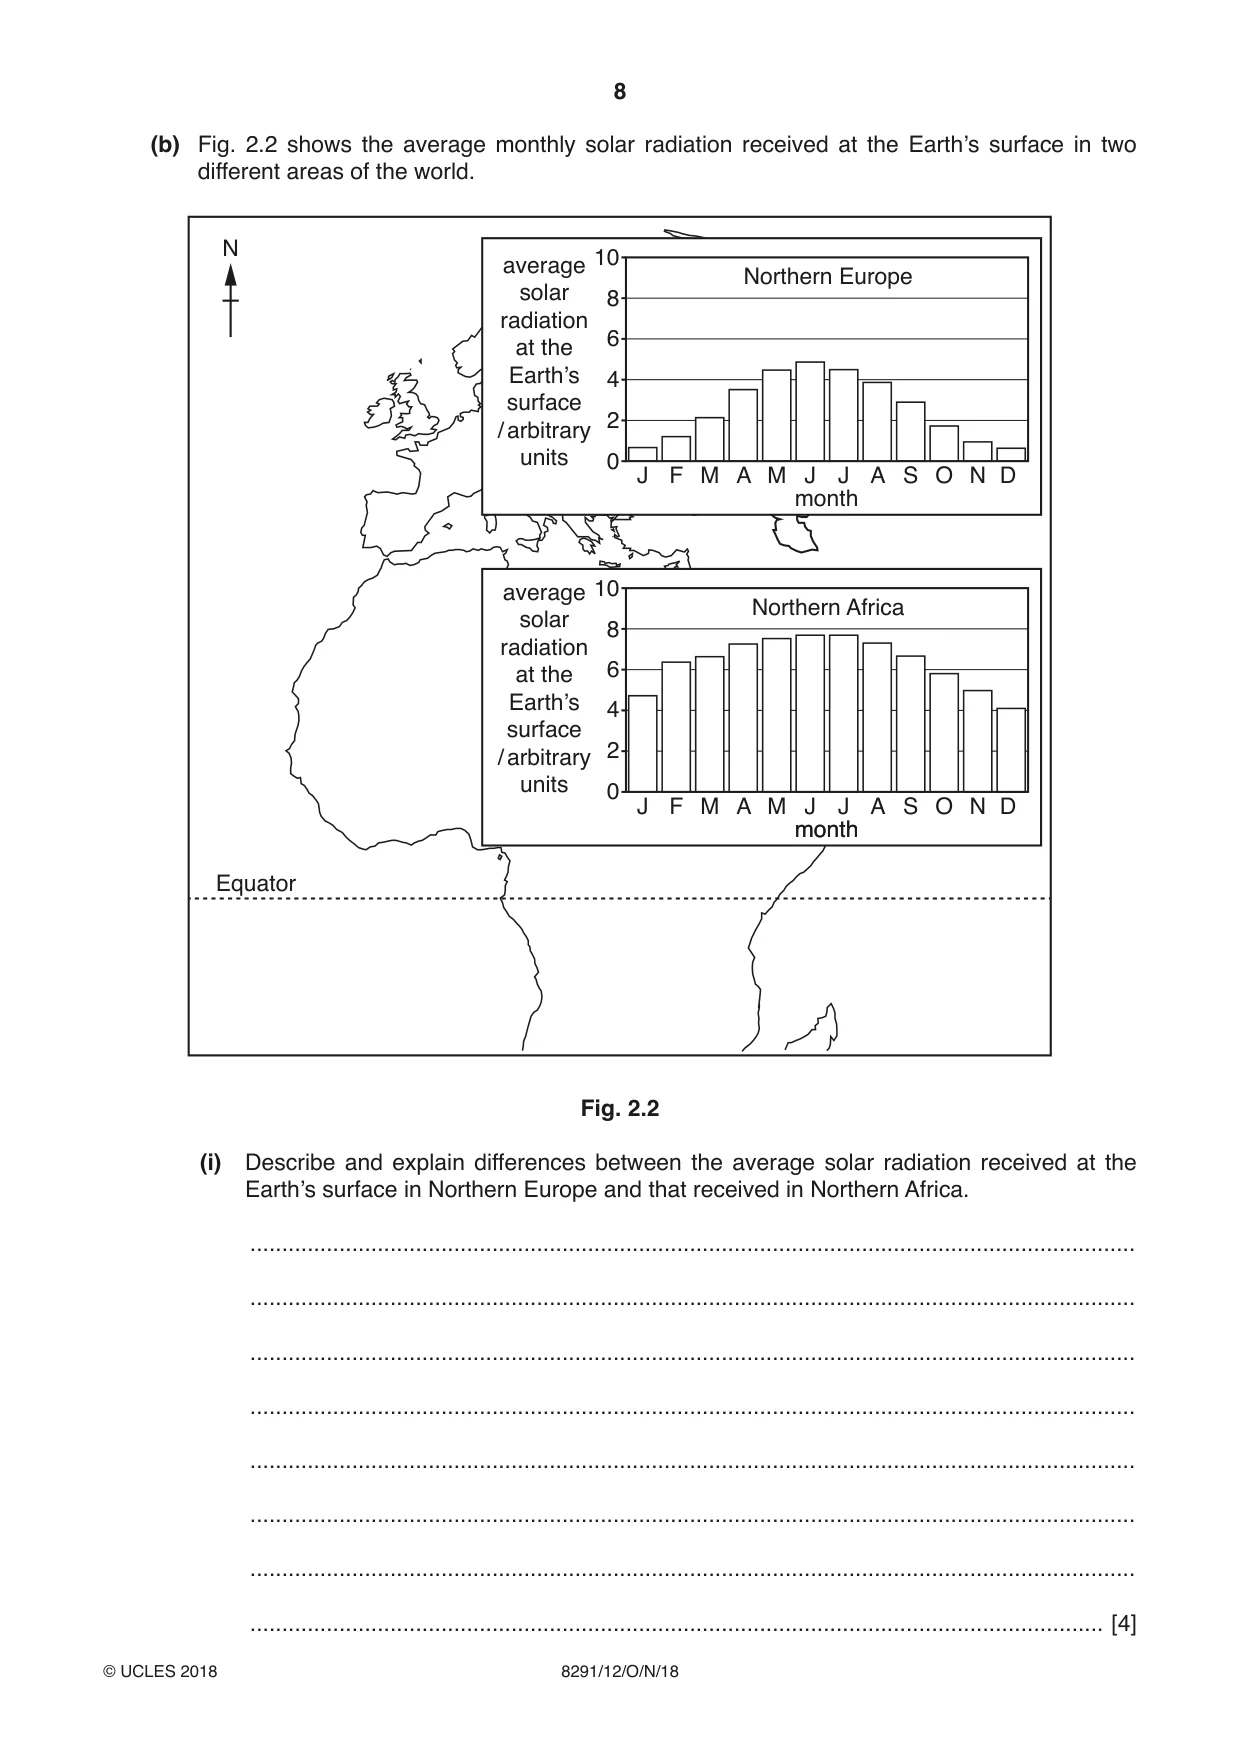
8 8291/12/O/N/18 © UCLES 2018 (b) Fig. 2.2 shows the average monthly solar radiation received at the Earth’s surface in two different areas of the world. Northern Africa Equator month average solar radiation at the Earth’s surface / arbitrary units 10 8 6 4 2 0 Northern Europe month 10 8 6 4 2 0 J F M A M J J A S O N D average solar radiation at the Earth’s surface / arbitrary units N month J F M A M J J A S O N D Fig. 2.2 (i) Describe and explain differences between the average solar radiation received at the Earth’s surface in Northern Europe and that received in Northern Africa. … … … … … … … … [4]
Question paper, page 9
9 8291/12/O/N/18 © UCLES 2018 [Turn over (ii) Explain why the oceans warm more slowly than the land when heated by the same amount of solar radiation. … … … … [2] [Total: 20]
Question paper, page 10
10 8291/12/O/N/18 © UCLES 2018 BLANK PAGE
Question paper, page 11
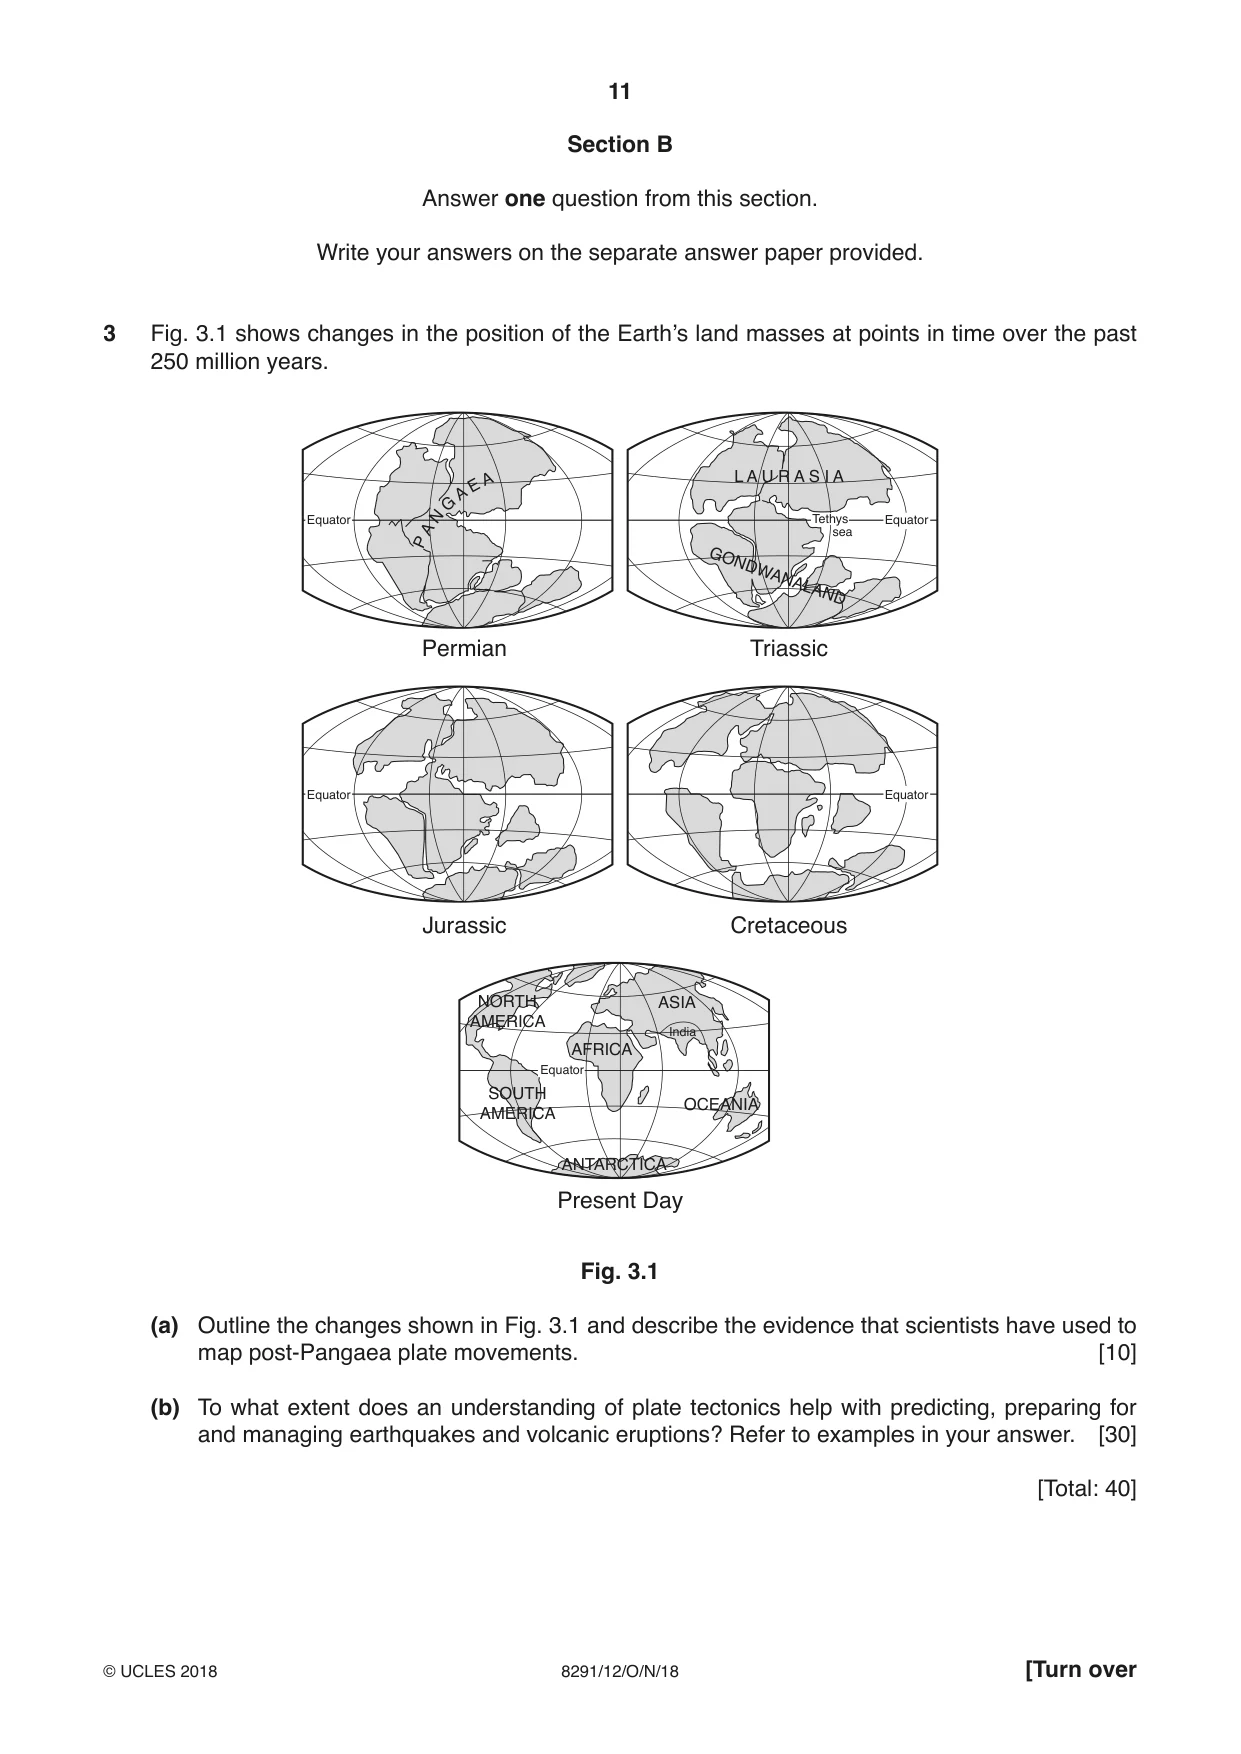
11 8291/12/O/N/18 © UCLES 2018 [Turn over Section B Answer one question from this section. Write your answers on the separate answer paper provided. 3 Fig. 3.1 shows changes in the position of the Earth’s land masses at points in time over the past 250 million years. Jurassic Cretaceous Present Day Permian Equator India Triassic L A U R A S I A GONDWANALAND P A N G A E A ASIA AFRICA OCEANIA ANTARCTICA SOUTH AMERICA NORTH AMERICA Equator Equator Equator Equator Tethys sea Fig. 3.1 (a) Outline the changes shown in Fig. 3.1 and describe the evidence that scientists have used to map post-Pangaea plate movements. [10] (b) To what extent does an understanding of plate tectonics help with predicting, preparing for and managing earthquakes and volcanic eruptions? Refer to examples in your answer. [30] [Total: 40]
Question paper, page 12
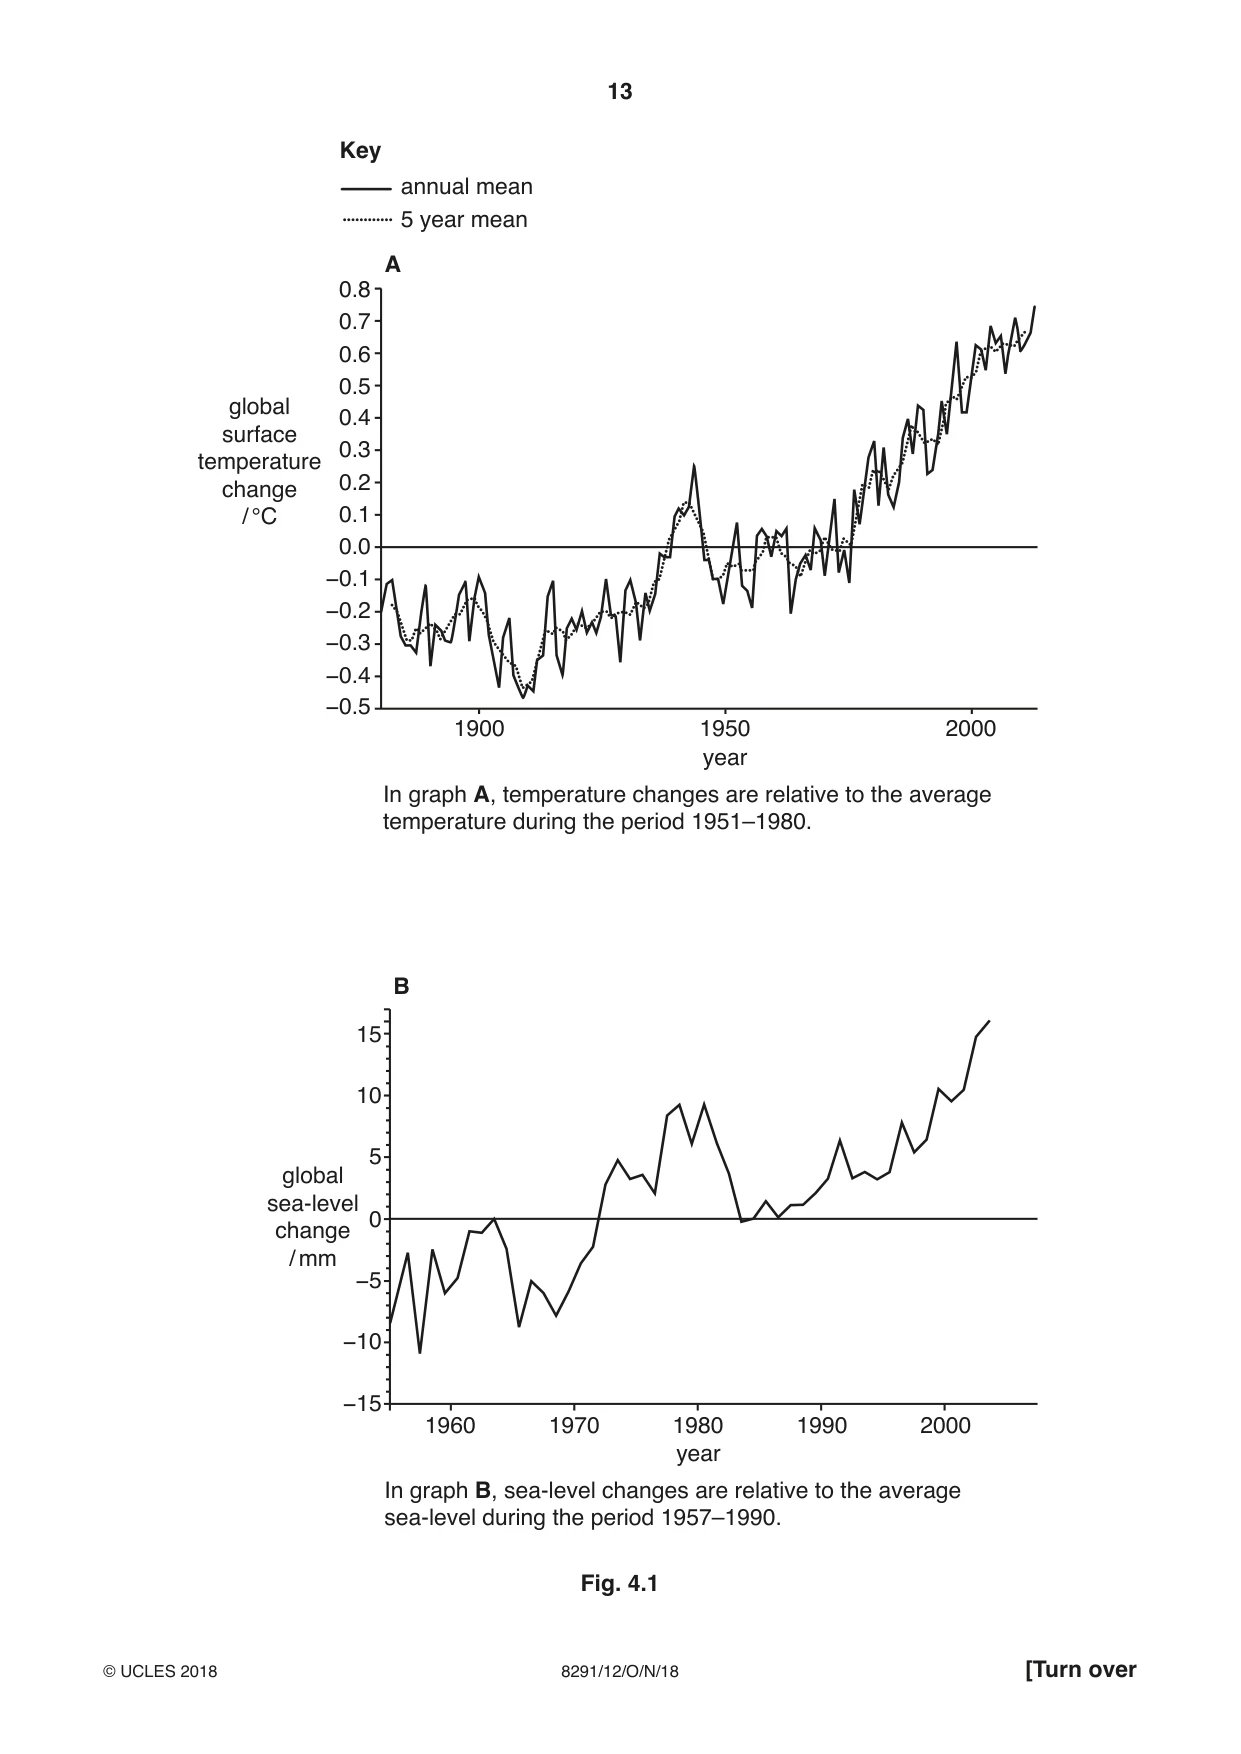
12 8291/12/O/N/18 © UCLES 2018 4 Fig. 4.1 shows changes in global surface temperature in graph A between 1880 and 2014 and changes in global sea-level in graph B between 1955 and 2004. (a) Briefly describe the trends shown by graphs A and B in Fig. 4.1. [10] (b) To what extent will the impacts of future climate change vary in different parts of the world? Refer to examples in your answer. [30] [Total: 40]
Question paper, page 13
13 8291/12/O/N/18 © UCLES 2018 [Turn over 0.8 0.7 0.6 0.5 0.4 0.3 0.2 0.1 −0.1 −0.2 −0.3 −0.4 −0.5 1900 Key annual mean 5 year mean In graph A, temperature changes are relative to the average temperature during the period 1951–1980. A In graph B, sea-level changes are relative to the average sea-level during the period 1957–1990. global surface temperature change / °C 1950 year 2000 0.0 B 15 10 5 −5 −10 −15 global sea-level change / mm 1960 1970 1980 2000 1990 year 0 Fig. 4.1
Question paper, page 14
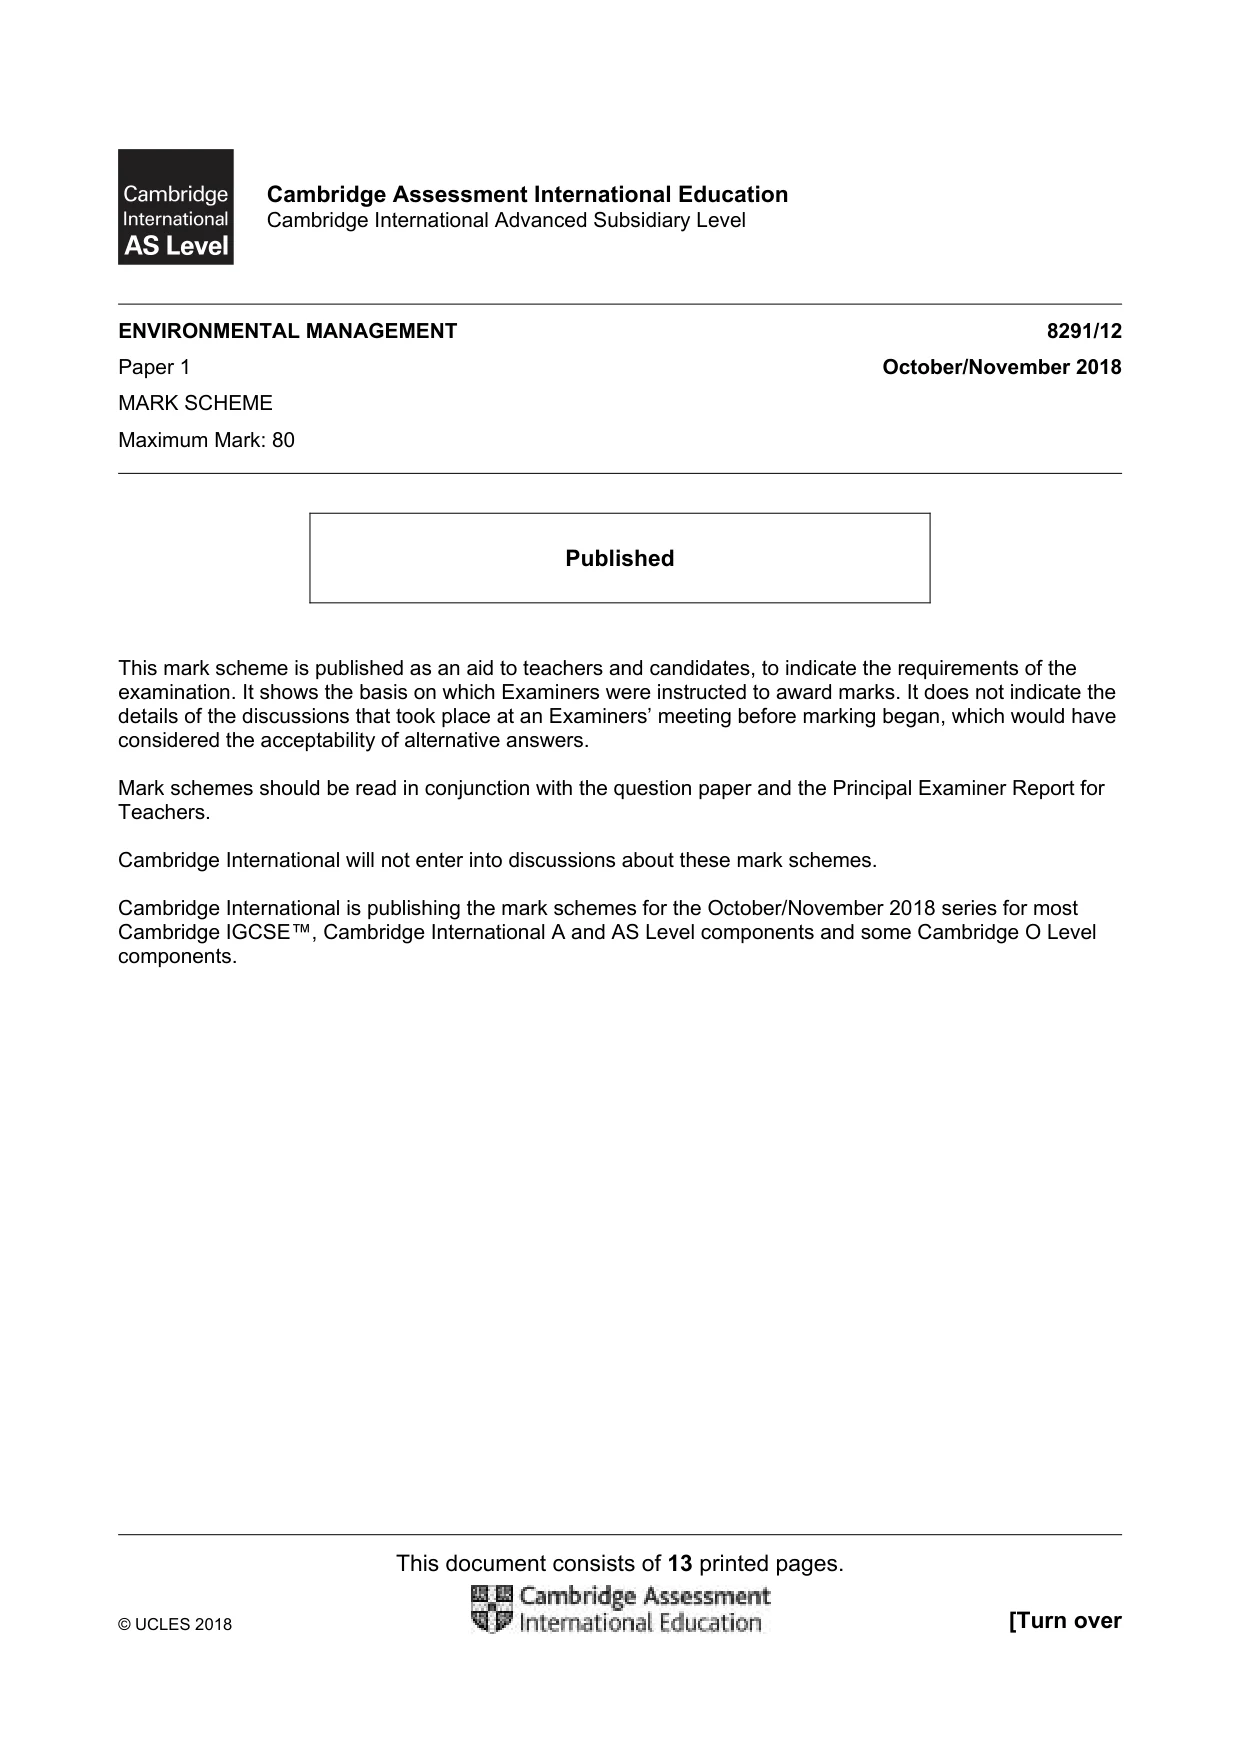
14 8291/12/O/N/18 © UCLES 2018 5 Fig. 5.1 summarises how human population growth can lead to soil deterioration. This deterioration could involve soil erosion, loss of fertility, compaction and salinisation. deforestation soil deterioration population growth agricultural intensification compaction loss of fertility soil erosion salinisation Fig. 5.1 (a) With reference to Fig. 5.1, describe and explain how population growth can lead to soil deterioration. [10] (b) Discuss the view that appropriate strategies for sustainable soil management will vary between countries at contrasting levels of economic development. [30] [Total: 40]
Question paper, page 15
15 8291/12/O/N/18 © UCLES 2018 BLANK PAGE
Question paper, page 16
16 8291/12/O/N/18 © UCLES 2018 Permission to reproduce items where third-party owned material protected by copyright is included has been sought and cleared where possible. Every reasonable effort has been made by the publisher (UCLES) to trace copyright holders, but if any items requiring clearance have unwittingly been included, the publisher will be pleased to make amends at the earliest possible opportunity. To avoid the issue of disclosure of answer-related information to candidates, all copyright acknowledgements are reproduced online in the Cambridge International Examinations Copyright Acknowledgements Booklet. This is produced for each series of examinations and is freely available to download at www.cie.org.uk after the live examination series. Cambridge International Examinations is part of the Cambridge Assessment Group. Cambridge Assessment is the brand name of University of Cambridge Local Examinations Syndicate (UCLES), which is itself a department of the University of Cambridge. BLANK PAGE
Mark scheme, page 1
This document consists of 13 printed pages. © UCLES 2018 [Turn over Cambridge Assessment International Education Cambridge International Advanced Subsidiary Level ENVIRONMENTAL MANAGEMENT 8291/12 Paper 1 October/November 2018 MARK SCHEME Maximum Mark: 80 Published This mark scheme is published as an aid to teachers and candidates, to indicate the requirements of the examination. It shows the basis on which Examiners were instructed to award marks. It does not indicate the details of the discussions that took place at an Examiners’ meeting before marking began, which would have considered the acceptability of alternative answers. Mark schemes should be read in conjunction with the question paper and the Principal Examiner Report for Teachers. Cambridge International will not enter into discussions about these mark schemes. Cambridge International is publishing the mark schemes for the October/November 2018 series for most Cambridge IGCSE™, Cambridge International A and AS Level components and some Cambridge O Level components.
Mark scheme, page 2
8291/12 Cambridge International AS Level – Mark Scheme PUBLISHED October/November 2018 © UCLES 2018 Page 2 of 13 Generic Marking Principles These general marking principles must be applied by all examiners when marking candidate answers. They should be applied alongside the specific content of the mark scheme or generic level descriptors for a question. Each question paper and mark scheme will also comply with these marking principles. GENERIC MARKING PRINCIPLE 1: Marks must be awarded in line with: • the specific content of the mark scheme or the generic level descriptors for the question • the specific skills defined in the mark scheme or in the generic level descriptors for the question • the standard of response required by a candidate as exemplified by the standardisation scripts. GENERIC MARKING PRINCIPLE 2: Marks awarded are always whole marks (not half marks, or other fractions). GENERIC MARKING PRINCIPLE 3: Marks must be awarded positively: • marks are awarded for correct/valid answers, as defined in the mark scheme. However, credit is given for valid answers which go beyond the scope of the syllabus and mark scheme, referring to your Team Leader as appropriate • marks are awarded when candidates clearly demonstrate what they know and can do • marks are not deducted for errors • marks are not deducted for omissions • answers should only be judged on the quality of spelling, punctuation and grammar when these features are specifically assessed by the question as indicated by the mark scheme. The meaning, however, should be unambiguous. GENERIC MARKING PRINCIPLE 4: Rules must be applied consistently e.g. in situations where candidates have not followed instructions or in the application of generic level descriptors.
Mark scheme, page 3
8291/12 Cambridge International AS Level – Mark Scheme PUBLISHED October/November 2018 © UCLES 2018 Page 3 of 13 GENERIC MARKING PRINCIPLE 5: Marks should be awarded using the full range of marks defined in the mark scheme for the question (however; the use of the full mark range may be limited according to the quality of the candidate responses seen). GENERIC MARKING PRINCIPLE 6: Marks awarded are based solely on the requirements as defined in the mark scheme. Marks should not be awarded with grade thresholds or grade descriptors in mind.
Mark scheme, page 4
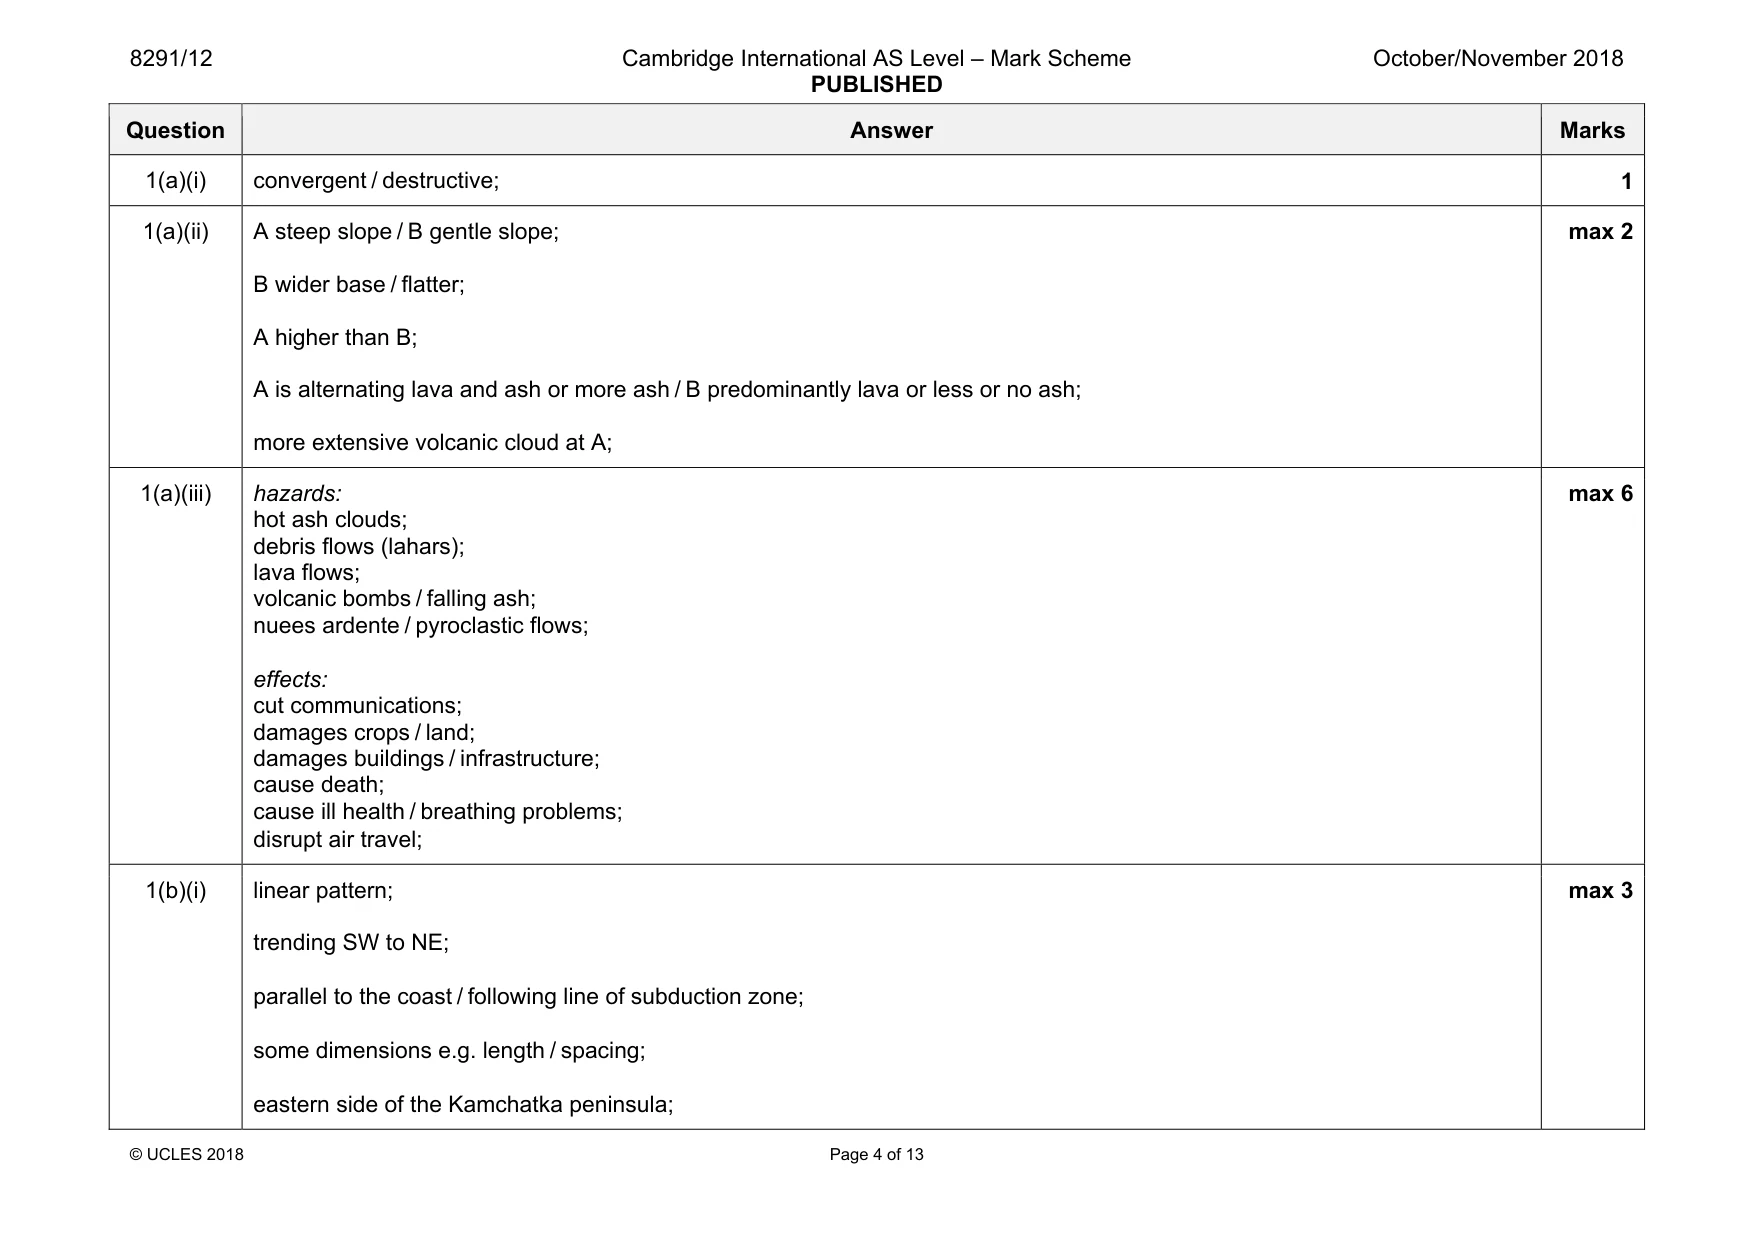
8291/12 Cambridge International AS Level – Mark Scheme PUBLISHED October/November 2018 © UCLES 2018 Page 4 of 13 Question Answer Marks 1(a)(i) convergent / destructive; 1 1(a)(ii) A steep slope / B gentle slope; B wider base / flatter; A higher than B; A is alternating lava and ash or more ash / B predominantly lava or less or no ash; more extensive volcanic cloud at A; max 2 1(a)(iii) hazards: hot ash clouds; debris flows (lahars); lava flows; volcanic bombs / falling ash; nuees ardente / pyroclastic flows; effects: cut communications; damages crops / land; damages buildings / infrastructure; cause death; cause ill health / breathing problems; disrupt air travel; max 6 1(b)(i) linear pattern; trending SW to NE; parallel to the coast / following line of subduction zone; some dimensions e.g. length / spacing; eastern side of the Kamchatka peninsula; max 3
Mark scheme, page 5
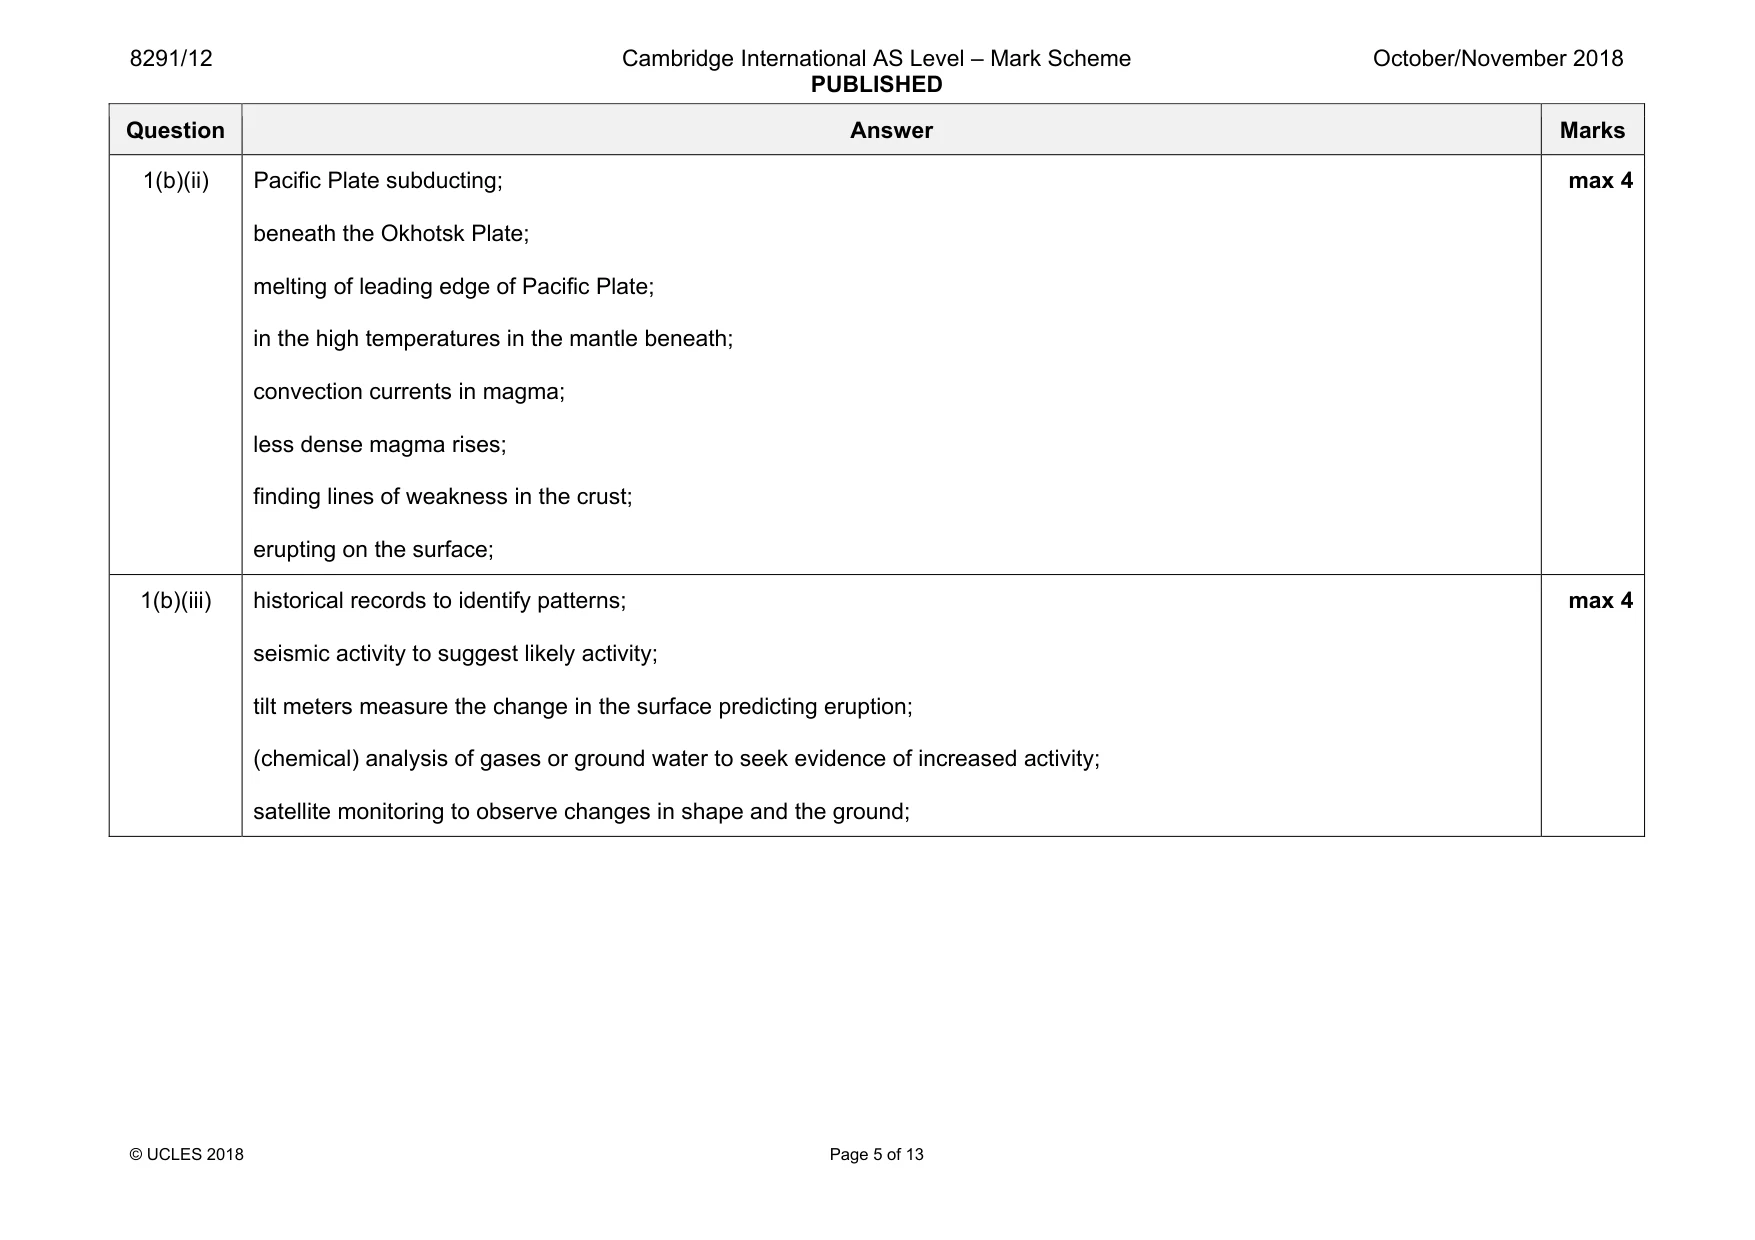
8291/12 Cambridge International AS Level – Mark Scheme PUBLISHED October/November 2018 © UCLES 2018 Page 5 of 13 Question Answer Marks 1(b)(ii) Pacific Plate subducting; beneath the Okhotsk Plate; melting of leading edge of Pacific Plate; in the high temperatures in the mantle beneath; convection currents in magma; less dense magma rises; finding lines of weakness in the crust; erupting on the surface; max 4 1(b)(iii) historical records to identify patterns; seismic activity to suggest likely activity; tilt meters measure the change in the surface predicting eruption; (chemical) analysis of gases or ground water to seek evidence of increased activity; satellite monitoring to observe changes in shape and the ground; max 4
Mark scheme, page 6
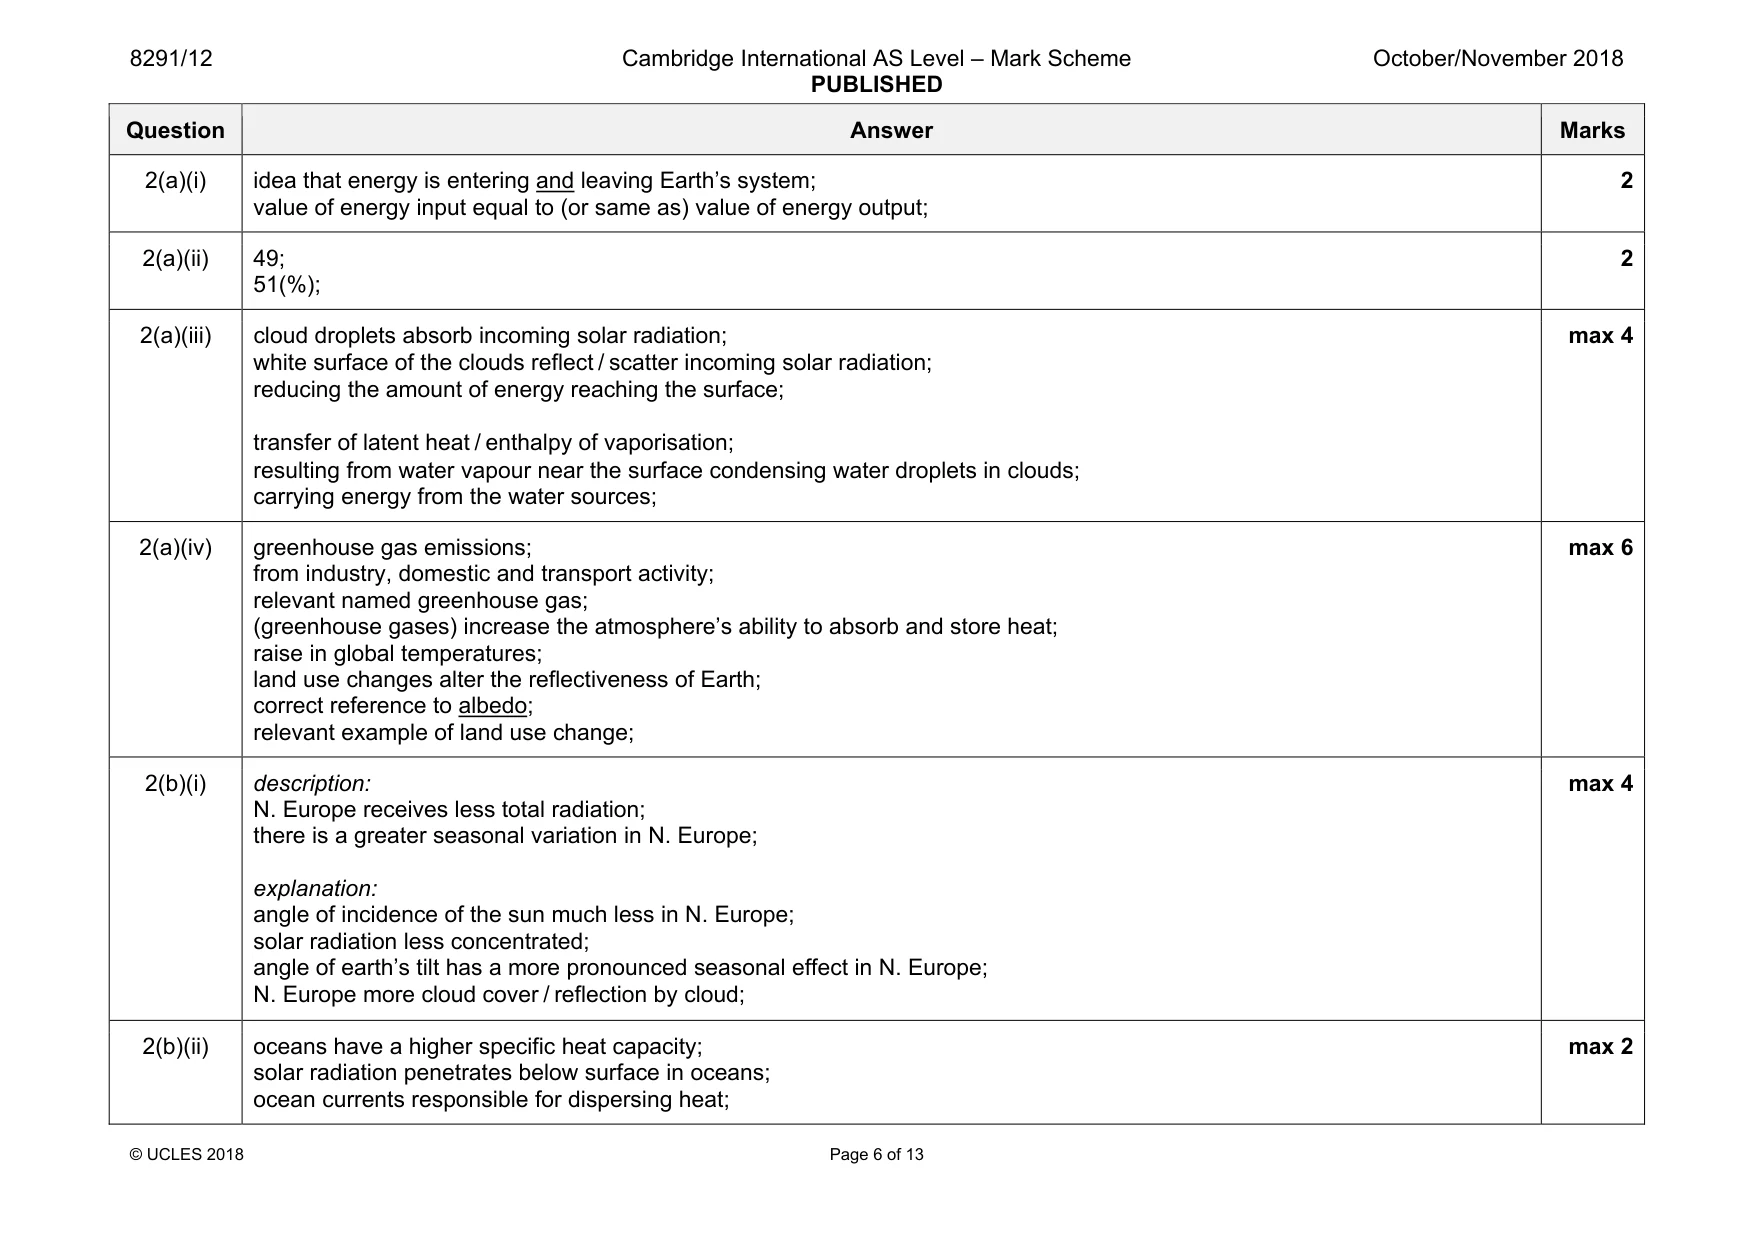
8291/12 Cambridge International AS Level – Mark Scheme PUBLISHED October/November 2018 © UCLES 2018 Page 6 of 13 Question Answer Marks 2(a)(i) idea that energy is entering and leaving Earth’s system; value of energy input equal to (or same as) value of energy output; 2 2(a)(ii) 49; 51(%); 2 2(a)(iii) cloud droplets absorb incoming solar radiation; white surface of the clouds reflect / scatter incoming solar radiation; reducing the amount of energy reaching the surface; transfer of latent heat / enthalpy of vaporisation; resulting from water vapour near the surface condensing water droplets in clouds; carrying energy from the water sources; max 4 2(a)(iv) greenhouse gas emissions; from industry, domestic and transport activity; relevant named greenhouse gas; (greenhouse gases) increase the atmosphere’s ability to absorb and store heat; raise in global temperatures; land use changes alter the reflectiveness of Earth; correct reference to albedo; relevant example of land use change; max 6 2(b)(i) description: N. Europe receives less total radiation; there is a greater seasonal variation in N. Europe; explanation: angle of incidence of the sun much less in N. Europe; solar radiation less concentrated; angle of earth’s tilt has a more pronounced seasonal effect in N. Europe; N. Europe more cloud cover / reflection by cloud; max 4 2(b)(ii) oceans have a higher specific heat capacity; solar radiation penetrates below surface in oceans; ocean currents responsible for dispersing heat; max 2
Mark scheme, page 7
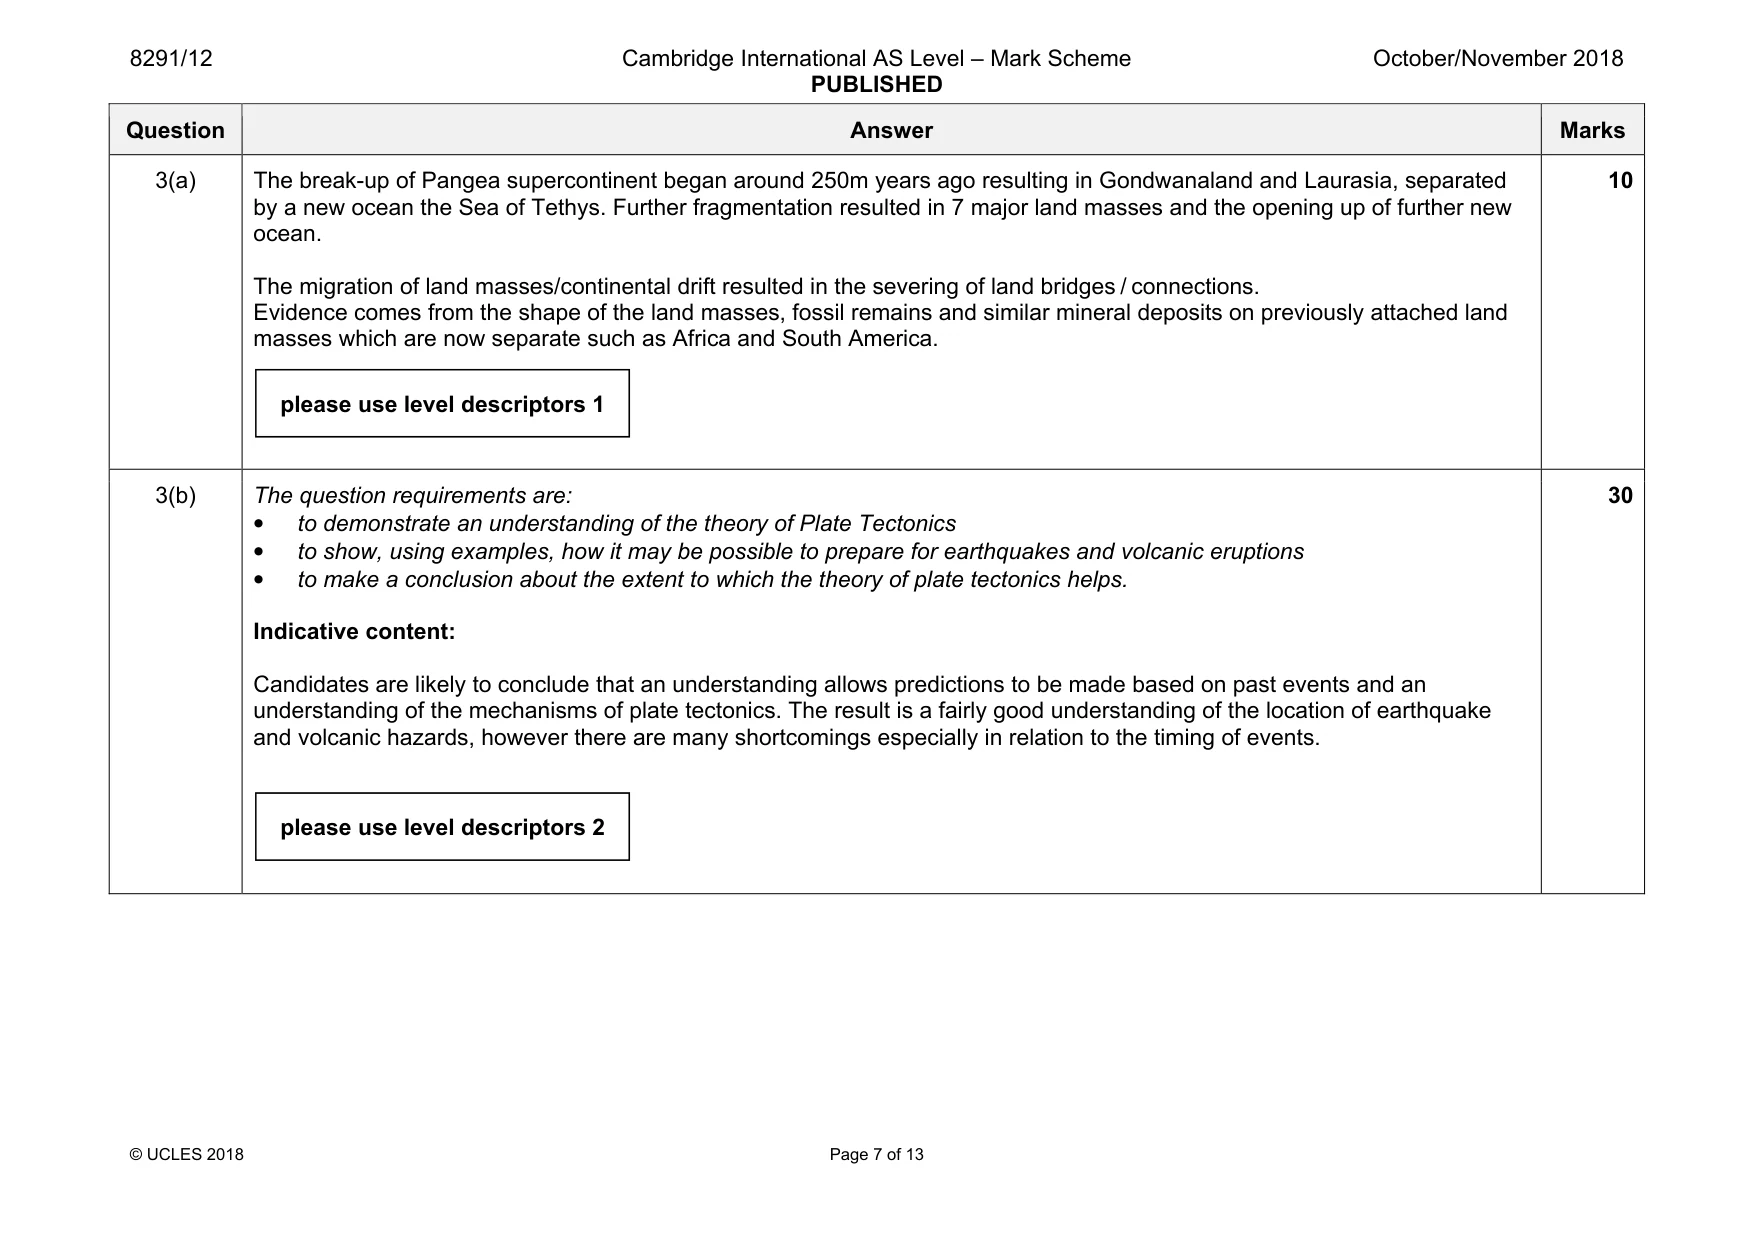
8291/12 Cambridge International AS Level – Mark Scheme PUBLISHED October/November 2018 © UCLES 2018 Page 7 of 13 Question Answer Marks 3(a) The break-up of Pangea supercontinent began around 250m years ago resulting in Gondwanaland and Laurasia, separated by a new ocean the Sea of Tethys. Further fragmentation resulted in 7 major land masses and the opening up of further new ocean. The migration of land masses/continental drift resulted in the severing of land bridges / connections. Evidence comes from the shape of the land masses, fossil remains and similar mineral deposits on previously attached land masses which are now separate such as Africa and South America. 10 3(b) The question requirements are: • to demonstrate an understanding of the theory of Plate Tectonics • to show, using examples, how it may be possible to prepare for earthquakes and volcanic eruptions • to make a conclusion about the extent to which the theory of plate tectonics helps. Indicative content: Candidates are likely to conclude that an understanding allows predictions to be made based on past events and an understanding of the mechanisms of plate tectonics. The result is a fairly good understanding of the location of earthquake and volcanic hazards, however there are many shortcomings especially in relation to the timing of events. 30 please use level descriptors 1 please use level descriptors 2
Mark scheme, page 8
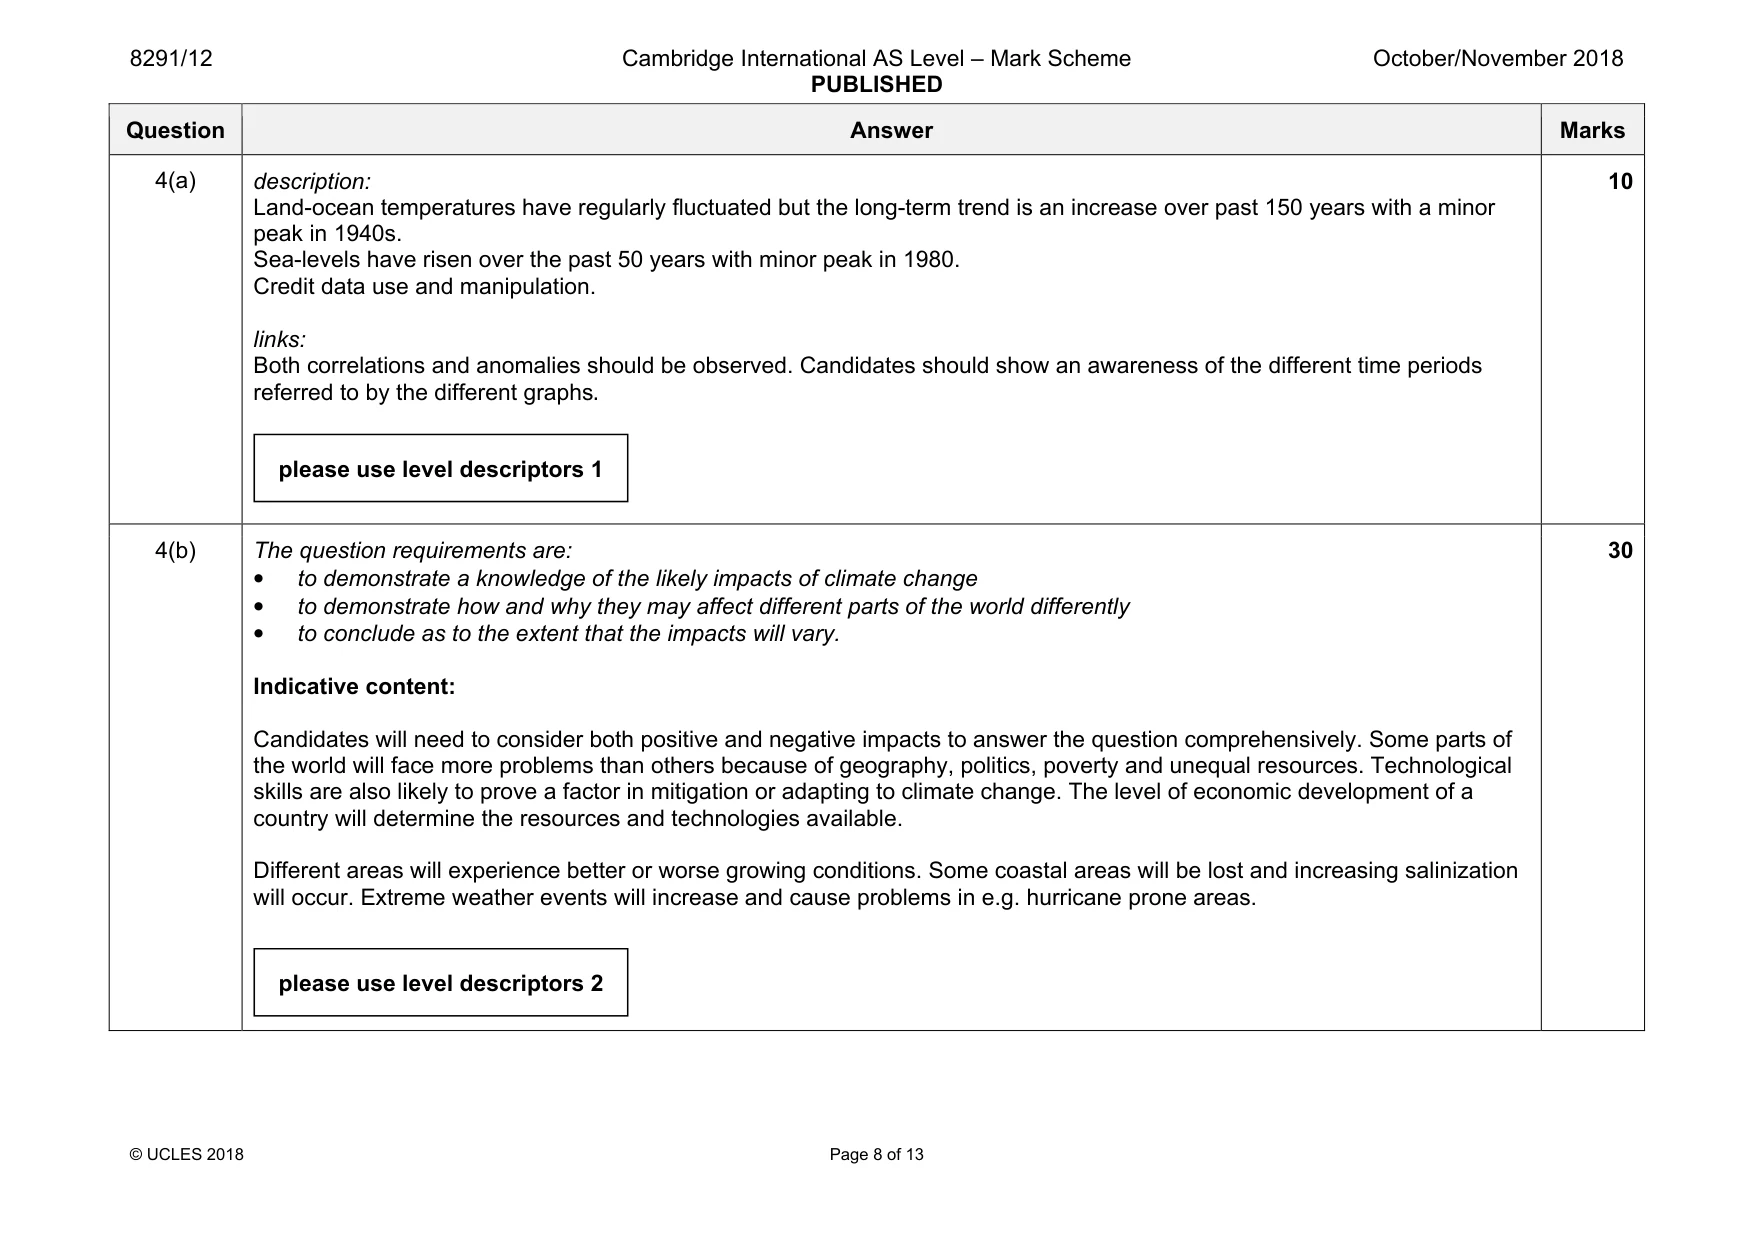
8291/12 Cambridge International AS Level – Mark Scheme PUBLISHED October/November 2018 © UCLES 2018 Page 8 of 13 Question Answer Marks 4(a) description: Land-ocean temperatures have regularly fluctuated but the long-term trend is an increase over past 150 years with a minor peak in 1940s. Sea-levels have risen over the past 50 years with minor peak in 1980. Credit data use and manipulation. links: Both correlations and anomalies should be observed. Candidates should show an awareness of the different time periods referred to by the different graphs. 10 4(b) The question requirements are: • to demonstrate a knowledge of the likely impacts of climate change • to demonstrate how and why they may affect different parts of the world differently • to conclude as to the extent that the impacts will vary. Indicative content: Candidates will need to consider both positive and negative impacts to answer the question comprehensively. Some parts of the world will face more problems than others because of geography, politics, poverty and unequal resources. Technological skills are also likely to prove a factor in mitigation or adapting to climate change. The level of economic development of a country will determine the resources and technologies available. Different areas will experience better or worse growing conditions. Some coastal areas will be lost and increasing salinization will occur. Extreme weather events will increase and cause problems in e.g. hurricane prone areas. 30 please use level descriptors 1 please use level descriptors 2
Mark scheme, page 9
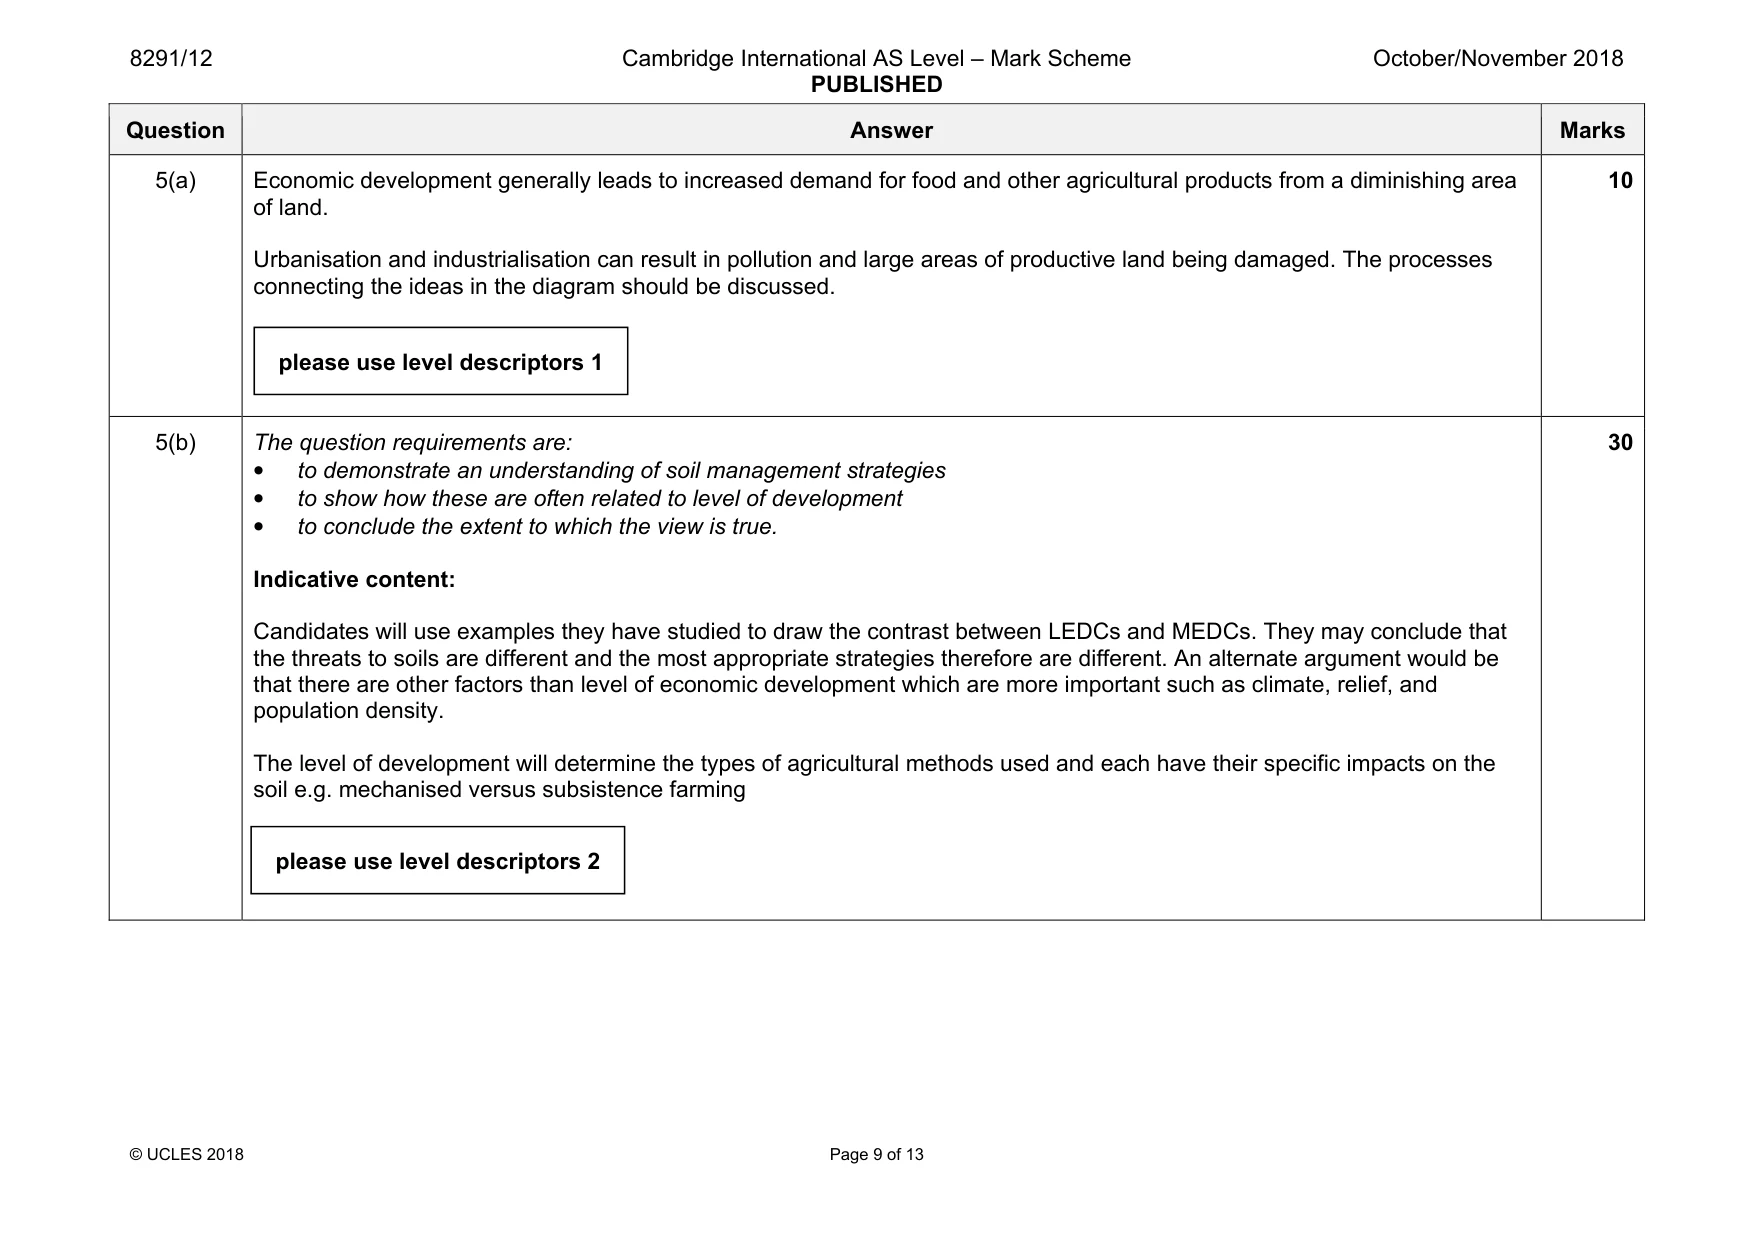
8291/12 Cambridge International AS Level – Mark Scheme PUBLISHED October/November 2018 © UCLES 2018 Page 9 of 13 Question Answer Marks 5(a) Economic development generally leads to increased demand for food and other agricultural products from a diminishing area of land. Urbanisation and industrialisation can result in pollution and large areas of productive land being damaged. The processes connecting the ideas in the diagram should be discussed. 10 5(b) The question requirements are: • to demonstrate an understanding of soil management strategies • to show how these are often related to level of development • to conclude the extent to which the view is true. Indicative content: Candidates will use examples they have studied to draw the contrast between LEDCs and MEDCs. They may conclude that the threats to soils are different and the most appropriate strategies therefore are different. An alternate argument would be that there are other factors than level of economic development which are more important such as climate, relief, and population density. The level of development will determine the types of agricultural methods used and each have their specific impacts on the soil e.g. mechanised versus subsistence farming 30 please use level descriptors 2 please use level descriptors 1
Mark scheme, page 10
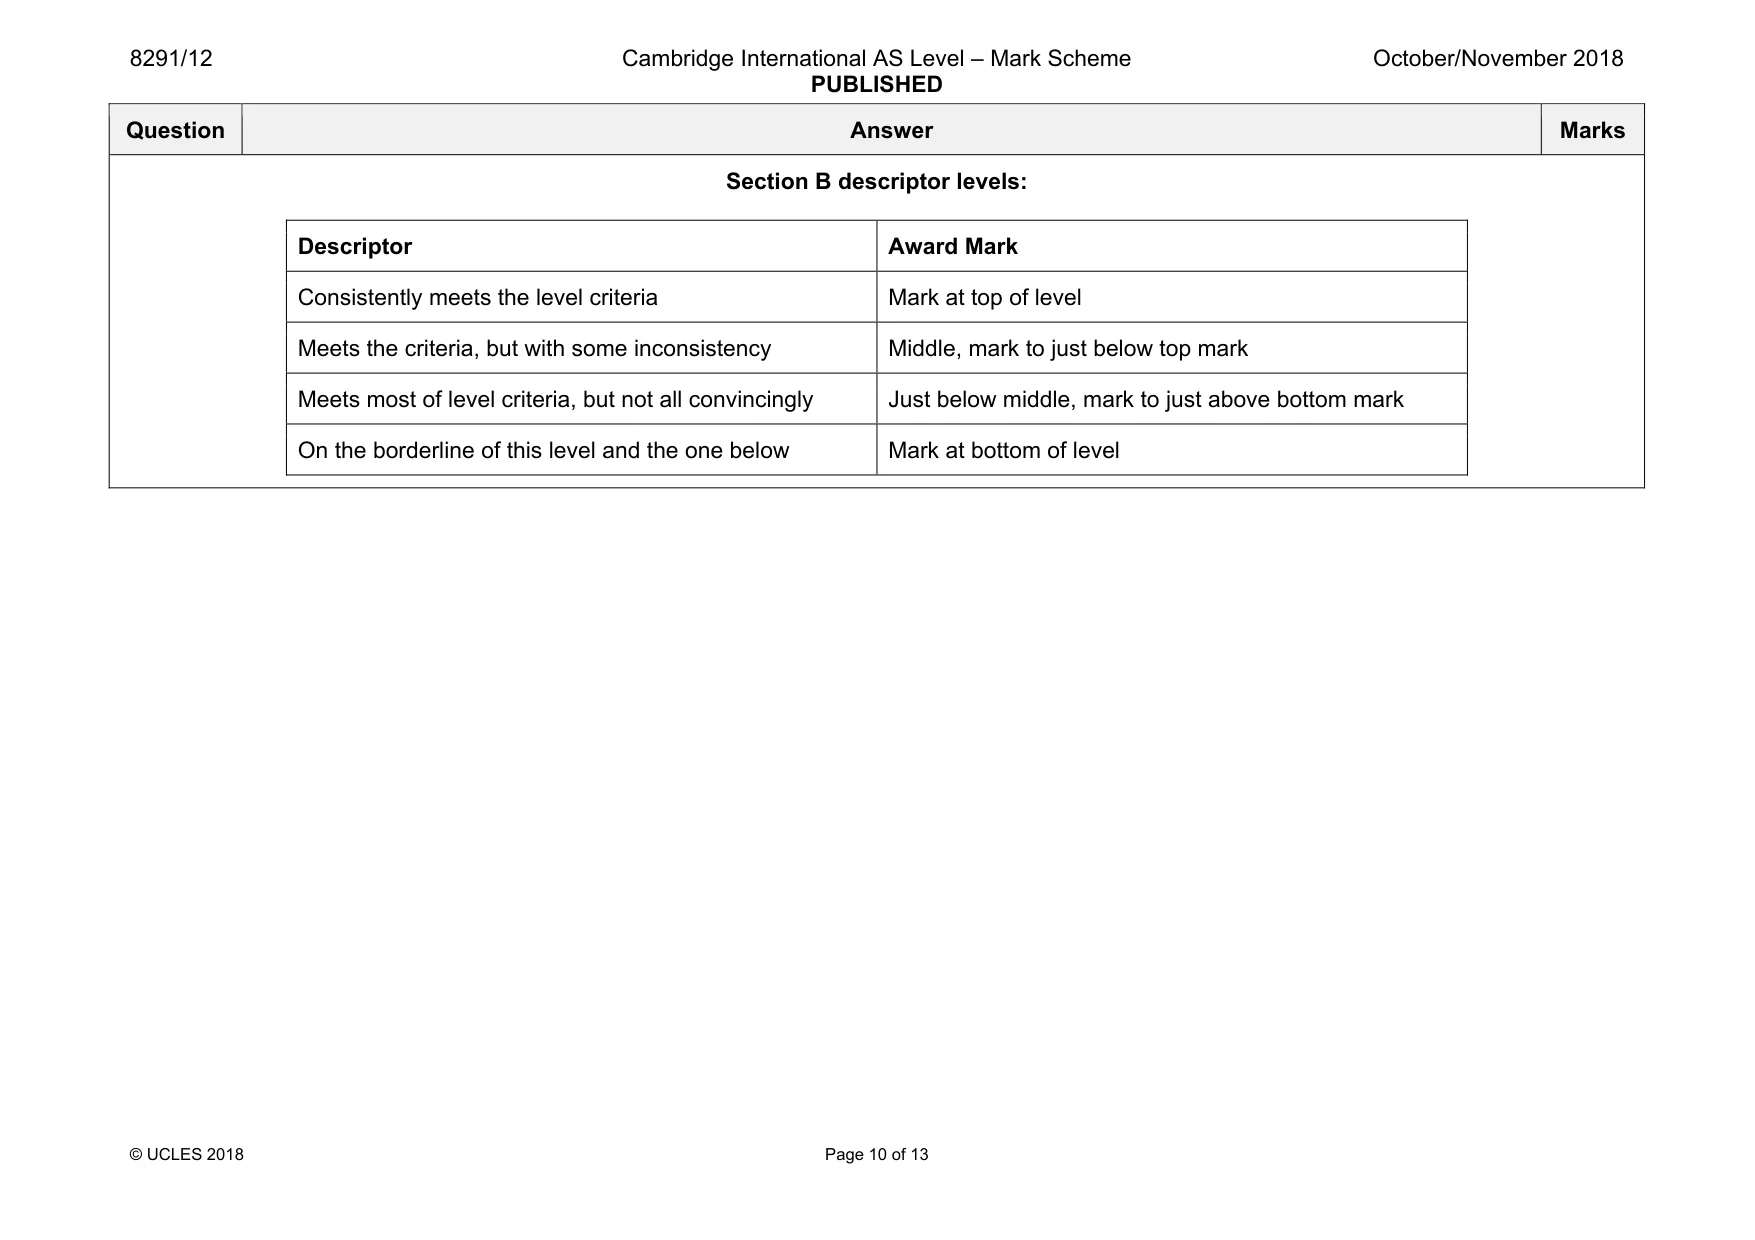
8291/12 Cambridge International AS Level – Mark Scheme PUBLISHED October/November 2018 © UCLES 2018 Page 10 of 13 Question Answer Marks Section B descriptor levels: Descriptor Award Mark Consistently meets the level criteria Mark at top of level Meets the criteria, but with some inconsistency Middle, mark to just below top mark Meets most of level criteria, but not all convincingly Just below middle, mark to just above bottom mark On the borderline of this level and the one below Mark at bottom of level
Mark scheme, page 11
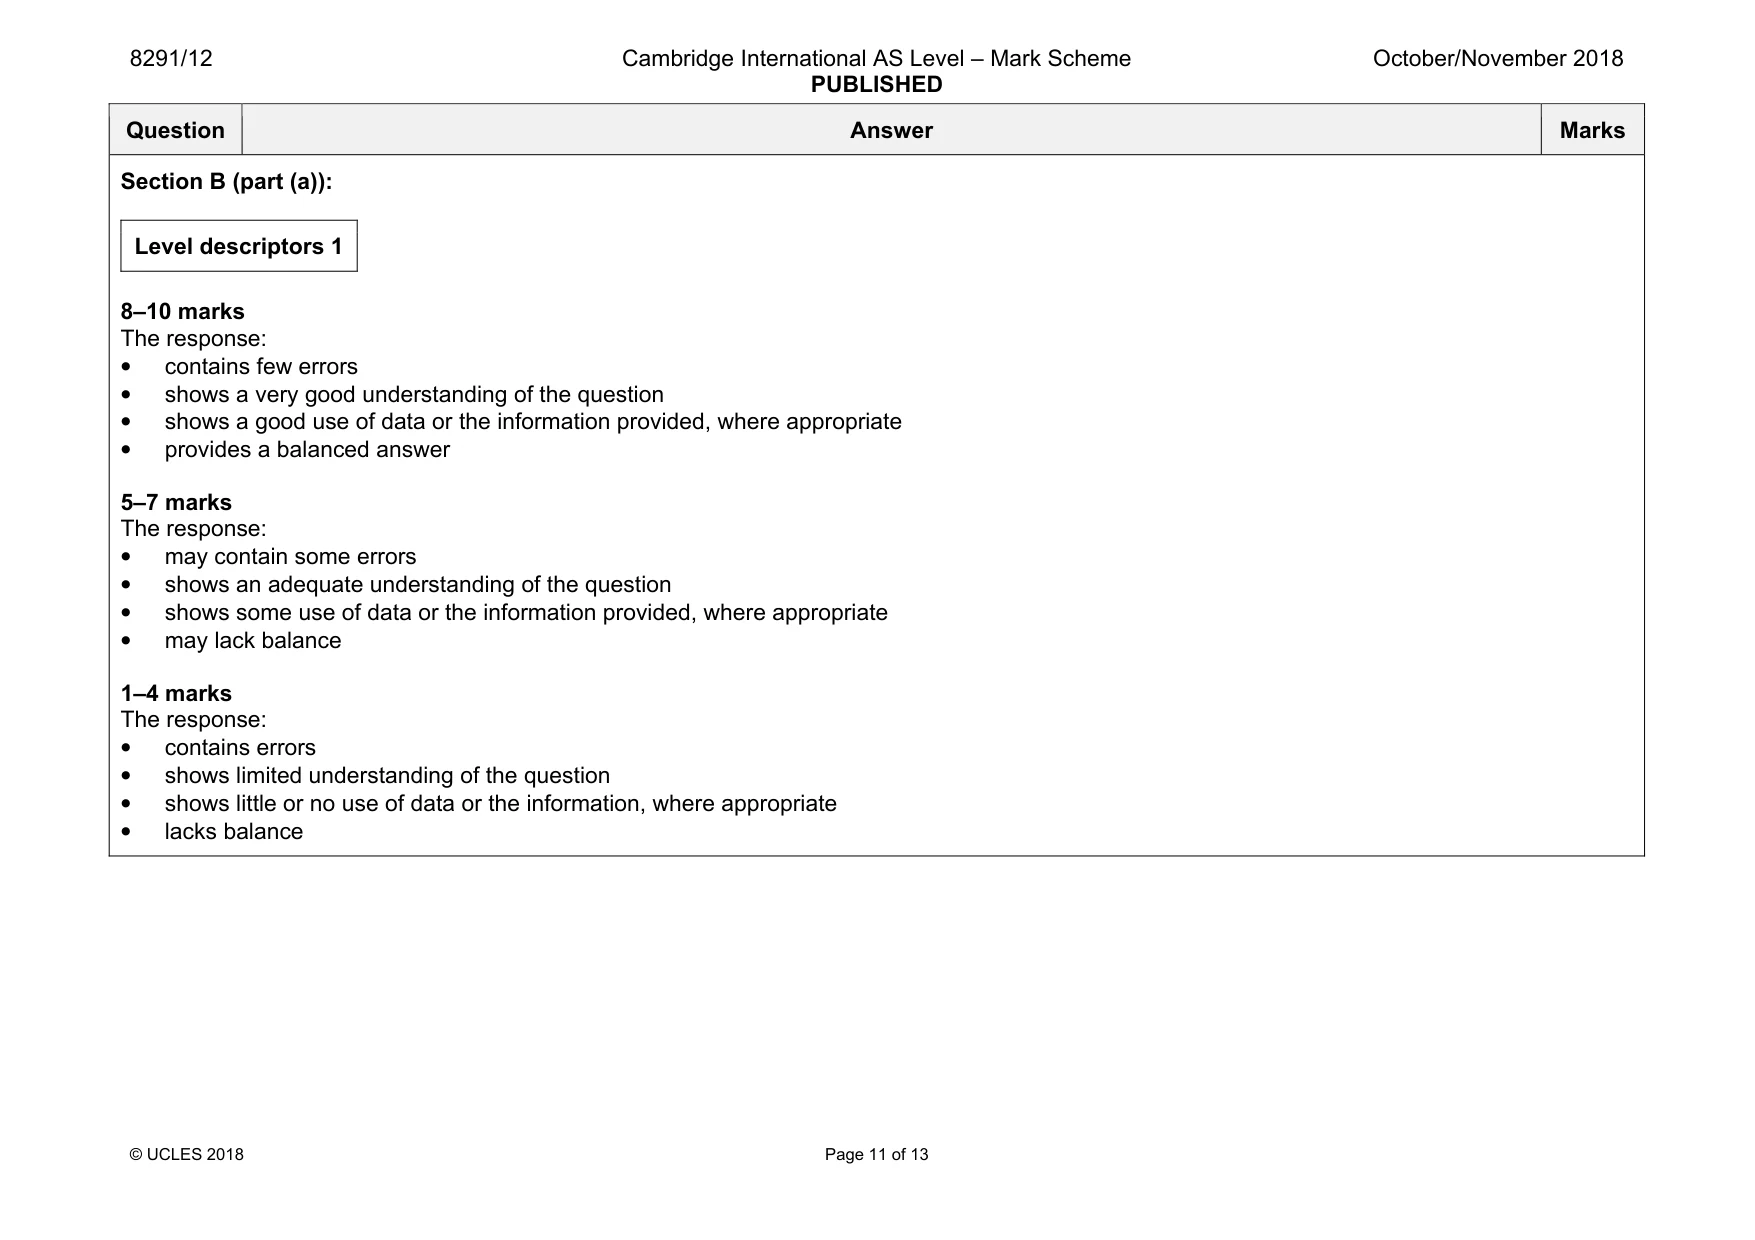
8291/12 Cambridge International AS Level – Mark Scheme PUBLISHED October/November 2018 © UCLES 2018 Page 11 of 13 Question Answer Marks Section B (part (a)): Level descriptors 1 8–10 marks The response: • contains few errors • shows a very good understanding of the question • shows a good use of data or the information provided, where appropriate • provides a balanced answer 5–7 marks The response: • may contain some errors • shows an adequate understanding of the question • shows some use of data or the information provided, where appropriate • may lack balance 1–4 marks The response: • contains errors • shows limited understanding of the question • shows little or no use of data or the information, where appropriate • lacks balance
Mark scheme, page 12
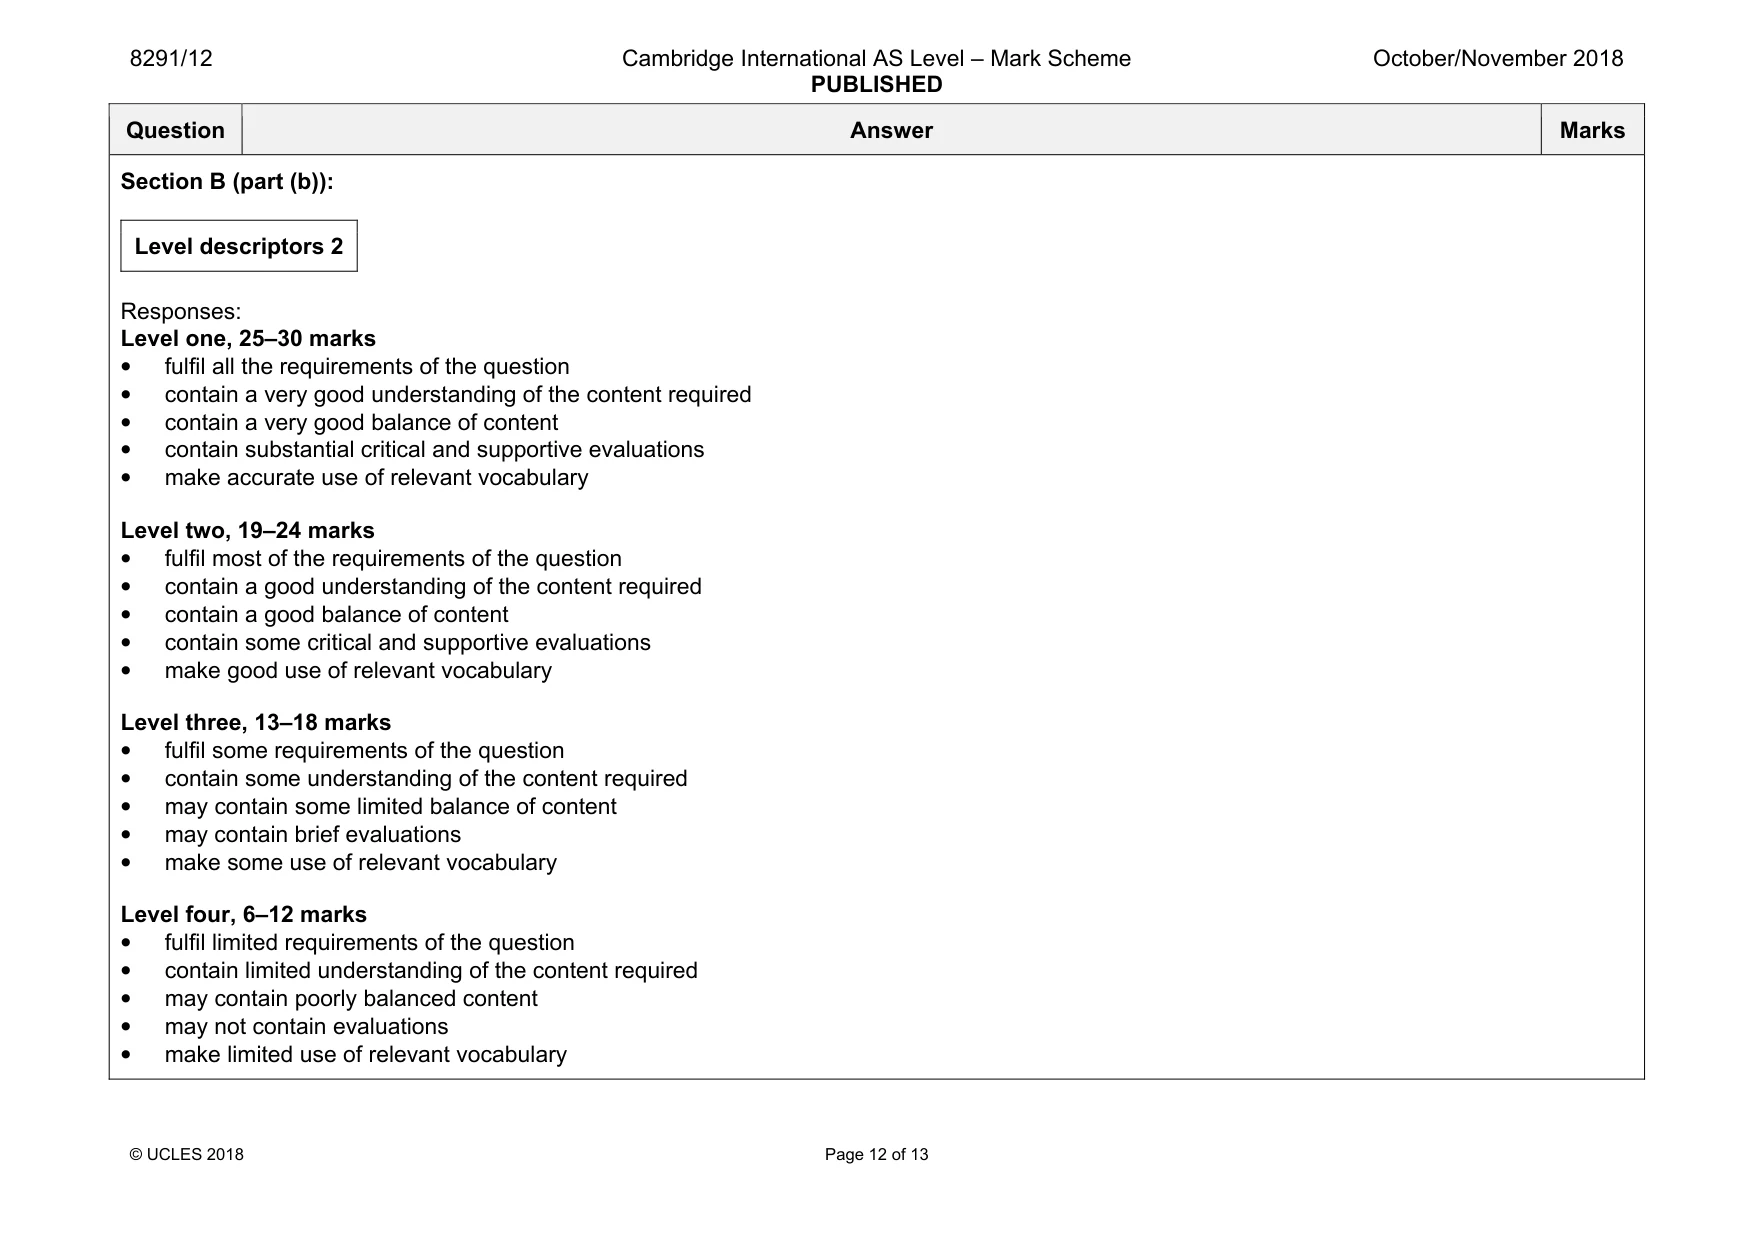
8291/12 Cambridge International AS Level – Mark Scheme PUBLISHED October/November 2018 © UCLES 2018 Page 12 of 13 Question Answer Marks Section B (part (b)): Level descriptors 2 Responses: Level one, 25–30 marks • fulfil all the requirements of the question • contain a very good understanding of the content required • contain a very good balance of content • contain substantial critical and supportive evaluations • make accurate use of relevant vocabulary Level two, 19–24 marks • fulfil most of the requirements of the question • contain a good understanding of the content required • contain a good balance of content • contain some critical and supportive evaluations • make good use of relevant vocabulary Level three, 13–18 marks • fulfil some requirements of the question • contain some understanding of the content required • may contain some limited balance of content • may contain brief evaluations • make some use of relevant vocabulary Level four, 6–12 marks • fulfil limited requirements of the question • contain limited understanding of the content required • may contain poorly balanced content • may not contain evaluations • make limited use of relevant vocabulary
Mark scheme, page 13
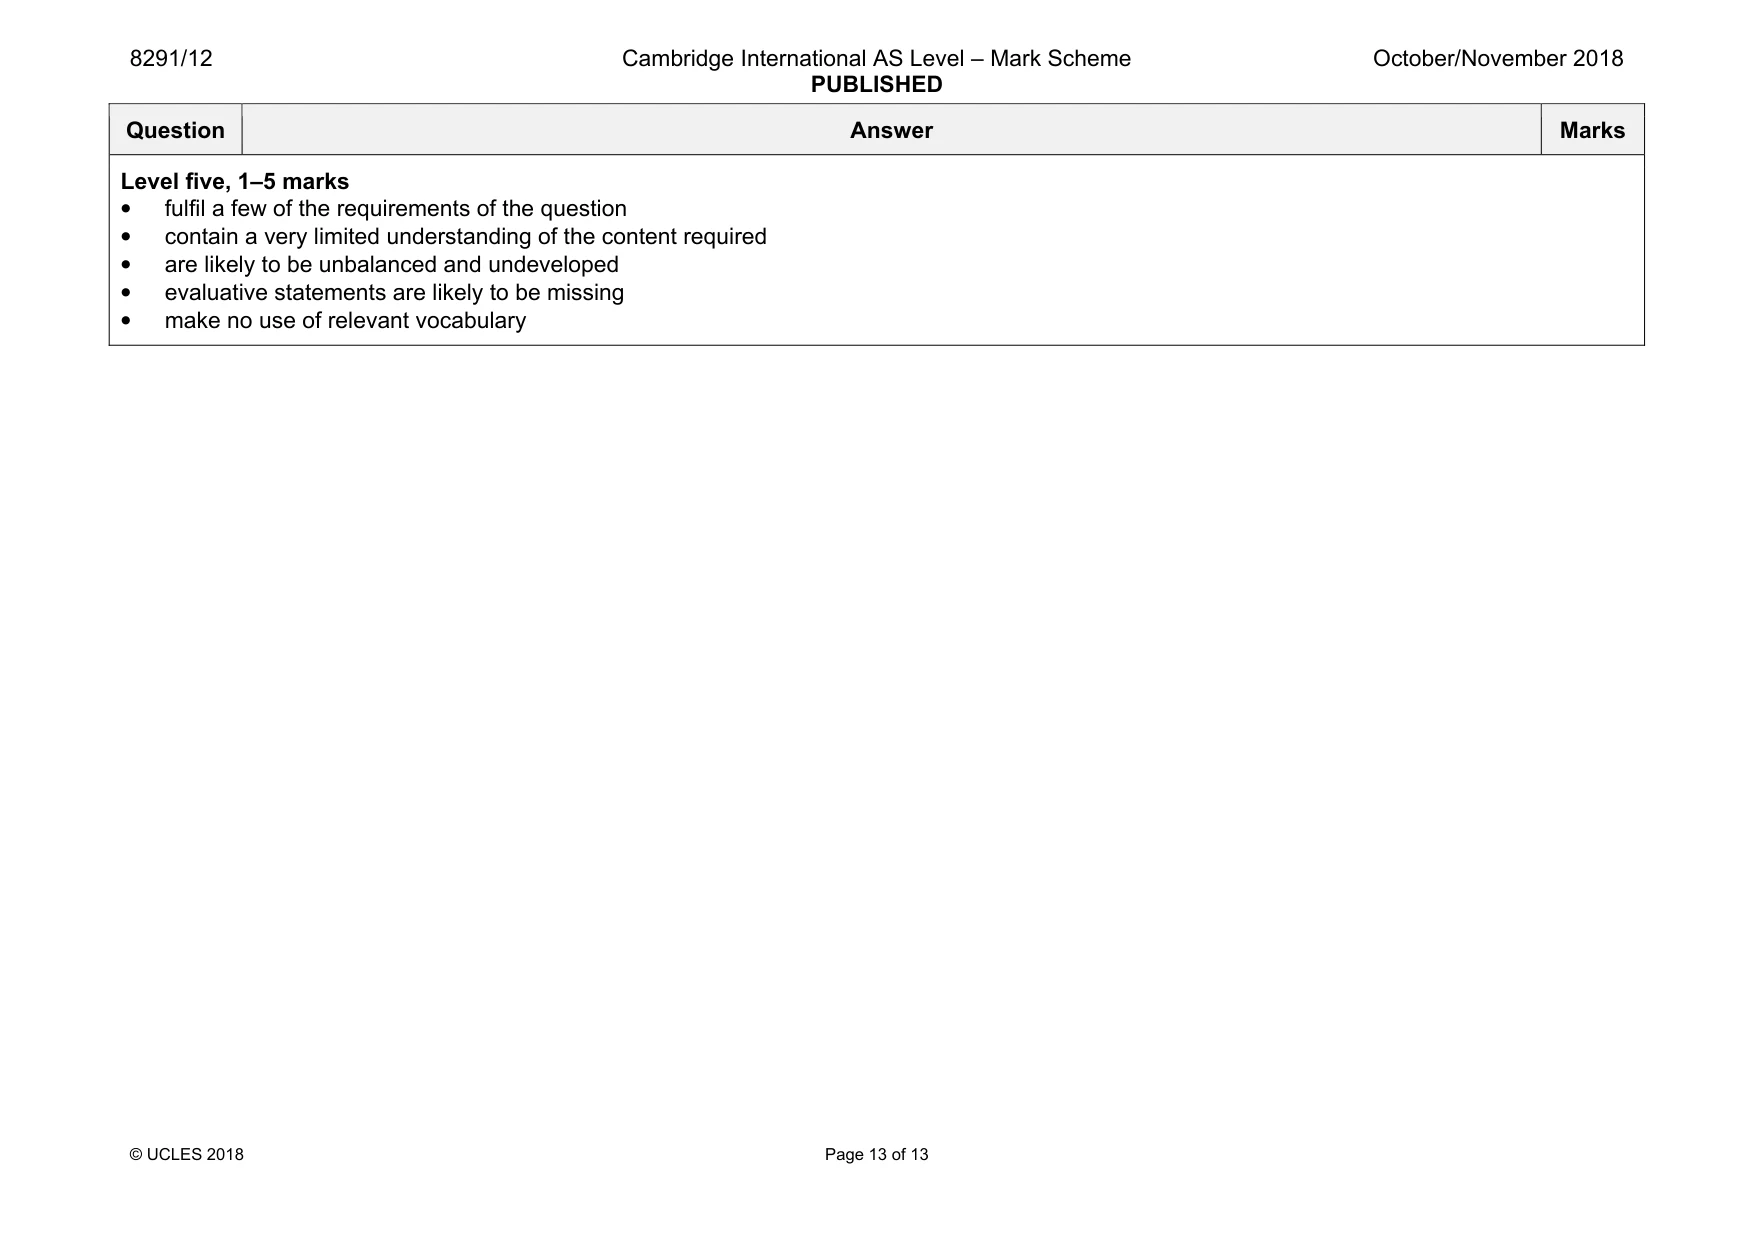
8291/12 Cambridge International AS Level – Mark Scheme PUBLISHED October/November 2018 © UCLES 2018 Page 13 of 13 Question Answer Marks Level five, 1–5 marks • fulfil a few of the requirements of the question • contain a very limited understanding of the content required • are likely to be unbalanced and undeveloped • evaluative statements are likely to be missing • make no use of relevant vocabulary