Cambridge A Level Environmental Management (AS only) 8291 — 2016 Oct/Nov Paper 1 · Variant 1
8291/11/O/N/16 · 80 marks · ≈90 min
The question paper and its mark scheme, free to read here and free to download. This is Cambridge’s own paper, exactly as it was sat.
Question paper12 pages
Mark scheme13 pages
Answers below. Sit the paper first if you are practising.
Paper as text
Question paper, page 1
This document consists of 12 printed pages. DC (CW/SG) 114257/5 © UCLES 2016 [Turn over Cambridge International Examinations Cambridge International Advanced Subsidiary Level * 2 8 6 1 9 9 7 5 8 4 * ENVIRONMENTAL MANAGEMENT 8291/11 Paper 1 Lithosphere and Atmosphere October/November 2016 1 hour 30 minutes Additional Materials: Answer Booklet/Paper READ THESE INSTRUCTIONS FIRST Write your Centre number, candidate number and name on all the work you hand in. Write in dark blue or black pen. You may use an HB pencil for any diagrams or graphs. Do not use staples, paper clips, glue or correction fluid. DO NOT WRITE IN ANY BARCODES. Electronic calculators may be used. You may lose marks if you do not show your working or if you do not use appropriate units. Section A Answer all questions in this section. Write your answers in the spaces provided on the question paper. Section B Answer one question from this section. Write your answers on the separate answer paper provided. At the end of the examination, 1. fasten all separate answer paper securely to the question paper; 2. enter the question number from Section B in the grid opposite. For Examiner’s Use Section A 1 2 Section B Total
Question paper, page 2
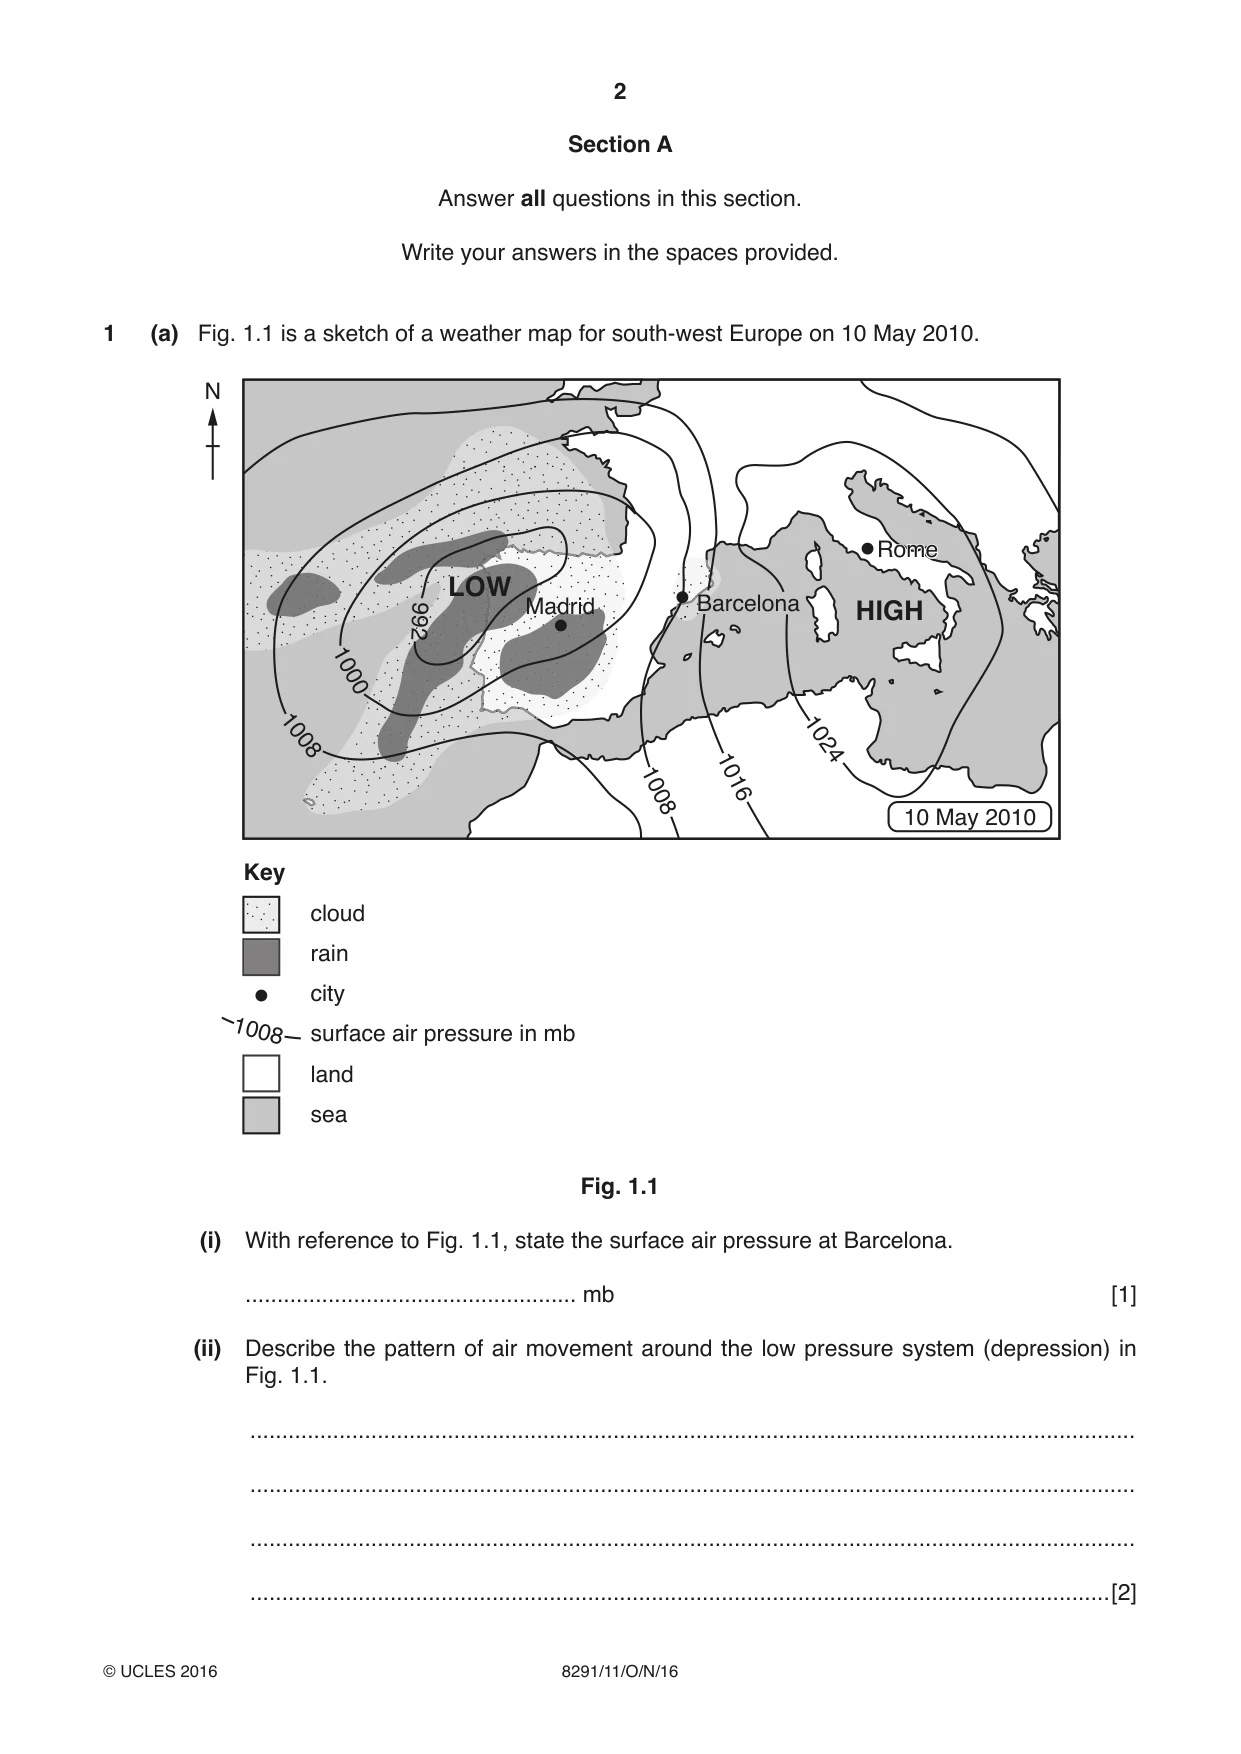
2 8291/11/O/N/16 © UCLES 2016 Section A Answer all questions in this section. Write your answers in the spaces provided. 1 (a) Fig. 1.1 is a sketch of a weather map for south-west Europe on 10 May 2010. Key LOW HIGH 10 May 2010 Barcelona 992 1000 1008 1008 1016 1024 Rome Rome Madrid 1008 cloud rain city land surface air pressure in mb sea N Fig. 1.1 (i) With reference to Fig. 1.1, state the surface air pressure at Barcelona. … mb [1] (ii) Describe the pattern of air movement around the low pressure system (depression) in Fig. 1.1. … … … …[2]
Question paper, page 3
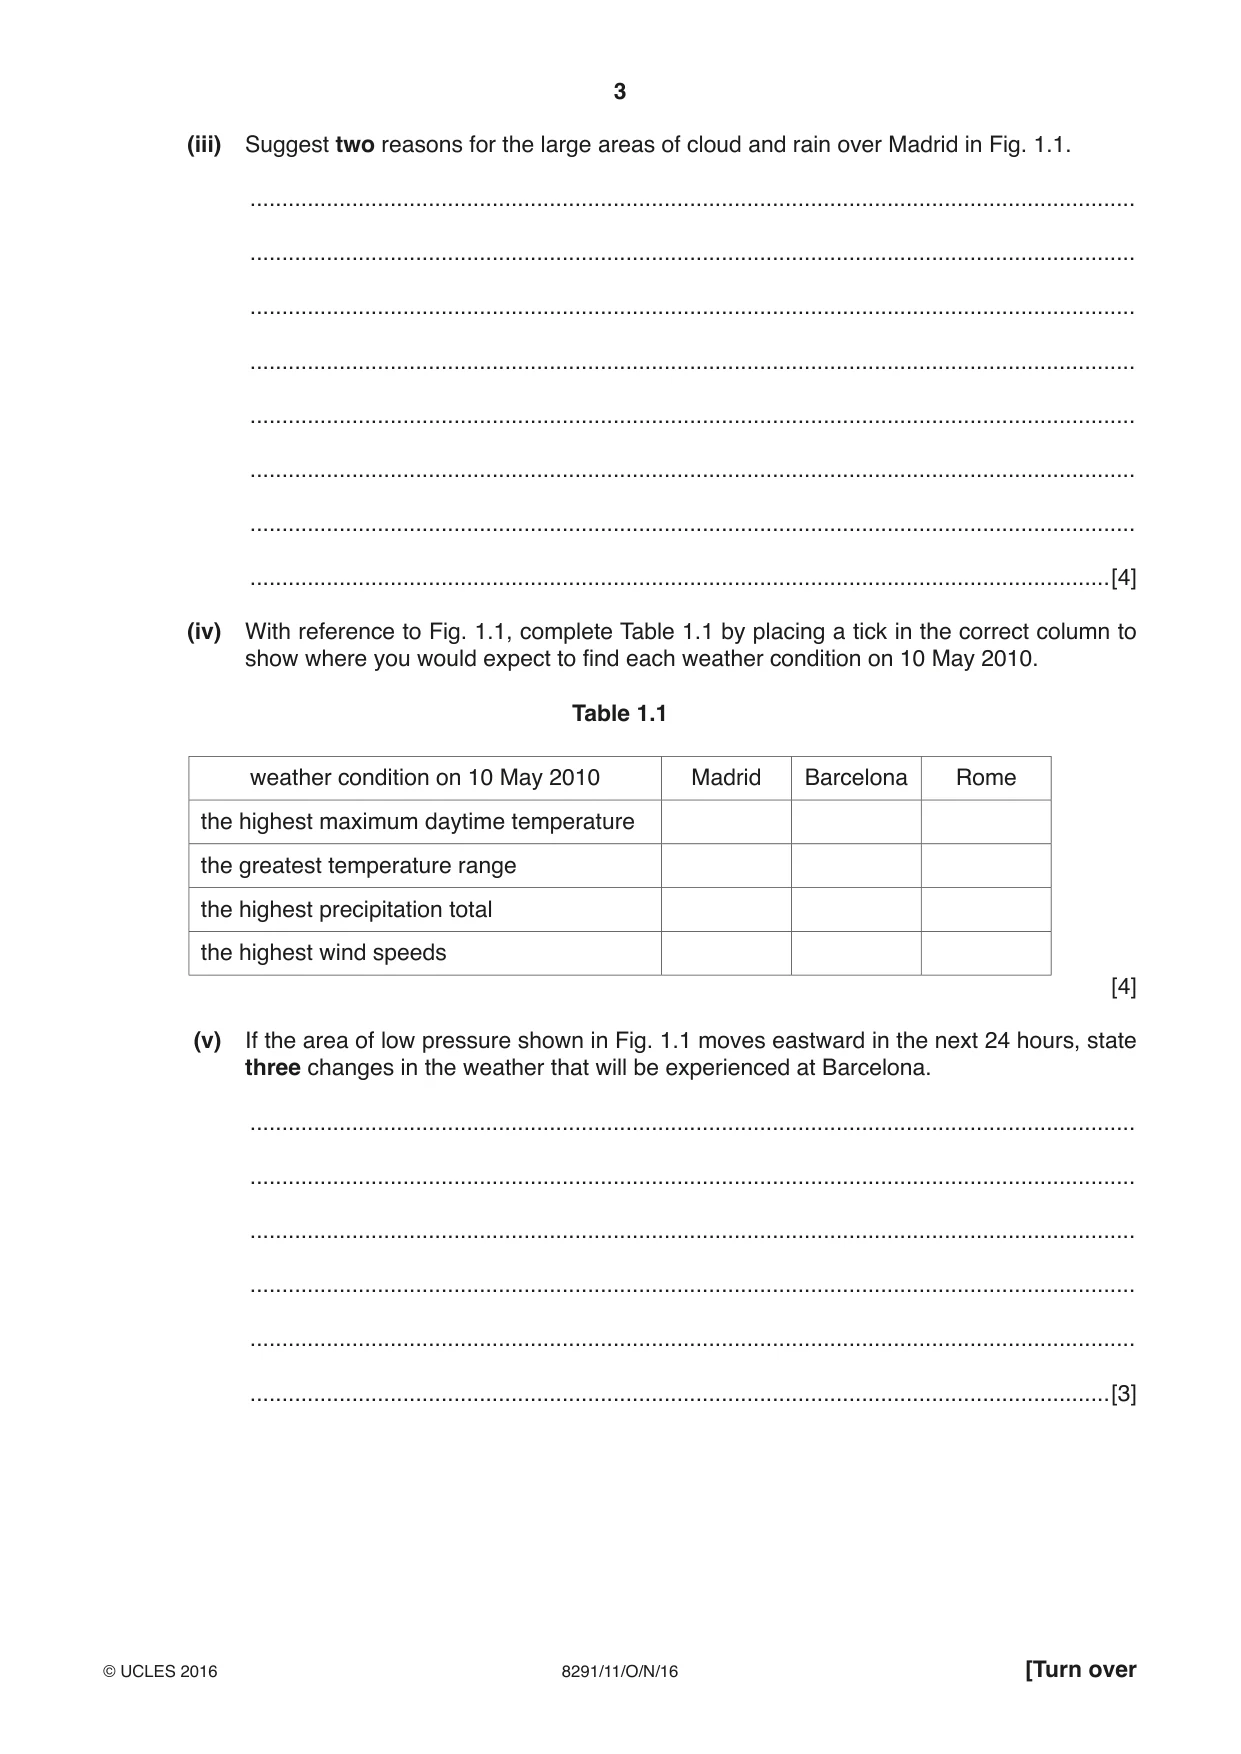
3 8291/11/O/N/16 © UCLES 2016 [Turn over (iii) Suggest two reasons for the large areas of cloud and rain over Madrid in Fig. 1.1. … … … … … … … …[4] (iv) With reference to Fig. 1.1, complete Table 1.1 by placing a tick in the correct column to show where you would expect to find each weather condition on 10 May 2010. Table 1.1 weather condition on 10 May 2010 Madrid Barcelona Rome the highest maximum daytime temperature the greatest temperature range the highest precipitation total the highest wind speeds [4] (v) If the area of low pressure shown in Fig. 1.1 moves eastward in the next 24 hours, state three changes in the weather that will be experienced at Barcelona. … … … … … …[3]
Question paper, page 4
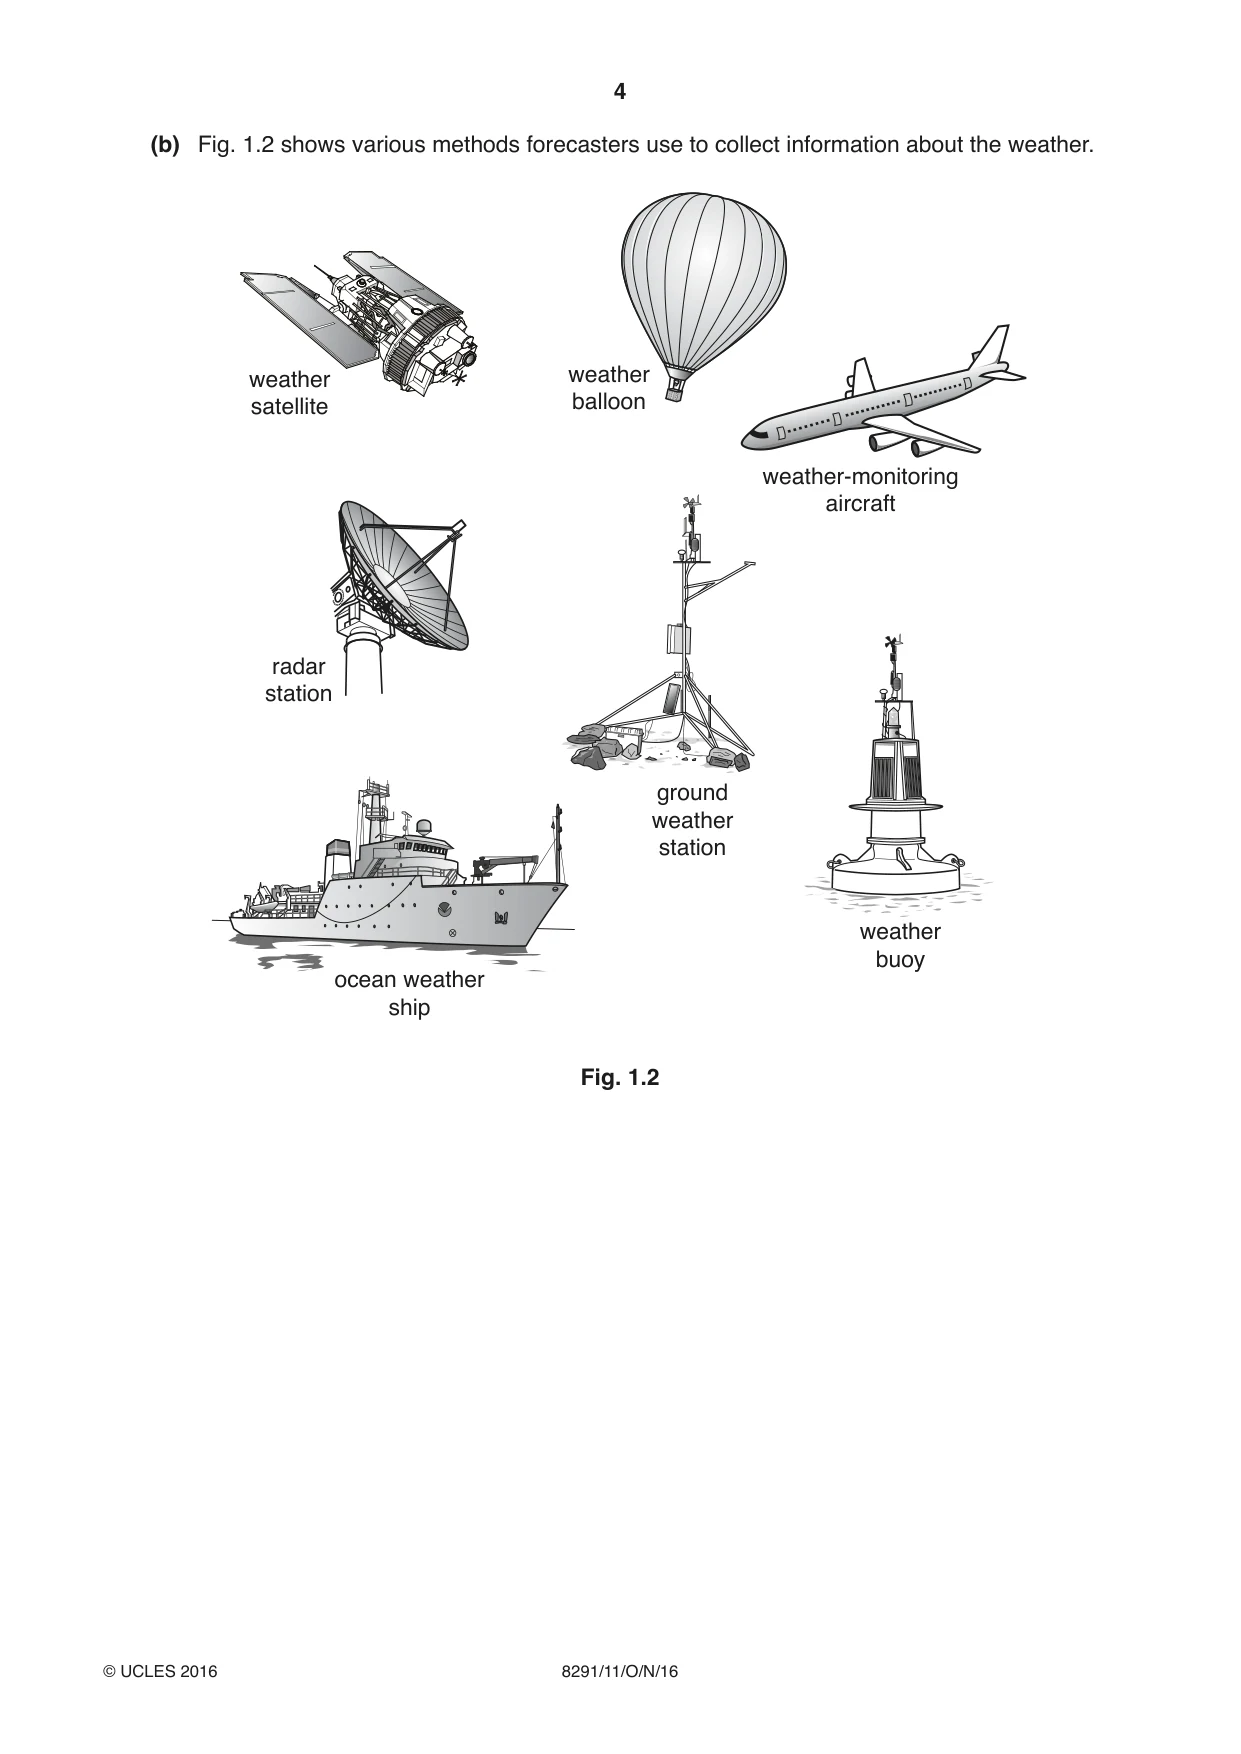
4 8291/11/O/N/16 © UCLES 2016 (b) Fig. 1.2 shows various methods forecasters use to collect information about the weather. weather satellite weather balloon weather-monitoring aircraft weather buoy ground weather station radar station ocean weather ship Fig. 1.2
Question paper, page 5
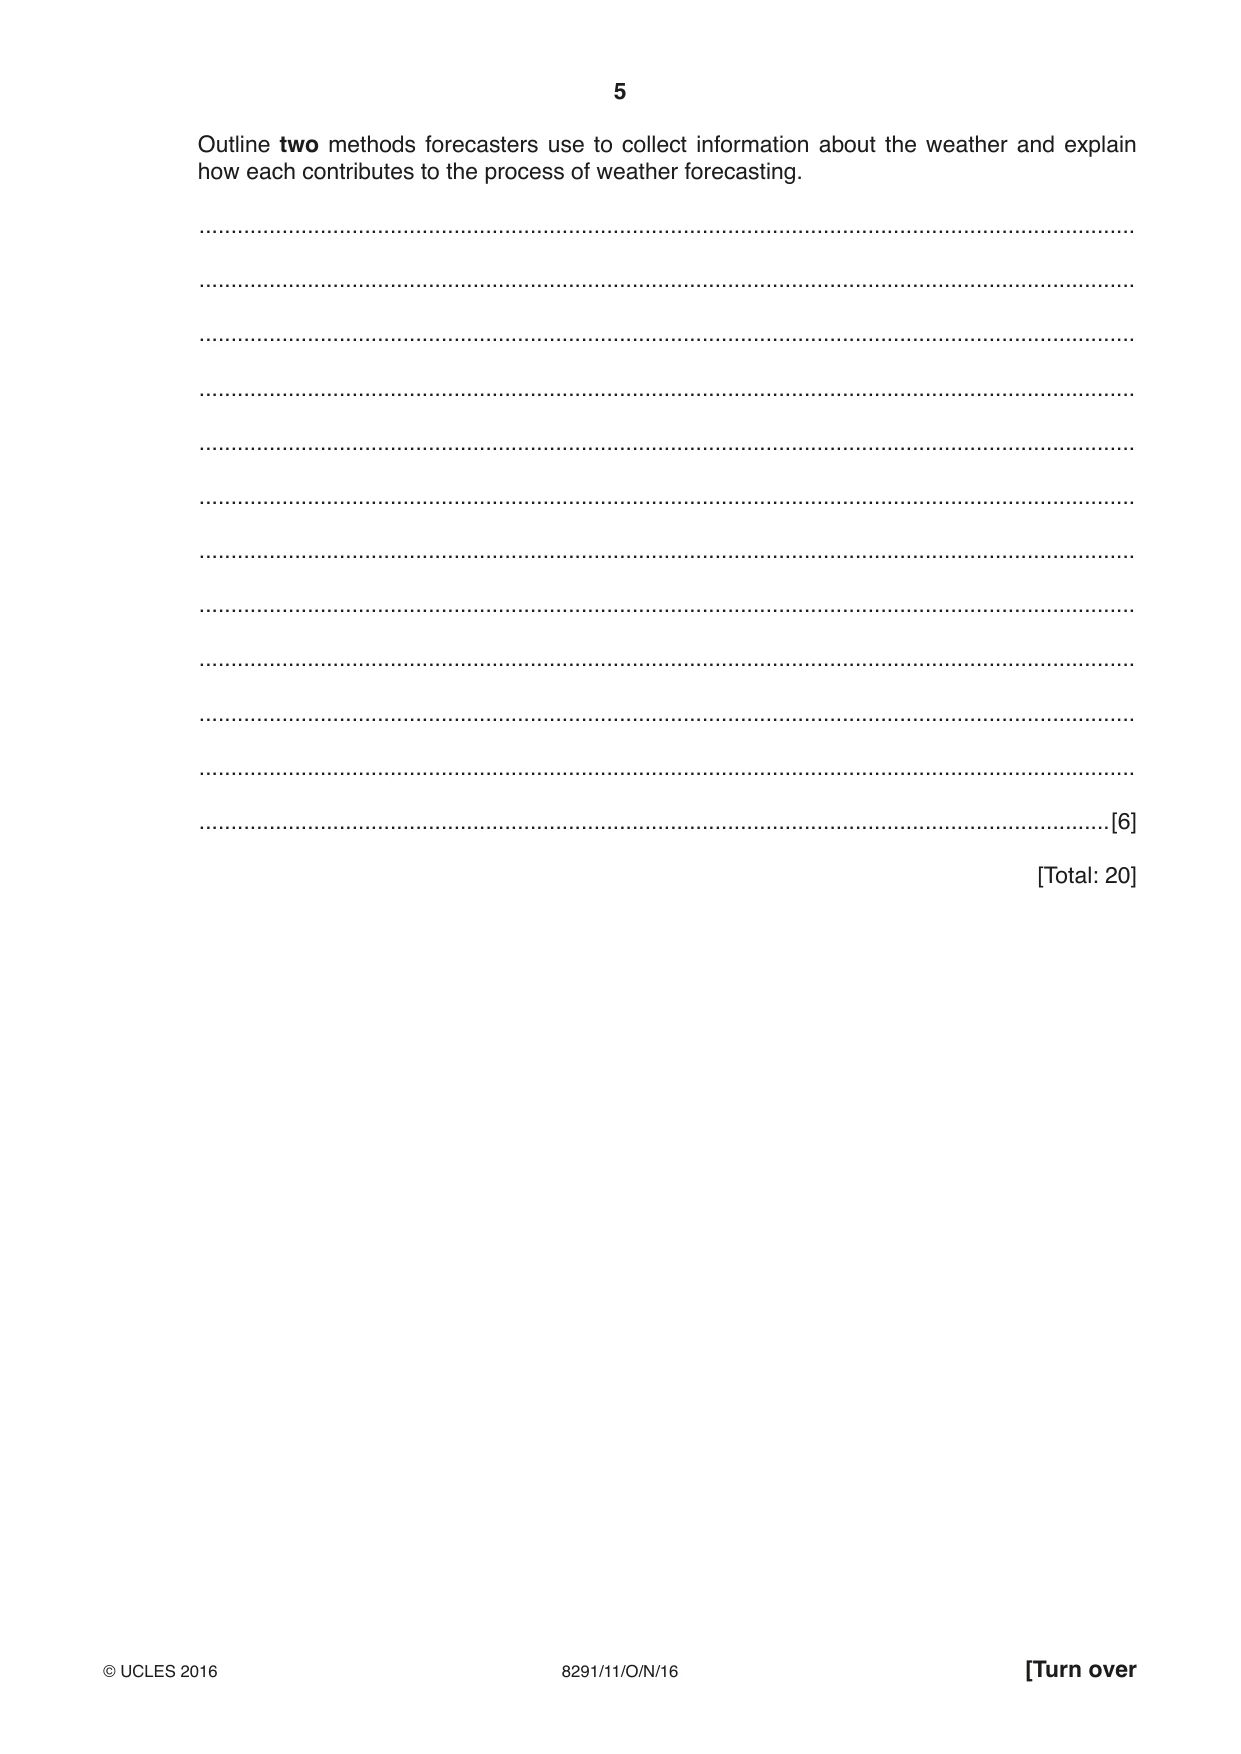
5 8291/11/O/N/16 © UCLES 2016 [Turn over Outline two methods forecasters use to collect information about the weather and explain how each contributes to the process of weather forecasting. … … … … … … … … … … … …[6] [Total: 20]
Question paper, page 6
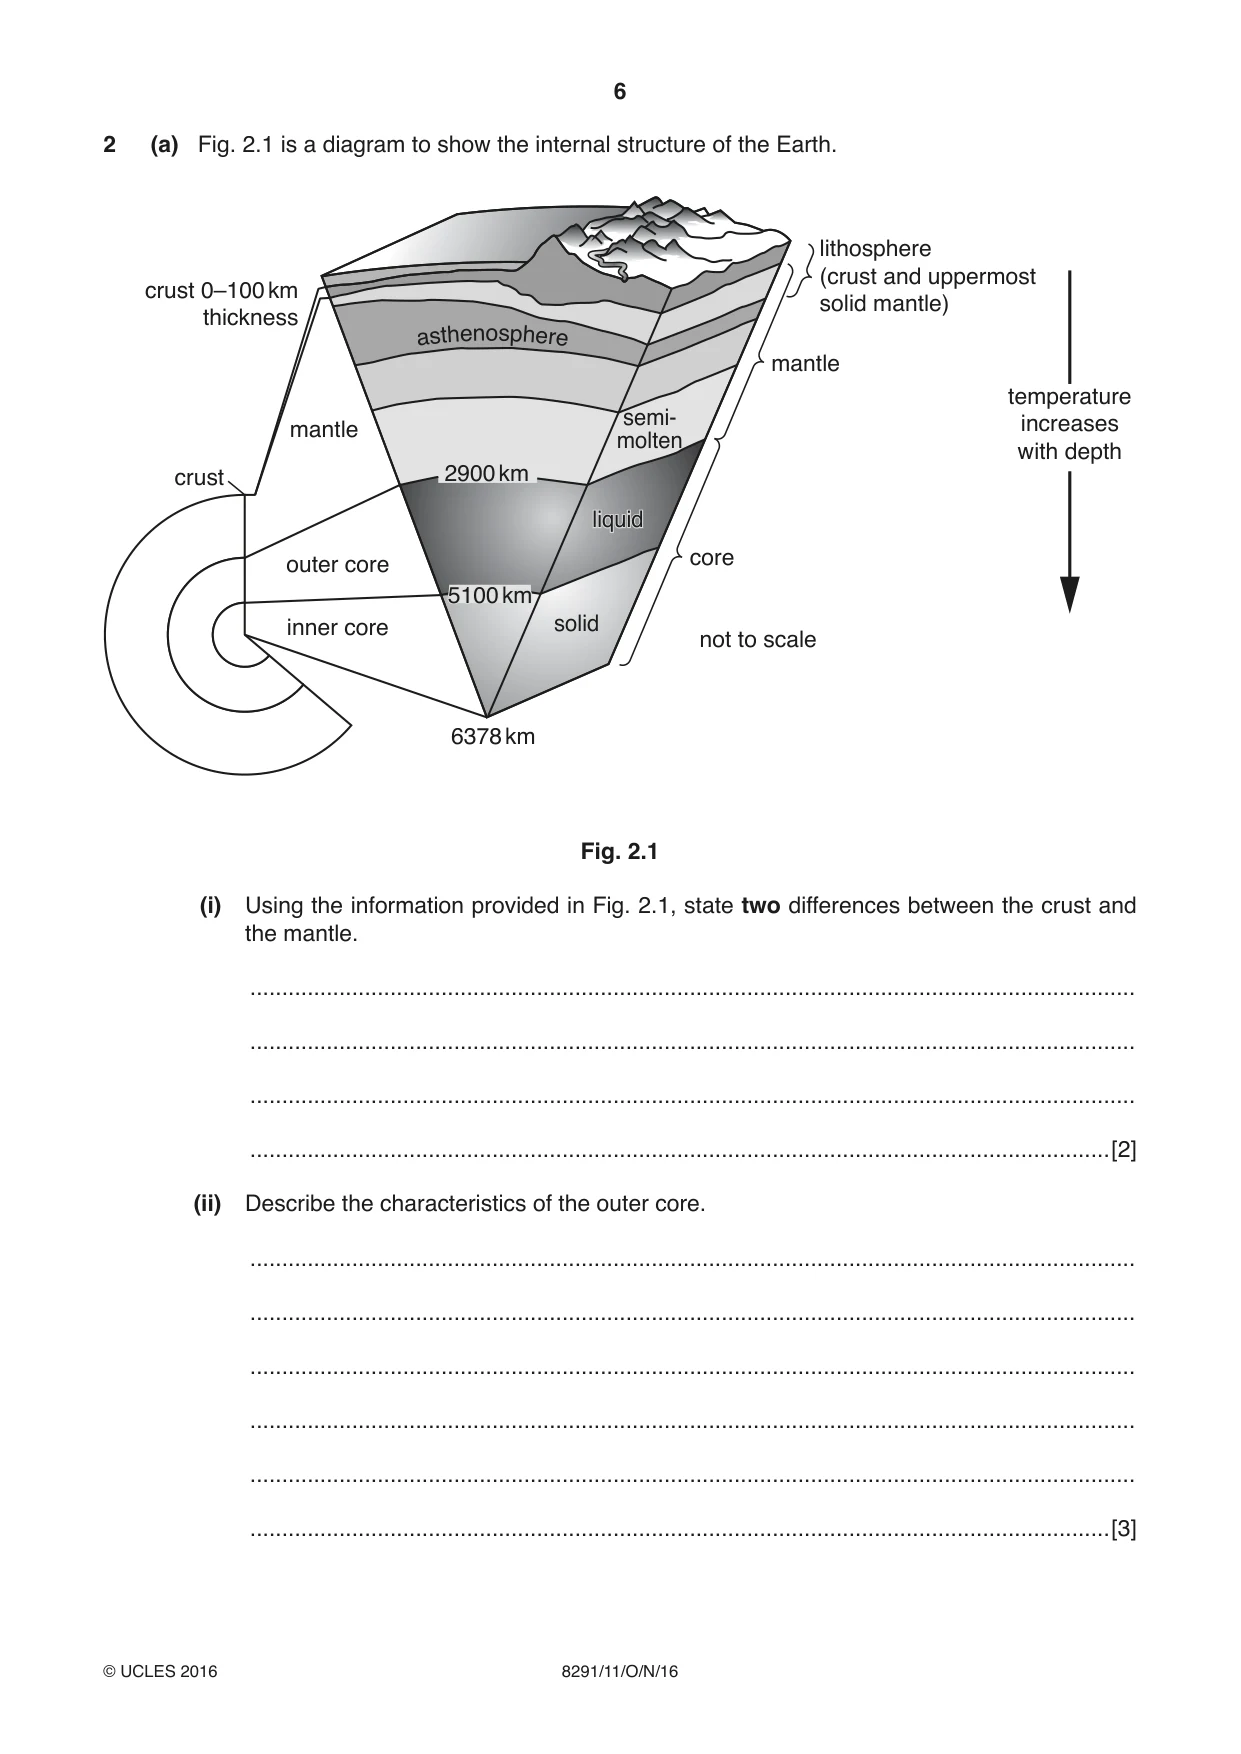
6 8291/11/O/N/16 © UCLES 2016 2 (a) Fig. 2.1 is a diagram to show the internal structure of the Earth. crust 0–100 km thickness crust mantle outer core inner core lithosphere (crust and uppermost solid mantle) mantle core not to scale temperature increases with depth ast he no sp her e 2900 km 6378 km semi- molten liquid liquid solid 5100 km 5100 km Fig. 2.1 (i) Using the information provided in Fig. 2.1, state two differences between the crust and the mantle. … … … …[2] (ii) Describe the characteristics of the outer core. … … … … … …[3]
Question paper, page 7
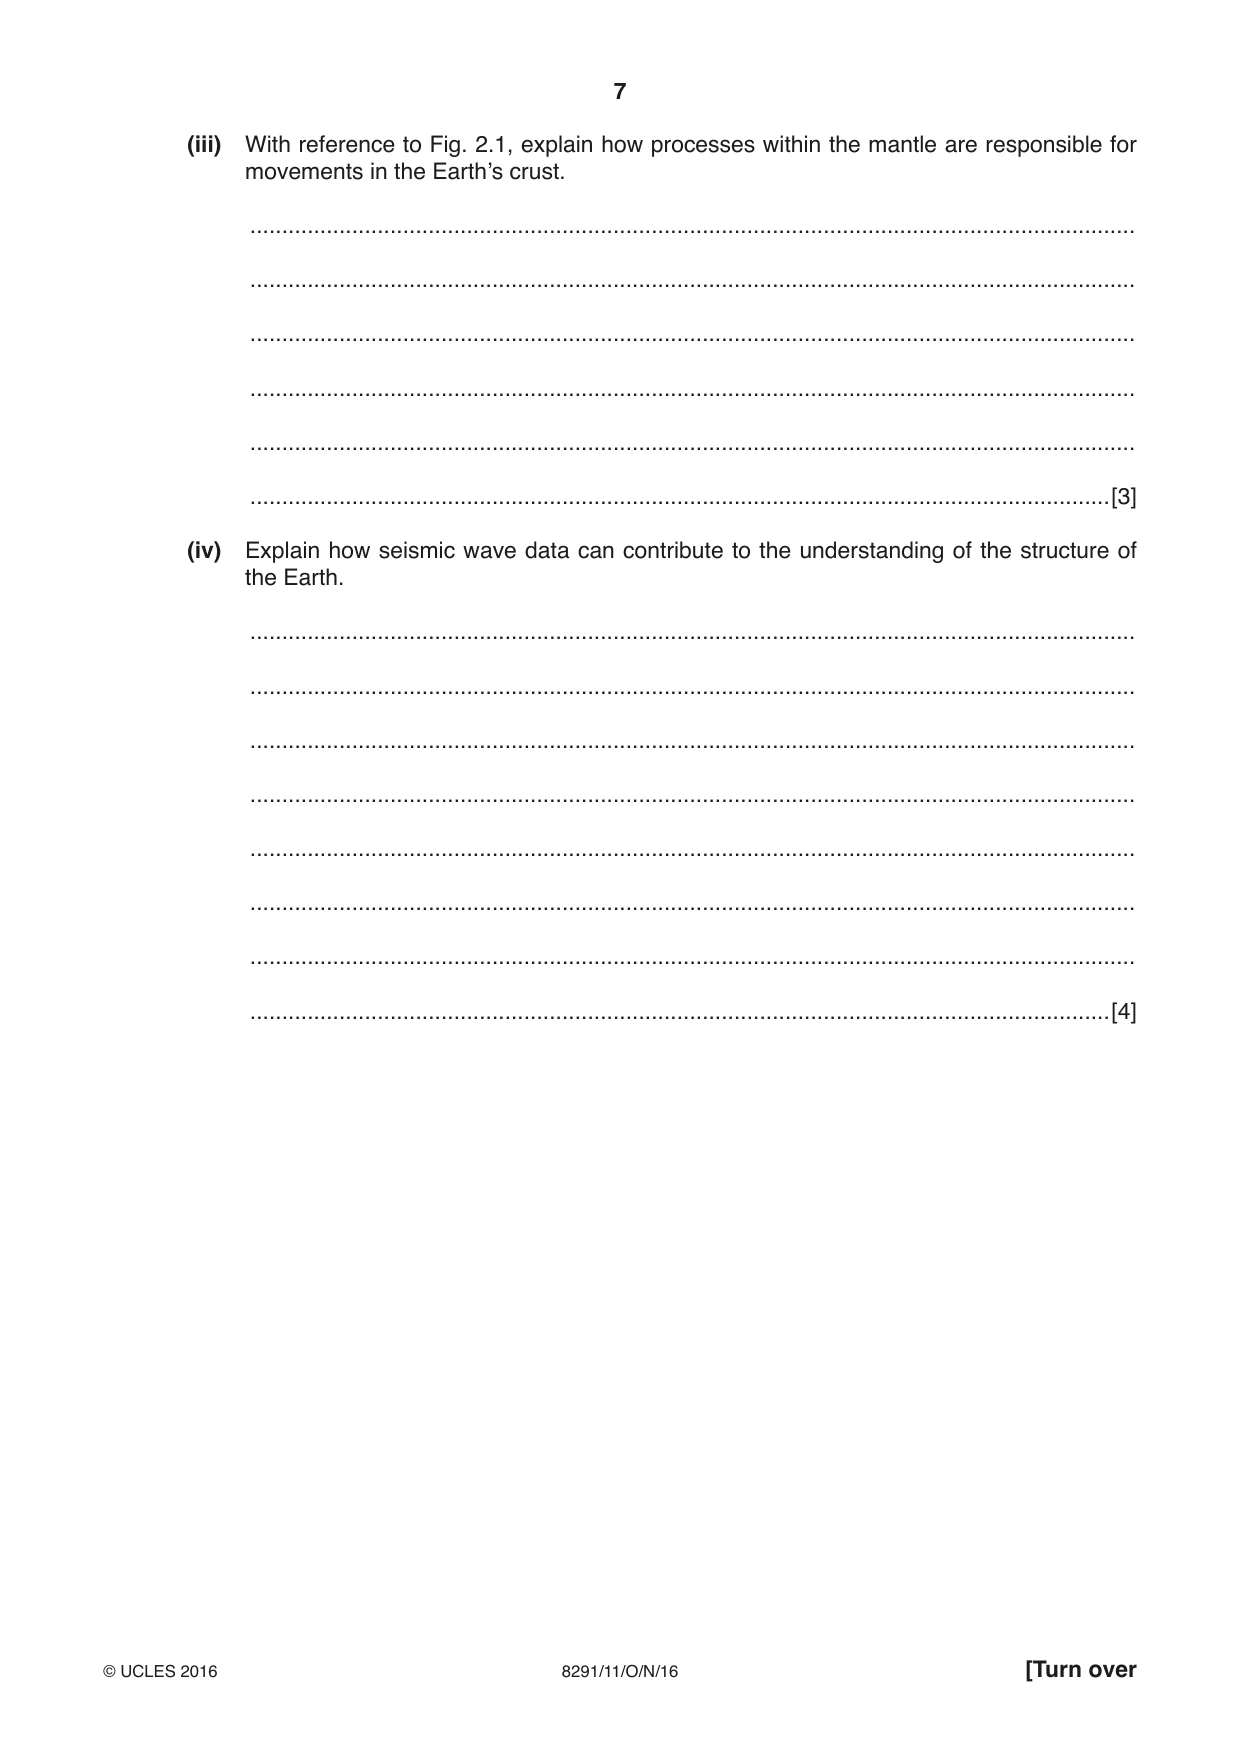
7 8291/11/O/N/16 © UCLES 2016 [Turn over (iii) With reference to Fig. 2.1, explain how processes within the mantle are responsible for movements in the Earth’s crust. … … … … … …[3] (iv) Explain how seismic wave data can contribute to the understanding of the structure of the Earth. … … … … … … … …[4]
Question paper, page 8
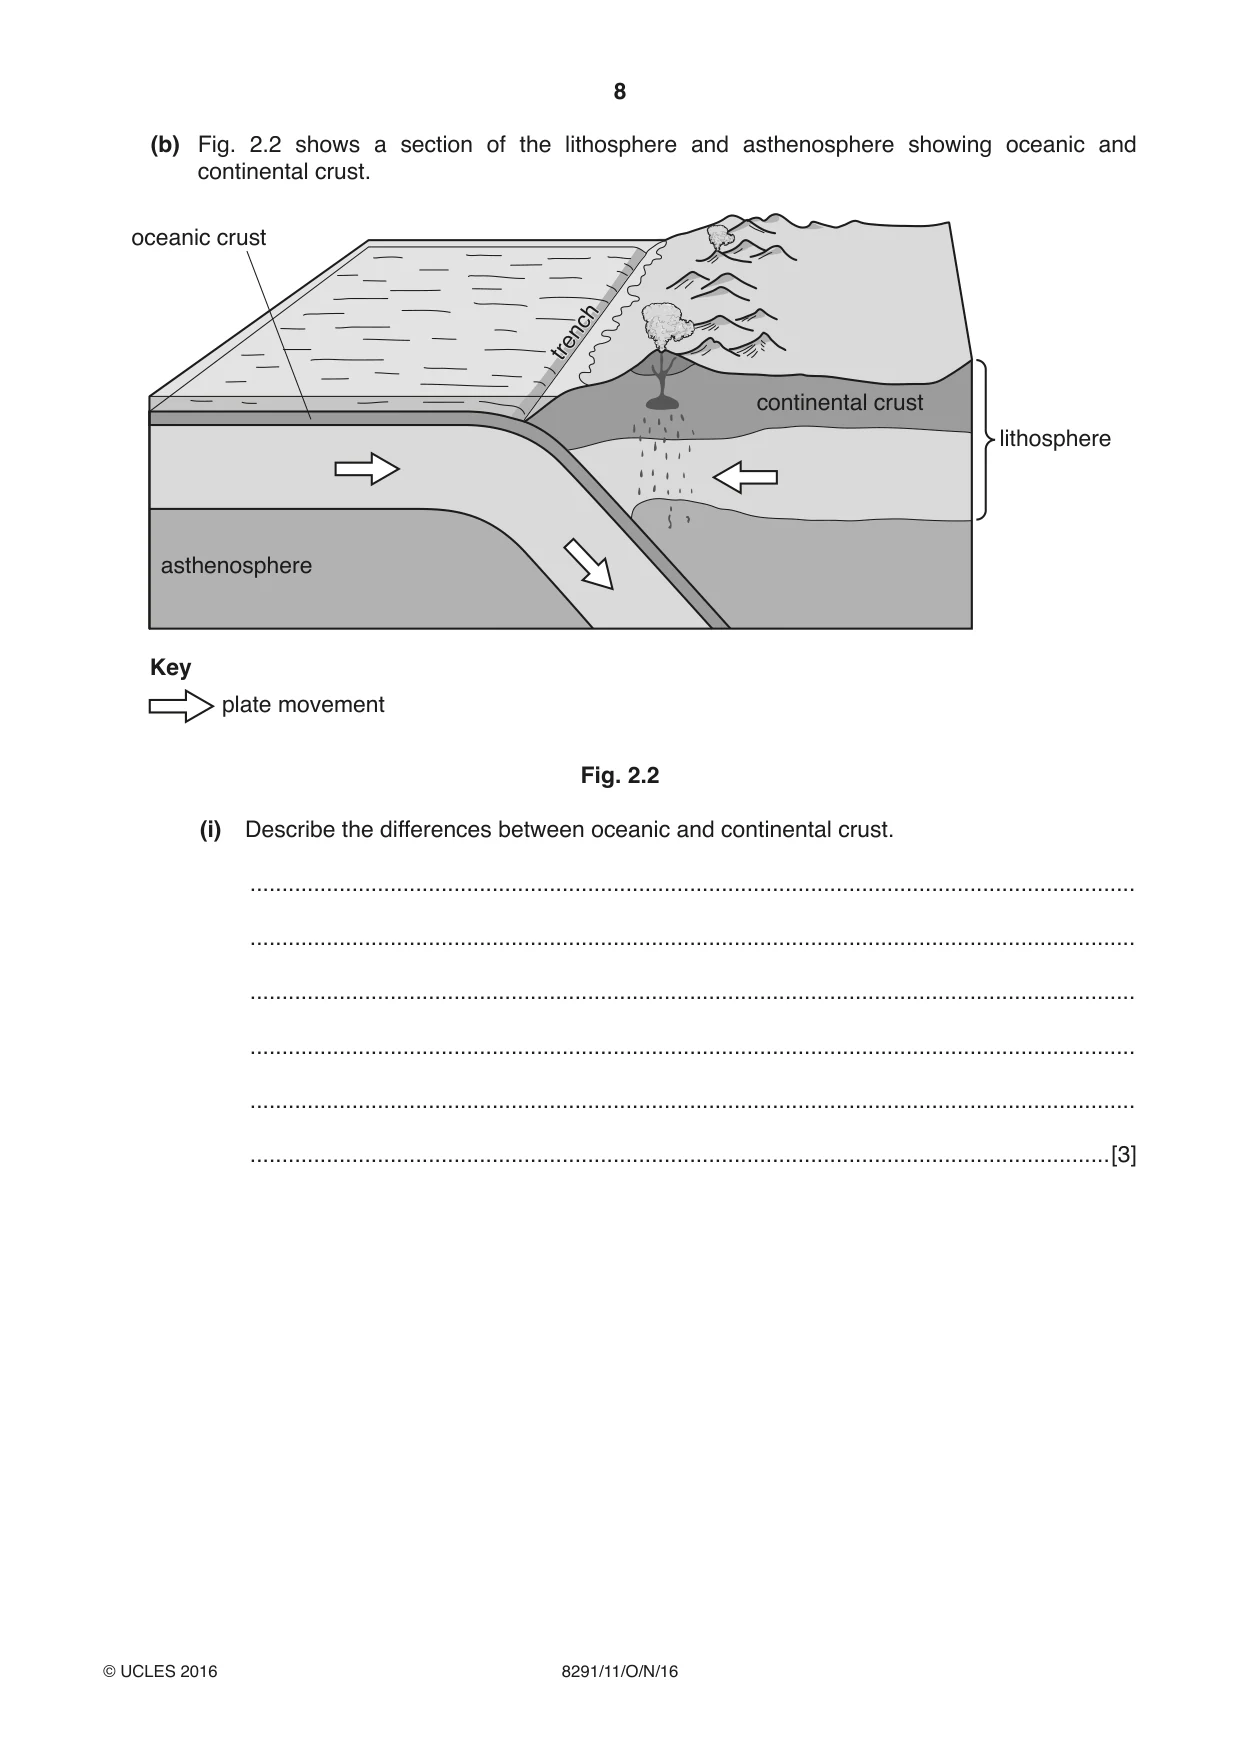
8 8291/11/O/N/16 © UCLES 2016 (b) Fig. 2.2 shows a section of the lithosphere and asthenosphere showing oceanic and continental crust. lithosphere asthenosphere oceanic crust continental crust Key plate movement trench trench Fig. 2.2 (i) Describe the differences between oceanic and continental crust. … … … … … …[3]
Question paper, page 9
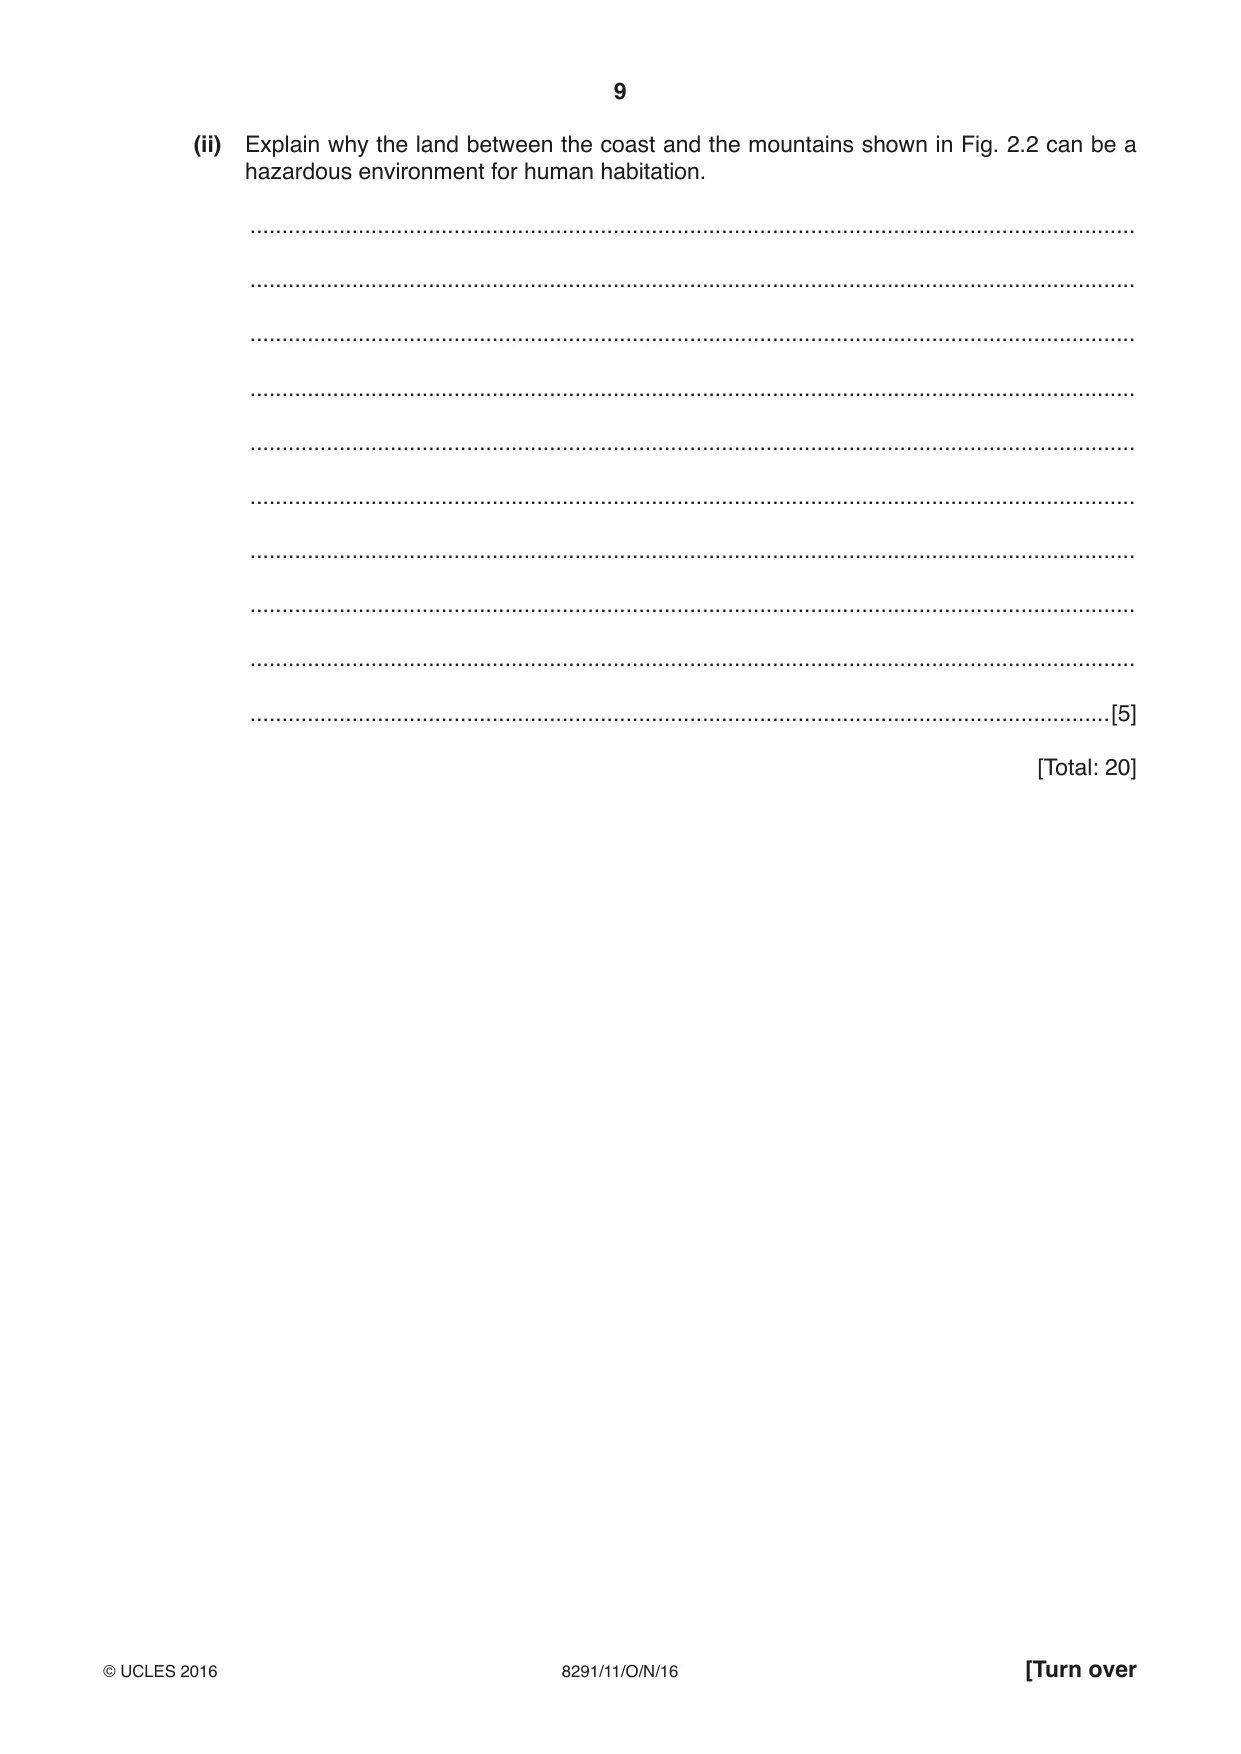
9 8291/11/O/N/16 © UCLES 2016 [Turn over (ii) Explain why the land between the coast and the mountains shown in Fig. 2.2 can be a hazardous environment for human habitation. … … … … … … … … … …[5] [Total: 20]
Question paper, page 10
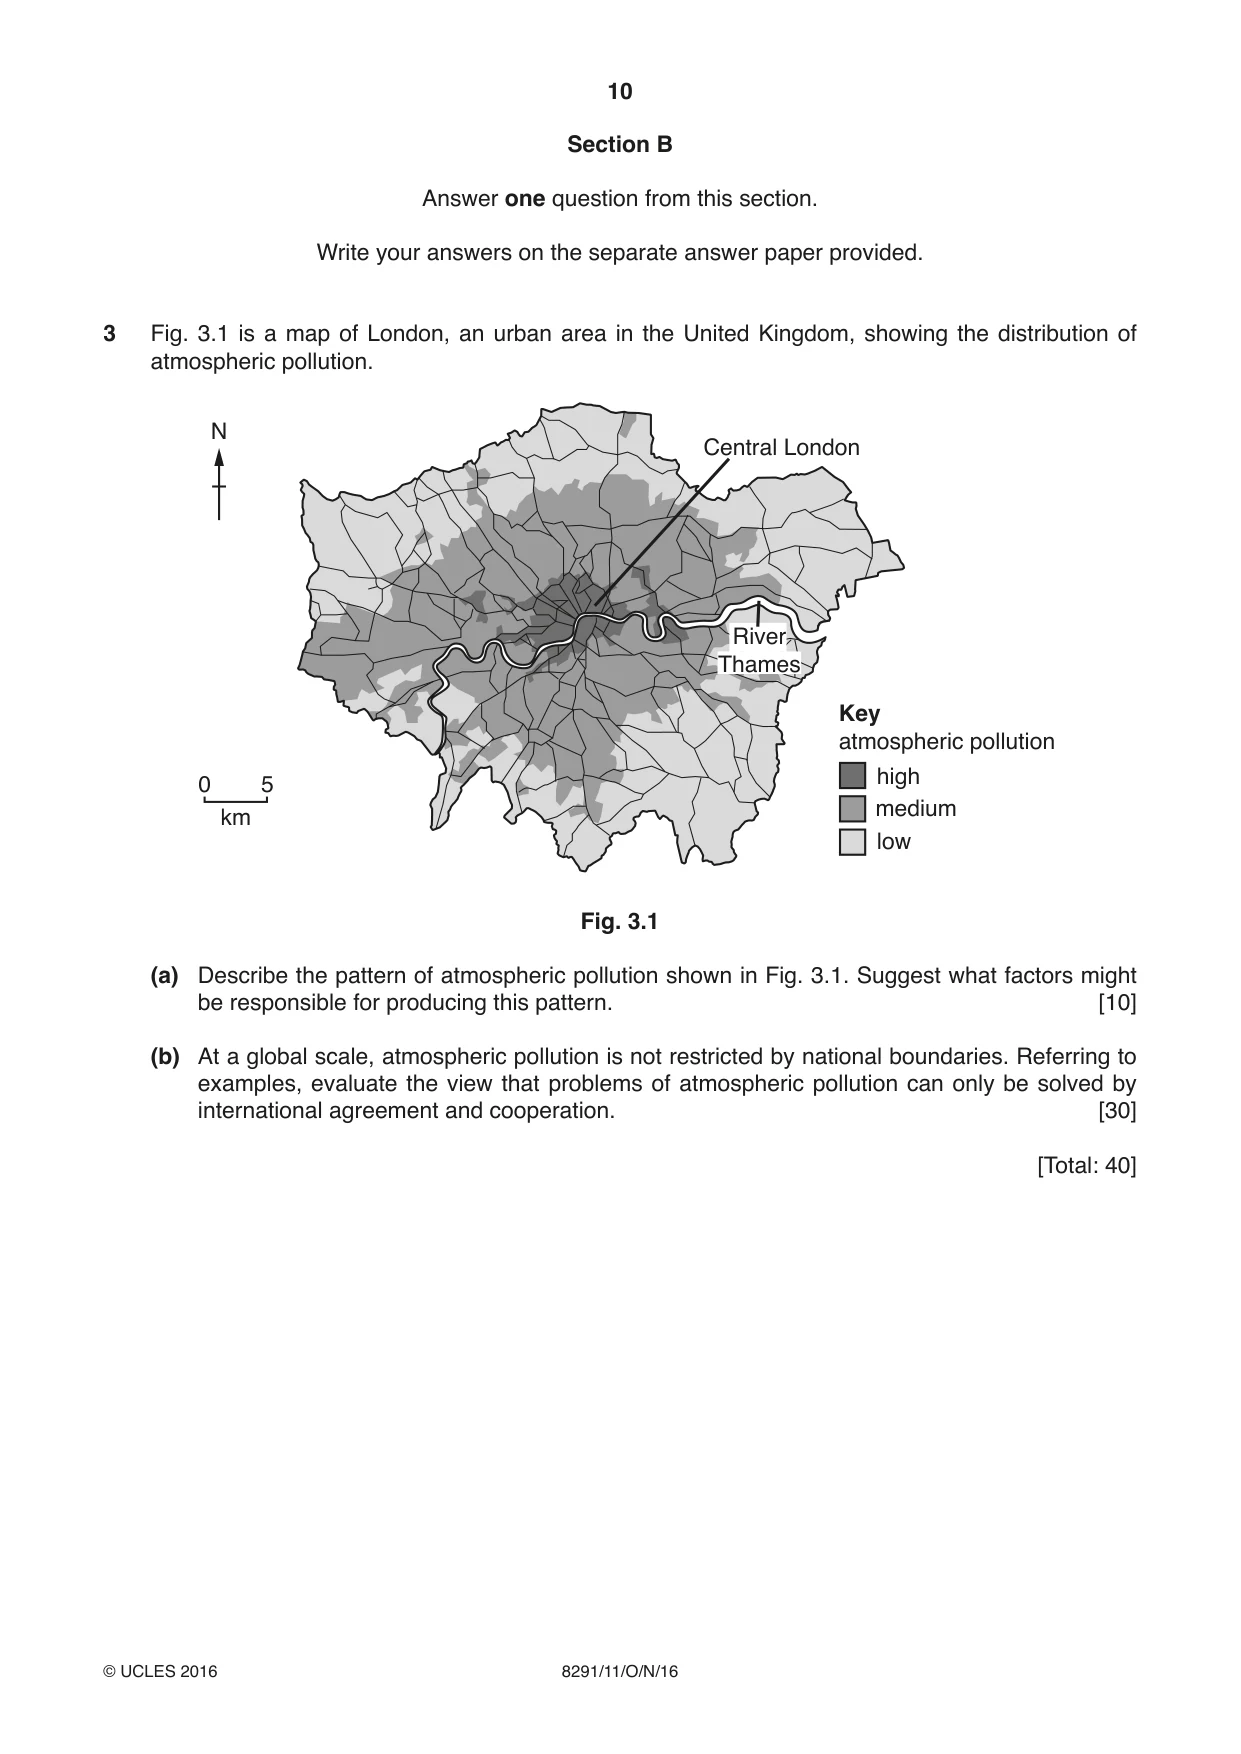
10 8291/11/O/N/16 © UCLES 2016 Section B Answer one question from this section. Write your answers on the separate answer paper provided. 3 Fig. 3.1 is a map of London, an urban area in the United Kingdom, showing the distribution of atmospheric pollution. 0 5 km N Central London River Thames Key atmospheric pollution high medium low Fig. 3.1 (a) Describe the pattern of atmospheric pollution shown in Fig. 3.1. Suggest what factors might be responsible for producing this pattern. [10] (b) At a global scale, atmospheric pollution is not restricted by national boundaries. Referring to examples, evaluate the view that problems of atmospheric pollution can only be solved by international agreement and cooperation. [30] [Total: 40]
Question paper, page 11
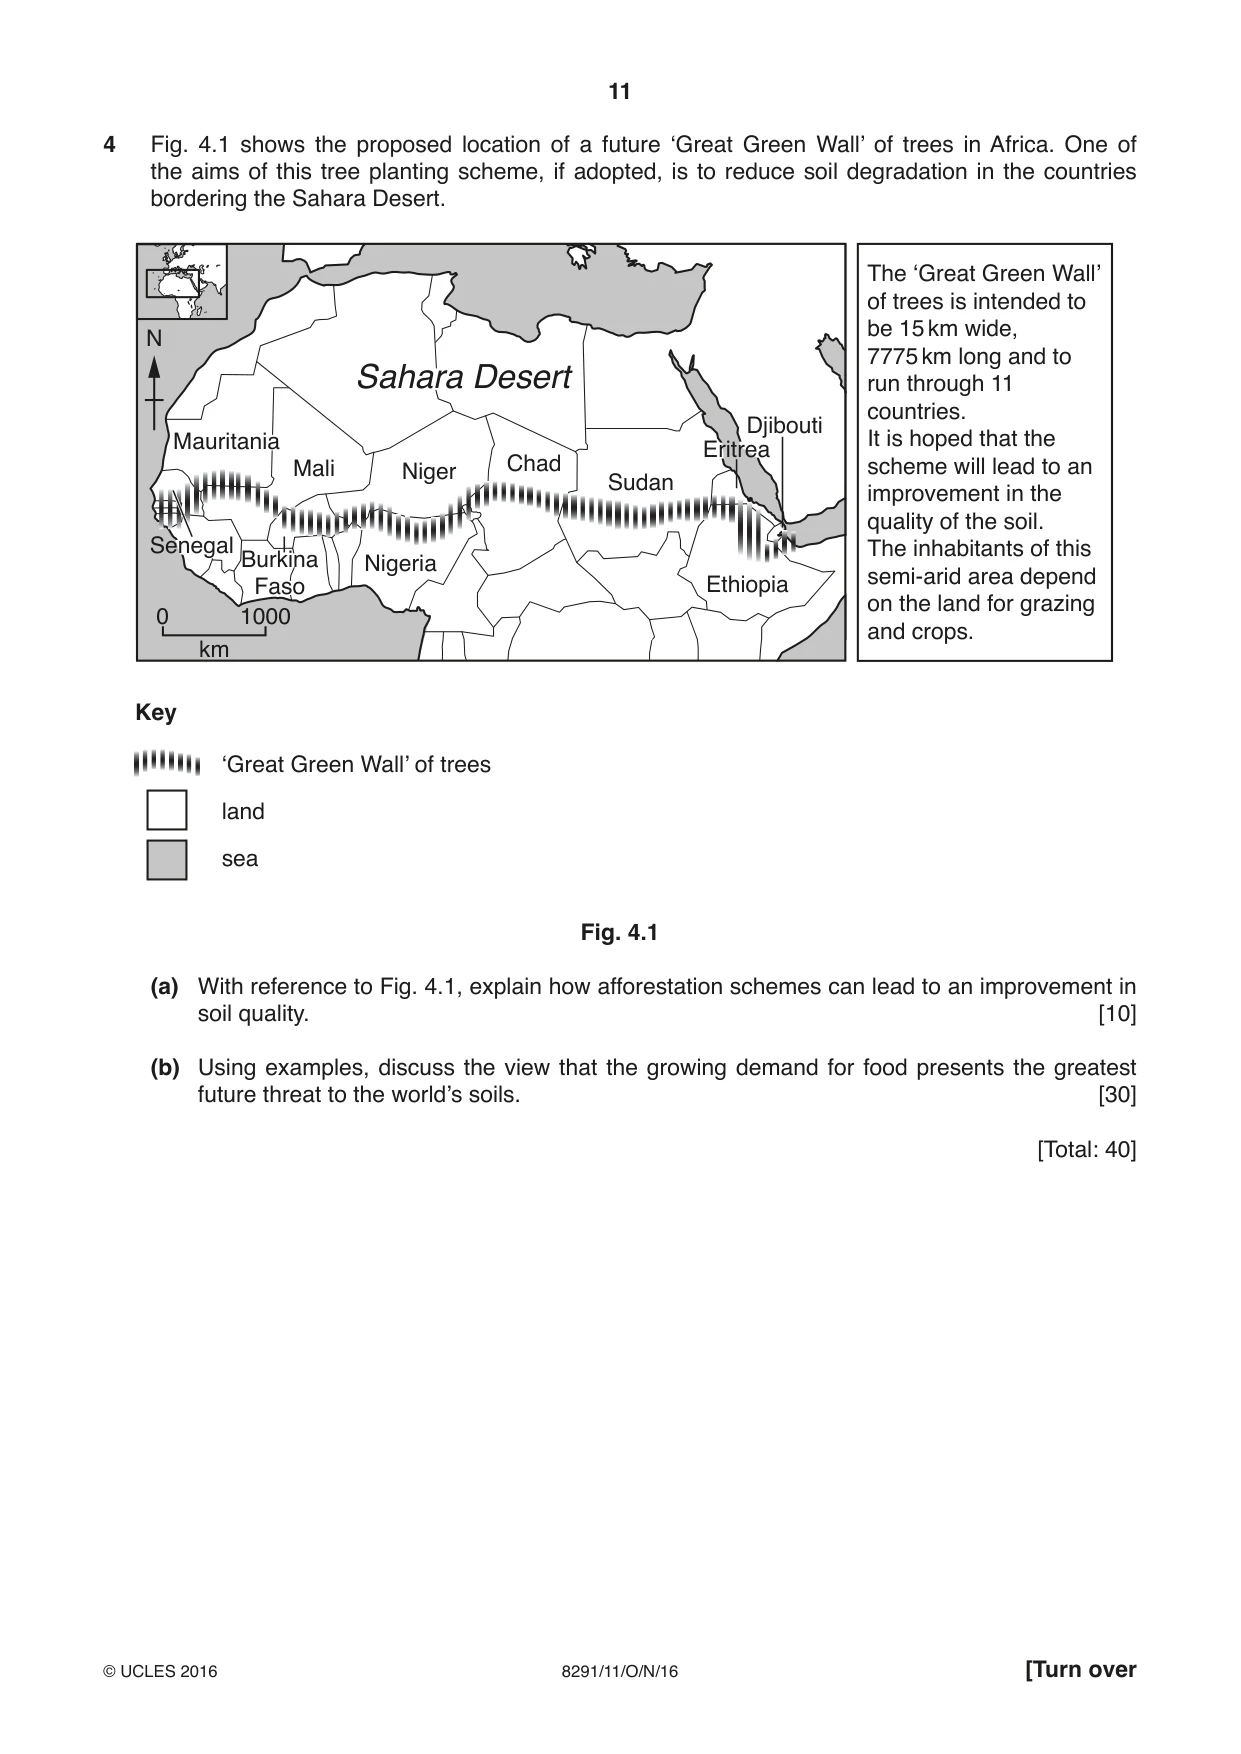
11 8291/11/O/N/16 © UCLES 2016 [Turn over 4 Fig. 4.1 shows the proposed location of a future ‘Great Green Wall’ of trees in Africa. One of the aims of this tree planting scheme, if adopted, is to reduce soil degradation in the countries bordering the Sahara Desert. Sahara Desert The ‘Great Green Wall’ of trees is intended to be 15 km wide, 7775 km long and to run through 11 countries. It is hoped that the scheme will lead to an improvement in the quality of the soil. The inhabitants of this semi-arid area depend on the land for grazing and crops. Mauritania Mali Niger Nigeria Chad Sudan Ethiopia Djibouti Senegal Burkina Faso Eritrea 0 1000 km N Key ‘Great Green Wall’ of trees land sea Fig. 4.1 (a) With reference to Fig. 4.1, explain how afforestation schemes can lead to an improvement in soil quality. [10] (b) Using examples, discuss the view that the growing demand for food presents the greatest future threat to the world’s soils. [30] [Total: 40]
Question paper, page 12
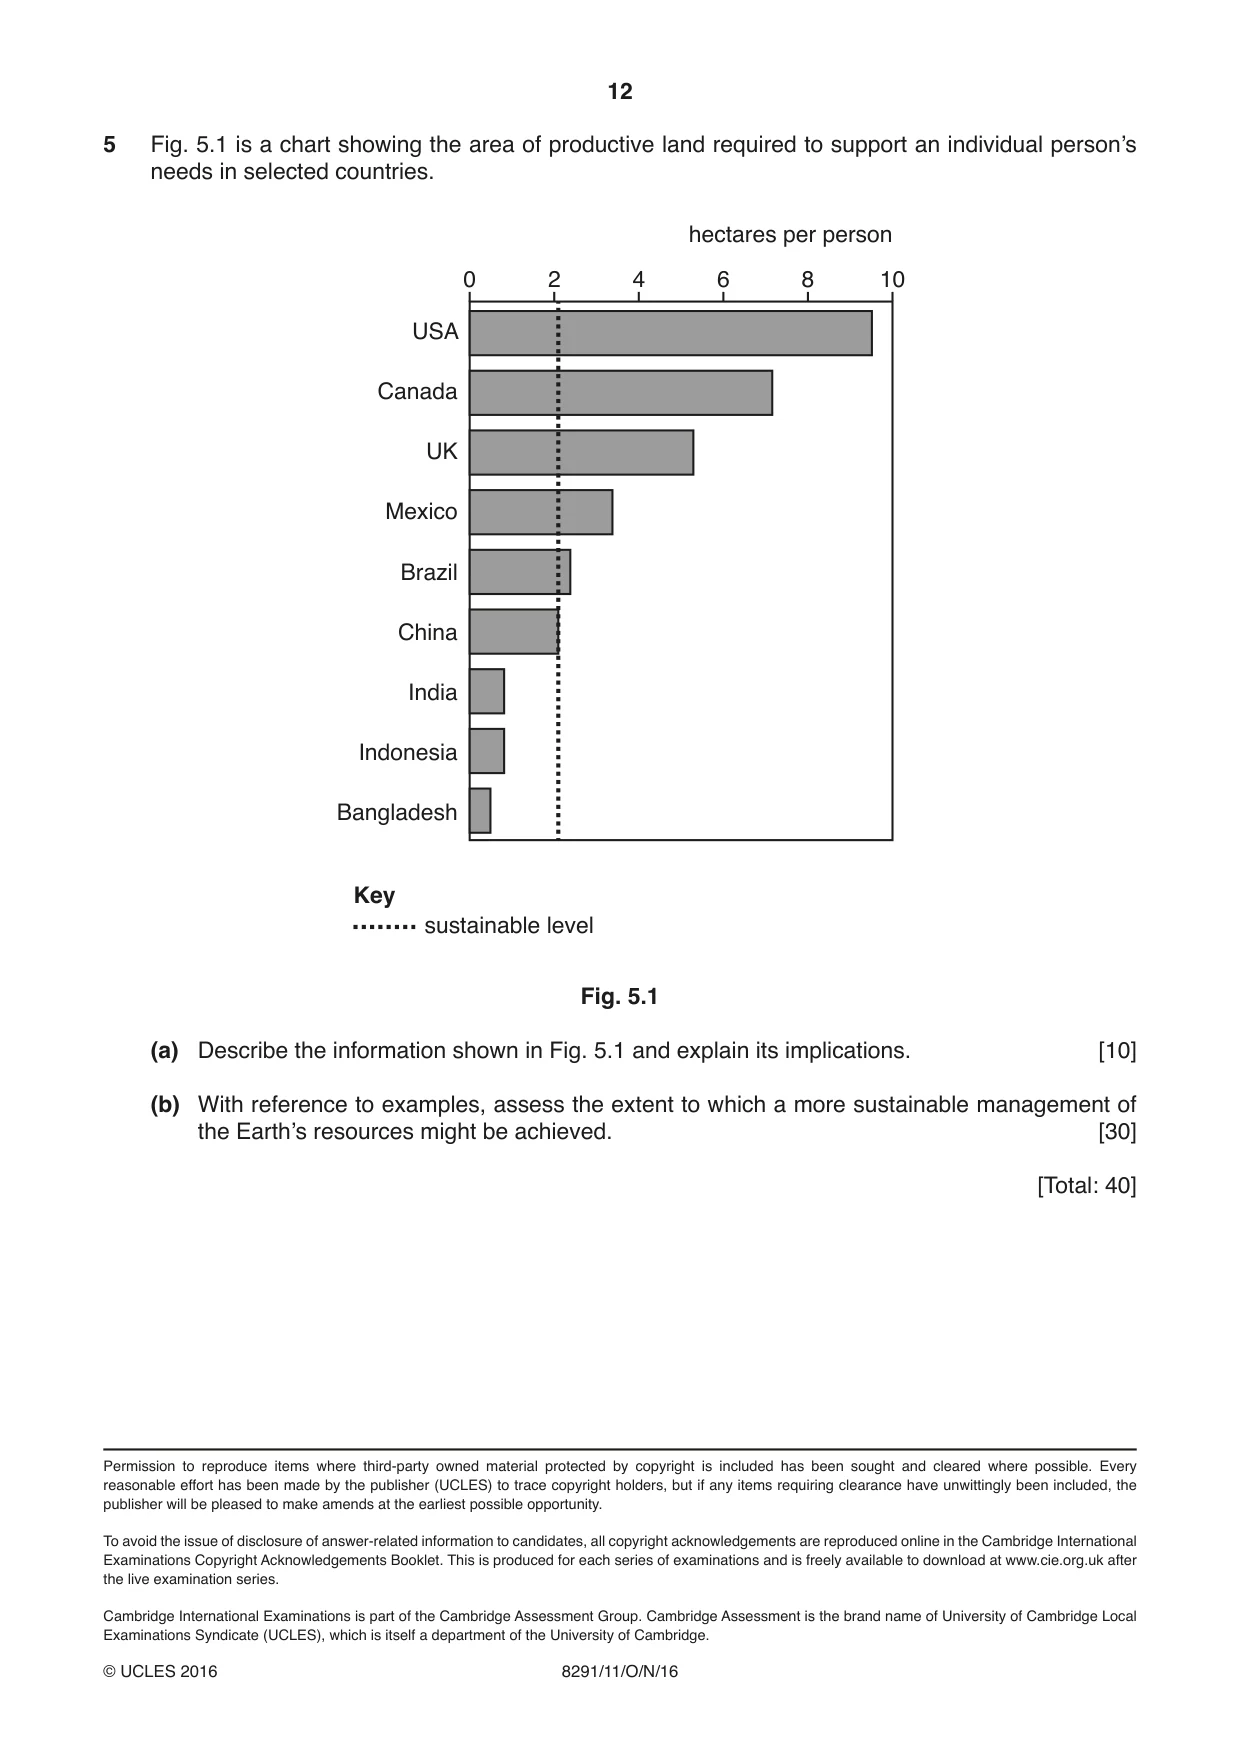
12 8291/11/O/N/16 © UCLES 2016 5 Fig. 5.1 is a chart showing the area of productive land required to support an individual person’s needs in selected countries. 0 2 4 6 8 10 hectares per person USA Canada UK Mexico Brazil China India Indonesia Bangladesh sustainable level Key Fig. 5.1 (a) Describe the information shown in Fig. 5.1 and explain its implications. [10] (b) With reference to examples, assess the extent to which a more sustainable management of the Earth’s resources might be achieved. [30] [Total: 40] Permission to reproduce items where third-party owned material protected by copyright is included has been sought and cleared where possible. Every reasonable effort has been made by the publisher (UCLES) to trace copyright holders, but if any items requiring clearance have unwittingly been included, the publisher will be pleased to make amends at the earliest possible opportunity. To avoid the issue of disclosure of answer-related information to candidates, all copyright acknowledgements are reproduced online in the Cambridge International Examinations Copyright Acknowledgements Booklet. This is produced for each series of examinations and is freely available to download at www.cie.org.uk after the live examination series. Cambridge International Examinations is part of the Cambridge Assessment Group. Cambridge Assessment is the brand name of University of Cambridge Local Examinations Syndicate (UCLES), which is itself a department of the University of Cambridge.
Mark scheme, page 1
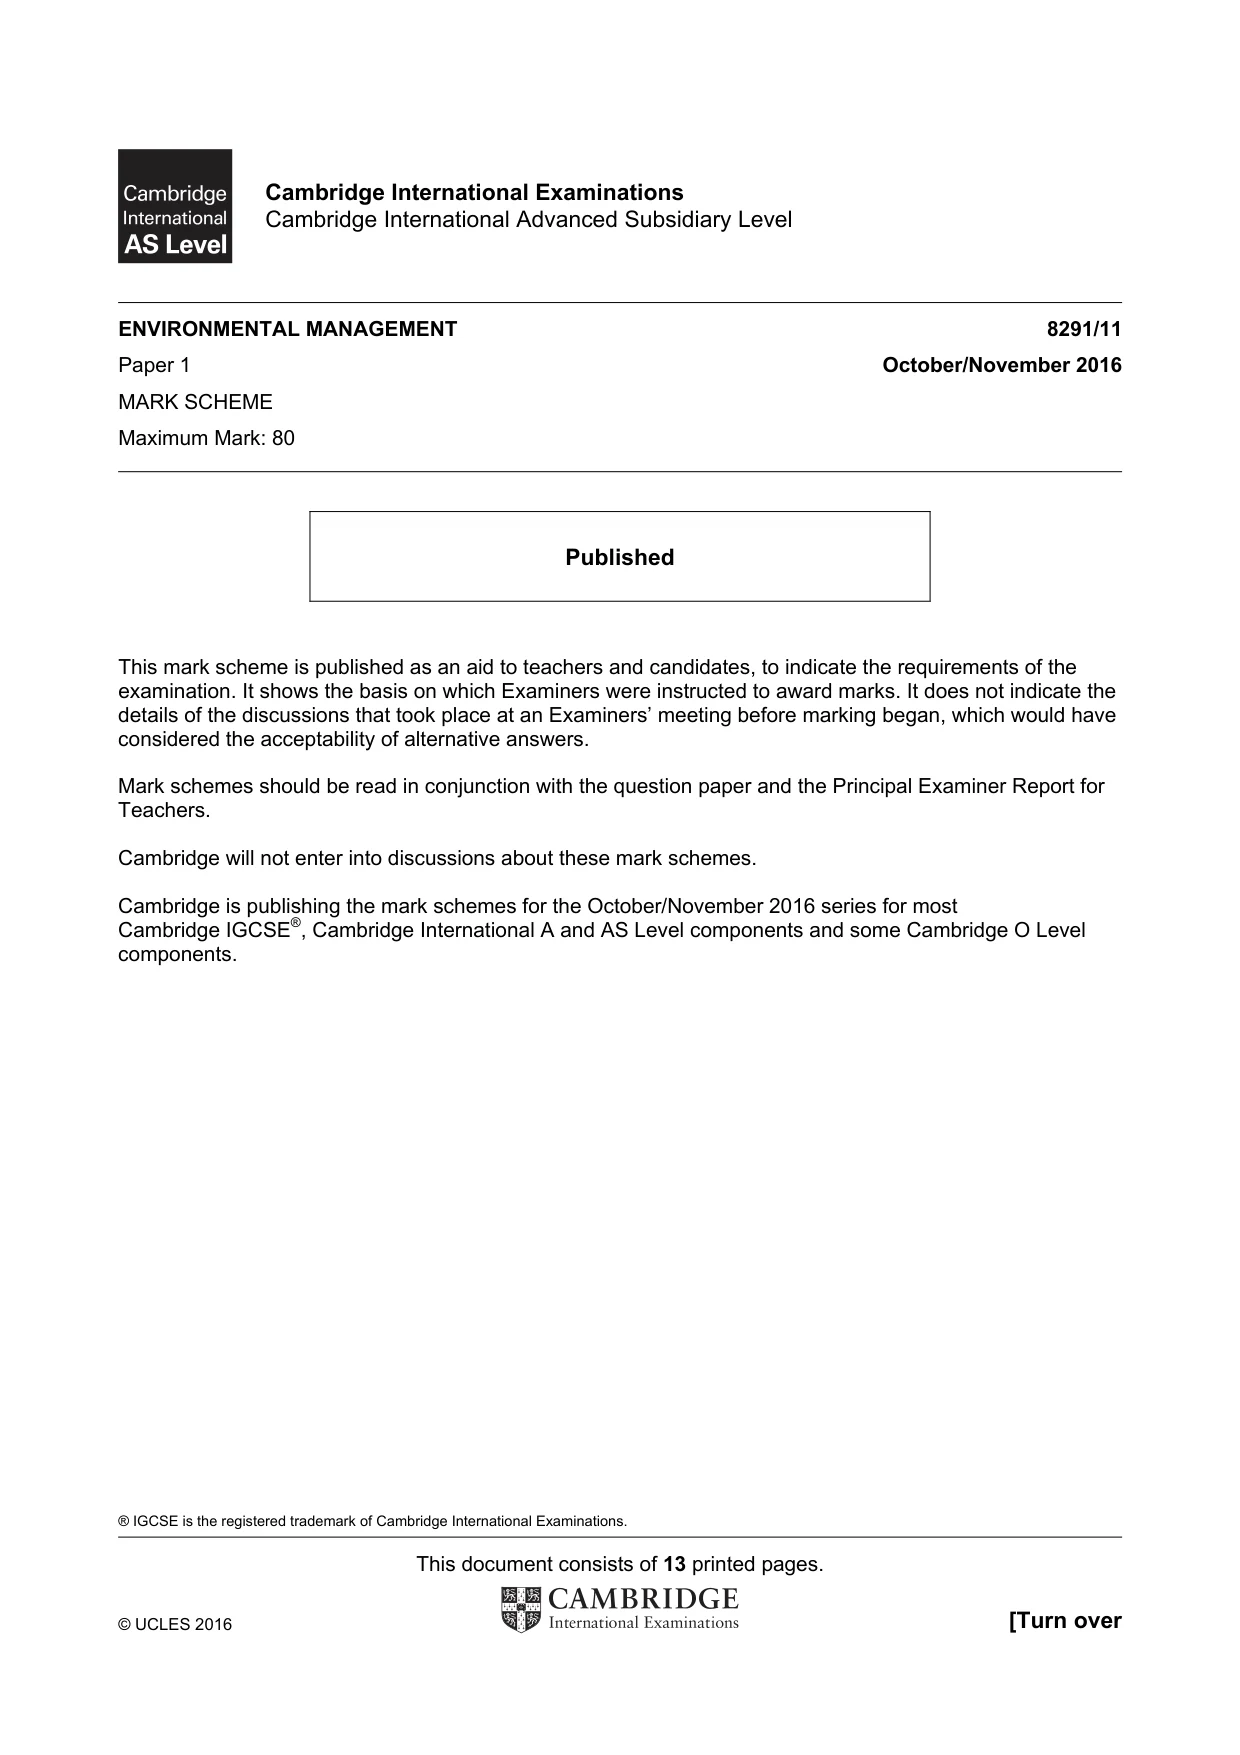
® IGCSE is the registered trademark of Cambridge International Examinations. This document consists of 13 printed pages. © UCLES 2016 [Turn over Cambridge International Examinations Cambridge International Advanced Subsidiary Level ENVIRONMENTAL MANAGEMENT 8291/11 Paper 1 October/November 2016 MARK SCHEME Maximum Mark: 80 Published This mark scheme is published as an aid to teachers and candidates, to indicate the requirements of the examination. It shows the basis on which Examiners were instructed to award marks. It does not indicate the details of the discussions that took place at an Examiners’ meeting before marking began, which would have considered the acceptability of alternative answers. Mark schemes should be read in conjunction with the question paper and the Principal Examiner Report for Teachers. Cambridge will not enter into discussions about these mark schemes. Cambridge is publishing the mark schemes for the October/November 2016 series for most Cambridge IGCSE®, Cambridge International A and AS Level components and some Cambridge O Level components.
Mark scheme, page 2
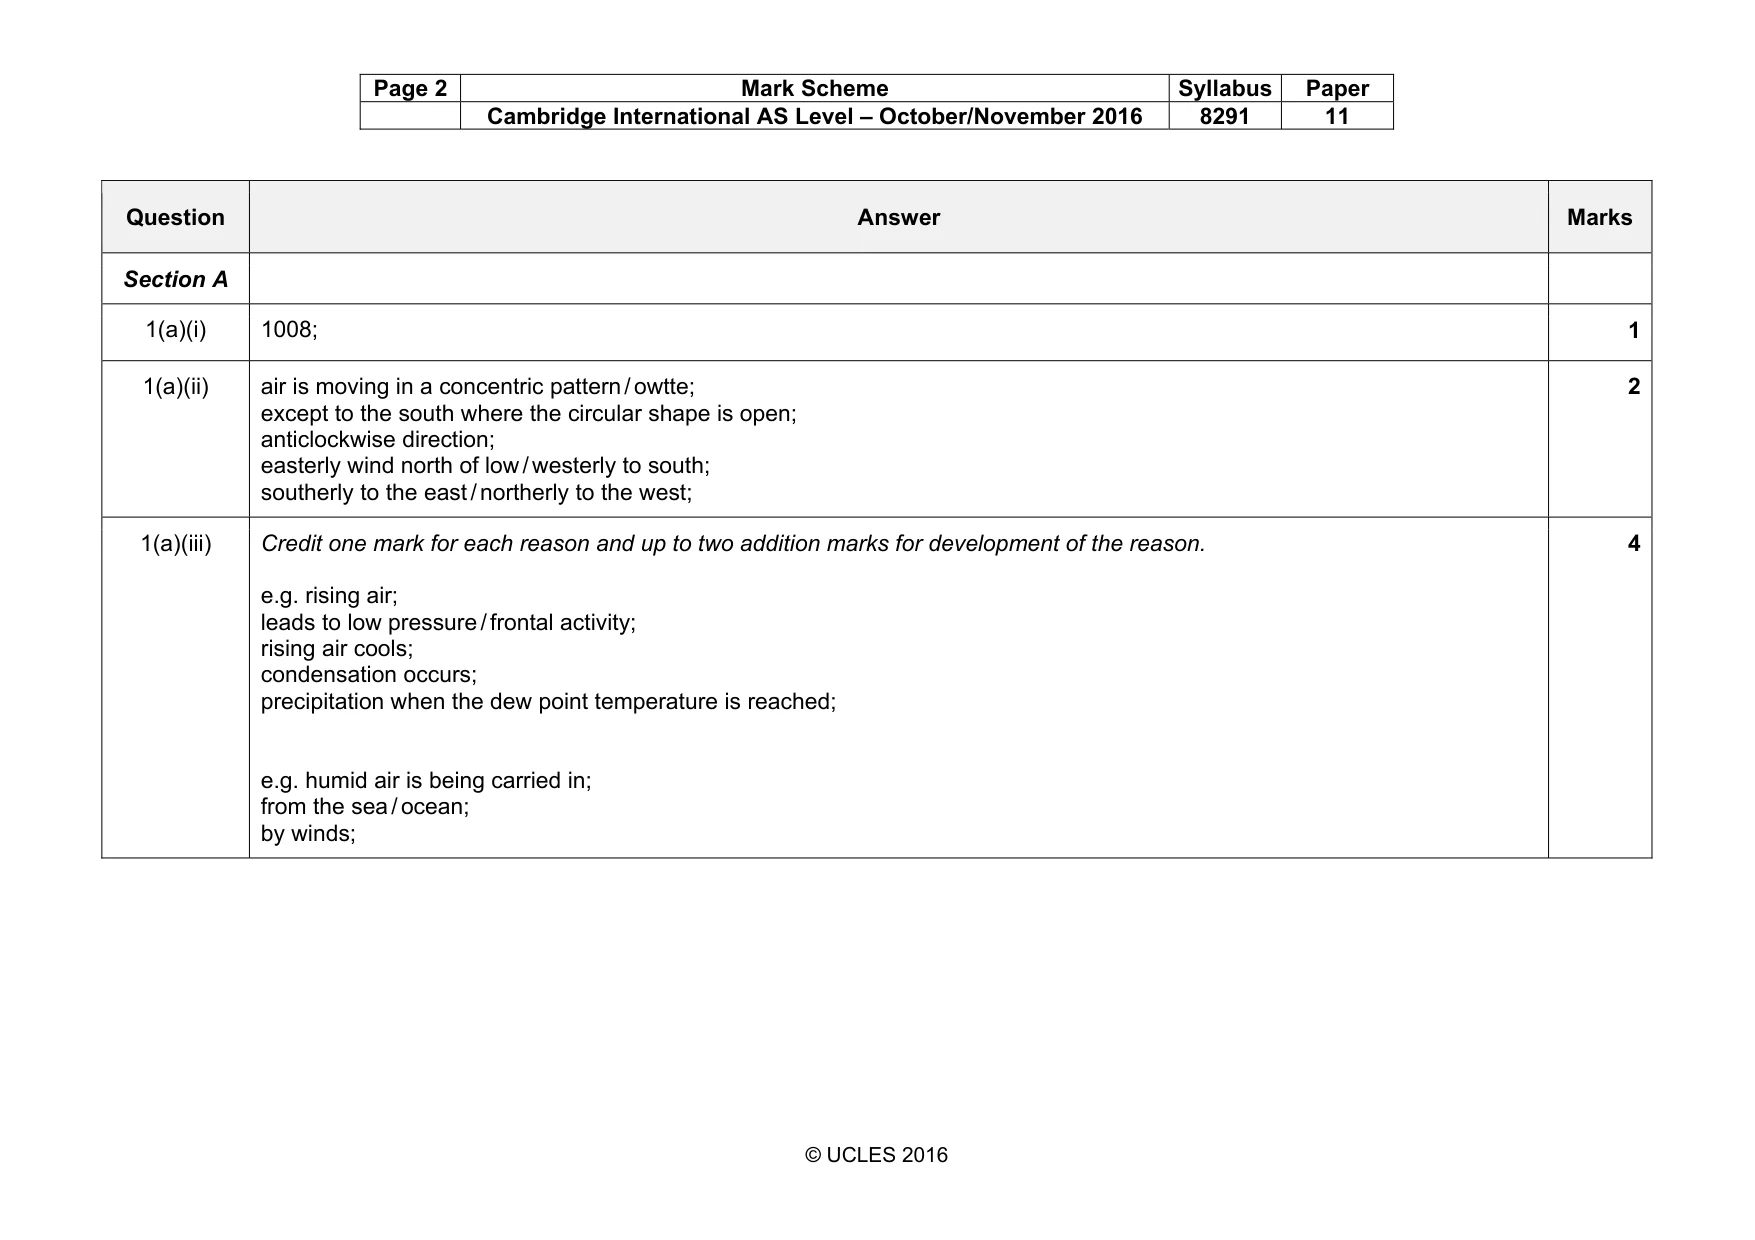
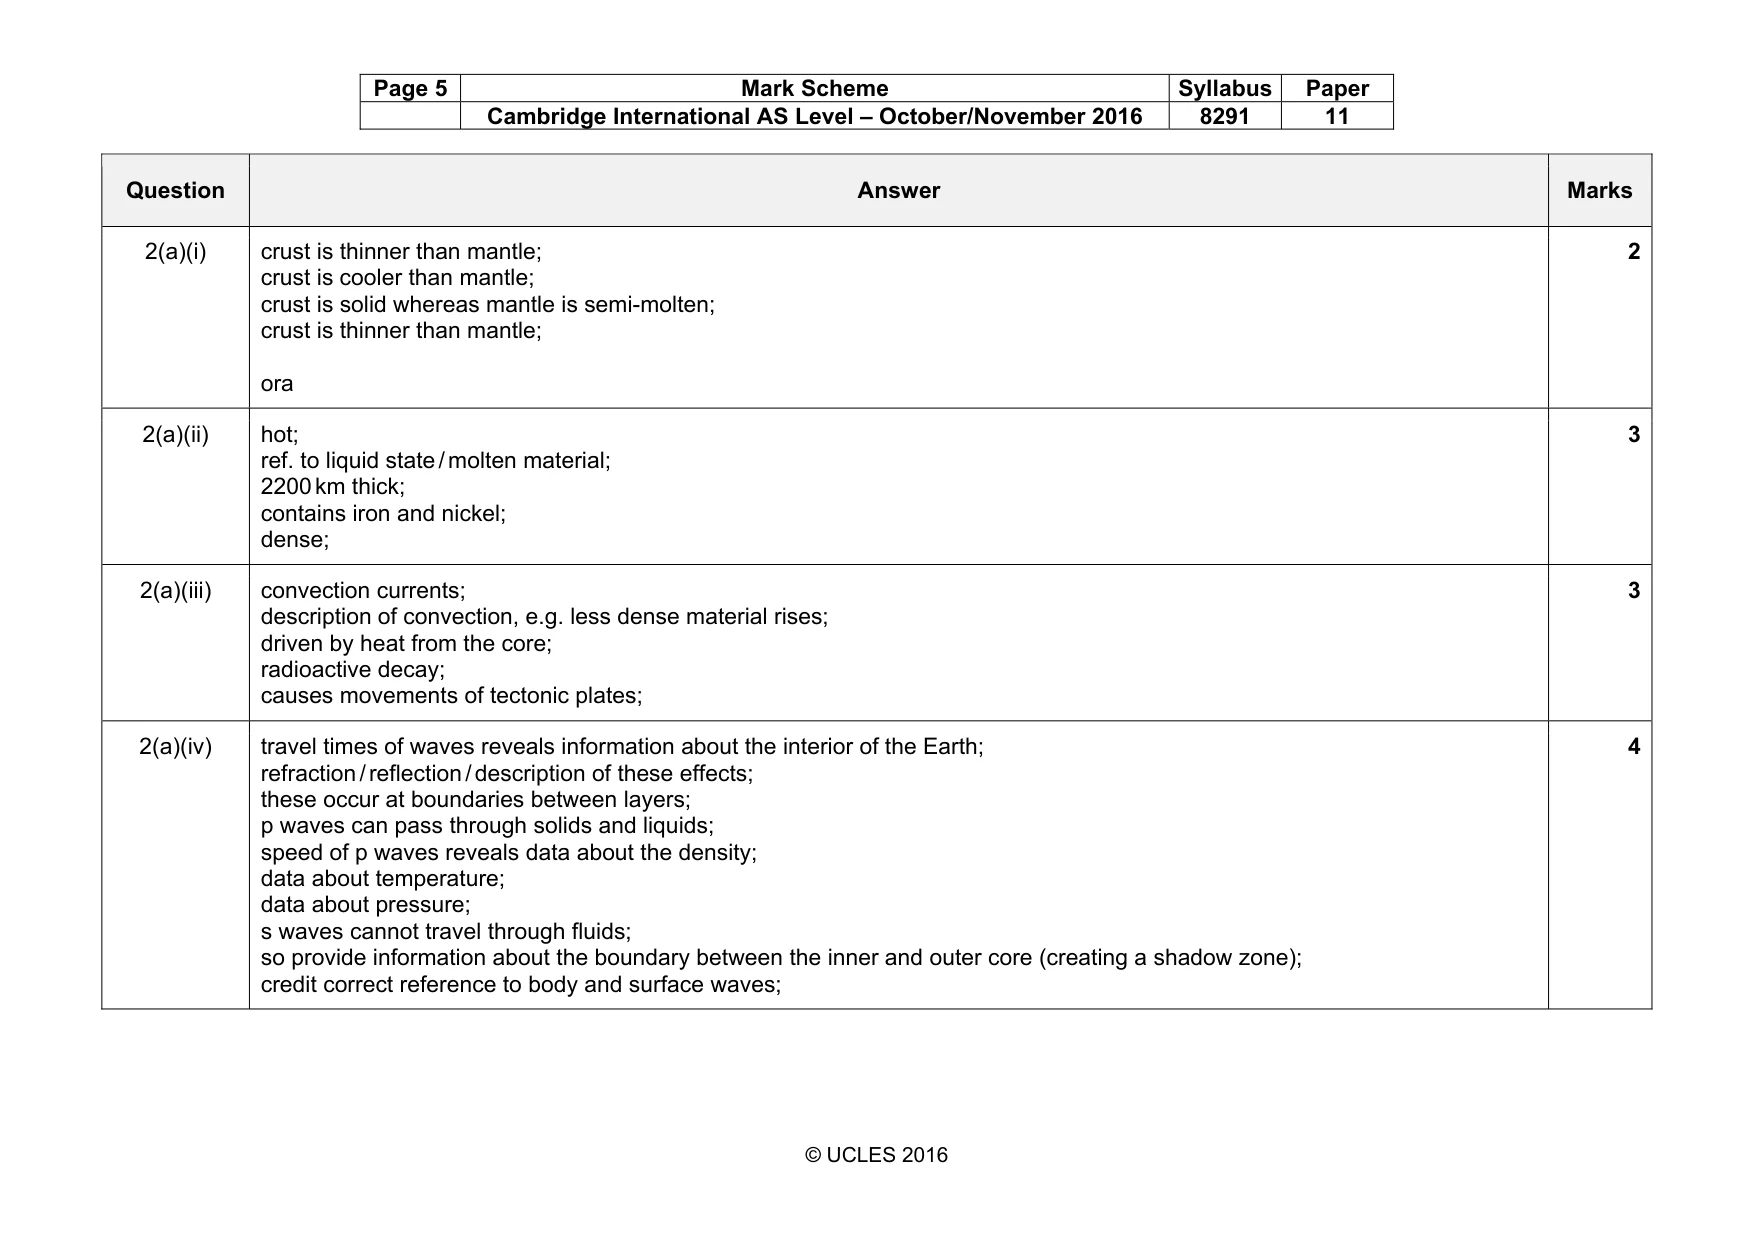
Page 2 Mark Scheme Syllabus Paper Cambridge International AS Level – October/November 2016 8291 11 © UCLES 2016 Question Answer Marks Section A 1(a)(i) 1008; 1 1(a)(ii) air is moving in a concentric pattern / owtte; except to the south where the circular shape is open; anticlockwise direction; easterly wind north of low / westerly to south; southerly to the east / northerly to the west; 2 1(a)(iii) Credit one mark for each reason and up to two addition marks for development of the reason. e.g. rising air; leads to low pressure / frontal activity; rising air cools; condensation occurs; precipitation when the dew point temperature is reached; e.g. humid air is being carried in; from the sea / ocean; by winds; 4
Mark scheme, page 3
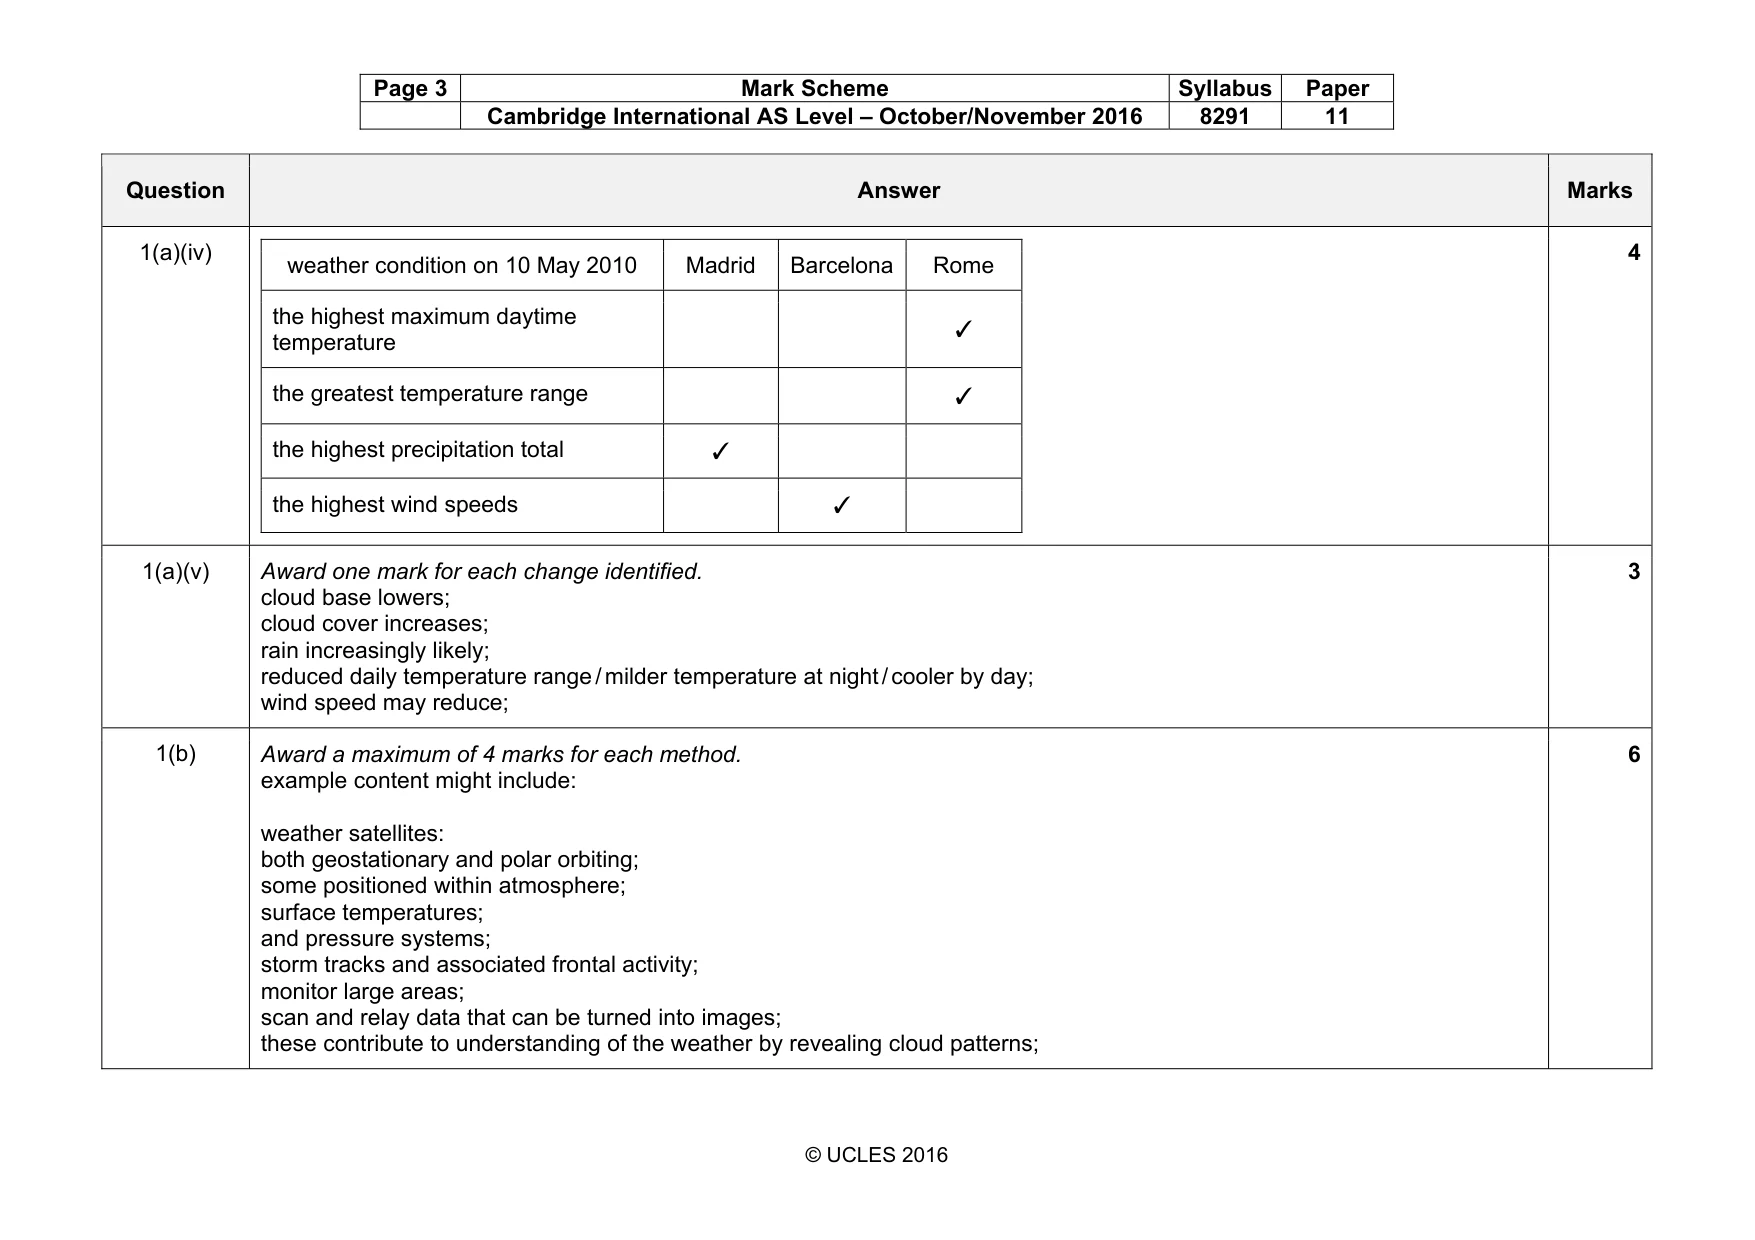
Page 3 Mark Scheme Syllabus Paper Cambridge International AS Level – October/November 2016 8291 11 © UCLES 2016 Question Answer Marks 1(a)(iv) weather condition on 10 May 2010 Madrid Barcelona Rome the highest maximum daytime temperature ✓ the greatest temperature range ✓ the highest precipitation total ✓ the highest wind speeds ✓ 4 1(a)(v) Award one mark for each change identified. cloud base lowers; cloud cover increases; rain increasingly likely; reduced daily temperature range / milder temperature at night / cooler by day; wind speed may reduce; 3 1(b) Award a maximum of 4 marks for each method. example content might include: weather satellites: both geostationary and polar orbiting; some positioned within atmosphere; surface temperatures; and pressure systems; storm tracks and associated frontal activity; monitor large areas; scan and relay data that can be turned into images; these contribute to understanding of the weather by revealing cloud patterns; 6
Mark scheme, page 4
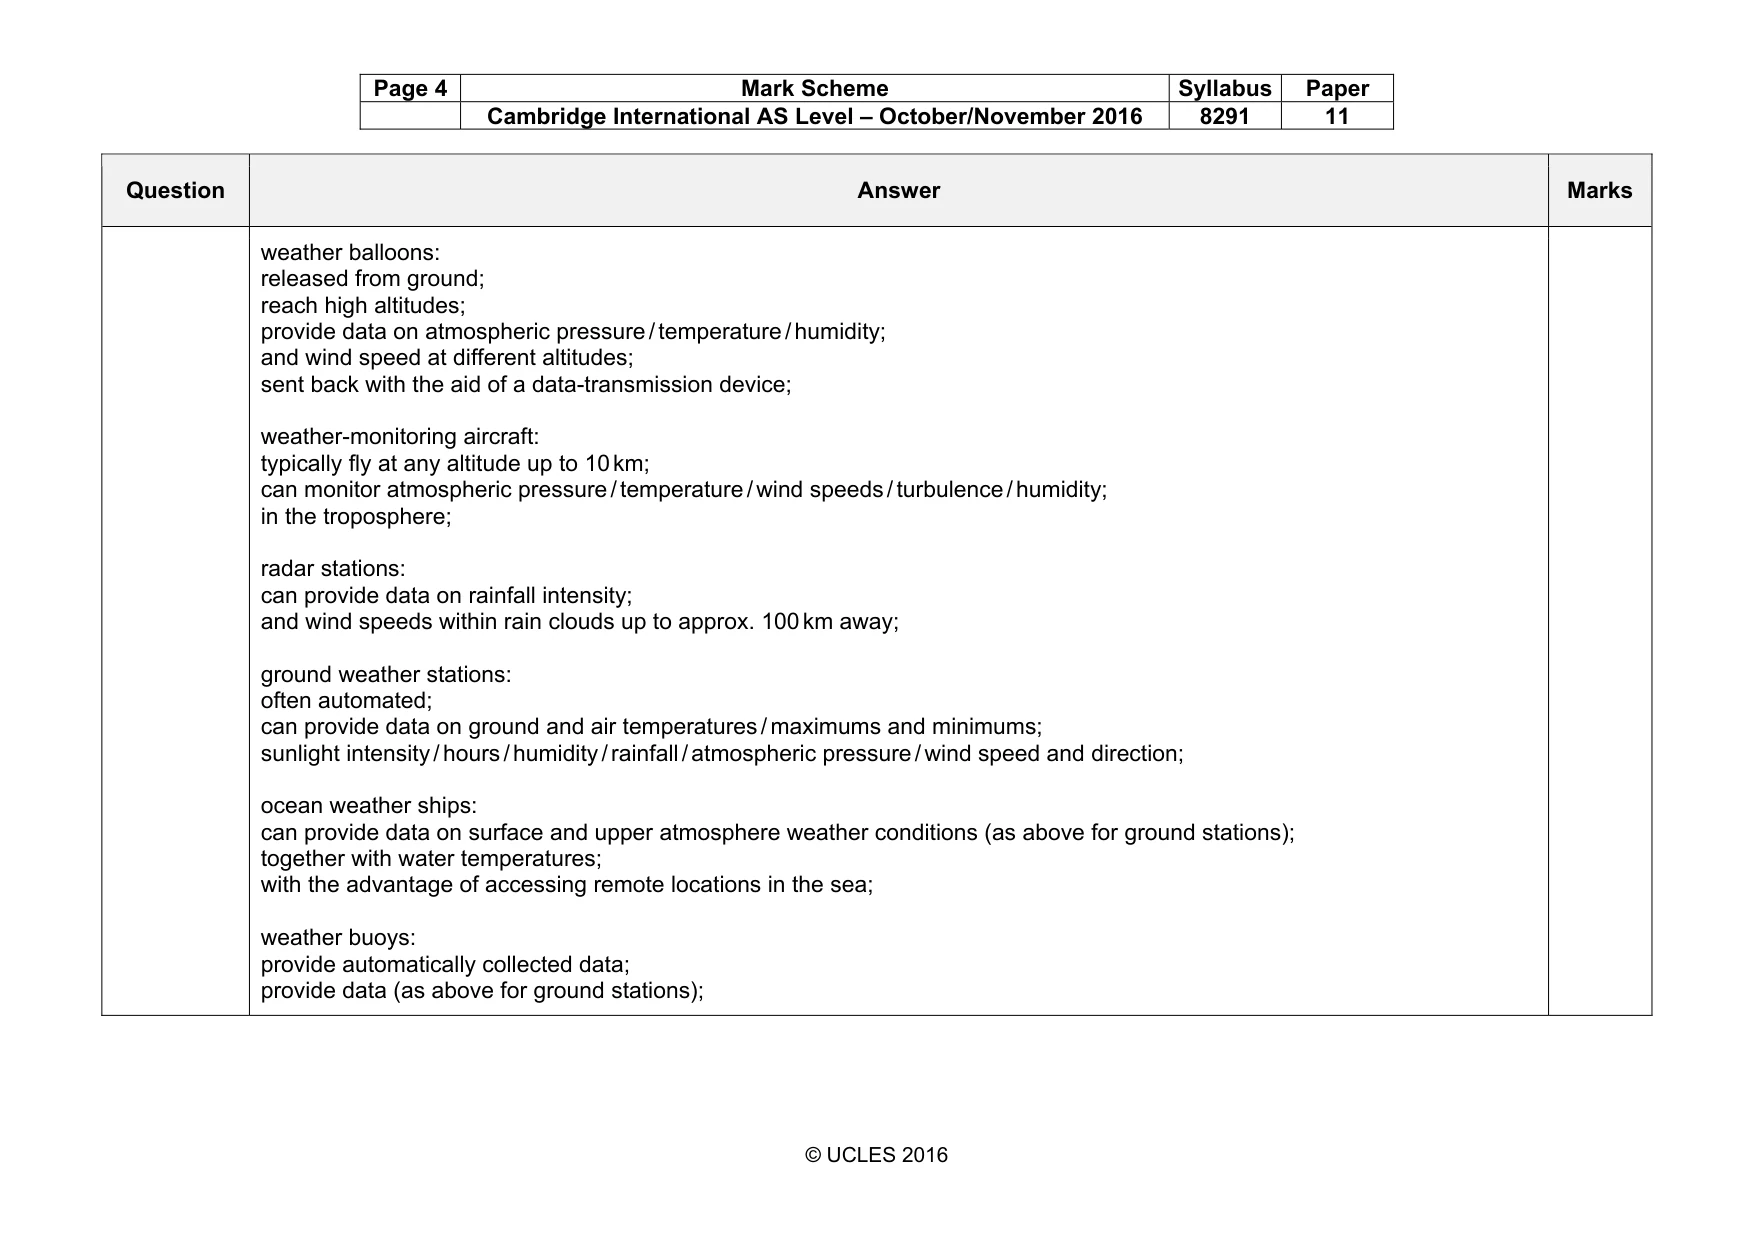
Page 4 Mark Scheme Syllabus Paper Cambridge International AS Level – October/November 2016 8291 11 © UCLES 2016 Question Answer Marks weather balloons: released from ground; reach high altitudes; provide data on atmospheric pressure / temperature / humidity; and wind speed at different altitudes; sent back with the aid of a data-transmission device; weather-monitoring aircraft: typically fly at any altitude up to 10 km; can monitor atmospheric pressure / temperature / wind speeds / turbulence / humidity; in the troposphere; radar stations: can provide data on rainfall intensity; and wind speeds within rain clouds up to approx. 100 km away; ground weather stations: often automated; can provide data on ground and air temperatures / maximums and minimums; sunlight intensity / hours / humidity / rainfall / atmospheric pressure / wind speed and direction; ocean weather ships: can provide data on surface and upper atmosphere weather conditions (as above for ground stations); together with water temperatures; with the advantage of accessing remote locations in the sea; weather buoys: provide automatically collected data; provide data (as above for ground stations);
Mark scheme, page 5
Page 5 Mark Scheme Syllabus Paper Cambridge International AS Level – October/November 2016 8291 11 © UCLES 2016 Question Answer Marks 2(a)(i) crust is thinner than mantle; crust is cooler than mantle; crust is solid whereas mantle is semi-molten; crust is thinner than mantle; ora 2 2(a)(ii) hot; ref. to liquid state / molten material; 2200 km thick; contains iron and nickel; dense; 3 2(a)(iii) convection currents; description of convection, e.g. less dense material rises; driven by heat from the core; radioactive decay; causes movements of tectonic plates; 3 2(a)(iv) travel times of waves reveals information about the interior of the Earth; refraction / reflection / description of these effects; these occur at boundaries between layers; p waves can pass through solids and liquids; speed of p waves reveals data about the density; data about temperature; data about pressure; s waves cannot travel through fluids; so provide information about the boundary between the inner and outer core (creating a shadow zone); credit correct reference to body and surface waves; 4
Mark scheme, page 6
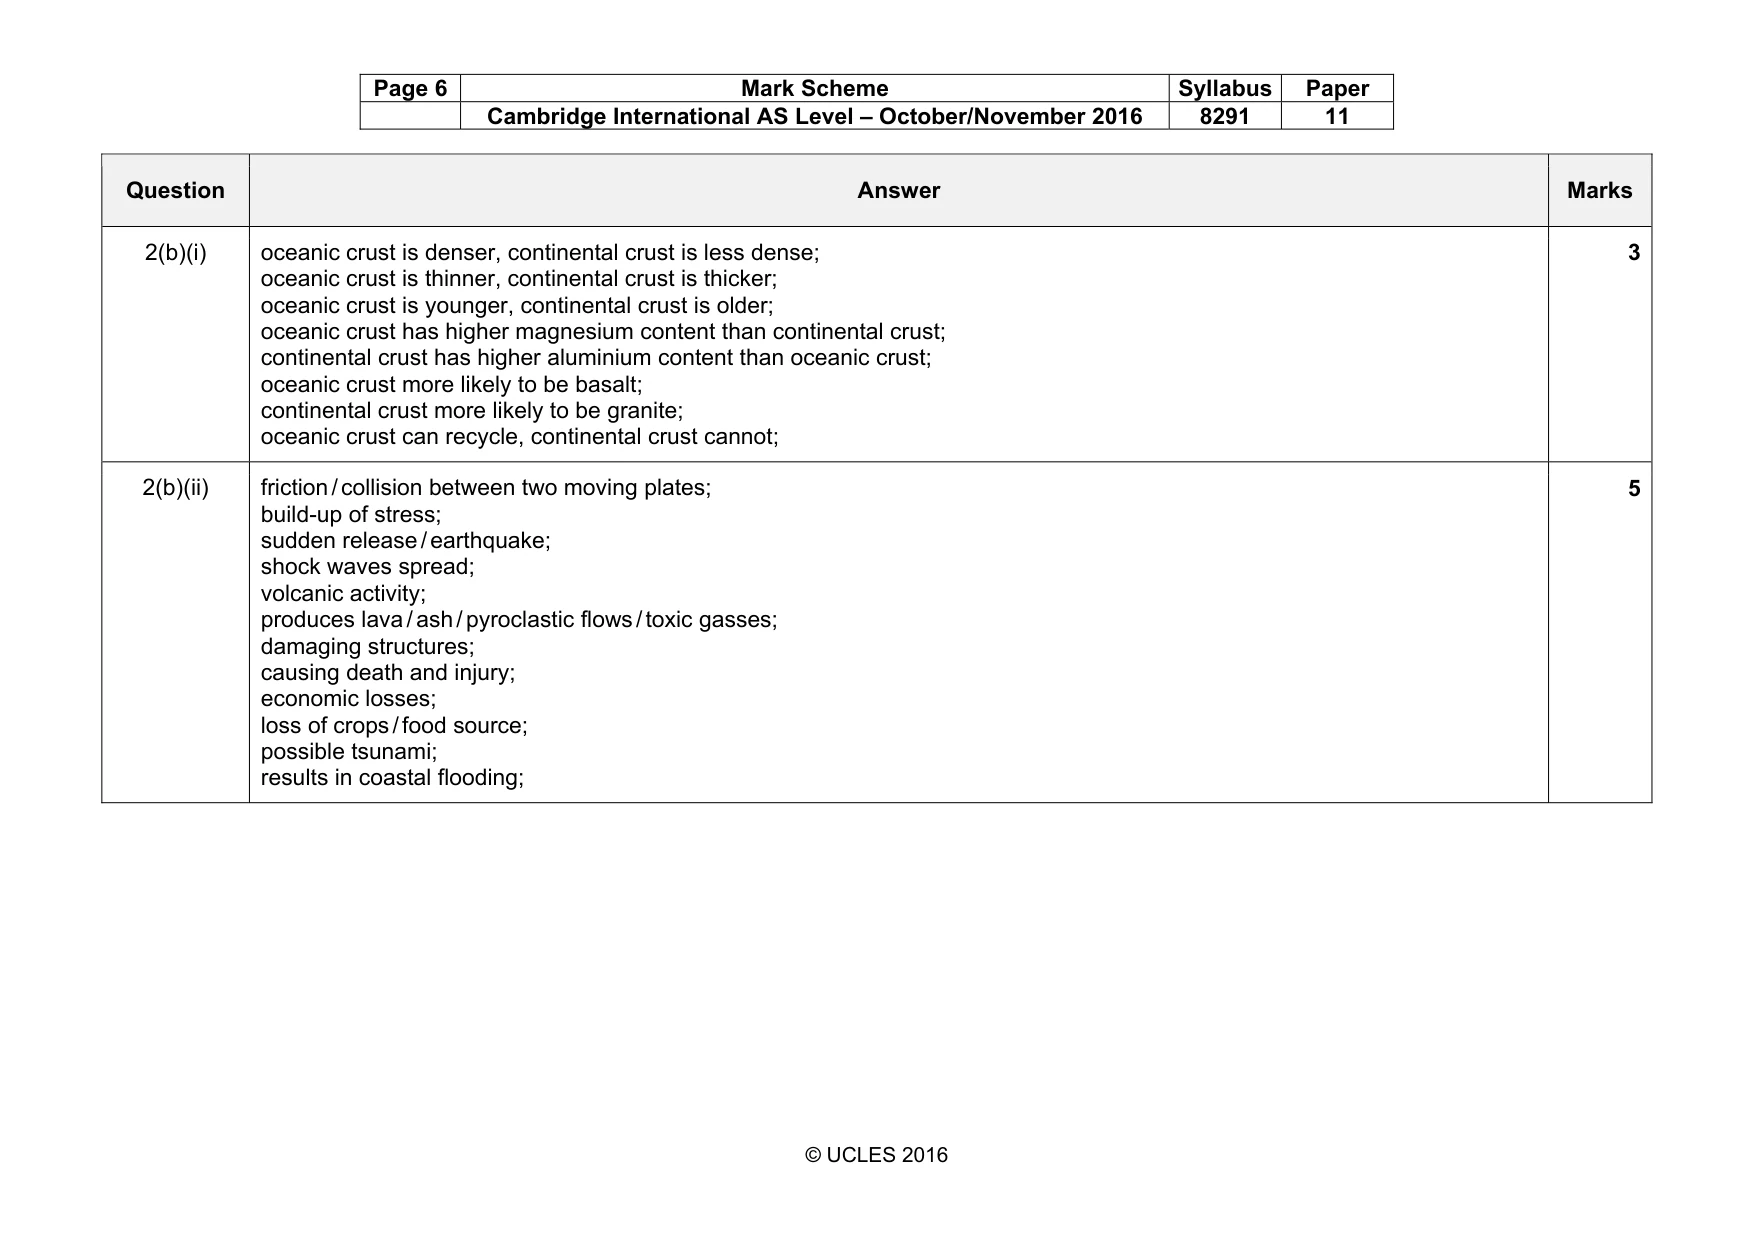
Page 6 Mark Scheme Syllabus Paper Cambridge International AS Level – October/November 2016 8291 11 © UCLES 2016 Question Answer Marks 2(b)(i) oceanic crust is denser, continental crust is less dense; oceanic crust is thinner, continental crust is thicker; oceanic crust is younger, continental crust is older; oceanic crust has higher magnesium content than continental crust; continental crust has higher aluminium content than oceanic crust; oceanic crust more likely to be basalt; continental crust more likely to be granite; oceanic crust can recycle, continental crust cannot; 3 2(b)(ii) friction / collision between two moving plates; build-up of stress; sudden release / earthquake; shock waves spread; volcanic activity; produces lava / ash / pyroclastic flows / toxic gasses; damaging structures; causing death and injury; economic losses; loss of crops / food source; possible tsunami; results in coastal flooding; 5
Mark scheme, page 7
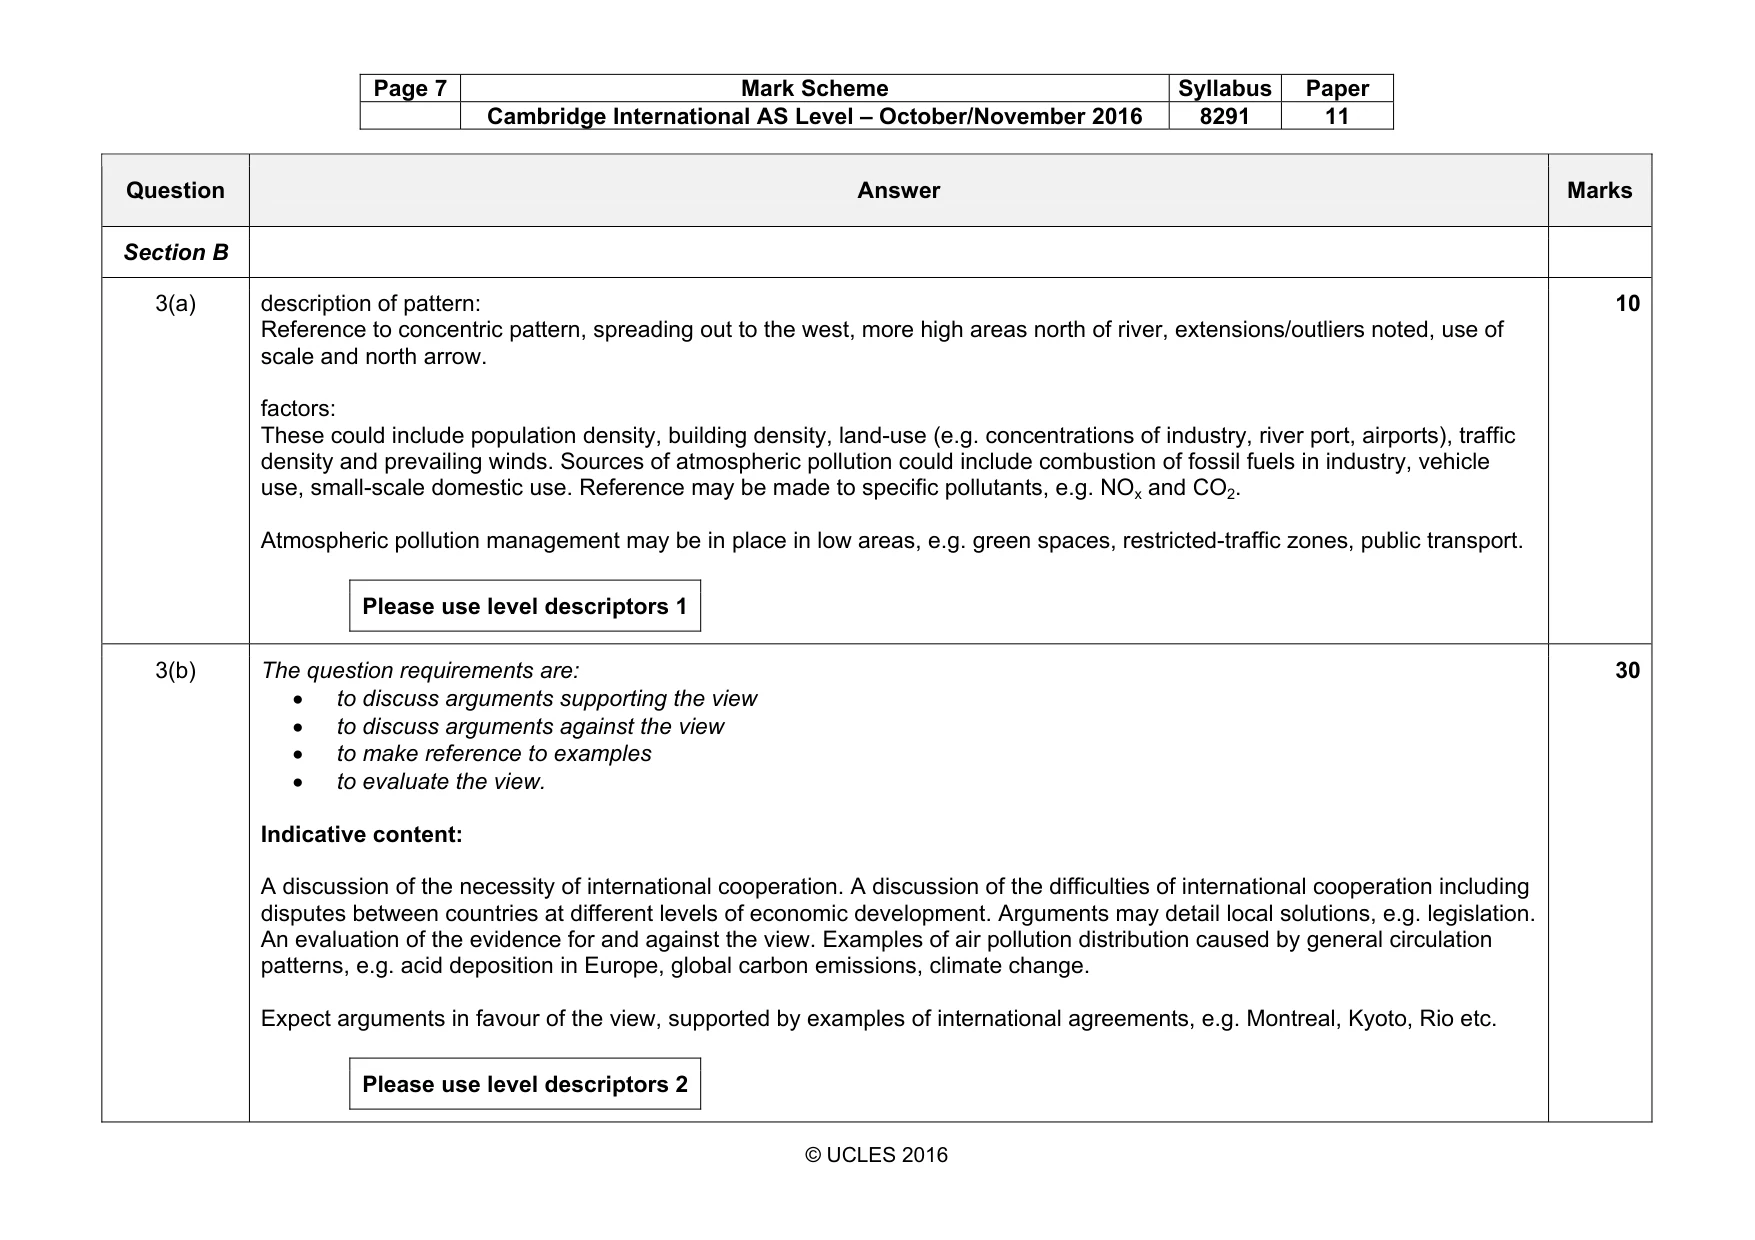
Page 7 Mark Scheme Syllabus Paper Cambridge International AS Level – October/November 2016 8291 11 © UCLES 2016 Question Answer Marks Section B 3(a) description of pattern: Reference to concentric pattern, spreading out to the west, more high areas north of river, extensions/outliers noted, use of scale and north arrow. factors: These could include population density, building density, land-use (e.g. concentrations of industry, river port, airports), traffic density and prevailing winds. Sources of atmospheric pollution could include combustion of fossil fuels in industry, vehicle use, small-scale domestic use. Reference may be made to specific pollutants, e.g. NOx and CO2. Atmospheric pollution management may be in place in low areas, e.g. green spaces, restricted-traffic zones, public transport. Please use level descriptors 1 10 3(b) The question requirements are: • to discuss arguments supporting the view • to discuss arguments against the view • to make reference to examples • to evaluate the view. Indicative content: A discussion of the necessity of international cooperation. A discussion of the difficulties of international cooperation including disputes between countries at different levels of economic development. Arguments may detail local solutions, e.g. legislation. An evaluation of the evidence for and against the view. Examples of air pollution distribution caused by general circulation patterns, e.g. acid deposition in Europe, global carbon emissions, climate change. Expect arguments in favour of the view, supported by examples of international agreements, e.g. Montreal, Kyoto, Rio etc. Please use level descriptors 2 30
Mark scheme, page 8
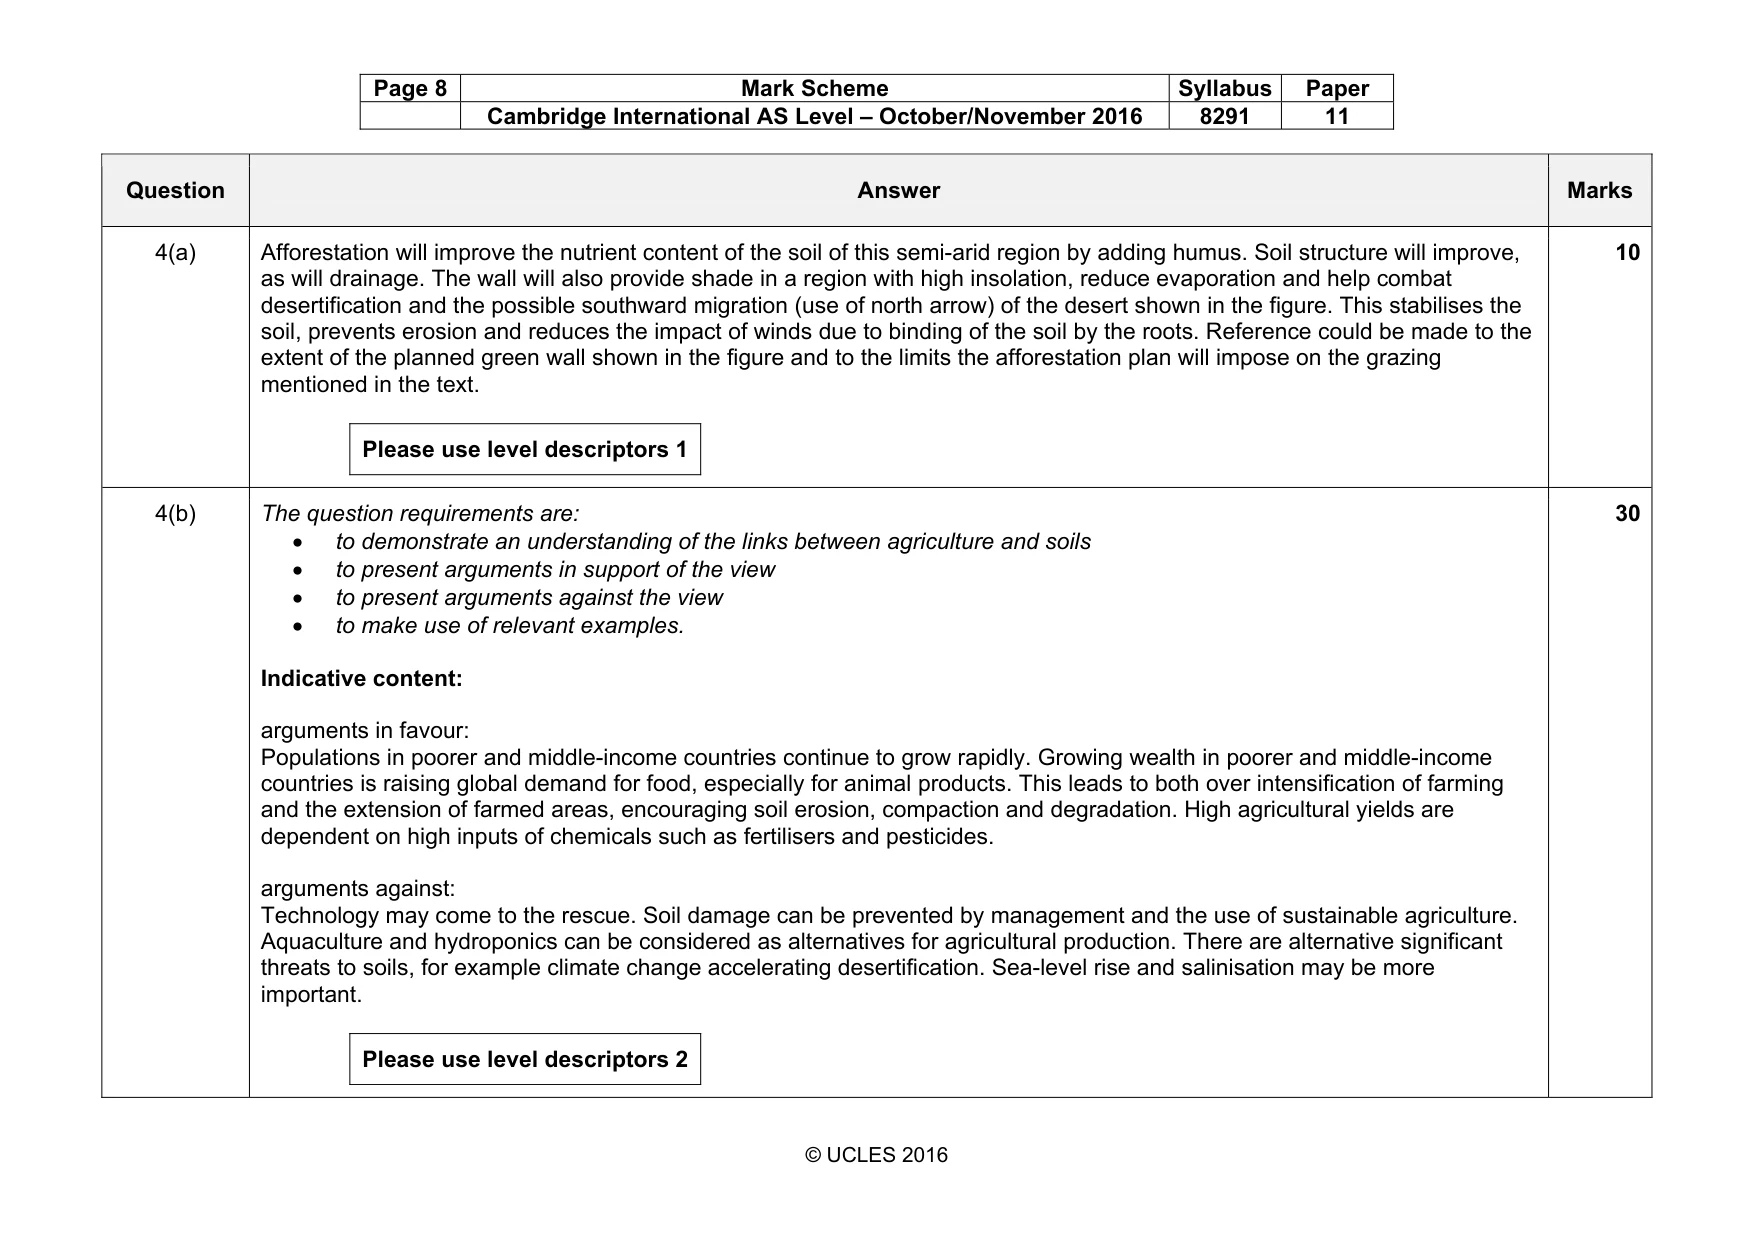
Page 8 Mark Scheme Syllabus Paper Cambridge International AS Level – October/November 2016 8291 11 © UCLES 2016 Question Answer Marks 4(a) Afforestation will improve the nutrient content of the soil of this semi-arid region by adding humus. Soil structure will improve, as will drainage. The wall will also provide shade in a region with high insolation, reduce evaporation and help combat desertification and the possible southward migration (use of north arrow) of the desert shown in the figure. This stabilises the soil, prevents erosion and reduces the impact of winds due to binding of the soil by the roots. Reference could be made to the extent of the planned green wall shown in the figure and to the limits the afforestation plan will impose on the grazing mentioned in the text. Please use level descriptors 1 10 4(b) The question requirements are: • to demonstrate an understanding of the links between agriculture and soils • to present arguments in support of the view • to present arguments against the view • to make use of relevant examples. Indicative content: arguments in favour: Populations in poorer and middle-income countries continue to grow rapidly. Growing wealth in poorer and middle-income countries is raising global demand for food, especially for animal products. This leads to both over intensification of farming and the extension of farmed areas, encouraging soil erosion, compaction and degradation. High agricultural yields are dependent on high inputs of chemicals such as fertilisers and pesticides. arguments against: Technology may come to the rescue. Soil damage can be prevented by management and the use of sustainable agriculture. Aquaculture and hydroponics can be considered as alternatives for agricultural production. There are alternative significant threats to soils, for example climate change accelerating desertification. Sea-level rise and salinisation may be more important. Please use level descriptors 2 30
Mark scheme, page 9
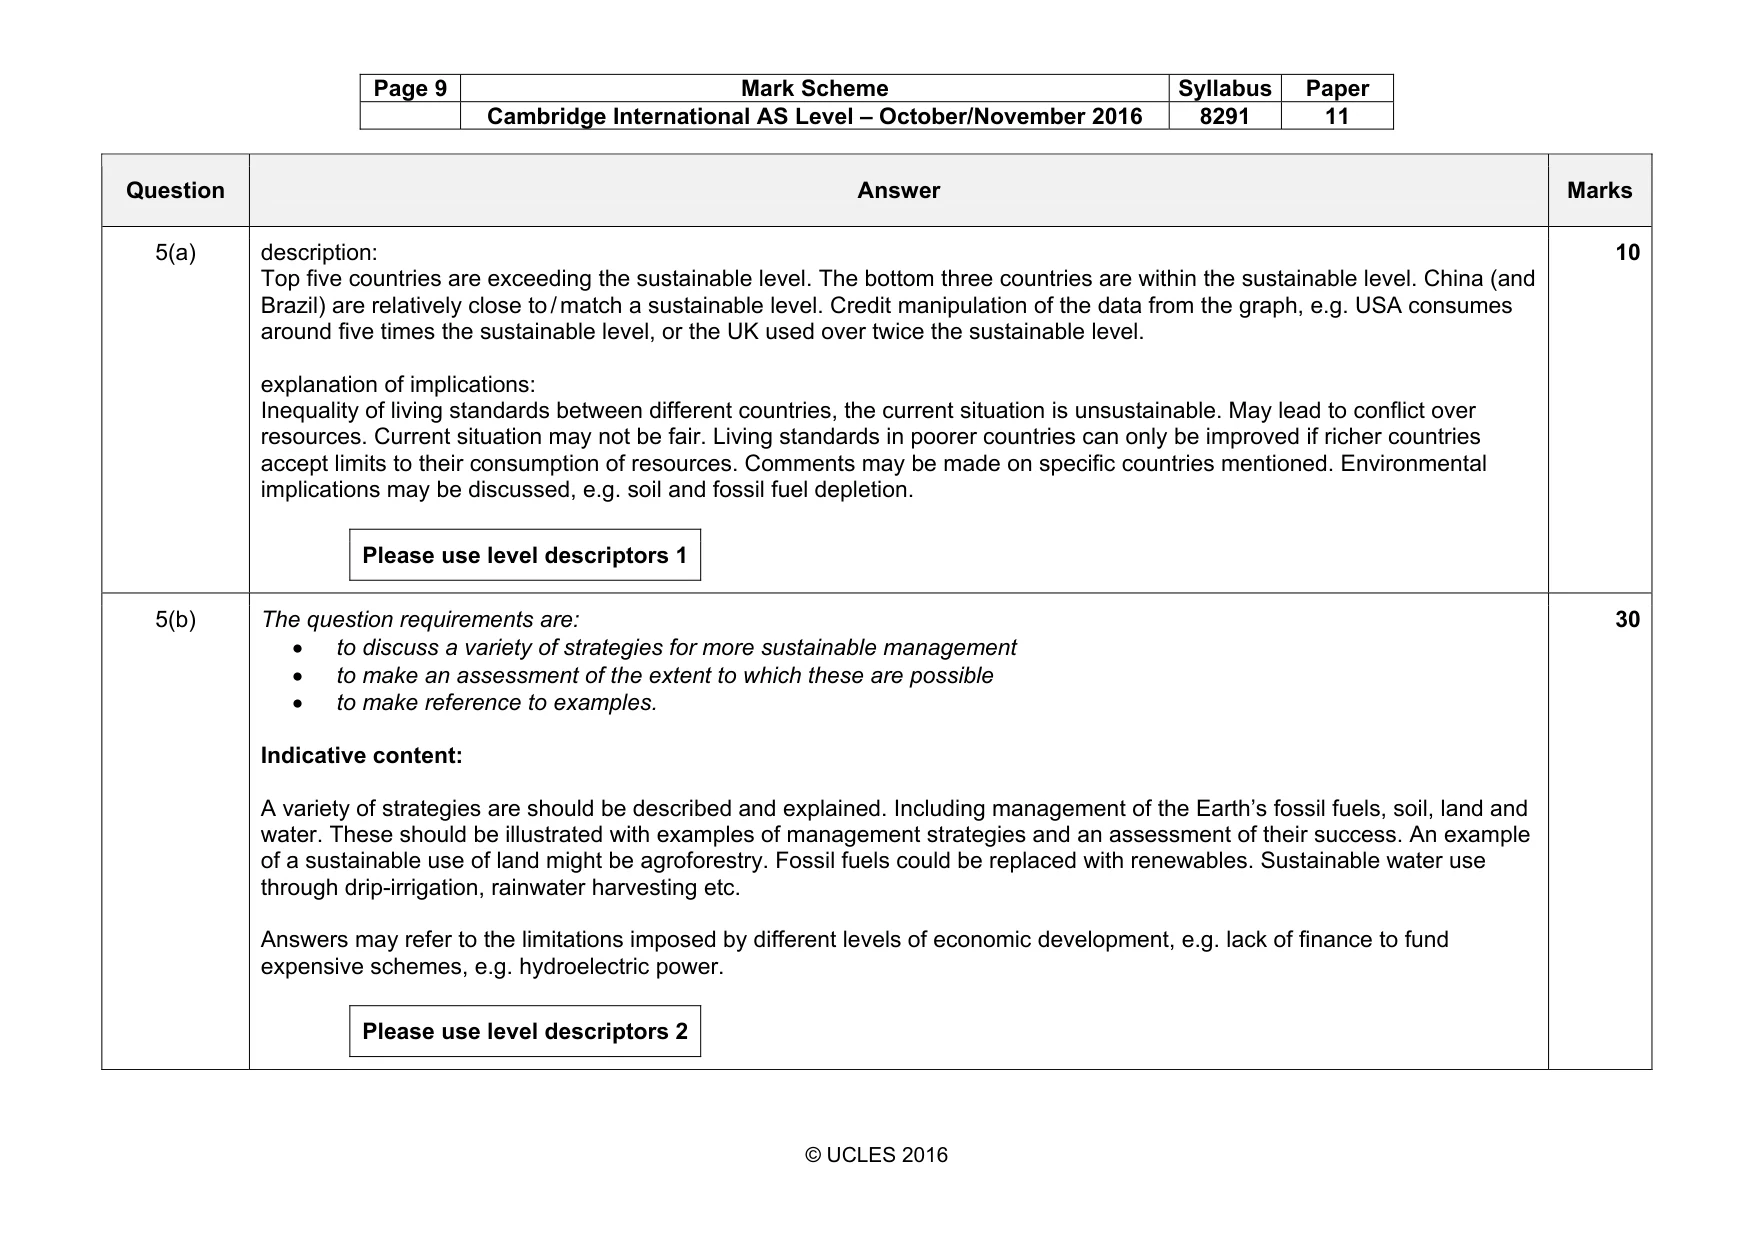
Page 9 Mark Scheme Syllabus Paper Cambridge International AS Level – October/November 2016 8291 11 © UCLES 2016 Question Answer Marks 5(a) description: Top five countries are exceeding the sustainable level. The bottom three countries are within the sustainable level. China (and Brazil) are relatively close to / match a sustainable level. Credit manipulation of the data from the graph, e.g. USA consumes around five times the sustainable level, or the UK used over twice the sustainable level. explanation of implications: Inequality of living standards between different countries, the current situation is unsustainable. May lead to conflict over resources. Current situation may not be fair. Living standards in poorer countries can only be improved if richer countries accept limits to their consumption of resources. Comments may be made on specific countries mentioned. Environmental implications may be discussed, e.g. soil and fossil fuel depletion. Please use level descriptors 1 10 5(b) The question requirements are: • to discuss a variety of strategies for more sustainable management • to make an assessment of the extent to which these are possible • to make reference to examples. Indicative content: A variety of strategies are should be described and explained. Including management of the Earth’s fossil fuels, soil, land and water. These should be illustrated with examples of management strategies and an assessment of their success. An example of a sustainable use of land might be agroforestry. Fossil fuels could be replaced with renewables. Sustainable water use through drip-irrigation, rainwater harvesting etc. Answers may refer to the limitations imposed by different levels of economic development, e.g. lack of finance to fund expensive schemes, e.g. hydroelectric power. Please use level descriptors 2 30
Mark scheme, page 10
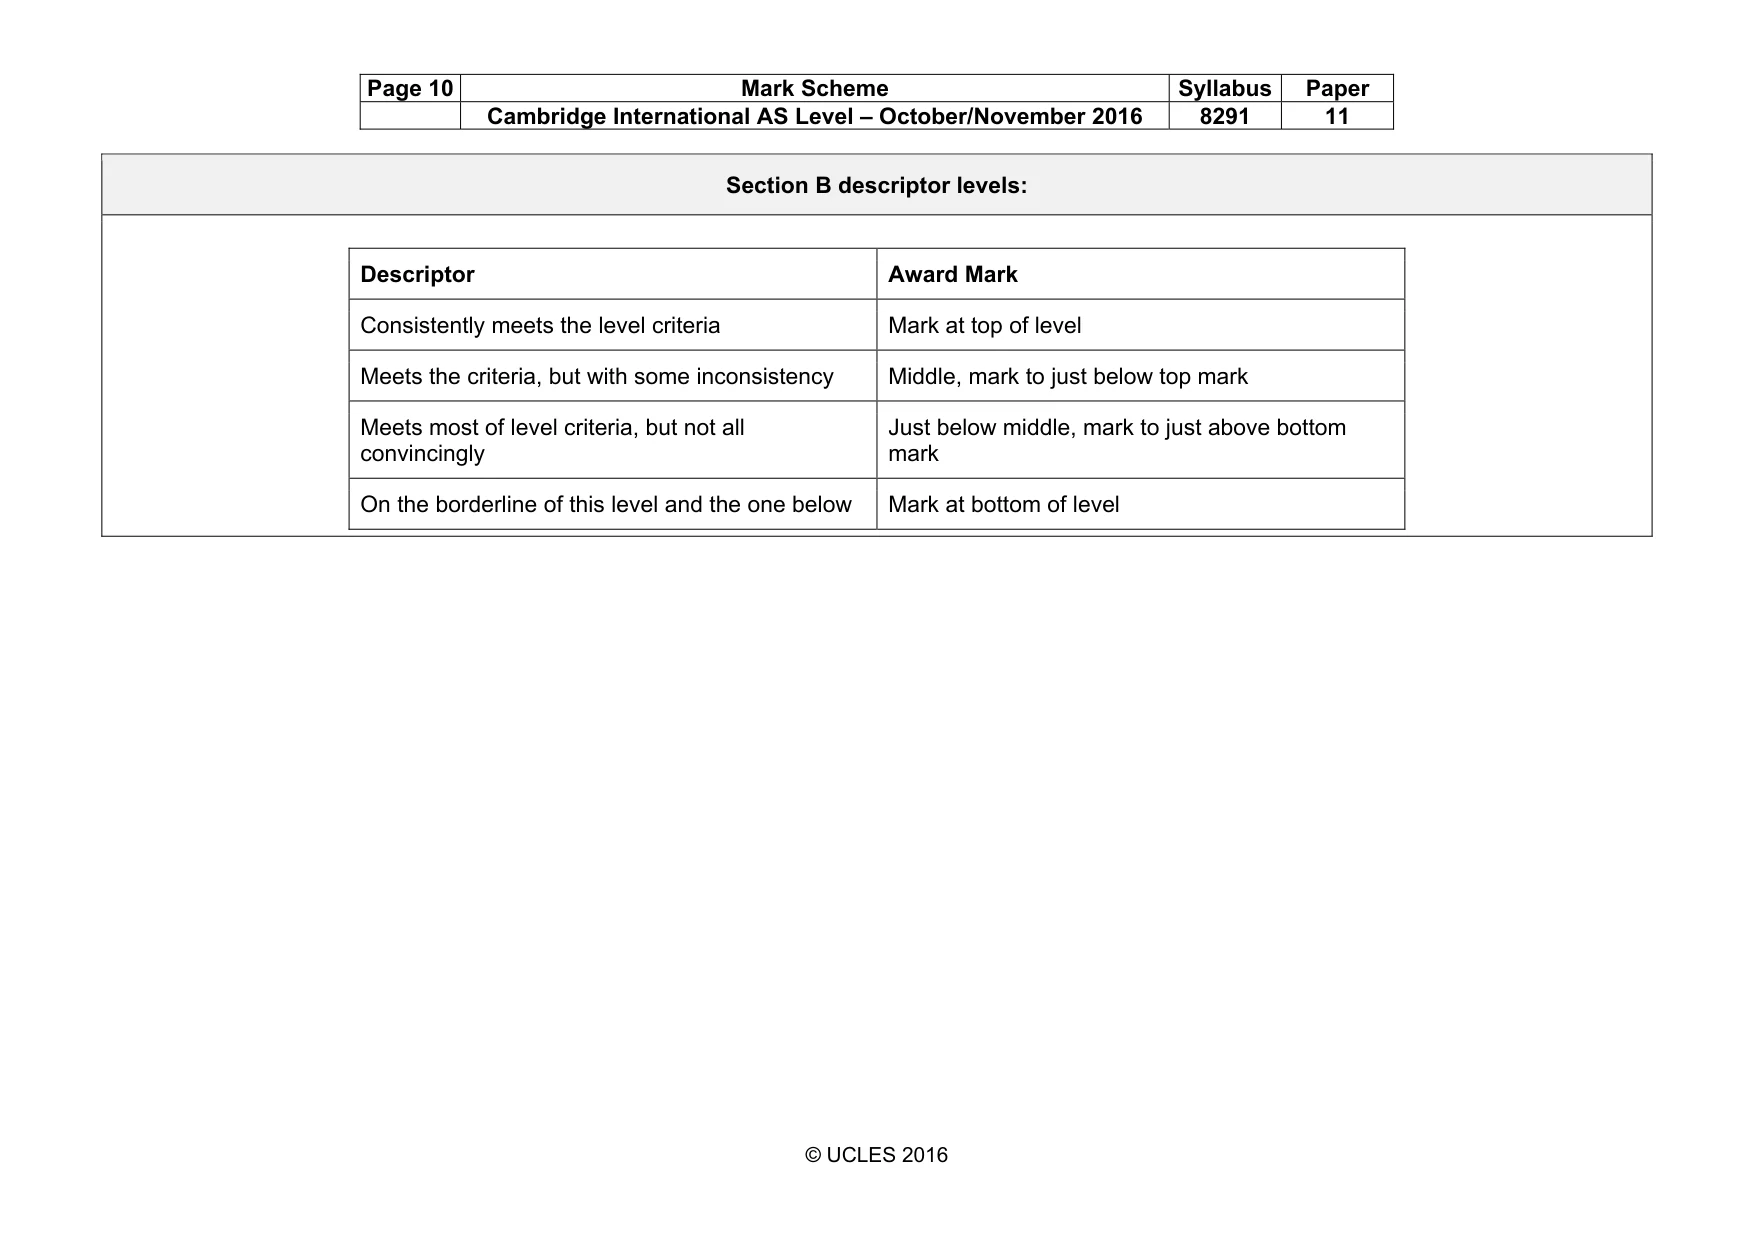
Page 10 Mark Scheme Syllabus Paper Cambridge International AS Level – October/November 2016 8291 11 © UCLES 2016 Section B descriptor levels: Descriptor Award Mark Consistently meets the level criteria Mark at top of level Meets the criteria, but with some inconsistency Middle, mark to just below top mark Meets most of level criteria, but not all convincingly Just below middle, mark to just above bottom mark On the borderline of this level and the one below Mark at bottom of level
Mark scheme, page 11
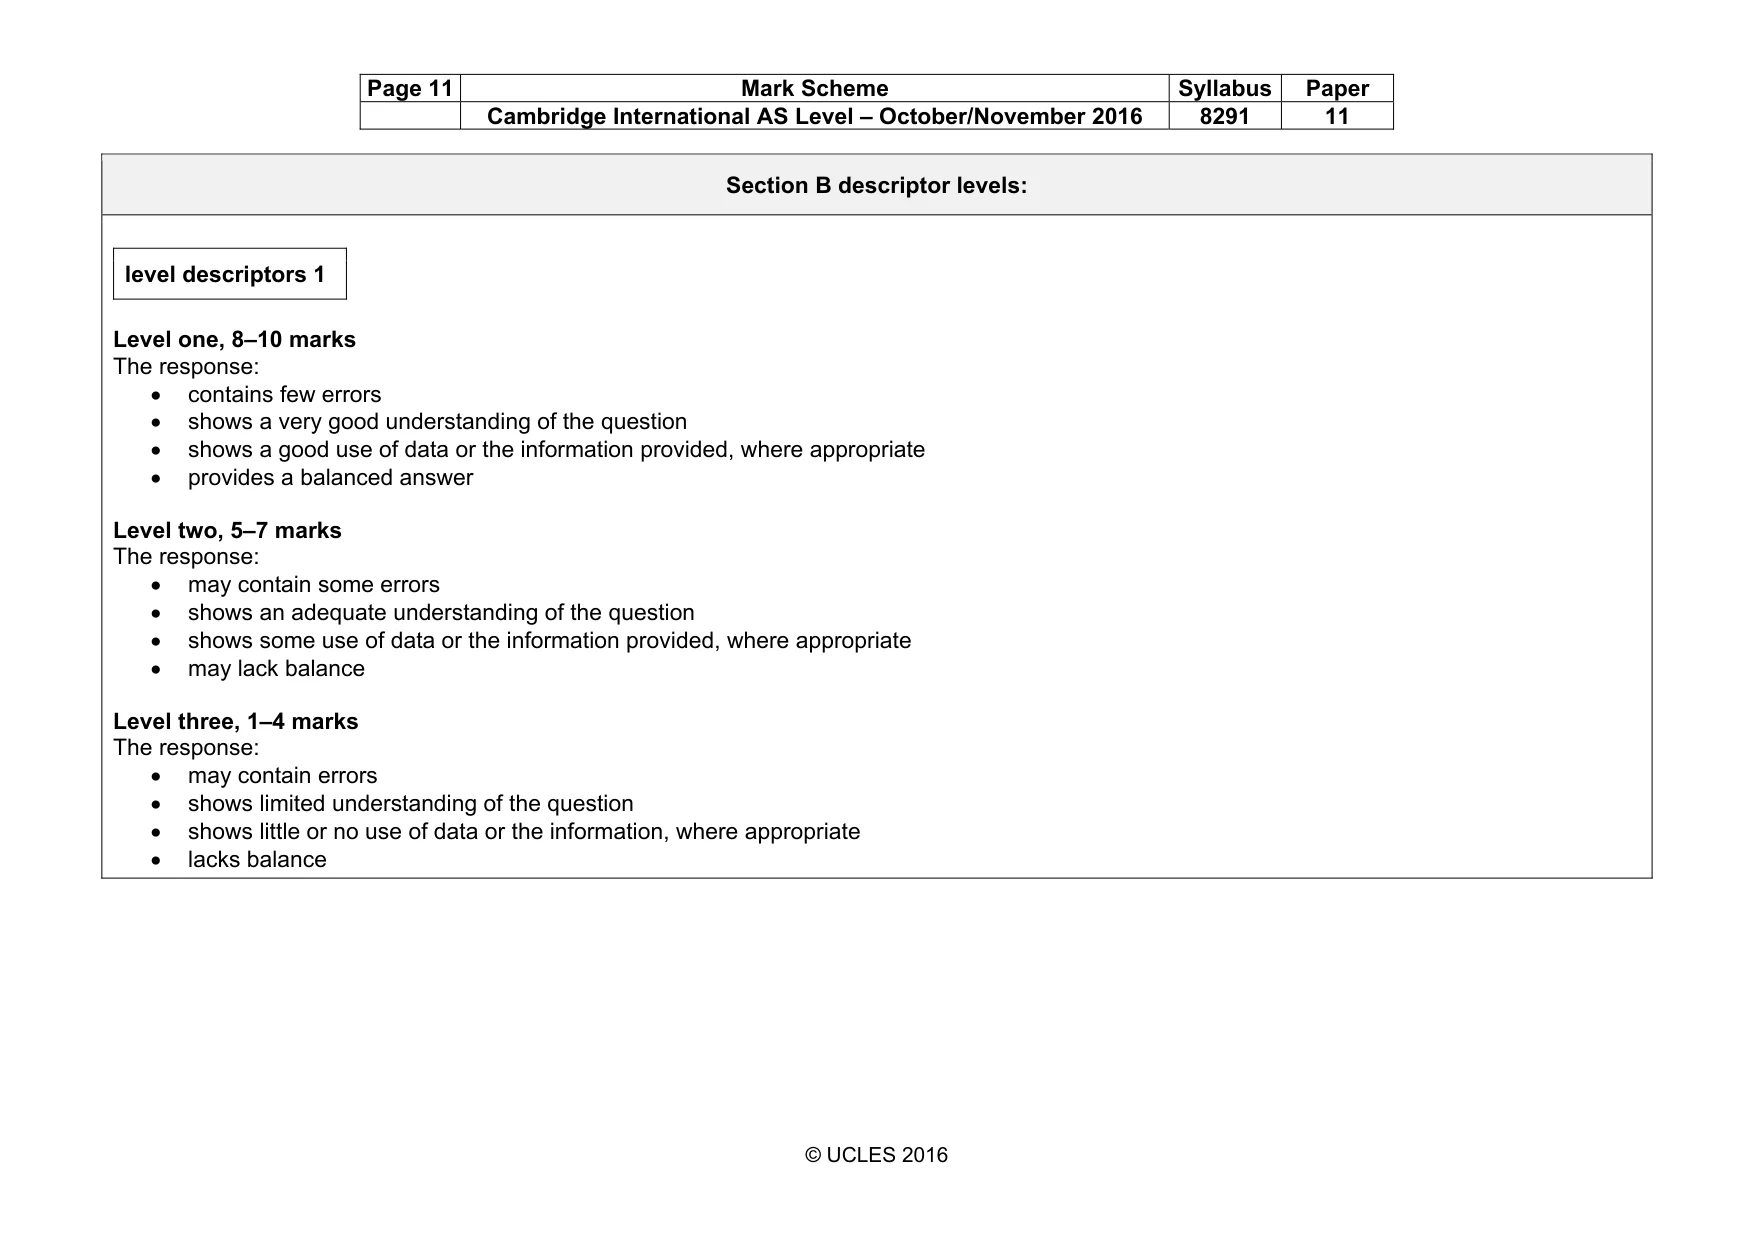
Page 11 Mark Scheme Syllabus Paper Cambridge International AS Level – October/November 2016 8291 11 © UCLES 2016 Section B descriptor levels: level descriptors 1 Level one, 8–10 marks The response: • contains few errors • shows a very good understanding of the question • shows a good use of data or the information provided, where appropriate • provides a balanced answer Level two, 5–7 marks The response: • may contain some errors • shows an adequate understanding of the question • shows some use of data or the information provided, where appropriate • may lack balance Level three, 1–4 marks The response: • may contain errors • shows limited understanding of the question • shows little or no use of data or the information, where appropriate • lacks balance
Mark scheme, page 12
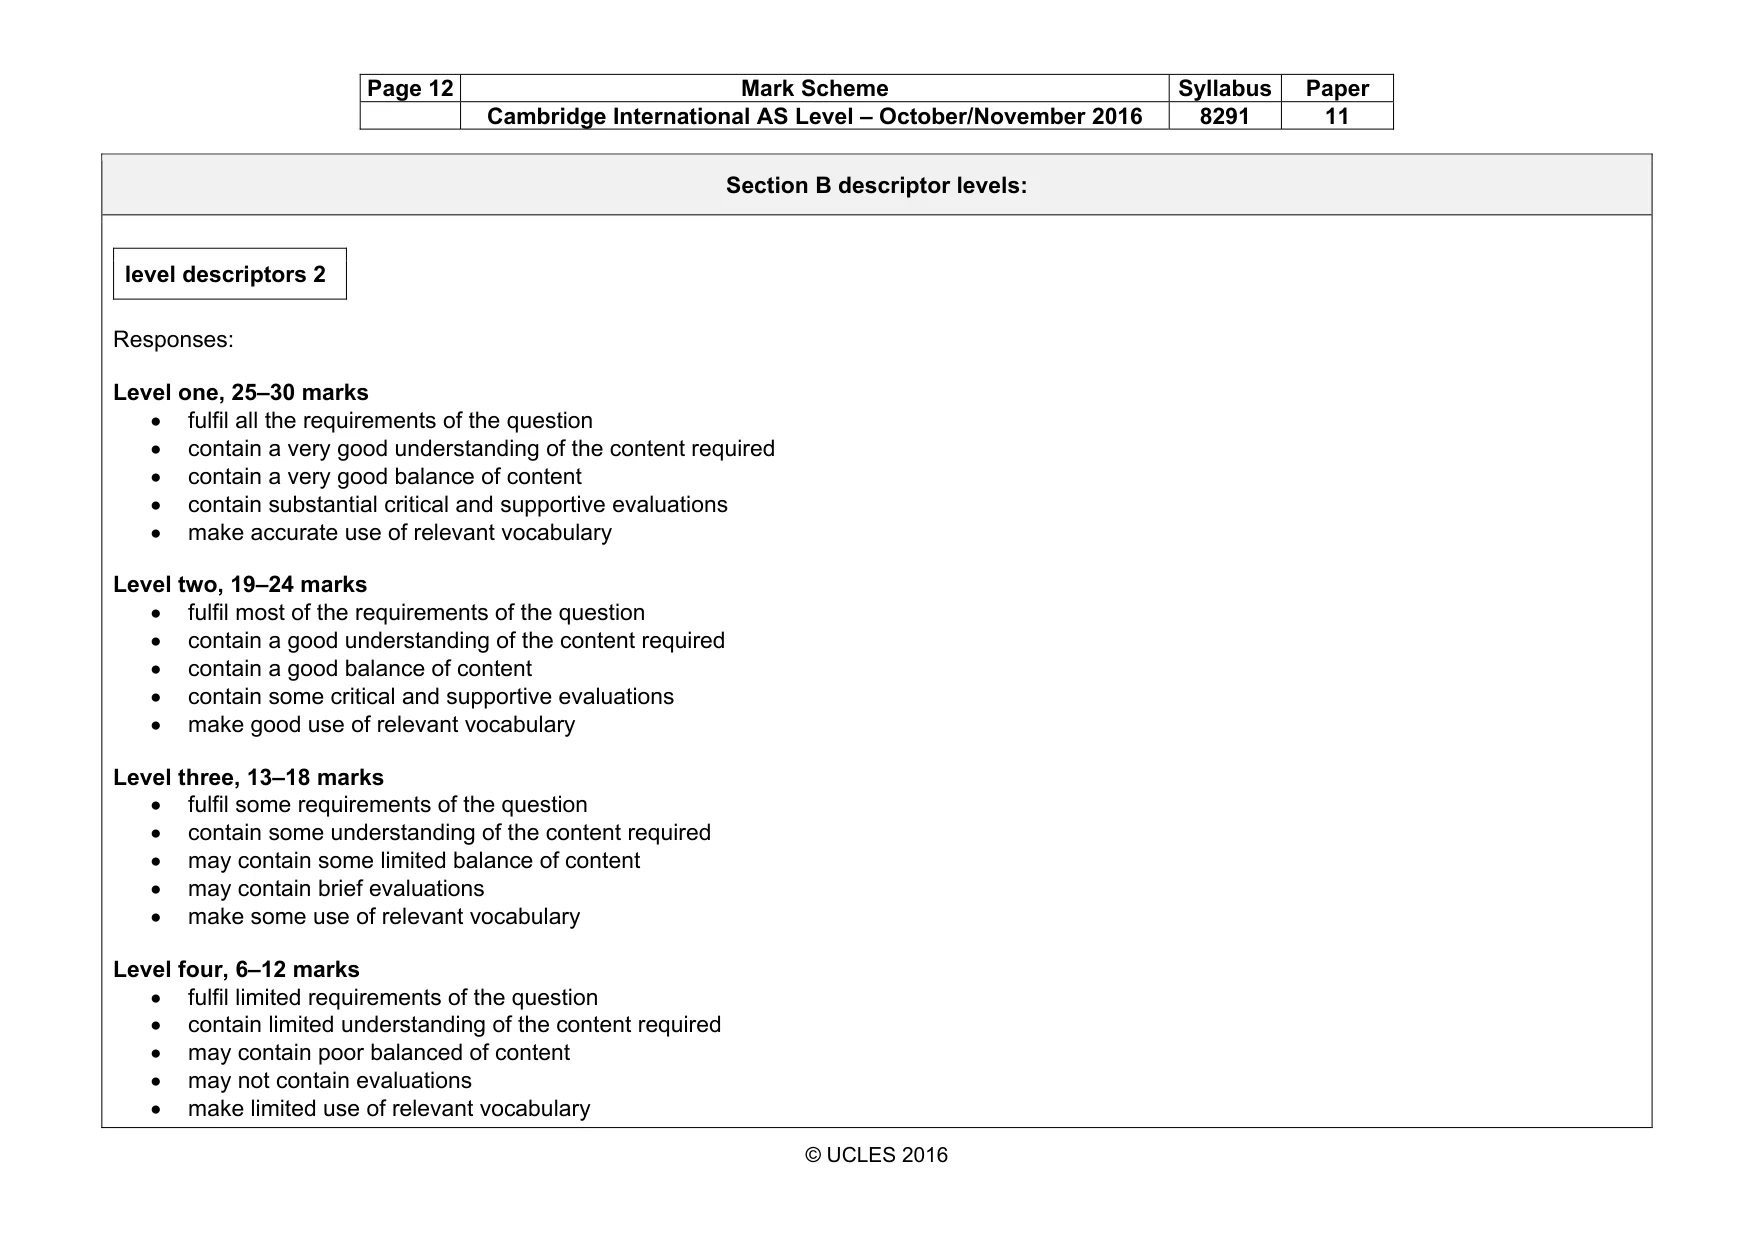
Page 12 Mark Scheme Syllabus Paper Cambridge International AS Level – October/November 2016 8291 11 © UCLES 2016 Section B descriptor levels: level descriptors 2 Responses: Level one, 25–30 marks • fulfil all the requirements of the question • contain a very good understanding of the content required • contain a very good balance of content • contain substantial critical and supportive evaluations • make accurate use of relevant vocabulary Level two, 19–24 marks • fulfil most of the requirements of the question • contain a good understanding of the content required • contain a good balance of content • contain some critical and supportive evaluations • make good use of relevant vocabulary Level three, 13–18 marks • fulfil some requirements of the question • contain some understanding of the content required • may contain some limited balance of content • may contain brief evaluations • make some use of relevant vocabulary Level four, 6–12 marks • fulfil limited requirements of the question • contain limited understanding of the content required • may contain poor balanced of content • may not contain evaluations • make limited use of relevant vocabulary
Mark scheme, page 13
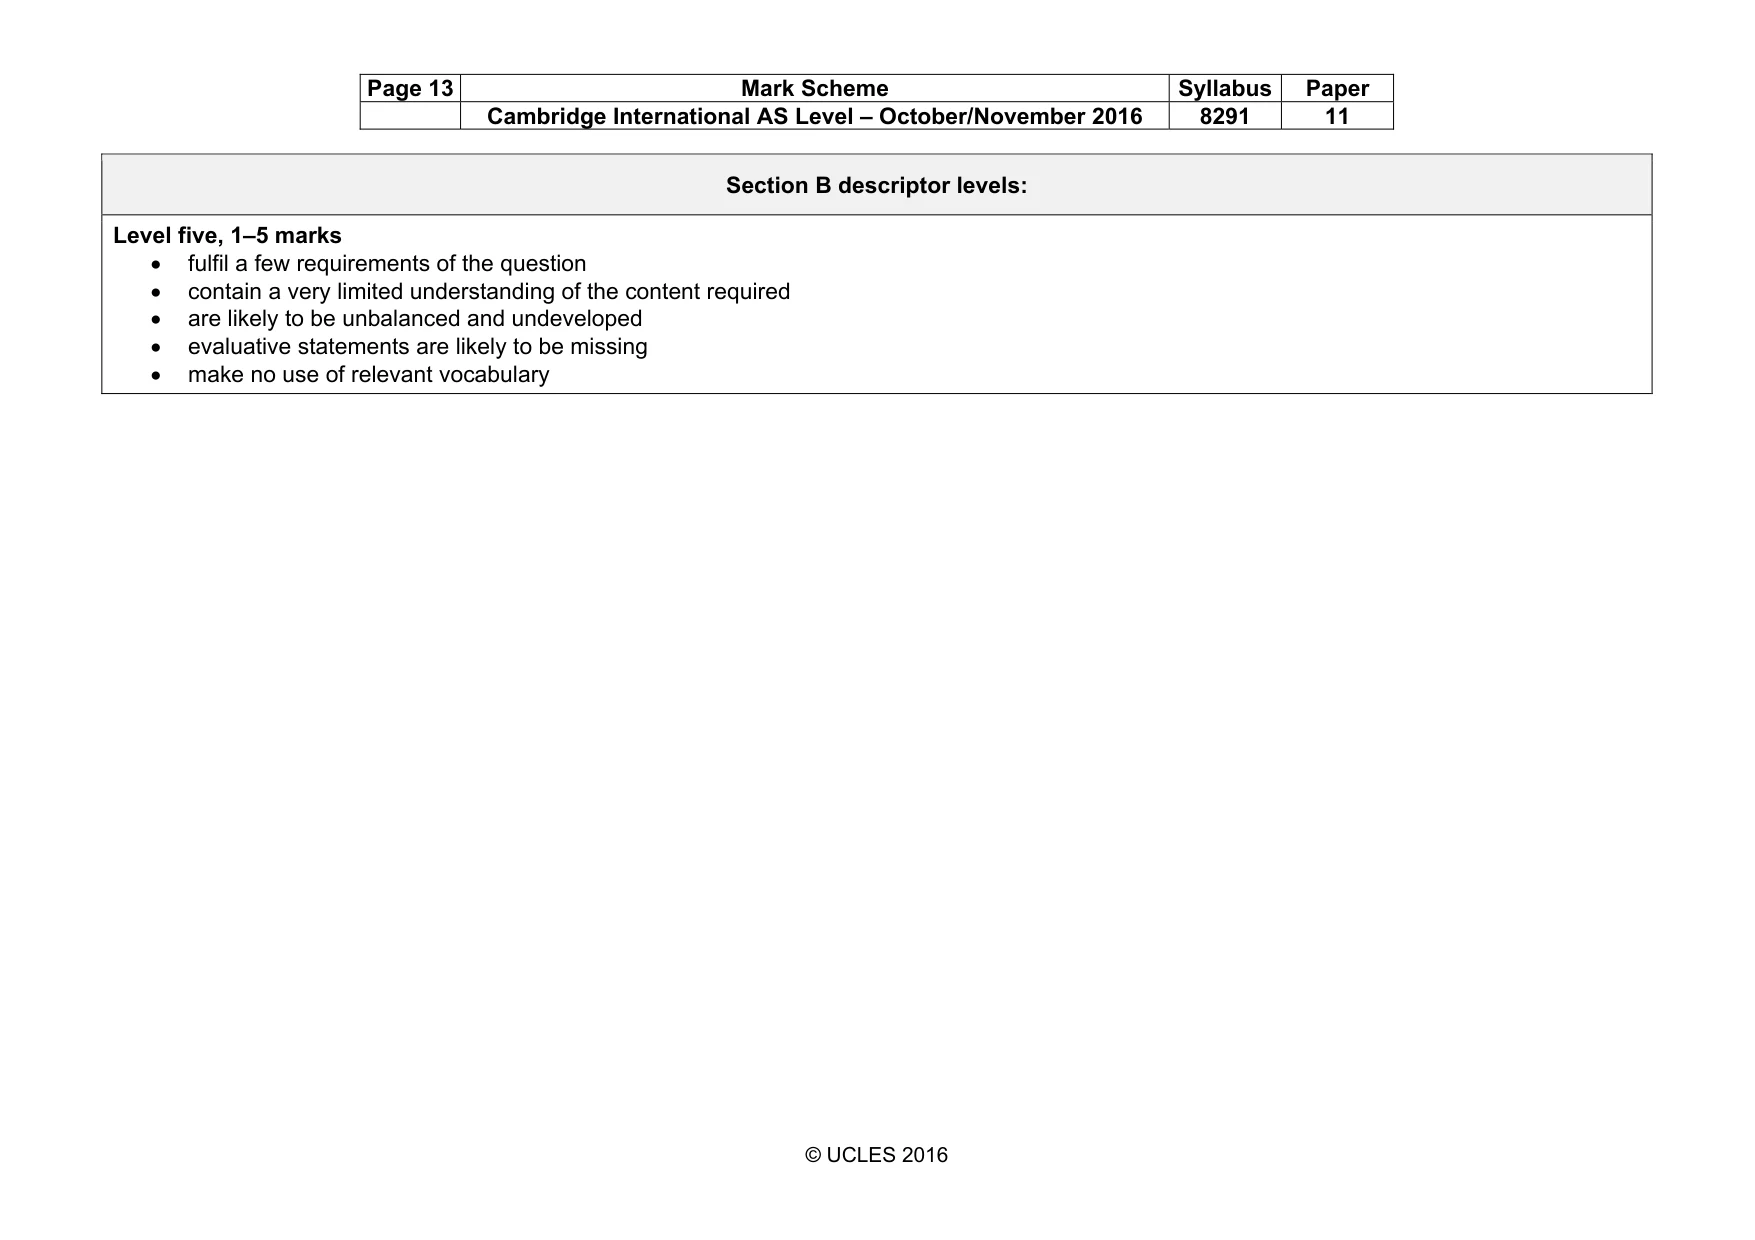
Page 13 Mark Scheme Syllabus Paper Cambridge International AS Level – October/November 2016 8291 11 © UCLES 2016 Section B descriptor levels: Level five, 1–5 marks • fulfil a few requirements of the question • contain a very limited understanding of the content required • are likely to be unbalanced and undeveloped • evaluative statements are likely to be missing • make no use of relevant vocabulary
What you needed in this session
Cambridge’s own grade thresholds for 2016 Oct/Nov, Paper 1 · Variant 1. A higher threshold means an easier paper — the bar moves with how the cohort did.