Cambridge A Level Environmental Management (AS only) 8291 — 2015 Oct/Nov Paper 2 · Variant 1
8291/21/O/N/15 · 80 marks · ≈90 min
The question paper and its mark scheme, free to read here and free to download. This is Cambridge’s own paper, exactly as it was sat.
Question paper16 pages



Mark scheme9 pages
Answers below. Sit the paper first if you are practising.
Paper as text
Question paper, page 1
This document consists of 12 printed pages and 4 blank pages. DC (ST/CGW) 97049/4 © UCLES 2015 [Turn over Cambridge International Examinations Cambridge International Advanced Subsidiary Level * 3 8 6 7 0 7 4 6 5 7 * ENVIRONMENTAL MANAGEMENT 8291/21 Paper 2 Hydrosphere and Biosphere October/November 2015 1 hour 30 minutes Additional Materials: Answer Booklet/Paper READ THESE INSTRUCTIONS FIRST Write your Centre number, candidate number and name on all the work you hand in. Write in dark blue or black pen. You may use an HB pencil for any diagrams or graphs. Do not use staples, paper clips, glue or correction fluid. DO NOT WRITE IN ANY BARCODES. Electronic calculators may be used. You may lose marks if you do not show your working or if you do not use appropriate units. Section A Answer all questions. Write your answers in the spaces provided on the question paper. Section B Answer one question from this section. Answer the question on the separate answer paper provided. At the end of the examination, 1. fasten all separate answer paper securely to the question paper; 2. enter the question number from Section B in the grid opposite. For Examiner’s Use Section A 1 2 Section B Total
Question paper, page 2
2 8291/21/O/N/15 © UCLES 2015 BLANK PAGE
Question paper, page 3
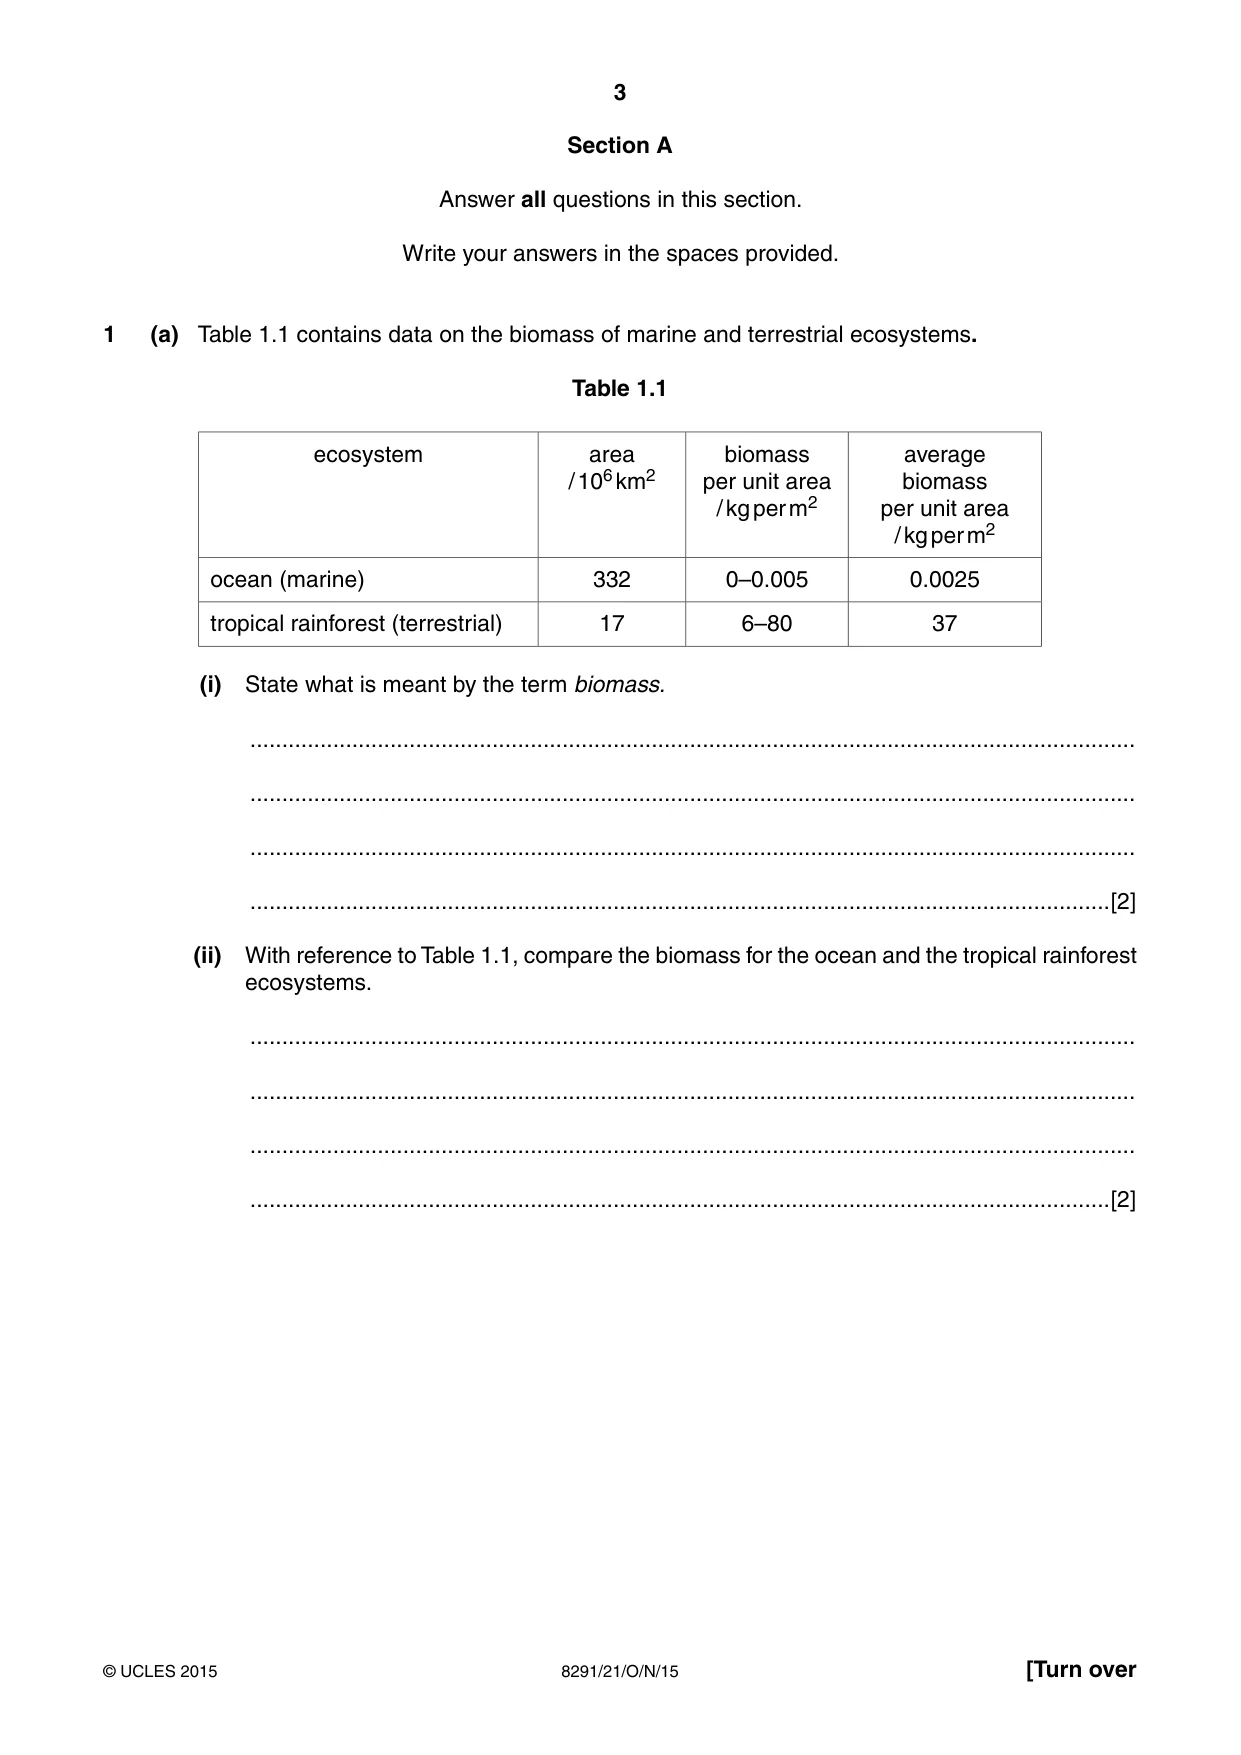
3 8291/21/O/N/15 © UCLES 2015 [Turn over Section A Answer all questions in this section. Write your answers in the spaces provided. 1 (a) Table 1.1 contains data on the biomass of marine and terrestrial ecosystems. Table 1.1 ecosystem area / 106 km2 biomass per unit area / kg per m2 average biomass per unit area / kg per m2 ocean (marine) 332 0–0.005 0.0025 tropical rainforest (terrestrial) 17 6–80 37 (i) State what is meant by the term biomass. … … … …[2] (ii) With reference to Table 1.1, compare the biomass for the ocean and the tropical rainforest ecosystems. … … … …[2]
Question paper, page 4
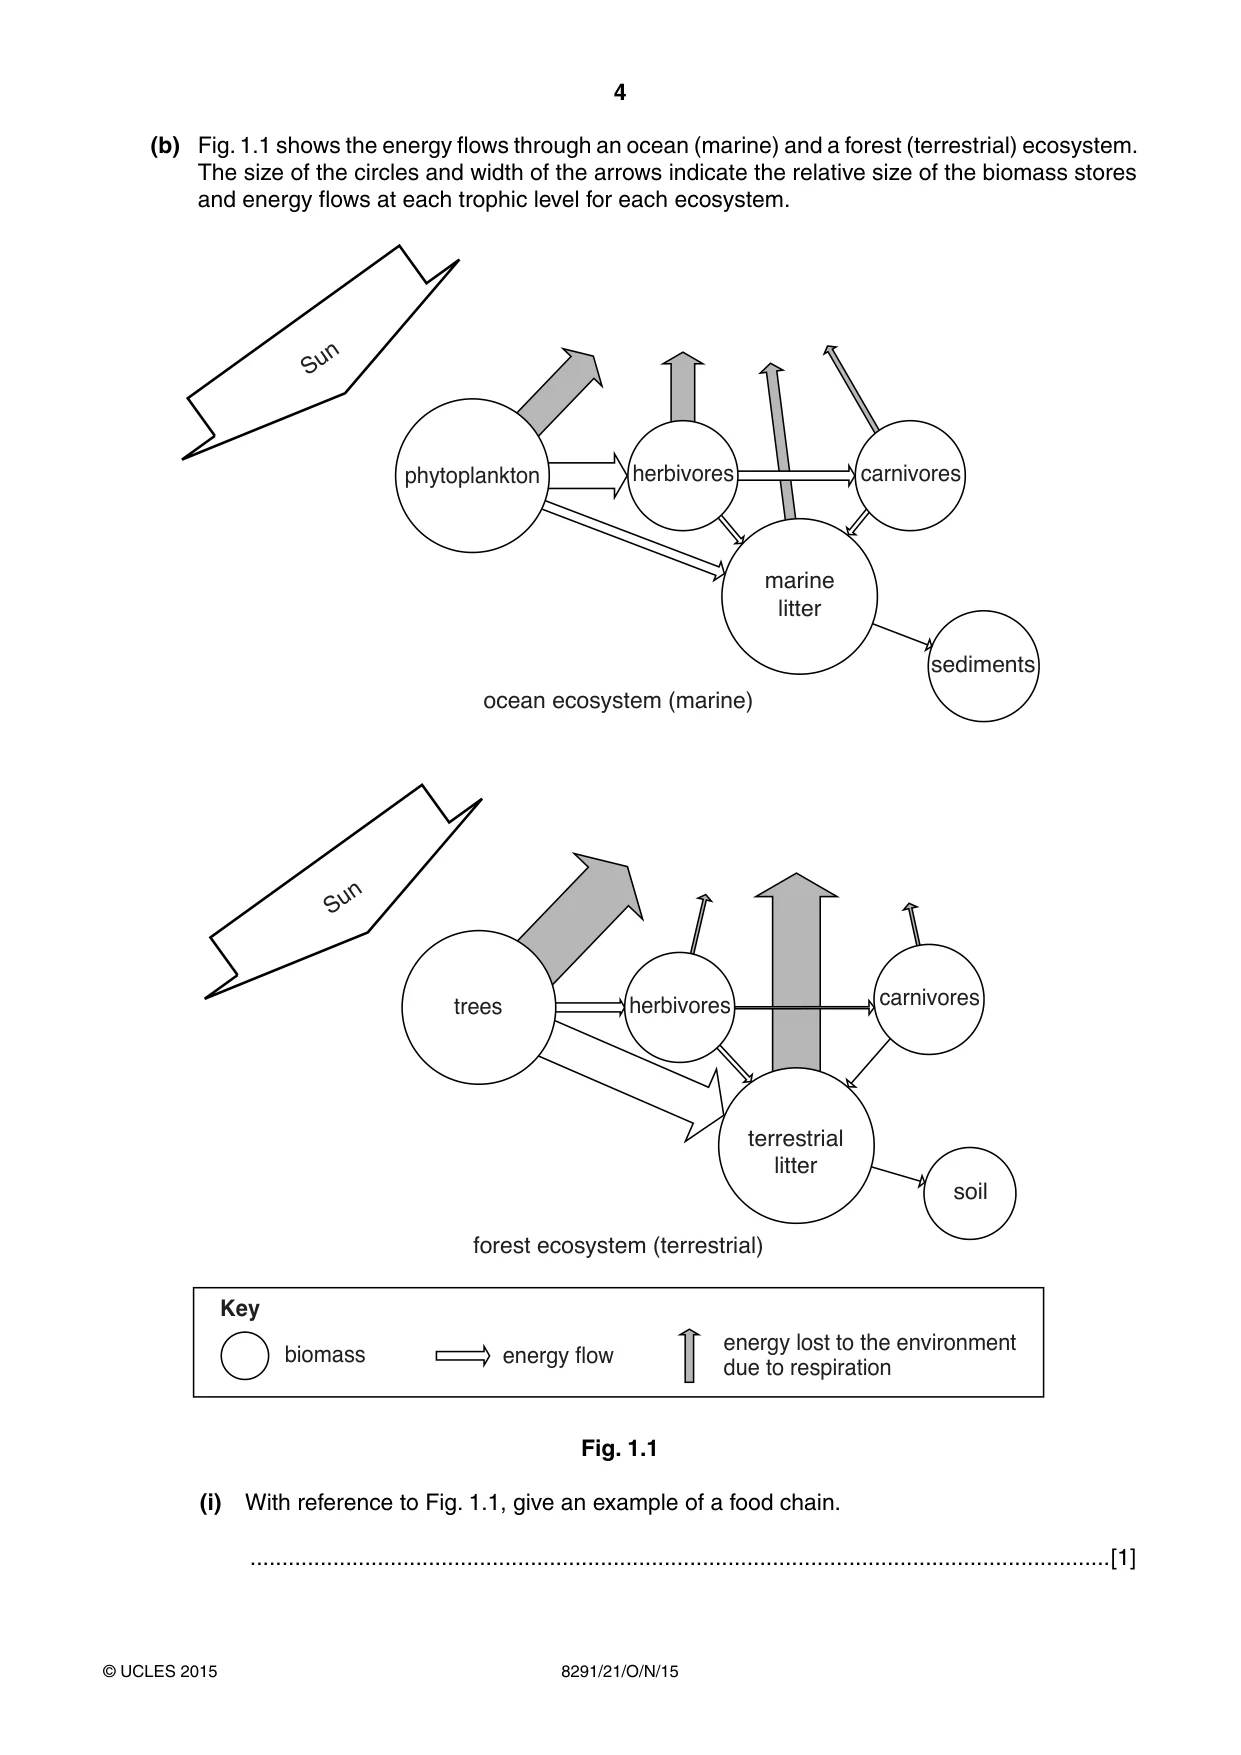
4 8291/21/O/N/15 © UCLES 2015 (b) Fig. 1.1 shows the energy flows through an ocean (marine) and a forest (terrestrial) ecosystem. The size of the circles and width of the arrows indicate the relative size of the biomass stores and energy flows at each trophic level for each ecosystem. Sun Sun soil sediments carnivores carnivores herbivores phytoplankton Key biomass energy flow energy lost to the environment due to respiration marine litter ocean ecosystem (marine) forest ecosystem (terrestrial) trees terrestrial litter herbivores Fig. 1.1 (i) With reference to Fig. 1.1, give an example of a food chain. …[1]
Question paper, page 5
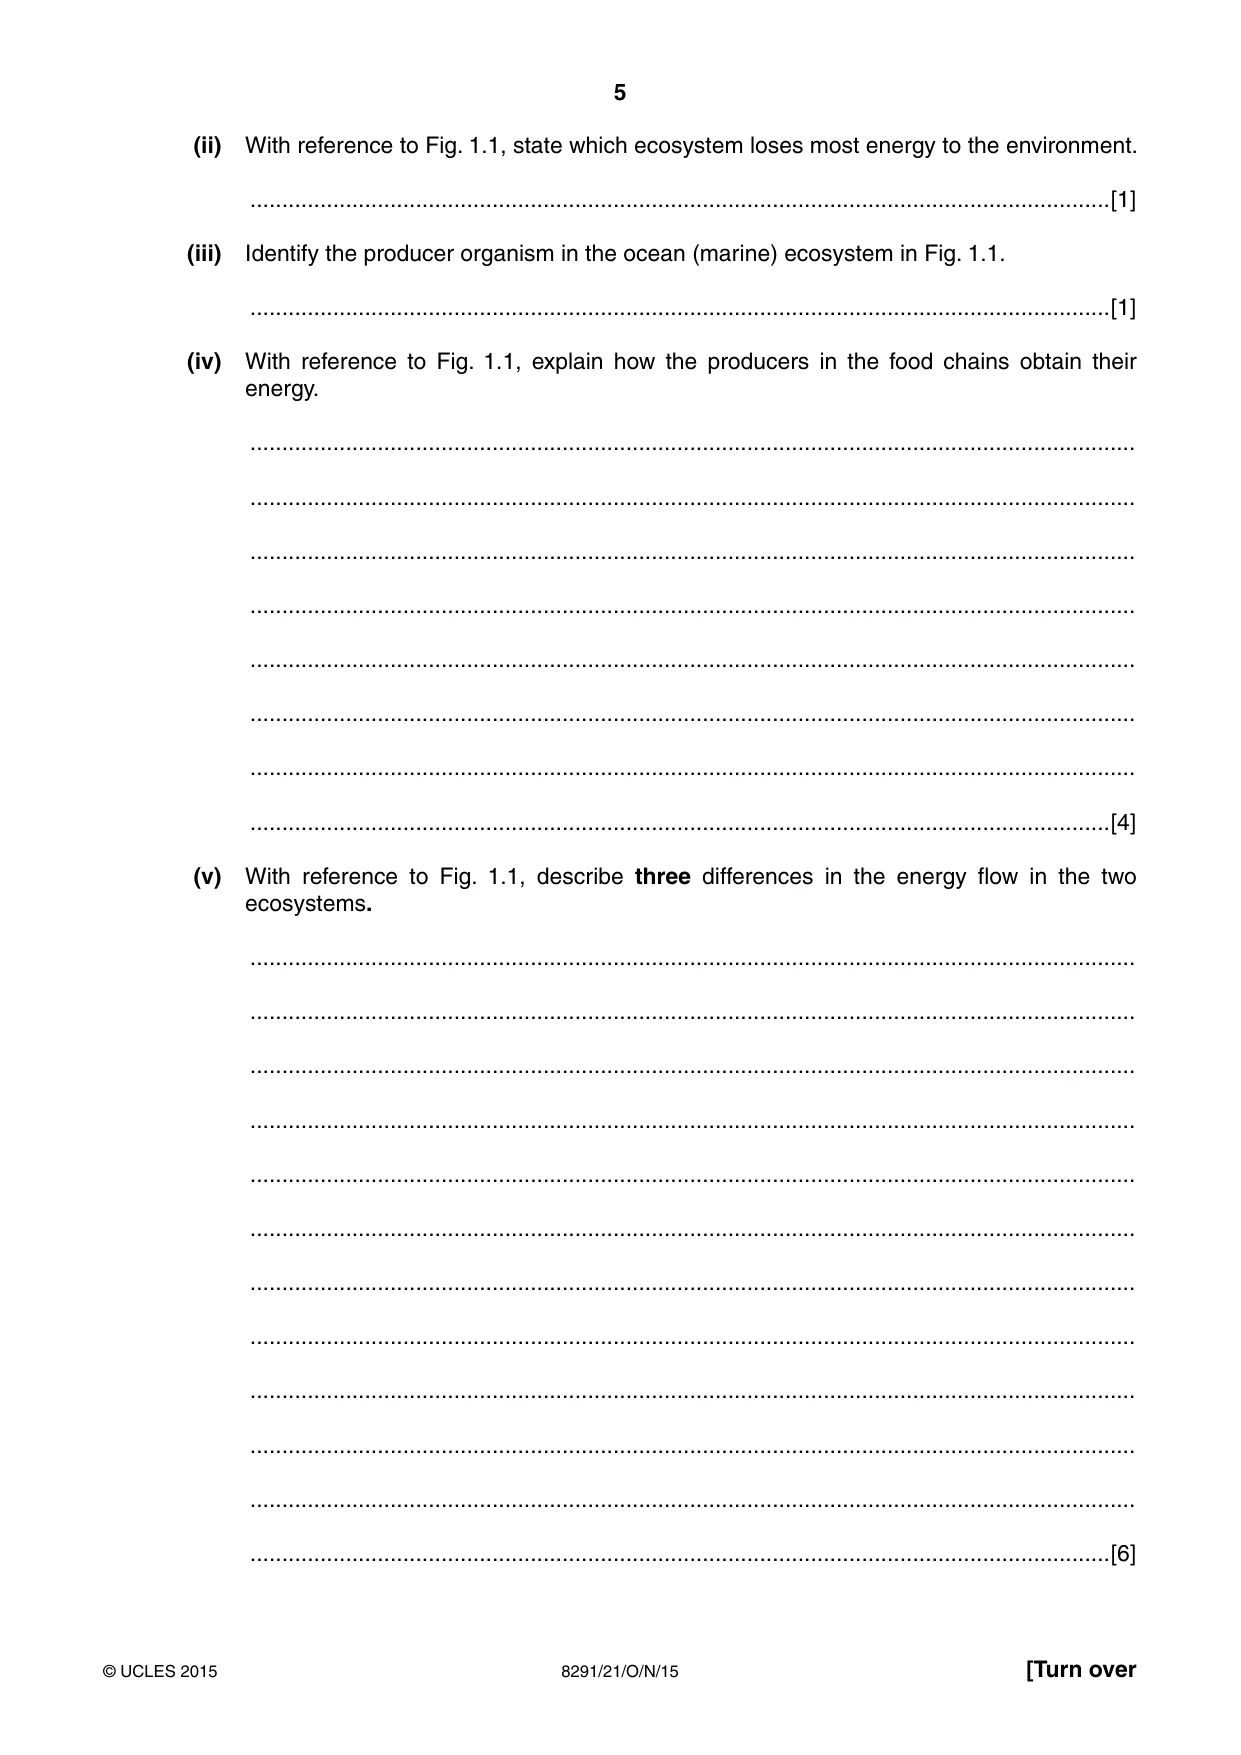
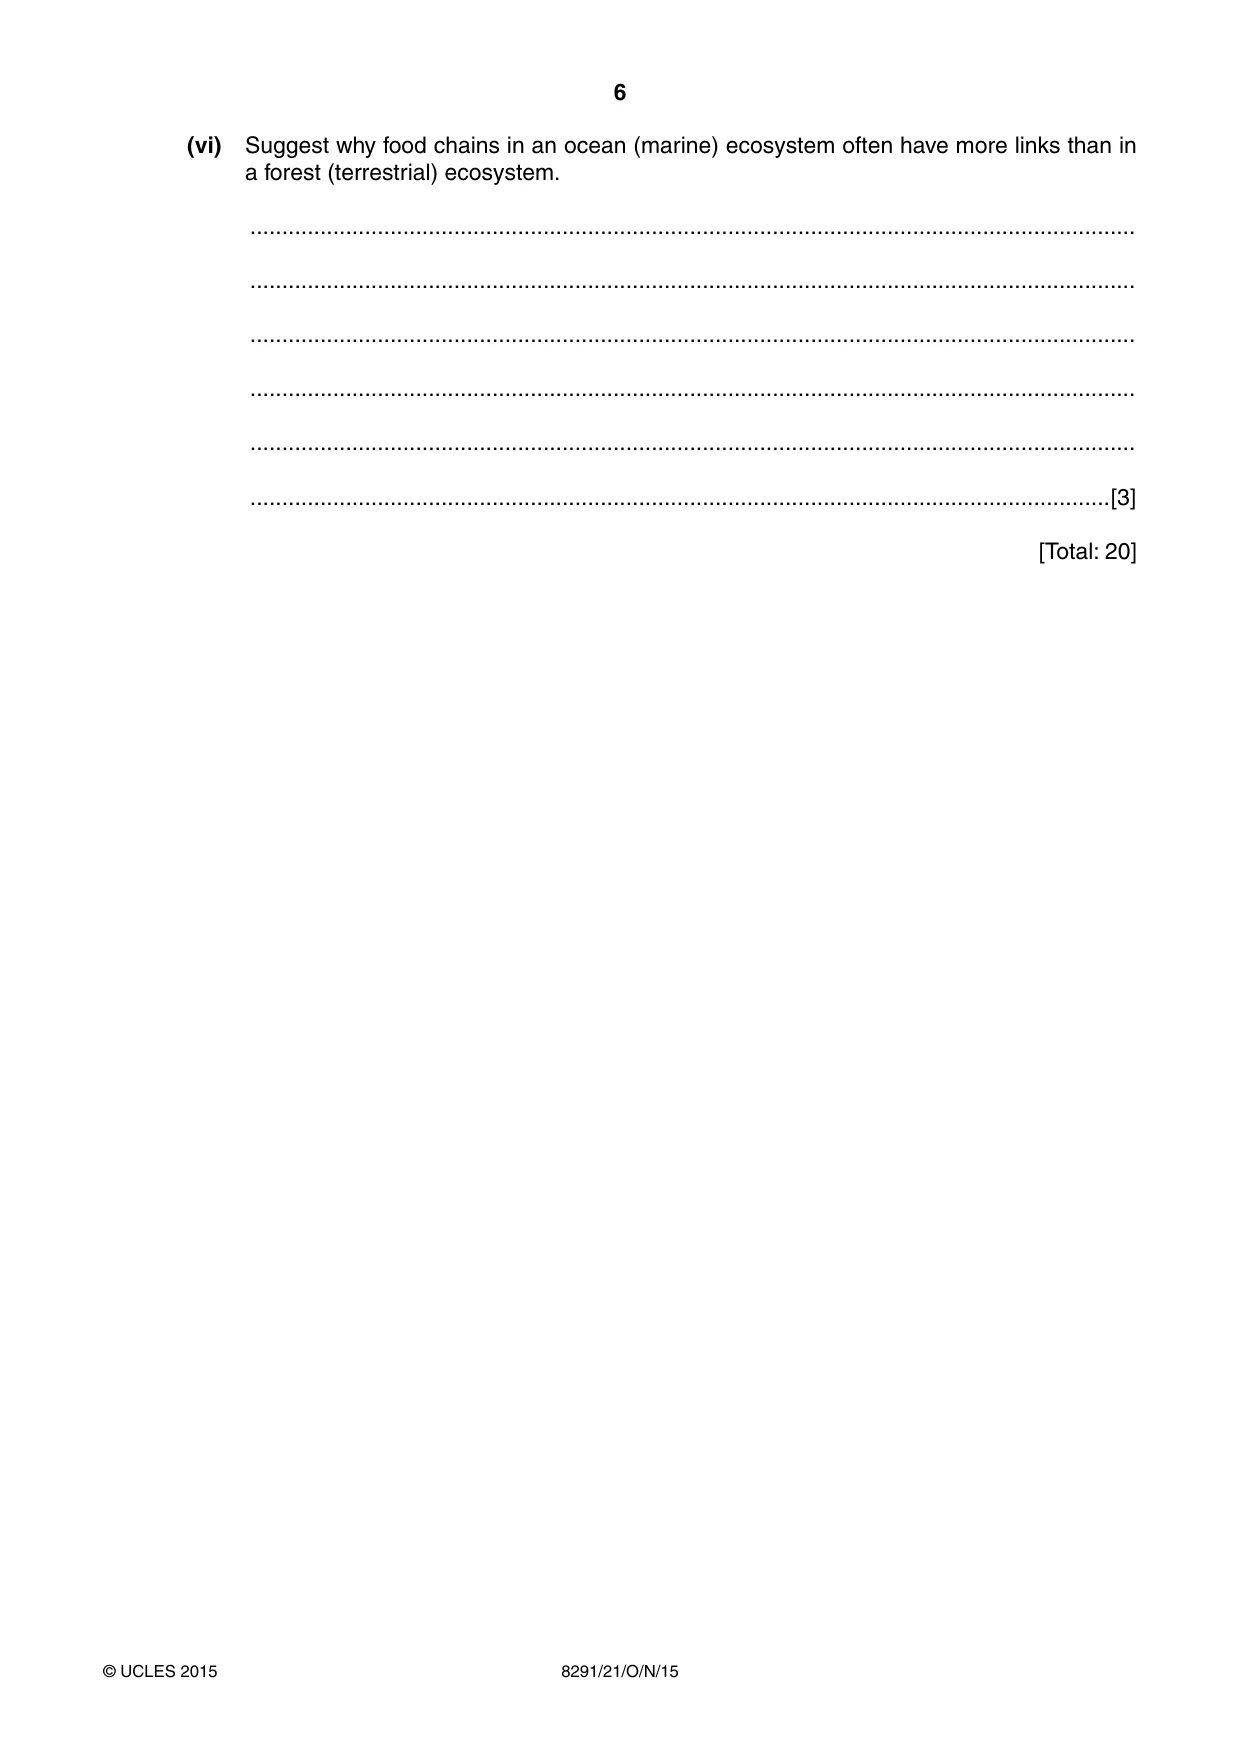
5 8291/21/O/N/15 © UCLES 2015 [Turn over (ii) With reference to Fig. 1.1, state which ecosystem loses most energy to the environment. …[1] (iii) Identify the producer organism in the ocean (marine) ecosystem in Fig. 1.1. …[1] (iv) With reference to Fig. 1.1, explain how the producers in the food chains obtain their energy. … … … … … … … …[4] (v) With reference to Fig. 1.1, describe three differences in the energy flow in the two ecosystems. … … … … … … … … … … … …[6]
Question paper, page 6
6 8291/21/O/N/15 © UCLES 2015 (vi) Suggest why food chains in an ocean (marine) ecosystem often have more links than in a forest (terrestrial) ecosystem. … … … … … …[3] [Total: 20]
Question paper, page 7
7 8291/21/O/N/15 © UCLES 2015 [Turn over BLANK PAGE
Question paper, page 8
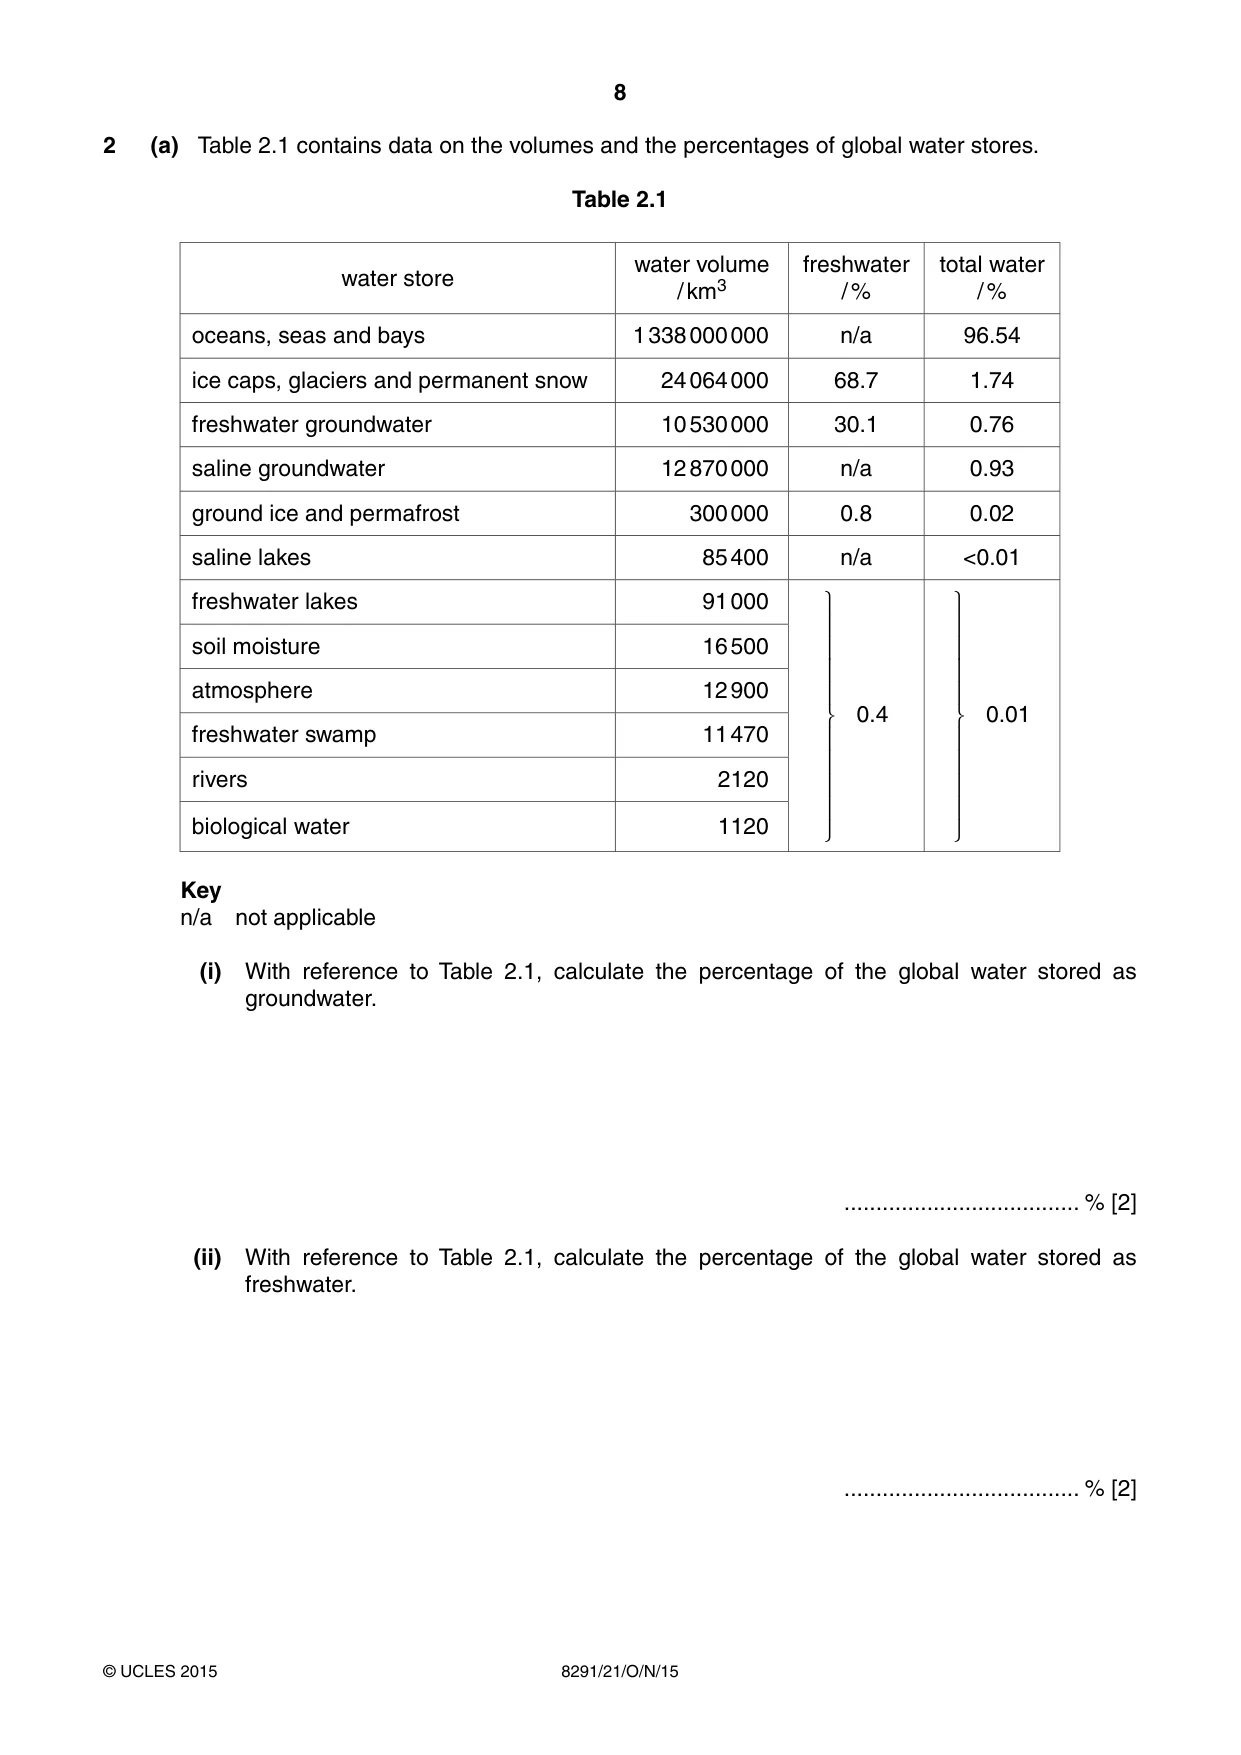
8 8291/21/O/N/15 © UCLES 2015 2 (a) Table 2.1 contains data on the volumes and the percentages of global water stores. Table 2.1 water store water volume / km3 freshwater / % total water / % oceans, seas and bays 1 338 000 000 n/a 96.54 ice caps, glaciers and permanent snow 24 064 000 68.7 1.74 freshwater groundwater 10 530 000 30.1 0.76 saline groundwater 12 870 000 n/a 0.93 ground ice and permafrost 300 000 0.8 0.02 saline lakes 85 400 n/a <0.01 freshwater lakes 91 000 ⎫ ⎪ ⎪ ⎪ ⎪ ⎬ ⎪ ⎪ ⎪ ⎪ ⎭ 0.4 ⎫ ⎪ ⎪ ⎪ ⎪ ⎬ ⎪ ⎪ ⎪ ⎪ ⎭ 0.01 soil moisture 16 500 atmosphere 12 900 freshwater swamp 11 470 rivers 2120 biological water 1120 Key n/a not applicable (i) With reference to Table 2.1, calculate the percentage of the global water stored as groundwater. … % [2] (ii) With reference to Table 2.1, calculate the percentage of the global water stored as freshwater. … % [2]
Question paper, page 9
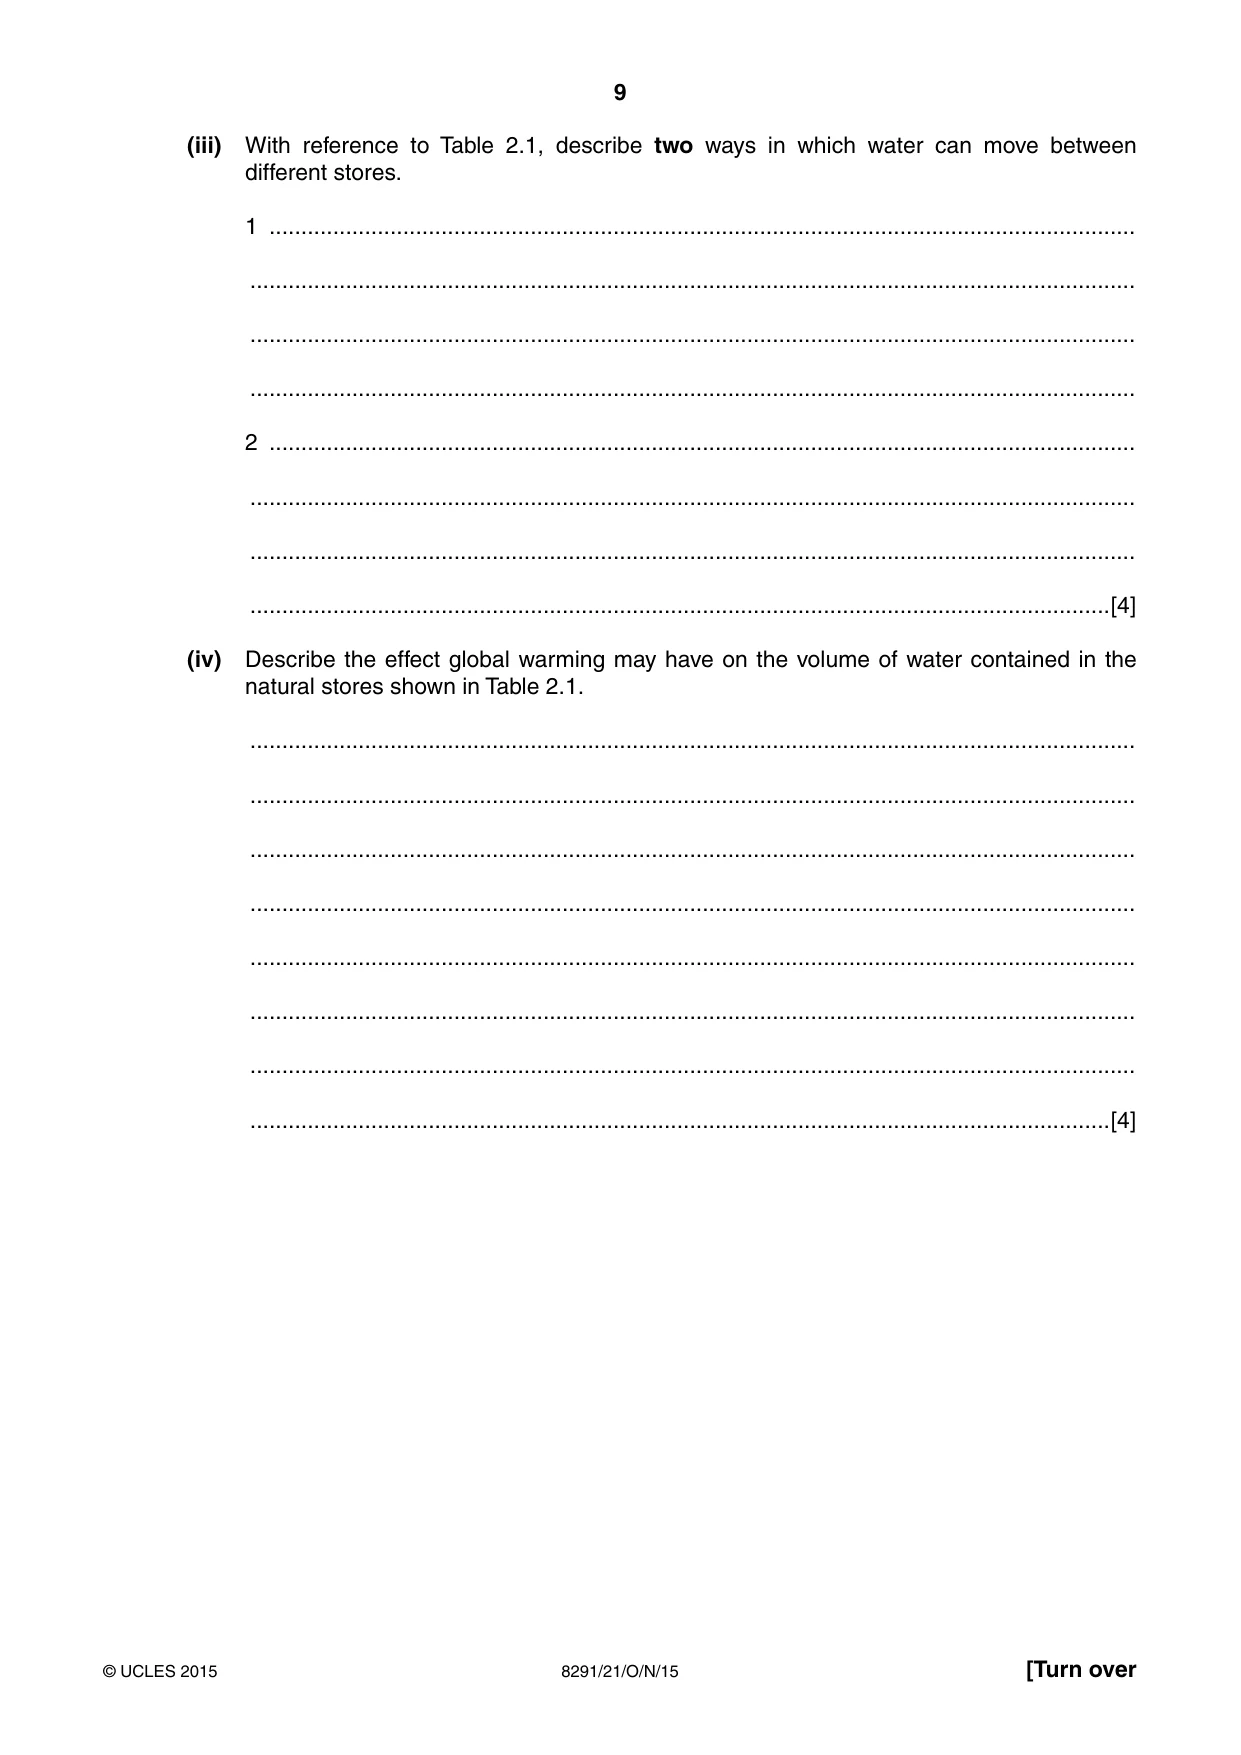
9 8291/21/O/N/15 © UCLES 2015 [Turn over (iii) With reference to Table 2.1, describe two ways in which water can move between different stores. 1 … … … … 2 … … … …[4] (iv) Describe the effect global warming may have on the volume of water contained in the natural stores shown in Table 2.1. … … … … … … … …[4]
Question paper, page 10
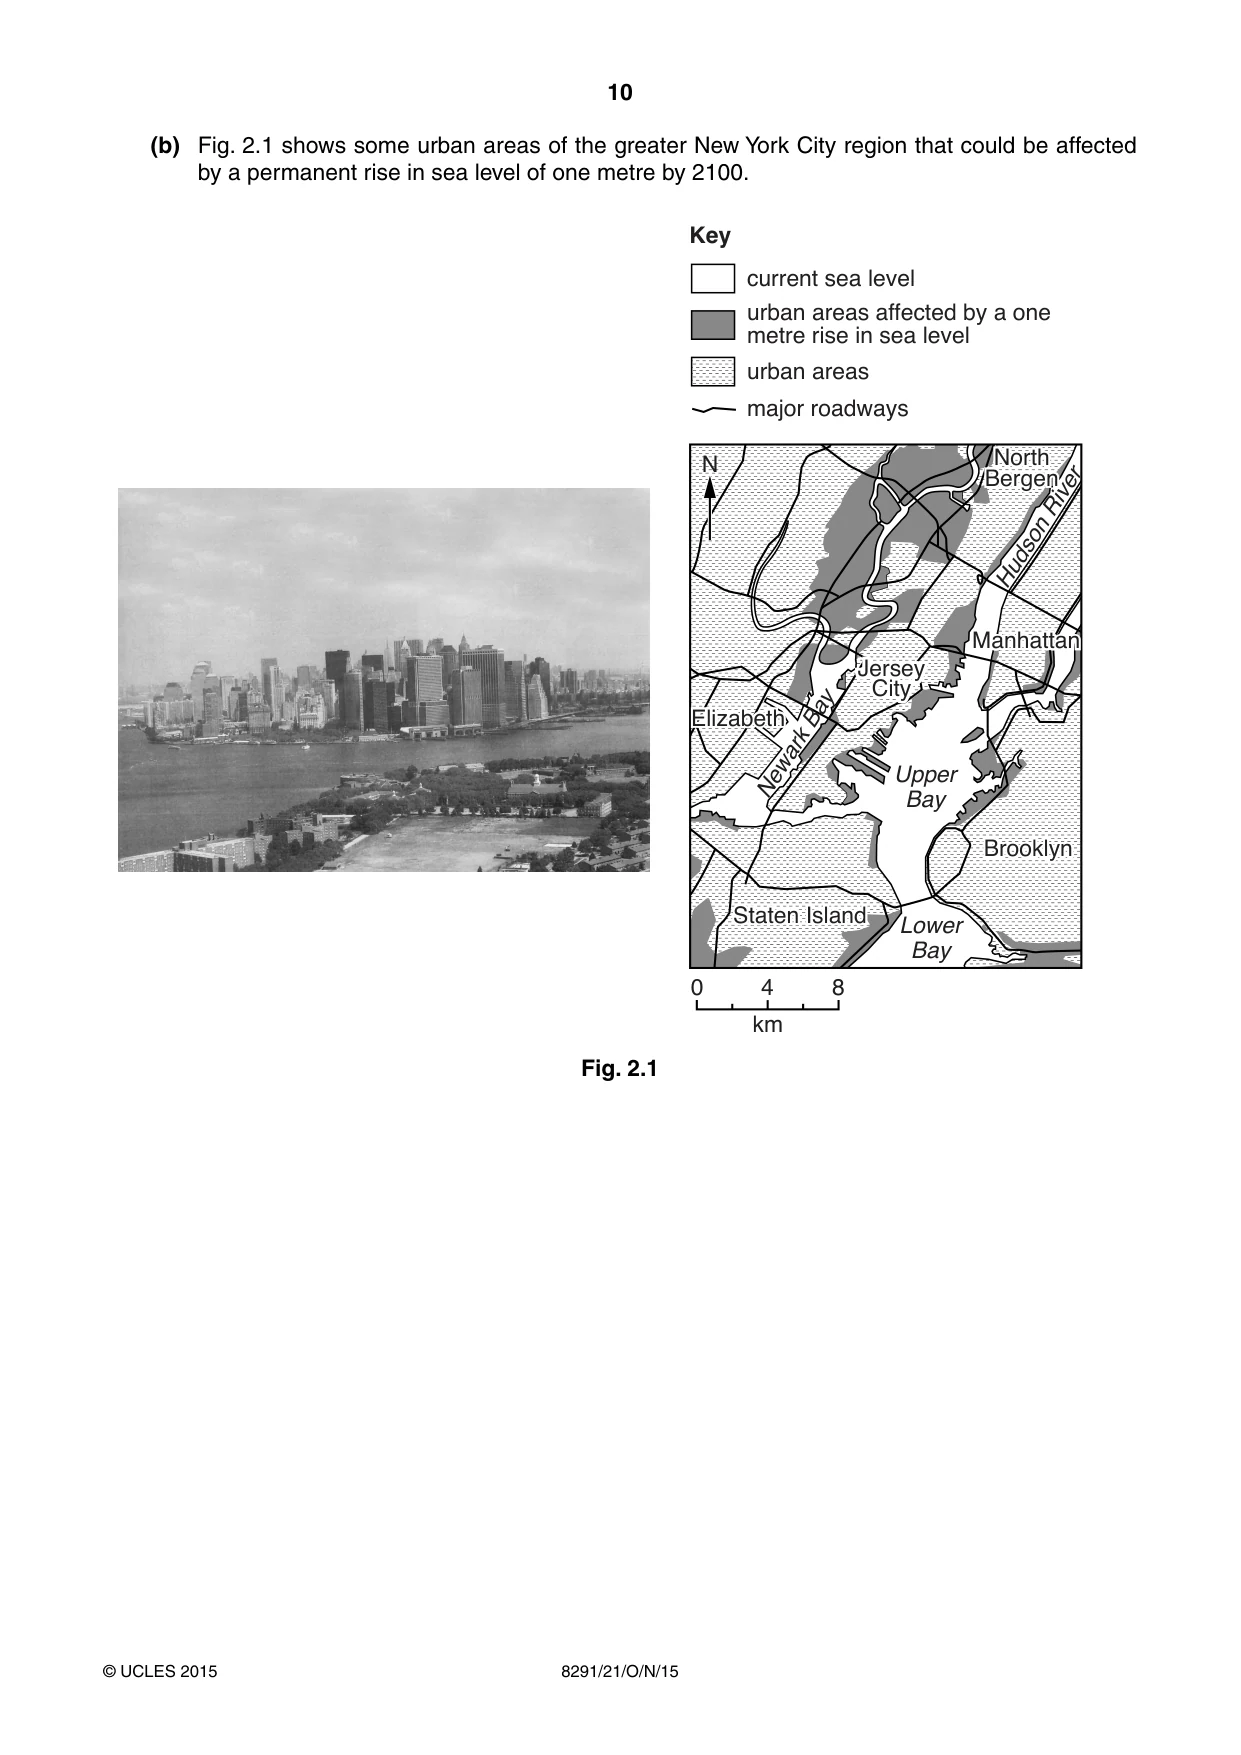
10 8291/21/O/N/15 © UCLES 2015 (b) Fig. 2.1 shows some urban areas of the greater New York City region that could be affected by a permanent rise in sea level of one metre by 2100. Manhattan Brooklyn Staten Island Manhattan North Bergen urban areas N Key current sea level urban areas affected by a one metre rise in sea level major roadways Brooklyn Staten Island 0 8 4 km Elizabeth Upper Bay Hudson River Newark Bay Lower Bay Jersey City Jersey City Fig. 2.1
Question paper, page 11
11 8291/21/O/N/15 © UCLES 2015 [Turn over With reference to Fig. 2.1, describe the possible threats to the urban communities of the greater New York City region, from a permanent rise in sea level of one metre by 2100. … … … … … … … … … … … … … … … …[8] [Total: 20]
Question paper, page 12
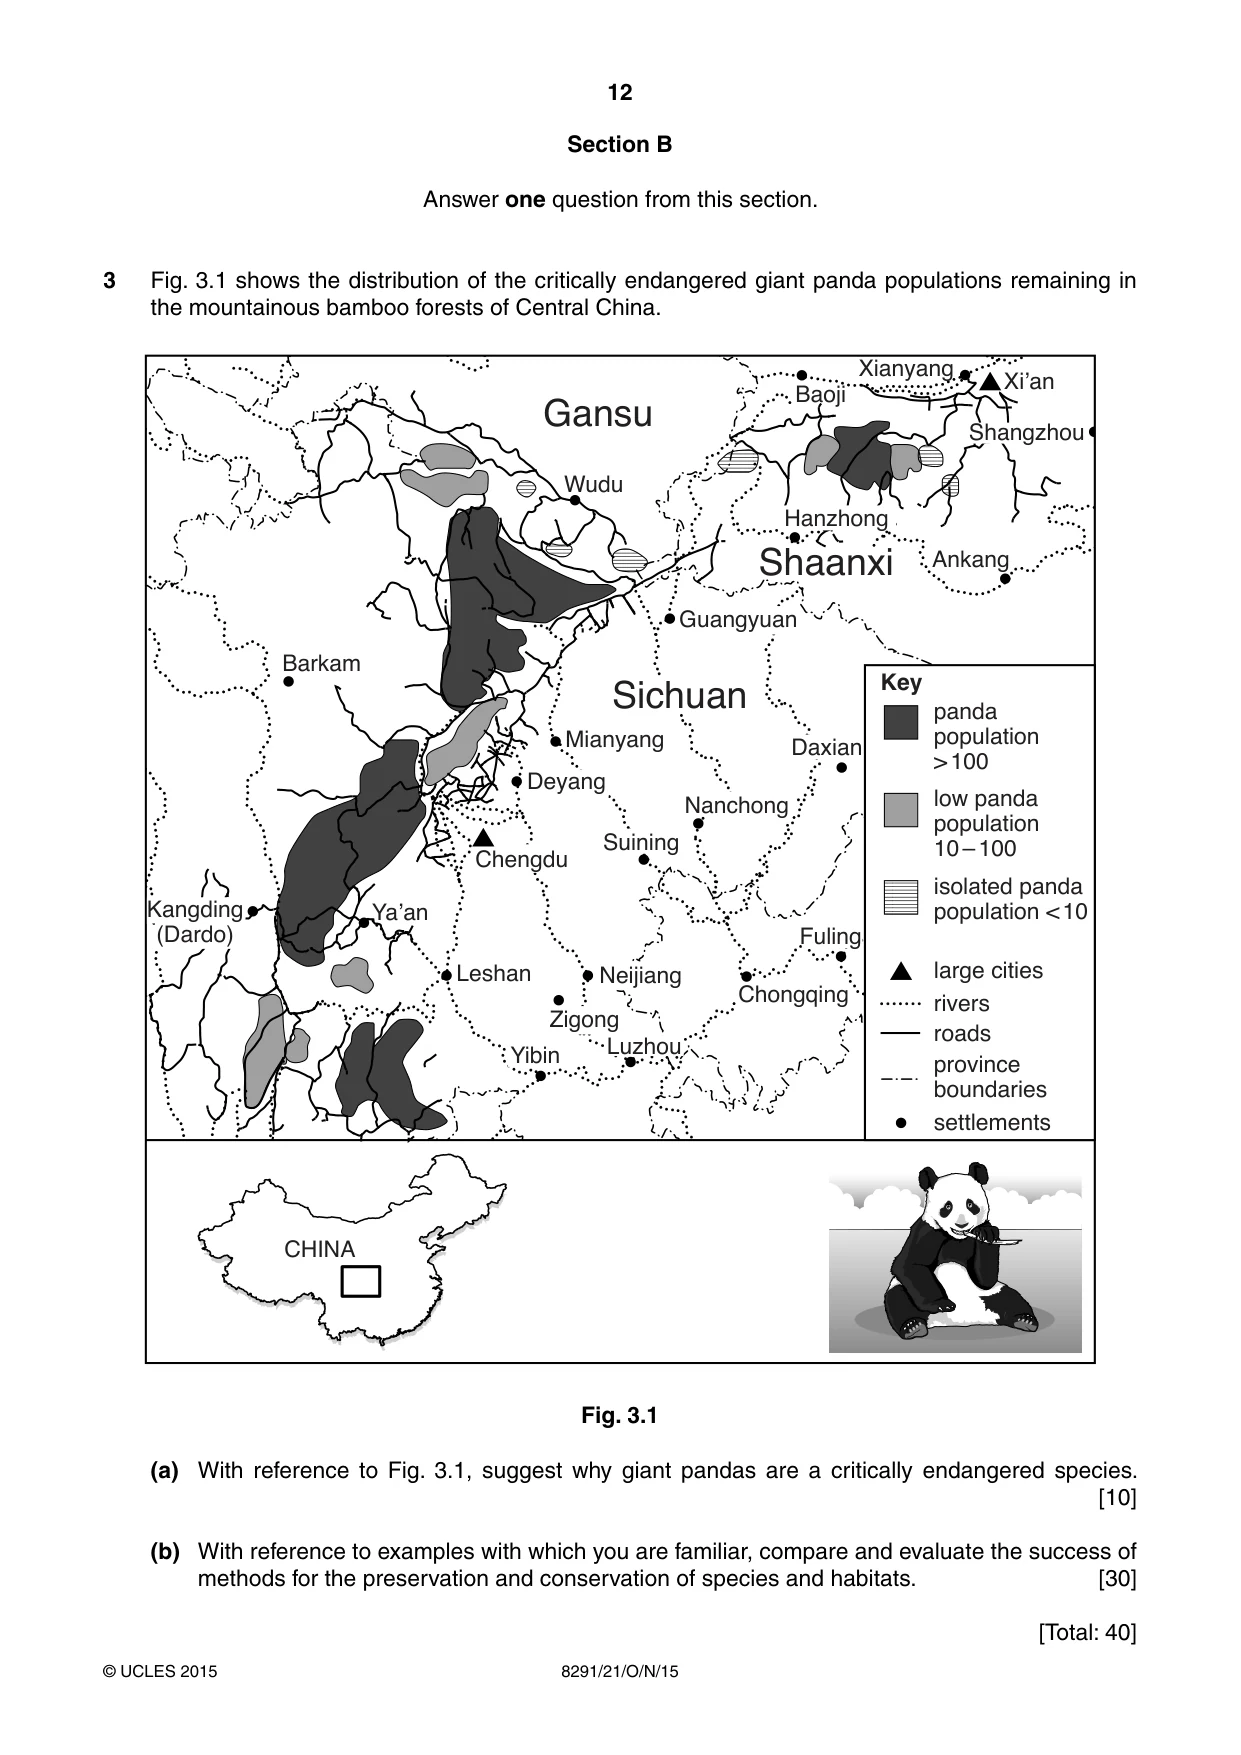
12 8291/21/O/N/15 © UCLES 2015 Section B Answer one question from this section. 3 Fig. 3.1 shows the distribution of the critically endangered giant panda populations remaining in the mountainous bamboo forests of Central China. Barkam Wudu Key panda population > 100 Baoji Ankang ;L·DQ Shangzhou Xianyang <D·DQ Leshan Shaanxi Gansu Mianyang Chengdu Deyang Nanchong Daxian Sichuan Zigong Yibin Luzhou Neijiang Chongqing Guangyuan Fuling Kangding (Dardo) Hanzhong low panda population 10 – 100 large cities rivers roads province boundaries settlements isolated panda population < 10 Suining CHINA Fig. 3.1 (a) With reference to Fig. 3.1, suggest why giant pandas are a critically endangered species. [10] (b) With reference to examples with which you are familiar, compare and evaluate the success of methods for the preservation and conservation of species and habitats. [30] [Total: 40]
Question paper, page 13
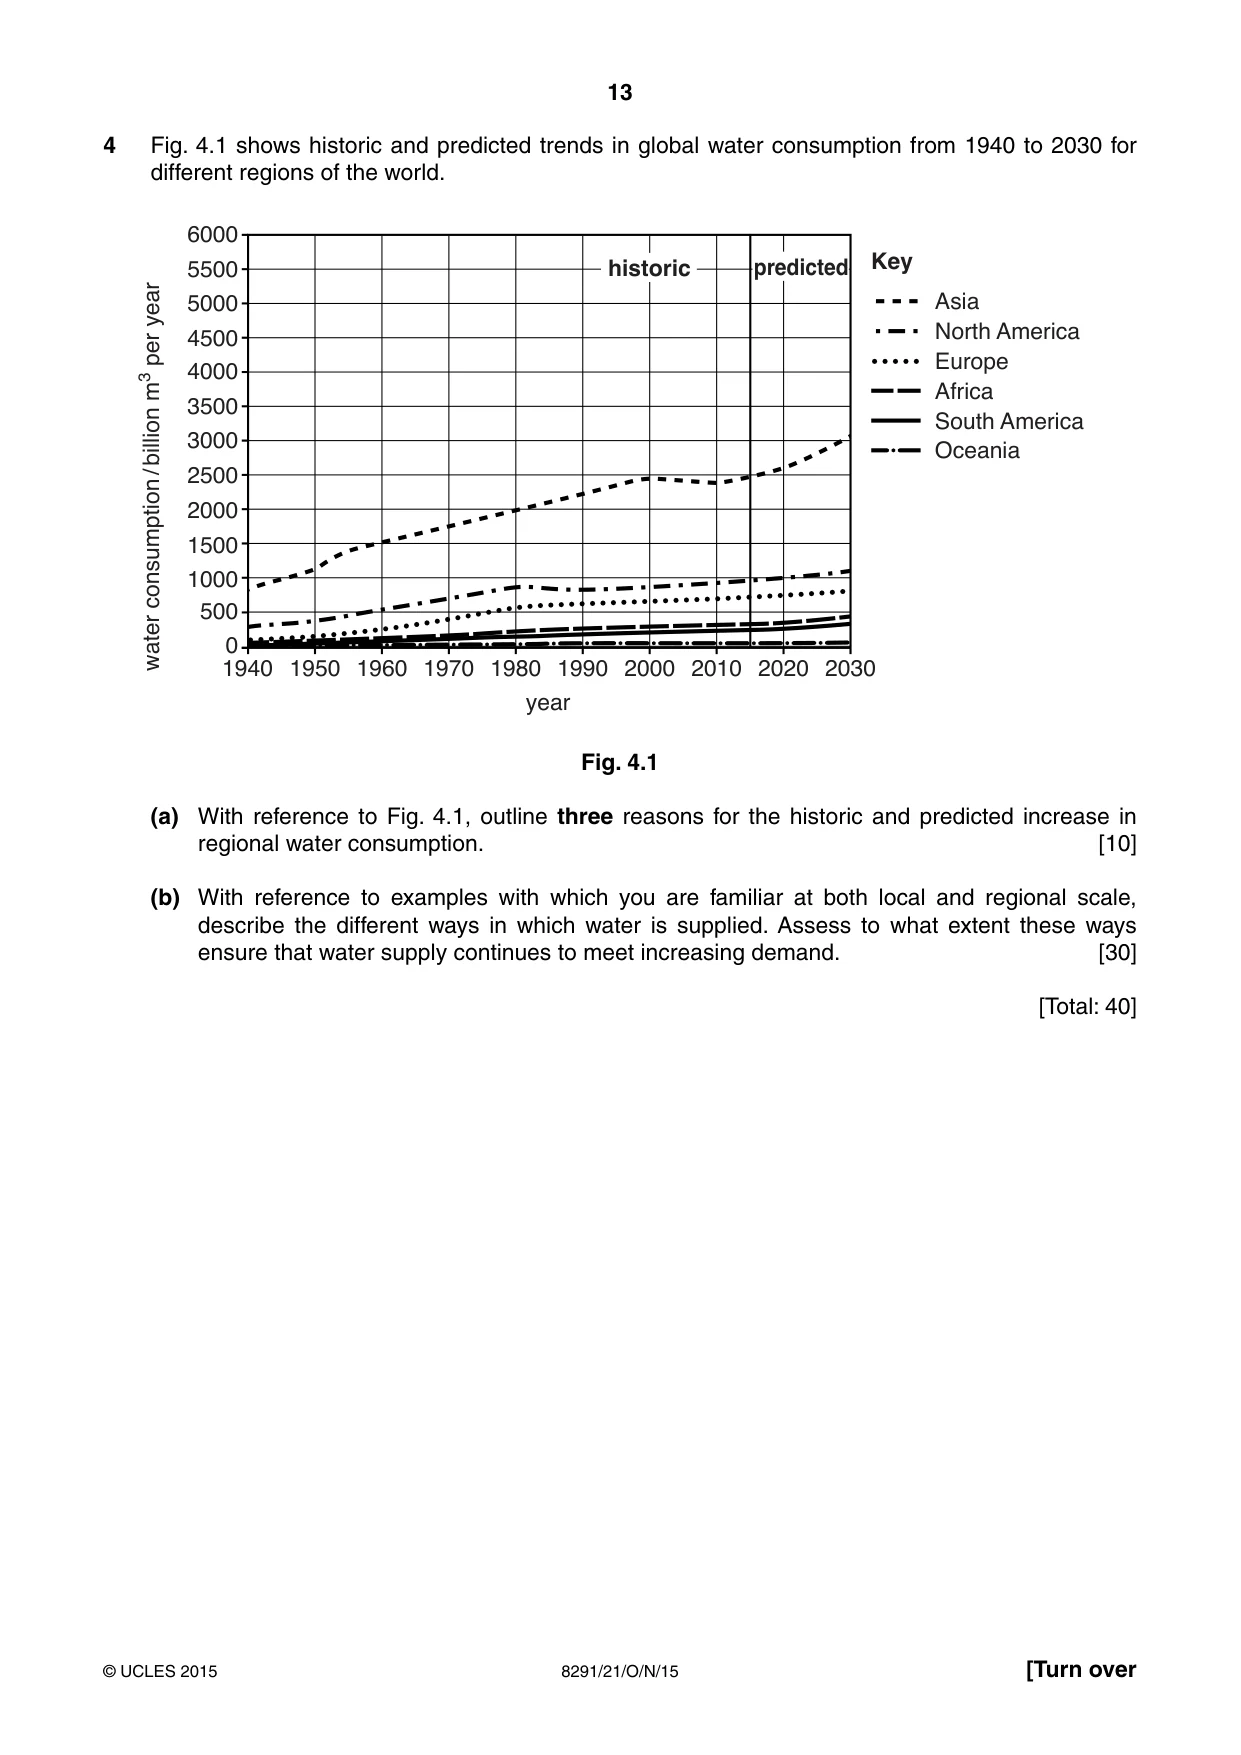
13 8291/21/O/N/15 © UCLES 2015 [Turn over 4 Fig. 4.1 shows historic and predicted trends in global water consumption from 1940 to 2030 for different regions of the world. 6000 Key 5500 5000 4500 4000 3500 3000 2500 water consumption / billion m3 per year 2000 1500 1000 500 0 1950 1940 1960 1970 1980 1990 year 2000 2010 2020 2030 historic predicted Europe North America South America Africa Asia Oceania Fig. 4.1 (a) With reference to Fig. 4.1, outline three reasons for the historic and predicted increase in regional water consumption. [10] (b) With reference to examples with which you are familiar at both local and regional scale, describe the different ways in which water is supplied. Assess to what extent these ways ensure that water supply continues to meet increasing demand. [30] [Total: 40]
Question paper, page 14
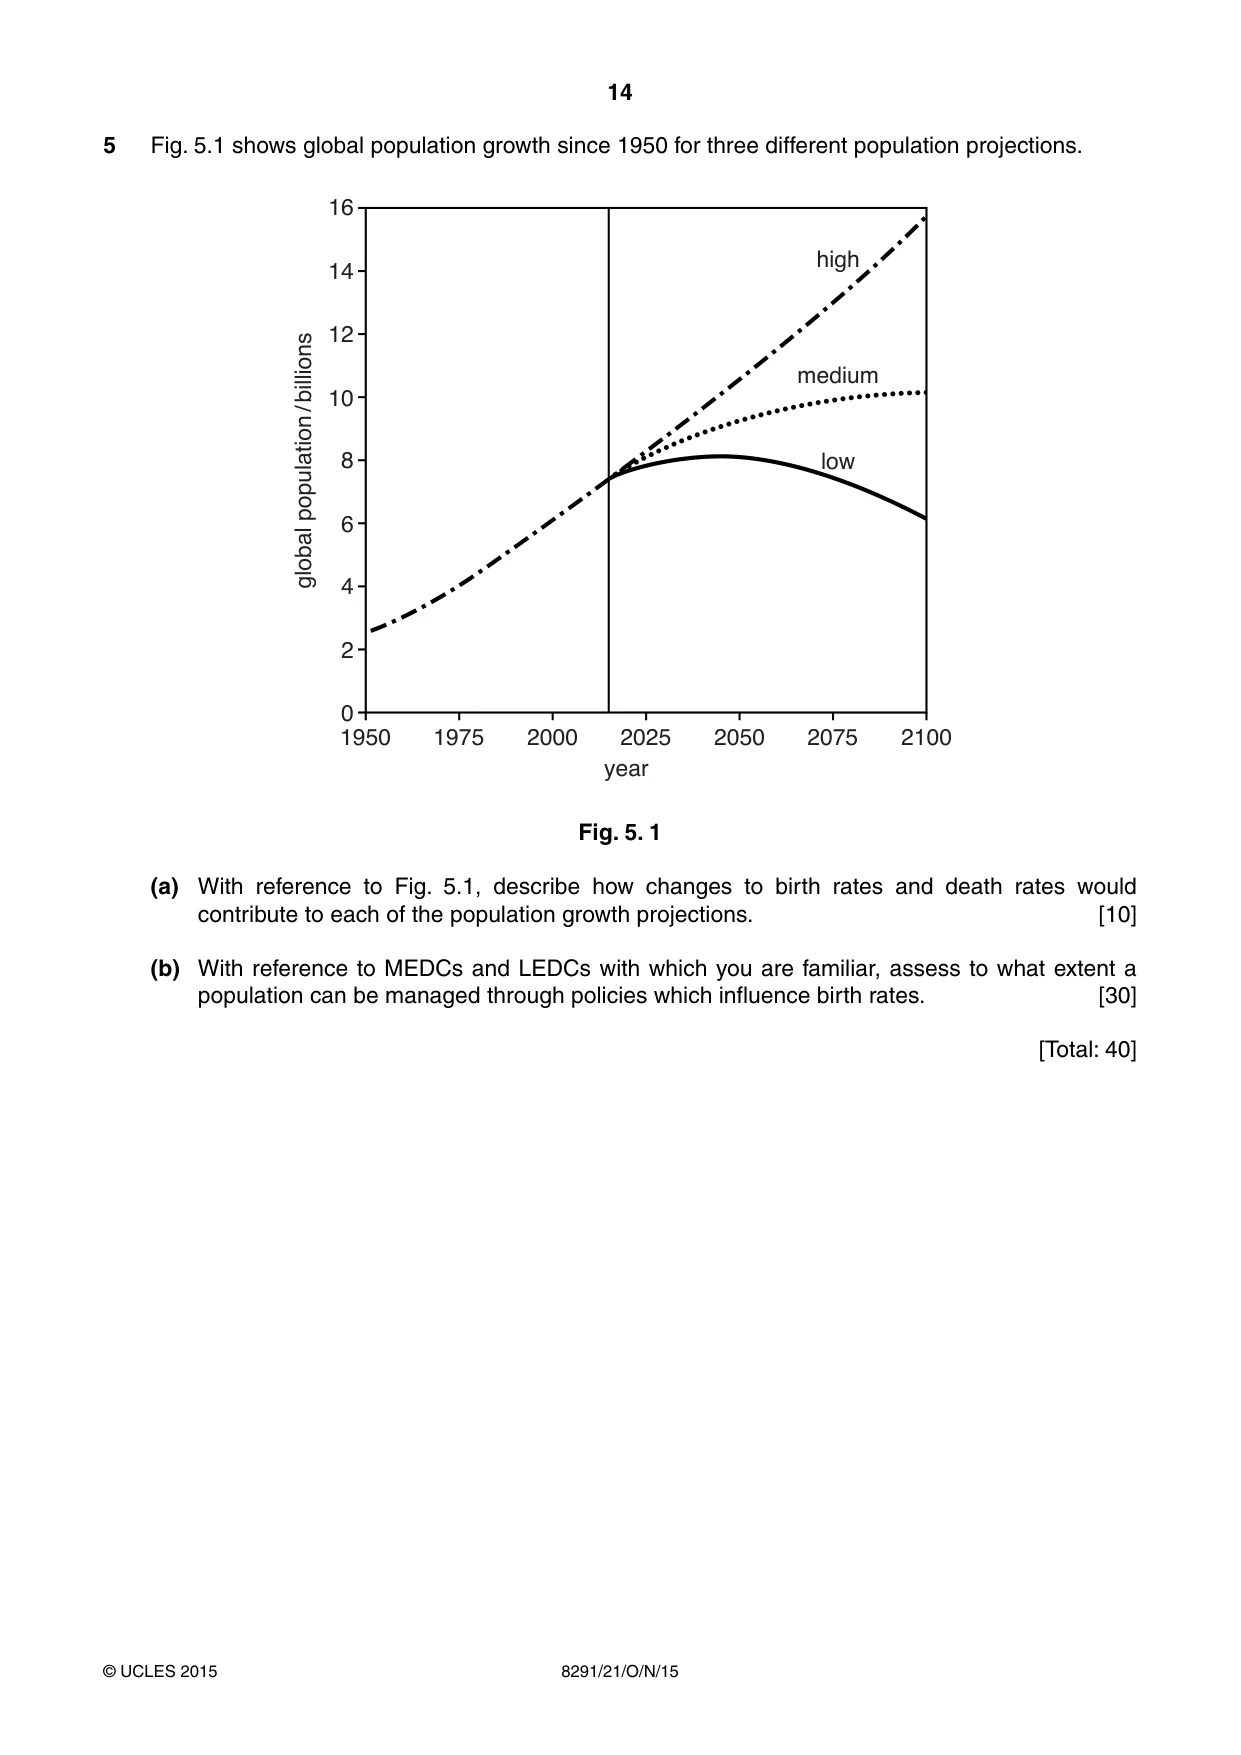
14 8291/21/O/N/15 © UCLES 2015 5 Fig. 5.1 shows global population growth since 1950 for three different population projections. 16 14 1950 1975 2000 2025 high medium low year 2050 2075 2100 12 10 8 global population / billions 6 4 2 0 Fig. 5. 1 (a) With reference to Fig. 5.1, describe how changes to birth rates and death rates would contribute to each of the population growth projections. [10] (b) With reference to MEDCs and LEDCs with which you are familiar, assess to what extent a population can be managed through policies which influence birth rates. [30] [Total: 40]
Question paper, page 15
15 8291/21/O/N/15 © UCLES 2015 BLANK PAGE
Question paper, page 16
16 8291/21/O/N/15 © UCLES 2015 Permission to reproduce items where third-party owned material protected by copyright is included has been sought and cleared where possible. Every reasonable effort has been made by the publisher (UCLES) to trace copyright holders, but if any items requiring clearance have unwittingly been included, the publisher will be pleased to make amends at the earliest possible opportunity. To avoid the issue of disclosure of answer-related information to candidates, all copyright acknowledgements are reproduced online in the Cambridge International Examinations Copyright Acknowledgements Booklet. This is produced for each series of examinations and is freely available to download at www.cie.org.uk after the live examination series. Cambridge International Examinations is part of the Cambridge Assessment Group. Cambridge Assessment is the brand name of University of Cambridge Local Examinations Syndicate (UCLES), which is itself a department of the University of Cambridge. BLANK PAGE
Mark scheme, page 1
® IGCSE is the registered trademark of Cambridge International Examinations. CAMBRIDGE INTERNATIONAL EXAMINATIONS Cambridge International Advanced Subsidiary Level MARK SCHEME for the October/November 2015 series 8291 ENVIRONMENTAL MANAGEMENT 8291/21 Paper 2, maximum raw mark 80 This mark scheme is published as an aid to teachers and candidates, to indicate the requirements of the examination. It shows the basis on which Examiners were instructed to award marks. It does not indicate the details of the discussions that took place at an Examiners’ meeting before marking began, which would have considered the acceptability of alternative answers. Mark schemes should be read in conjunction with the question paper and the Principal Examiner Report for Teachers. Cambridge will not enter into discussions about these mark schemes. Cambridge is publishing the mark schemes for the October/November 2015 series for most Cambridge IGCSE®, Cambridge International A and AS Level components and some Cambridge O Level components.
Mark scheme, page 2
Page 2 Mark Scheme Syllabus Paper Cambridge International AS Level – October/November 2015 8291 21 © Cambridge International Examinations 2015 General notes Symbols used in Environmental Management mark schemes. / separates alternatives for a marking point – other valid ways of expressing the same idea are also credited ; separates points for the award of a mark [3] indicates the number of marks available italic indicates that this is information about the marking points and is not required to gain credit italic text is also used for comments about alternatives that should be accepted, ignored or rejected ora or reverse argument – shows that an argument from an alternative viewpoint will be credited AW alternative wording, sometimes called ‘or words to that effect’ – AW is used when there are many different ways of expressing the same idea ( ) the word / phrase in brackets is not required to gain marks but sets the context of the response for credit e.g. (nuclear) waste – nuclear is not needed but if it was described as a domestic waste then no mark is awarded volcanic underlined words – the answer must contain exactly this word ecf error carried forward – if an incorrect answer is given to part of a question, and this answer is subsequently used by a candidate in later parts of the question, this indicates that the candidate’s incorrect answer will be used as a starting point for marking the later parts of the question
Mark scheme, page 3
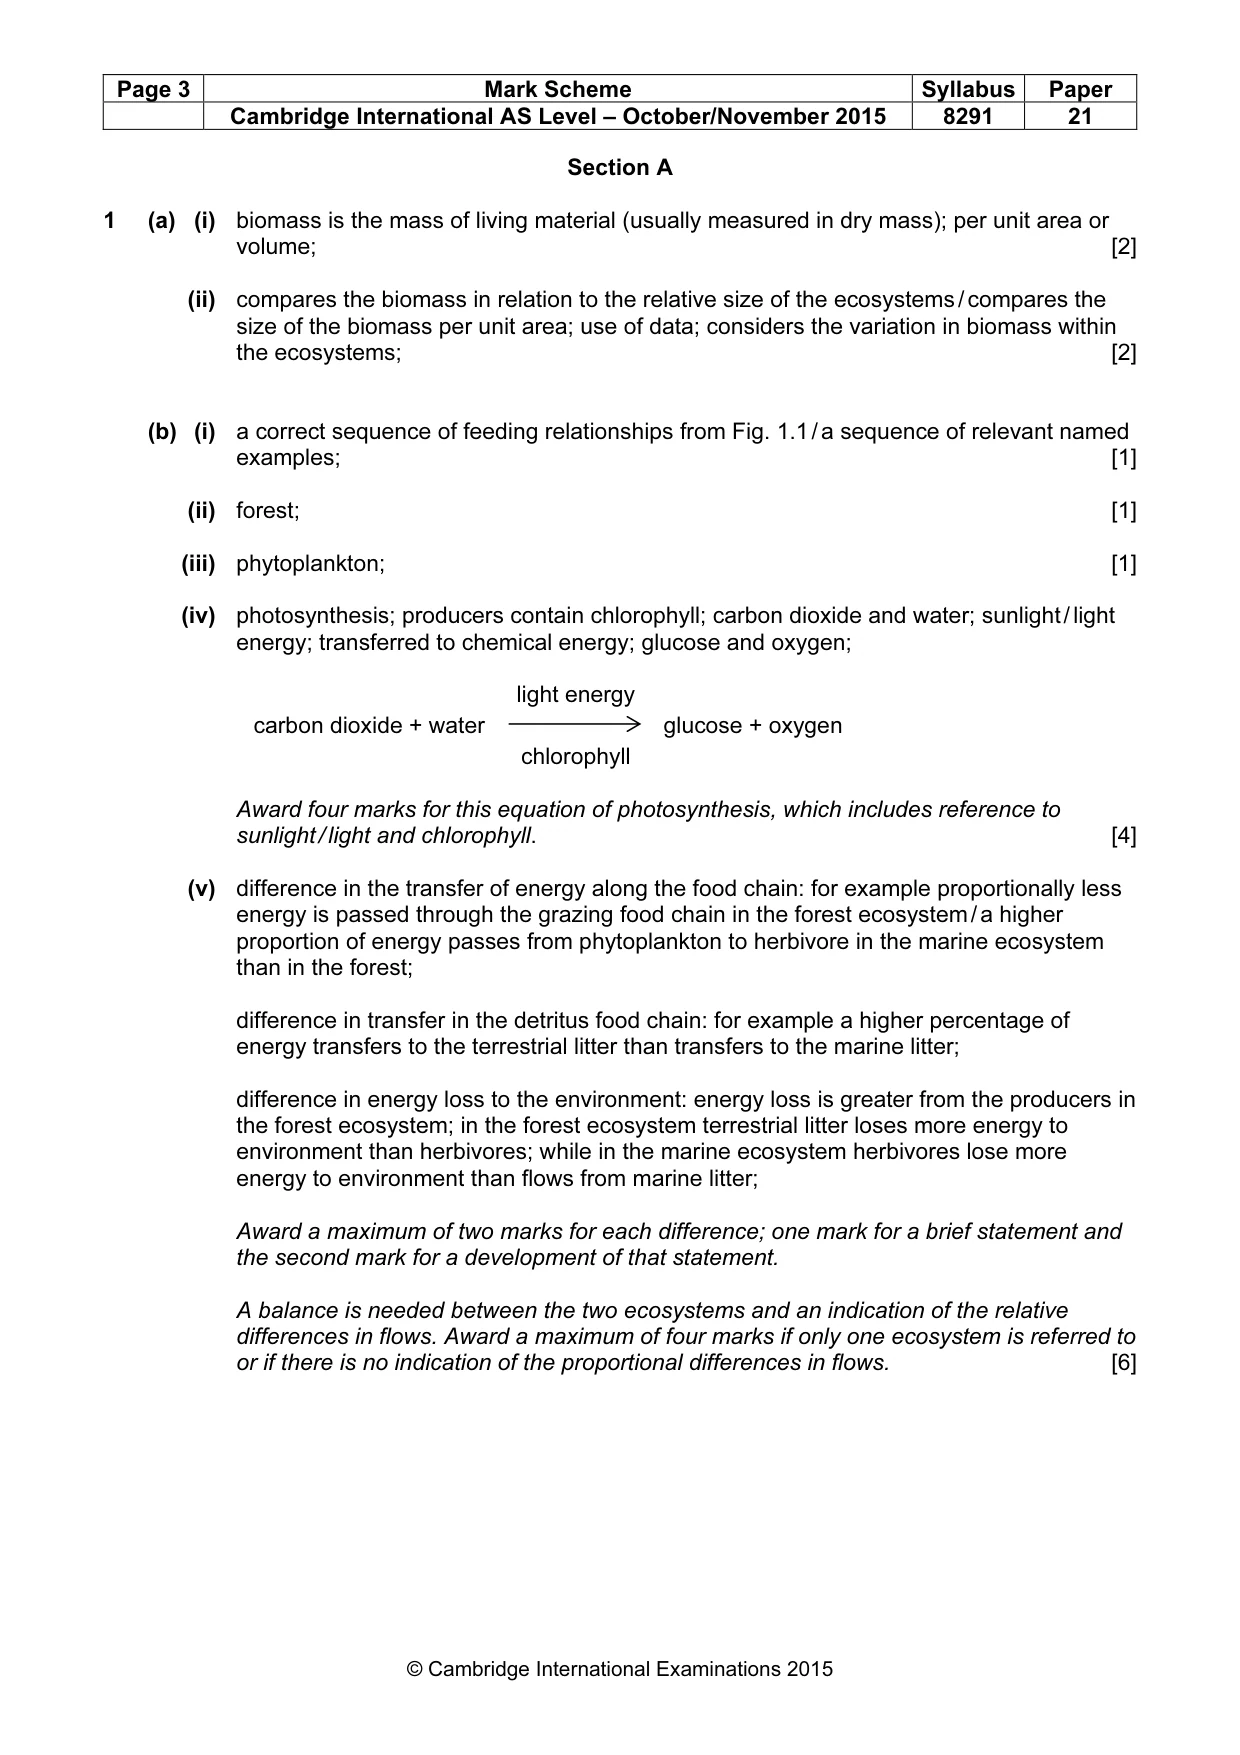
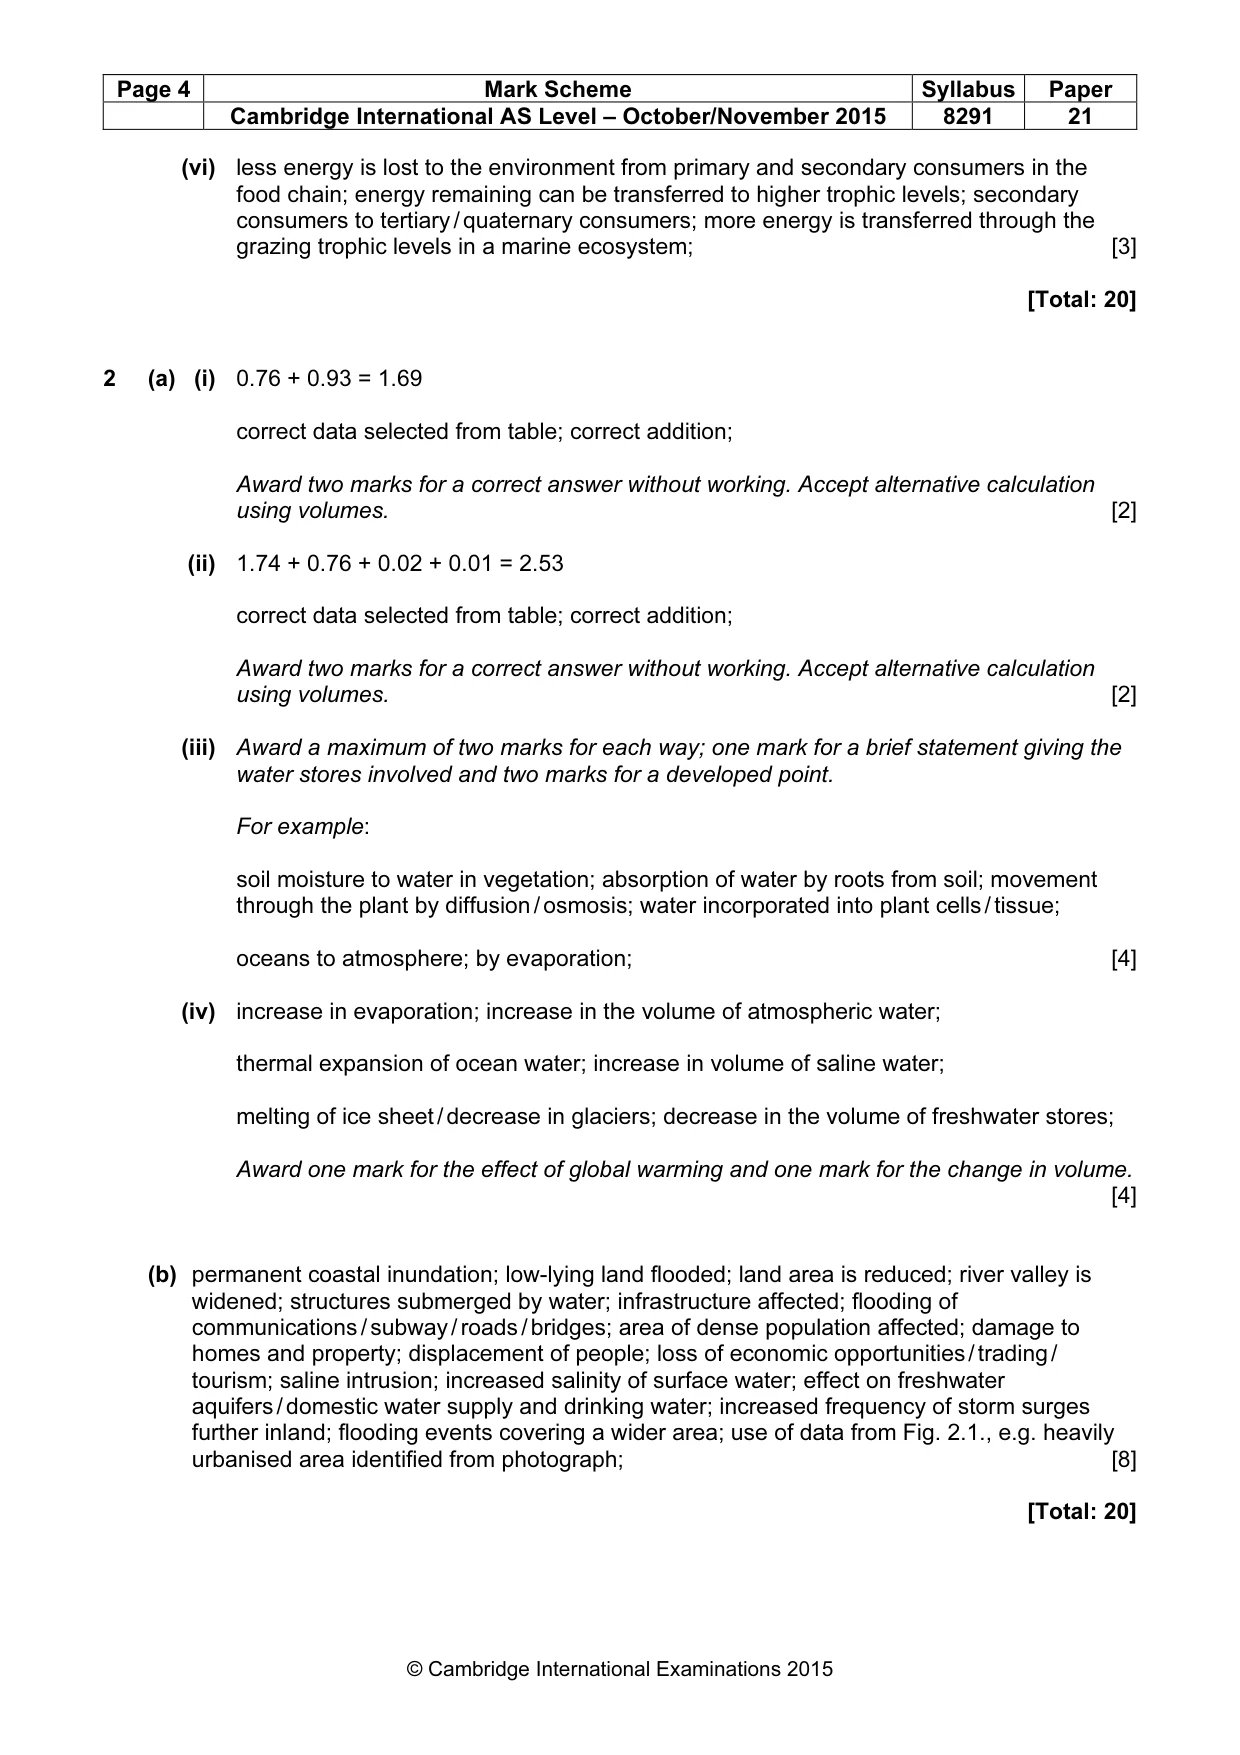
Page 3 Mark Scheme Syllabus Paper Cambridge International AS Level – October/November 2015 8291 21 © Cambridge International Examinations 2015 Section A 1 (a) (i) biomass is the mass of living material (usually measured in dry mass); per unit area or volume; [2] (ii) compares the biomass in relation to the relative size of the ecosystems / compares the size of the biomass per unit area; use of data; considers the variation in biomass within the ecosystems; [2] (b) (i) a correct sequence of feeding relationships from Fig. 1.1 / a sequence of relevant named examples; [1] (ii) forest; [1] (iii) phytoplankton; [1] (iv) photosynthesis; producers contain chlorophyll; carbon dioxide and water; sunlight / light energy; transferred to chemical energy; glucose and oxygen; light energy carbon dioxide + water glucose + oxygen chlorophyll Award four marks for this equation of photosynthesis, which includes reference to sunlight / light and chlorophyll. [4] (v) difference in the transfer of energy along the food chain: for example proportionally less energy is passed through the grazing food chain in the forest ecosystem / a higher proportion of energy passes from phytoplankton to herbivore in the marine ecosystem than in the forest; difference in transfer in the detritus food chain: for example a higher percentage of energy transfers to the terrestrial litter than transfers to the marine litter; difference in energy loss to the environment: energy loss is greater from the producers in the forest ecosystem; in the forest ecosystem terrestrial litter loses more energy to environment than herbivores; while in the marine ecosystem herbivores lose more energy to environment than flows from marine litter; Award a maximum of two marks for each difference; one mark for a brief statement and the second mark for a development of that statement. A balance is needed between the two ecosystems and an indication of the relative differences in flows. Award a maximum of four marks if only one ecosystem is referred to or if there is no indication of the proportional differences in flows. [6]
Mark scheme, page 4
Page 4 Mark Scheme Syllabus Paper Cambridge International AS Level – October/November 2015 8291 21 © Cambridge International Examinations 2015 (vi) less energy is lost to the environment from primary and secondary consumers in the food chain; energy remaining can be transferred to higher trophic levels; secondary consumers to tertiary / quaternary consumers; more energy is transferred through the grazing trophic levels in a marine ecosystem; [3] [Total: 20] 2 (a) (i) 0.76 + 0.93 = 1.69 correct data selected from table; correct addition; Award two marks for a correct answer without working. Accept alternative calculation using volumes. [2] (ii) 1.74 + 0.76 + 0.02 + 0.01 = 2.53 correct data selected from table; correct addition; Award two marks for a correct answer without working. Accept alternative calculation using volumes. [2] (iii) Award a maximum of two marks for each way; one mark for a brief statement giving the water stores involved and two marks for a developed point. For example: soil moisture to water in vegetation; absorption of water by roots from soil; movement through the plant by diffusion / osmosis; water incorporated into plant cells / tissue; oceans to atmosphere; by evaporation; [4] (iv) increase in evaporation; increase in the volume of atmospheric water; thermal expansion of ocean water; increase in volume of saline water; melting of ice sheet / decrease in glaciers; decrease in the volume of freshwater stores; Award one mark for the effect of global warming and one mark for the change in volume. [4] (b) permanent coastal inundation; low-lying land flooded; land area is reduced; river valley is widened; structures submerged by water; infrastructure affected; flooding of communications / subway / roads / bridges; area of dense population affected; damage to homes and property; displacement of people; loss of economic opportunities / trading / tourism; saline intrusion; increased salinity of surface water; effect on freshwater aquifers / domestic water supply and drinking water; increased frequency of storm surges further inland; flooding events covering a wider area; use of data from Fig. 2.1., e.g. heavily urbanised area identified from photograph; [8] [Total: 20]
Mark scheme, page 5
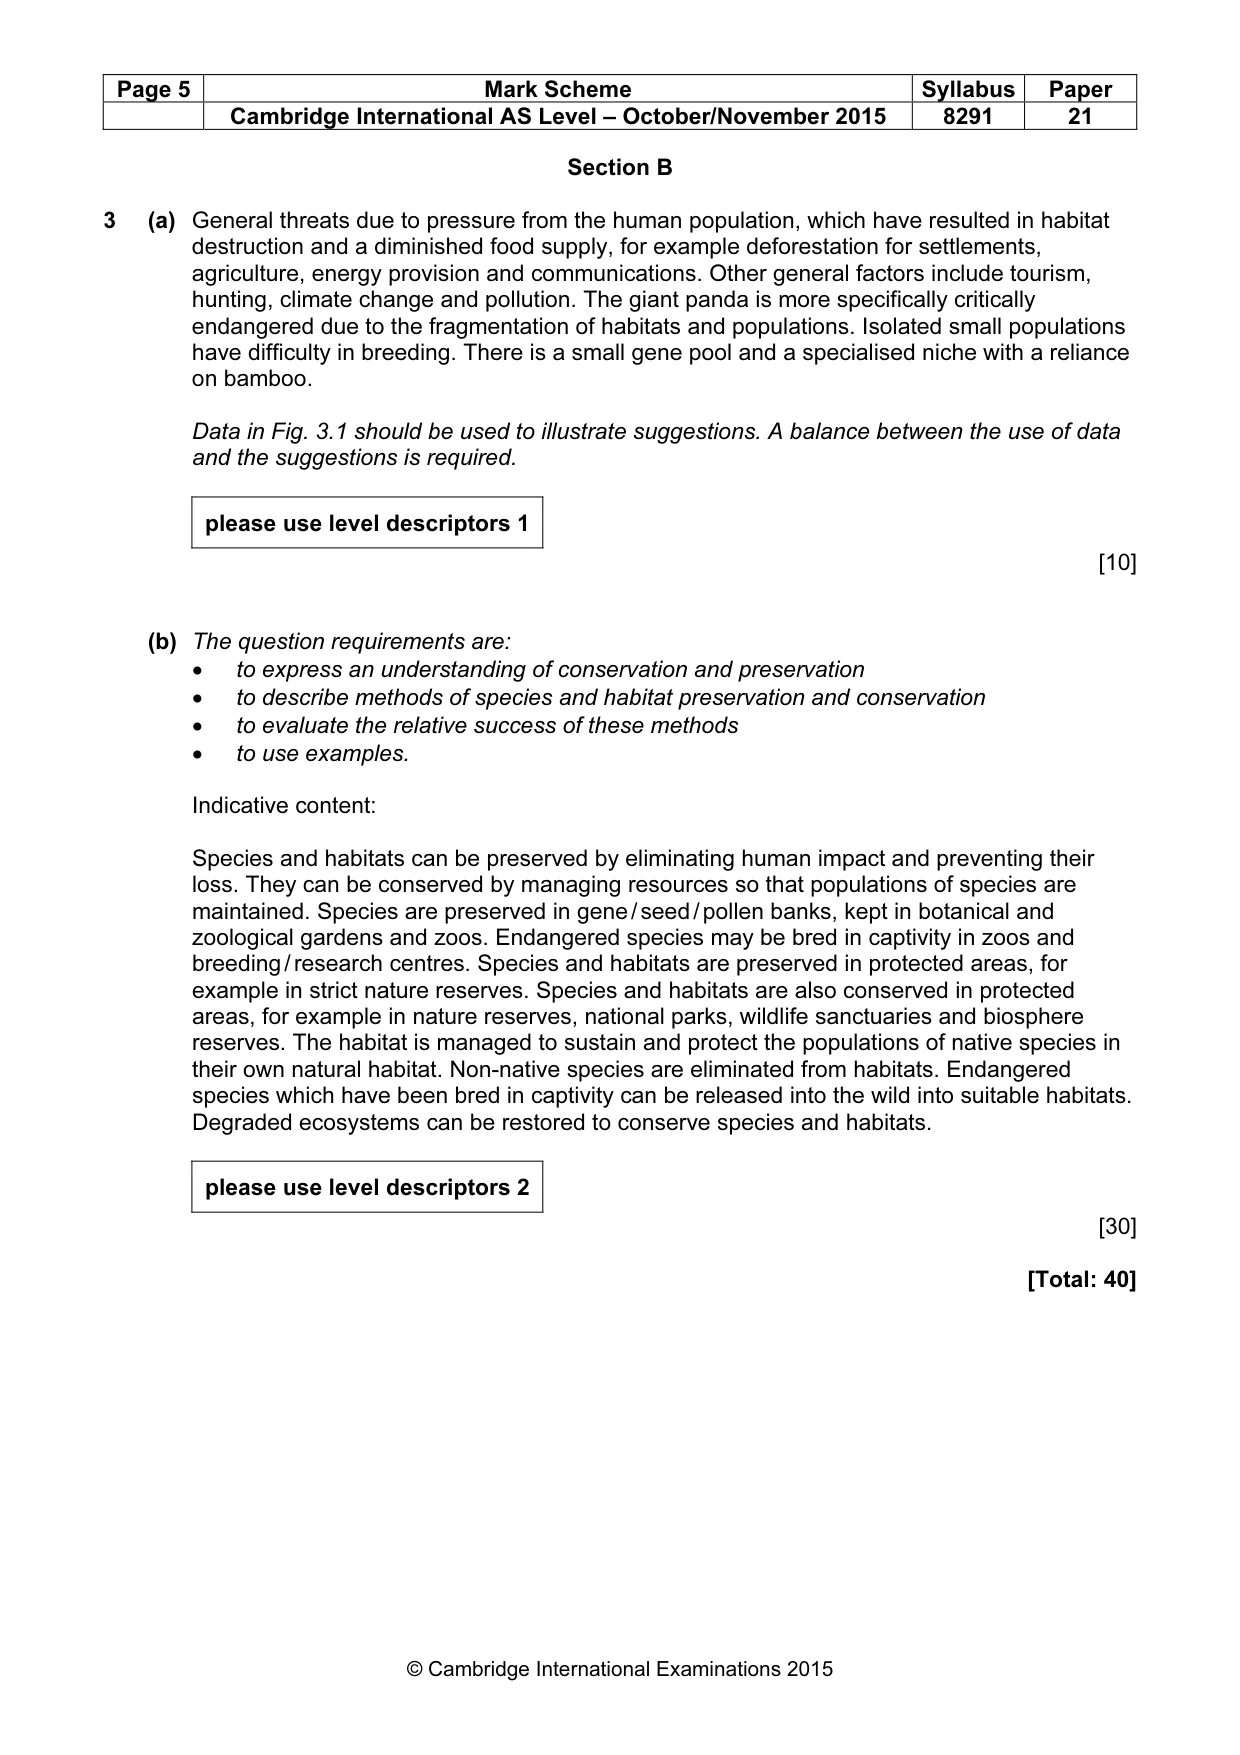
Page 5 Mark Scheme Syllabus Paper Cambridge International AS Level – October/November 2015 8291 21 © Cambridge International Examinations 2015 Section B 3 (a) General threats due to pressure from the human population, which have resulted in habitat destruction and a diminished food supply, for example deforestation for settlements, agriculture, energy provision and communications. Other general factors include tourism, hunting, climate change and pollution. The giant panda is more specifically critically endangered due to the fragmentation of habitats and populations. Isolated small populations have difficulty in breeding. There is a small gene pool and a specialised niche with a reliance on bamboo. Data in Fig. 3.1 should be used to illustrate suggestions. A balance between the use of data and the suggestions is required. please use level descriptors 1 [10] (b) The question requirements are: • to express an understanding of conservation and preservation • to describe methods of species and habitat preservation and conservation • to evaluate the relative success of these methods • to use examples. Indicative content: Species and habitats can be preserved by eliminating human impact and preventing their loss. They can be conserved by managing resources so that populations of species are maintained. Species are preserved in gene / seed / pollen banks, kept in botanical and zoological gardens and zoos. Endangered species may be bred in captivity in zoos and breeding / research centres. Species and habitats are preserved in protected areas, for example in strict nature reserves. Species and habitats are also conserved in protected areas, for example in nature reserves, national parks, wildlife sanctuaries and biosphere reserves. The habitat is managed to sustain and protect the populations of native species in their own natural habitat. Non-native species are eliminated from habitats. Endangered species which have been bred in captivity can be released into the wild into suitable habitats. Degraded ecosystems can be restored to conserve species and habitats. please use level descriptors 2 [30] [Total: 40]
Mark scheme, page 6
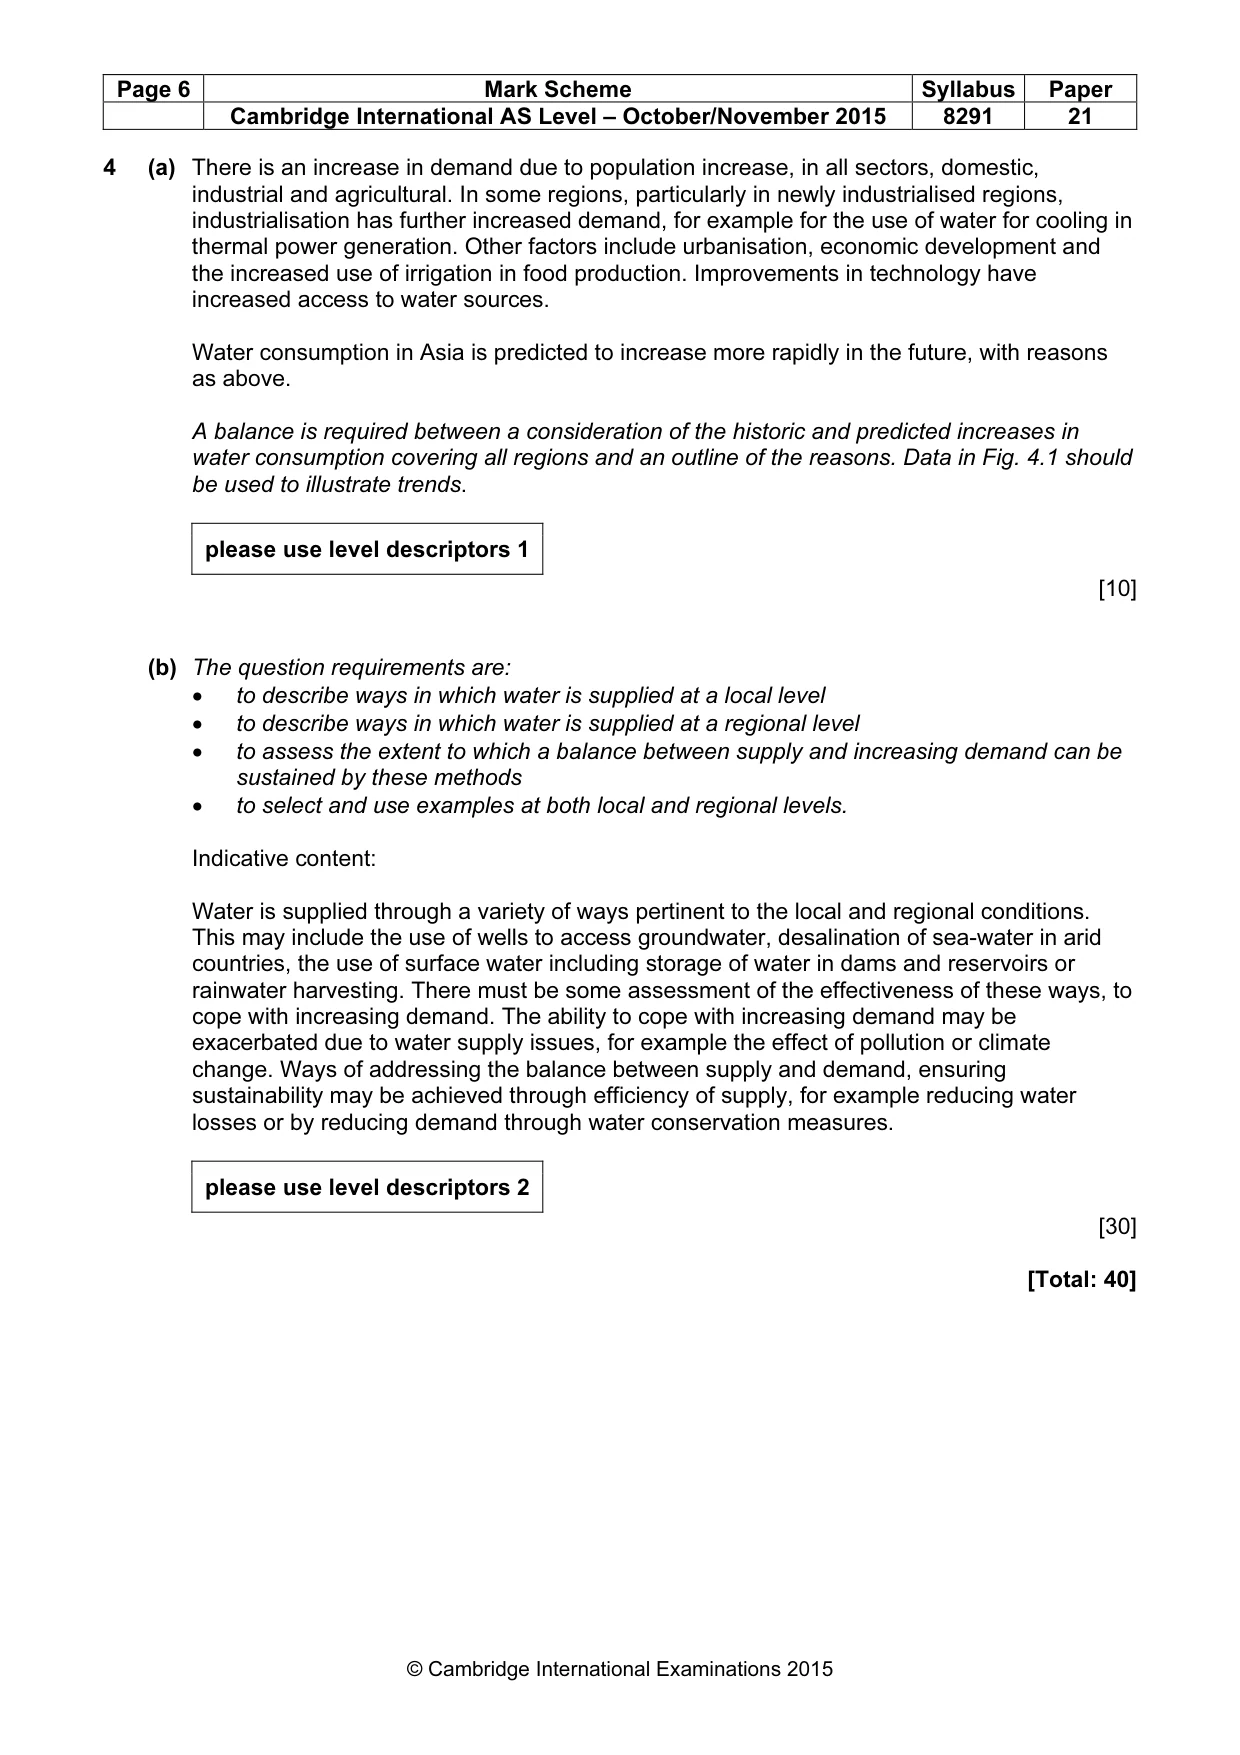
Page 6 Mark Scheme Syllabus Paper Cambridge International AS Level – October/November 2015 8291 21 © Cambridge International Examinations 2015 4 (a) There is an increase in demand due to population increase, in all sectors, domestic, industrial and agricultural. In some regions, particularly in newly industrialised regions, industrialisation has further increased demand, for example for the use of water for cooling in thermal power generation. Other factors include urbanisation, economic development and the increased use of irrigation in food production. Improvements in technology have increased access to water sources. Water consumption in Asia is predicted to increase more rapidly in the future, with reasons as above. A balance is required between a consideration of the historic and predicted increases in water consumption covering all regions and an outline of the reasons. Data in Fig. 4.1 should be used to illustrate trends. please use level descriptors 1 [10] (b) The question requirements are: • to describe ways in which water is supplied at a local level • to describe ways in which water is supplied at a regional level • to assess the extent to which a balance between supply and increasing demand can be sustained by these methods • to select and use examples at both local and regional levels. Indicative content: Water is supplied through a variety of ways pertinent to the local and regional conditions. This may include the use of wells to access groundwater, desalination of sea-water in arid countries, the use of surface water including storage of water in dams and reservoirs or rainwater harvesting. There must be some assessment of the effectiveness of these ways, to cope with increasing demand. The ability to cope with increasing demand may be exacerbated due to water supply issues, for example the effect of pollution or climate change. Ways of addressing the balance between supply and demand, ensuring sustainability may be achieved through efficiency of supply, for example reducing water losses or by reducing demand through water conservation measures. please use level descriptors 2 [30] [Total: 40]
Mark scheme, page 7
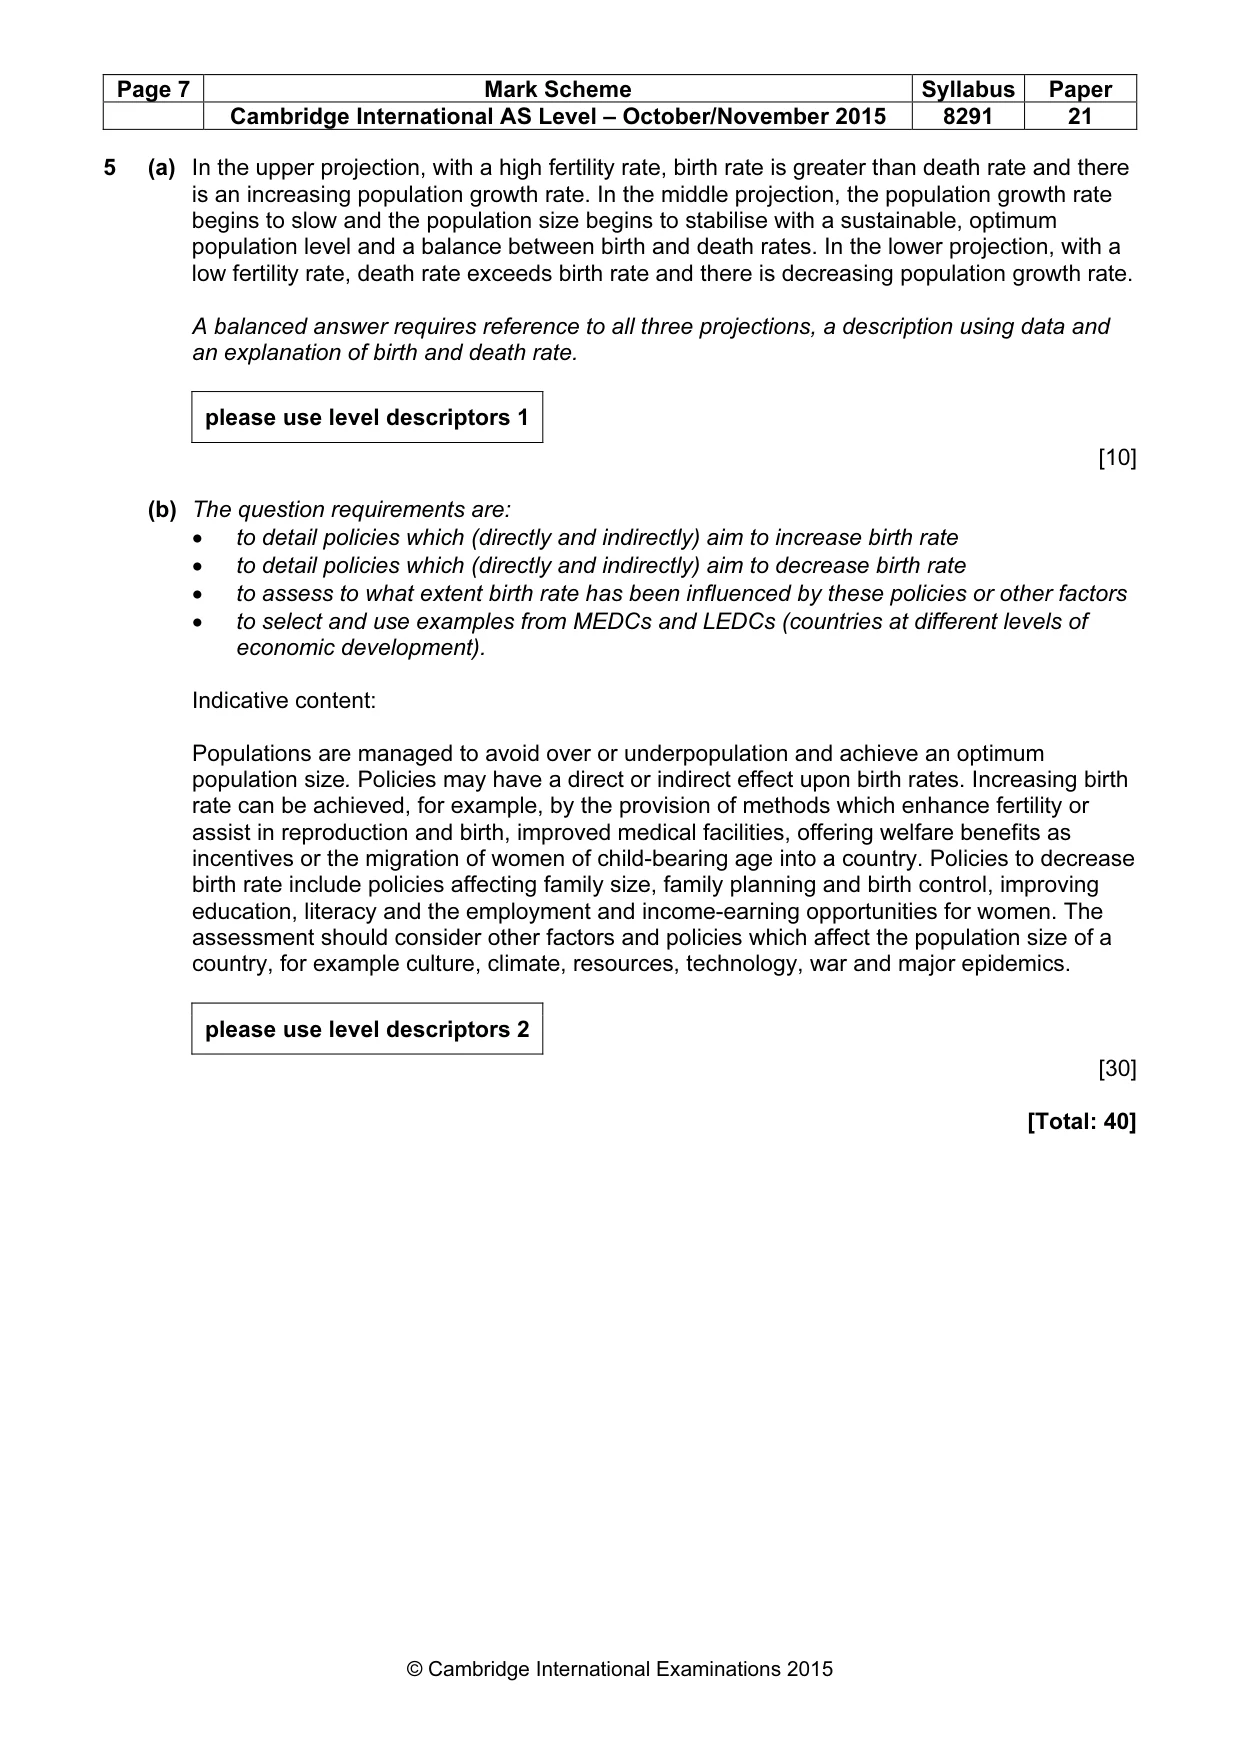
Page 7 Mark Scheme Syllabus Paper Cambridge International AS Level – October/November 2015 8291 21 © Cambridge International Examinations 2015 5 (a) In the upper projection, with a high fertility rate, birth rate is greater than death rate and there is an increasing population growth rate. In the middle projection, the population growth rate begins to slow and the population size begins to stabilise with a sustainable, optimum population level and a balance between birth and death rates. In the lower projection, with a low fertility rate, death rate exceeds birth rate and there is decreasing population growth rate. A balanced answer requires reference to all three projections, a description using data and an explanation of birth and death rate. please use level descriptors 1 [10] (b) The question requirements are: • to detail policies which (directly and indirectly) aim to increase birth rate • to detail policies which (directly and indirectly) aim to decrease birth rate • to assess to what extent birth rate has been influenced by these policies or other factors • to select and use examples from MEDCs and LEDCs (countries at different levels of economic development). Indicative content: Populations are managed to avoid over or underpopulation and achieve an optimum population size. Policies may have a direct or indirect effect upon birth rates. Increasing birth rate can be achieved, for example, by the provision of methods which enhance fertility or assist in reproduction and birth, improved medical facilities, offering welfare benefits as incentives or the migration of women of child-bearing age into a country. Policies to decrease birth rate include policies affecting family size, family planning and birth control, improving education, literacy and the employment and income-earning opportunities for women. The assessment should consider other factors and policies which affect the population size of a country, for example culture, climate, resources, technology, war and major epidemics. please use level descriptors 2 [30] [Total: 40]
Mark scheme, page 8
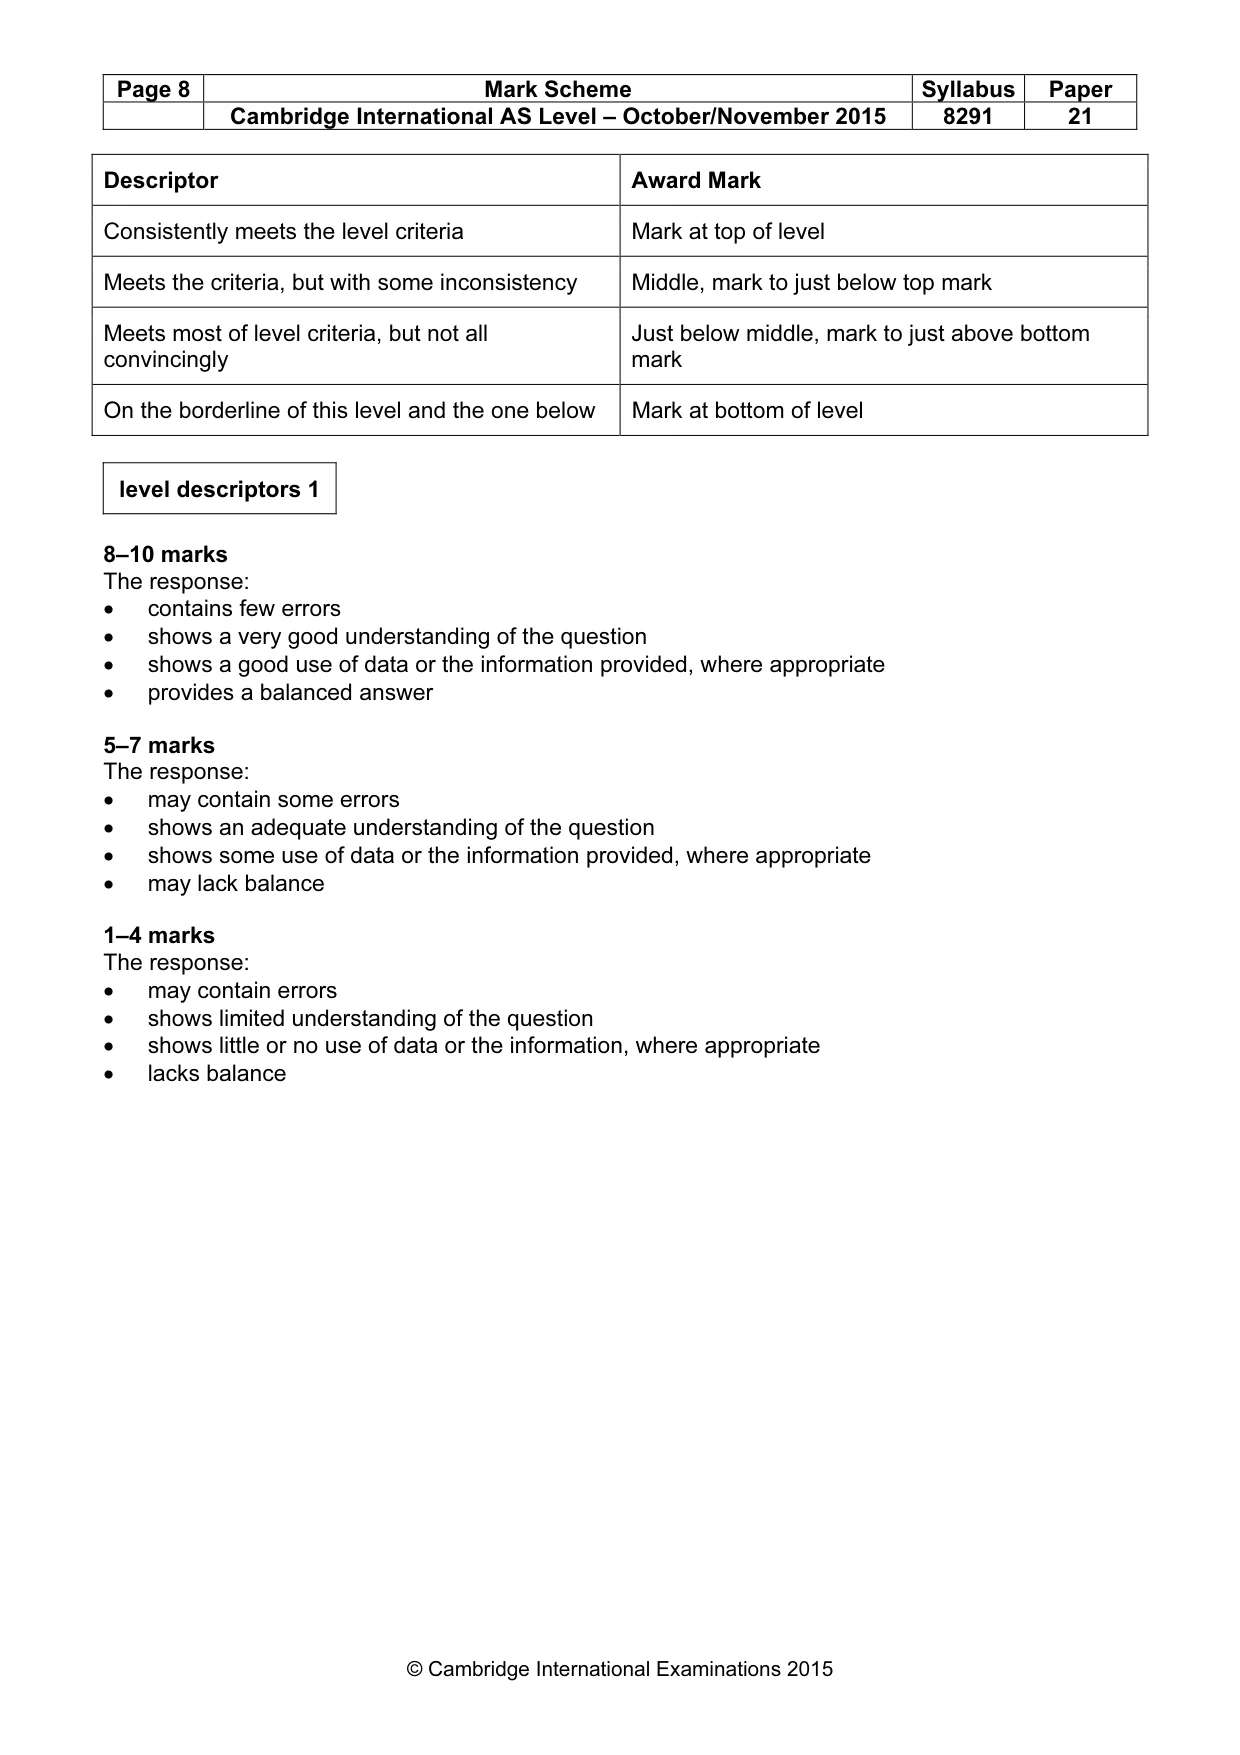
Page 8 Mark Scheme Syllabus Paper Cambridge International AS Level – October/November 2015 8291 21 © Cambridge International Examinations 2015 Descriptor Award Mark Consistently meets the level criteria Mark at top of level Meets the criteria, but with some inconsistency Middle, mark to just below top mark Meets most of level criteria, but not all convincingly Just below middle, mark to just above bottom mark On the borderline of this level and the one below Mark at bottom of level level descriptors 1 8–10 marks The response: • contains few errors • shows a very good understanding of the question • shows a good use of data or the information provided, where appropriate • provides a balanced answer 5–7 marks The response: • may contain some errors • shows an adequate understanding of the question • shows some use of data or the information provided, where appropriate • may lack balance 1–4 marks The response: • may contain errors • shows limited understanding of the question • shows little or no use of data or the information, where appropriate • lacks balance
Mark scheme, page 9
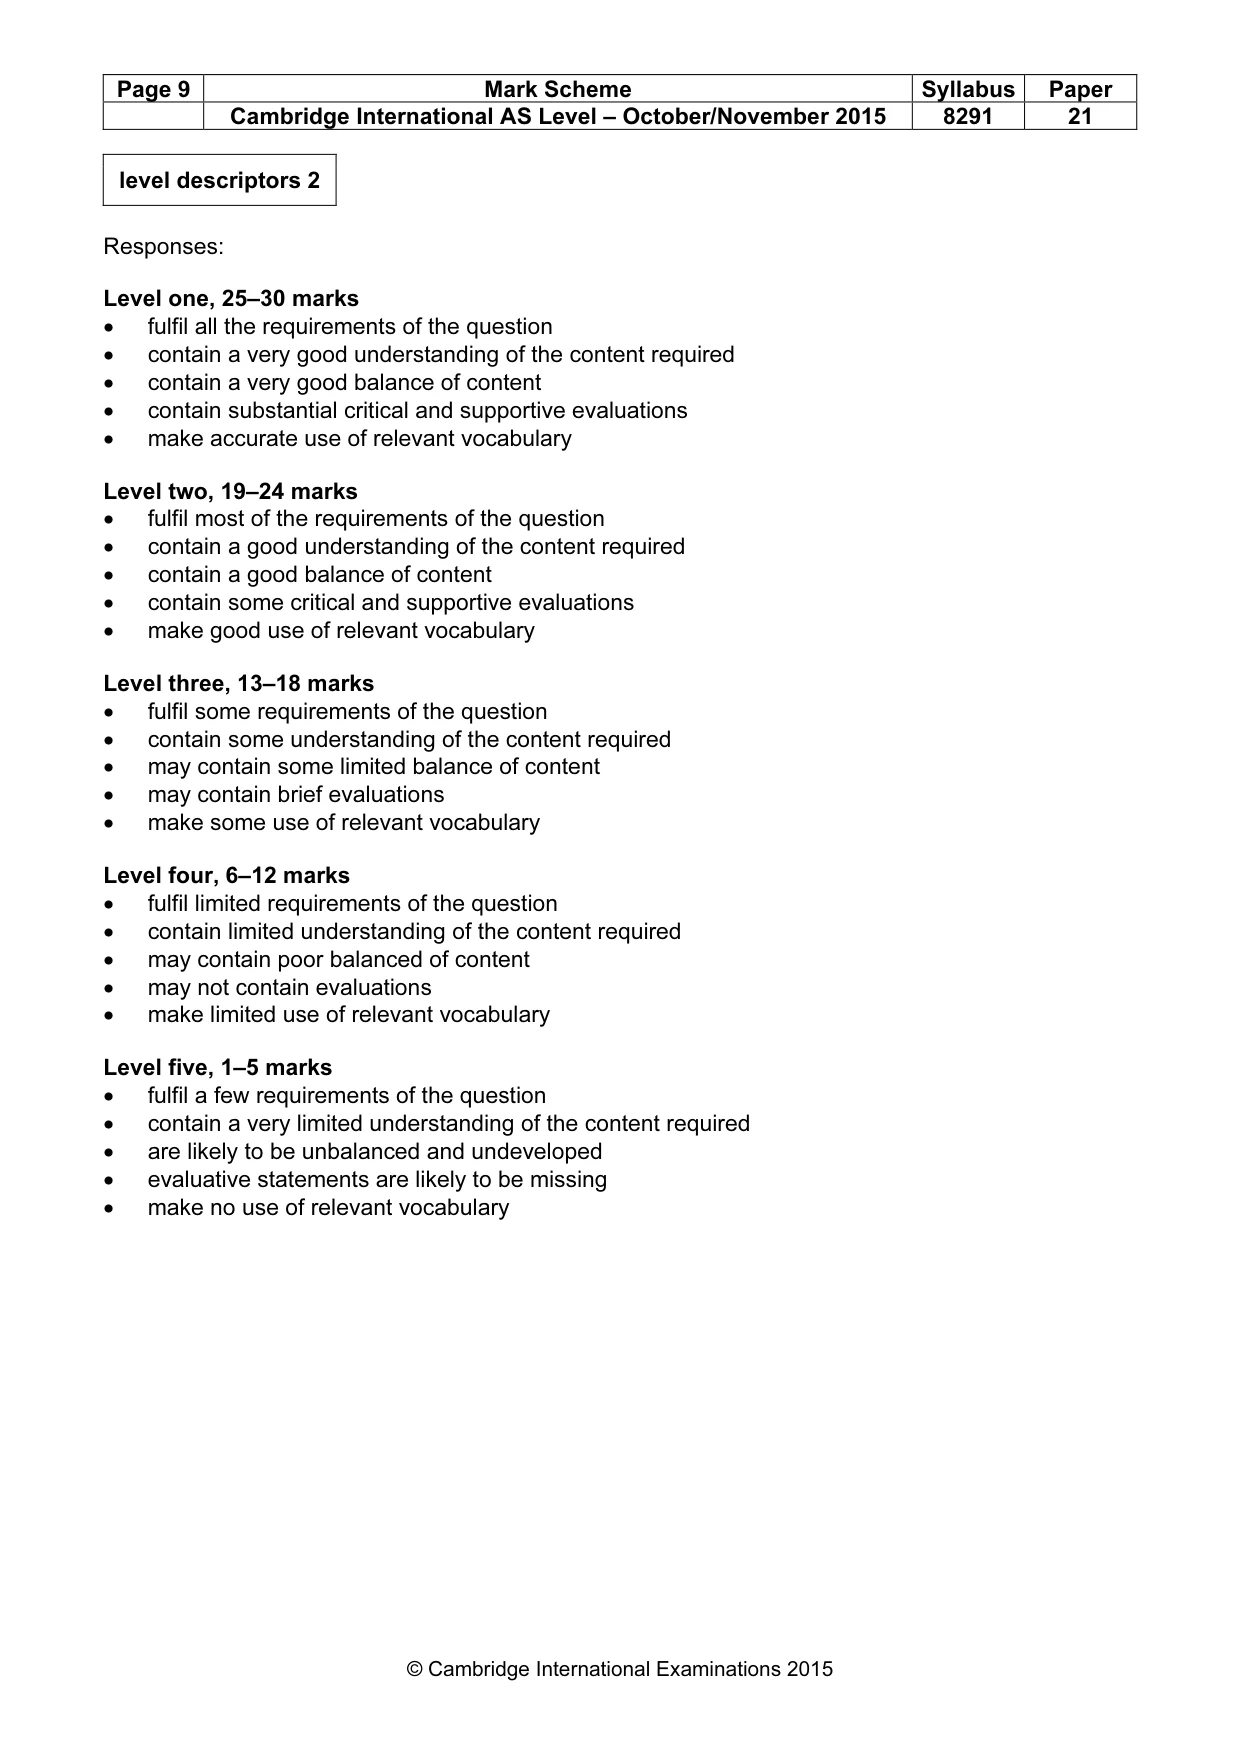
Page 9 Mark Scheme Syllabus Paper Cambridge International AS Level – October/November 2015 8291 21 © Cambridge International Examinations 2015 level descriptors 2 Responses: Level one, 25–30 marks • fulfil all the requirements of the question • contain a very good understanding of the content required • contain a very good balance of content • contain substantial critical and supportive evaluations • make accurate use of relevant vocabulary Level two, 19–24 marks • fulfil most of the requirements of the question • contain a good understanding of the content required • contain a good balance of content • contain some critical and supportive evaluations • make good use of relevant vocabulary Level three, 13–18 marks • fulfil some requirements of the question • contain some understanding of the content required • may contain some limited balance of content • may contain brief evaluations • make some use of relevant vocabulary Level four, 6–12 marks • fulfil limited requirements of the question • contain limited understanding of the content required • may contain poor balanced of content • may not contain evaluations • make limited use of relevant vocabulary Level five, 1–5 marks • fulfil a few requirements of the question • contain a very limited understanding of the content required • are likely to be unbalanced and undeveloped • evaluative statements are likely to be missing • make no use of relevant vocabulary
What you needed in this session
Cambridge’s own grade thresholds for 2015 Oct/Nov, Paper 2 · Variant 1. A higher threshold means an easier paper — the bar moves with how the cohort did.