Cambridge A Level Environmental Management (AS only) 8291 — 2014 Oct/Nov Paper 2 · Variant 1
8291/21/O/N/14 · 80 marks · ≈90 min
The question paper and its mark scheme, free to read here and free to download. This is Cambridge’s own paper, exactly as it was sat.
Question paper16 pages





Mark scheme9 pages
Answers below. Sit the paper first if you are practising.
Paper as text
Question paper, page 1
This document consists of 13 printed pages and 3 blank pages. DC (NH/JG) 83346/4 © UCLES 2014 [Turn over * 8 0 2 9 0 6 0 6 8 4 * ENVIRONMENTAL MANAGEMENT 8291/21 Paper 2 Hydrosphere and Biosphere October/November 2014 1 hour 30 minutes Additional Materials: Answer Booklet/Paper READ THESE INSTRUCTIONS FIRST Write your Centre number, candidate number and name on all the work you hand in. Write in dark blue or black pen. You may use an HB pencil for any diagrams or graphs. Do not use staples, paper clips, glue or correction fluid. DO NOT WRITE IN ANY BARCODES. Electronic calculators may be used. You may lose marks if you do not show your working or if you do not use appropriate units. Section A Answer all questions. Write your answers in the spaces provided on the question paper. Section B Answer one question from this section. Answer the question on the separate answer paper provided. At the end of the examination, 1. fasten all separate answer paper securely to the question paper; 2. enter the question number from Section B in the grid opposite. Cambridge International Examinations Cambridge International Advanced Subsidiary Level For Examiner’s Use Section A 1 2 Section B Total
Question paper, page 2
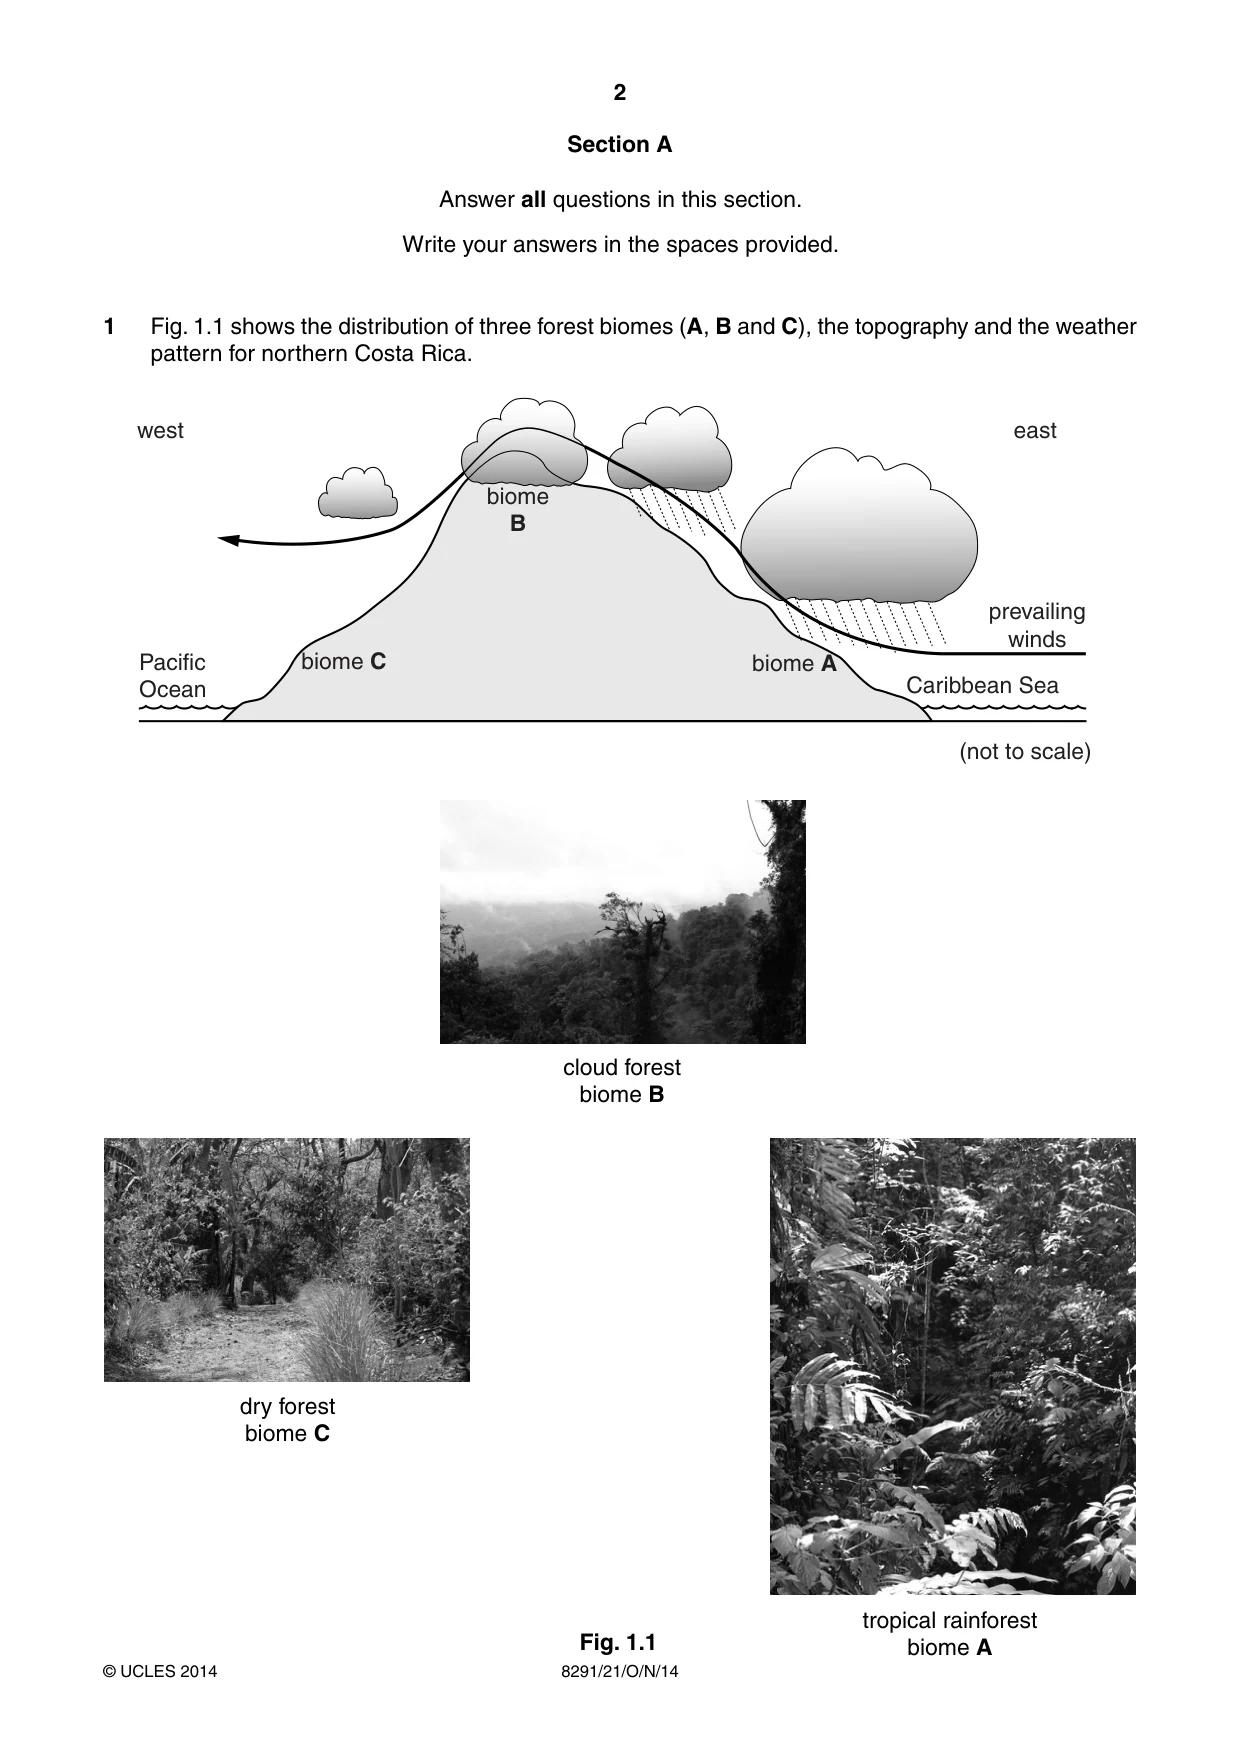
2 8291/21/O/N/14 © UCLES 2014 Section A Answer all questions in this section. Write your answers in the spaces provided. 1 Fig. 1.1 shows the distribution of three forest biomes (A, B and C), the topography and the weather pattern for northern Costa Rica. west east Caribbean Sea Pacific Ocean prevailing winds biome A biome B biome C (not to scale) cloud forest biome B tropical rainforest biome A dry forest biome C Fig. 1.1
Question paper, page 3
3 8291/21/O/N/14 © UCLES 2014 [Turn over (a) (i) Describe the characteristics of the vegetation in each of the biomes labelled A, B and C shown in Fig. 1.1. A … … … … B … … … … C … … … …[6] (ii) Briefly describe the conditions which have enabled the formation of biomes A and B shown in Fig. 1.1. … … … … … … … …[4]
Question paper, page 4
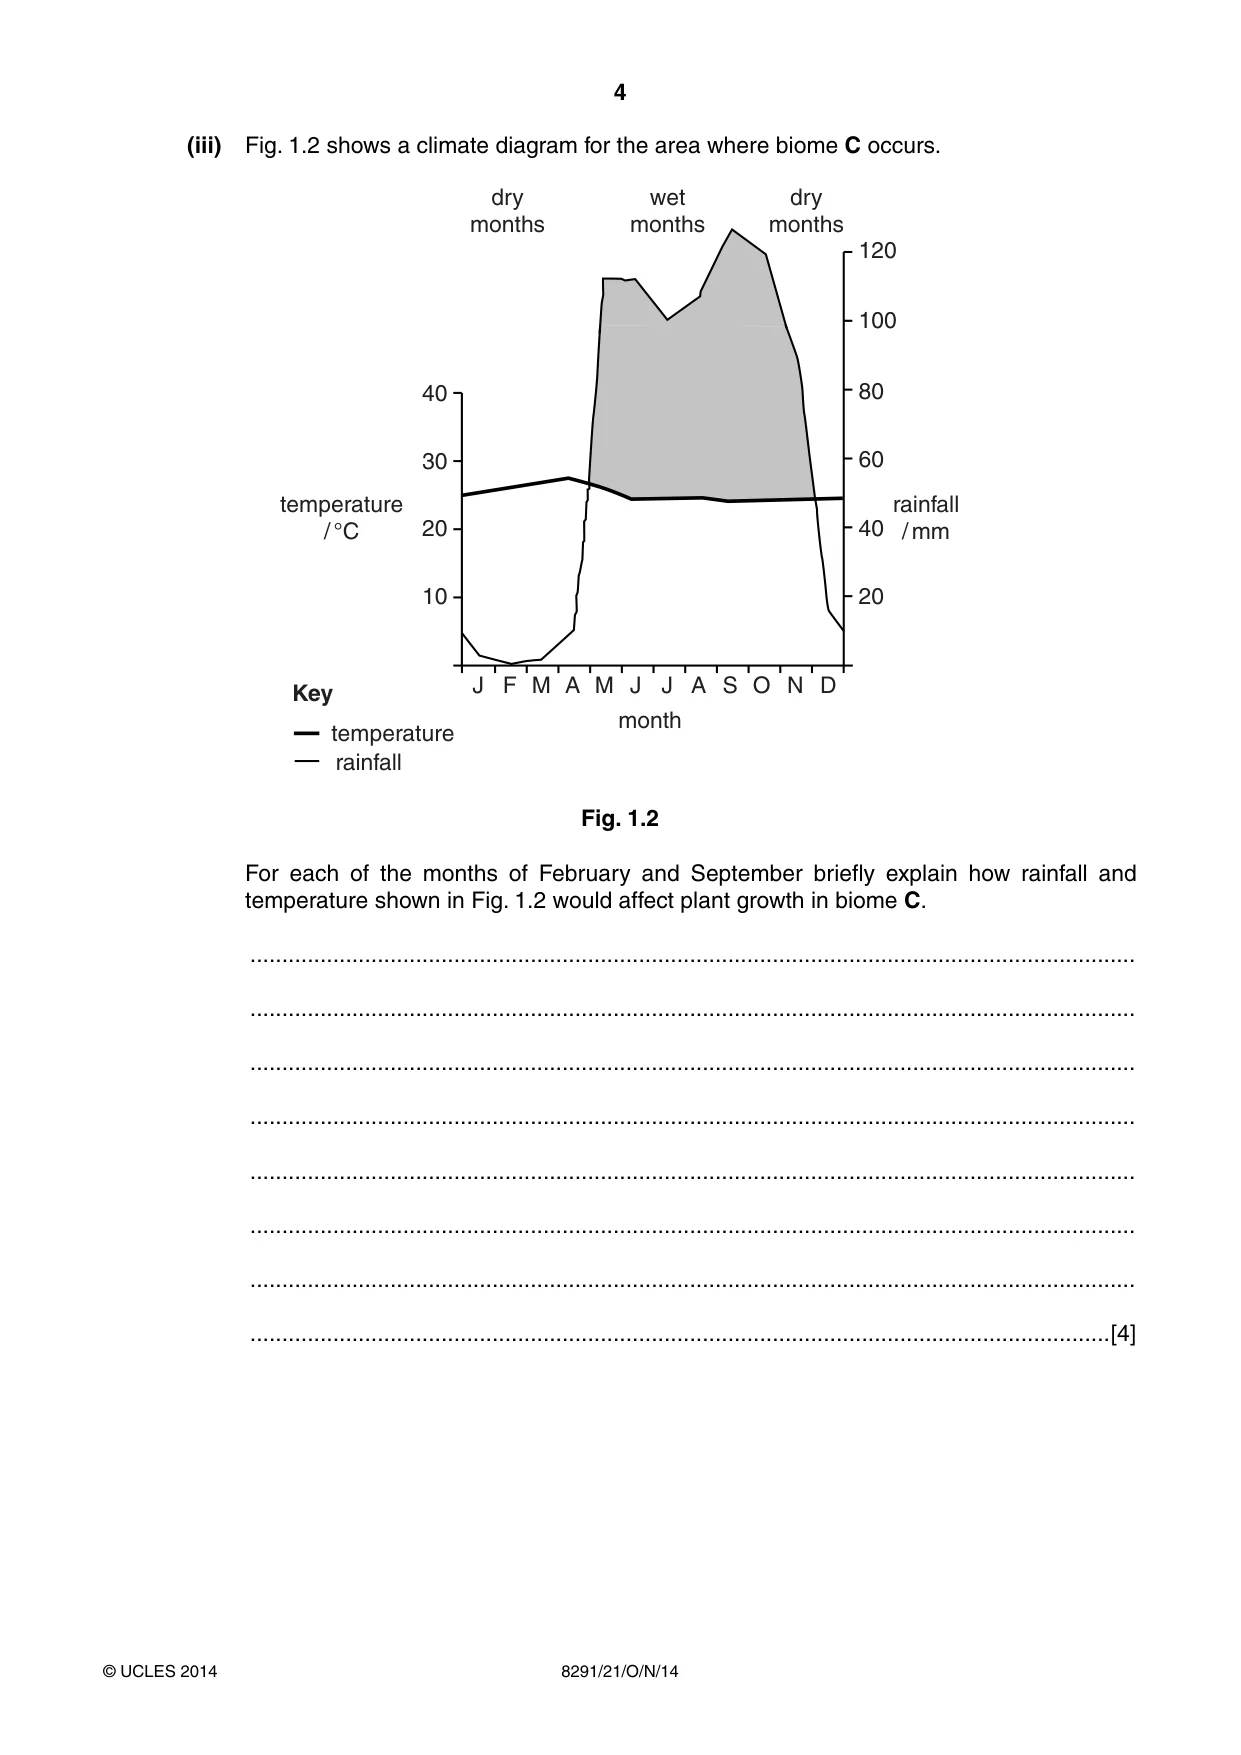
4 8291/21/O/N/14 © UCLES 2014 (iii) Fig. 1.2 shows a climate diagram for the area where biome C occurs. J F M A M J J A S O N D 40 30 20 10 20 40 60 80 100 120 month temperature / °C rainfall / mm dry months dry months wet months Key rainfall temperature Fig. 1.2 For each of the months of February and September briefly explain how rainfall and temperature shown in Fig. 1.2 would affect plant growth in biome C. … … … … … … … …[4]
Question paper, page 5
5 8291/21/O/N/14 © UCLES 2014 [Turn over (b) Guanacaste National Park in Costa Rica, located within biome C shown in Fig. 1.1, was created in 1989 to conserve this biome, using forest restoration from remaining isolated patches of forest. Suggest what measures could be taken to encourage sustainable use of forest within the Guanacaste National Park. … … … … … … … … … … … …[6] [Total: 20]
Question paper, page 6
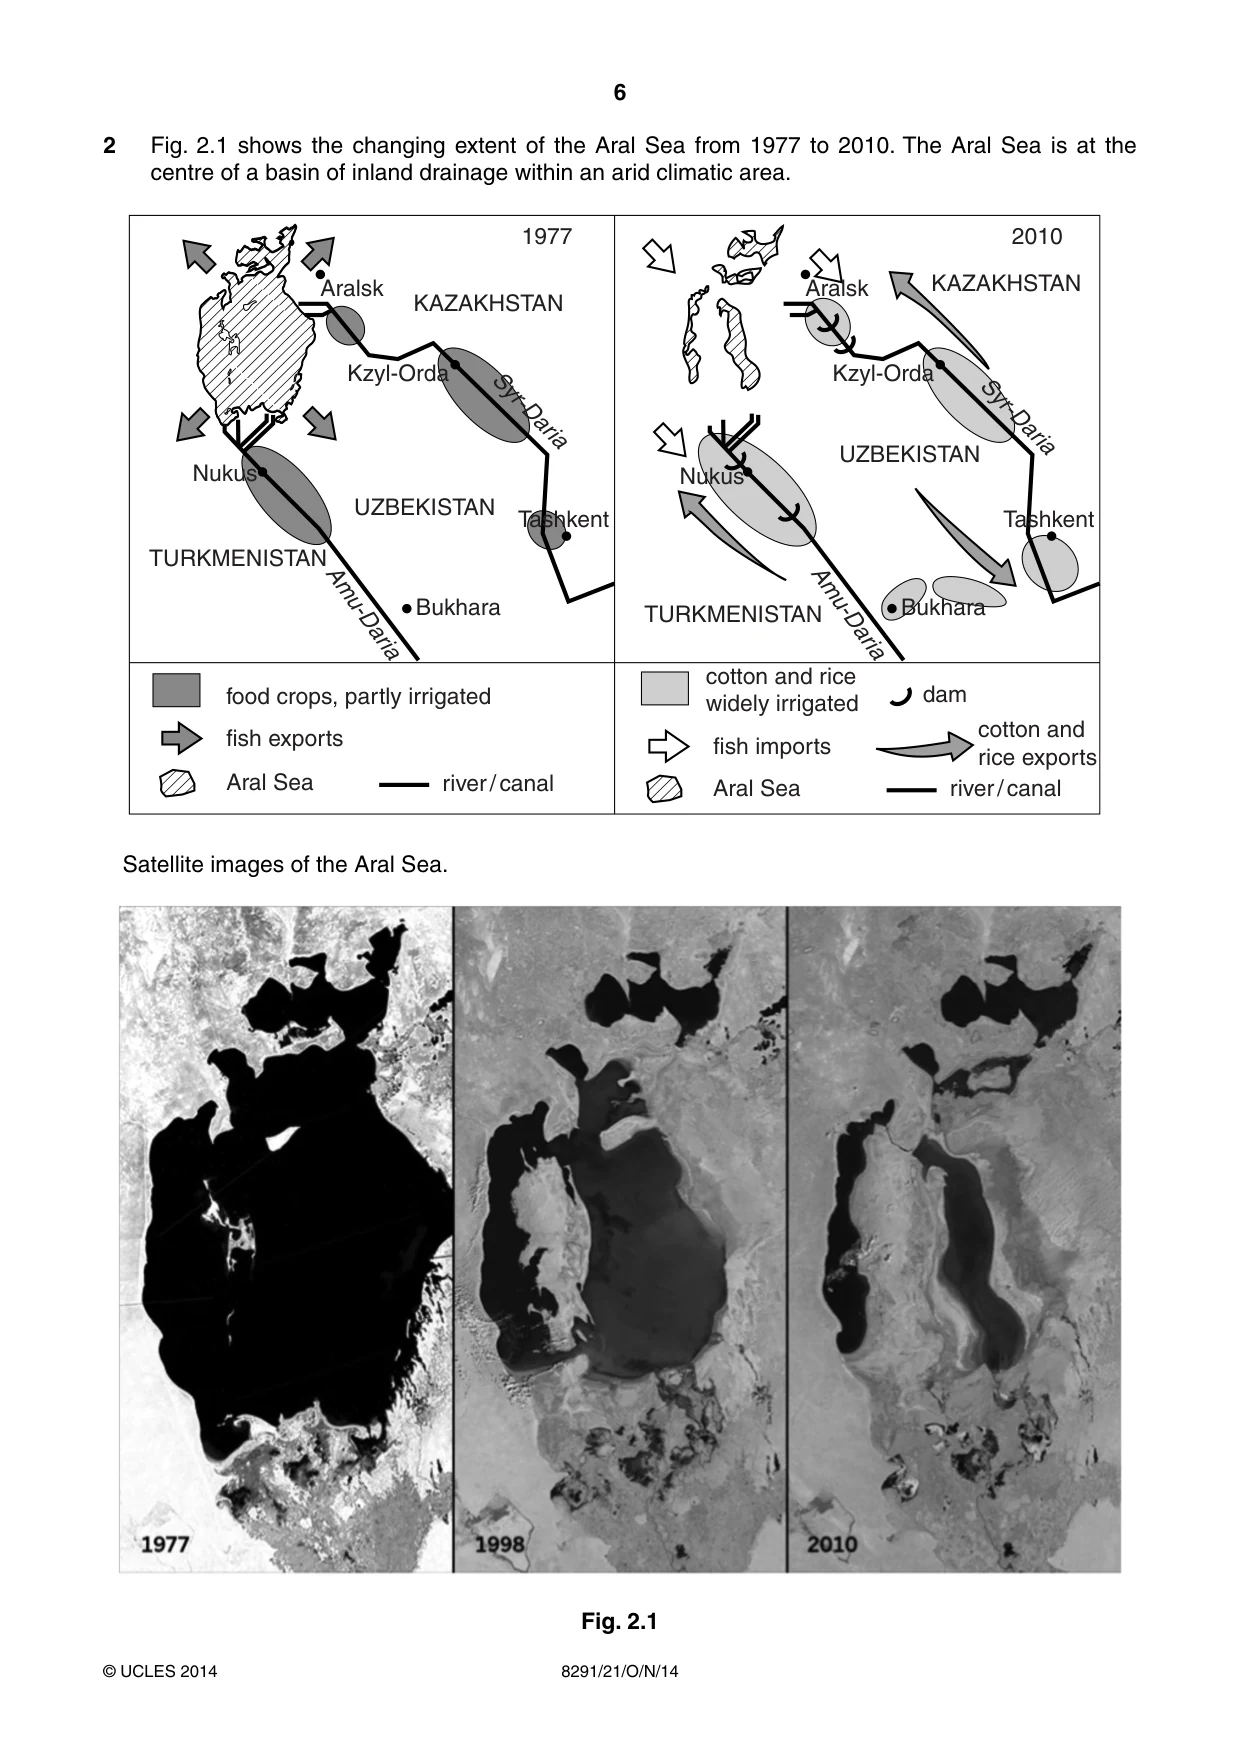
6 8291/21/O/N/14 © UCLES 2014 2 Fig. 2.1 shows the changing extent of the Aral Sea from 1977 to 2010. The Aral Sea is at the centre of a basin of inland drainage within an arid climatic area. KAZAKHSTAN UZBEKISTAN TURKMENISTAN Nukus Bukhara Tashkent Kzyl-Orda Aralsk Amu-Daria Syr-Daria 1977 2010 food crops, partly irrigated Aral Sea river / canal fish exports KAZAKHSTAN UZBEKISTAN TURKMENISTAN Nukus Bukhara Tashkent Kzyl-Orda Aralsk Amu-Daria fish imports dam cotton and rice widely irrigated cotton and rice exports Aral Sea Syr-Daria river / canal Satellite images of the Aral Sea. Fig. 2.1
Question paper, page 7
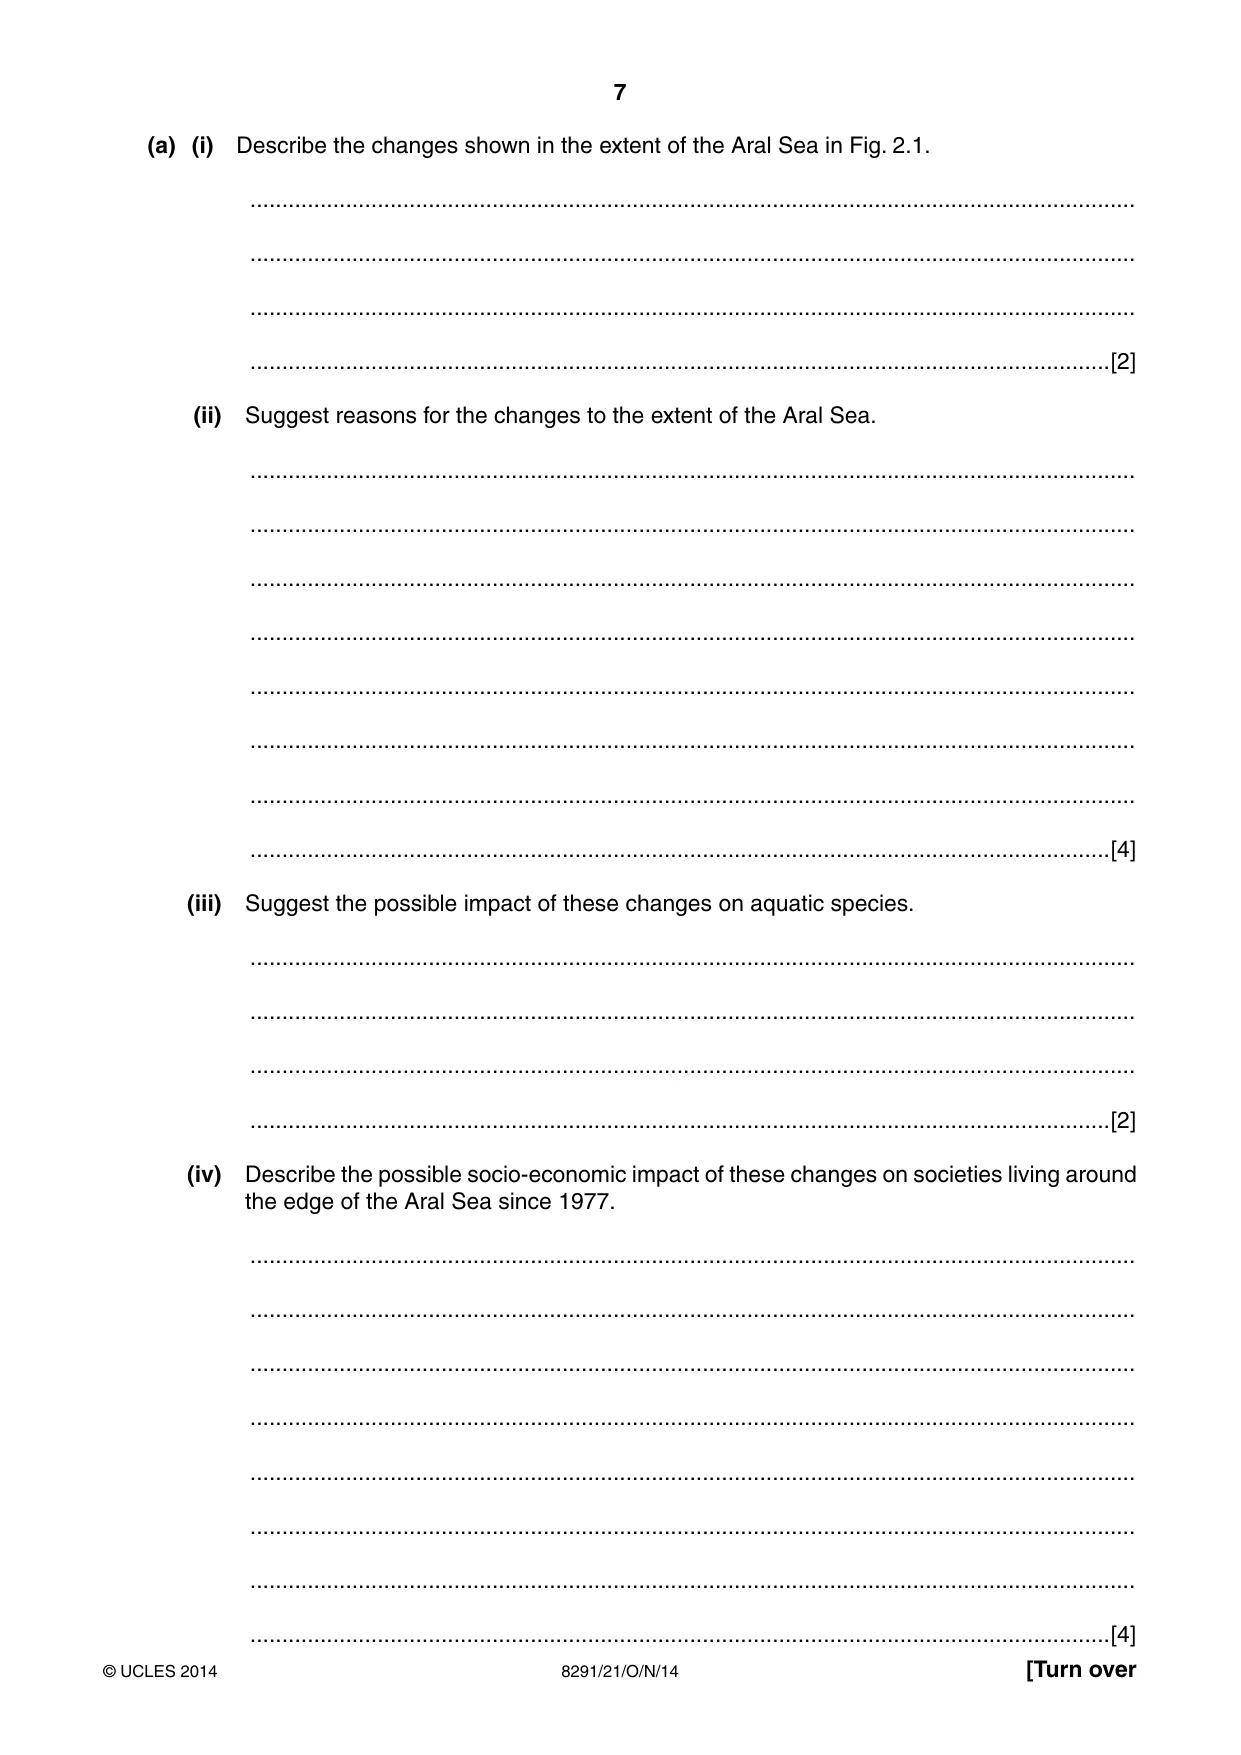
7 8291/21/O/N/14 © UCLES 2014 [Turn over (a) (i) Describe the changes shown in the extent of the Aral Sea in Fig. 2.1. … … … …[2] (ii) Suggest reasons for the changes to the extent of the Aral Sea. … … … … … … … …[4] (iii) Suggest the possible impact of these changes on aquatic species. … … … …[2] (iv) Describe the possible socio-economic impact of these changes on societies living around the edge of the Aral Sea since 1977. … … … … … … … …[4]
Question paper, page 8
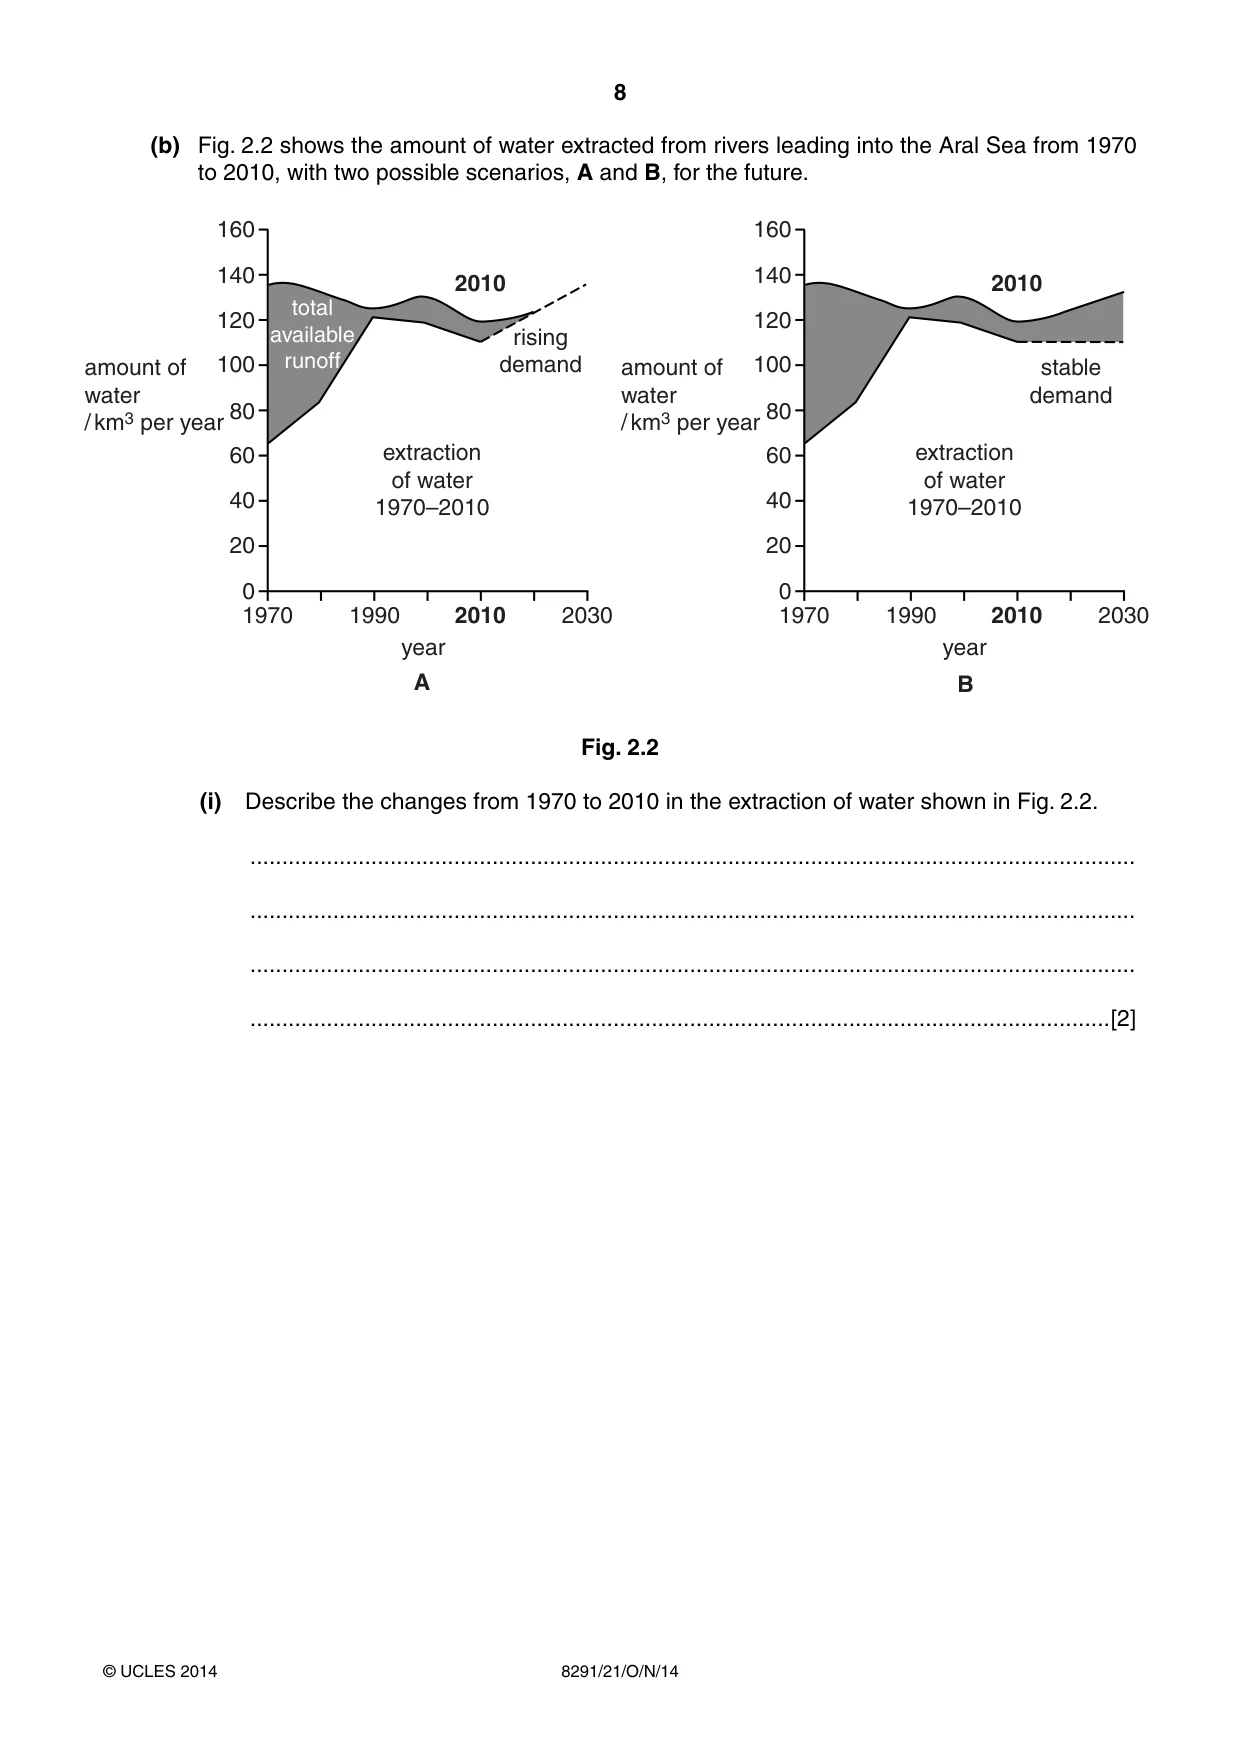
8 8291/21/O/N/14 © UCLES 2014 (b) Fig. 2.2 shows the amount of water extracted from rivers leading into the Aral Sea from 1970 to 2010, with two possible scenarios, A and B, for the future. 160 amount of water / km3 per year amount of water / km3 per year 140 120 100 80 60 40 20 0 1970 1990 extraction of water 1970–2010 2010 2010 2030 rising demand 160 140 120 100 80 60 40 20 0 1970 1990 extraction of water 1970–2010 2010 2010 2030 stable demand A B total available runoff year year Fig. 2.2 (i) Describe the changes from 1970 to 2010 in the extraction of water shown in Fig. 2.2. … … … …[2]
Question paper, page 9
9 8291/21/O/N/14 © UCLES 2014 [Turn over (ii) Describe and explain the possible effect of the two future scenarios, A and B, on the extent of the Aral Sea. A … … … … … … B … … … … … …[6] [Total: 20]
Question paper, page 10
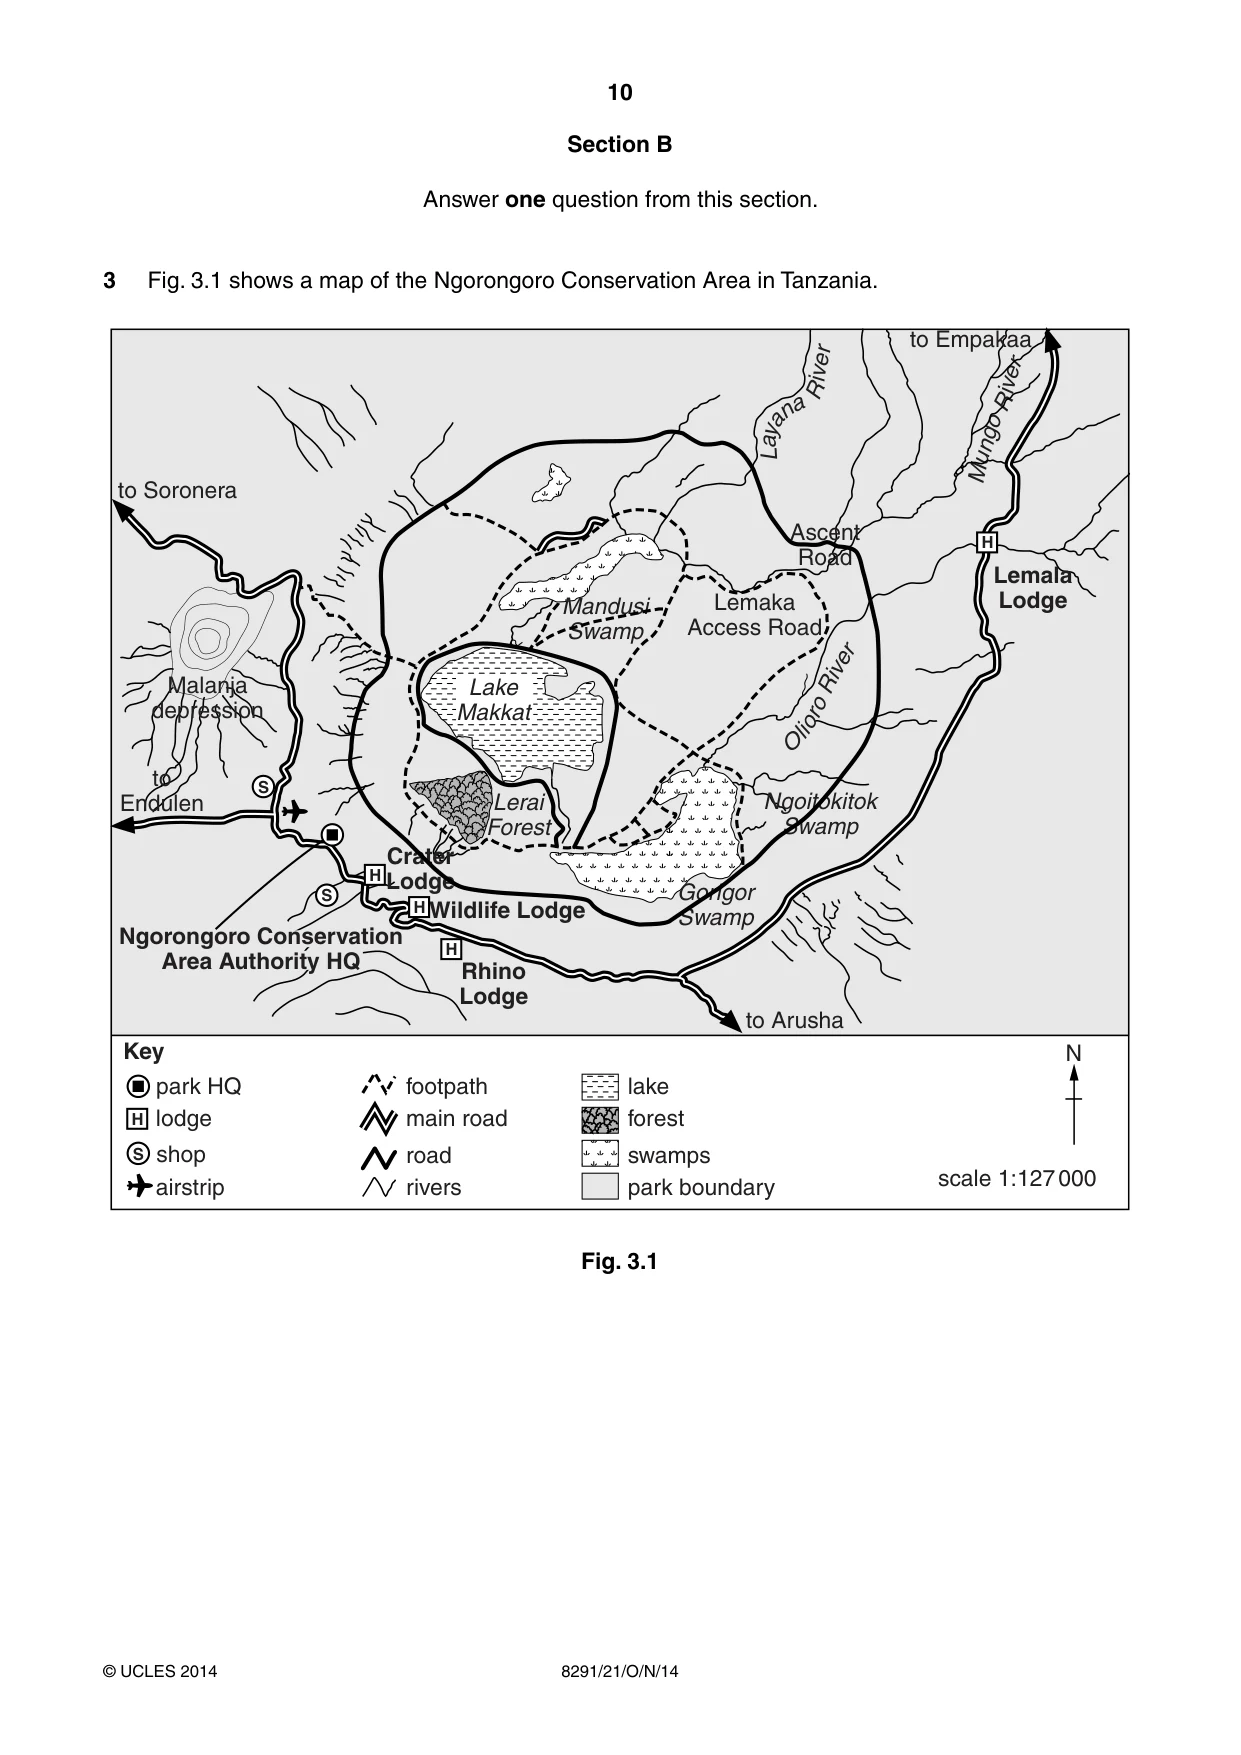
10 8291/21/O/N/14 © UCLES 2014 Section B Answer one question from this section. 3 Fig. 3.1 shows a map of the Ngorongoro Conservation Area in Tanzania. lake footpath main road road rivers park HQ lodge shop airstrip forest swamps park boundary N scale 1:127 000 L a y a n a R i v e r M ung o R iv e r Ascent Road Lemaka Access Road Mandusi Swamp Gorigor Swamp Ngoitokitok Swamp O l i o ro Riv er to Arusha Rhino Lodge Malanja depression Lerai Forest Wildlife Lodge Crater Lodge Lake Makkat S S S H H H H H to Soronera to Empakaa to Endulen Lemala Lodge Key Ngorongoro Conservation Area Authority HQ Fig. 3.1
Question paper, page 11
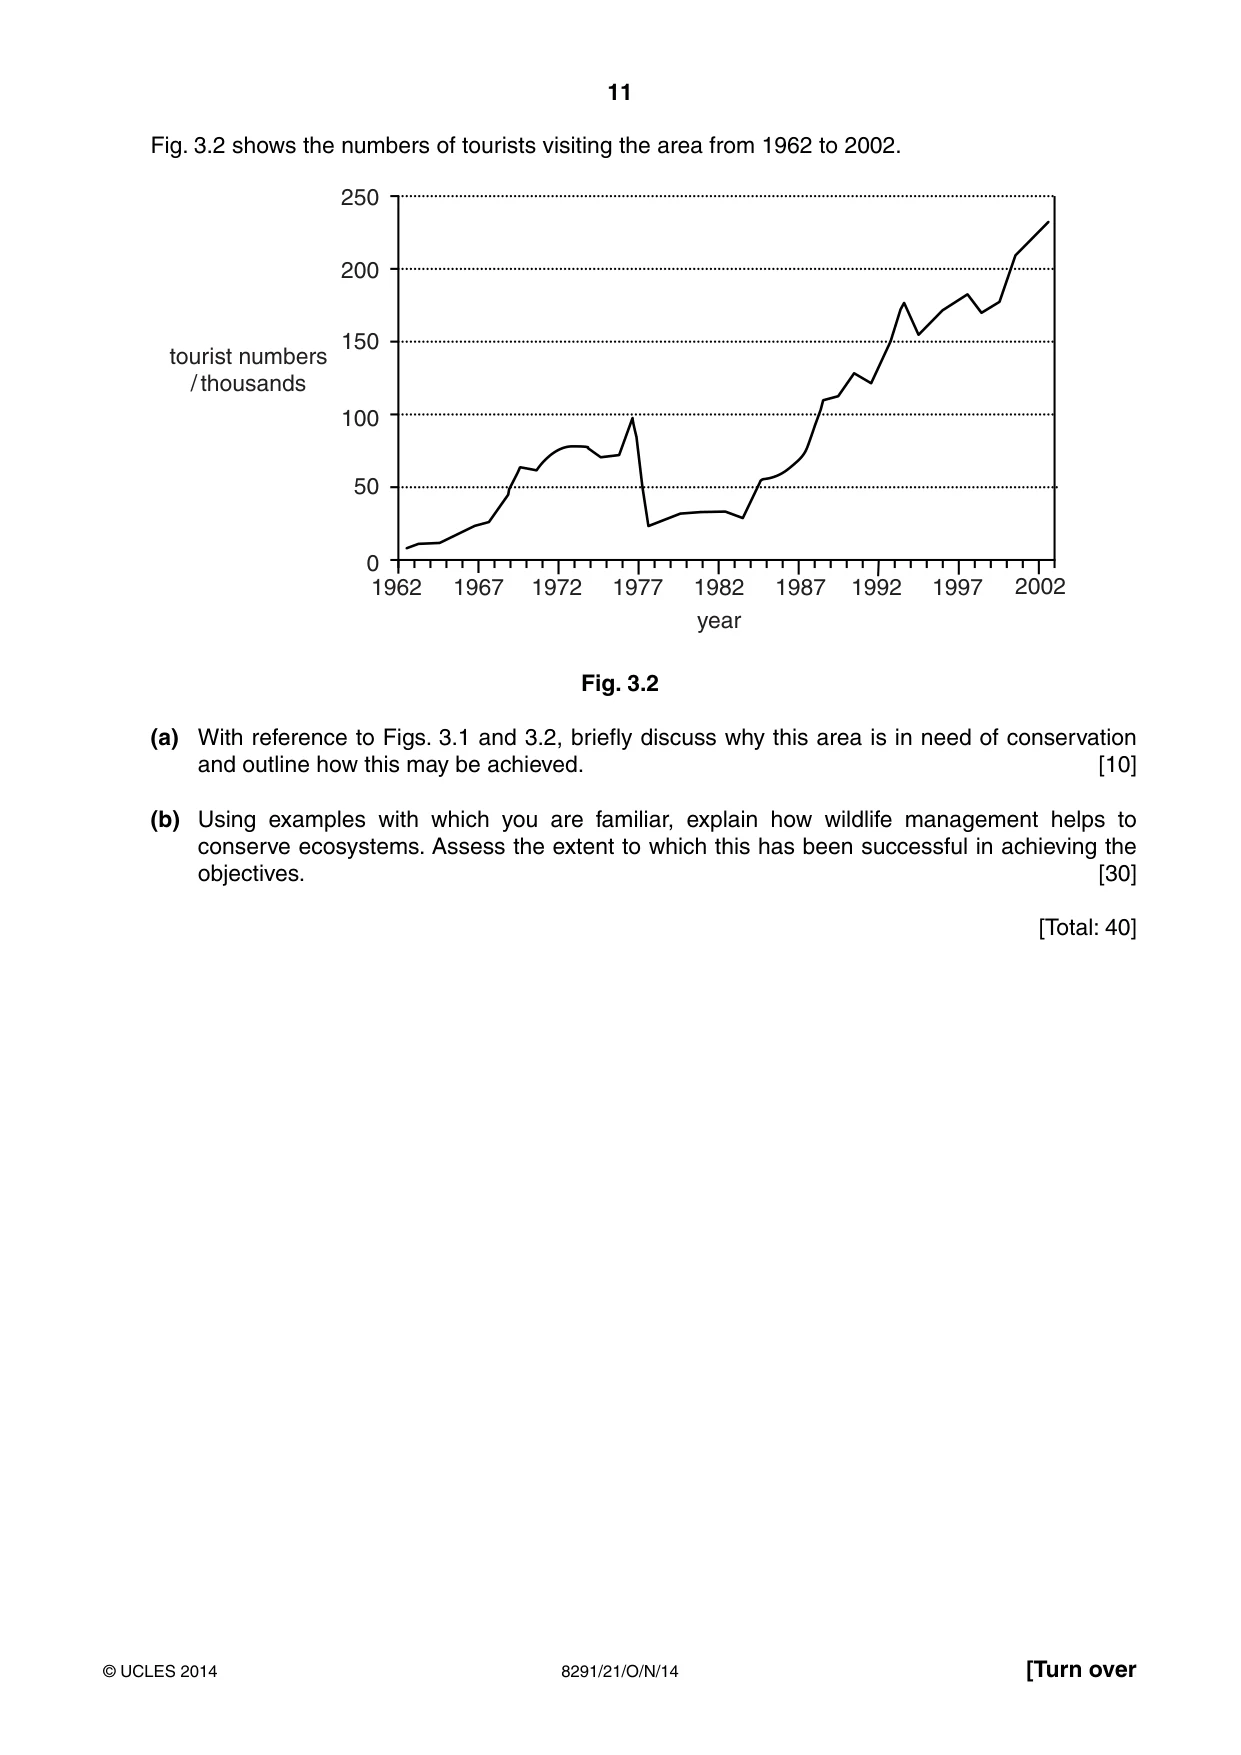
11 8291/21/O/N/14 © UCLES 2014 [Turn over Fig. 3.2 shows the numbers of tourists visiting the area from 1962 to 2002. 1962 1967 1972 1977 1982 year 1987 1992 1997 2002 0 50 100 150 200 250 tourist numbers / thousands Fig. 3.2 (a) With reference to Figs. 3.1 and 3.2, briefly discuss why this area is in need of conservation and outline how this may be achieved. [10] (b) Using examples with which you are familiar, explain how wildlife management helps to conserve ecosystems. Assess the extent to which this has been successful in achieving the objectives. [30] [Total: 40]
Question paper, page 12
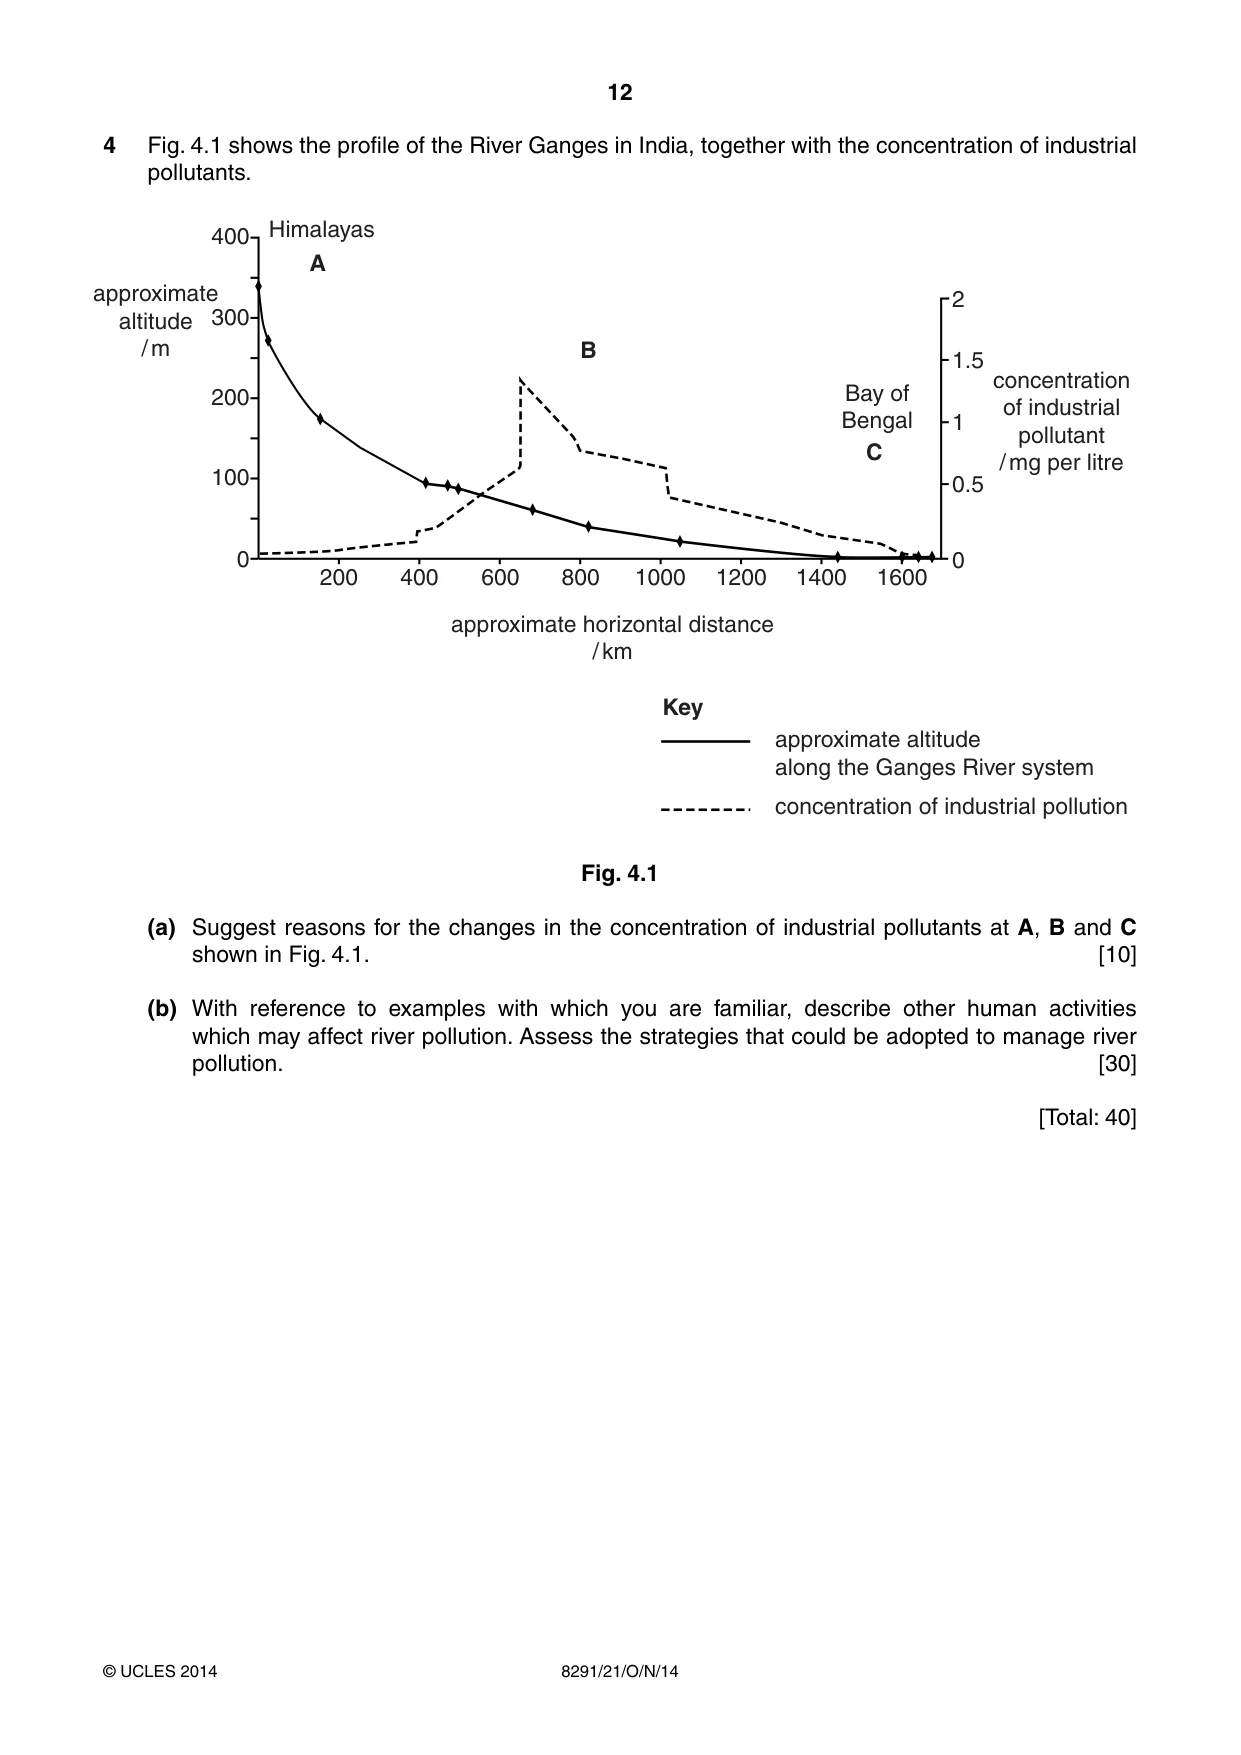
12 8291/21/O/N/14 © UCLES 2014 4 Fig. 4.1 shows the profile of the River Ganges in India, together with the concentration of industrial pollutants. approximate altitude / m 0 200 200 400 600 800 100 300 400 0 0.5 1 1.5 2 1000 1200 1400 1600 concentration of industrial pollutant / mg per litre Himalayas A B Bay of Bengal C approximate horizontal distance / km approximate altitude along the Ganges River system concentration of industrial pollution Key Fig. 4.1 (a) Suggest reasons for the changes in the concentration of industrial pollutants at A, B and C shown in Fig. 4.1. [10] (b) With reference to examples with which you are familiar, describe other human activities which may affect river pollution. Assess the strategies that could be adopted to manage river pollution. [30] [Total: 40]
Question paper, page 13
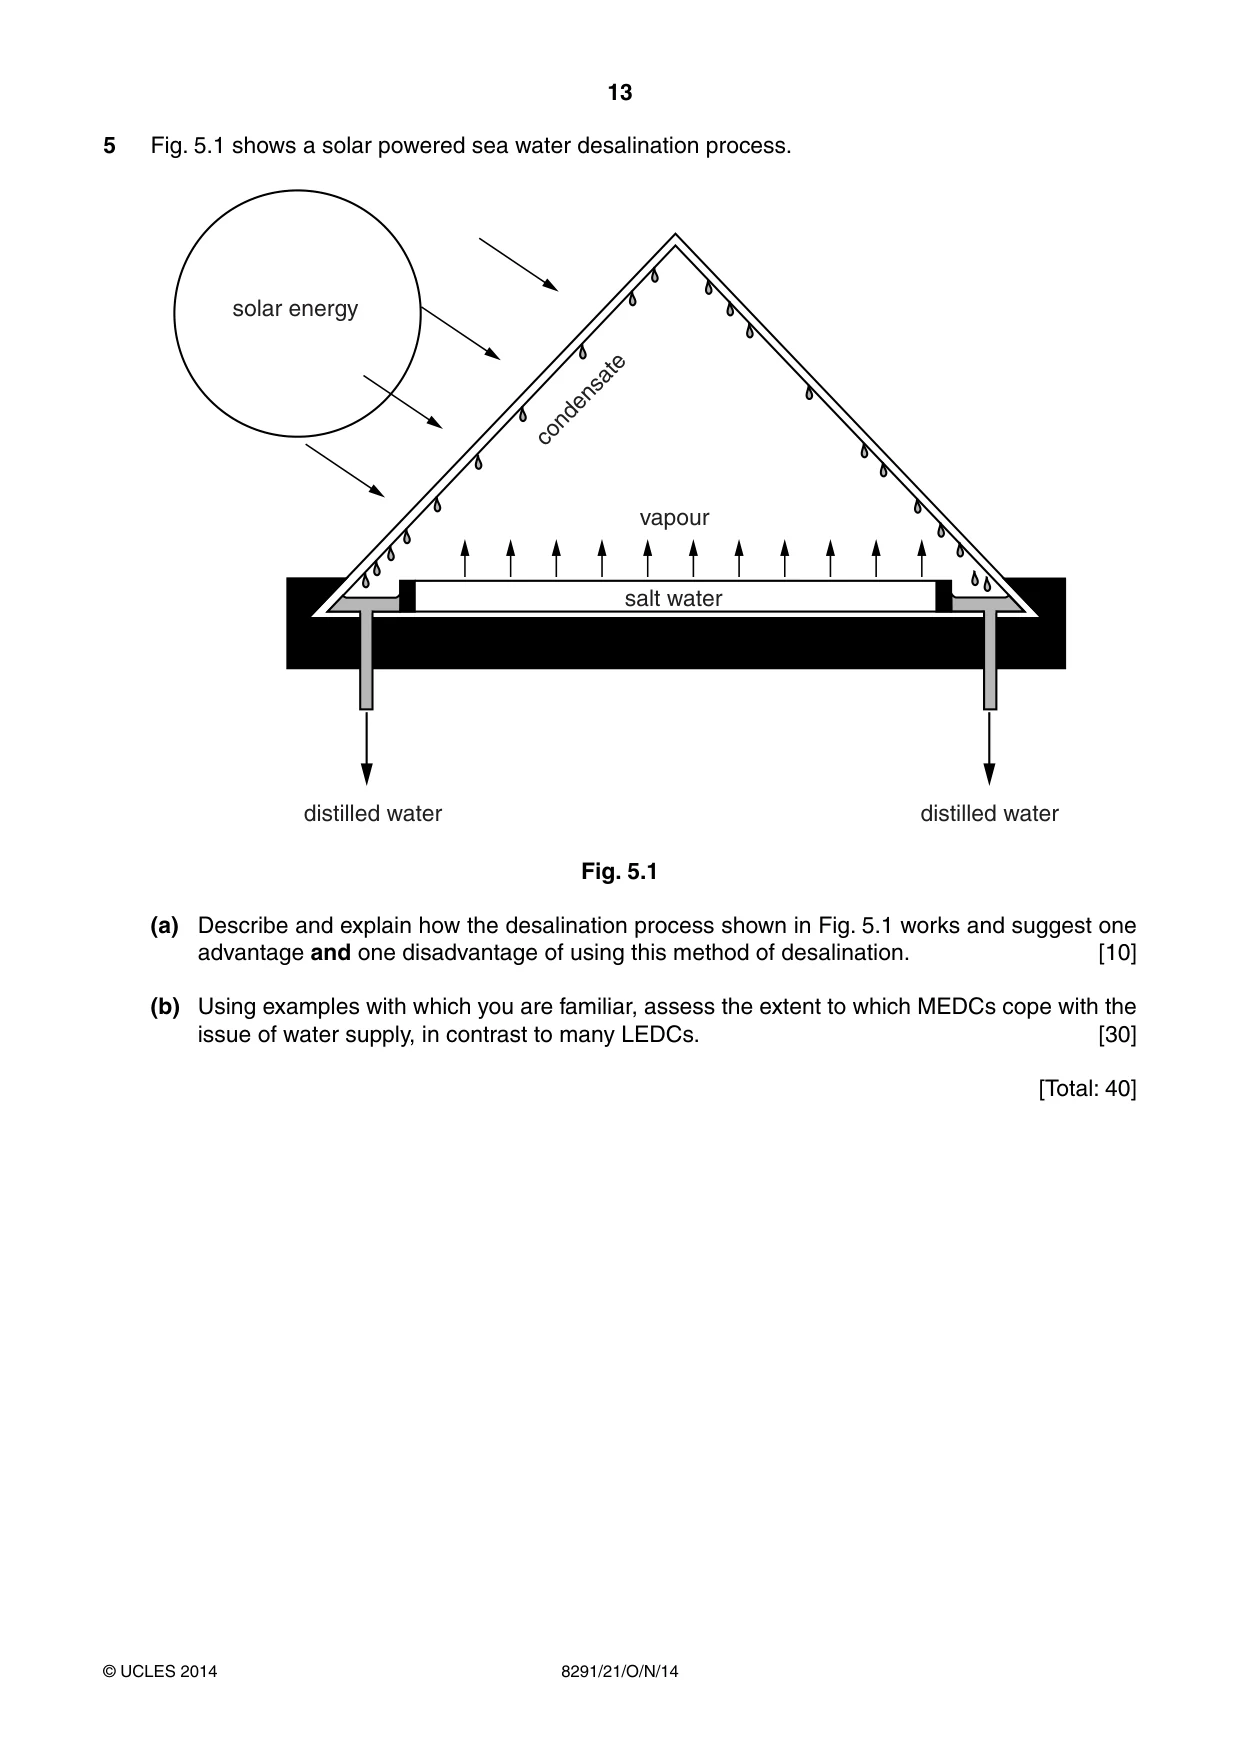
13 8291/21/O/N/14 © UCLES 2014 5 Fig. 5.1 shows a solar powered sea water desalination process. salt water distilled water distilled water condensate vapour solar energy Fig. 5.1 (a) Describe and explain how the desalination process shown in Fig. 5.1 works and suggest one advantage and one disadvantage of using this method of desalination. [10] (b) Using examples with which you are familiar, assess the extent to which MEDCs cope with the issue of water supply, in contrast to many LEDCs. [30] [Total: 40]
Question paper, page 14
14 8291/21/O/N/14 © UCLES 2014 BLANK PAGE
Question paper, page 15
15 8291/21/O/N/14 © UCLES 2014 BLANK PAGE
Question paper, page 16
16 8291/21/O/N/14 © UCLES 2014 Copyright Acknowledgement: Question 1 Fig. 1.1 Joan Pearson © UCLES. Question 2 Fig. 2.1 © USGS EROS Data Center. Permission to reproduce items where third-party owned material protected by copyright is included has been sought and cleared where possible. Every reasonable effort has been made by the publisher (UCLES) to trace copyright holders, but if any items requiring clearance have unwittingly been included, the publisher will be pleased to make amends at the earliest possible opportunity. Cambridge International Examinations is part of the Cambridge Assessment Group. Cambridge Assessment is the brand name of University of Cambridge Local Examinations Syndicate (UCLES), which is itself a department of the University of Cambridge. BLANK PAGE
Mark scheme, page 1
® IGCSE is the registered trademark of Cambridge International Examinations. CAMBRIDGE INTERNATIONAL EXAMINATIONS Cambridge International Advanced Subsidiary and Advanced Level MARK SCHEME for the October/November 2014 series 8291 ENVIRONMENTAL MANAGEMENT 8291/21 Paper 2, maximum raw mark 80 This mark scheme is published as an aid to teachers and candidates, to indicate the requirements of the examination. It shows the basis on which Examiners were instructed to award marks. It does not indicate the details of the discussions that took place at an Examiners’ meeting before marking began, which would have considered the acceptability of alternative answers. Mark schemes should be read in conjunction with the question paper and the Principal Examiner Report for Teachers. Cambridge will not enter into discussions about these mark schemes. Cambridge is publishing the mark schemes for the October/November 2014 series for most Cambridge IGCSE®, Cambridge International A and AS Level components and some Cambridge O Level components.
Mark scheme, page 2
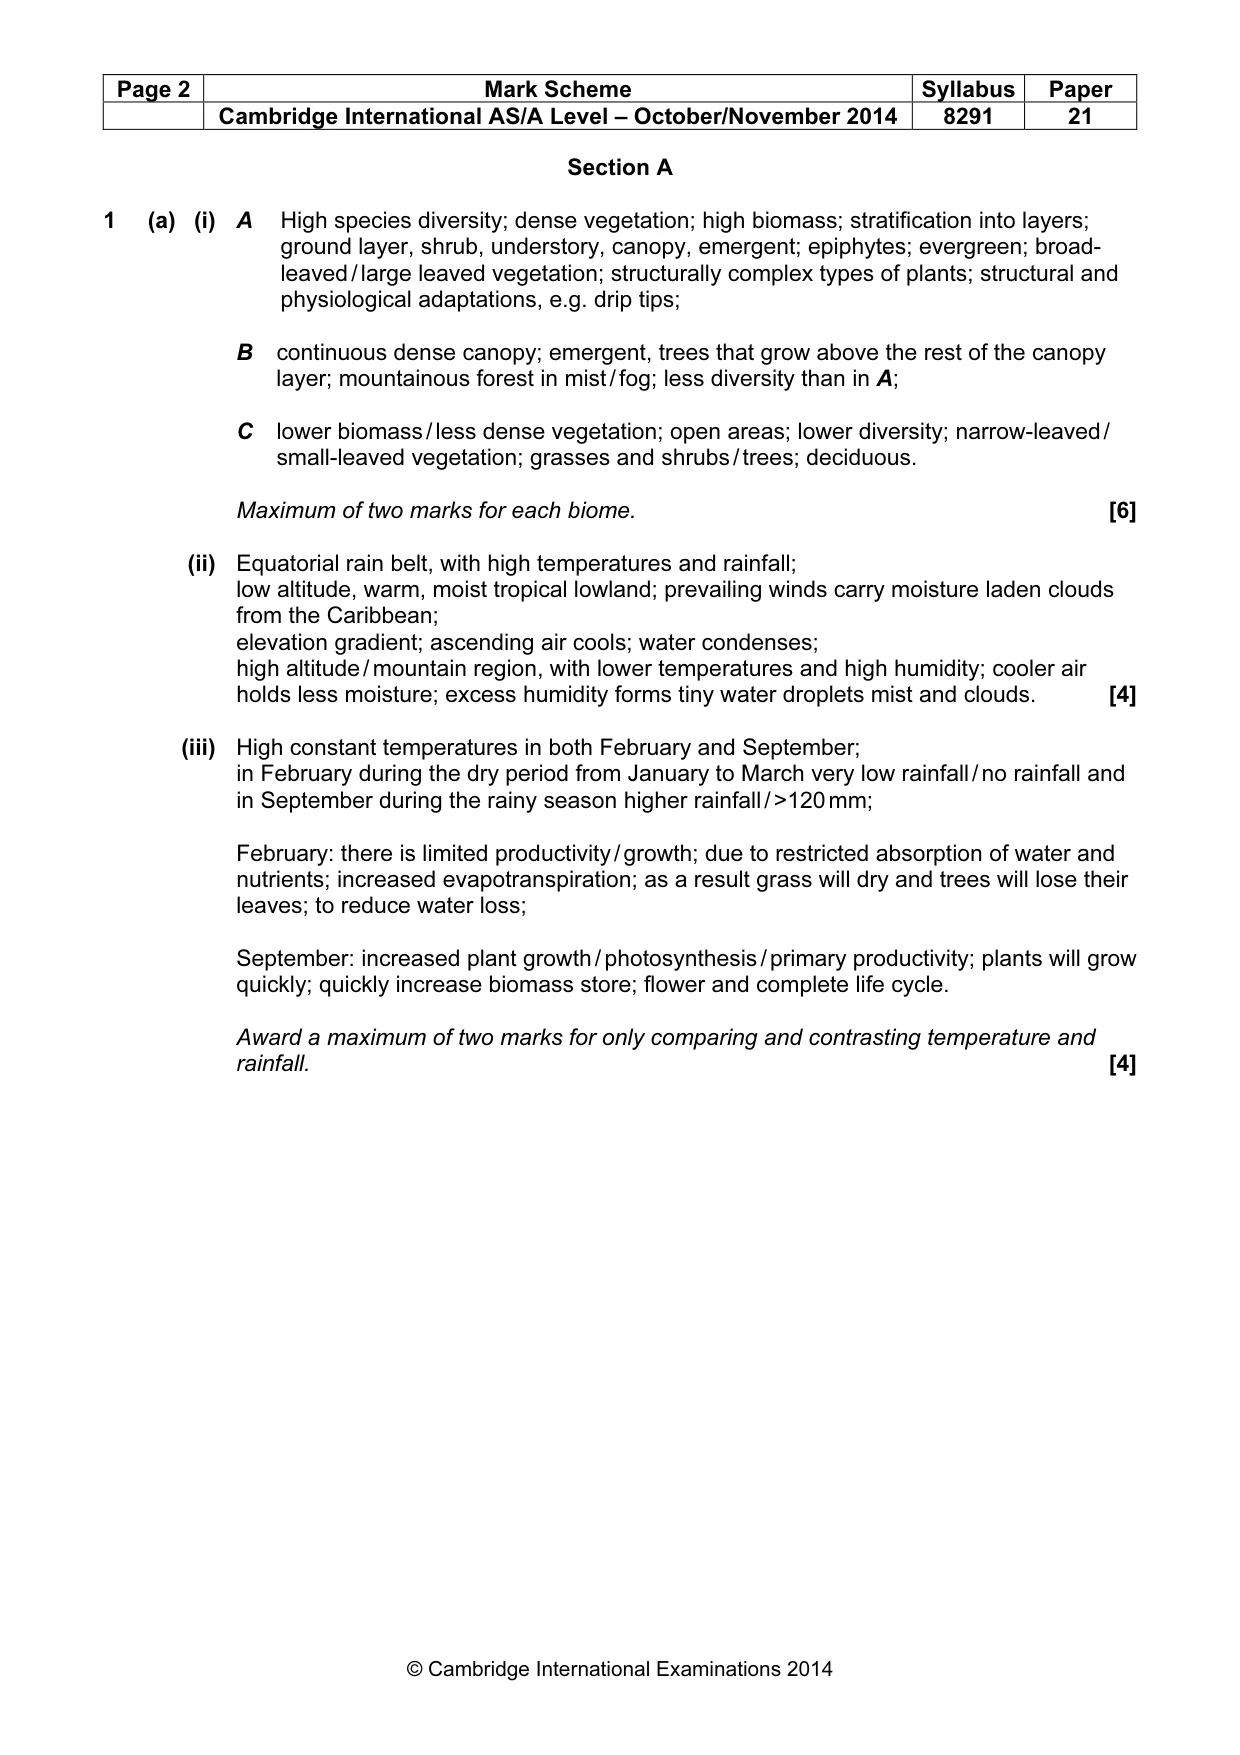
Page 2 Mark Scheme Syllabus Paper Cambridge International AS/A Level – October/November 2014 8291 21 © Cambridge International Examinations 2014 Section A 1 (a) (i) A High species diversity; dense vegetation; high biomass; stratification into layers; ground layer, shrub, understory, canopy, emergent; epiphytes; evergreen; broad- leaved / large leaved vegetation; structurally complex types of plants; structural and physiological adaptations, e.g. drip tips; B continuous dense canopy; emergent, trees that grow above the rest of the canopy layer; mountainous forest in mist / fog; less diversity than in A; C lower biomass / less dense vegetation; open areas; lower diversity; narrow-leaved / small-leaved vegetation; grasses and shrubs / trees; deciduous. Maximum of two marks for each biome. [6] (ii) Equatorial rain belt, with high temperatures and rainfall; low altitude, warm, moist tropical lowland; prevailing winds carry moisture laden clouds from the Caribbean; elevation gradient; ascending air cools; water condenses; high altitude / mountain region, with lower temperatures and high humidity; cooler air holds less moisture; excess humidity forms tiny water droplets mist and clouds. [4] (iii) High constant temperatures in both February and September; in February during the dry period from January to March very low rainfall / no rainfall and in September during the rainy season higher rainfall / >120 mm; February: there is limited productivity / growth; due to restricted absorption of water and nutrients; increased evapotranspiration; as a result grass will dry and trees will lose their leaves; to reduce water loss; September: increased plant growth / photosynthesis / primary productivity; plants will grow quickly; quickly increase biomass store; flower and complete life cycle. Award a maximum of two marks for only comparing and contrasting temperature and rainfall. [4]
Mark scheme, page 3
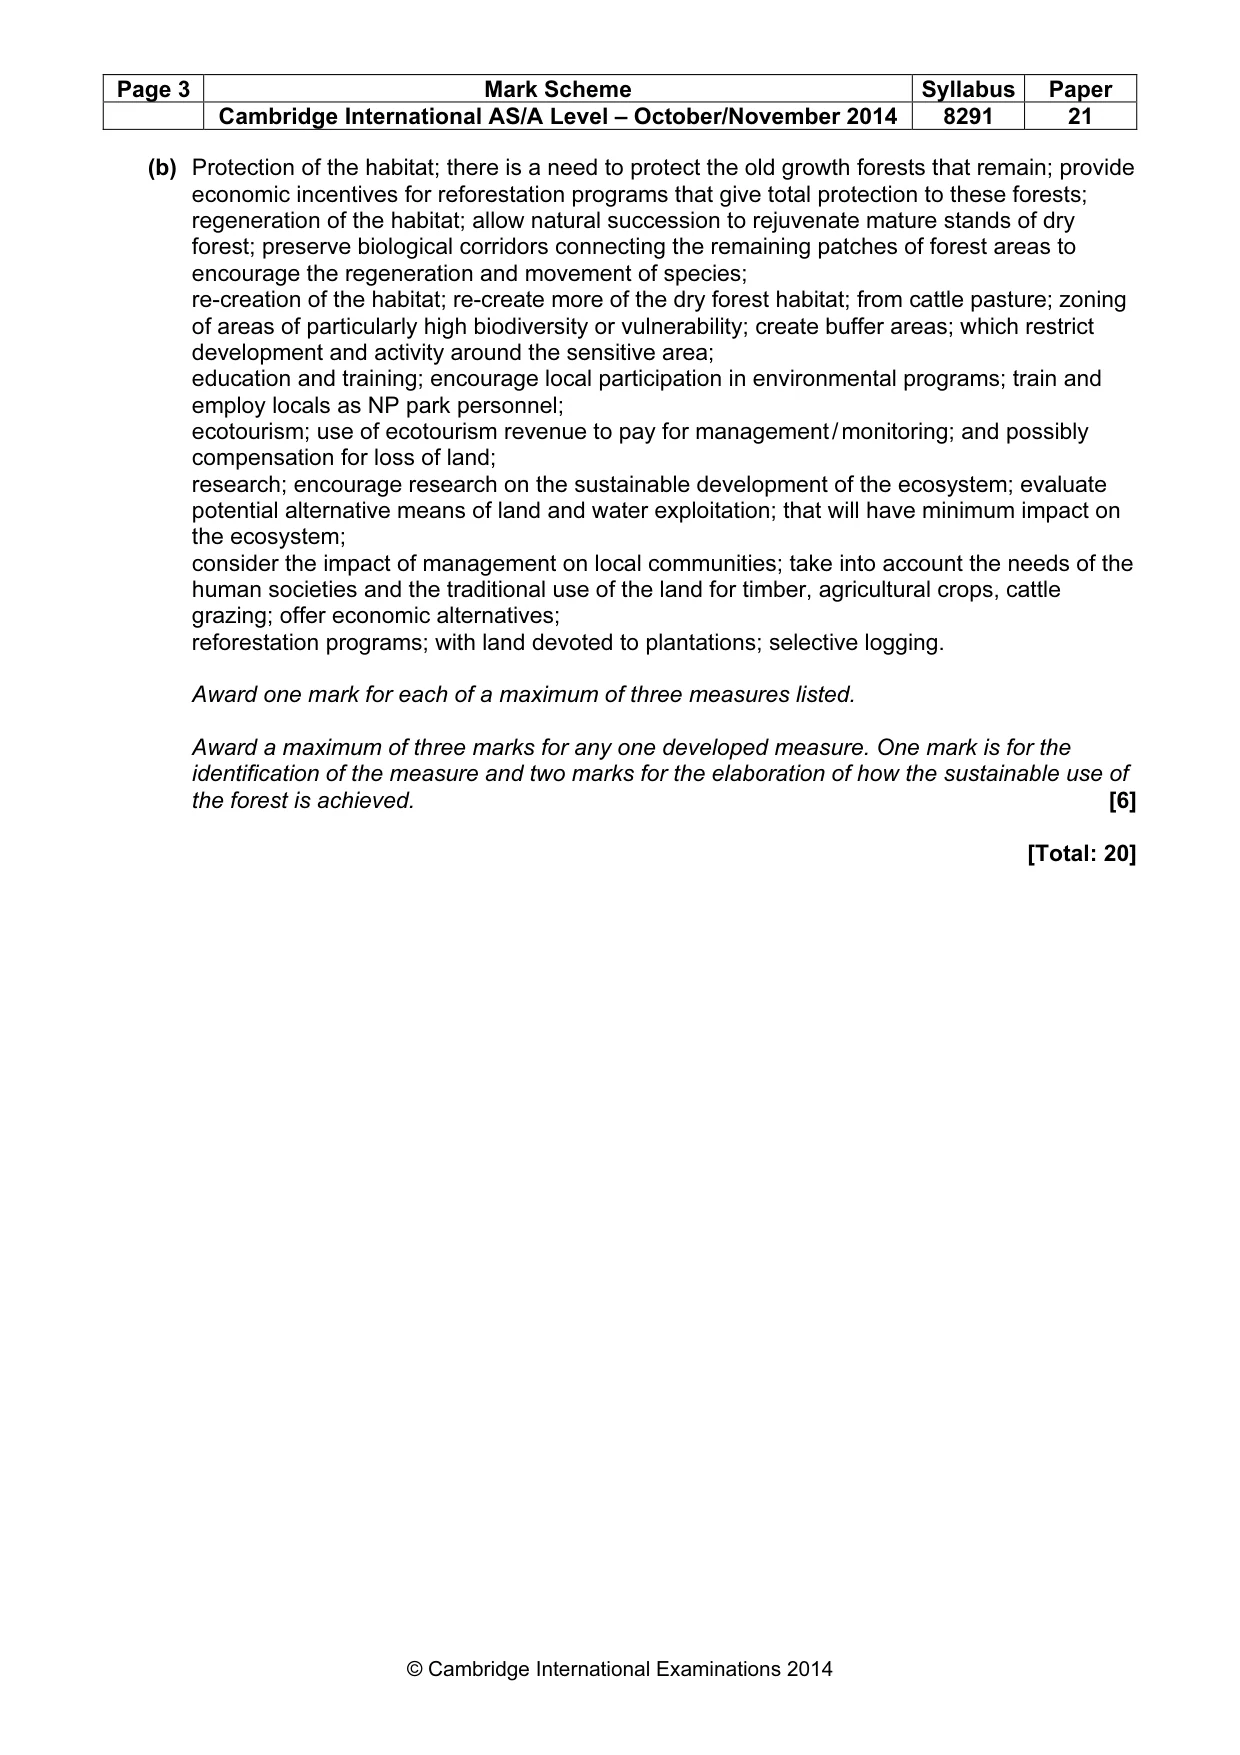
Page 3 Mark Scheme Syllabus Paper Cambridge International AS/A Level – October/November 2014 8291 21 © Cambridge International Examinations 2014 (b) Protection of the habitat; there is a need to protect the old growth forests that remain; provide economic incentives for reforestation programs that give total protection to these forests; regeneration of the habitat; allow natural succession to rejuvenate mature stands of dry forest; preserve biological corridors connecting the remaining patches of forest areas to encourage the regeneration and movement of species; re-creation of the habitat; re-create more of the dry forest habitat; from cattle pasture; zoning of areas of particularly high biodiversity or vulnerability; create buffer areas; which restrict development and activity around the sensitive area; education and training; encourage local participation in environmental programs; train and employ locals as NP park personnel; ecotourism; use of ecotourism revenue to pay for management / monitoring; and possibly compensation for loss of land; research; encourage research on the sustainable development of the ecosystem; evaluate potential alternative means of land and water exploitation; that will have minimum impact on the ecosystem; consider the impact of management on local communities; take into account the needs of the human societies and the traditional use of the land for timber, agricultural crops, cattle grazing; offer economic alternatives; reforestation programs; with land devoted to plantations; selective logging. Award one mark for each of a maximum of three measures listed. Award a maximum of three marks for any one developed measure. One mark is for the identification of the measure and two marks for the elaboration of how the sustainable use of the forest is achieved. [6] [Total: 20]
Mark scheme, page 4
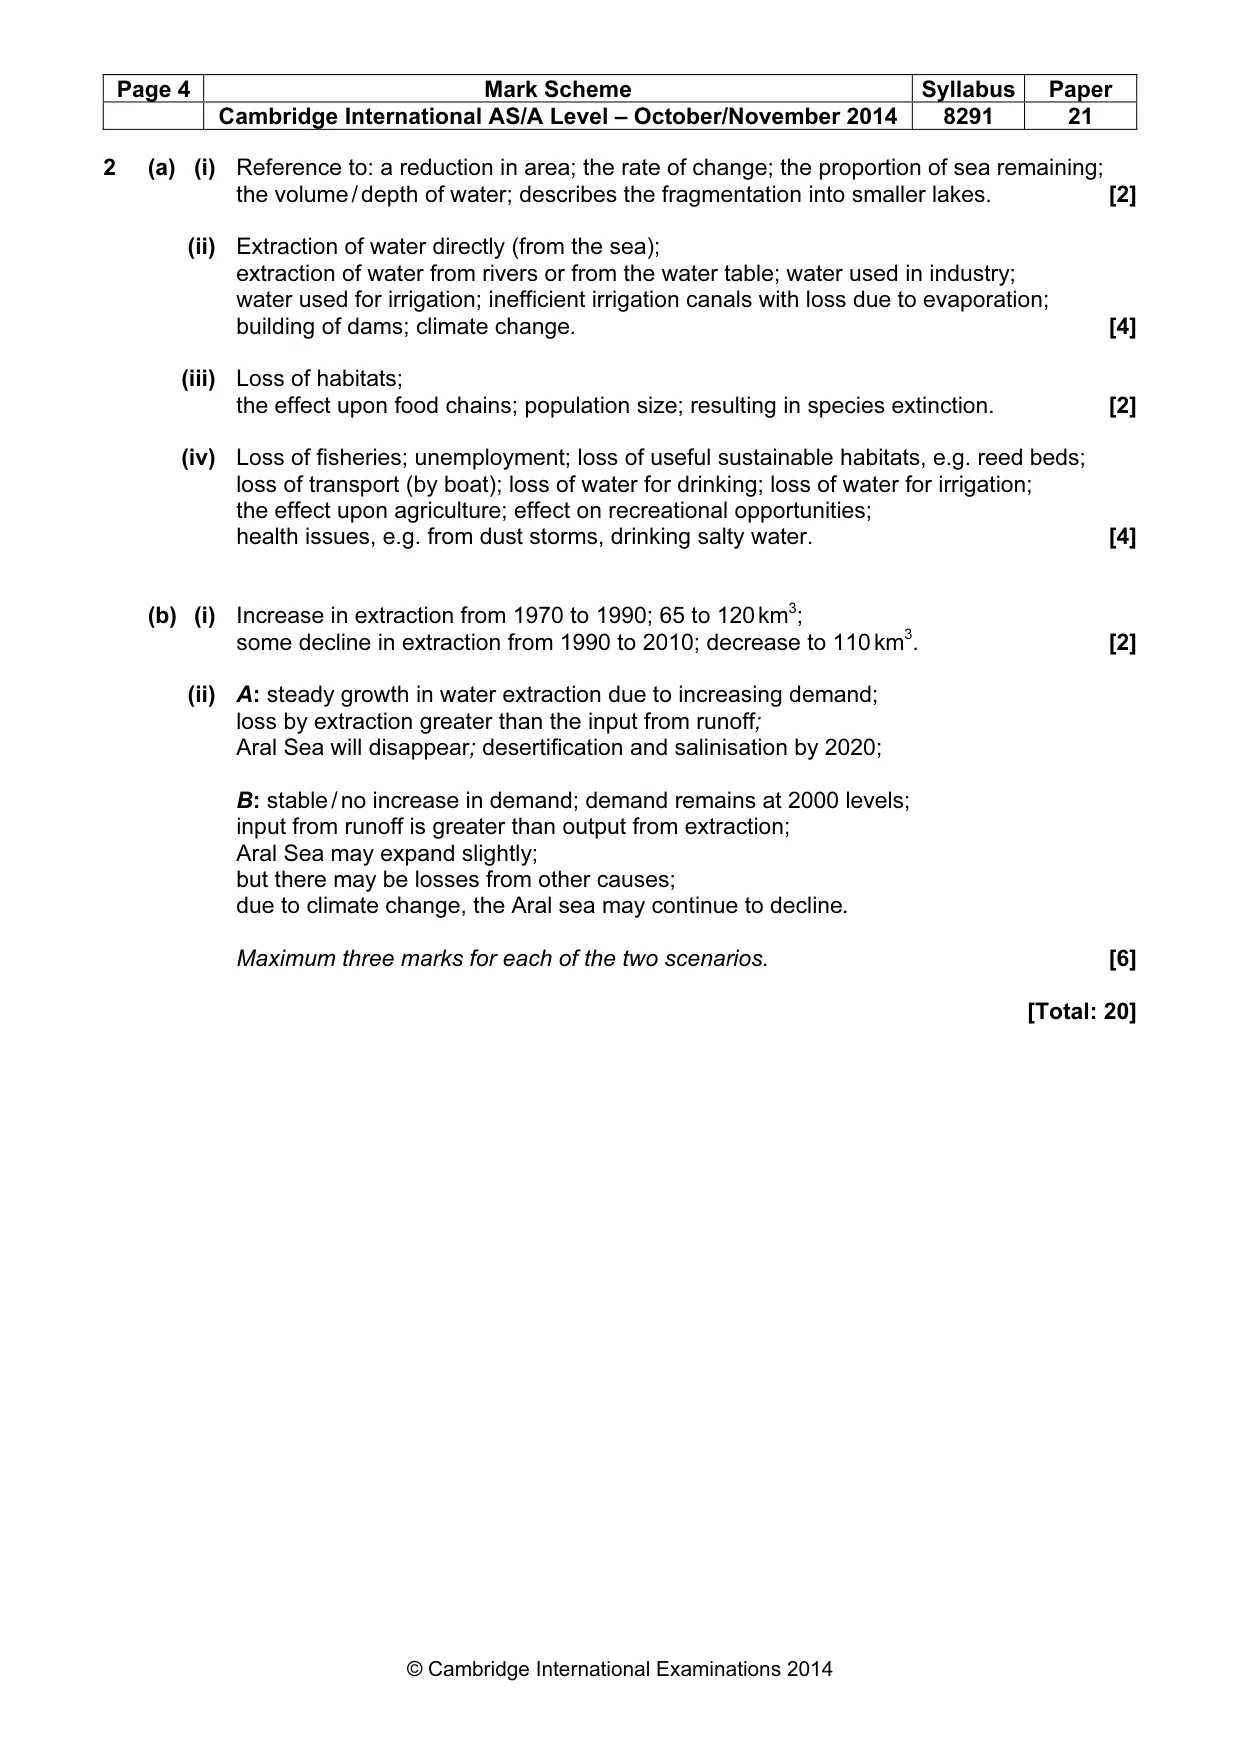
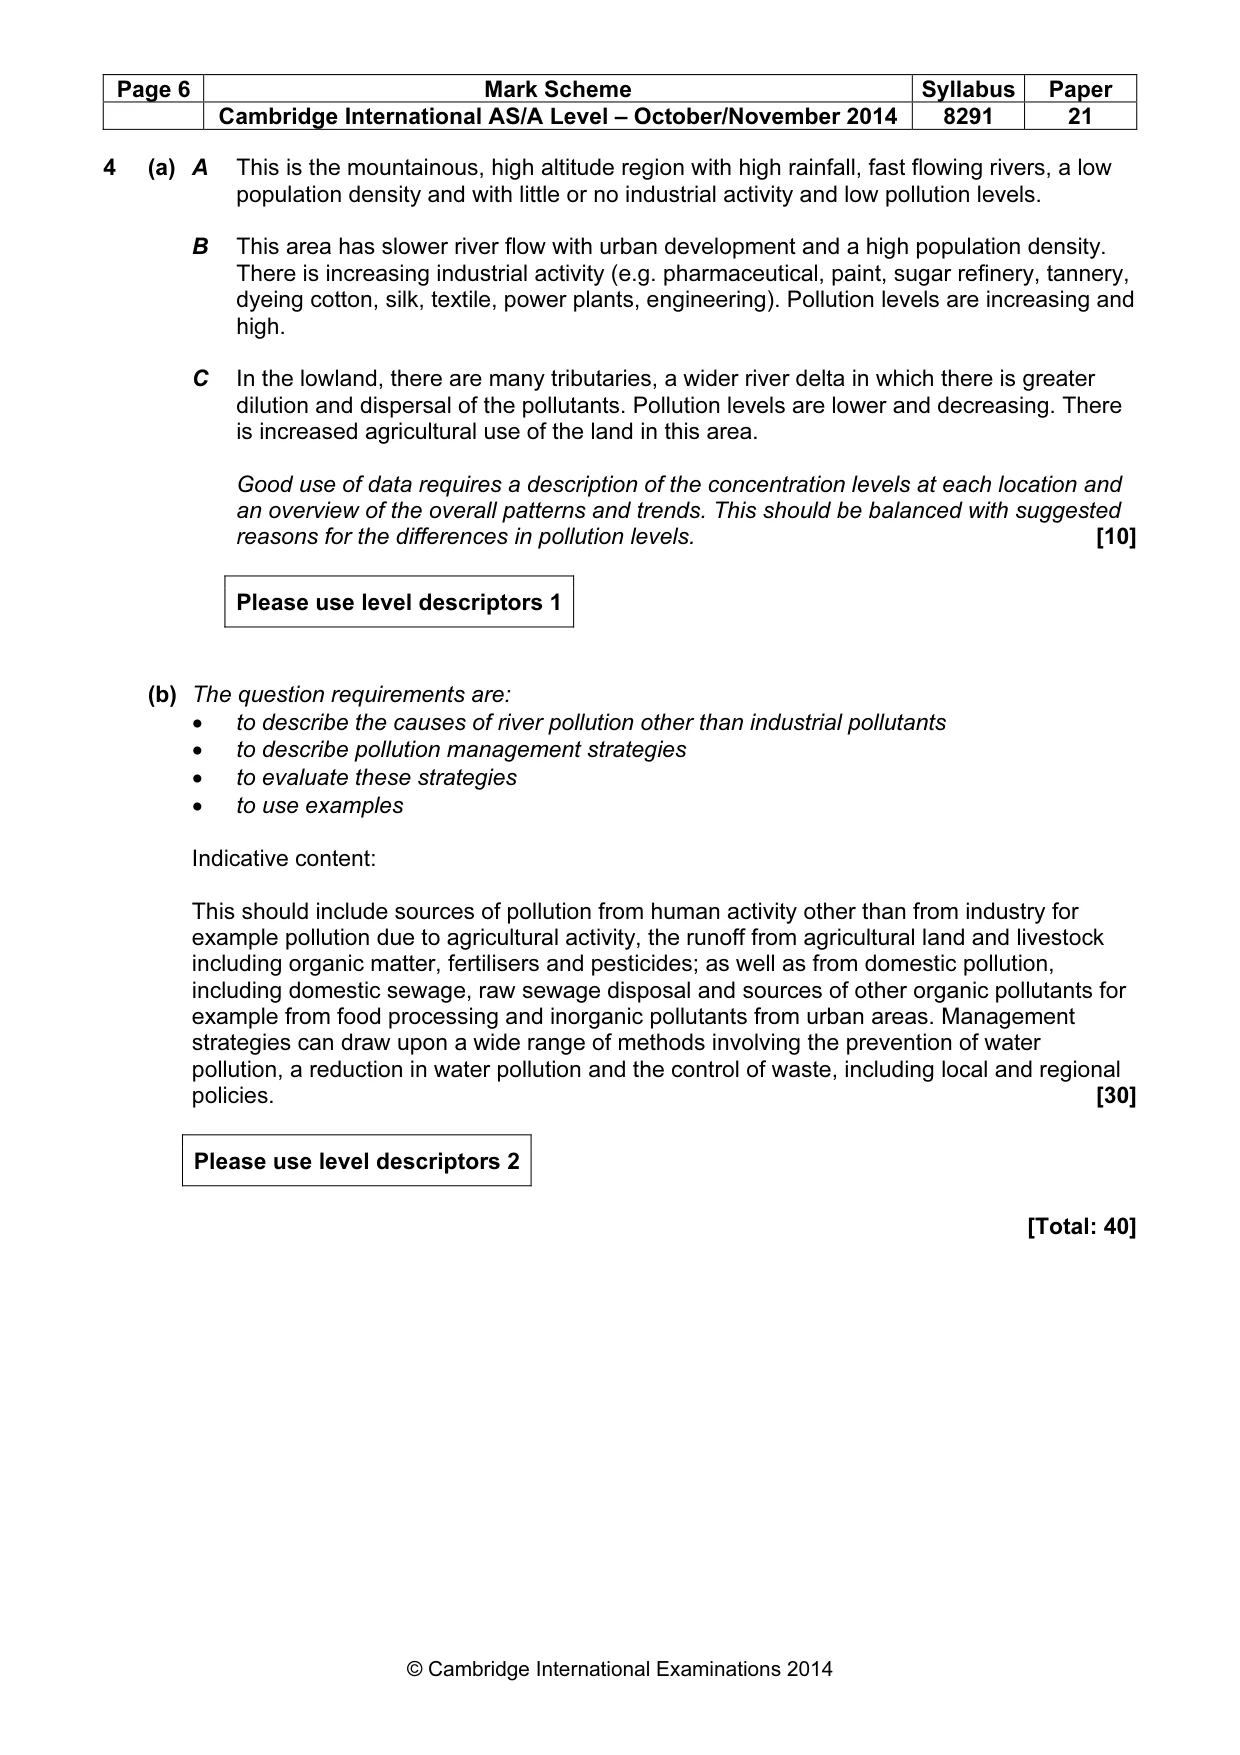
Page 4 Mark Scheme Syllabus Paper Cambridge International AS/A Level – October/November 2014 8291 21 © Cambridge International Examinations 2014 2 (a) (i) Reference to: a reduction in area; the rate of change; the proportion of sea remaining; the volume / depth of water; describes the fragmentation into smaller lakes. [2] (ii) Extraction of water directly (from the sea); extraction of water from rivers or from the water table; water used in industry; water used for irrigation; inefficient irrigation canals with loss due to evaporation; building of dams; climate change. [4] (iii) Loss of habitats; the effect upon food chains; population size; resulting in species extinction. [2] (iv) Loss of fisheries; unemployment; loss of useful sustainable habitats, e.g. reed beds; loss of transport (by boat); loss of water for drinking; loss of water for irrigation; the effect upon agriculture; effect on recreational opportunities; health issues, e.g. from dust storms, drinking salty water. [4] (b) (i) Increase in extraction from 1970 to 1990; 65 to 120 km3; some decline in extraction from 1990 to 2010; decrease to 110 km3. [2] (ii) A: steady growth in water extraction due to increasing demand; loss by extraction greater than the input from runoff; Aral Sea will disappear; desertification and salinisation by 2020; B: stable / no increase in demand; demand remains at 2000 levels; input from runoff is greater than output from extraction; Aral Sea may expand slightly; but there may be losses from other causes; due to climate change, the Aral sea may continue to decline. Maximum three marks for each of the two scenarios. [6] [Total: 20]
Mark scheme, page 5
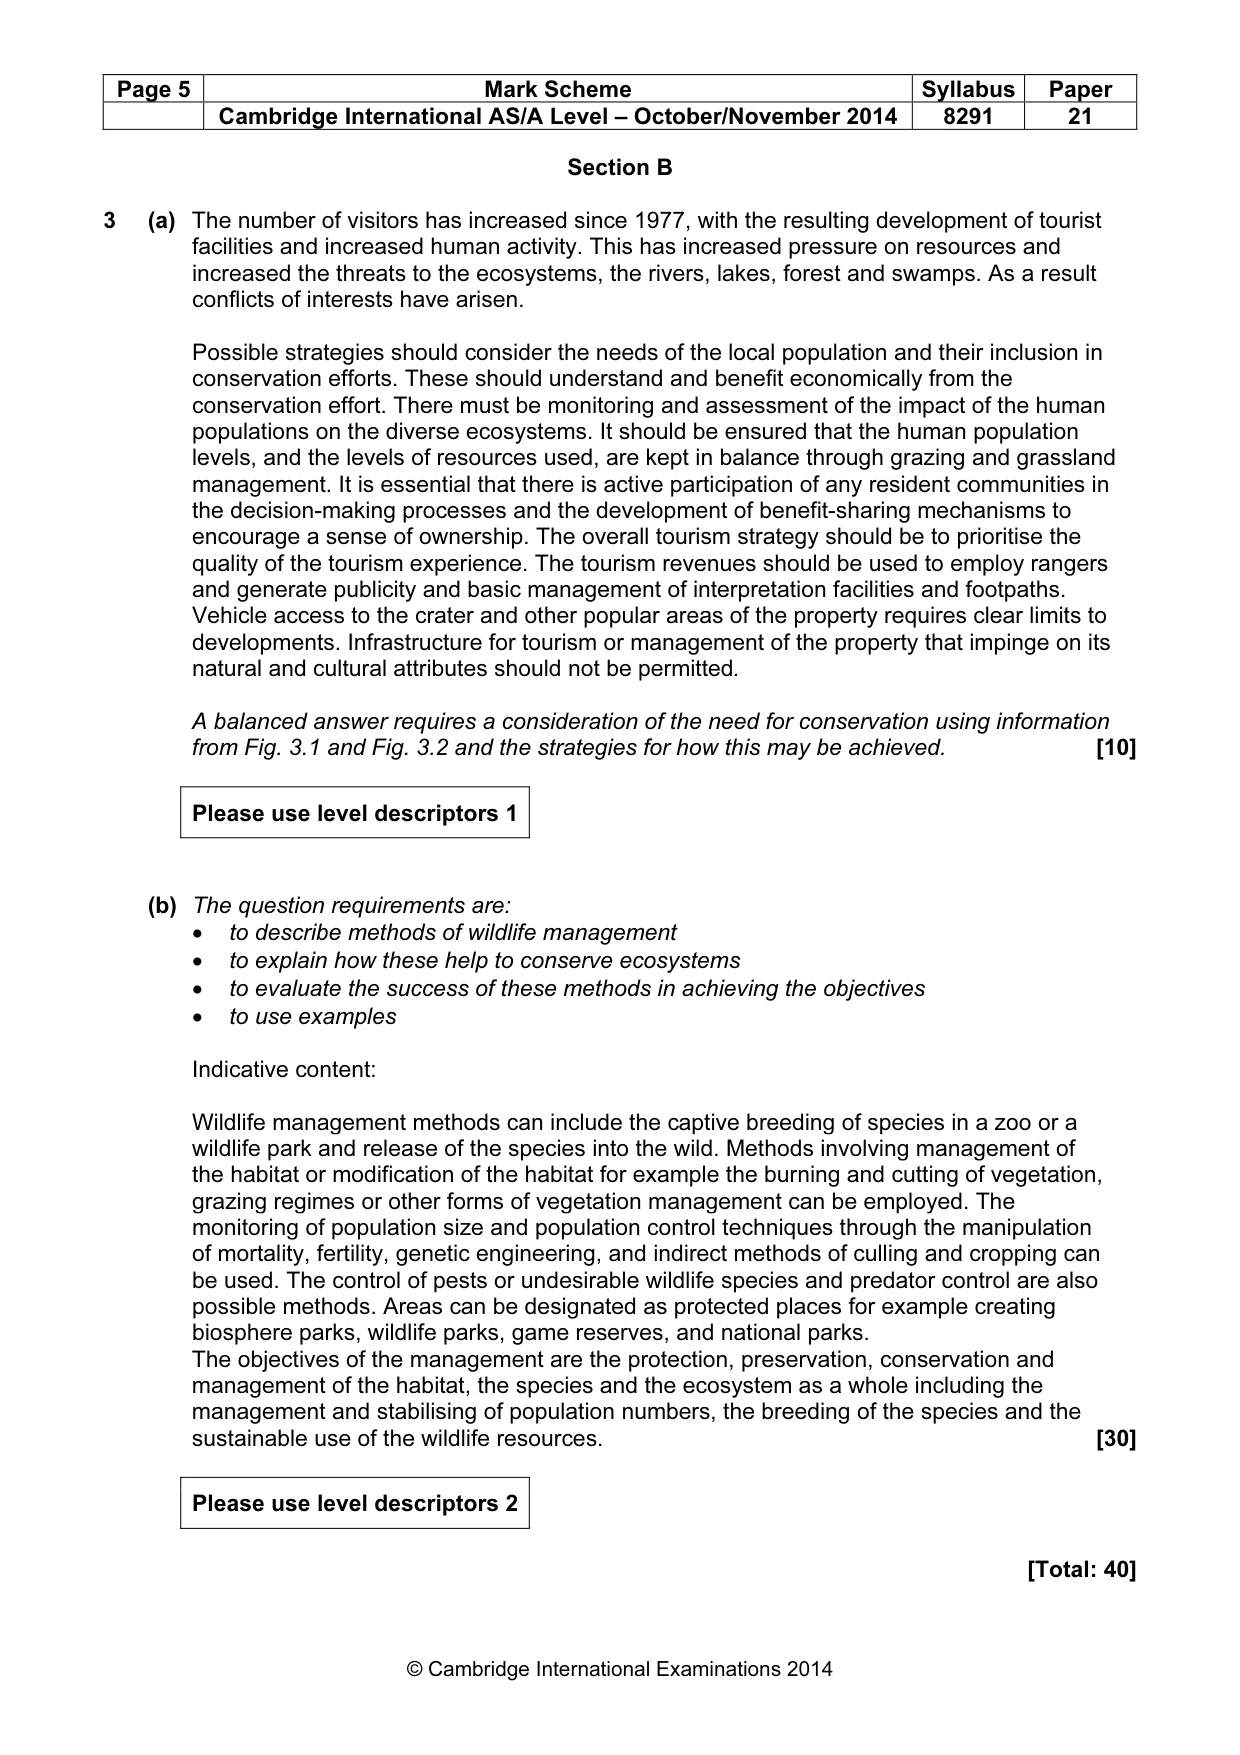
Page 5 Mark Scheme Syllabus Paper Cambridge International AS/A Level – October/November 2014 8291 21 © Cambridge International Examinations 2014 Section B 3 (a) The number of visitors has increased since 1977, with the resulting development of tourist facilities and increased human activity. This has increased pressure on resources and increased the threats to the ecosystems, the rivers, lakes, forest and swamps. As a result conflicts of interests have arisen. Possible strategies should consider the needs of the local population and their inclusion in conservation efforts. These should understand and benefit economically from the conservation effort. There must be monitoring and assessment of the impact of the human populations on the diverse ecosystems. It should be ensured that the human population levels, and the levels of resources used, are kept in balance through grazing and grassland management. It is essential that there is active participation of any resident communities in the decision-making processes and the development of benefit-sharing mechanisms to encourage a sense of ownership. The overall tourism strategy should be to prioritise the quality of the tourism experience. The tourism revenues should be used to employ rangers and generate publicity and basic management of interpretation facilities and footpaths. Vehicle access to the crater and other popular areas of the property requires clear limits to developments. Infrastructure for tourism or management of the property that impinge on its natural and cultural attributes should not be permitted. A balanced answer requires a consideration of the need for conservation using information from Fig. 3.1 and Fig. 3.2 and the strategies for how this may be achieved. [10] Please use level descriptors 1 (b) The question requirements are: • to describe methods of wildlife management • to explain how these help to conserve ecosystems • to evaluate the success of these methods in achieving the objectives • to use examples Indicative content: Wildlife management methods can include the captive breeding of species in a zoo or a wildlife park and release of the species into the wild. Methods involving management of the habitat or modification of the habitat for example the burning and cutting of vegetation, grazing regimes or other forms of vegetation management can be employed. The monitoring of population size and population control techniques through the manipulation of mortality, fertility, genetic engineering, and indirect methods of culling and cropping can be used. The control of pests or undesirable wildlife species and predator control are also possible methods. Areas can be designated as protected places for example creating biosphere parks, wildlife parks, game reserves, and national parks. The objectives of the management are the protection, preservation, conservation and management of the habitat, the species and the ecosystem as a whole including the management and stabilising of population numbers, the breeding of the species and the sustainable use of the wildlife resources. [30] Please use level descriptors 2 [Total: 40]
Mark scheme, page 6
Page 6 Mark Scheme Syllabus Paper Cambridge International AS/A Level – October/November 2014 8291 21 © Cambridge International Examinations 2014 4 (a) A This is the mountainous, high altitude region with high rainfall, fast flowing rivers, a low population density and with little or no industrial activity and low pollution levels. B This area has slower river flow with urban development and a high population density. There is increasing industrial activity (e.g. pharmaceutical, paint, sugar refinery, tannery, dyeing cotton, silk, textile, power plants, engineering). Pollution levels are increasing and high. C In the lowland, there are many tributaries, a wider river delta in which there is greater dilution and dispersal of the pollutants. Pollution levels are lower and decreasing. There is increased agricultural use of the land in this area. Good use of data requires a description of the concentration levels at each location and an overview of the overall patterns and trends. This should be balanced with suggested reasons for the differences in pollution levels. [10] Please use level descriptors 1 (b) The question requirements are: • to describe the causes of river pollution other than industrial pollutants • to describe pollution management strategies • to evaluate these strategies • to use examples Indicative content: This should include sources of pollution from human activity other than from industry for example pollution due to agricultural activity, the runoff from agricultural land and livestock including organic matter, fertilisers and pesticides; as well as from domestic pollution, including domestic sewage, raw sewage disposal and sources of other organic pollutants for example from food processing and inorganic pollutants from urban areas. Management strategies can draw upon a wide range of methods involving the prevention of water pollution, a reduction in water pollution and the control of waste, including local and regional policies. [30] Please use level descriptors 2 [Total: 40]
Mark scheme, page 7
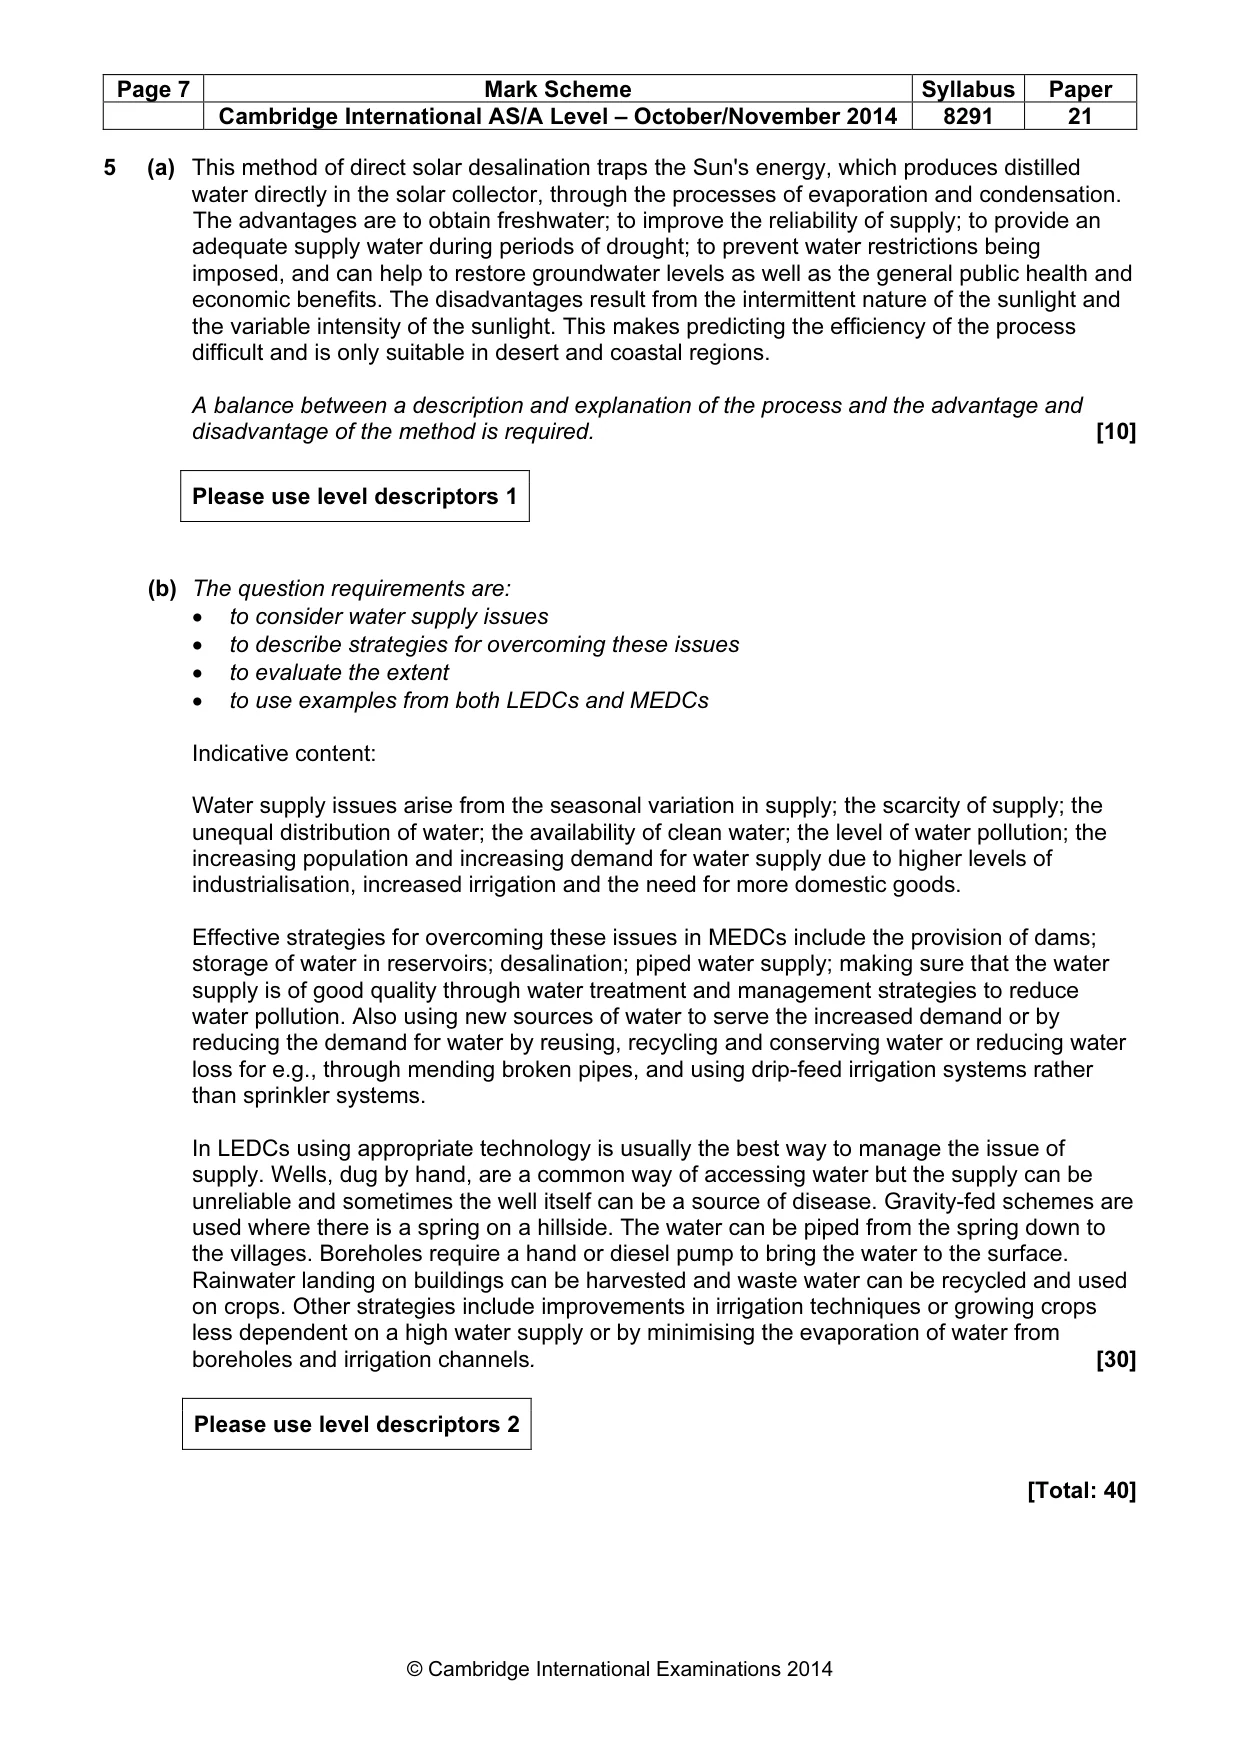
Page 7 Mark Scheme Syllabus Paper Cambridge International AS/A Level – October/November 2014 8291 21 © Cambridge International Examinations 2014 5 (a) This method of direct solar desalination traps the Sun's energy, which produces distilled water directly in the solar collector, through the processes of evaporation and condensation. The advantages are to obtain freshwater; to improve the reliability of supply; to provide an adequate supply water during periods of drought; to prevent water restrictions being imposed, and can help to restore groundwater levels as well as the general public health and economic benefits. The disadvantages result from the intermittent nature of the sunlight and the variable intensity of the sunlight. This makes predicting the efficiency of the process difficult and is only suitable in desert and coastal regions. A balance between a description and explanation of the process and the advantage and disadvantage of the method is required. [10] Please use level descriptors 1 (b) The question requirements are: • to consider water supply issues • to describe strategies for overcoming these issues • to evaluate the extent • to use examples from both LEDCs and MEDCs Indicative content: Water supply issues arise from the seasonal variation in supply; the scarcity of supply; the unequal distribution of water; the availability of clean water; the level of water pollution; the increasing population and increasing demand for water supply due to higher levels of industrialisation, increased irrigation and the need for more domestic goods. Effective strategies for overcoming these issues in MEDCs include the provision of dams; storage of water in reservoirs; desalination; piped water supply; making sure that the water supply is of good quality through water treatment and management strategies to reduce water pollution. Also using new sources of water to serve the increased demand or by reducing the demand for water by reusing, recycling and conserving water or reducing water loss for e.g., through mending broken pipes, and using drip-feed irrigation systems rather than sprinkler systems. In LEDCs using appropriate technology is usually the best way to manage the issue of supply. Wells, dug by hand, are a common way of accessing water but the supply can be unreliable and sometimes the well itself can be a source of disease. Gravity-fed schemes are used where there is a spring on a hillside. The water can be piped from the spring down to the villages. Boreholes require a hand or diesel pump to bring the water to the surface. Rainwater landing on buildings can be harvested and waste water can be recycled and used on crops. Other strategies include improvements in irrigation techniques or growing crops less dependent on a high water supply or by minimising the evaporation of water from boreholes and irrigation channels. [30] Please use level descriptors 2 [Total: 40]
Mark scheme, page 8
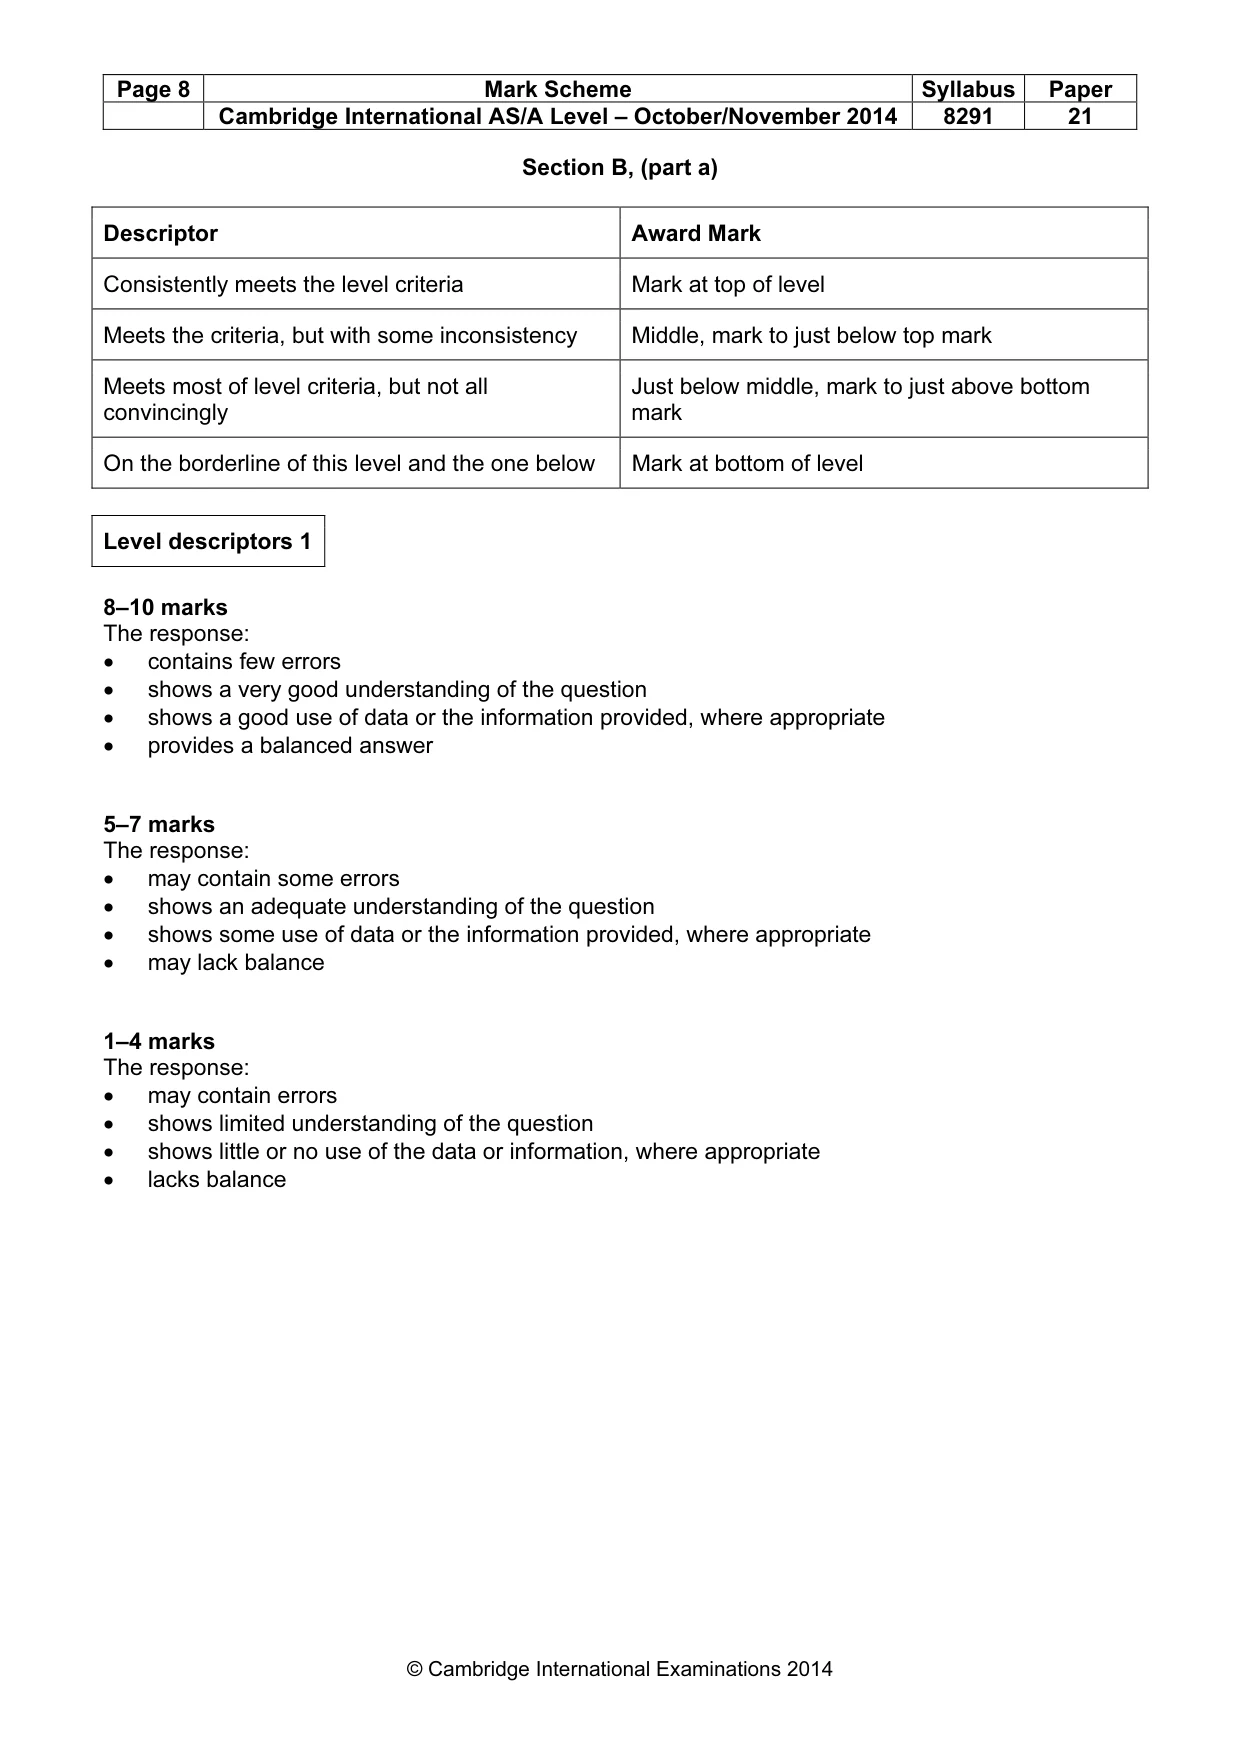
Page 8 Mark Scheme Syllabus Paper Cambridge International AS/A Level – October/November 2014 8291 21 © Cambridge International Examinations 2014 Section B, (part a) Descriptor Award Mark Consistently meets the level criteria Mark at top of level Meets the criteria, but with some inconsistency Middle, mark to just below top mark Meets most of level criteria, but not all convincingly Just below middle, mark to just above bottom mark On the borderline of this level and the one below Mark at bottom of level Level descriptors 1 8–10 marks The response: • contains few errors • shows a very good understanding of the question • shows a good use of data or the information provided, where appropriate • provides a balanced answer 5–7 marks The response: • may contain some errors • shows an adequate understanding of the question • shows some use of data or the information provided, where appropriate • may lack balance 1–4 marks The response: • may contain errors • shows limited understanding of the question • shows little or no use of the data or information, where appropriate • lacks balance
Mark scheme, page 9
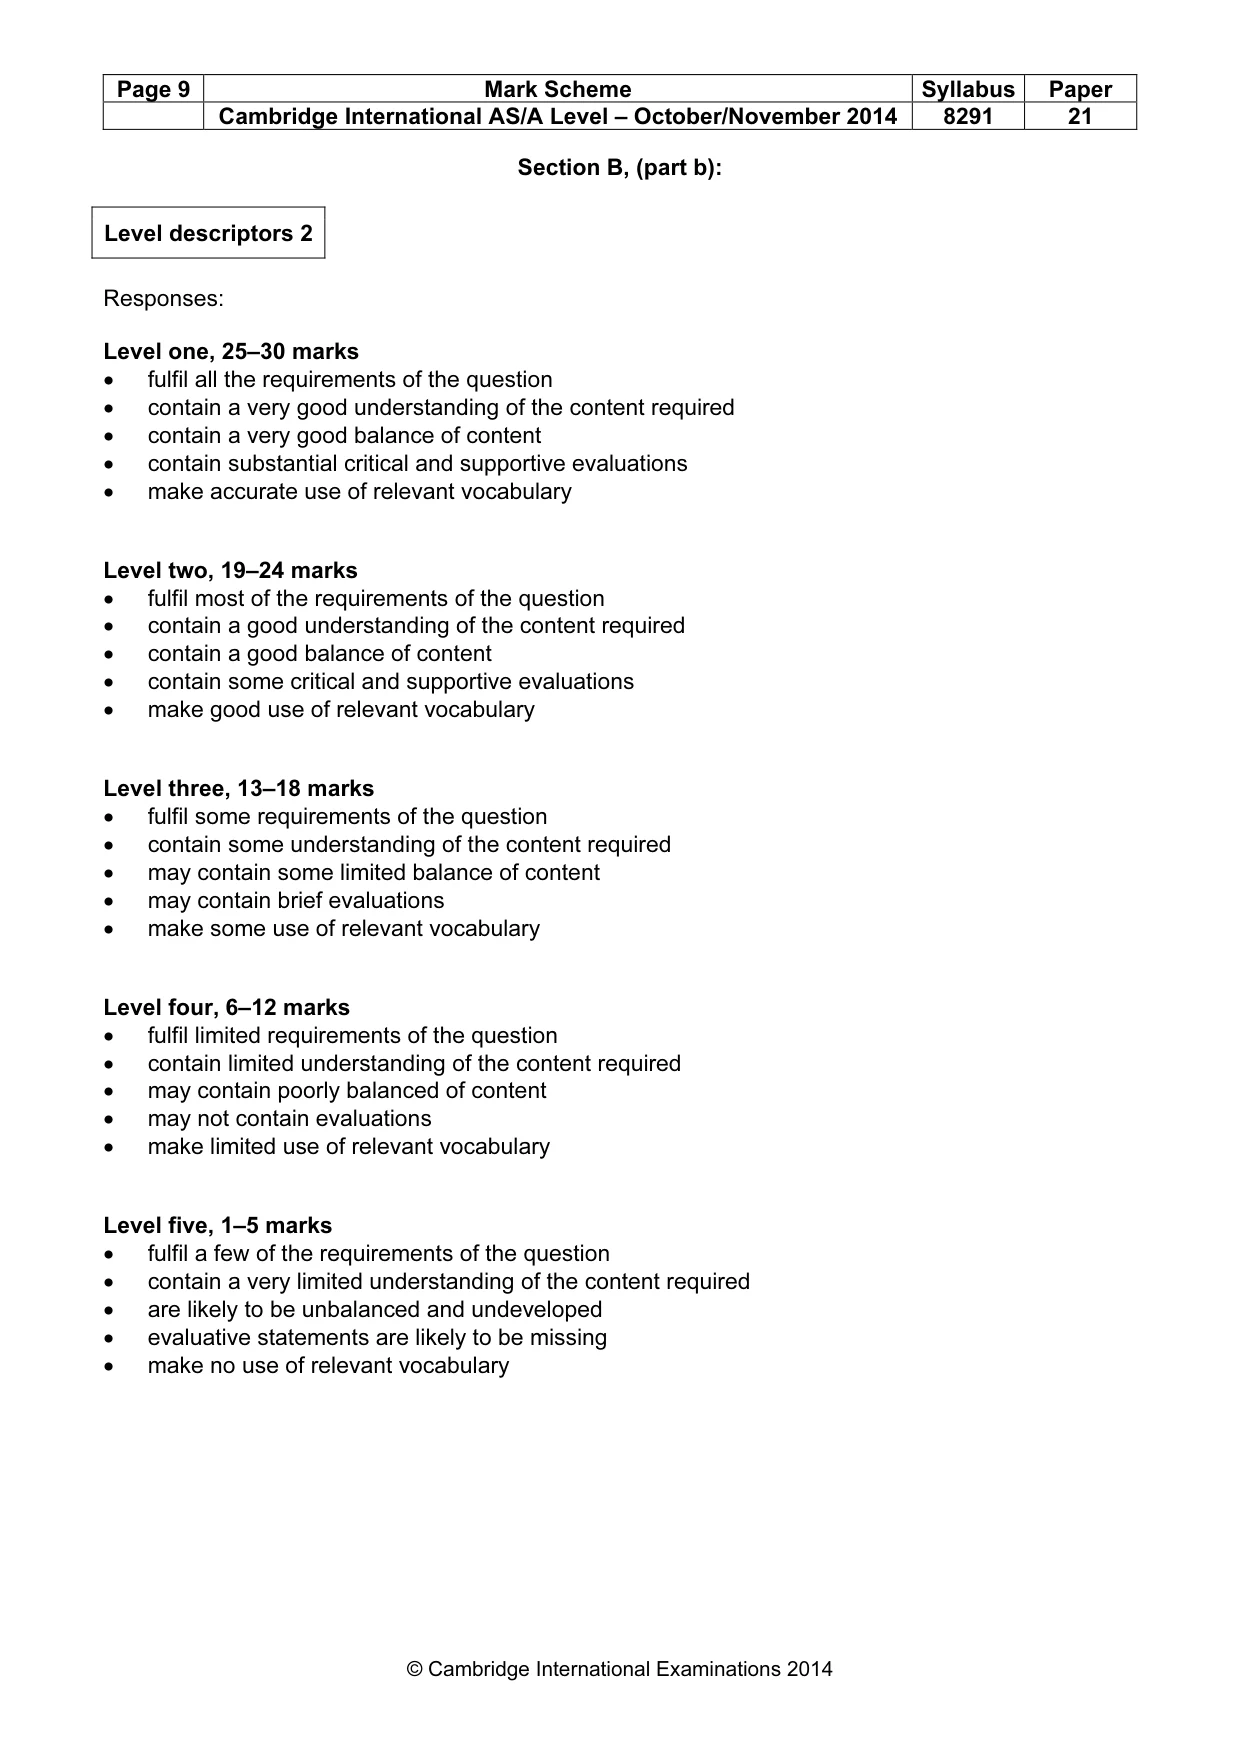
Page 9 Mark Scheme Syllabus Paper Cambridge International AS/A Level – October/November 2014 8291 21 © Cambridge International Examinations 2014 Section B, (part b): Level descriptors 2 Responses: Level one, 25–30 marks • fulfil all the requirements of the question • contain a very good understanding of the content required • contain a very good balance of content • contain substantial critical and supportive evaluations • make accurate use of relevant vocabulary Level two, 19–24 marks • fulfil most of the requirements of the question • contain a good understanding of the content required • contain a good balance of content • contain some critical and supportive evaluations • make good use of relevant vocabulary Level three, 13–18 marks • fulfil some requirements of the question • contain some understanding of the content required • may contain some limited balance of content • may contain brief evaluations • make some use of relevant vocabulary Level four, 6–12 marks • fulfil limited requirements of the question • contain limited understanding of the content required • may contain poorly balanced of content • may not contain evaluations • make limited use of relevant vocabulary Level five, 1–5 marks • fulfil a few of the requirements of the question • contain a very limited understanding of the content required • are likely to be unbalanced and undeveloped • evaluative statements are likely to be missing • make no use of relevant vocabulary
What you needed in this session
Cambridge’s own grade thresholds for 2014 Oct/Nov, Paper 2 · Variant 1. A higher threshold means an easier paper — the bar moves with how the cohort did.