Cambridge A Level Environmental Management (AS only) 8291 — 2014 Oct/Nov Paper 1 · Variant 1
8291/11/O/N/14 · 80 marks · ≈90 min
The question paper and its mark scheme, free to read here and free to download. This is Cambridge’s own paper, exactly as it was sat.
Question paper12 pages
Mark scheme8 pages
Answers below. Sit the paper first if you are practising.
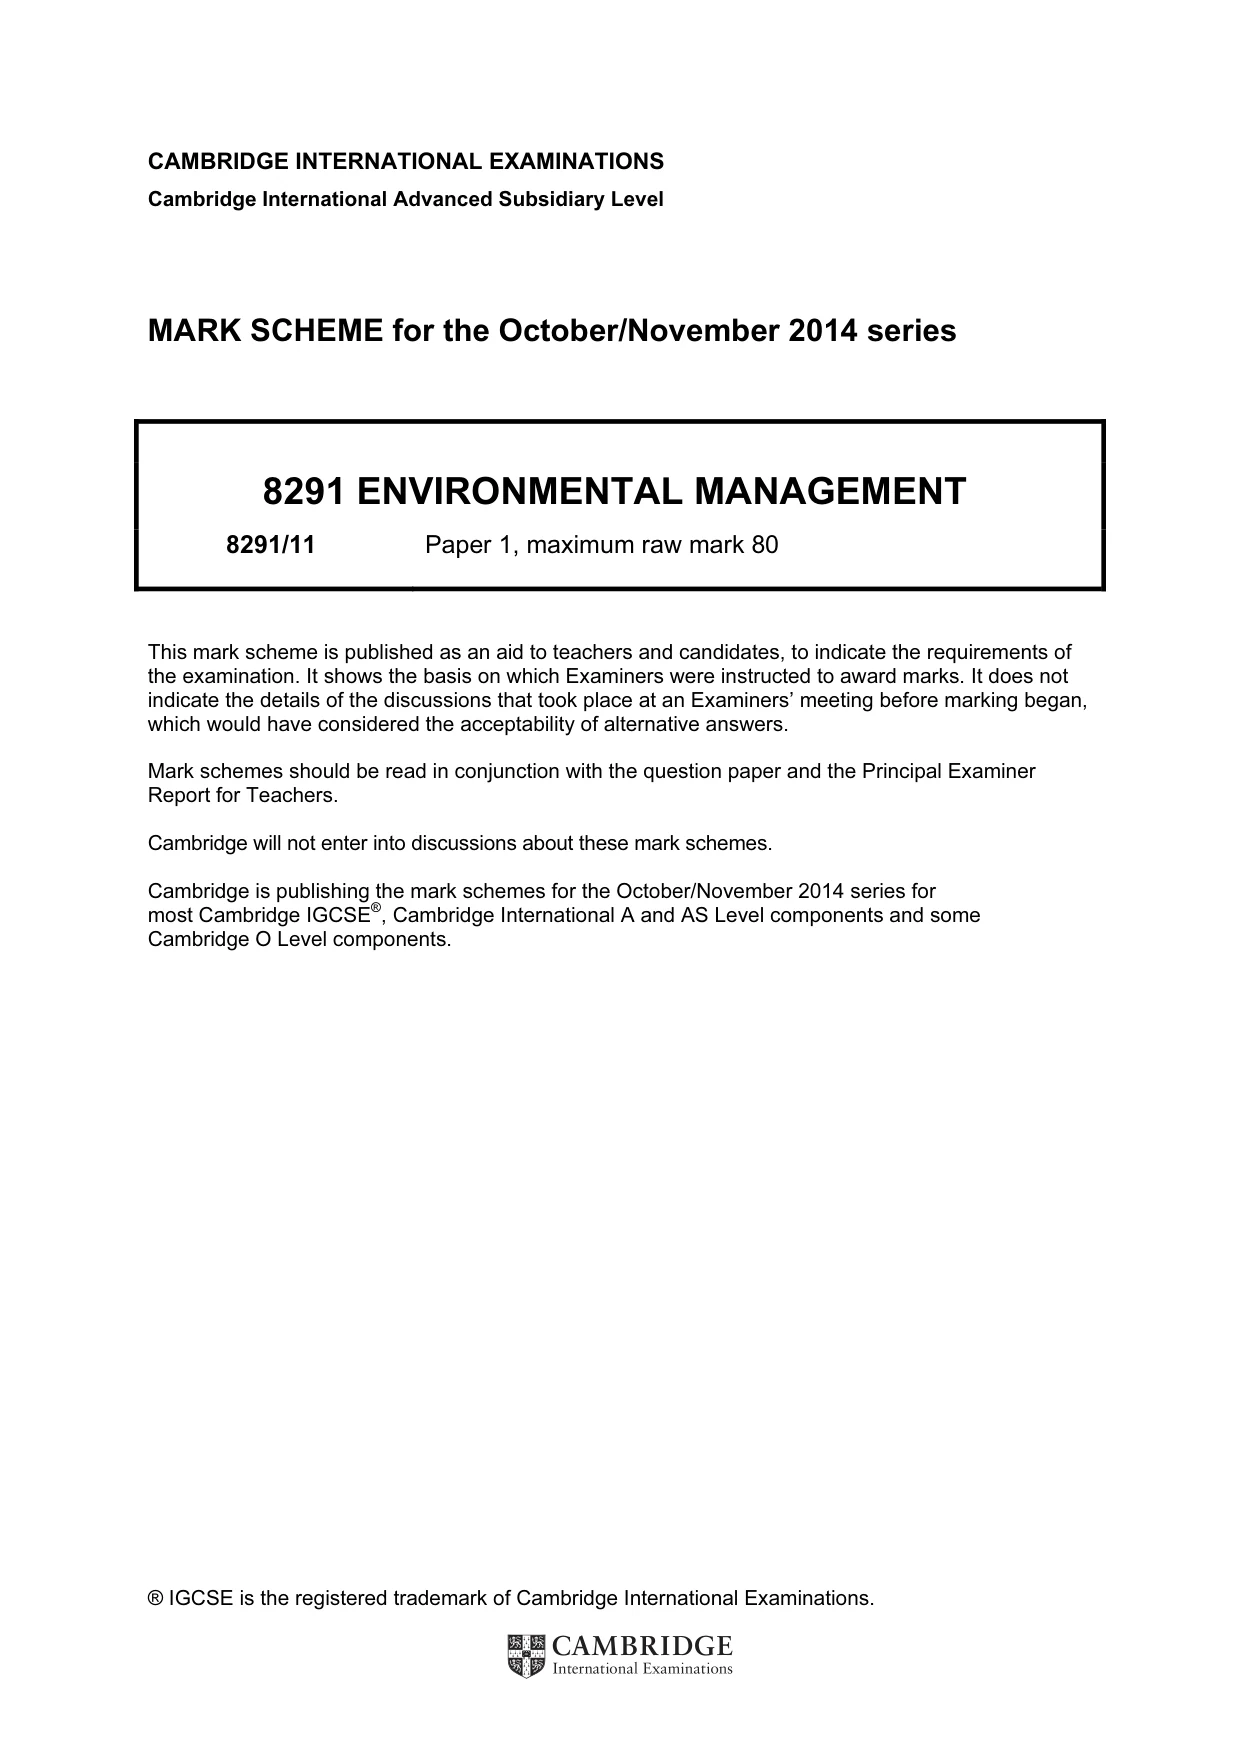
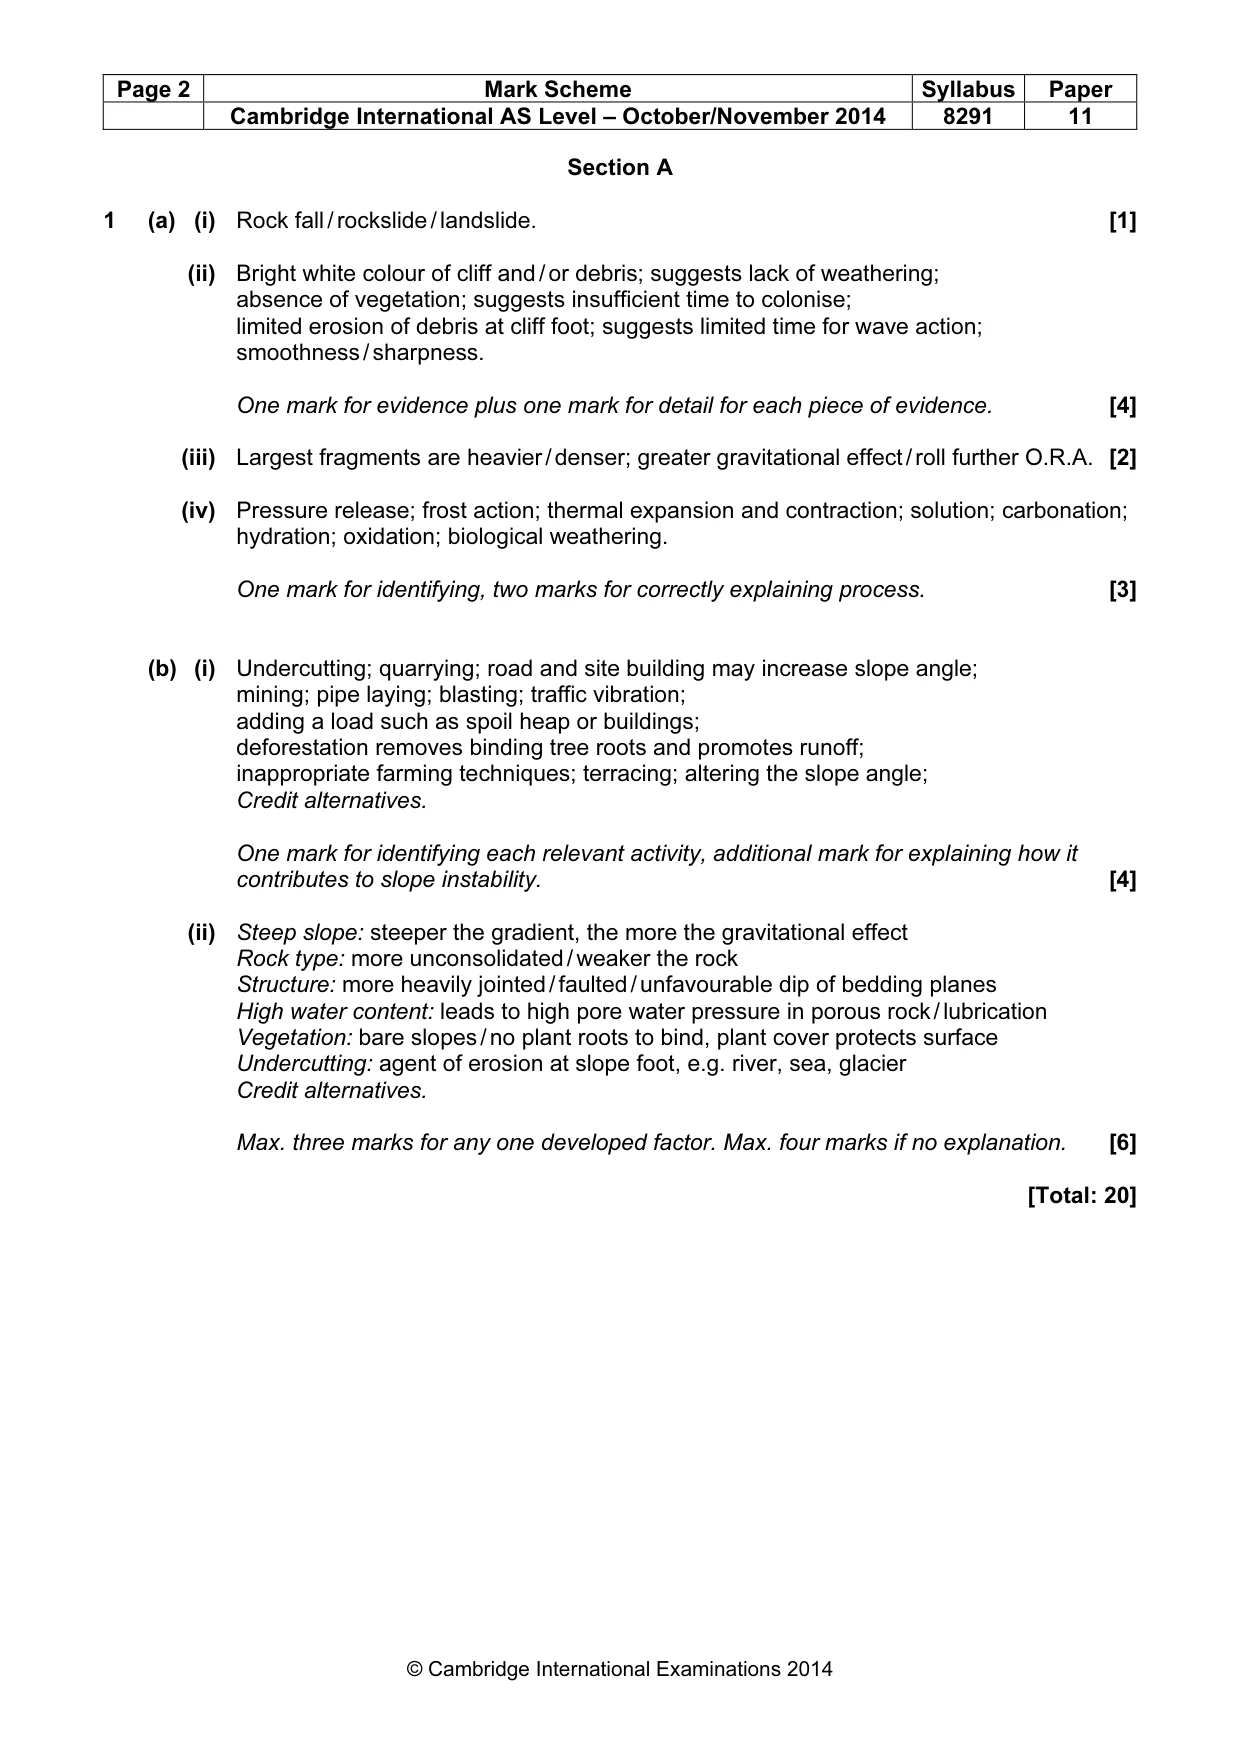
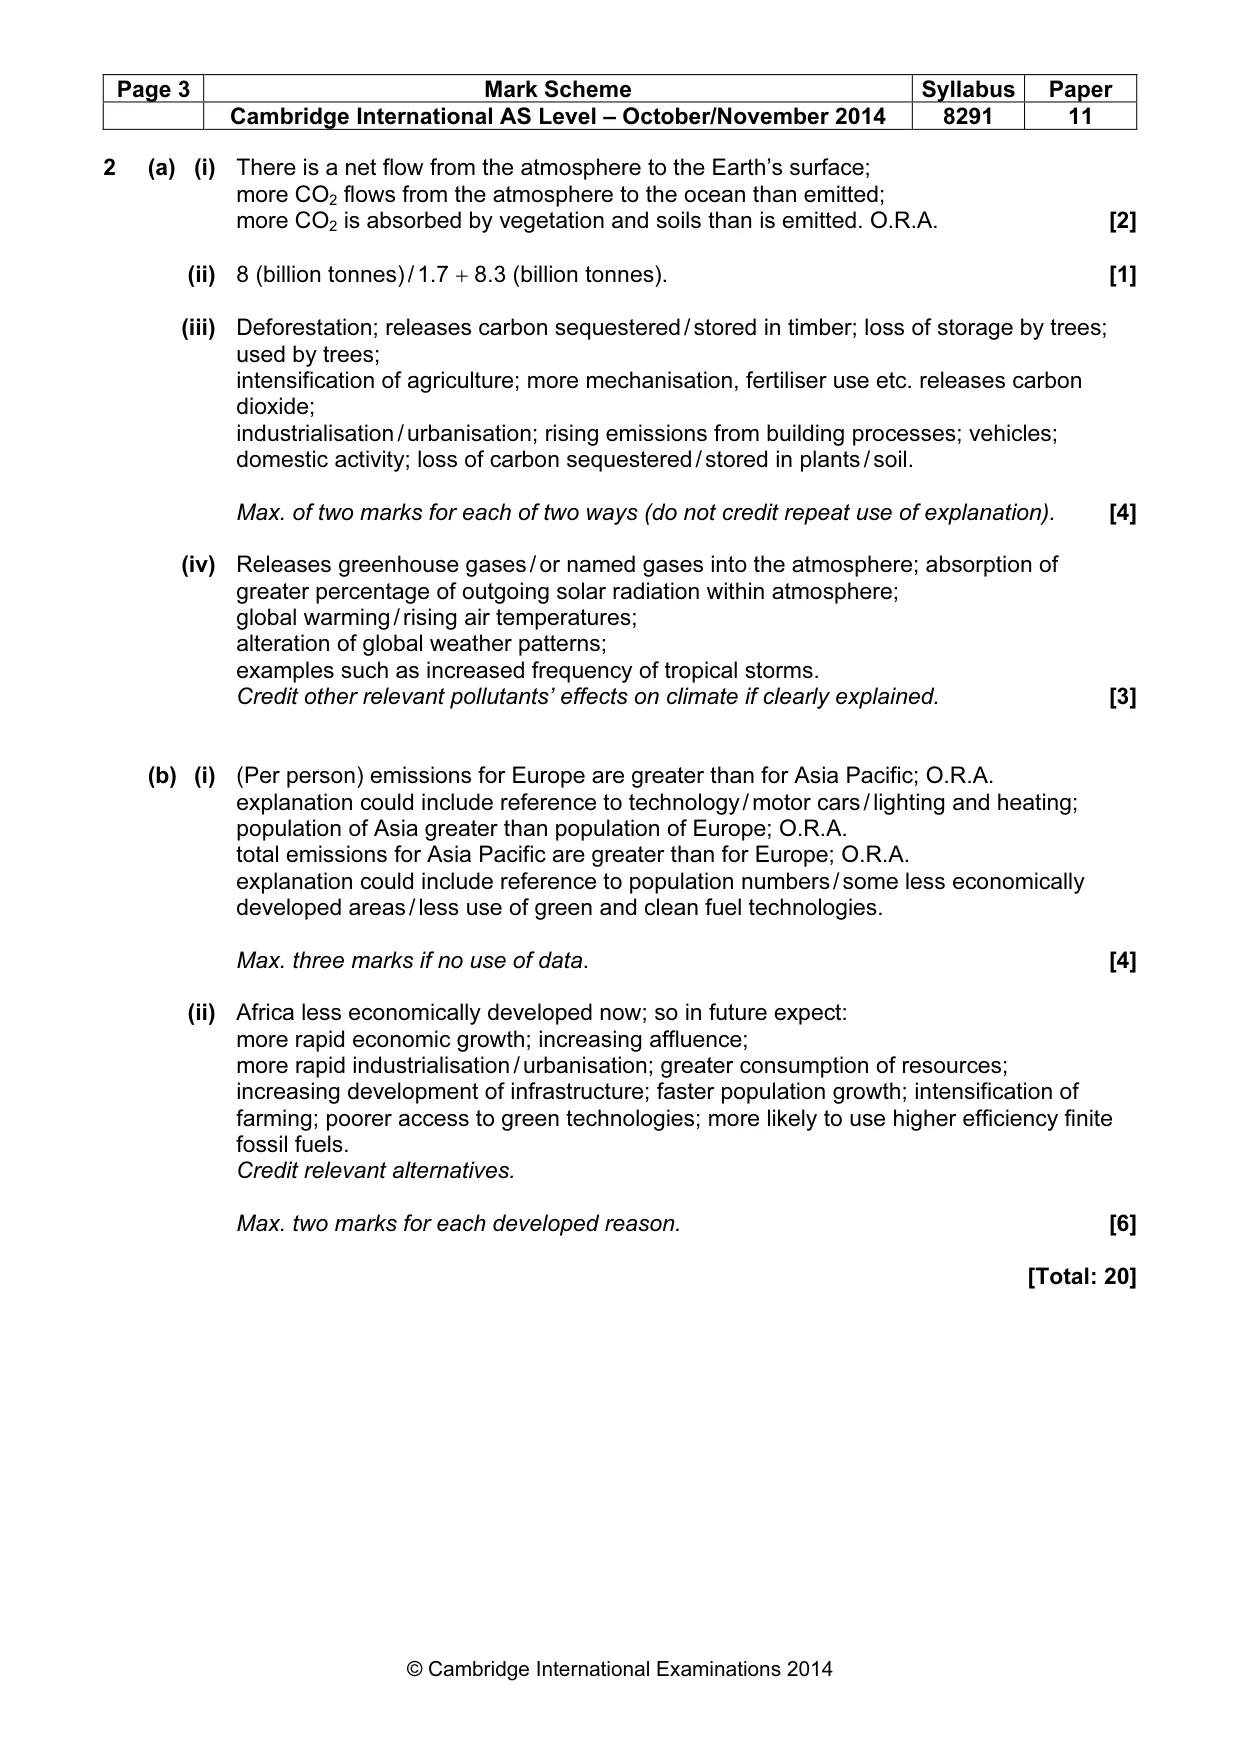
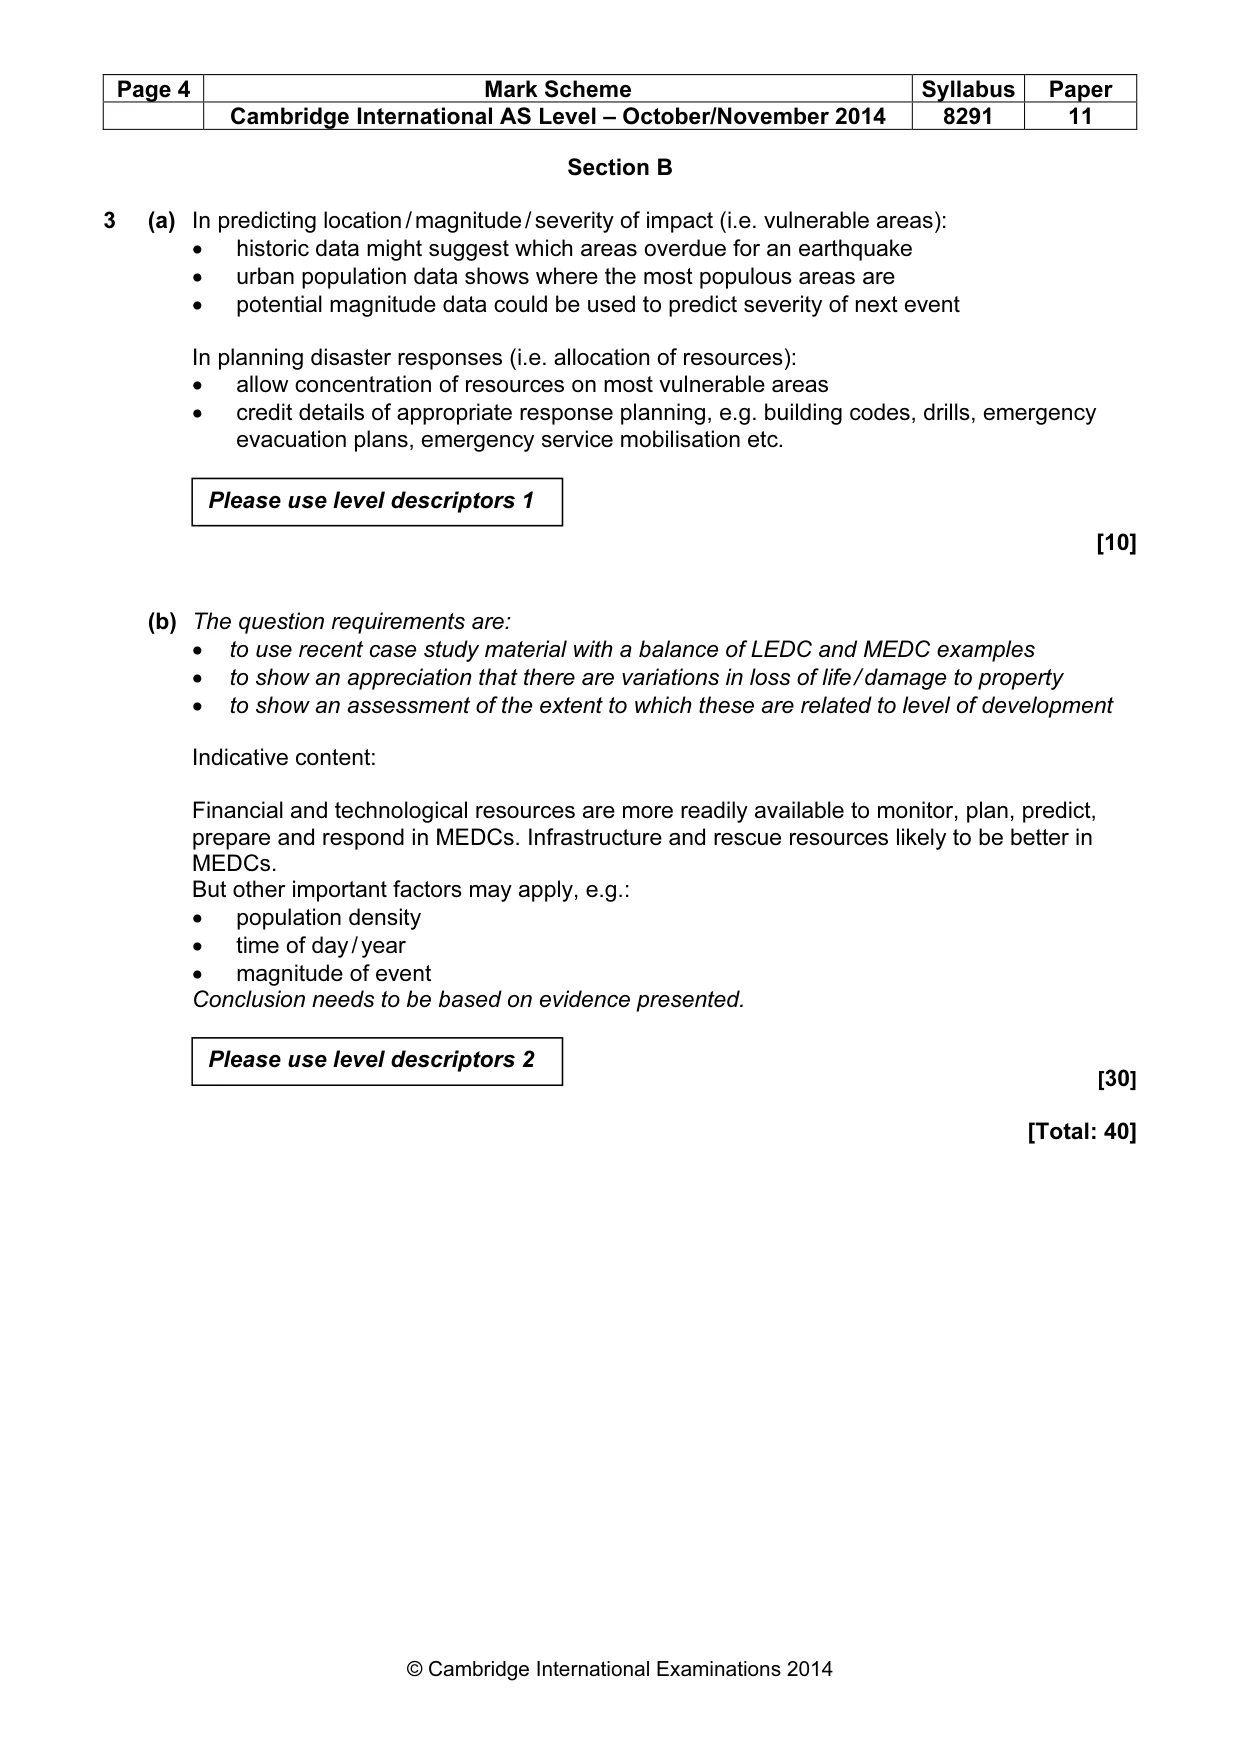
Paper as text
Question paper, page 1
This document consists of 12 printed pages. DC (SJF/JG) 81132/4 © UCLES 2014 [Turn over Cambridge International Examinations Cambridge International Advanced Subsidiary Level * 0 2 1 4 1 9 3 1 0 5 * ENVIRONMENTAL MANAGEMENT 8291/11 Paper 1 Lithosphere and Atmosphere October/November 2014 1 hour 30 minutes Additional Materials: Answer Booklet/Paper READ THESE INSTRUCTIONS FIRST Write your Centre number, candidate number and name on all the work you hand in. Write in dark blue or black pen. You may use an HB pencil for any diagrams or graphs. Do not use staples, paper clips, glue or correction fluid. DO NOT WRITE IN ANY BARCODES. Electronic calculators may be used. You may lose marks if you do not show your working or if you do not use appropriate units. Section A Answer all questions. Write your answers in the spaces provided on the question paper. Section B Answer one question from this section. Answer the question on the separate answer paper provided. At the end of the examination, 1. fasten all separate answer paper securely to the question paper; 2. enter the question number from Section B in the grid opposite. For Examiner’s Use Section A 1 2 Section B Total
Question paper, page 2
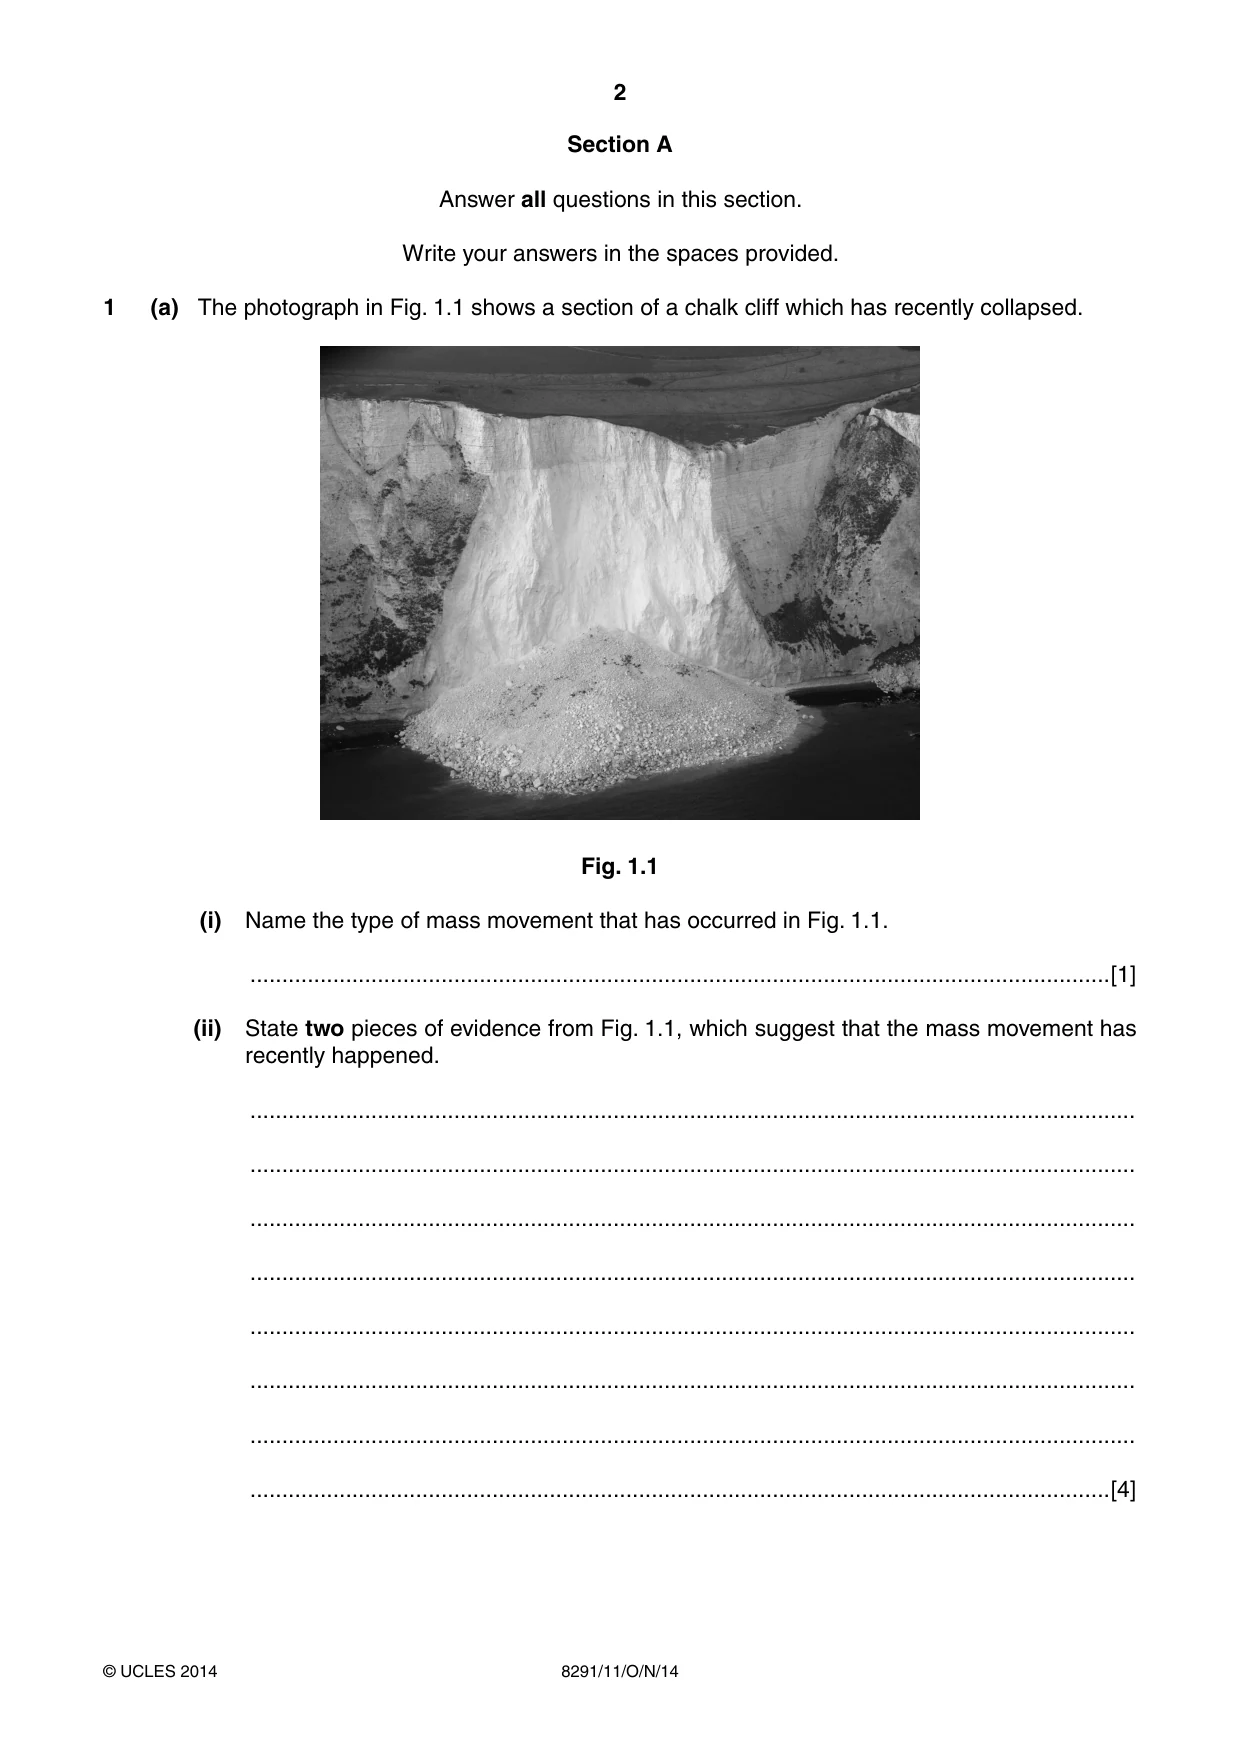
2 8291/11/O/N/14 © UCLES 2014 Section A Answer all questions in this section. Write your answers in the spaces provided. 1 (a) The photograph in Fig. 1.1 shows a section of a chalk cliff which has recently collapsed. Fig. 1.1 (i) Name the type of mass movement that has occurred in Fig. 1.1. …[1] (ii) State two pieces of evidence from Fig. 1.1, which suggest that the mass movement has recently happened. … … … … … … … …[4]
Question paper, page 3
3 8291/11/O/N/14 © UCLES 2014 [Turn over (iii) Explain why the largest rock fragments shown in Fig. 1.1 have travelled furthest away from the cliff. … … … …[2] (iv) Identify and explain one rock weathering process that might operate on the newly exposed sections of cliff face shown in Fig. 1.1. … … … … … …[3]
Question paper, page 4
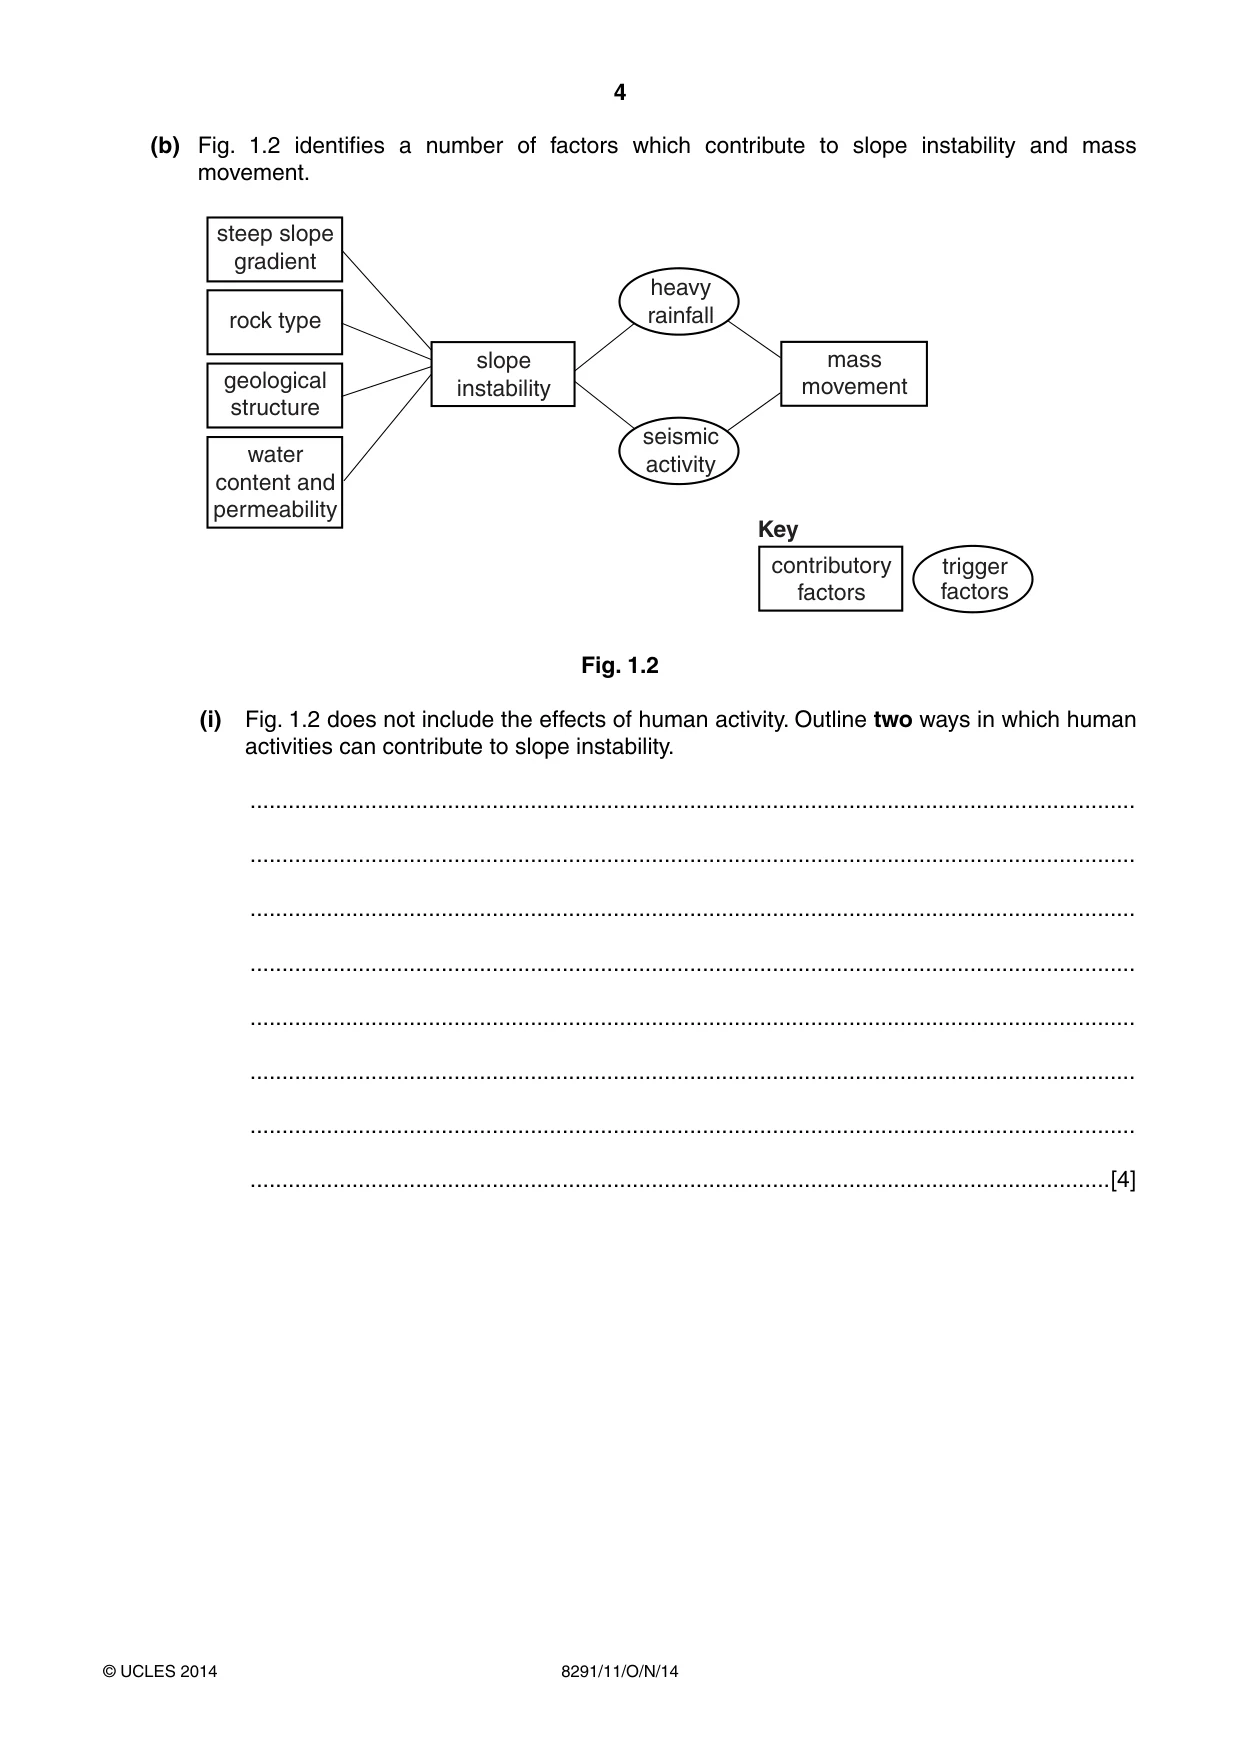
4 8291/11/O/N/14 © UCLES 2014 (b) Fig. 1.2 identifies a number of factors which contribute to slope instability and mass movement. steep slope gradient rock type geological structure slope instability mass movement water content and permeability heavy rainfall seismic activity contributory factors trigger factors Key Fig. 1.2 (i) Fig. 1.2 does not include the effects of human activity. Outline two ways in which human activities can contribute to slope instability. … … … … … … … …[4]
Question paper, page 5
5 8291/11/O/N/14 © UCLES 2014 [Turn over (ii) With reference to Fig. 1.2, explain why some slopes are more unstable than others. … … … … … … … … … … … …[6] [Total: 20]
Question paper, page 6
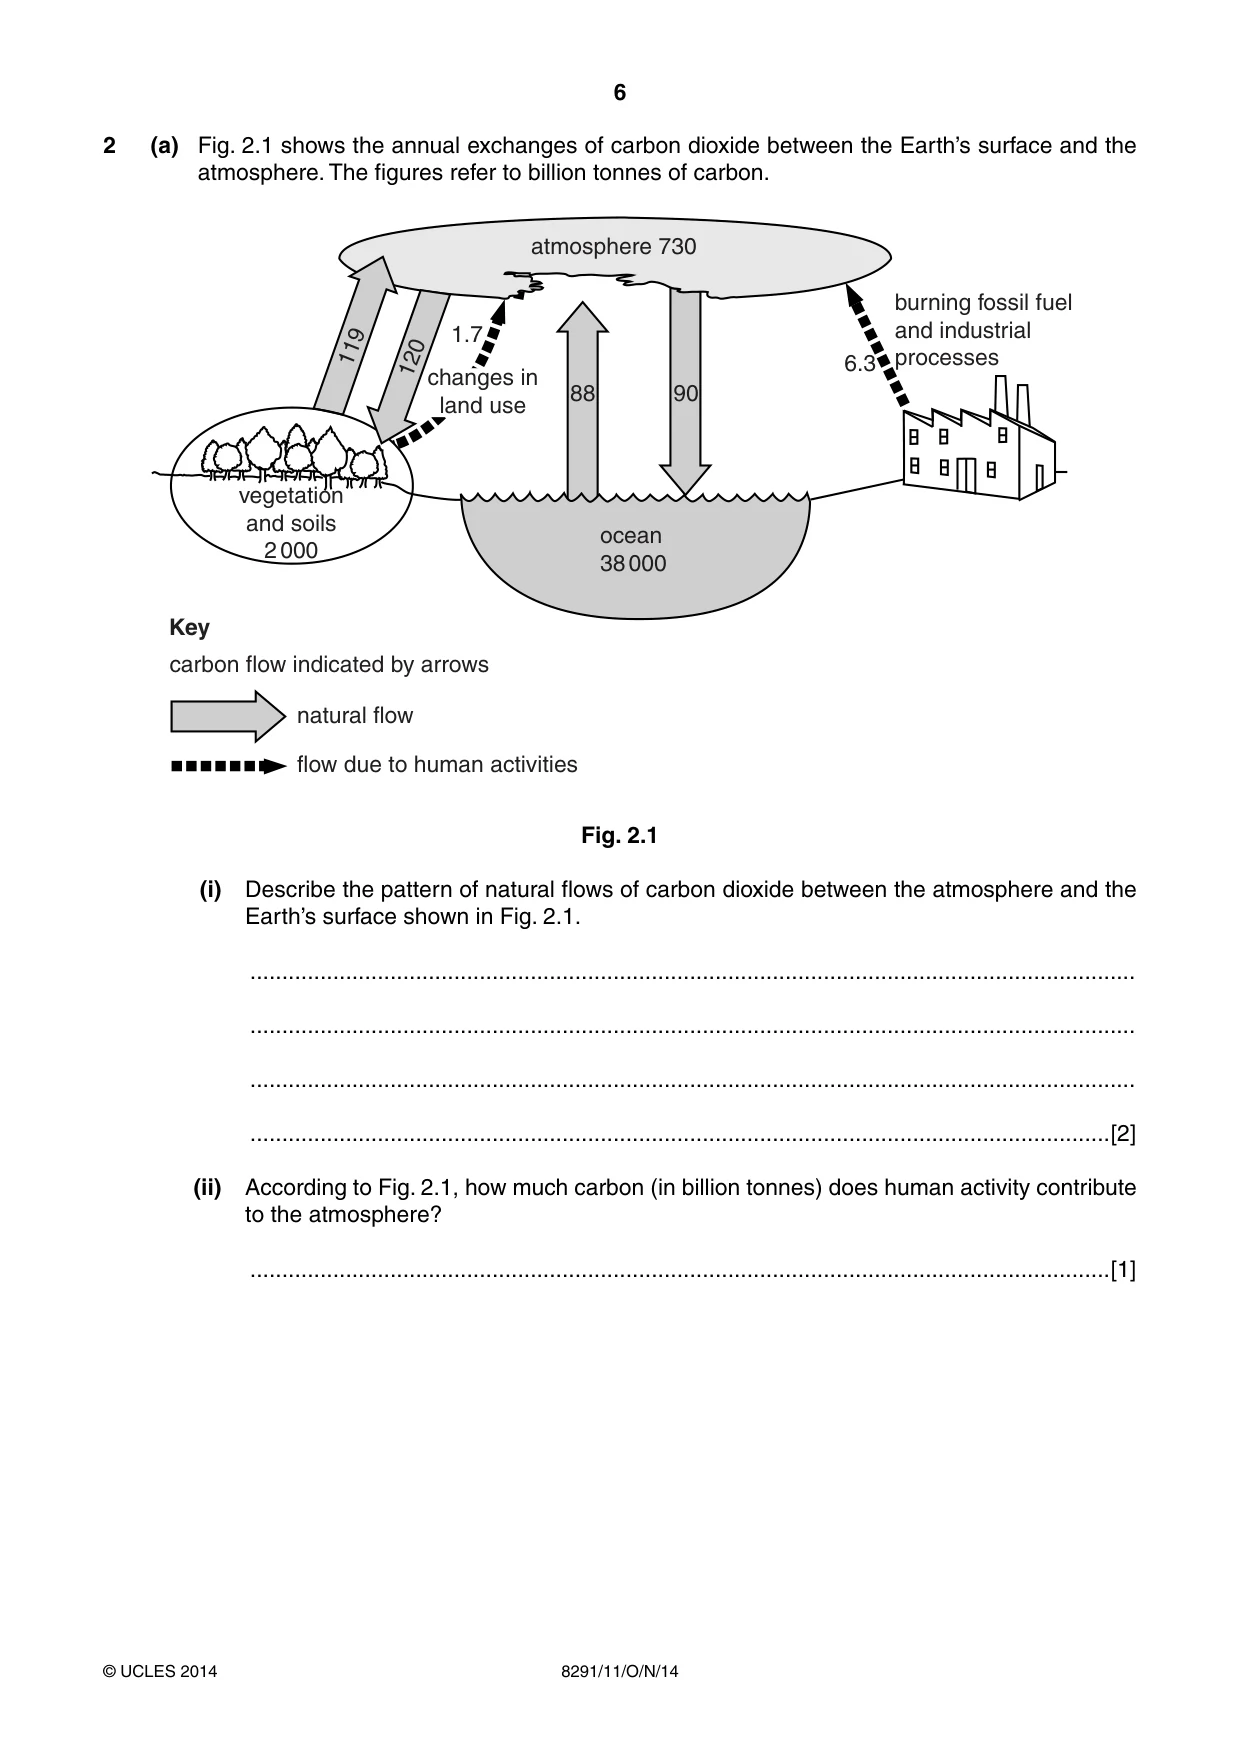
6 8291/11/O/N/14 © UCLES 2014 2 (a) Fig. 2.1 shows the annual exchanges of carbon dioxide between the Earth’s surface and the atmosphere. The figures refer to billion tonnes of carbon. atmosphere 730 ocean 38 000 burning fossil fuel and industrial processes 88 90 6.3 1.7 119 vegetation and soils 2 000 120 changes in land use carbon flow indicated by arrows flow due to human activities natural flow Key Fig. 2.1 (i) Describe the pattern of natural flows of carbon dioxide between the atmosphere and the Earth’s surface shown in Fig. 2.1. … … … …[2] (ii) According to Fig. 2.1, how much carbon (in billion tonnes) does human activity contribute to the atmosphere? …[1]
Question paper, page 7
7 8291/11/O/N/14 © UCLES 2014 [Turn over (iii) Describe and explain two ways that changes in land use might result in an increase in carbon dioxide in the atmosphere. … … … … … … … …[4] (iv) Briefly describe the effect that burning fossil fuels has on global climate. … … … … … …[3]
Question paper, page 8
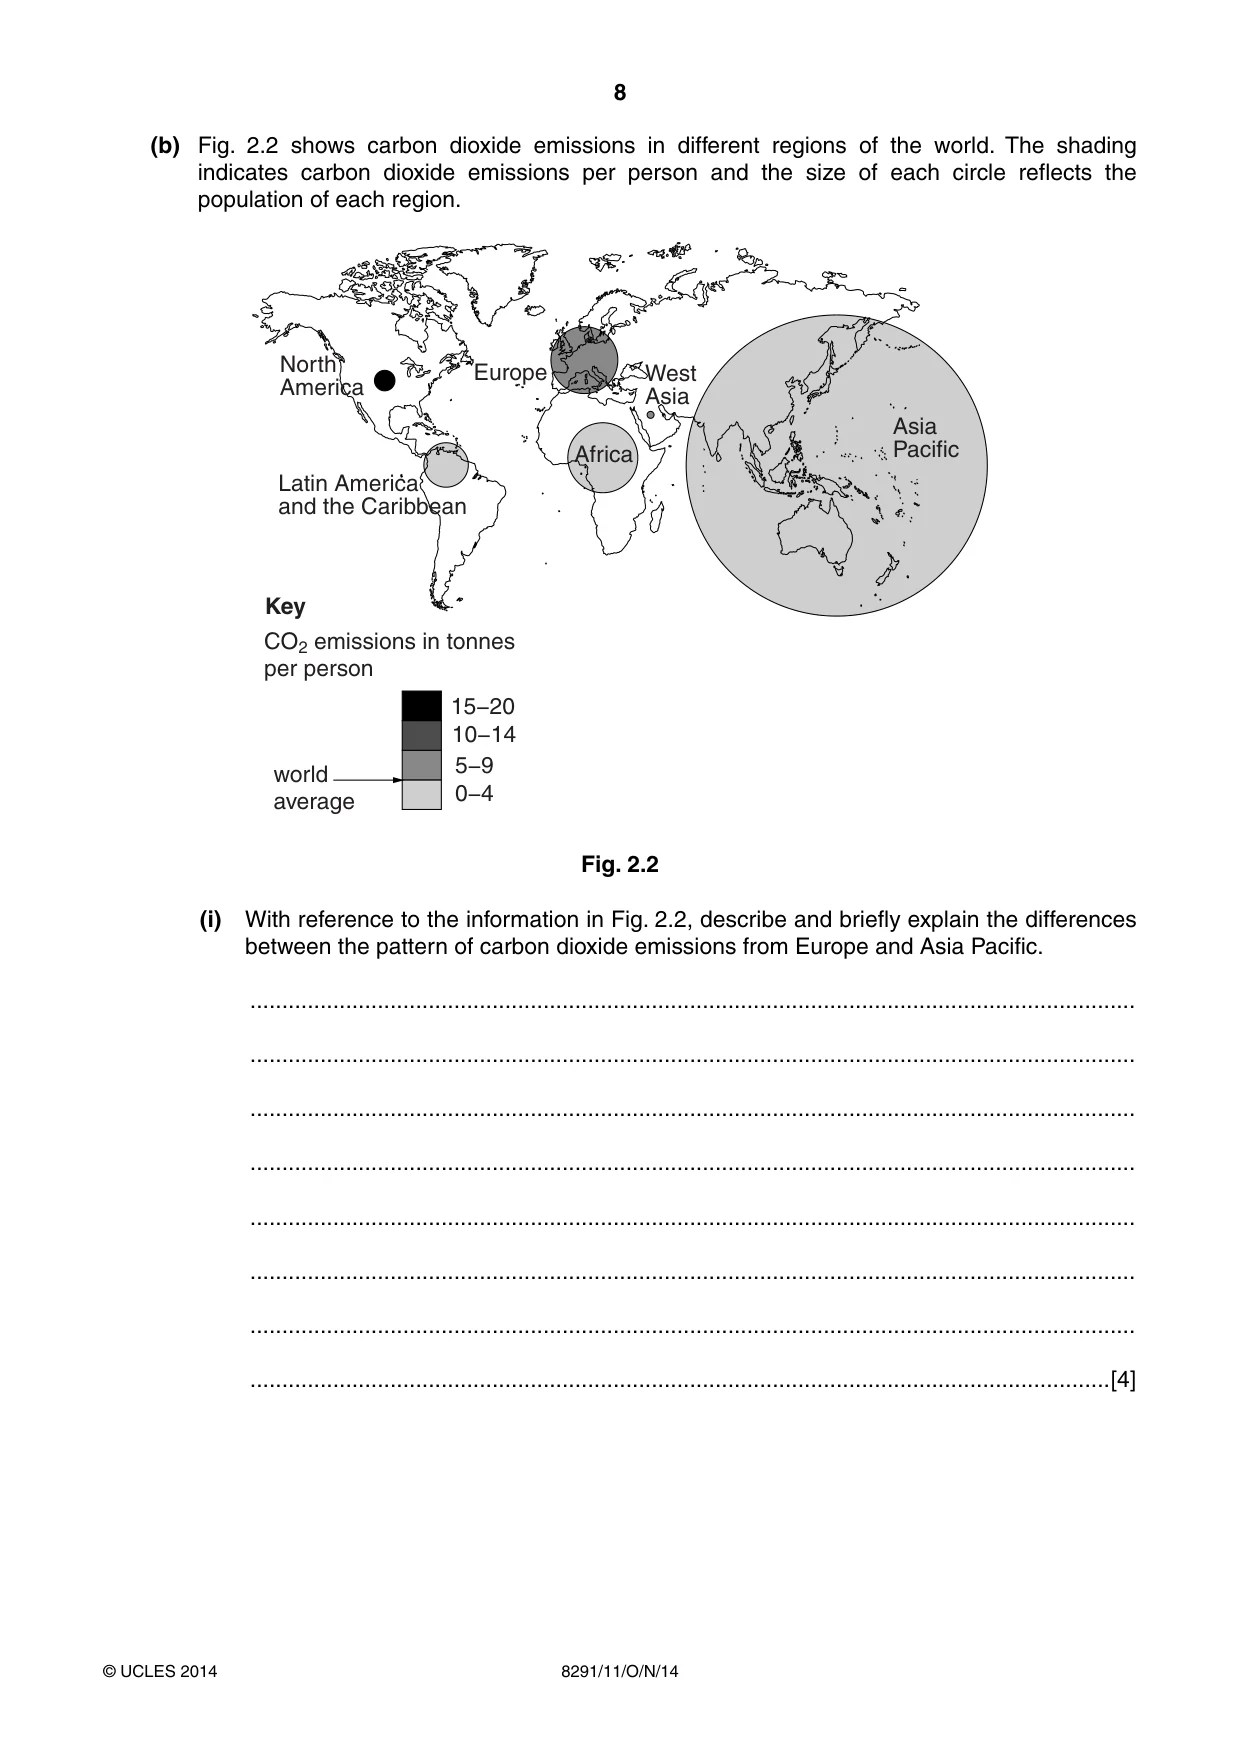
8 8291/11/O/N/14 © UCLES 2014 (b) Fig. 2.2 shows carbon dioxide emissions in different regions of the world. The shading indicates carbon dioxide emissions per person and the size of each circle reflects the population of each region. Latin America and the Caribbean CO2 emissions in tonnes per person 15−20 10−14 5−9 0−4 world average Key West Asia Asia Pacific Europe North America Africa Fig. 2.2 (i) With reference to the information in Fig. 2.2, describe and briefly explain the differences between the pattern of carbon dioxide emissions from Europe and Asia Pacific. … … … … … … … …[4]
Question paper, page 9
9 8291/11/O/N/14 © UCLES 2014 [Turn over (ii) Suggest three reasons why Africa’s per person carbon dioxide emissions might be expected to grow faster than Europe’s in the future. … … … … … … … … … … … …[6] [Total: 20]
Question paper, page 10
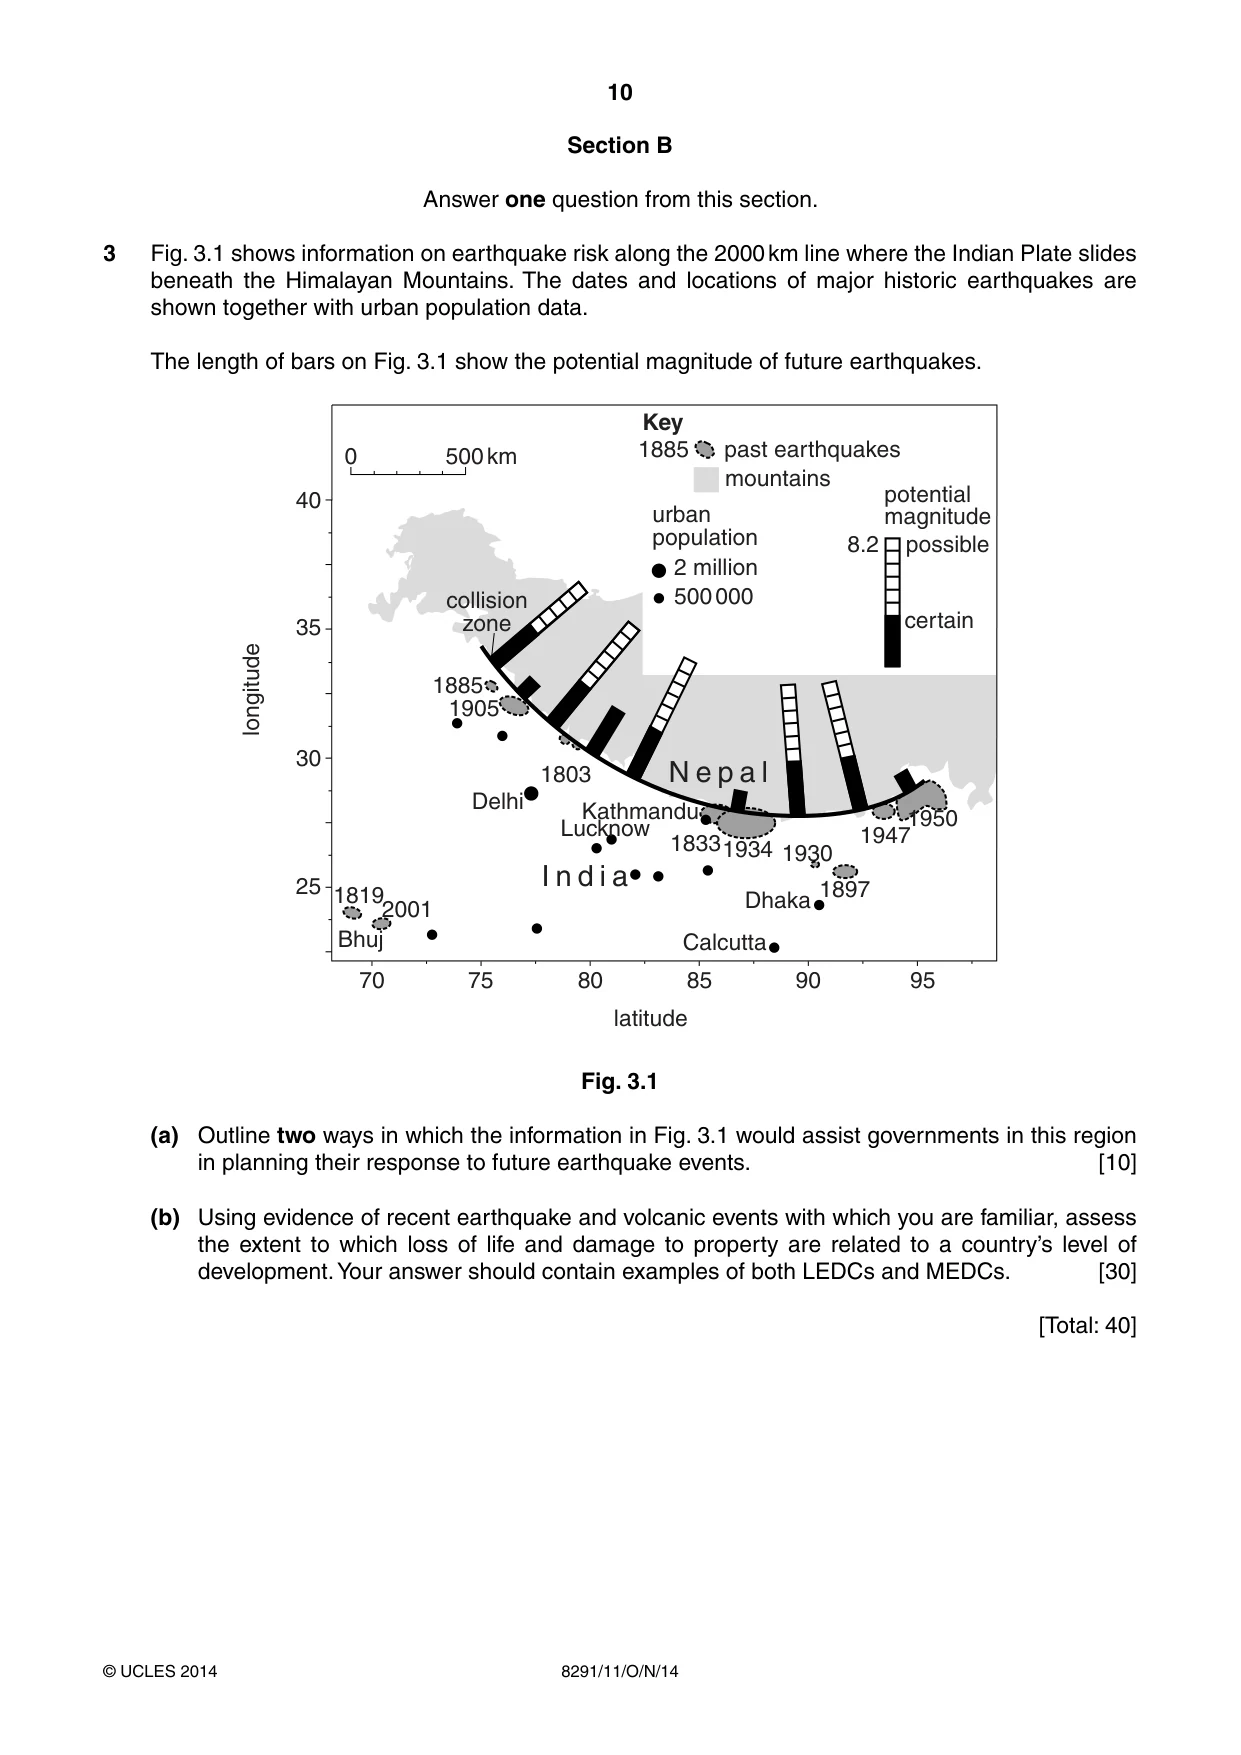
10 8291/11/O/N/14 © UCLES 2014 Section B Answer one question from this section. 3 Fig. 3.1 shows information on earthquake risk along the 2000 km line where the Indian Plate slides beneath the Himalayan Mountains. The dates and locations of major historic earthquakes are shown together with urban population data. The length of bars on Fig. 3.1 show the potential magnitude of future earthquakes. 40 35 1885 1885 18192001 1905 1803 18331934 1930 1947 1897 30 25 70 75 80 85 90 95 1950 Delhi Calcutta Lucknow Kathmandu collision zone Dhaka Bhuj 0 500 km N e p a l I n d i a past earthquakes mountains 8.2 certain possible potential magnitude urban population 2 million 500 000 Key latitude longitude Fig. 3.1 (a) Outline two ways in which the information in Fig. 3.1 would assist governments in this region in planning their response to future earthquake events. [10] (b) Using evidence of recent earthquake and volcanic events with which you are familiar, assess the extent to which loss of life and damage to property are related to a country’s level of development. Your answer should contain examples of both LEDCs and MEDCs. [30] [Total: 40]
Question paper, page 11
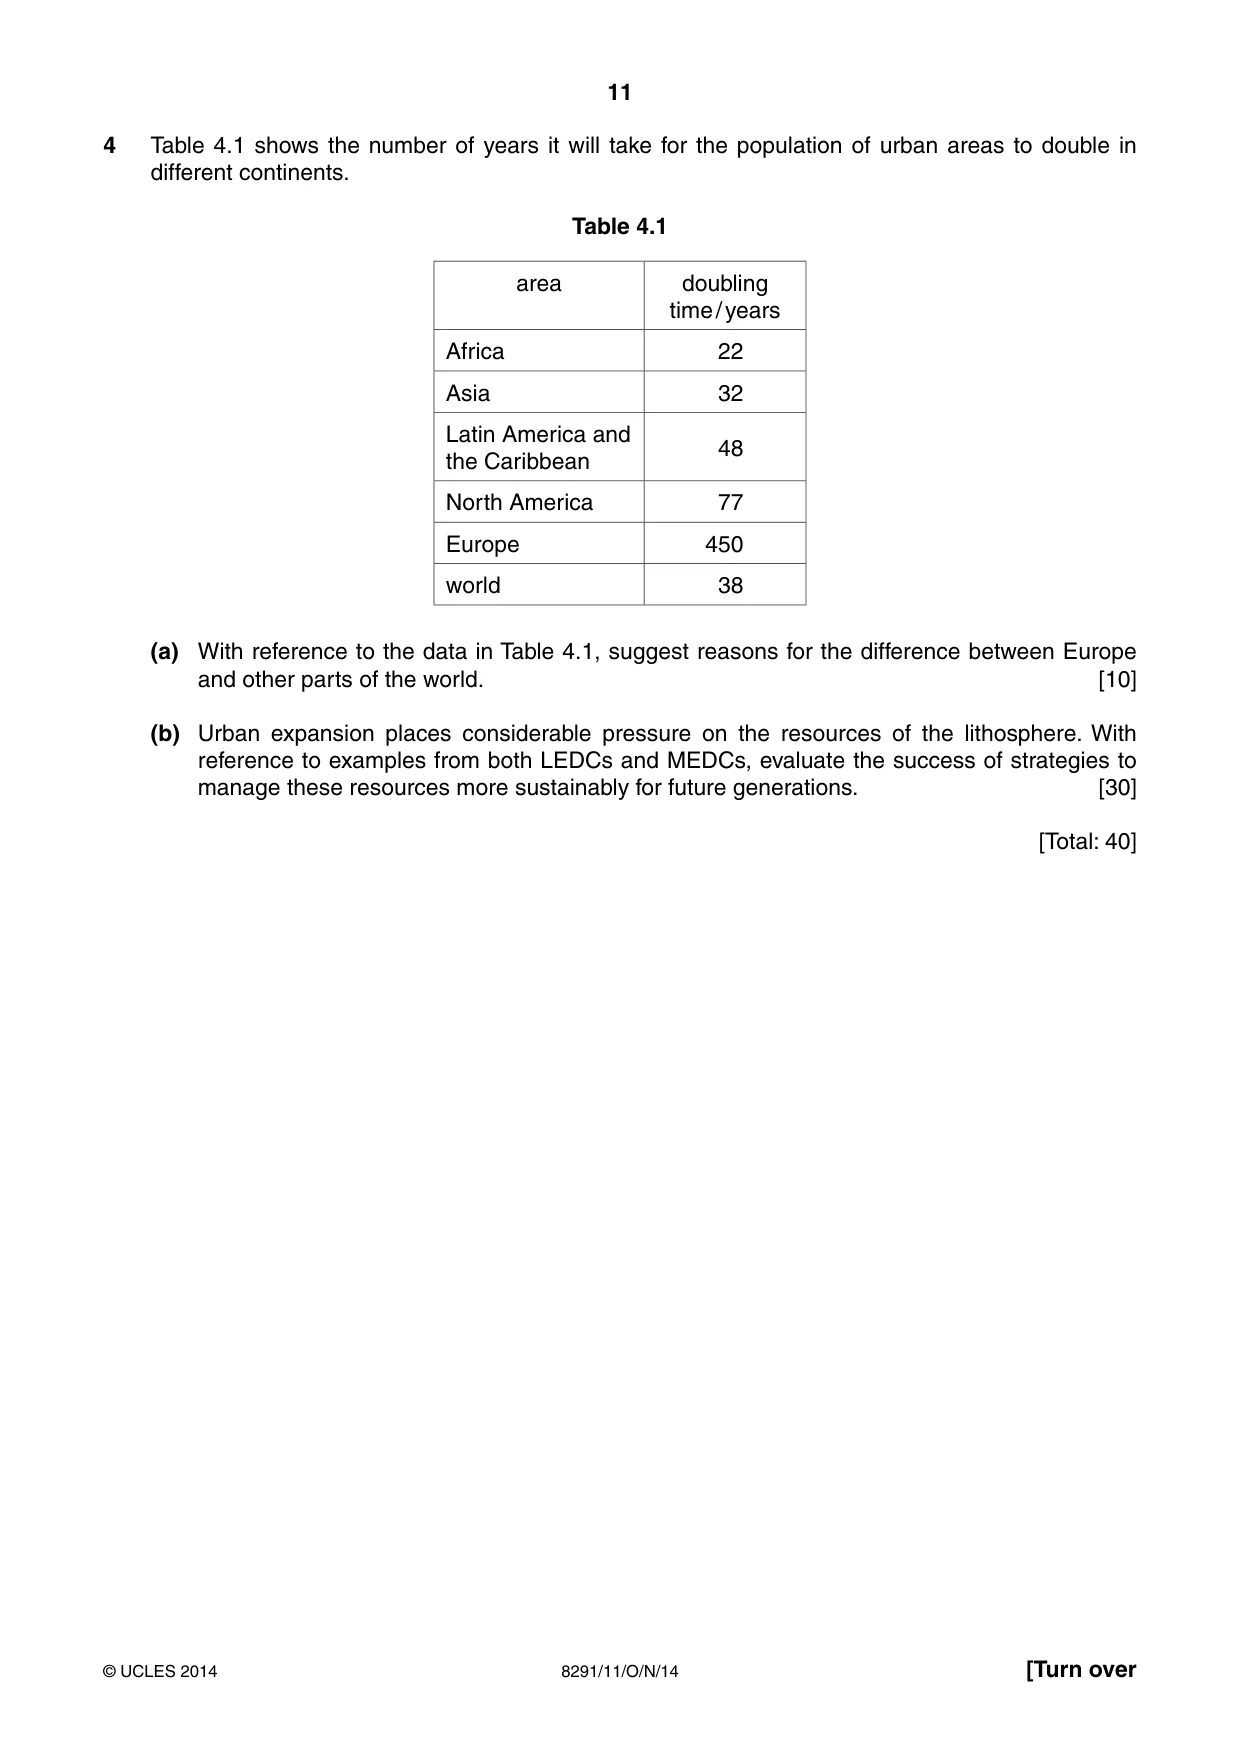
11 8291/11/O/N/14 © UCLES 2014 [Turn over 4 Table 4.1 shows the number of years it will take for the population of urban areas to double in different continents. Table 4.1 area doubling time / years Africa 22 Asia 32 Latin America and the Caribbean 48 North America 77 Europe 450 world 38 (a) With reference to the data in Table 4.1, suggest reasons for the difference between Europe and other parts of the world. [10] (b) Urban expansion places considerable pressure on the resources of the lithosphere. With reference to examples from both LEDCs and MEDCs, evaluate the success of strategies to manage these resources more sustainably for future generations. [30] [Total: 40]
Question paper, page 12
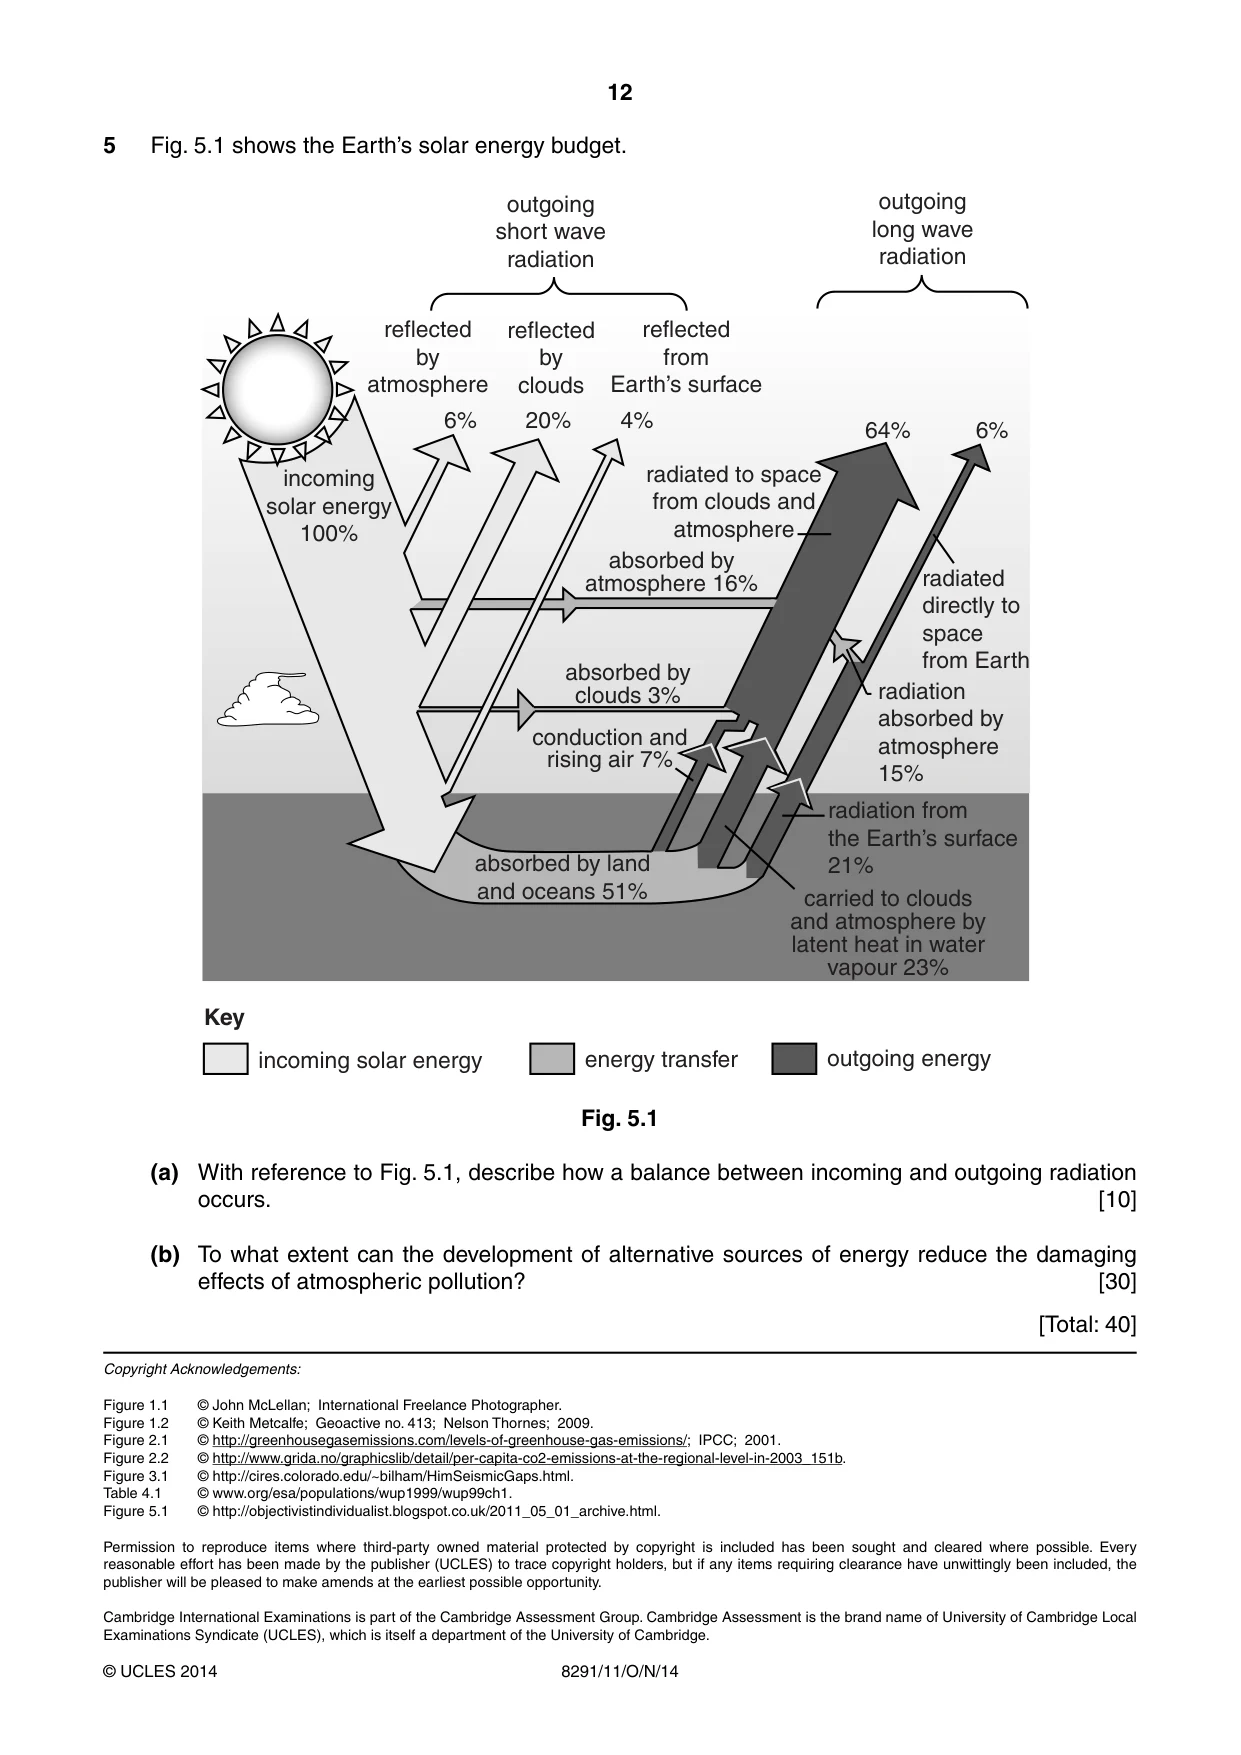
12 8291/11/O/N/14 © UCLES 2014 5 Fig. 5.1 shows the Earth’s solar energy budget. incoming solar energy 100% absorbed by land and oceans 51% radiated to space from clouds and atmosphere absorbed by atmosphere 16% absorbed by clouds 3% conduction and rising air 7% 64% 6% reflected by atmosphere radiation absorbed by atmosphere 15% radiation from the Earth’s surface 21% radiated directly to space from Earth reflected by clouds reflected from Earth’s surface outgoing short wave radiation outgoing long wave radiation carried to clouds and atmosphere by latent heat in water vapour 23% 6% 20% 4% Key incoming solar energy energy transfer outgoing energy Fig. 5.1 (a) With reference to Fig. 5.1, describe how a balance between incoming and outgoing radiation occurs. [10] (b) To what extent can the development of alternative sources of energy reduce the damaging effects of atmospheric pollution? [30] [Total: 40] Copyright Acknowledgements: Figure 1.1 © John McLellan; International Freelance Photographer. Figure 1.2 © Keith Metcalfe; Geoactive no. 413; Nelson Thornes; 2009. Figure 2.1 © http://greenhousegasemissions.com/levels-of-greenhouse-gas-emissions/; IPCC; 2001. Figure 2.2 © http://www.grida.no/graphicslib/detail/per-capita-co2-emissions-at-the-regional-level-in-2003_151b. Figure 3.1 © http://cires.colorado.edu/~bilham/HimSeismicGaps.html. Table 4.1 © www.org/esa/populations/wup1999/wup99ch1. Figure 5.1 © http://objectivistindividualist.blogspot.co.uk/2011_05_01_archive.html. Permission to reproduce items where third-party owned material protected by copyright is included has been sought and cleared where possible. Every reasonable effort has been made by the publisher (UCLES) to trace copyright holders, but if any items requiring clearance have unwittingly been included, the publisher will be pleased to make amends at the earliest possible opportunity. Cambridge International Examinations is part of the Cambridge Assessment Group. Cambridge Assessment is the brand name of University of Cambridge Local Examinations Syndicate (UCLES), which is itself a department of the University of Cambridge.
Mark scheme, page 1
® IGCSE is the registered trademark of Cambridge International Examinations. CAMBRIDGE INTERNATIONAL EXAMINATIONS Cambridge International Advanced Subsidiary Level MARK SCHEME for the October/November 2014 series 8291 ENVIRONMENTAL MANAGEMENT 8291/11 Paper 1, maximum raw mark 80 This mark scheme is published as an aid to teachers and candidates, to indicate the requirements of the examination. It shows the basis on which Examiners were instructed to award marks. It does not indicate the details of the discussions that took place at an Examiners’ meeting before marking began, which would have considered the acceptability of alternative answers. Mark schemes should be read in conjunction with the question paper and the Principal Examiner Report for Teachers. Cambridge will not enter into discussions about these mark schemes. Cambridge is publishing the mark schemes for the October/November 2014 series for most Cambridge IGCSE®, Cambridge International A and AS Level components and some Cambridge O Level components.
Mark scheme, page 2
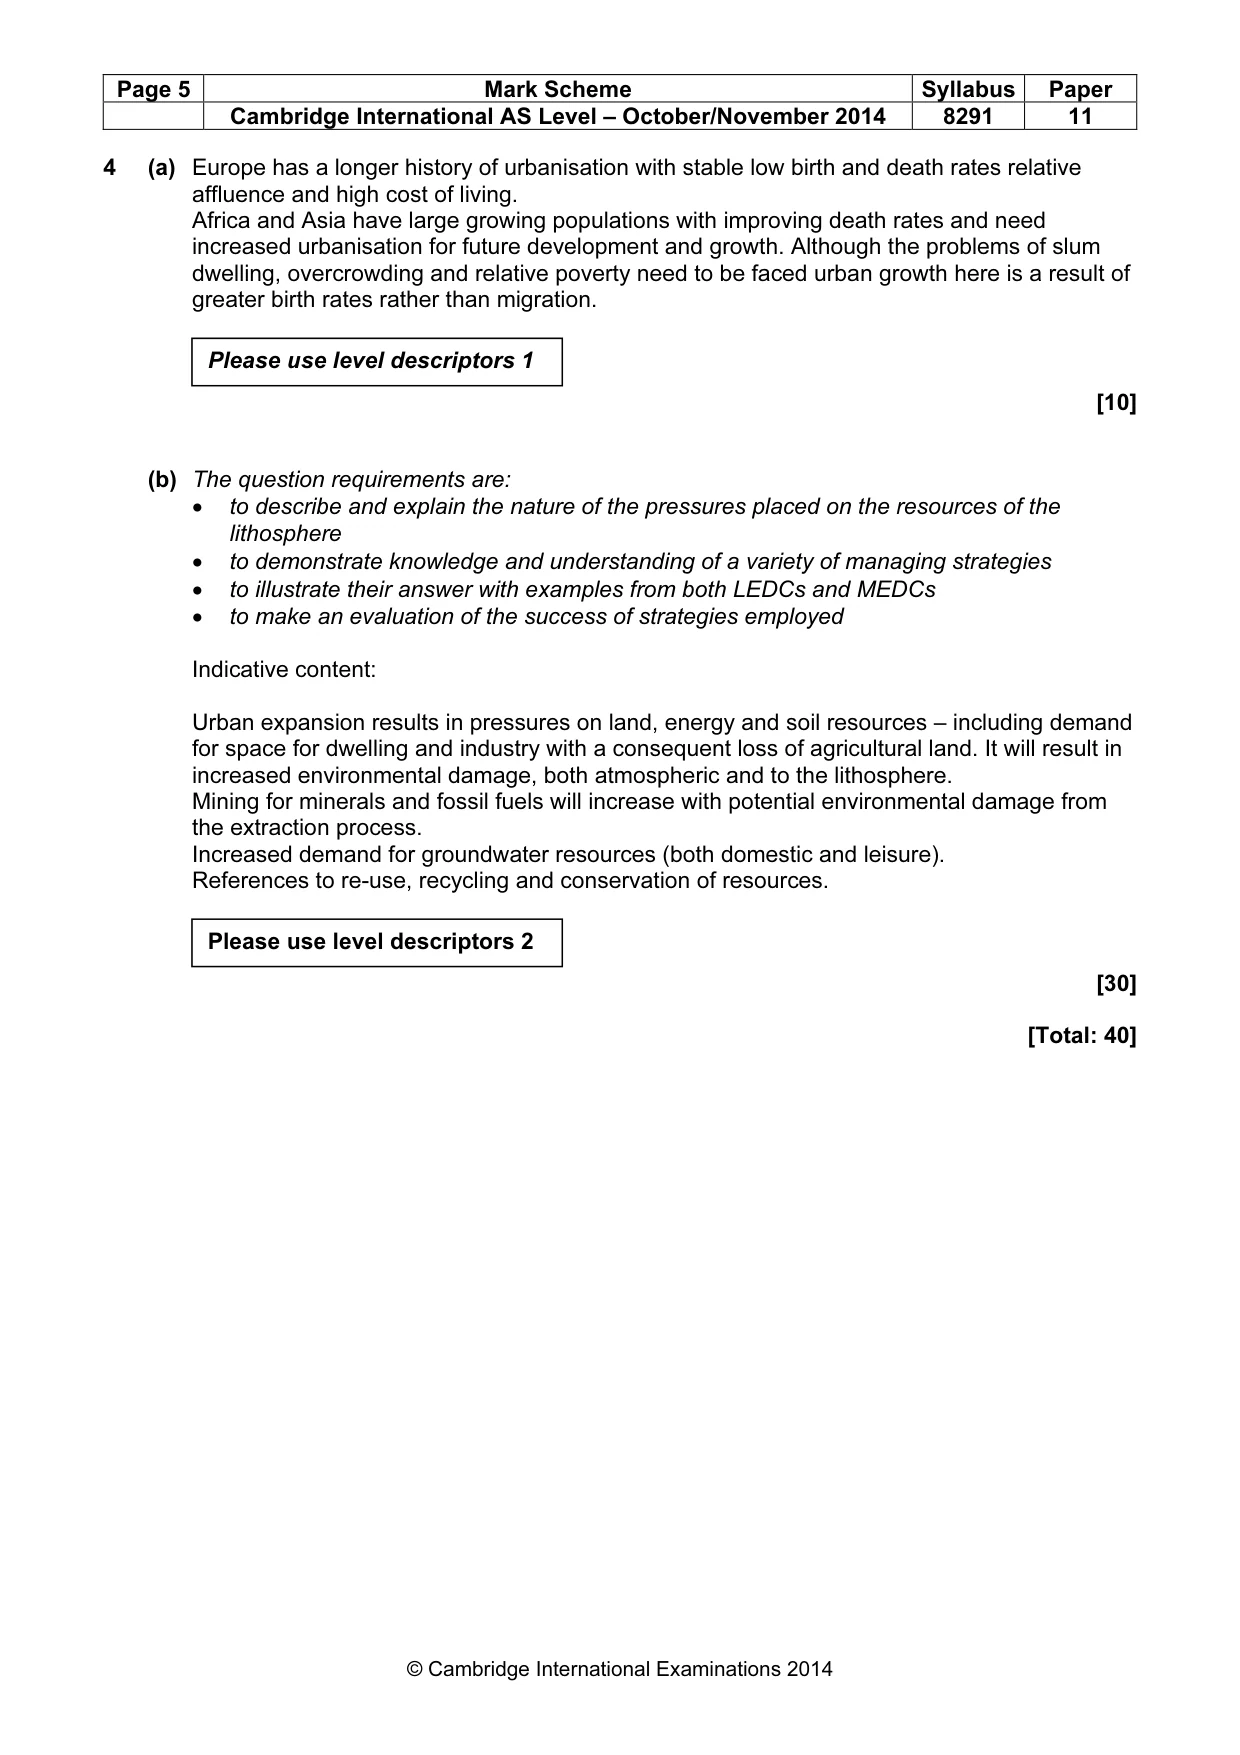
Page 2 Mark Scheme Syllabus Paper Cambridge International AS Level – October/November 2014 8291 11 © Cambridge International Examinations 2014 Section A 1 (a) (i) Rock fall / rockslide / landslide. [1] (ii) Bright white colour of cliff and / or debris; suggests lack of weathering; absence of vegetation; suggests insufficient time to colonise; limited erosion of debris at cliff foot; suggests limited time for wave action; smoothness / sharpness. One mark for evidence plus one mark for detail for each piece of evidence. [4] (iii) Largest fragments are heavier / denser; greater gravitational effect / roll further O.R.A. [2] (iv) Pressure release; frost action; thermal expansion and contraction; solution; carbonation; hydration; oxidation; biological weathering. One mark for identifying, two marks for correctly explaining process. [3] (b) (i) Undercutting; quarrying; road and site building may increase slope angle; mining; pipe laying; blasting; traffic vibration; adding a load such as spoil heap or buildings; deforestation removes binding tree roots and promotes runoff; inappropriate farming techniques; terracing; altering the slope angle; Credit alternatives. One mark for identifying each relevant activity, additional mark for explaining how it contributes to slope instability. [4] (ii) Steep slope: steeper the gradient, the more the gravitational effect Rock type: more unconsolidated / weaker the rock Structure: more heavily jointed / faulted / unfavourable dip of bedding planes High water content: leads to high pore water pressure in porous rock / lubrication Vegetation: bare slopes / no plant roots to bind, plant cover protects surface Undercutting: agent of erosion at slope foot, e.g. river, sea, glacier Credit alternatives. Max. three marks for any one developed factor. Max. four marks if no explanation. [6] [Total: 20]
Mark scheme, page 3
Page 3 Mark Scheme Syllabus Paper Cambridge International AS Level – October/November 2014 8291 11 © Cambridge International Examinations 2014 2 (a) (i) There is a net flow from the atmosphere to the Earth’s surface; more CO2 flows from the atmosphere to the ocean than emitted; more CO2 is absorbed by vegetation and soils than is emitted. O.R.A. [2] (ii) 8 (billion tonnes) / 1.7 + 8.3 (billion tonnes). [1] (iii) Deforestation; releases carbon sequestered / stored in timber; loss of storage by trees; used by trees; intensification of agriculture; more mechanisation, fertiliser use etc. releases carbon dioxide; industrialisation / urbanisation; rising emissions from building processes; vehicles; domestic activity; loss of carbon sequestered / stored in plants / soil. Max. of two marks for each of two ways (do not credit repeat use of explanation). [4] (iv) Releases greenhouse gases / or named gases into the atmosphere; absorption of greater percentage of outgoing solar radiation within atmosphere; global warming / rising air temperatures; alteration of global weather patterns; examples such as increased frequency of tropical storms. Credit other relevant pollutants’ effects on climate if clearly explained. [3] (b) (i) (Per person) emissions for Europe are greater than for Asia Pacific; O.R.A. explanation could include reference to technology / motor cars / lighting and heating; population of Asia greater than population of Europe; O.R.A. total emissions for Asia Pacific are greater than for Europe; O.R.A. explanation could include reference to population numbers / some less economically developed areas / less use of green and clean fuel technologies. Max. three marks if no use of data. [4] (ii) Africa less economically developed now; so in future expect: more rapid economic growth; increasing affluence; more rapid industrialisation / urbanisation; greater consumption of resources; increasing development of infrastructure; faster population growth; intensification of farming; poorer access to green technologies; more likely to use higher efficiency finite fossil fuels. Credit relevant alternatives. Max. two marks for each developed reason. [6] [Total: 20]
Mark scheme, page 4
Page 4 Mark Scheme Syllabus Paper Cambridge International AS Level – October/November 2014 8291 11 © Cambridge International Examinations 2014 Please use level descriptors 2 Section B 3 (a) In predicting location / magnitude / severity of impact (i.e. vulnerable areas): • historic data might suggest which areas overdue for an earthquake • urban population data shows where the most populous areas are • potential magnitude data could be used to predict severity of next event In planning disaster responses (i.e. allocation of resources): • allow concentration of resources on most vulnerable areas • credit details of appropriate response planning, e.g. building codes, drills, emergency evacuation plans, emergency service mobilisation etc. [10] (b) The question requirements are: • to use recent case study material with a balance of LEDC and MEDC examples • to show an appreciation that there are variations in loss of life / damage to property • to show an assessment of the extent to which these are related to level of development Indicative content: Financial and technological resources are more readily available to monitor, plan, predict, prepare and respond in MEDCs. Infrastructure and rescue resources likely to be better in MEDCs. But other important factors may apply, e.g.: • population density • time of day / year • magnitude of event Conclusion needs to be based on evidence presented. [30] [Total: 40] Please use level descriptors 1
Mark scheme, page 5
Page 5 Mark Scheme Syllabus Paper Cambridge International AS Level – October/November 2014 8291 11 © Cambridge International Examinations 2014 4 (a) Europe has a longer history of urbanisation with stable low birth and death rates relative affluence and high cost of living. Africa and Asia have large growing populations with improving death rates and need increased urbanisation for future development and growth. Although the problems of slum dwelling, overcrowding and relative poverty need to be faced urban growth here is a result of greater birth rates rather than migration. [10] (b) The question requirements are: • to describe and explain the nature of the pressures placed on the resources of the lithosphere • to demonstrate knowledge and understanding of a variety of managing strategies • to illustrate their answer with examples from both LEDCs and MEDCs • to make an evaluation of the success of strategies employed Indicative content: Urban expansion results in pressures on land, energy and soil resources – including demand for space for dwelling and industry with a consequent loss of agricultural land. It will result in increased environmental damage, both atmospheric and to the lithosphere. Mining for minerals and fossil fuels will increase with potential environmental damage from the extraction process. Increased demand for groundwater resources (both domestic and leisure). References to re-use, recycling and conservation of resources. [30] [Total: 40] Please use level descriptors 1 Please use level descriptors 2
Mark scheme, page 6
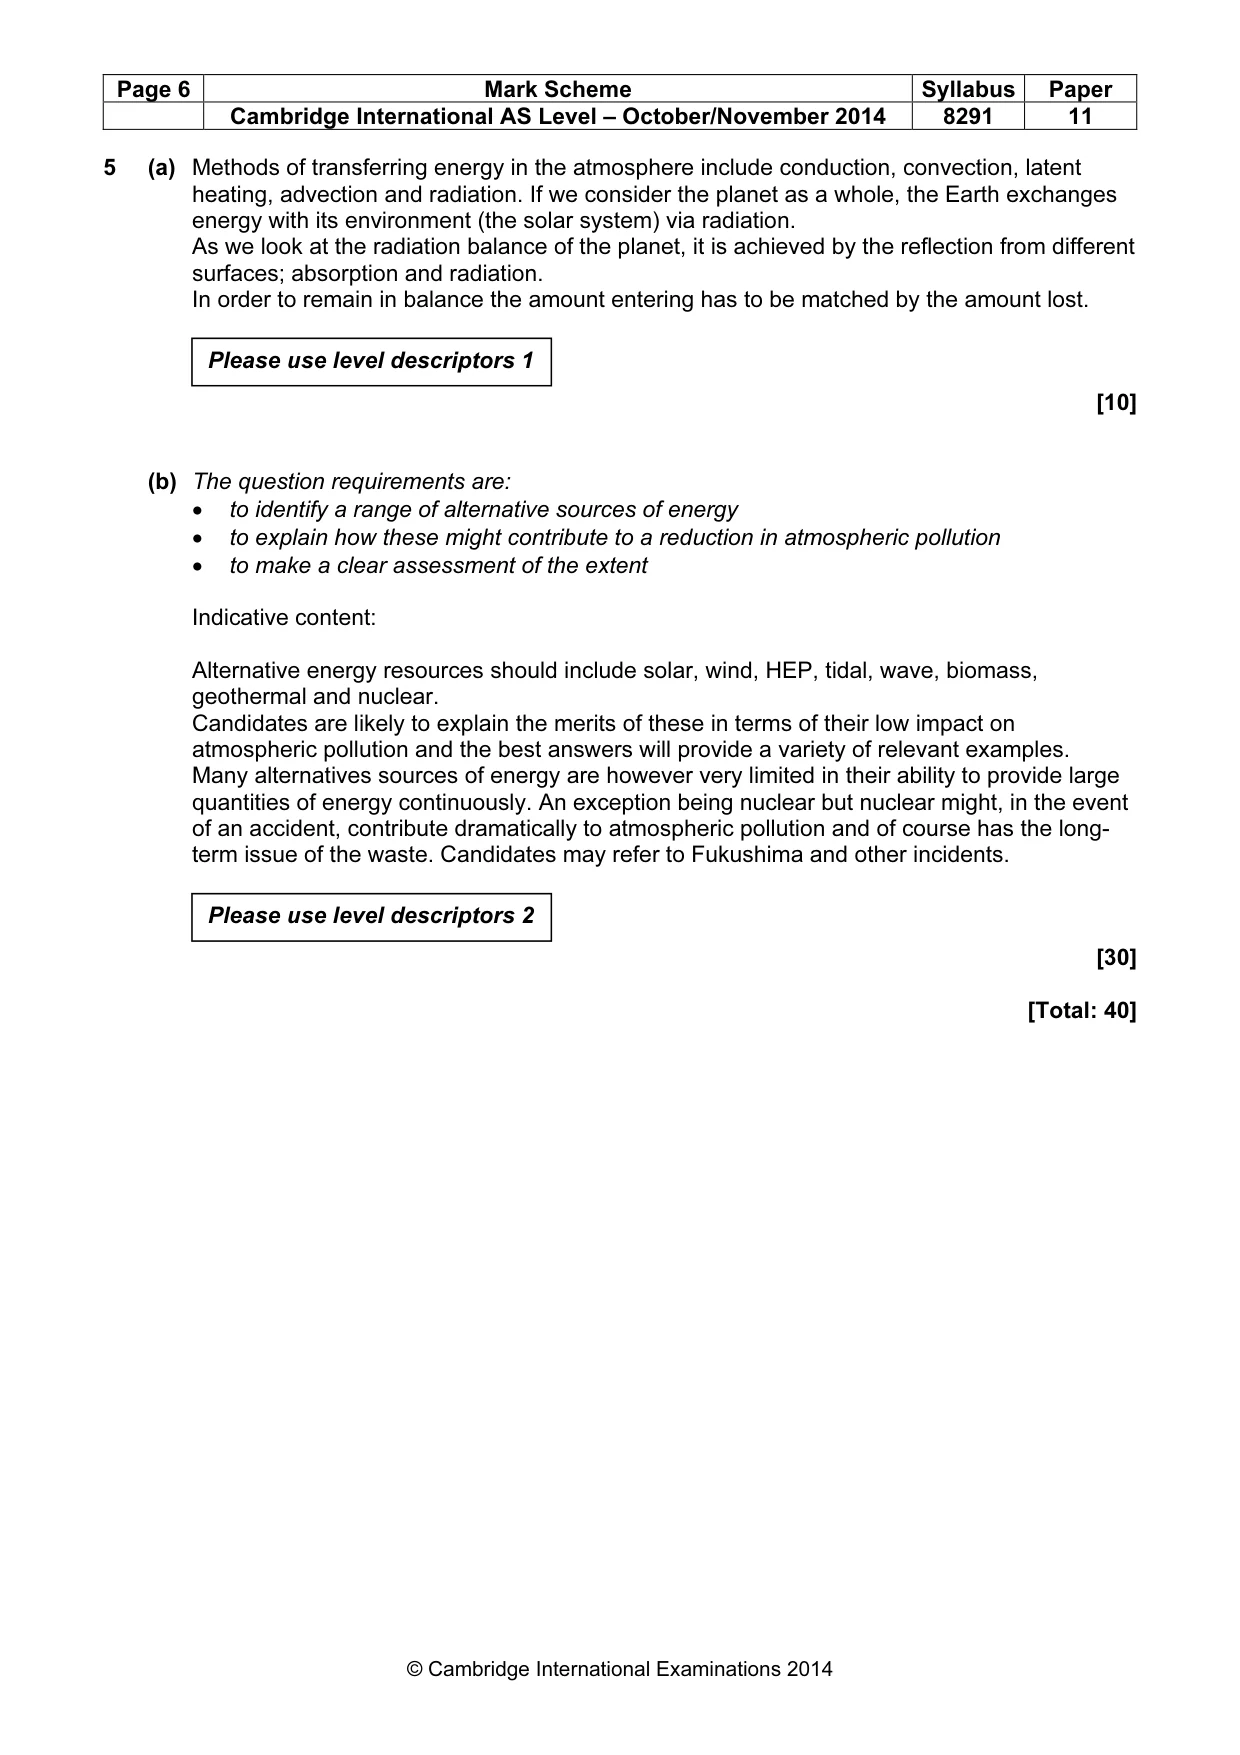
Page 6 Mark Scheme Syllabus Paper Cambridge International AS Level – October/November 2014 8291 11 © Cambridge International Examinations 2014 5 (a) Methods of transferring energy in the atmosphere include conduction, convection, latent heating, advection and radiation. If we consider the planet as a whole, the Earth exchanges energy with its environment (the solar system) via radiation. As we look at the radiation balance of the planet, it is achieved by the reflection from different surfaces; absorption and radiation. In order to remain in balance the amount entering has to be matched by the amount lost. [10] (b) The question requirements are: • to identify a range of alternative sources of energy • to explain how these might contribute to a reduction in atmospheric pollution • to make a clear assessment of the extent Indicative content: Alternative energy resources should include solar, wind, HEP, tidal, wave, biomass, geothermal and nuclear. Candidates are likely to explain the merits of these in terms of their low impact on atmospheric pollution and the best answers will provide a variety of relevant examples. Many alternatives sources of energy are however very limited in their ability to provide large quantities of energy continuously. An exception being nuclear but nuclear might, in the event of an accident, contribute dramatically to atmospheric pollution and of course has the long- term issue of the waste. Candidates may refer to Fukushima and other incidents. [30] [Total: 40] Please use level descriptors 1 Please use level descriptors 2
Mark scheme, page 7
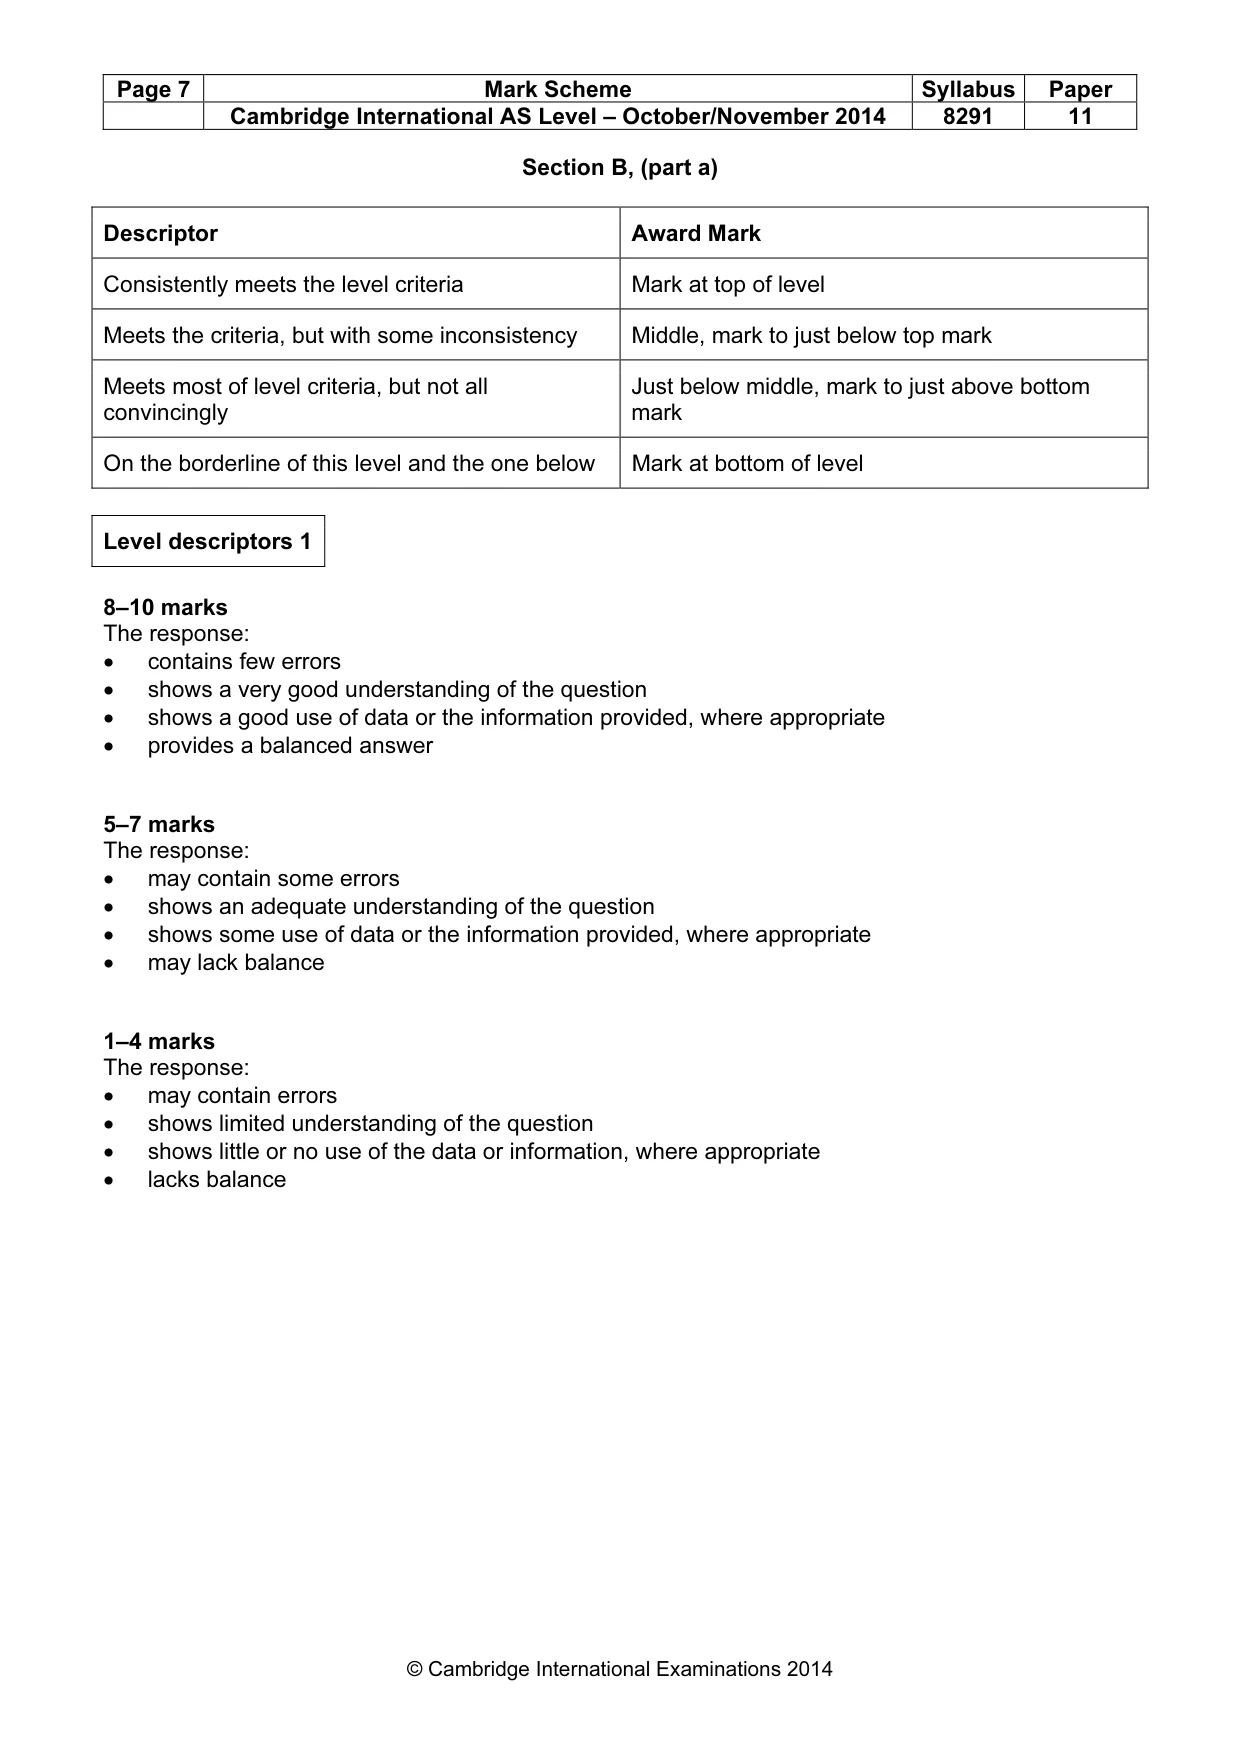
Page 7 Mark Scheme Syllabus Paper Cambridge International AS Level – October/November 2014 8291 11 © Cambridge International Examinations 2014 Section B, (part a) Descriptor Award Mark Consistently meets the level criteria Mark at top of level Meets the criteria, but with some inconsistency Middle, mark to just below top mark Meets most of level criteria, but not all convincingly Just below middle, mark to just above bottom mark On the borderline of this level and the one below Mark at bottom of level Level descriptors 1 8–10 marks The response: • contains few errors • shows a very good understanding of the question • shows a good use of data or the information provided, where appropriate • provides a balanced answer 5–7 marks The response: • may contain some errors • shows an adequate understanding of the question • shows some use of data or the information provided, where appropriate • may lack balance 1–4 marks The response: • may contain errors • shows limited understanding of the question • shows little or no use of the data or information, where appropriate • lacks balance
Mark scheme, page 8
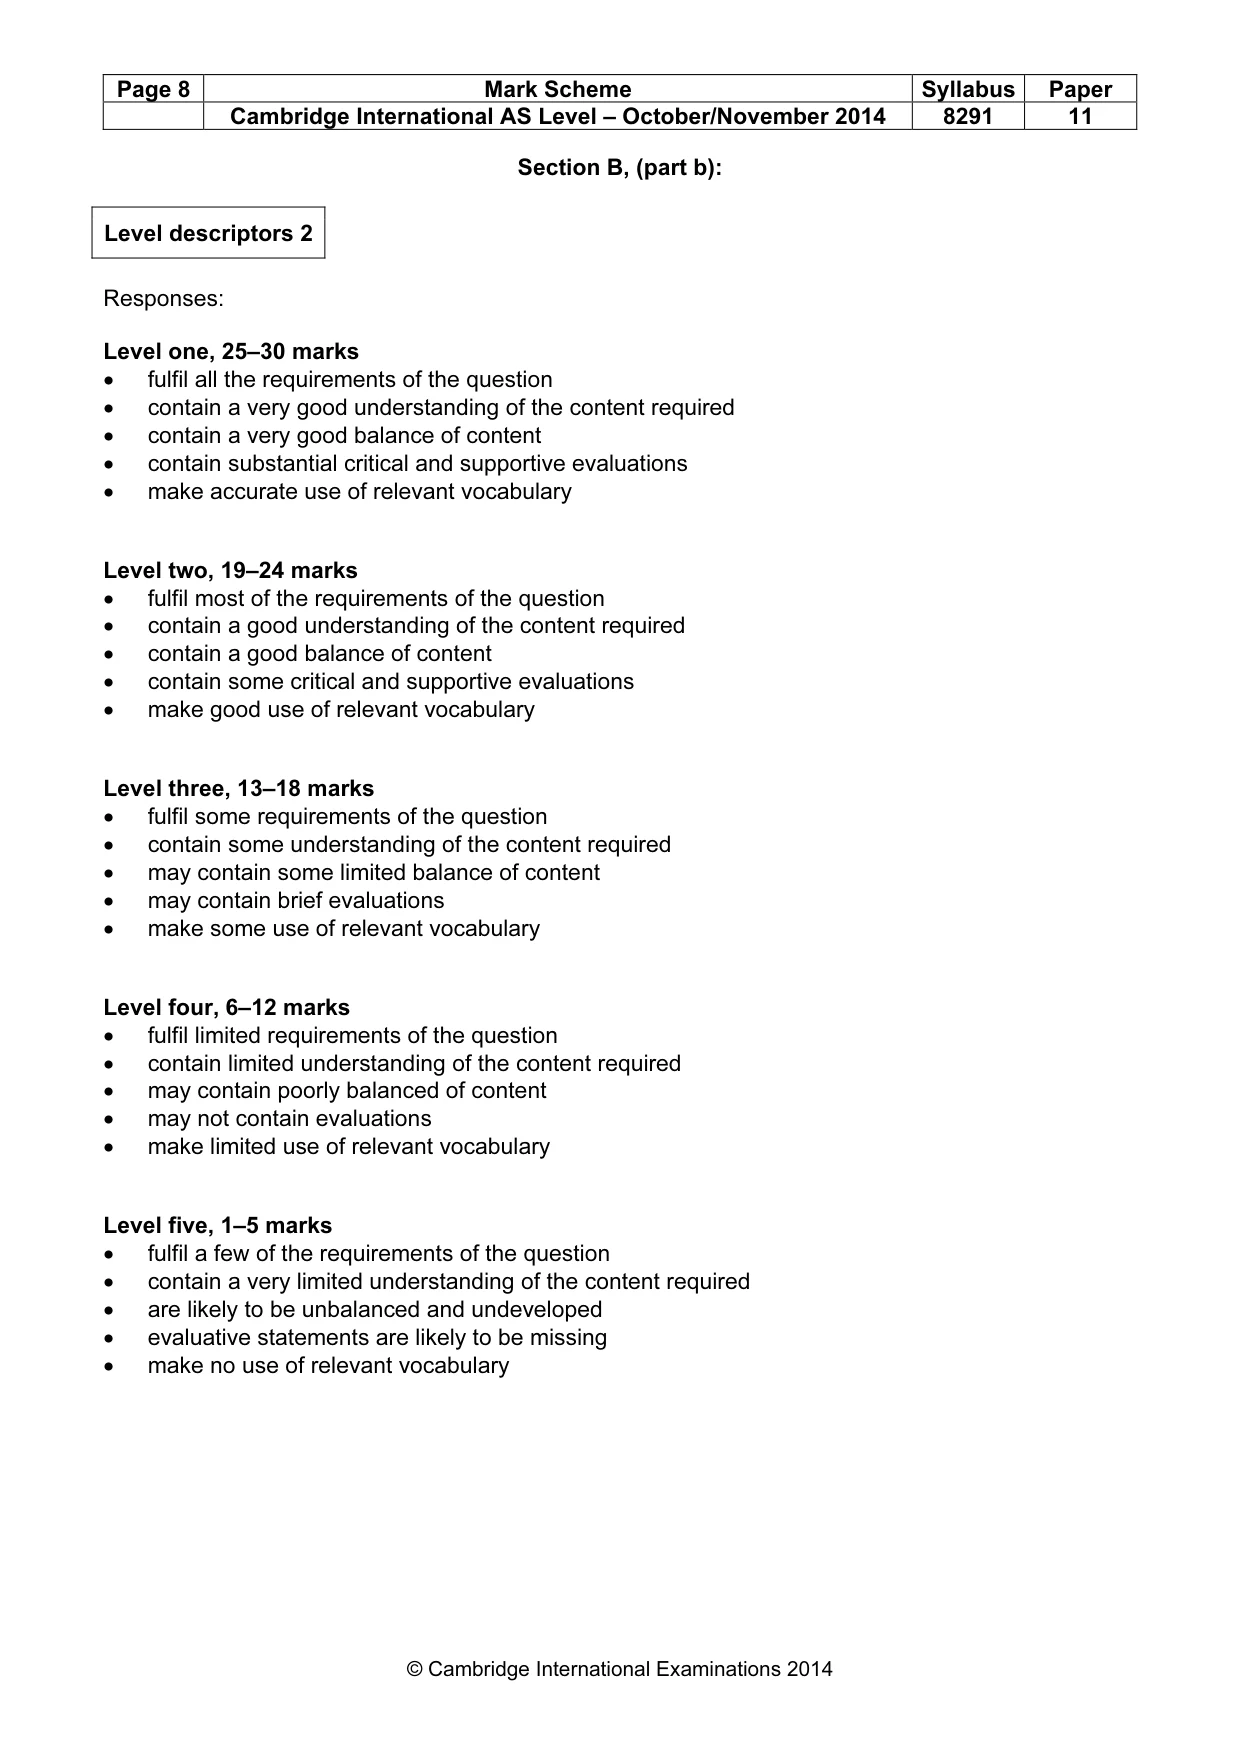
Page 8 Mark Scheme Syllabus Paper Cambridge International AS Level – October/November 2014 8291 11 © Cambridge International Examinations 2014 Section B, (part b): Level descriptors 2 Responses: Level one, 25–30 marks • fulfil all the requirements of the question • contain a very good understanding of the content required • contain a very good balance of content • contain substantial critical and supportive evaluations • make accurate use of relevant vocabulary Level two, 19–24 marks • fulfil most of the requirements of the question • contain a good understanding of the content required • contain a good balance of content • contain some critical and supportive evaluations • make good use of relevant vocabulary Level three, 13–18 marks • fulfil some requirements of the question • contain some understanding of the content required • may contain some limited balance of content • may contain brief evaluations • make some use of relevant vocabulary Level four, 6–12 marks • fulfil limited requirements of the question • contain limited understanding of the content required • may contain poorly balanced of content • may not contain evaluations • make limited use of relevant vocabulary Level five, 1–5 marks • fulfil a few of the requirements of the question • contain a very limited understanding of the content required • are likely to be unbalanced and undeveloped • evaluative statements are likely to be missing • make no use of relevant vocabulary
What you needed in this session
Cambridge’s own grade thresholds for 2014 Oct/Nov, Paper 1 · Variant 1. A higher threshold means an easier paper — the bar moves with how the cohort did.