Cambridge A Level Environmental Management (AS only) 8291 — 2013 May/June Paper 2 · Variant 1
8291/21/M/J/13 · 80 marks · ≈90 min
The question paper and its mark scheme, free to read here and free to download. This is Cambridge’s own paper, exactly as it was sat.
Question paper12 pages

Mark scheme10 pages
Answers below. Sit the paper first if you are practising.
Paper as text
Question paper, page 1
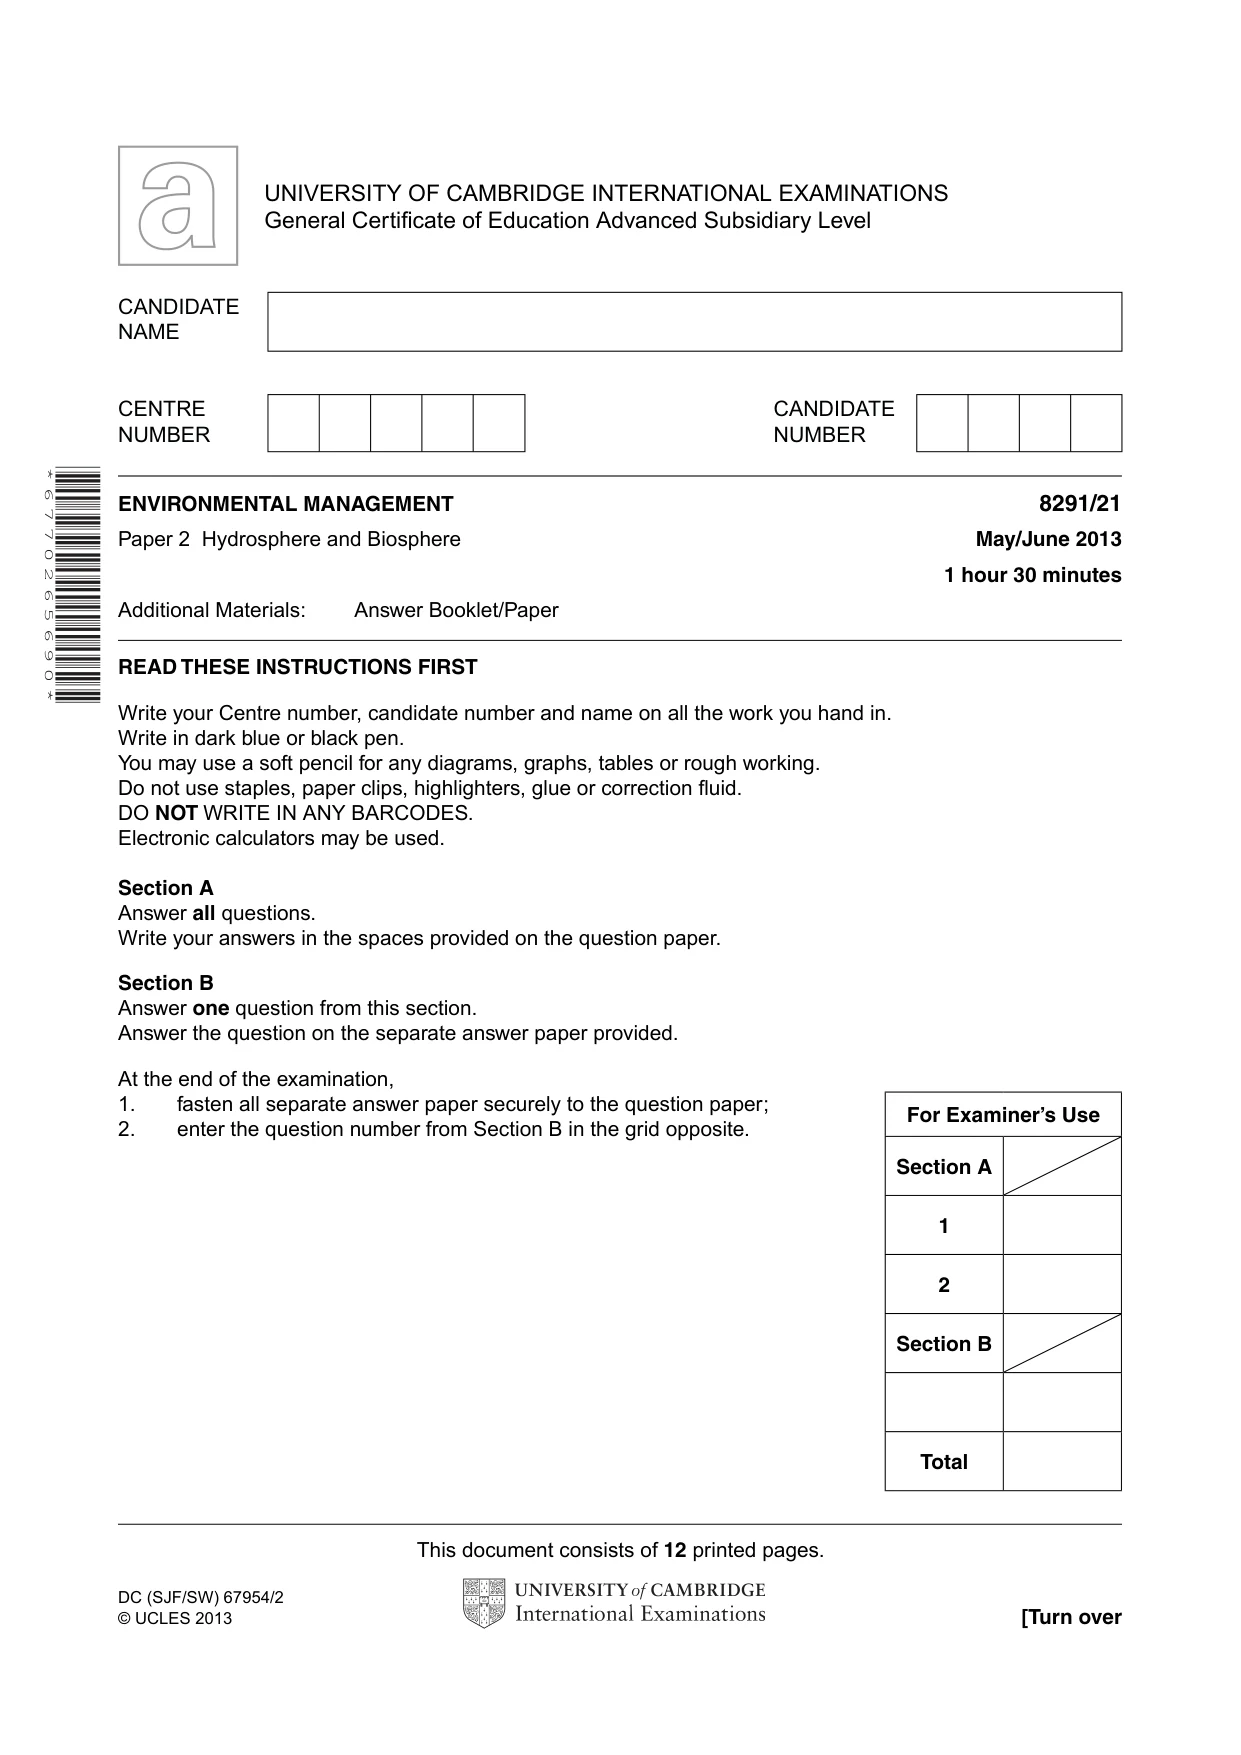
This document consists of 12 printed pages. DC (SJF/SW) 67954/2 © UCLES 2013 [Turn over UNIVERSITY OF CAMBRIDGE INTERNATIONAL EXAMINATIONS General Certificate of Education Advanced Subsidiary Level READ THESE INSTRUCTIONS FIRST Write your Centre number, candidate number and name on all the work you hand in. Write in dark blue or black pen. You may use a soft pencil for any diagrams, graphs, tables or rough working. Do not use staples, paper clips, highlighters, glue or correction fluid. DO NOT WRITE IN ANY BARCODES. Electronic calculators may be used. Section A Answer all questions. Write your answers in the spaces provided on the question paper. Section B Answer one question from this section. Answer the question on the separate answer paper provided. At the end of the examination, 1. fasten all separate answer paper securely to the question paper; 2. enter the question number from Section B in the grid opposite. CANDIDATE NAME CENTRE NUMBER CANDIDATE NUMBER ENVIRONMENTAL MANAGEMENT 8291/21 Paper 2 Hydrosphere and Biosphere May/June 2013 1 hour 30 minutes Additional Materials: Answer Booklet/Paper * 6 7 7 0 2 6 5 6 9 0 * For Examiner’s Use Section A 1 2 Section B Total
Question paper, page 2
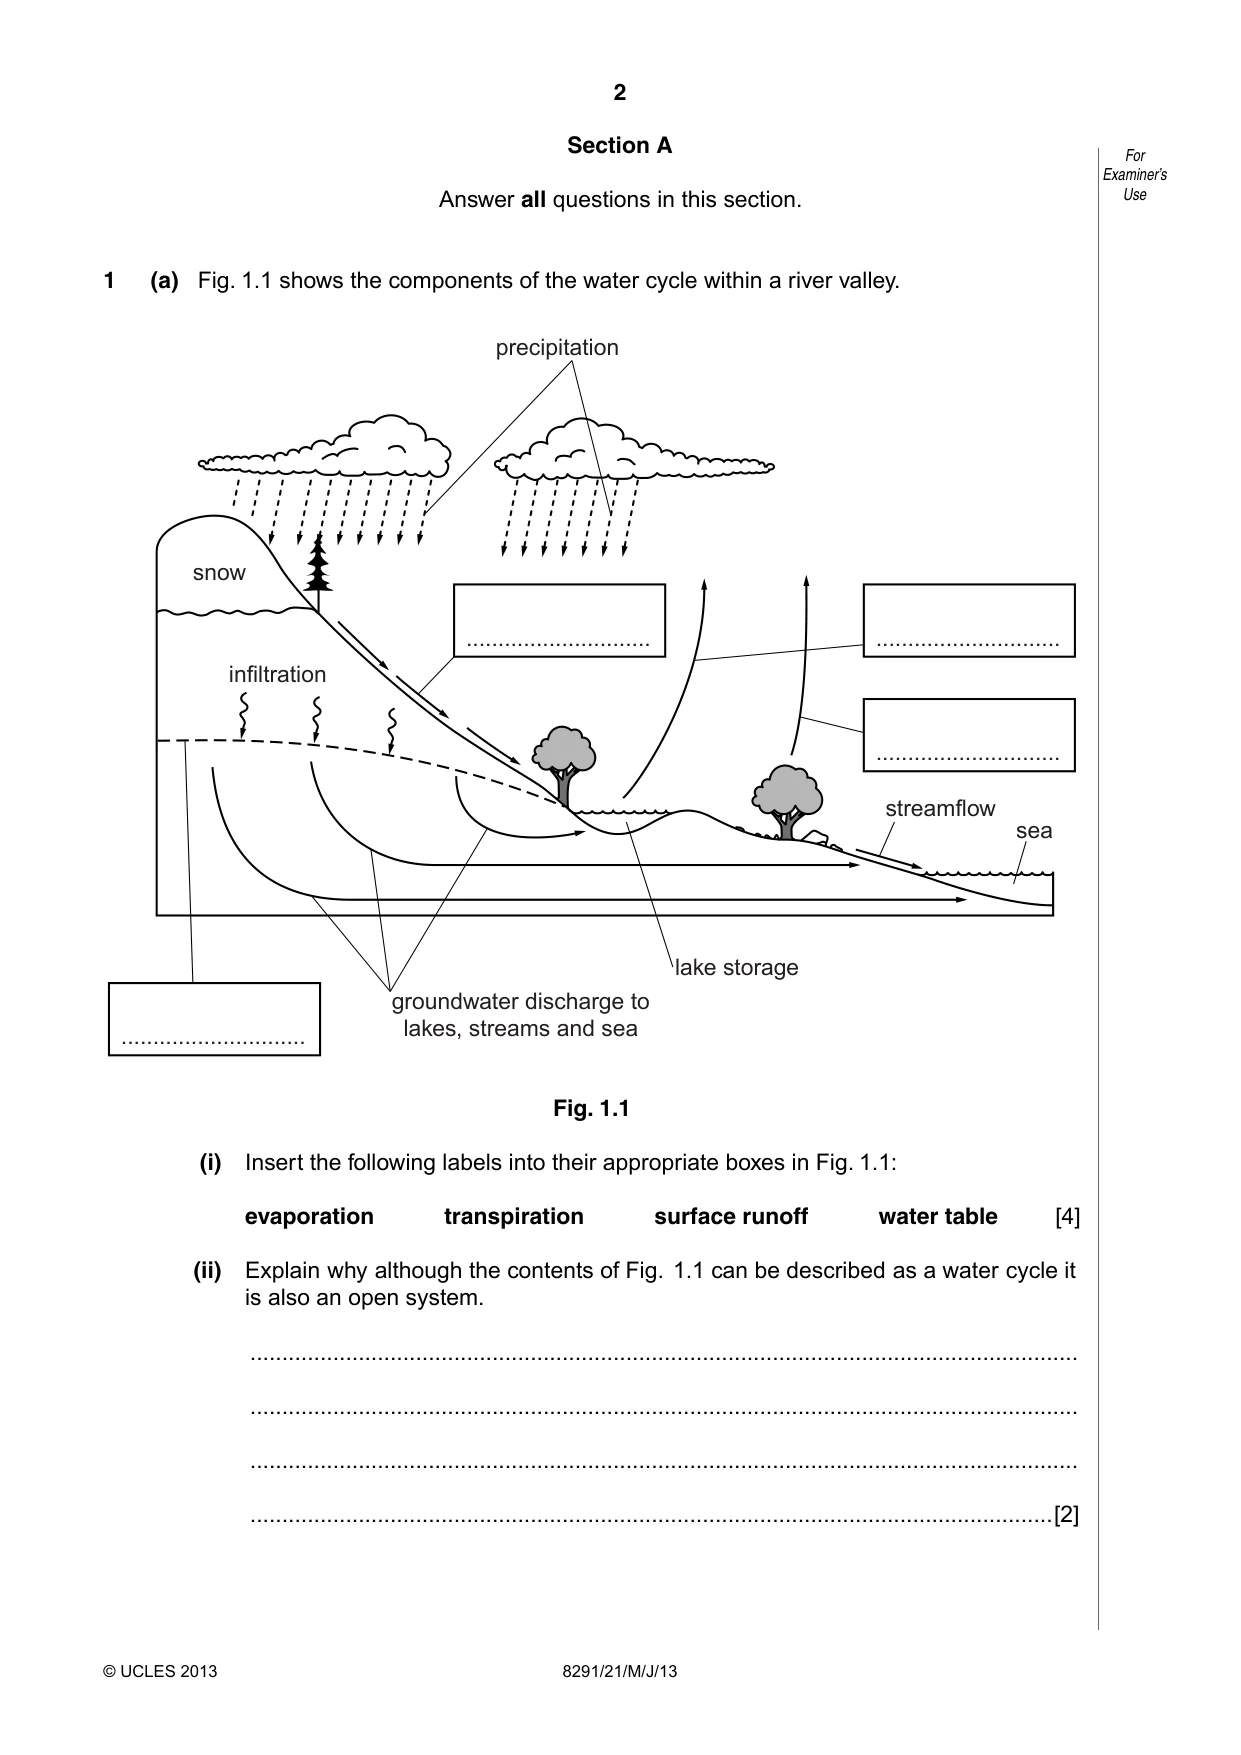
2 8291/21/M/J/13 For Examiner’s Use © UCLES 2013 Section A Answer all questions in this section. 1 (a) Fig. 1.1 shows the components of the water cycle within a river valley. snow precipitation … … … … infiltration groundwater discharge to lakes, streams and sea lake storage streamflow sea Fig. 1.1 (i) Insert the following labels into their appropriate boxes in Fig. 1.1: evaporation transpiration surface runoff water table [4] (ii) Explain why although the contents of Fig. 1.1 can be described as a water cycle it is also an open system. … … … …[2]
Question paper, page 3
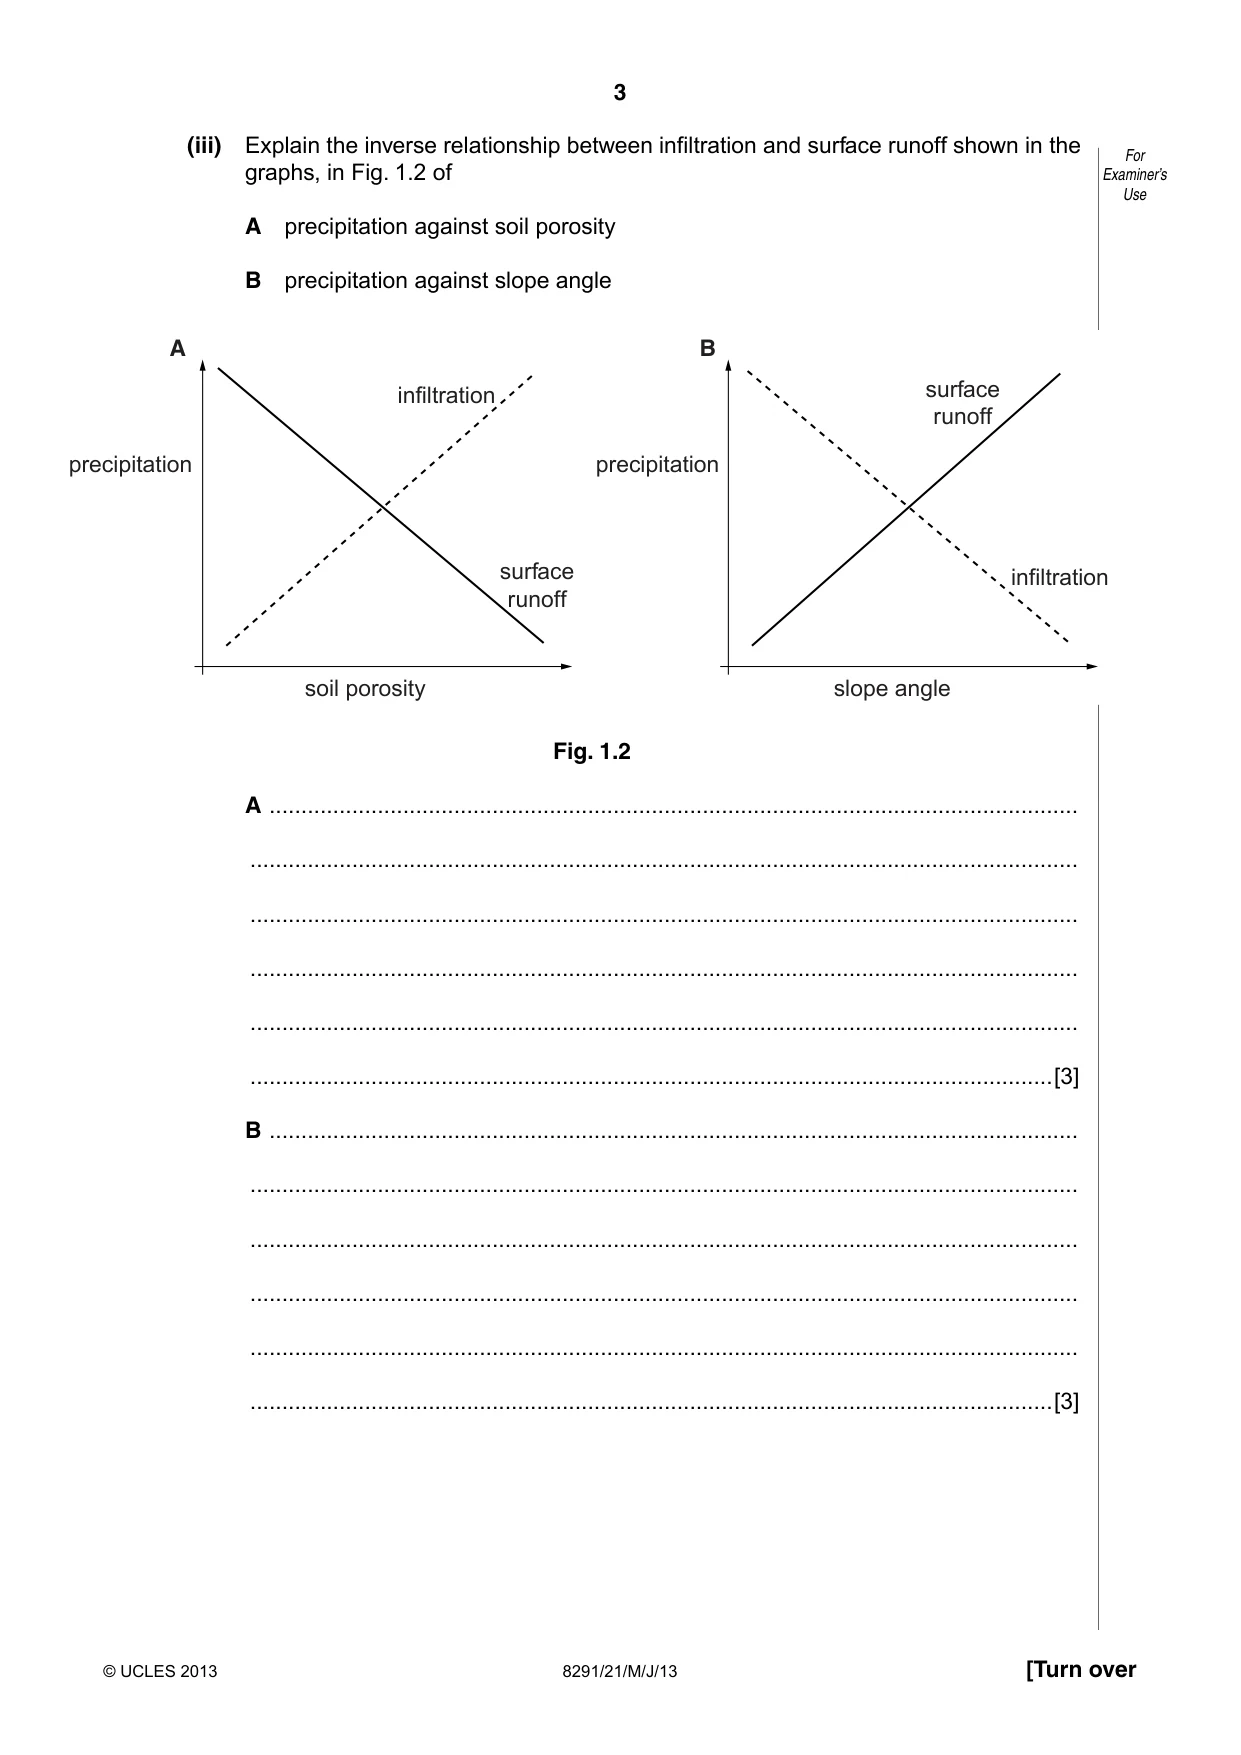
3 8291/21/M/J/13 [Turn over For Examiner’s Use © UCLES 2013 (iii) Explain the inverse relationship between infiltration and surface runoff shown in the graphs, in Fig. 1.2 of A precipitation against soil porosity B precipitation against slope angle precipitation A B soil porosity precipitation slope angle surface runoff surface runoff infiltration infiltration Fig. 1.2 A … … … … … …[3] B … … … … … …[3]
Question paper, page 4
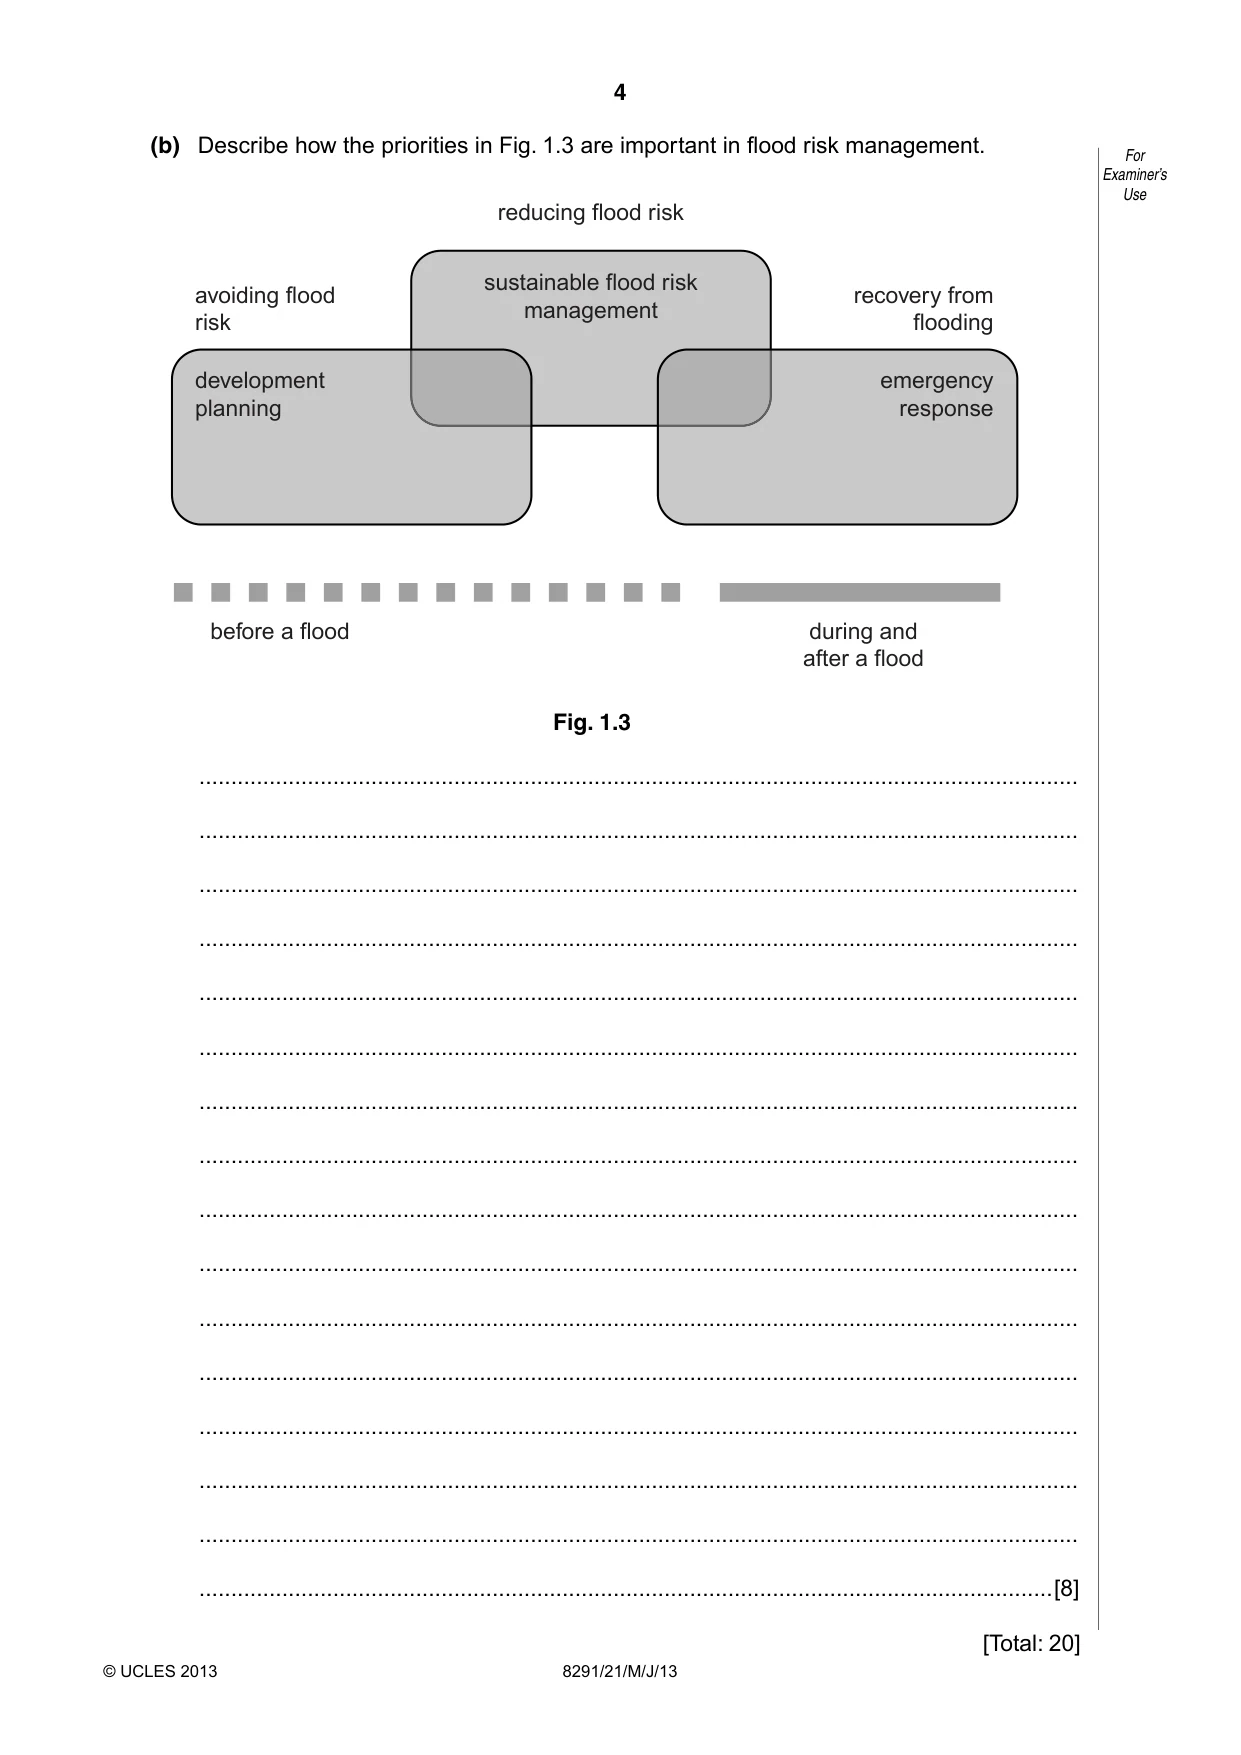
4 8291/21/M/J/13 For Examiner’s Use © UCLES 2013 (b) Describe how the priorities in Fig. 1.3 are important in flood risk management. development planning emergency response avoiding flood risk recovery from flooding sustainable flood risk management reducing flood risk before a flood during and after a flood Fig. 1.3 … … … … … … … … … … … … … … … …[8] [Total: 20]
Question paper, page 5
5 8291/21/M/J/13 [Turn over For Examiner’s Use © UCLES 2013 2 (a) What is meant by the terms biodiversity and biomass? biodiversity … … … … biomass … … … …[4]
Question paper, page 6
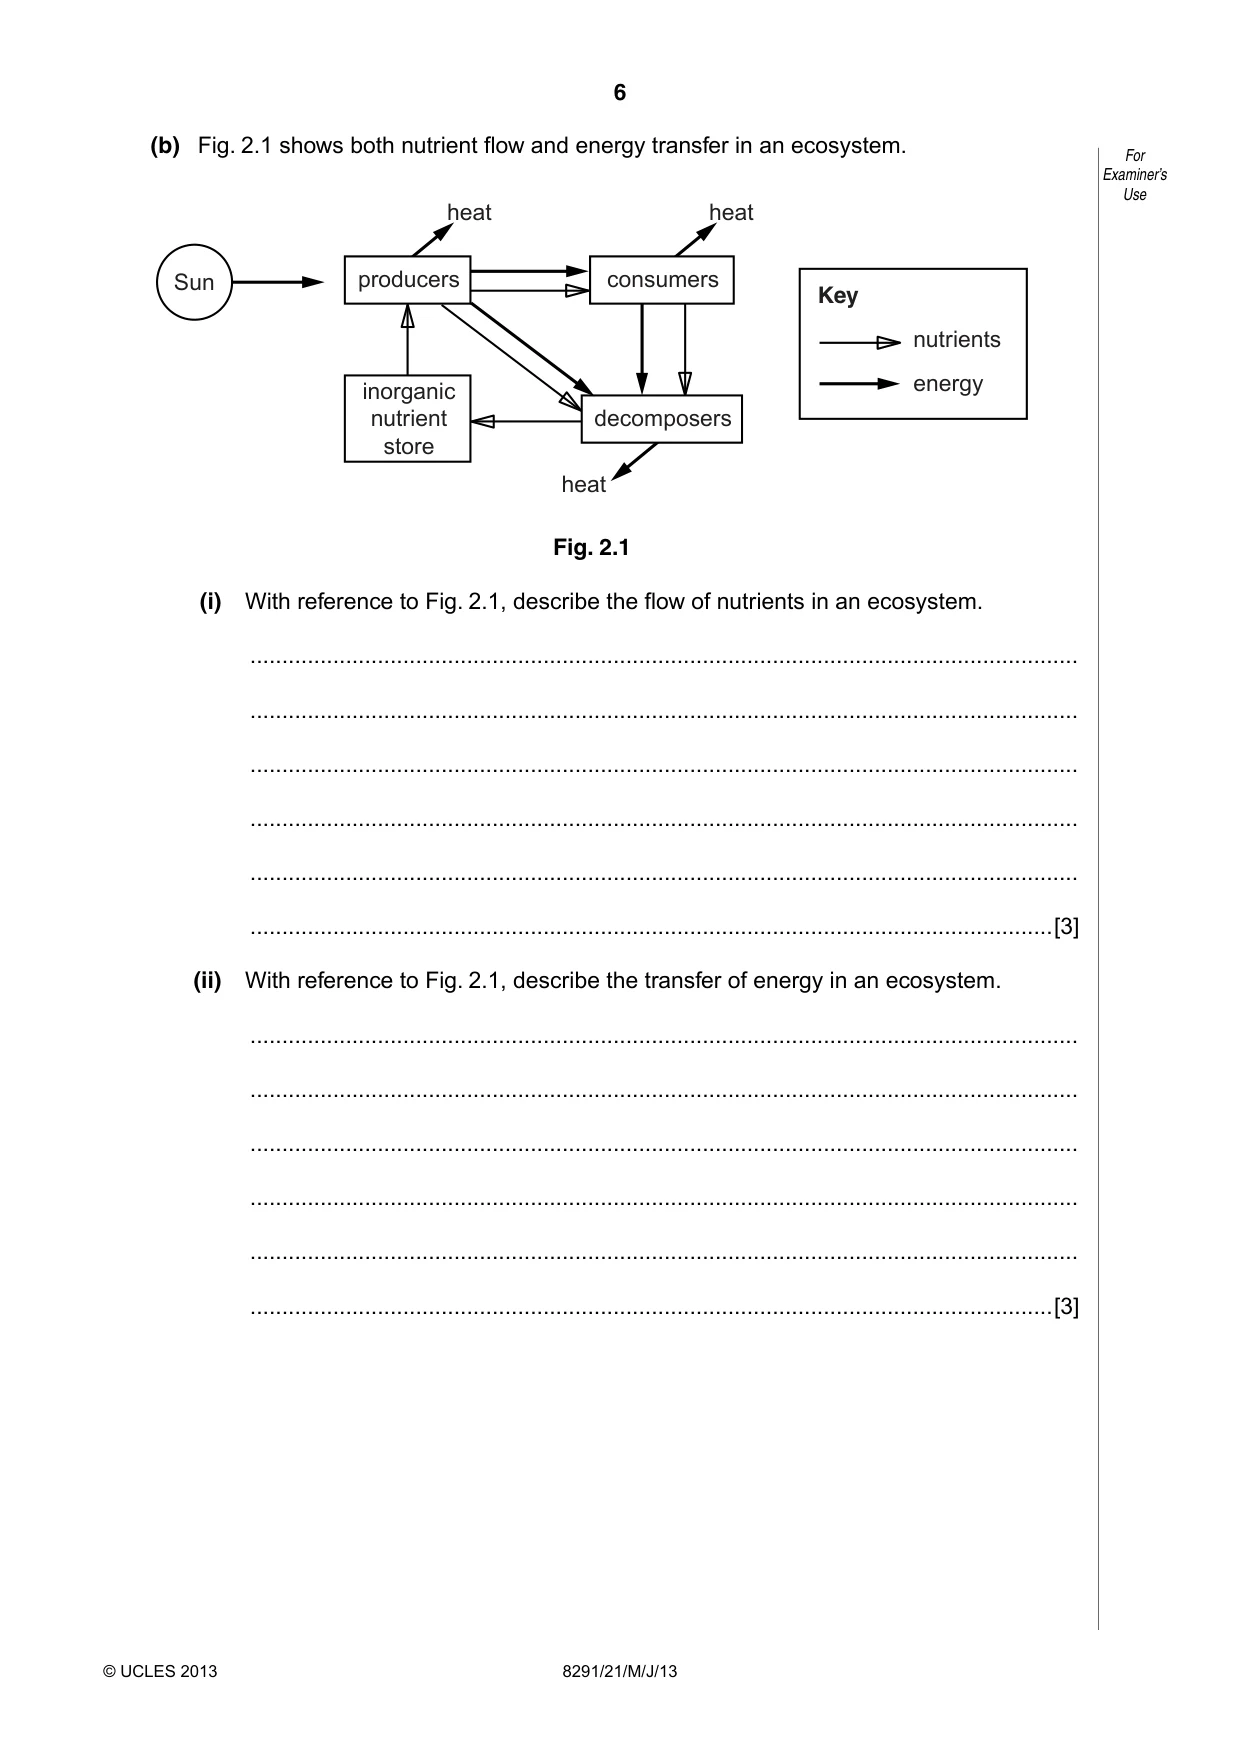
6 8291/21/M/J/13 For Examiner’s Use © UCLES 2013 (b) Fig. 2.1 shows both nutrient flow and energy transfer in an ecosystem. Sun producers heat heat heat consumers inorganic nutrient store decomposers Key nutrients energy Fig. 2.1 (i) With reference to Fig. 2.1, describe the flow of nutrients in an ecosystem. … … … … … …[3] (ii) With reference to Fig. 2.1, describe the transfer of energy in an ecosystem. … … … … … …[3]
Question paper, page 7
7 8291/21/M/J/13 © UCLES 2013 [Turn over Question 2(c) starts on page 8
Question paper, page 8
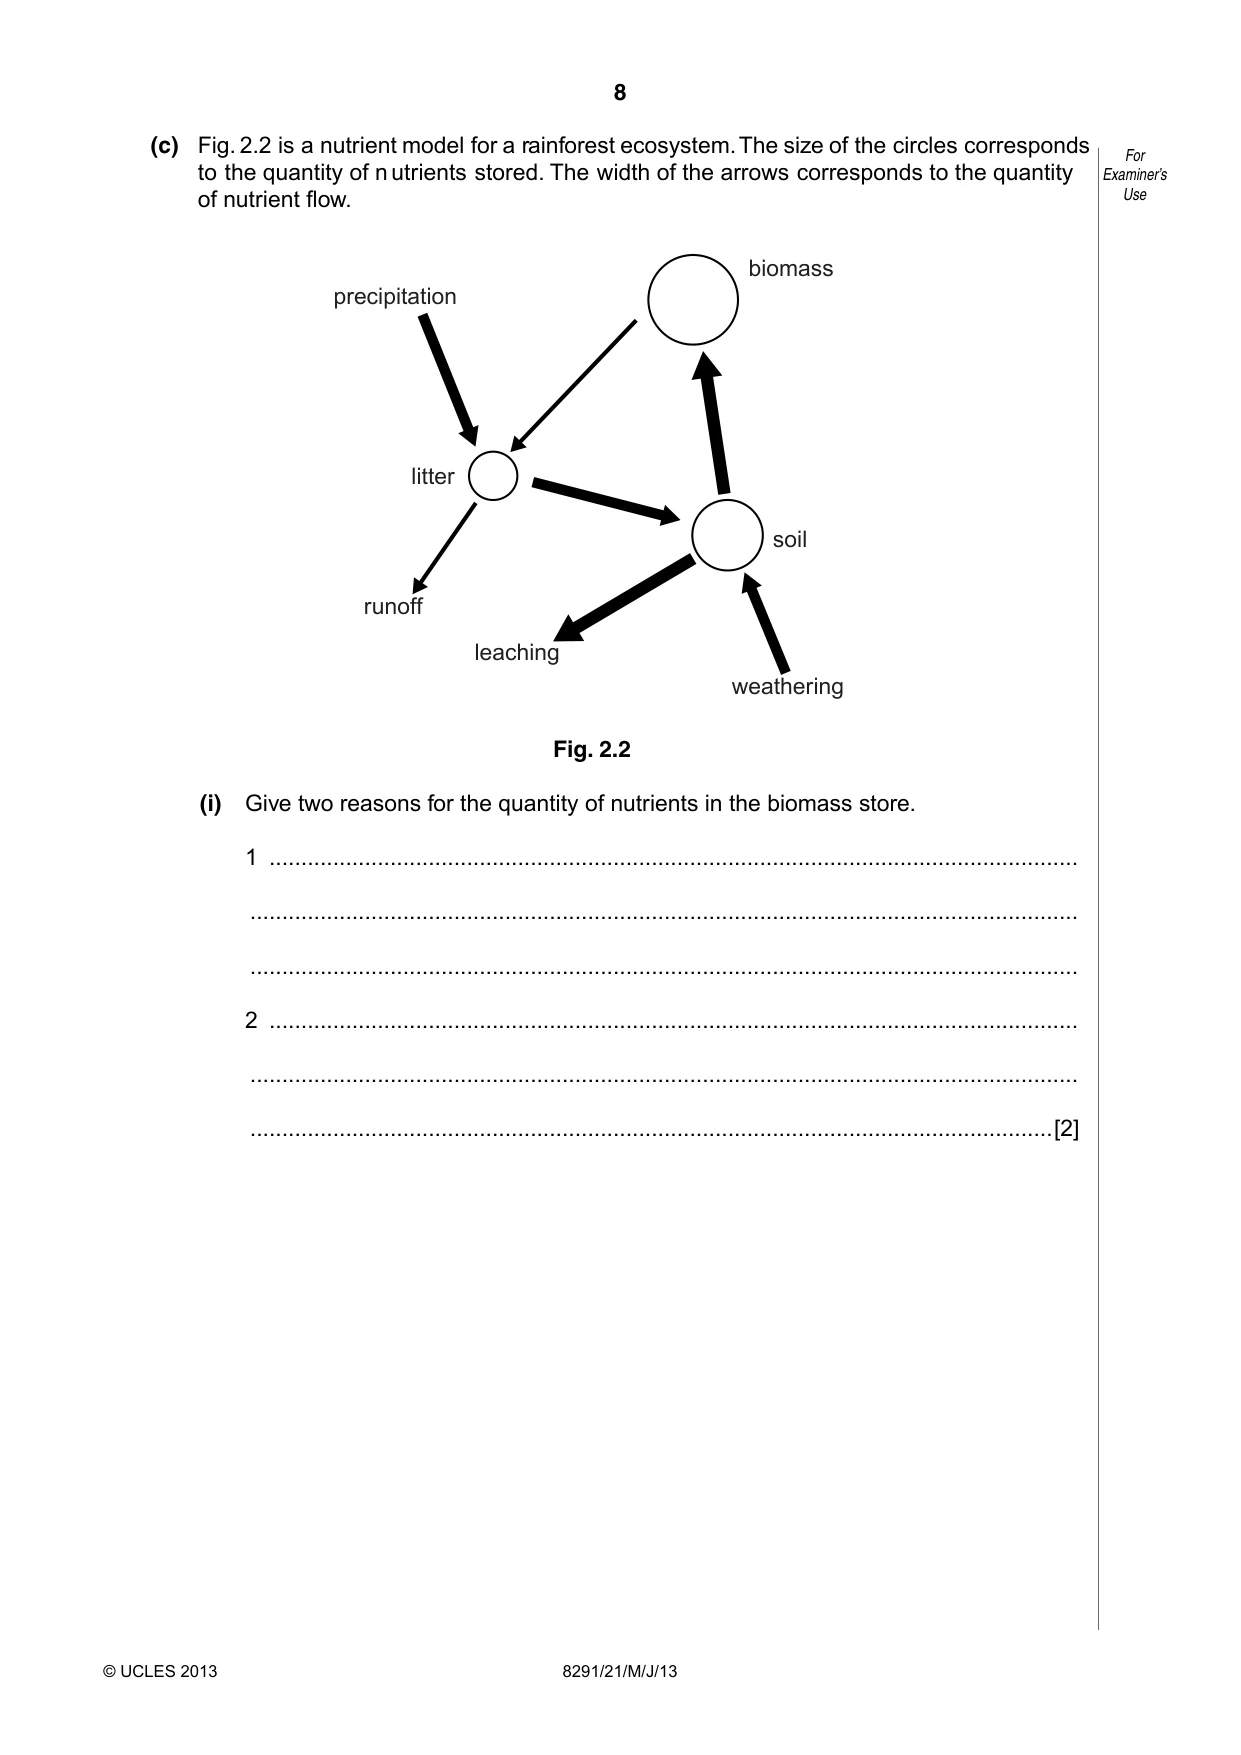
8 8291/21/M/J/13 For Examiner’s Use © UCLES 2013 (c) Fig. 2.2 is a nutrient model for a rainforest ecosystem. The size of the circles corresponds to the quantity of n utrients stored. The width of the arrows corresponds to the quantity of nutrient flow. biomass precipitation litter runoff leaching weathering soil Fig. 2.2 (i) Give two reasons for the quantity of nutrients in the biomass store. 1 … … … 2 … … …[2]
Question paper, page 9
9 8291/21/M/J/13 [Turn over For Examiner’s Use © UCLES 2013 (ii) Explain why the litter nutrient store is the smallest. … … … …[2] (iii) Describe the effect of deforestation upon the flows and stores in Fig. 2.2. … … … … … … … … … … … …[6] [Total: 20]
Question paper, page 10
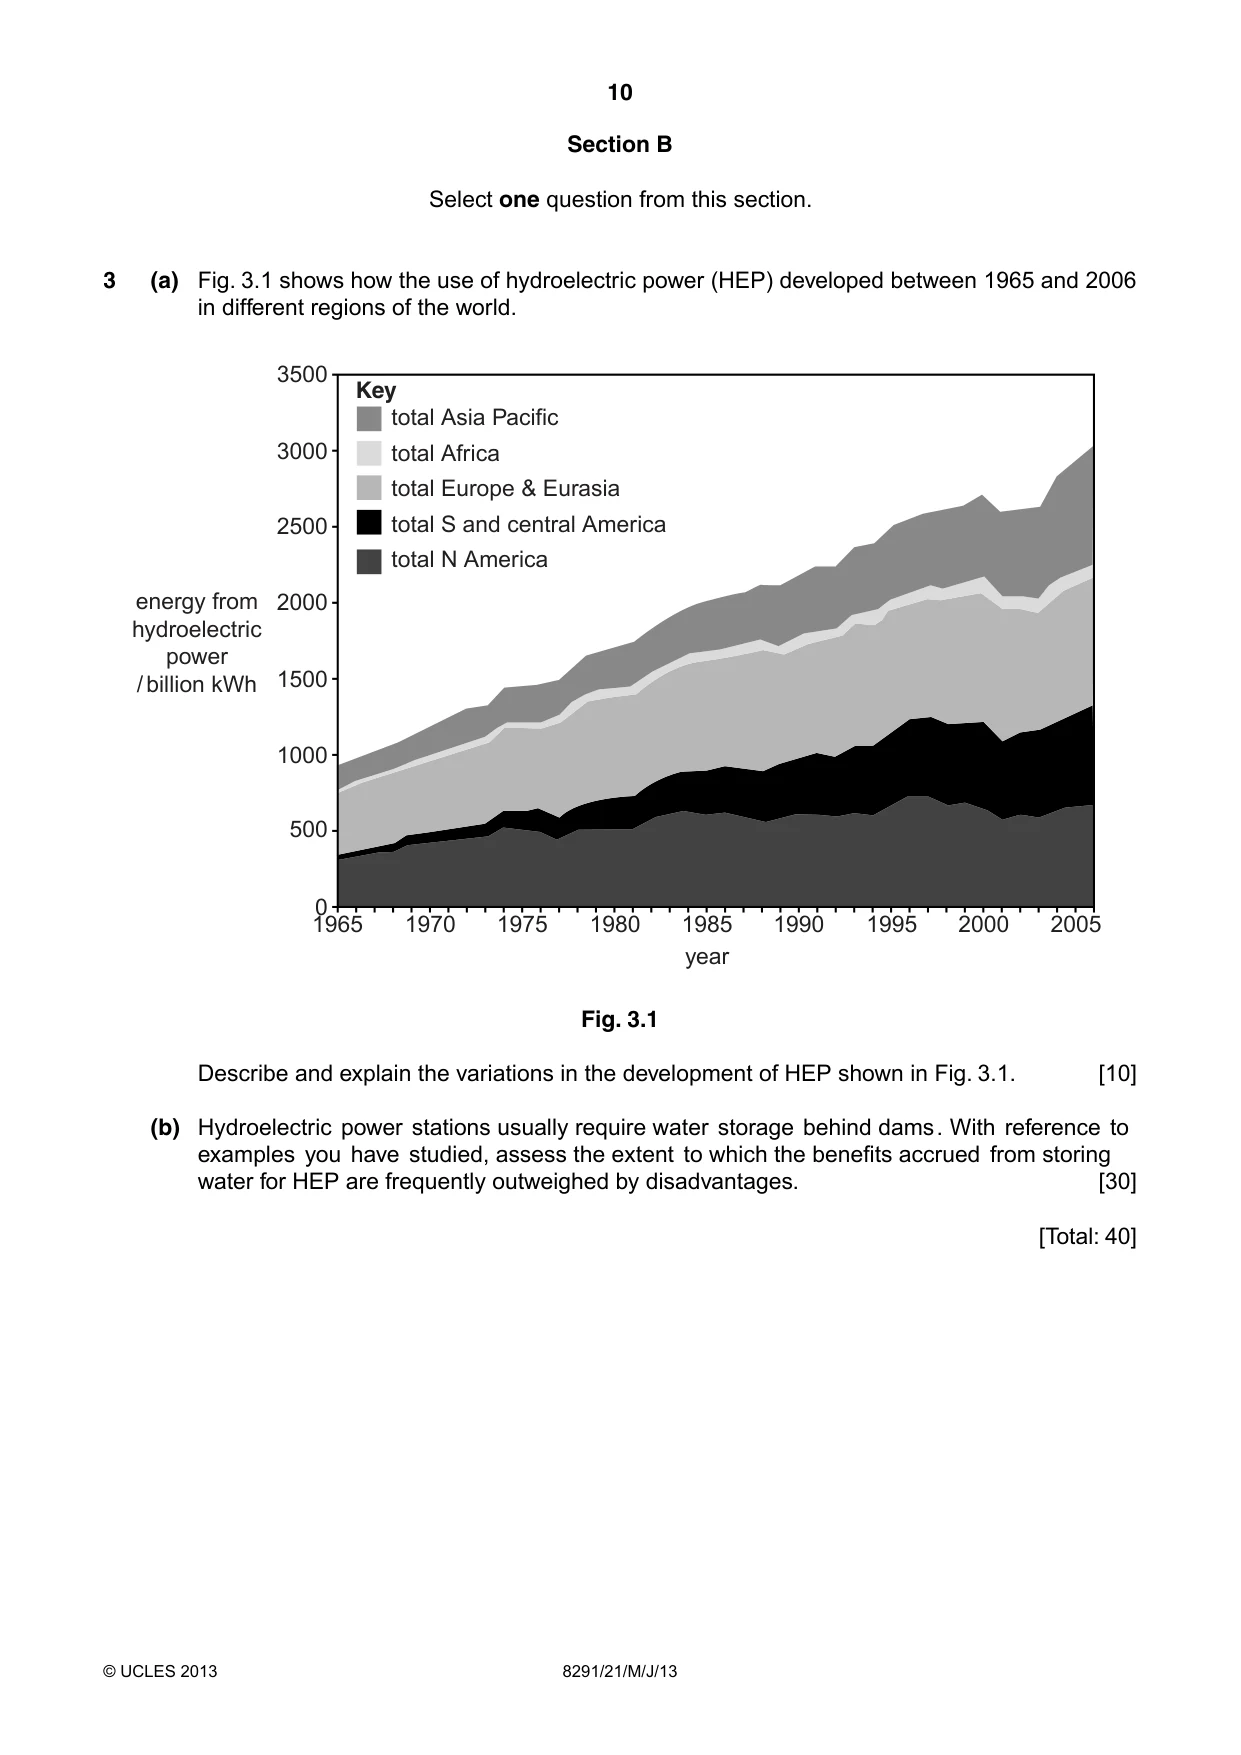
10 8291/21/M/J/13 © UCLES 2013 Section B Select one question from this section. 3 (a) Fig. 3.1 shows how the use of hydroelectric power (HEP) developed between 1965 and 2006 in different regions of the world. total Asia Pacific total Africa total Europe & Eurasia total S and central America total N America Key 3500 3000 2500 2000 1500 500 01965 1970 1975 1980 1985 year energy from hydroelectric power / billion kWh 1990 1995 2000 2005 1000 Fig. 3.1 Describe and explain the variations in the development of HEP shown in Fig. 3.1. [10] (b) Hydroelectric power stations usually require water storage behind dams. With reference to examples you have studied, assess the extent to which the benefits accrued from storing water for HEP are frequently outweighed by disadvantages. [30] [Total: 40]
Question paper, page 11
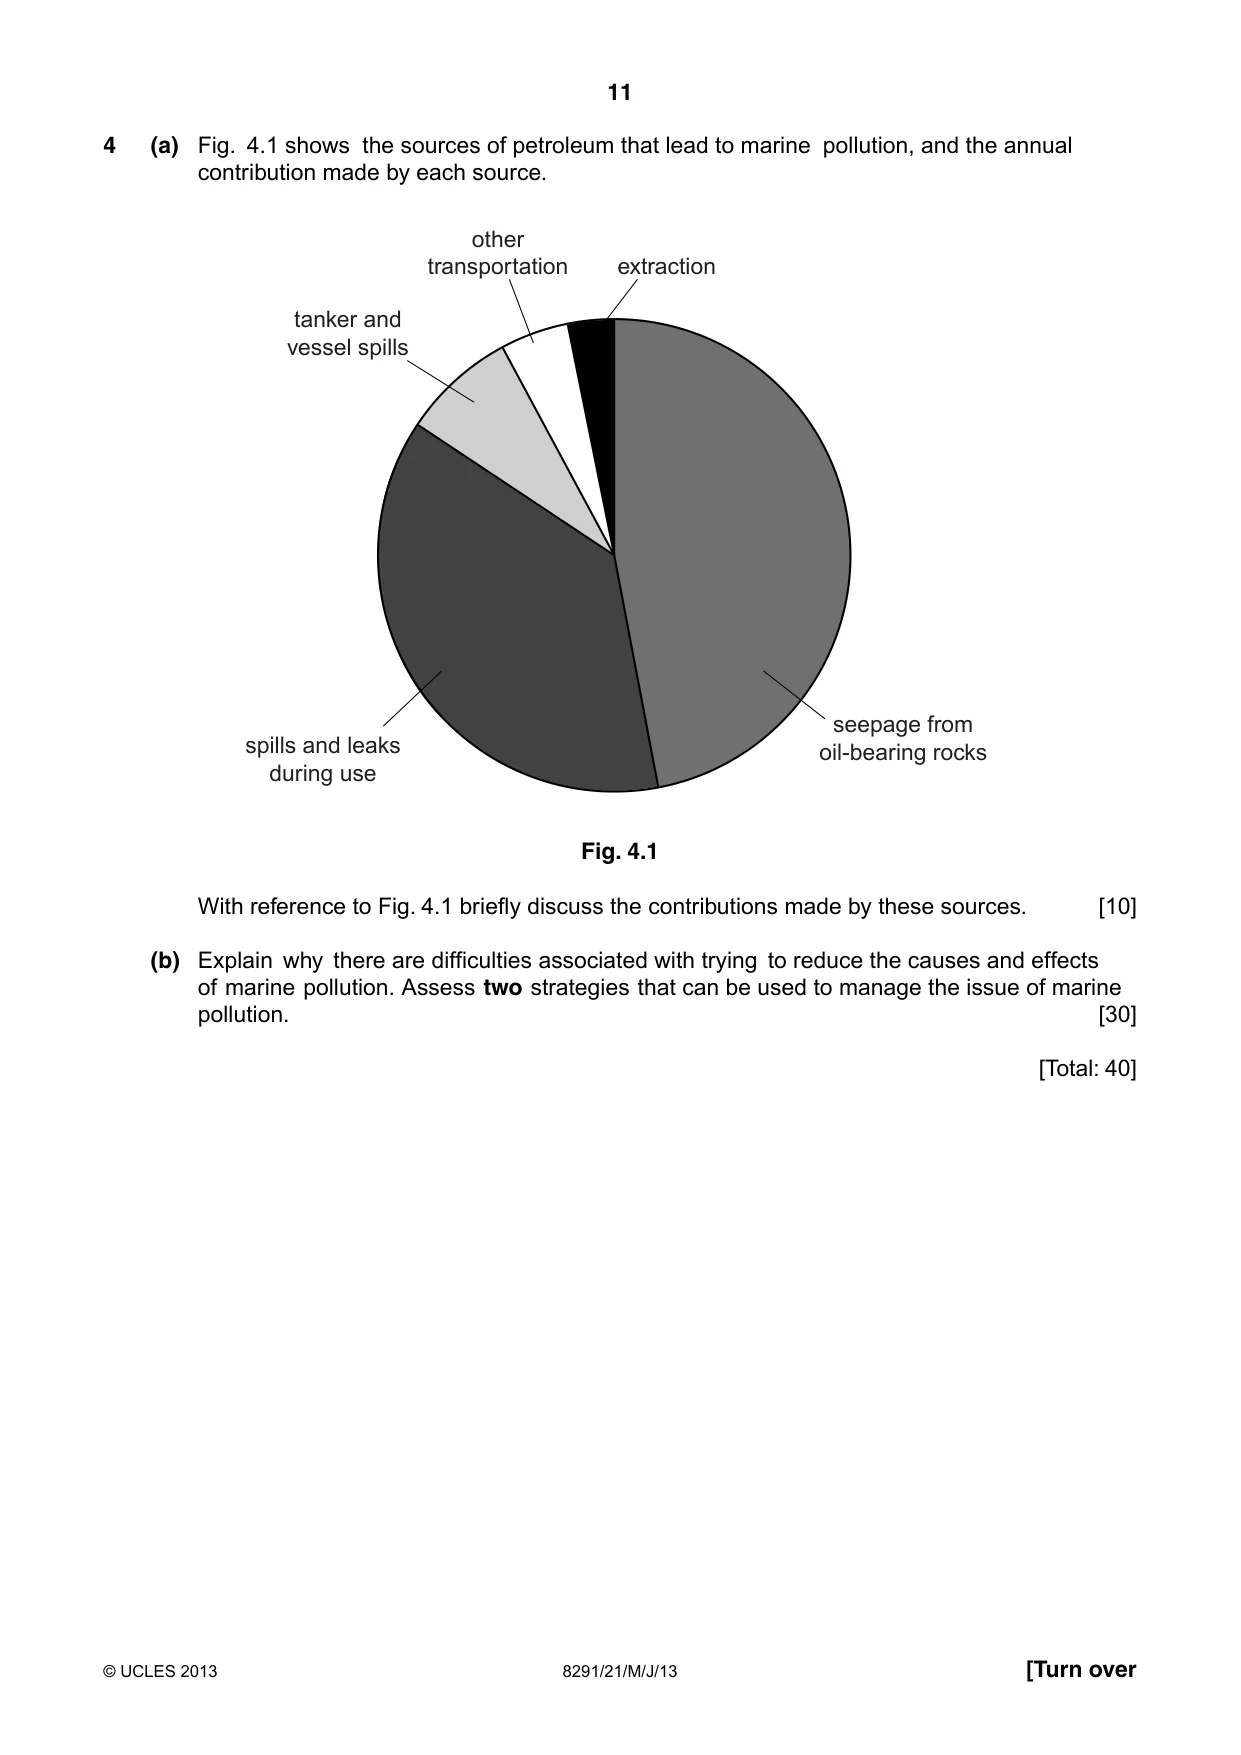
11 8291/21/M/J/13 © UCLES 2013 [Turn over 4 (a) Fig. 4.1 shows the sources of petroleum that lead to marine pollution, and the annual contribution made by each source. other transportation extraction tanker and vessel spills spills and leaks during use seepage from oil-bearing rocks Fig. 4.1 With reference to Fig. 4.1 briefly discuss the contributions made by these sources. [10] (b) Explain why there are difficulties associated with trying to reduce the causes and effects of marine pollution. Assess two strategies that can be used to manage the issue of marine pollution. [30] [Total: 40]
Question paper, page 12
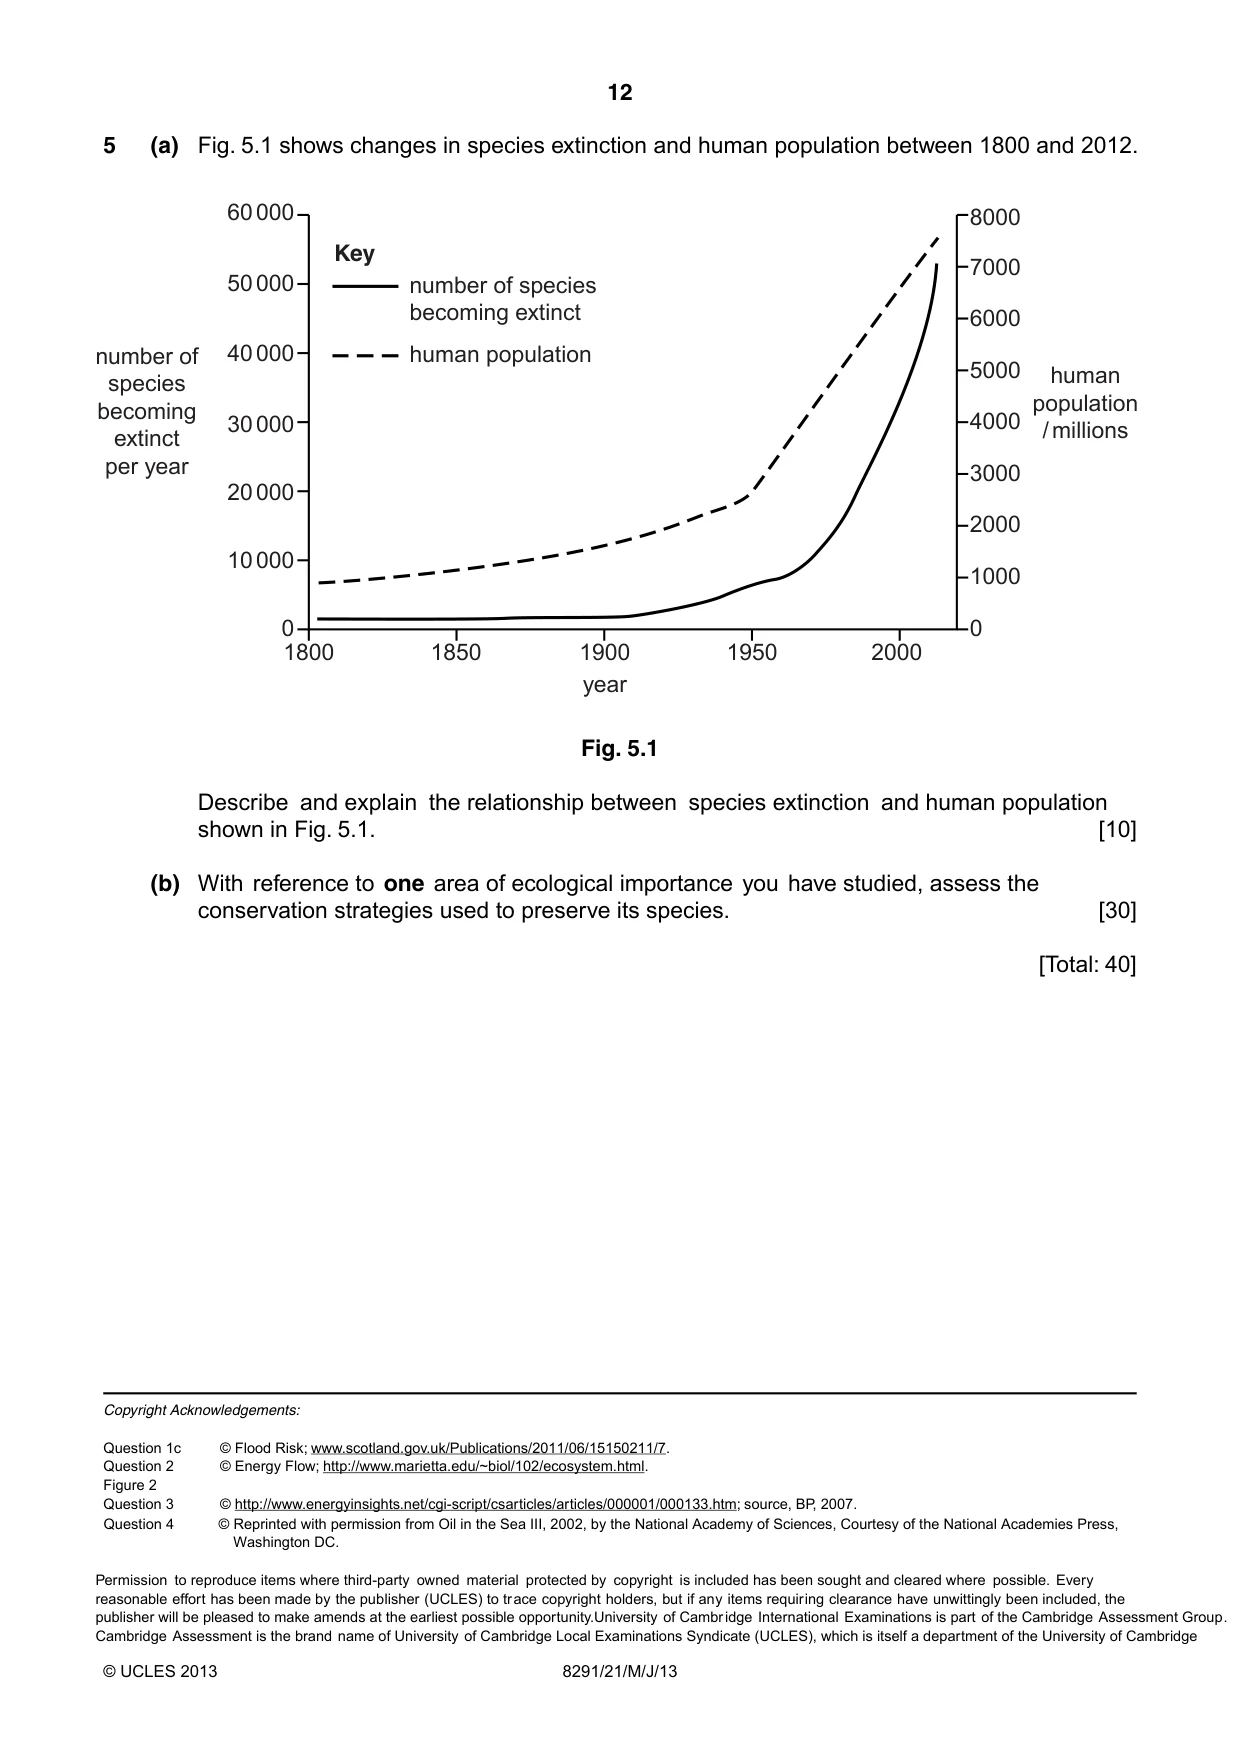
12 8291/21/M/J/13 © UCLES 2013 5 (a) Fig. 5.1 shows changes in species extinction and human population between 1800 and 2012. 1800 0 0 1000 2000 3000 4000 5000 6000 7000 8000 human population / millions number of species becoming extinct per year 10 000 20 000 30 000 40 000 50 000 60 000 1850 1900 year 1950 2000 number of species becoming extinct Key human population Fig. 5.1 Describe and explain the relationship between species extinction and human population shown in Fig. 5.1. [10] (b) With reference to one area of ecological importance you have studied, assess the conservation strategies used to preserve its species. [30] [Total: 40] Copyright Acknowledgements: Question 1c © Flood Risk; www.scotland.gov.uk/Publications/2011/06/15150211/7. Question 2 © Energy Flow; http://www.marietta.edu/~biol/102/ecosystem.html. Figure 2 Question 3 © http://www.energyinsights.net/cgi-script/csarticles/articles/000001/000133.htm; source, BP, 2007. Question 4 © Reprinted with permission from Oil in the Sea III, 2002, by the National Academy of Sciences, Courtesy of the National Academies Press, Washington DC. Permission to reproduce items where third-party owned material protected by copyright is included has been sought and cleared where possible. Every reasonable effort has been made by the publisher (UCLES) to trace copyright holders, but if any items requiring clearance have unwittingly been included, the publisher will be pleased to make amends at the earliest possible opportunity.University of Cambridge International Examinations is part of the Cambridge Assessment Group. Cambridge Assessment is the brand name of University of Cambridge Local Examinations Syndicate (UCLES), which is itself a department of the University of Cambridge
Mark scheme, page 1
CAMBRIDGE INTERNATIONAL EXAMINATIONS GCE Advanced Subsidiary Level MARK SCHEME for the May/June 2013 series 8291 ENVIRONMENTAL MANAGEMENT 8291/21 Paper 2, maximum raw mark 80 This mark scheme is published as an aid to teachers and candidates, to indicate the requirements of the examination. It shows the basis on which Examiners were instructed to award marks. It does not indicate the details of the discussions that took place at an Examiners’ meeting before marking began, which would have considered the acceptability of alternative answers. Mark schemes should be read in conjunction with the question paper and the Principal Examiner Report for Teachers. Cambridge will not enter into discussions about these mark schemes. Cambridge is publishing the mark schemes for the May/June 2013 series for most IGCSE, GCE Advanced Level and Advanced Subsidiary Level components and some Ordinary Level components.
Mark scheme, page 2
Page 2 Mark Scheme Syllabus Paper GCE AS LEVEL – May/June 2013 8291 21 © Cambridge International Examinations 2013 General notes Symbols used in Environmental Management mark schemes. / separates alternatives for a marking point – other valid ways of expressing the same idea are also credited ; separates points for the award of a mark [3] indicates the number of marks available italic indicates that this is information about the marking points and is not required to gain credit italic text is also used for comments about alternatives that should be accepted, ignored or rejected ora or reverse argument – shows that an argument from an alternative viewpoint will be credited AW alternative wording, sometimes called ‘or words to that effect’ – AW is used when there are many different ways of expressing the same idea ( ) the word / phrase in brackets is not required to gain marks but sets the context of the response for credit e.g. (nuclear) waste – nuclear is not needed but if it was described as a domestic waste then no mark is awarded volcanic underlined words – the answer must contain exactly this word ecf error carried forward – if an incorrect answer is given to part of a question, and this answer is subsequently used by a candidate in later parts of the question, this indicates that the candidate’s incorrect answer will be used as a starting point for marking the later parts of the question
Mark scheme, page 3
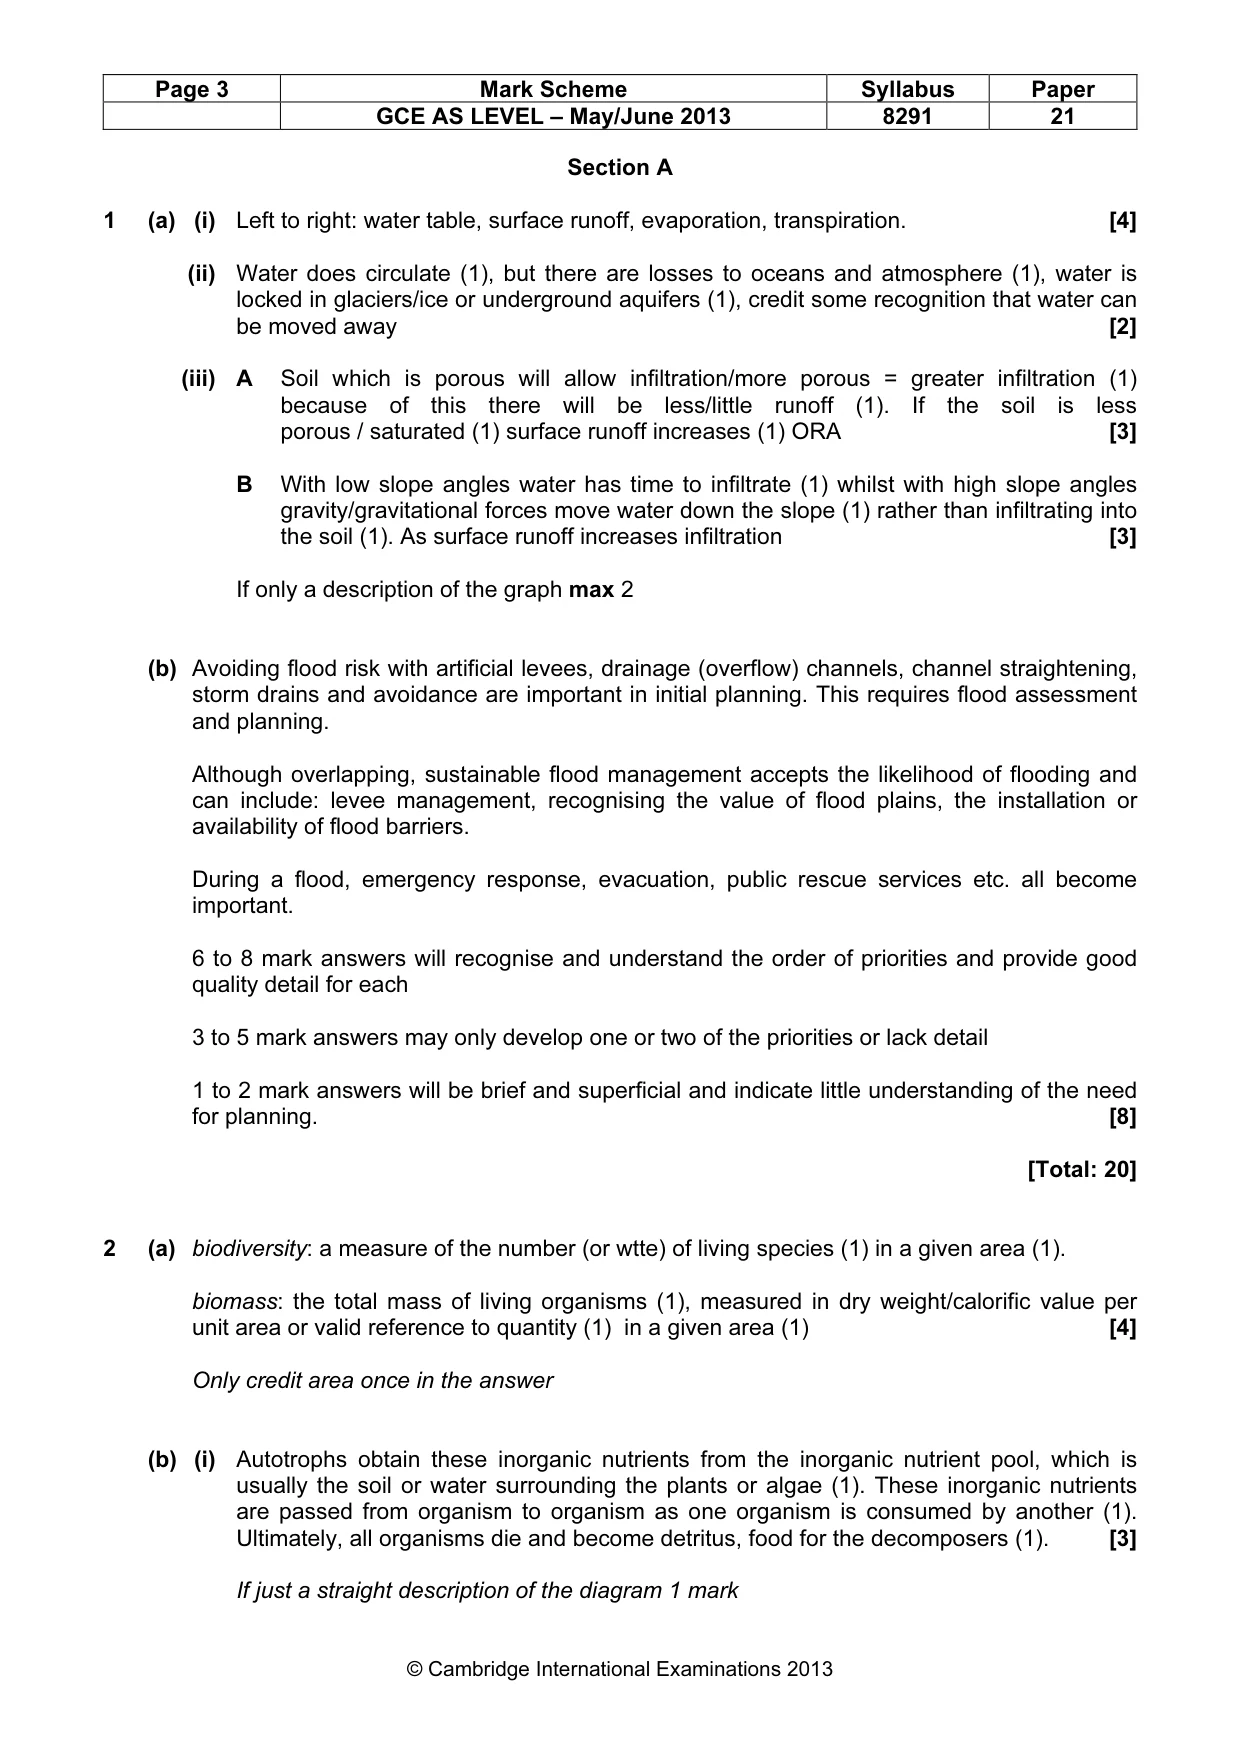
Page 3 Mark Scheme Syllabus Paper GCE AS LEVEL – May/June 2013 8291 21 © Cambridge International Examinations 2013 Section A 1 (a) (i) Left to right: water table, surface runoff, evaporation, transpiration. [4] (ii) Water does circulate (1), but there are losses to oceans and atmosphere (1), water is locked in glaciers/ice or underground aquifers (1), credit some recognition that water can be moved away [2] (iii) A Soil which is porous will allow infiltration/more porous = greater infiltration (1) because of this there will be less/little runoff (1). If the soil is less porous / saturated (1) surface runoff increases (1) ORA [3] B With low slope angles water has time to infiltrate (1) whilst with high slope angles gravity/gravitational forces move water down the slope (1) rather than infiltrating into the soil (1). As surface runoff increases infiltration [3] If only a description of the graph max 2 (b) Avoiding flood risk with artificial levees, drainage (overflow) channels, channel straightening, storm drains and avoidance are important in initial planning. This requires flood assessment and planning. Although overlapping, sustainable flood management accepts the likelihood of flooding and can include: levee management, recognising the value of flood plains, the installation or availability of flood barriers. During a flood, emergency response, evacuation, public rescue services etc. all become important. 6 to 8 mark answers will recognise and understand the order of priorities and provide good quality detail for each 3 to 5 mark answers may only develop one or two of the priorities or lack detail 1 to 2 mark answers will be brief and superficial and indicate little understanding of the need for planning. [8] [Total: 20] 2 (a) biodiversity: a measure of the number (or wtte) of living species (1) in a given area (1). biomass: the total mass of living organisms (1), measured in dry weight/calorific value per unit area or valid reference to quantity (1) in a given area (1) [4] Only credit area once in the answer (b) (i) Autotrophs obtain these inorganic nutrients from the inorganic nutrient pool, which is usually the soil or water surrounding the plants or algae (1). These inorganic nutrients are passed from organism to organism as one organism is consumed by another (1). Ultimately, all organisms die and become detritus, food for the decomposers (1). [3] If just a straight description of the diagram 1 mark
Mark scheme, page 4
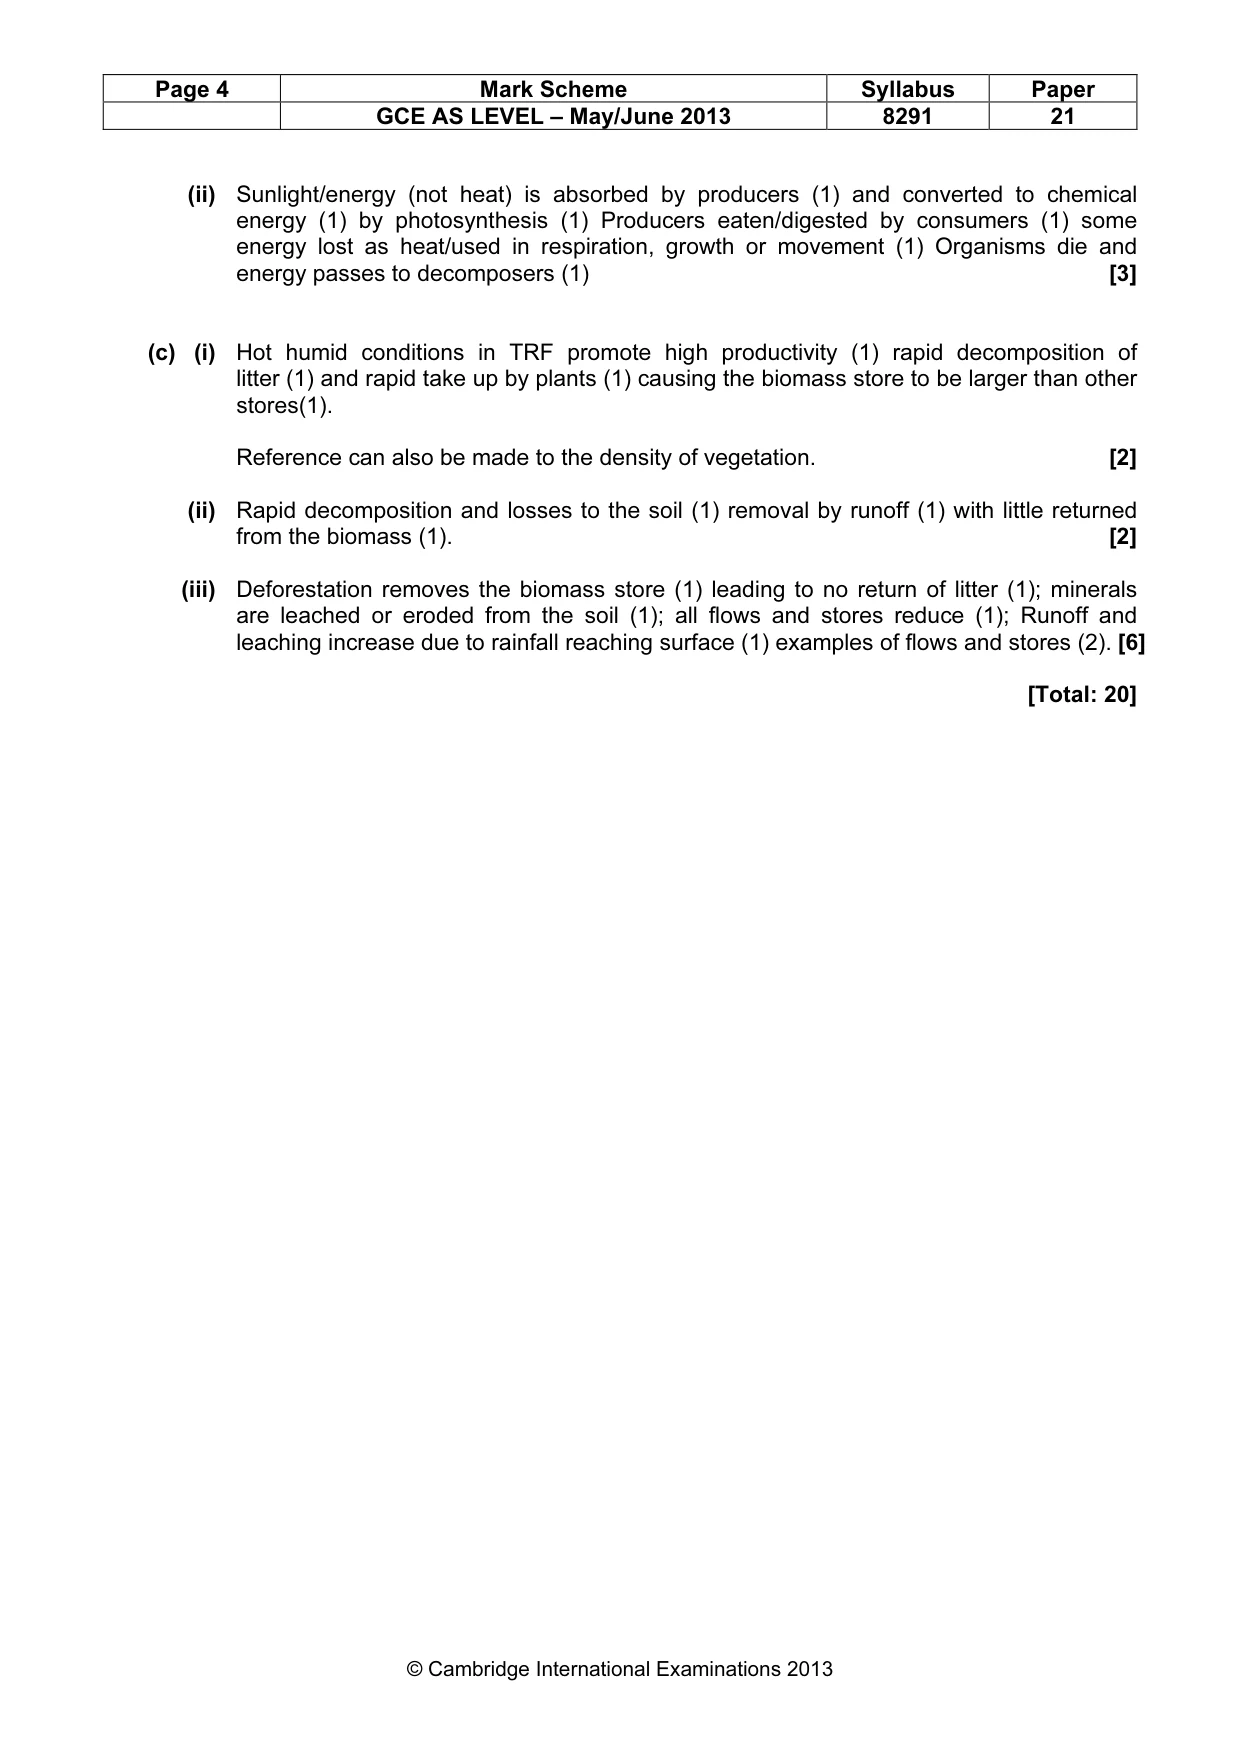
Page 4 Mark Scheme Syllabus Paper GCE AS LEVEL – May/June 2013 8291 21 © Cambridge International Examinations 2013 (ii) Sunlight/energy (not heat) is absorbed by producers (1) and converted to chemical energy (1) by photosynthesis (1) Producers eaten/digested by consumers (1) some energy lost as heat/used in respiration, growth or movement (1) Organisms die and energy passes to decomposers (1) [3] (c) (i) Hot humid conditions in TRF promote high productivity (1) rapid decomposition of litter (1) and rapid take up by plants (1) causing the biomass store to be larger than other stores(1). Reference can also be made to the density of vegetation. [2] (ii) Rapid decomposition and losses to the soil (1) removal by runoff (1) with little returned from the biomass (1). [2] (iii) Deforestation removes the biomass store (1) leading to no return of litter (1); minerals are leached or eroded from the soil (1); all flows and stores reduce (1); Runoff and leaching increase due to rainfall reaching surface (1) examples of flows and stores (2). [6] [Total: 20]
Mark scheme, page 5
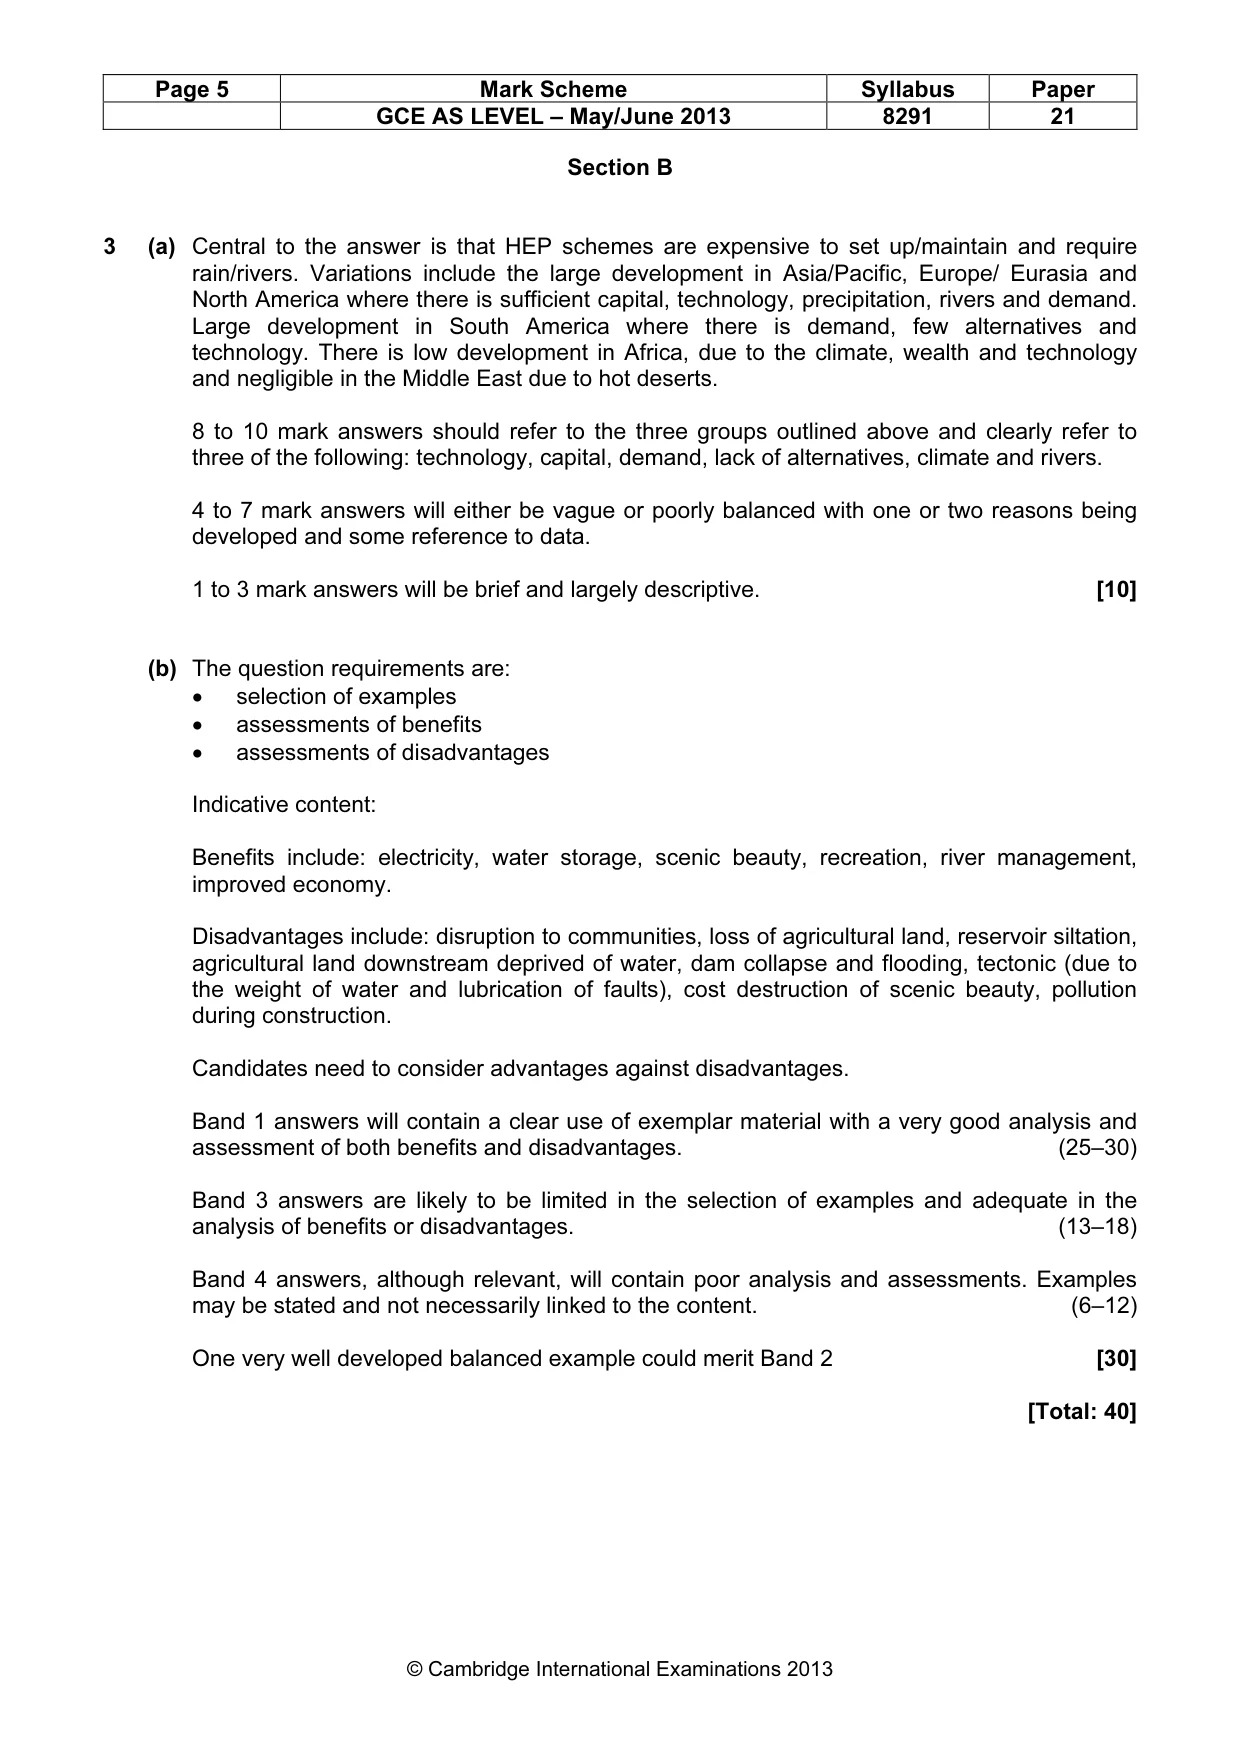
Page 5 Mark Scheme Syllabus Paper GCE AS LEVEL – May/June 2013 8291 21 © Cambridge International Examinations 2013 Section B 3 (a) Central to the answer is that HEP schemes are expensive to set up/maintain and require rain/rivers. Variations include the large development in Asia/Pacific, Europe/ Eurasia and North America where there is sufficient capital, technology, precipitation, rivers and demand. Large development in South America where there is demand, few alternatives and technology. There is low development in Africa, due to the climate, wealth and technology and negligible in the Middle East due to hot deserts. 8 to 10 mark answers should refer to the three groups outlined above and clearly refer to three of the following: technology, capital, demand, lack of alternatives, climate and rivers. 4 to 7 mark answers will either be vague or poorly balanced with one or two reasons being developed and some reference to data. 1 to 3 mark answers will be brief and largely descriptive. [10] (b) The question requirements are: • selection of examples • assessments of benefits • assessments of disadvantages Indicative content: Benefits include: electricity, water storage, scenic beauty, recreation, river management, improved economy. Disadvantages include: disruption to communities, loss of agricultural land, reservoir siltation, agricultural land downstream deprived of water, dam collapse and flooding, tectonic (due to the weight of water and lubrication of faults), cost destruction of scenic beauty, pollution during construction. Candidates need to consider advantages against disadvantages. Band 1 answers will contain a clear use of exemplar material with a very good analysis and assessment of both benefits and disadvantages. (25–30) Band 3 answers are likely to be limited in the selection of examples and adequate in the analysis of benefits or disadvantages. (13–18) Band 4 answers, although relevant, will contain poor analysis and assessments. Examples may be stated and not necessarily linked to the content. (6–12) One very well developed balanced example could merit Band 2 [30] [Total: 40]
Mark scheme, page 6
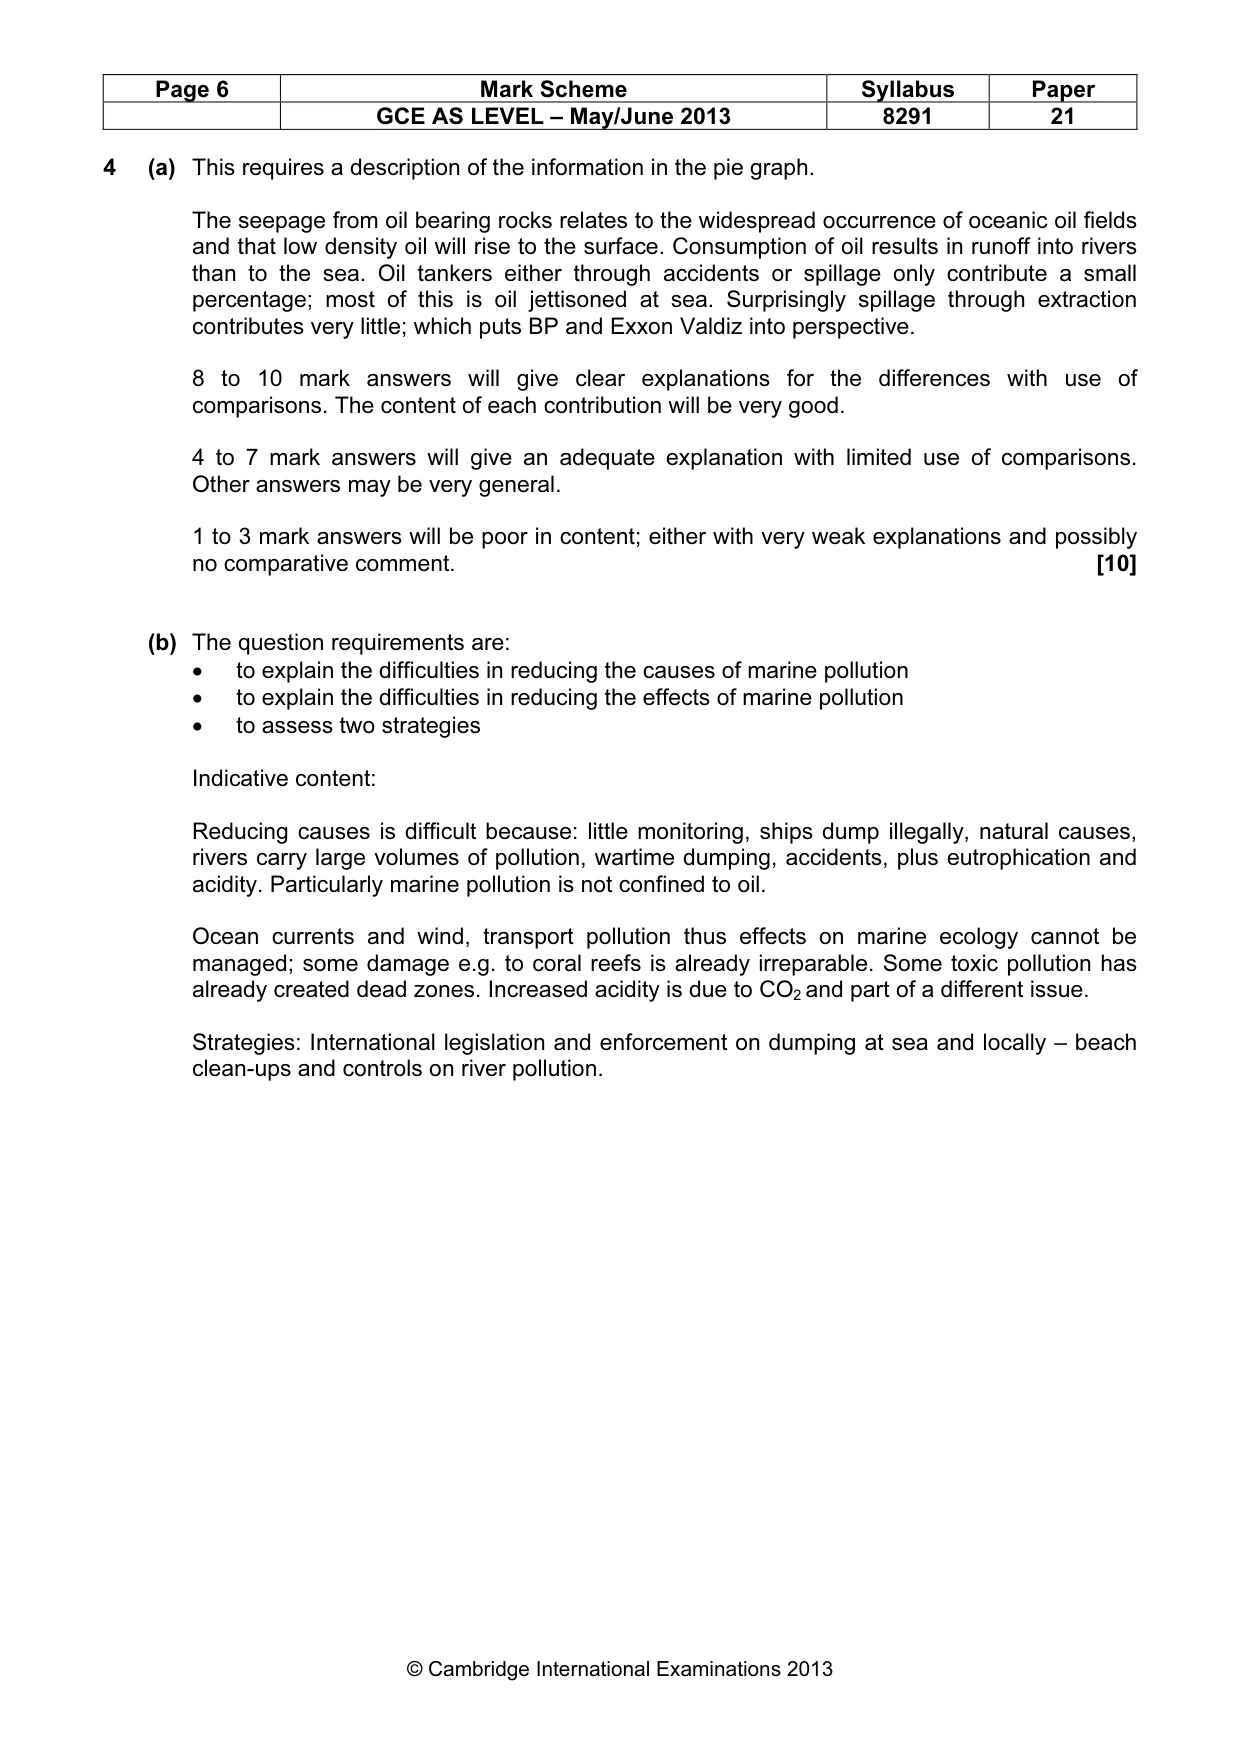
Page 6 Mark Scheme Syllabus Paper GCE AS LEVEL – May/June 2013 8291 21 © Cambridge International Examinations 2013 4 (a) This requires a description of the information in the pie graph. The seepage from oil bearing rocks relates to the widespread occurrence of oceanic oil fields and that low density oil will rise to the surface. Consumption of oil results in runoff into rivers than to the sea. Oil tankers either through accidents or spillage only contribute a small percentage; most of this is oil jettisoned at sea. Surprisingly spillage through extraction contributes very little; which puts BP and Exxon Valdiz into perspective. 8 to 10 mark answers will give clear explanations for the differences with use of comparisons. The content of each contribution will be very good. 4 to 7 mark answers will give an adequate explanation with limited use of comparisons. Other answers may be very general. 1 to 3 mark answers will be poor in content; either with very weak explanations and possibly no comparative comment. [10] (b) The question requirements are: • to explain the difficulties in reducing the causes of marine pollution • to explain the difficulties in reducing the effects of marine pollution • to assess two strategies Indicative content: Reducing causes is difficult because: little monitoring, ships dump illegally, natural causes, rivers carry large volumes of pollution, wartime dumping, accidents, plus eutrophication and acidity. Particularly marine pollution is not confined to oil. Ocean currents and wind, transport pollution thus effects on marine ecology cannot be managed; some damage e.g. to coral reefs is already irreparable. Some toxic pollution has already created dead zones. Increased acidity is due to CO2 and part of a different issue. Strategies: International legislation and enforcement on dumping at sea and locally – beach clean-ups and controls on river pollution.
Mark scheme, page 7
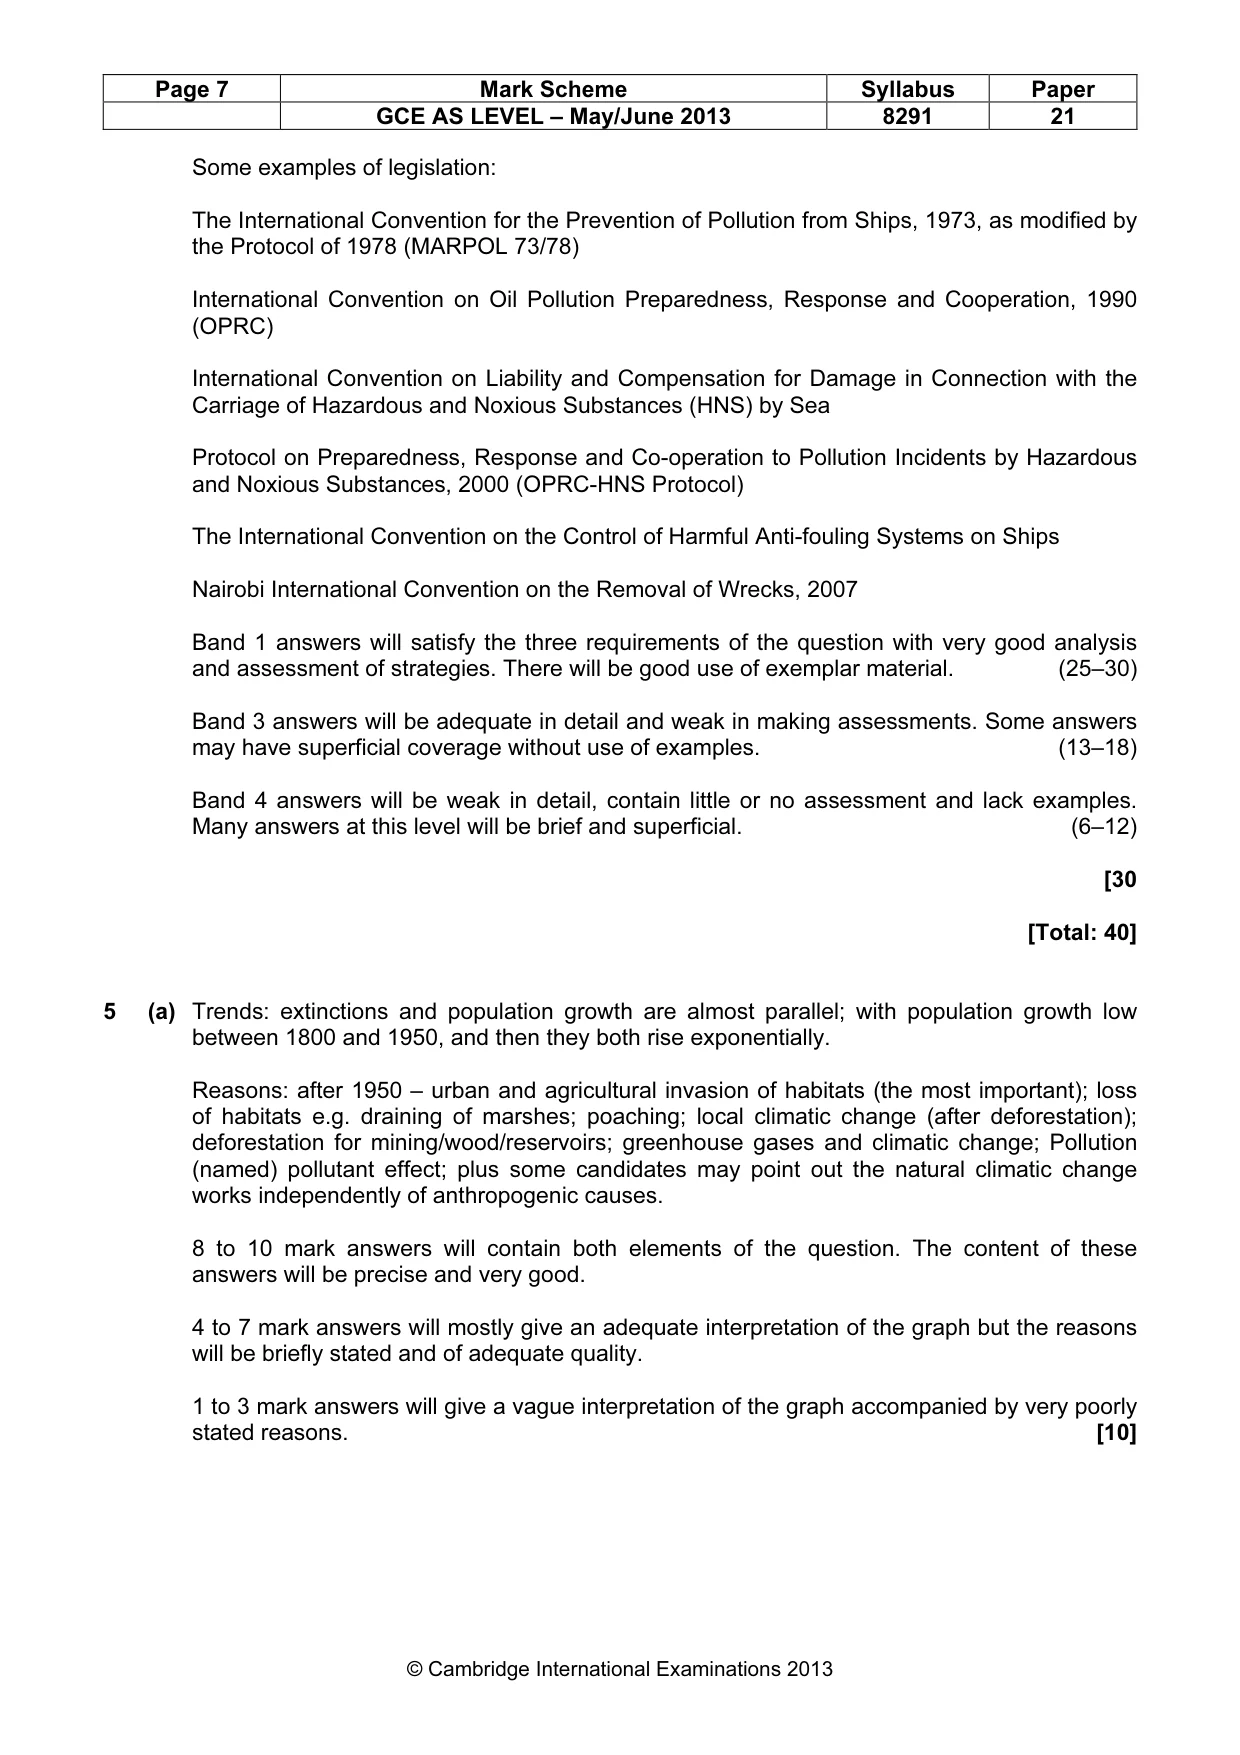
Page 7 Mark Scheme Syllabus Paper GCE AS LEVEL – May/June 2013 8291 21 © Cambridge International Examinations 2013 Some examples of legislation: The International Convention for the Prevention of Pollution from Ships, 1973, as modified by the Protocol of 1978 (MARPOL 73/78) International Convention on Oil Pollution Preparedness, Response and Cooperation, 1990 (OPRC) International Convention on Liability and Compensation for Damage in Connection with the Carriage of Hazardous and Noxious Substances (HNS) by Sea Protocol on Preparedness, Response and Co-operation to Pollution Incidents by Hazardous and Noxious Substances, 2000 (OPRC-HNS Protocol) The International Convention on the Control of Harmful Anti-fouling Systems on Ships Nairobi International Convention on the Removal of Wrecks, 2007 Band 1 answers will satisfy the three requirements of the question with very good analysis and assessment of strategies. There will be good use of exemplar material. (25–30) Band 3 answers will be adequate in detail and weak in making assessments. Some answers may have superficial coverage without use of examples. (13–18) Band 4 answers will be weak in detail, contain little or no assessment and lack examples. Many answers at this level will be brief and superficial. (6–12) [30 [Total: 40] 5 (a) Trends: extinctions and population growth are almost parallel; with population growth low between 1800 and 1950, and then they both rise exponentially. Reasons: after 1950 – urban and agricultural invasion of habitats (the most important); loss of habitats e.g. draining of marshes; poaching; local climatic change (after deforestation); deforestation for mining/wood/reservoirs; greenhouse gases and climatic change; Pollution (named) pollutant effect; plus some candidates may point out the natural climatic change works independently of anthropogenic causes. 8 to 10 mark answers will contain both elements of the question. The content of these answers will be precise and very good. 4 to 7 mark answers will mostly give an adequate interpretation of the graph but the reasons will be briefly stated and of adequate quality. 1 to 3 mark answers will give a vague interpretation of the graph accompanied by very poorly stated reasons. [10]
Mark scheme, page 8
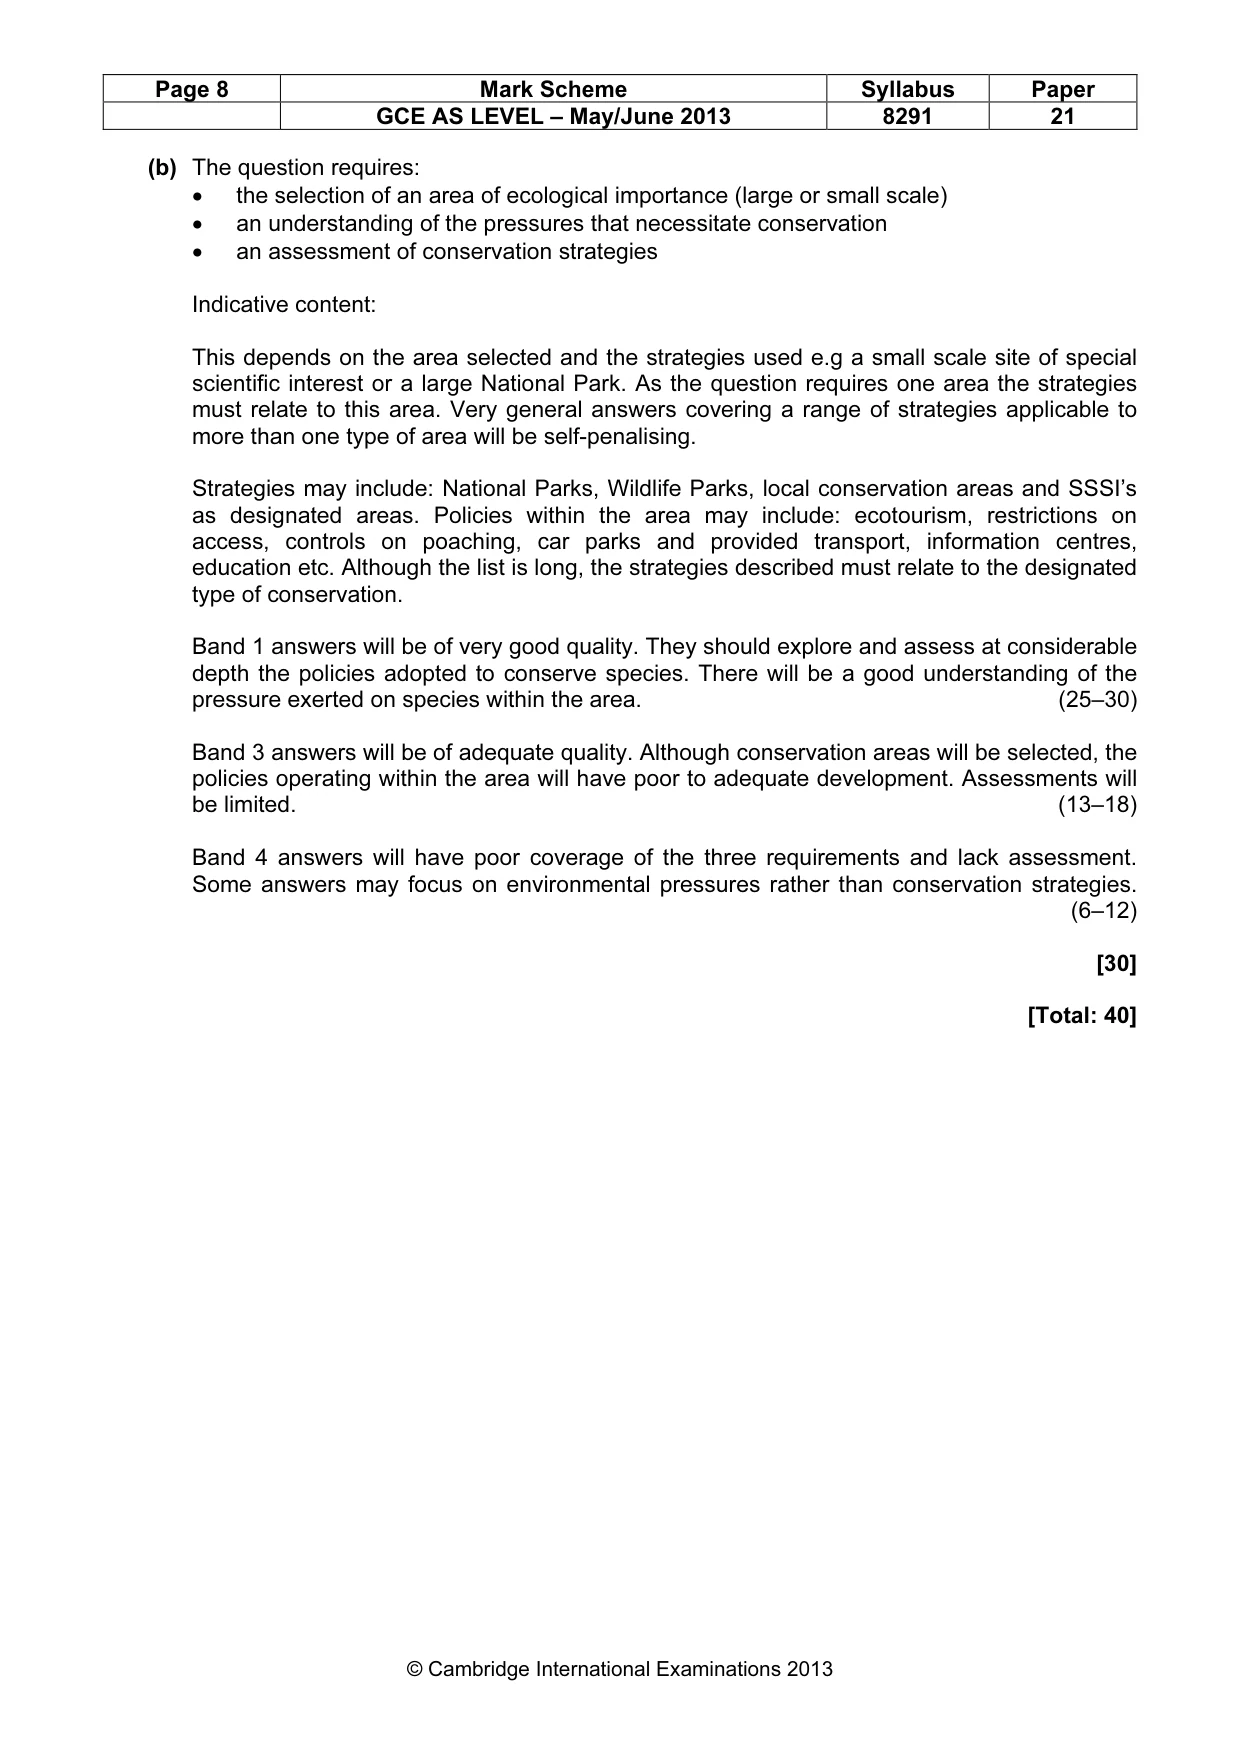
Page 8 Mark Scheme Syllabus Paper GCE AS LEVEL – May/June 2013 8291 21 © Cambridge International Examinations 2013 (b) The question requires: • the selection of an area of ecological importance (large or small scale) • an understanding of the pressures that necessitate conservation • an assessment of conservation strategies Indicative content: This depends on the area selected and the strategies used e.g a small scale site of special scientific interest or a large National Park. As the question requires one area the strategies must relate to this area. Very general answers covering a range of strategies applicable to more than one type of area will be self-penalising. Strategies may include: National Parks, Wildlife Parks, local conservation areas and SSSI’s as designated areas. Policies within the area may include: ecotourism, restrictions on access, controls on poaching, car parks and provided transport, information centres, education etc. Although the list is long, the strategies described must relate to the designated type of conservation. Band 1 answers will be of very good quality. They should explore and assess at considerable depth the policies adopted to conserve species. There will be a good understanding of the pressure exerted on species within the area. (25–30) Band 3 answers will be of adequate quality. Although conservation areas will be selected, the policies operating within the area will have poor to adequate development. Assessments will be limited. (13–18) Band 4 answers will have poor coverage of the three requirements and lack assessment. Some answers may focus on environmental pressures rather than conservation strategies. (6–12) [30] [Total: 40]
Mark scheme, page 9
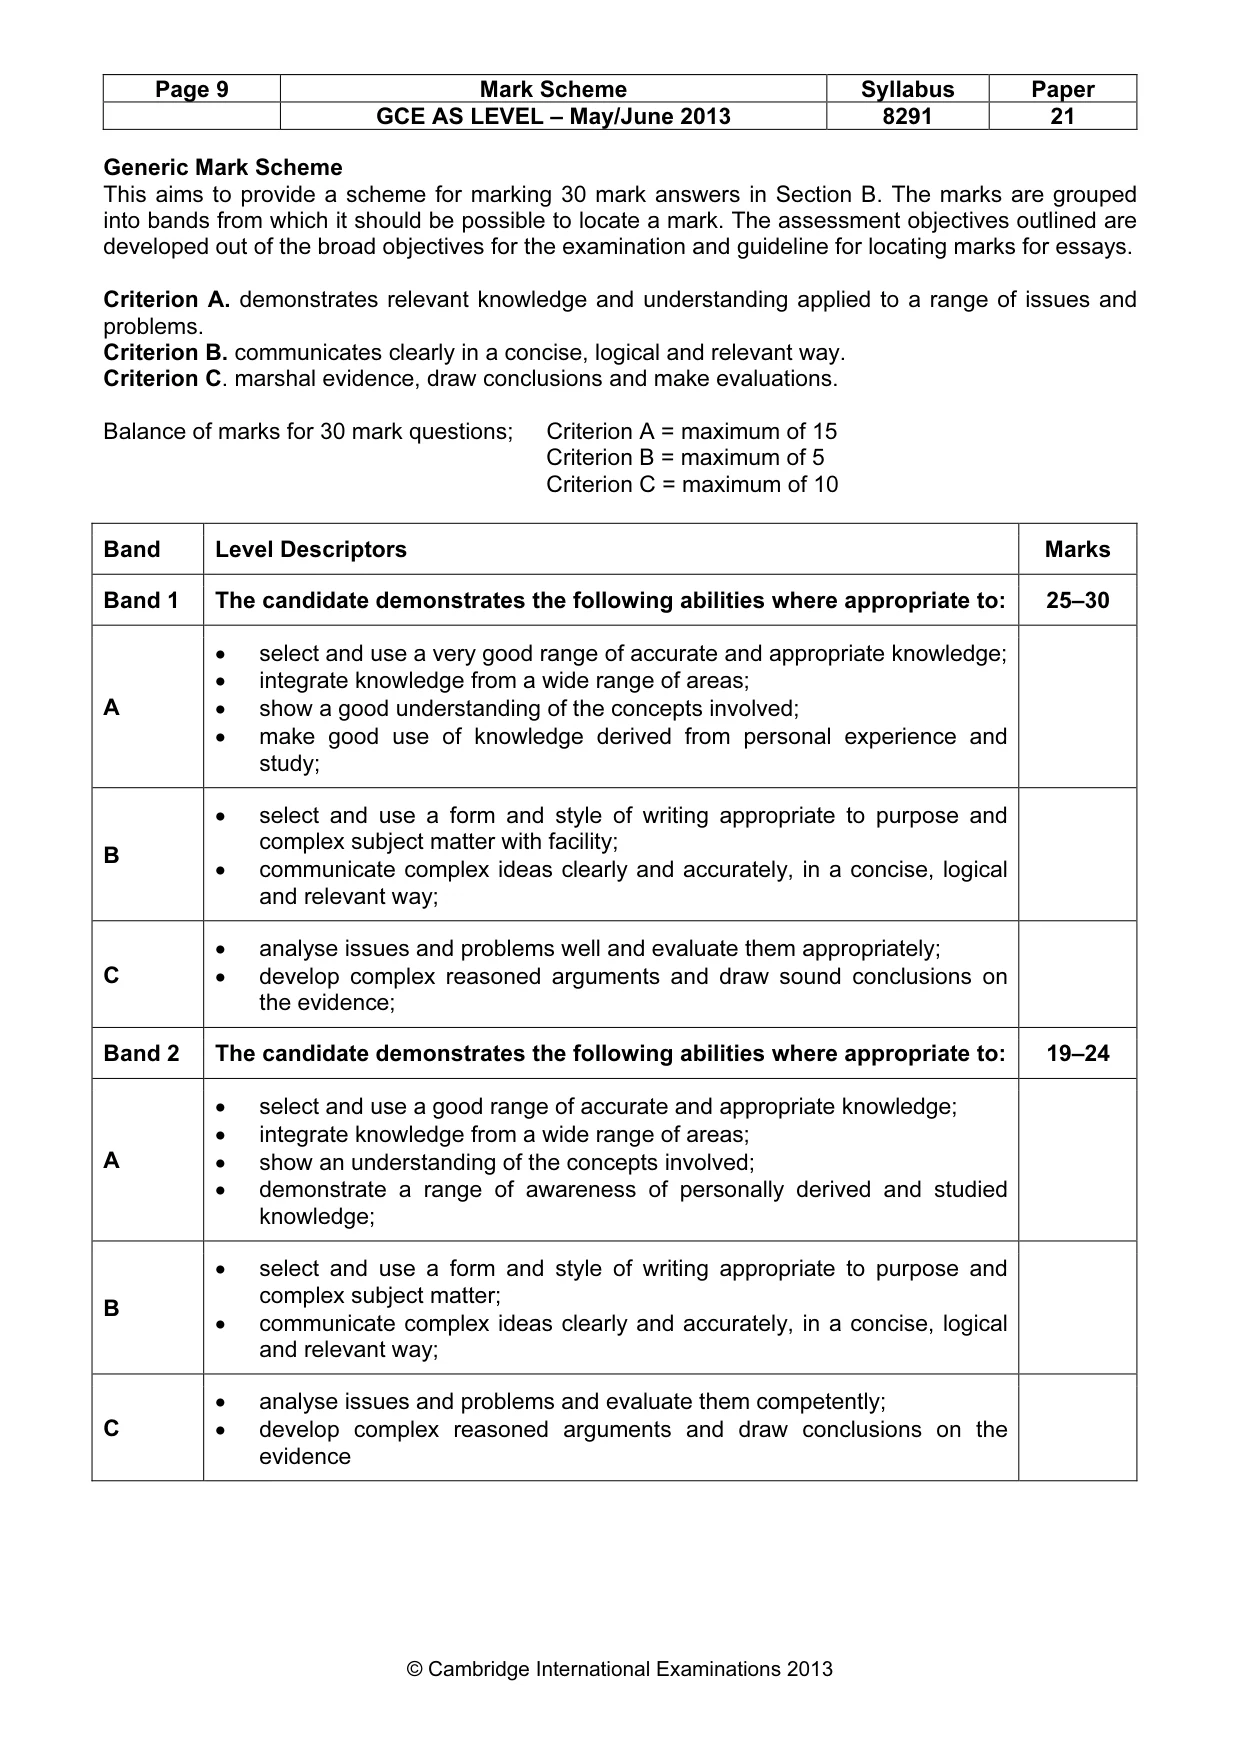
Page 9 Mark Scheme Syllabus Paper GCE AS LEVEL – May/June 2013 8291 21 © Cambridge International Examinations 2013 Generic Mark Scheme This aims to provide a scheme for marking 30 mark answers in Section B. The marks are grouped into bands from which it should be possible to locate a mark. The assessment objectives outlined are developed out of the broad objectives for the examination and guideline for locating marks for essays. Criterion A. demonstrates relevant knowledge and understanding applied to a range of issues and problems. Criterion B. communicates clearly in a concise, logical and relevant way. Criterion C. marshal evidence, draw conclusions and make evaluations. Balance of marks for 30 mark questions; Criterion A = maximum of 15 Criterion B = maximum of 5 Criterion C = maximum of 10 Band Level Descriptors Marks Band 1 The candidate demonstrates the following abilities where appropriate to: 25–30 A • select and use a very good range of accurate and appropriate knowledge; • integrate knowledge from a wide range of areas; • show a good understanding of the concepts involved; • make good use of knowledge derived from personal experience and study; B • select and use a form and style of writing appropriate to purpose and complex subject matter with facility; • communicate complex ideas clearly and accurately, in a concise, logical and relevant way; C • analyse issues and problems well and evaluate them appropriately; • develop complex reasoned arguments and draw sound conclusions on the evidence; Band 2 The candidate demonstrates the following abilities where appropriate to: 19–24 A • select and use a good range of accurate and appropriate knowledge; • integrate knowledge from a wide range of areas; • show an understanding of the concepts involved; • demonstrate a range of awareness of personally derived and studied knowledge; B • select and use a form and style of writing appropriate to purpose and complex subject matter; • communicate complex ideas clearly and accurately, in a concise, logical and relevant way; C • analyse issues and problems and evaluate them competently; • develop complex reasoned arguments and draw conclusions on the evidence
Mark scheme, page 10
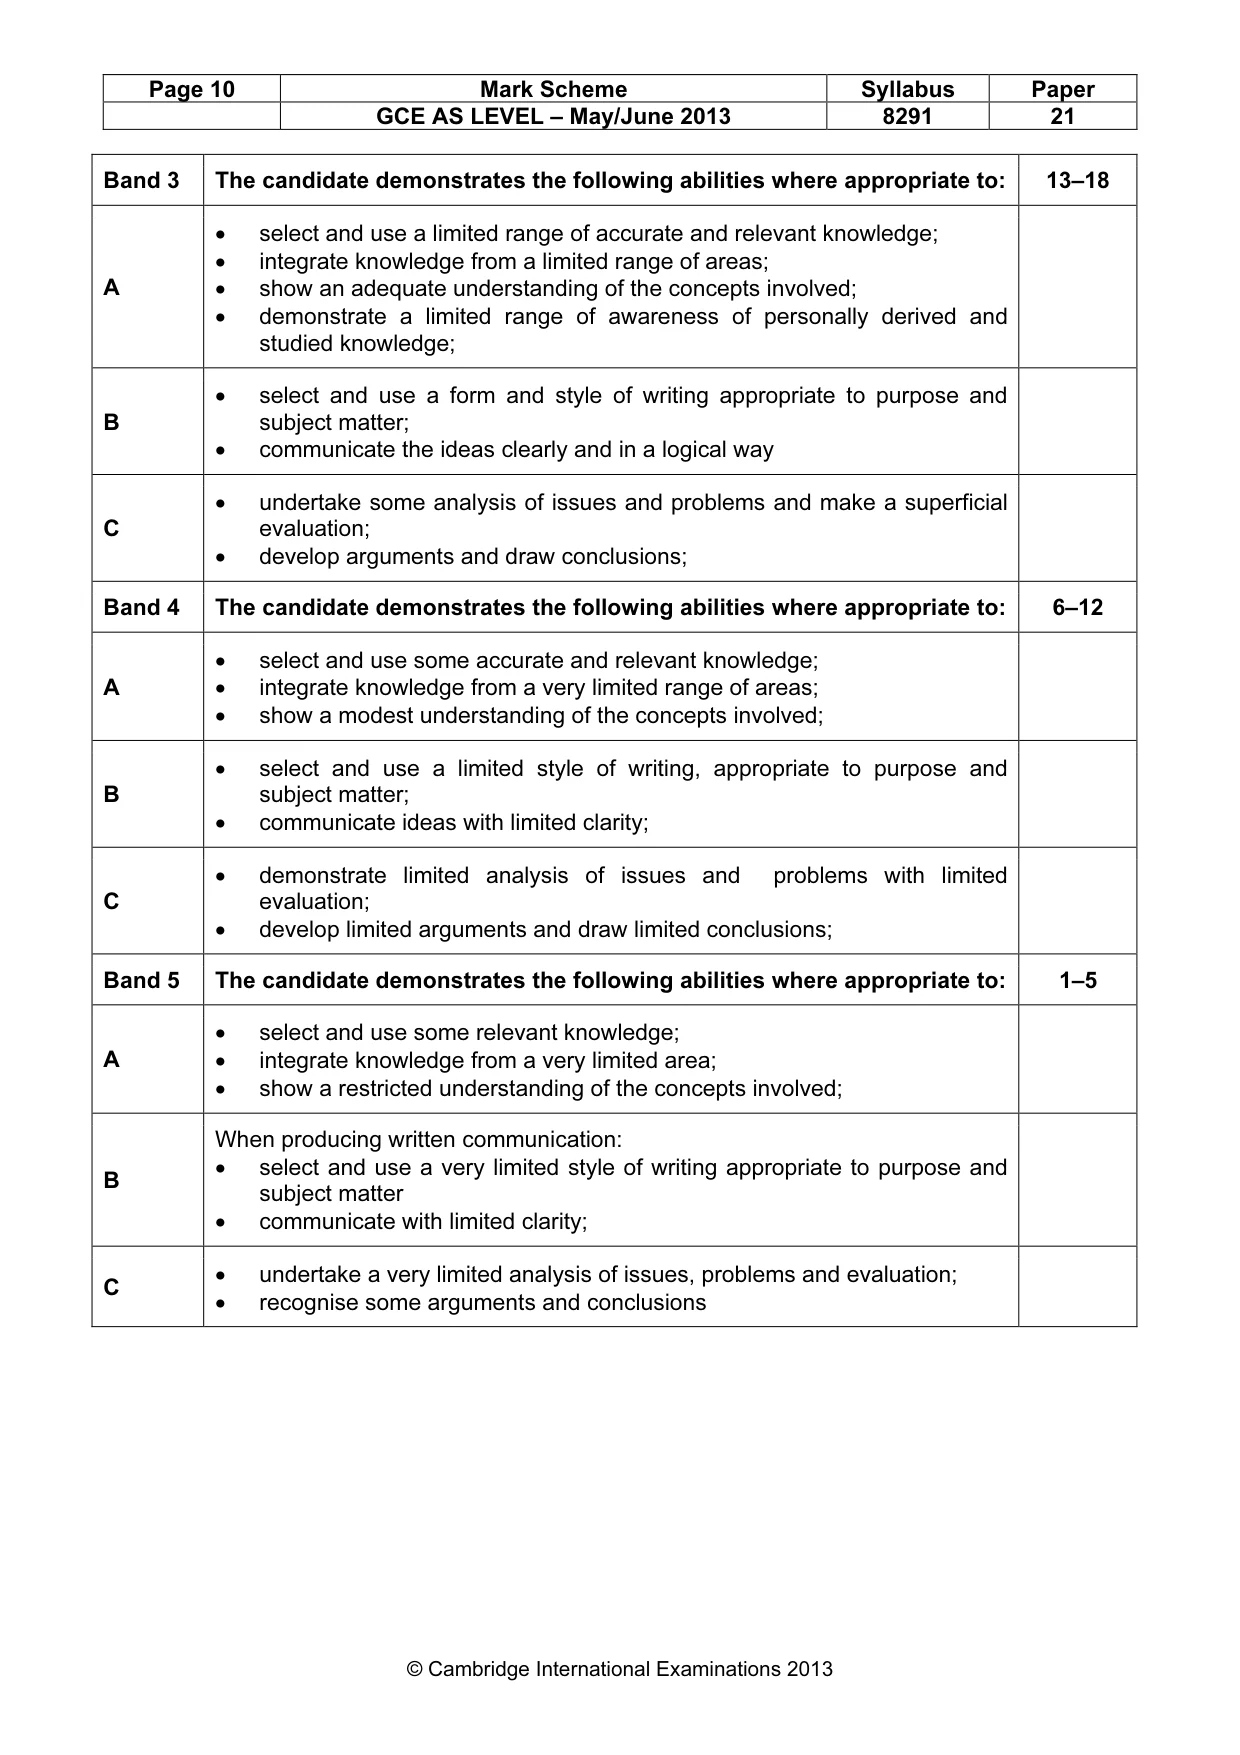
Page 10 Mark Scheme Syllabus Paper GCE AS LEVEL – May/June 2013 8291 21 © Cambridge International Examinations 2013 Band 3 The candidate demonstrates the following abilities where appropriate to: 13–18 A • select and use a limited range of accurate and relevant knowledge; • integrate knowledge from a limited range of areas; • show an adequate understanding of the concepts involved; • demonstrate a limited range of awareness of personally derived and studied knowledge; B • select and use a form and style of writing appropriate to purpose and subject matter; • communicate the ideas clearly and in a logical way C • undertake some analysis of issues and problems and make a superficial evaluation; • develop arguments and draw conclusions; Band 4 The candidate demonstrates the following abilities where appropriate to: 6–12 A • select and use some accurate and relevant knowledge; • integrate knowledge from a very limited range of areas; • show a modest understanding of the concepts involved; B • select and use a limited style of writing, appropriate to purpose and subject matter; • communicate ideas with limited clarity; C • demonstrate limited analysis of issues and problems with limited evaluation; • develop limited arguments and draw limited conclusions; Band 5 The candidate demonstrates the following abilities where appropriate to: 1–5 A • select and use some relevant knowledge; • integrate knowledge from a very limited area; • show a restricted understanding of the concepts involved; B When producing written communication: • select and use a very limited style of writing appropriate to purpose and subject matter • communicate with limited clarity; C • undertake a very limited analysis of issues, problems and evaluation; • recognise some arguments and conclusions
What you needed in this session
Cambridge’s own grade thresholds for 2013 May/June, Paper 2 · Variant 1. A higher threshold means an easier paper — the bar moves with how the cohort did.