Cambridge A Level Environmental Management (AS only) 8291 — 2012 Oct/Nov Paper 2 · Variant 1
8291/21/O/N/12 · 80 marks · ≈90 min
The question paper and its mark scheme, free to read here and free to download. This is Cambridge’s own paper, exactly as it was sat.
Question paper11 pages
Mark scheme8 pages
Answers below. Sit the paper first if you are practising.
Paper as text
Question paper, page 1
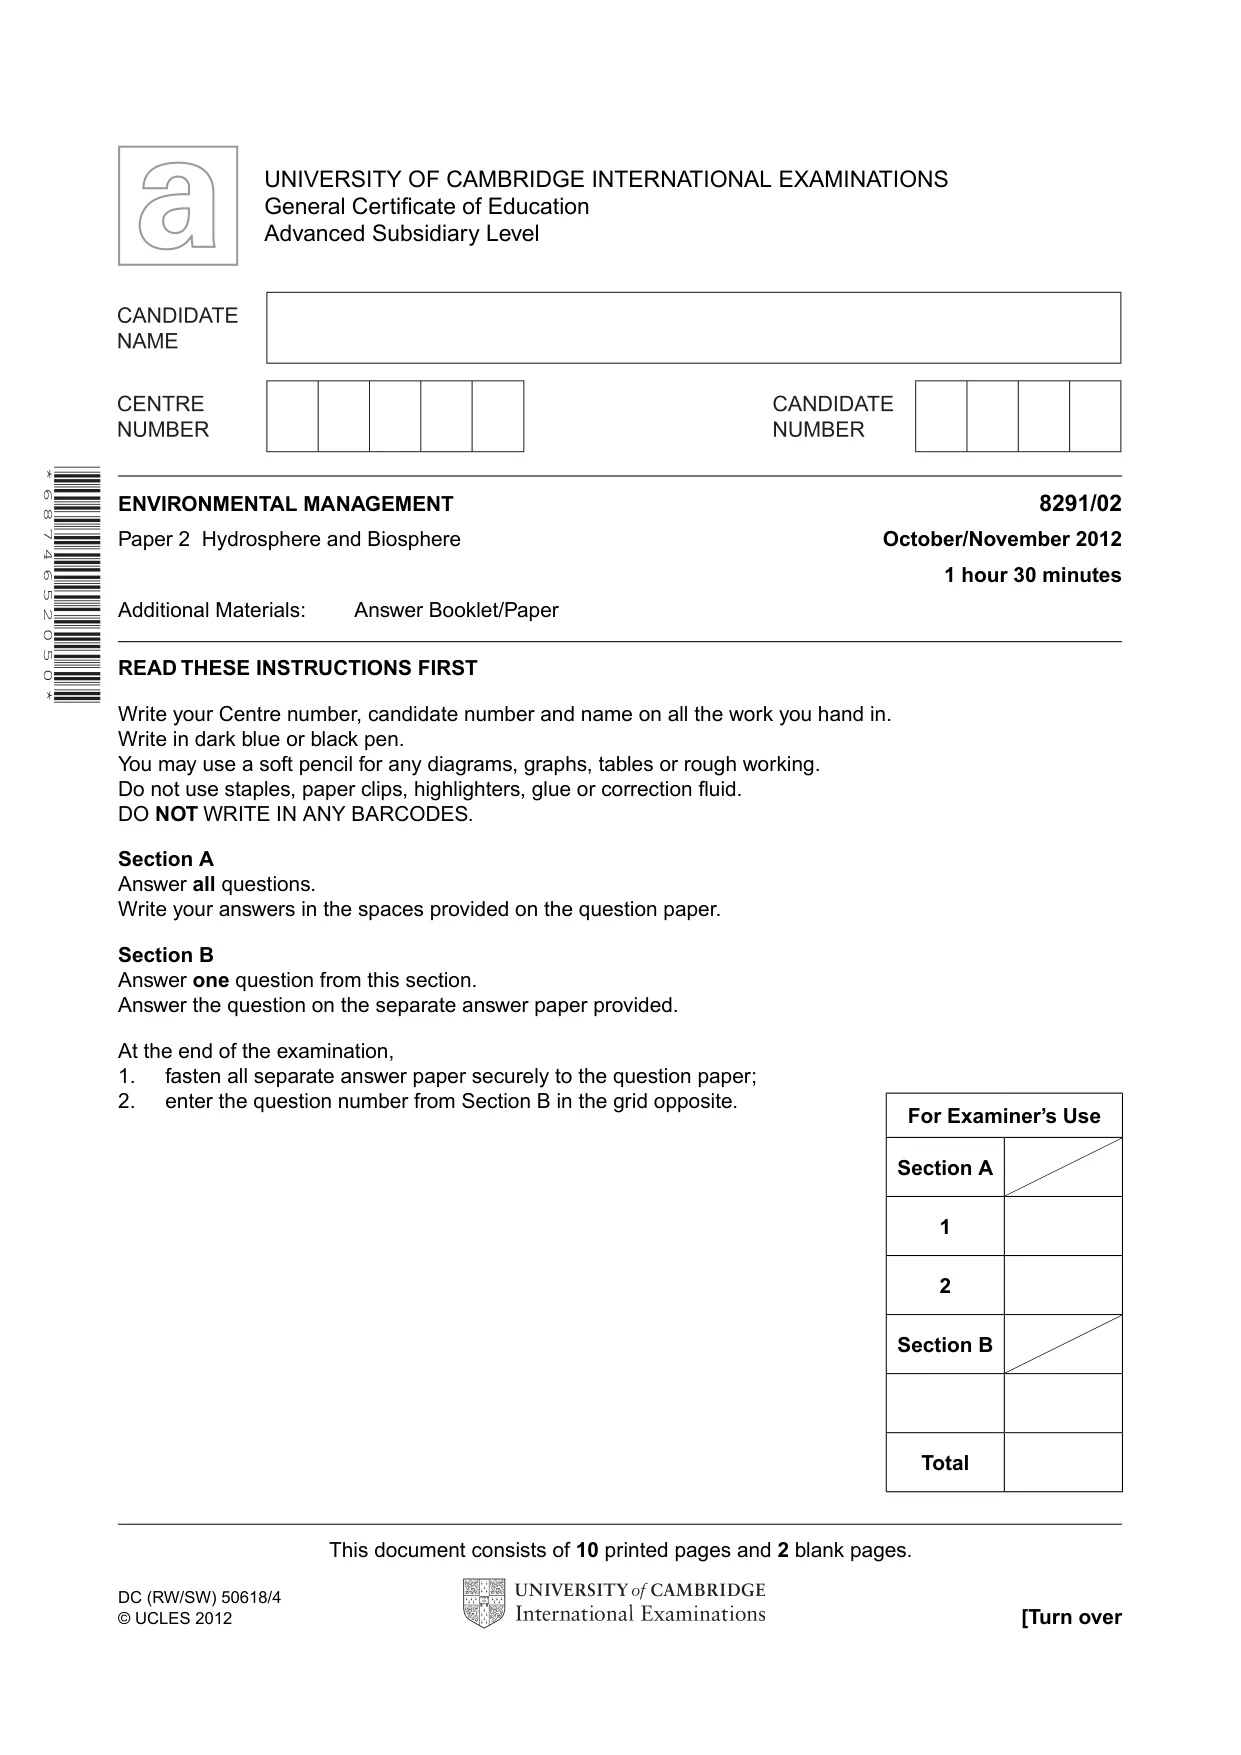
This document consists of 10 printed pages and 2 blank pages. DC (RW/SW) 50618/4 © UCLES 2012 [Turn over UNIVERSITY OF CAMBRIDGE INTERNATIONAL EXAMINATIONS General Certificate of Education Advanced Subsidiary Level * 6 8 7 4 6 5 2 0 5 0 * ENVIRONMENTAL MANAGEMENT 8291/02 Paper 2 Hydrosphere and Biosphere October/November 2012 1 hour 30 minutes Additional Materials: Answer Booklet/Paper READ THESE INSTRUCTIONS FIRST Write your Centre number, candidate number and name on all the work you hand in. Write in dark blue or black pen. You may use a soft pencil for any diagrams, graphs, tables or rough working. Do not use staples, paper clips, highlighters, glue or correction fluid. DO NOT WRITE IN ANY BARCODES. Section A Answer all questions. Write your answers in the spaces provided on the question paper. Section B Answer one question from this section. Answer the question on the separate answer paper provided. At the end of the examination, 1. fasten all separate answer paper securely to the question paper; 2. enter the question number from Section B in the grid opposite. For Examiner’s Use Section A 1 2 Section B Total
Question paper, page 2
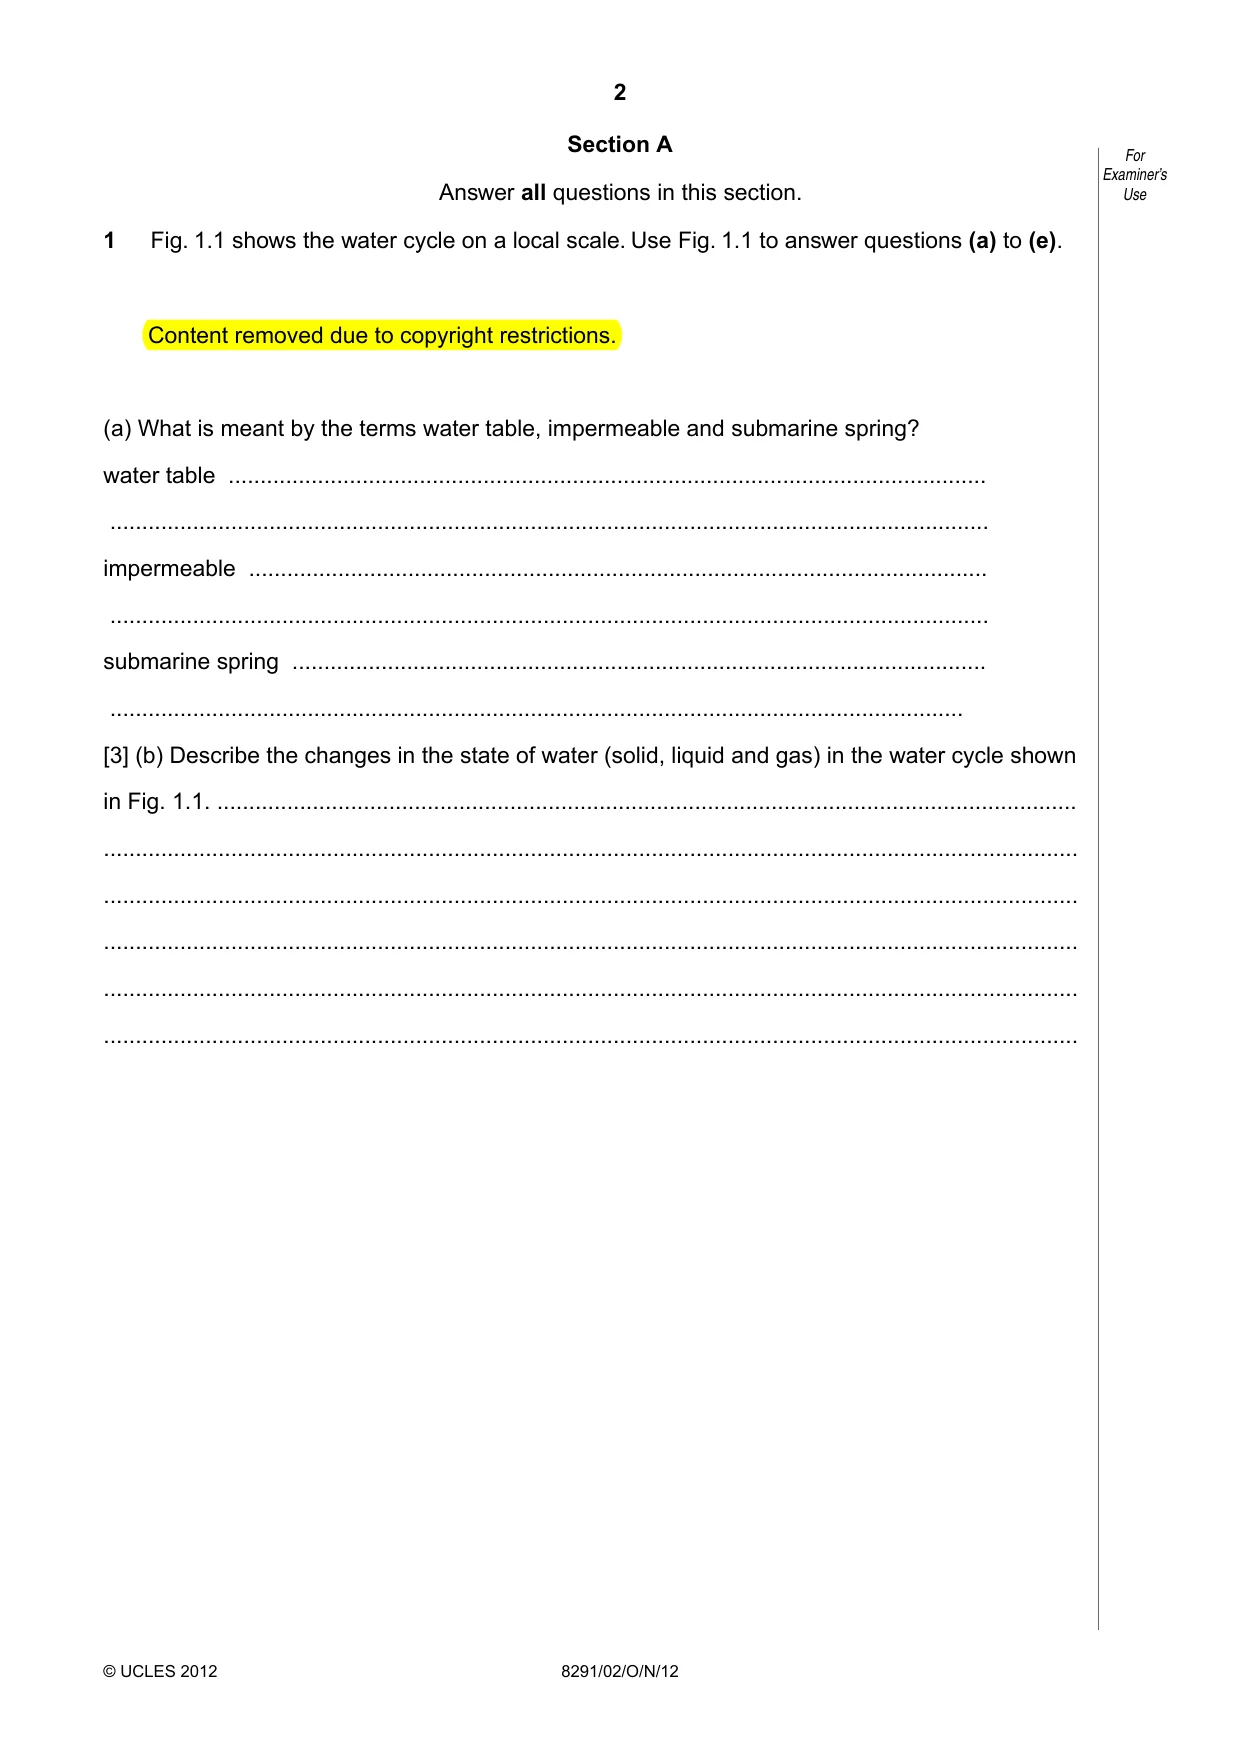
2 8291/02/O/N/12 © UCLES 2012 For Examiner’s Use Section A Answer all questions in this section. 1 Fig. 1.1 shows the water cycle on a local scale. Use Fig. 1.1 to answer questions (a) to (e). Content removed due to copyright restrictions. (a) What is meant by the terms water table, impermeable and submarine spring? water table … … impermeable … … submarine spring … … [3] (b) Describe the changes in the state of water (solid, liquid and gas) in the water cycle shown in Fig. 1.1. … … … … … …
Question paper, page 3
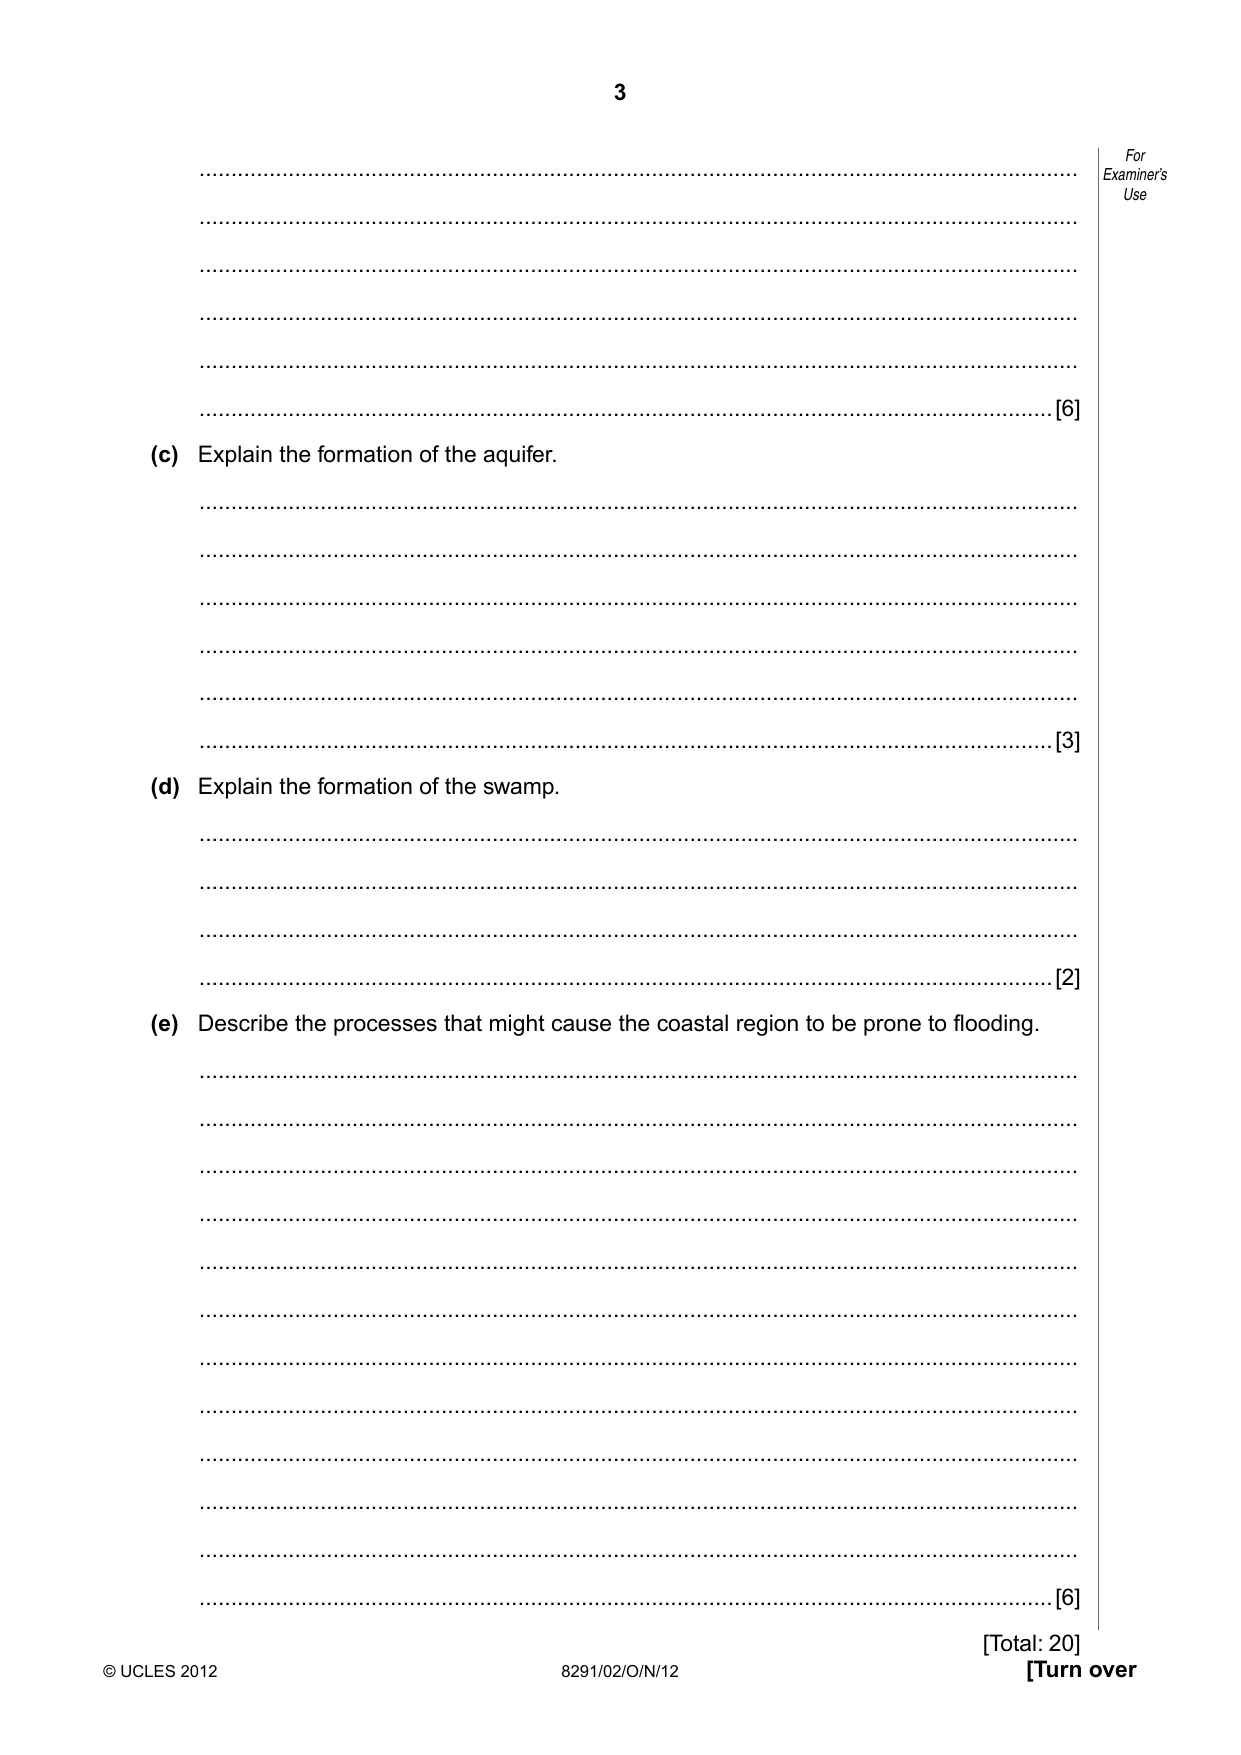
3 8291/02/O/N/12 © UCLES 2012 [Turn over For Examiner’s Use … … … … … …[6] (c) Explain the formation of the aquifer. … … … … … …[3] (d) Explain the formation of the swamp. … … … …[2] (e) Describe the processes that might cause the coastal region to be prone to flooding. … … … … … … … … … … … …[6] [Total: 20]
Question paper, page 4
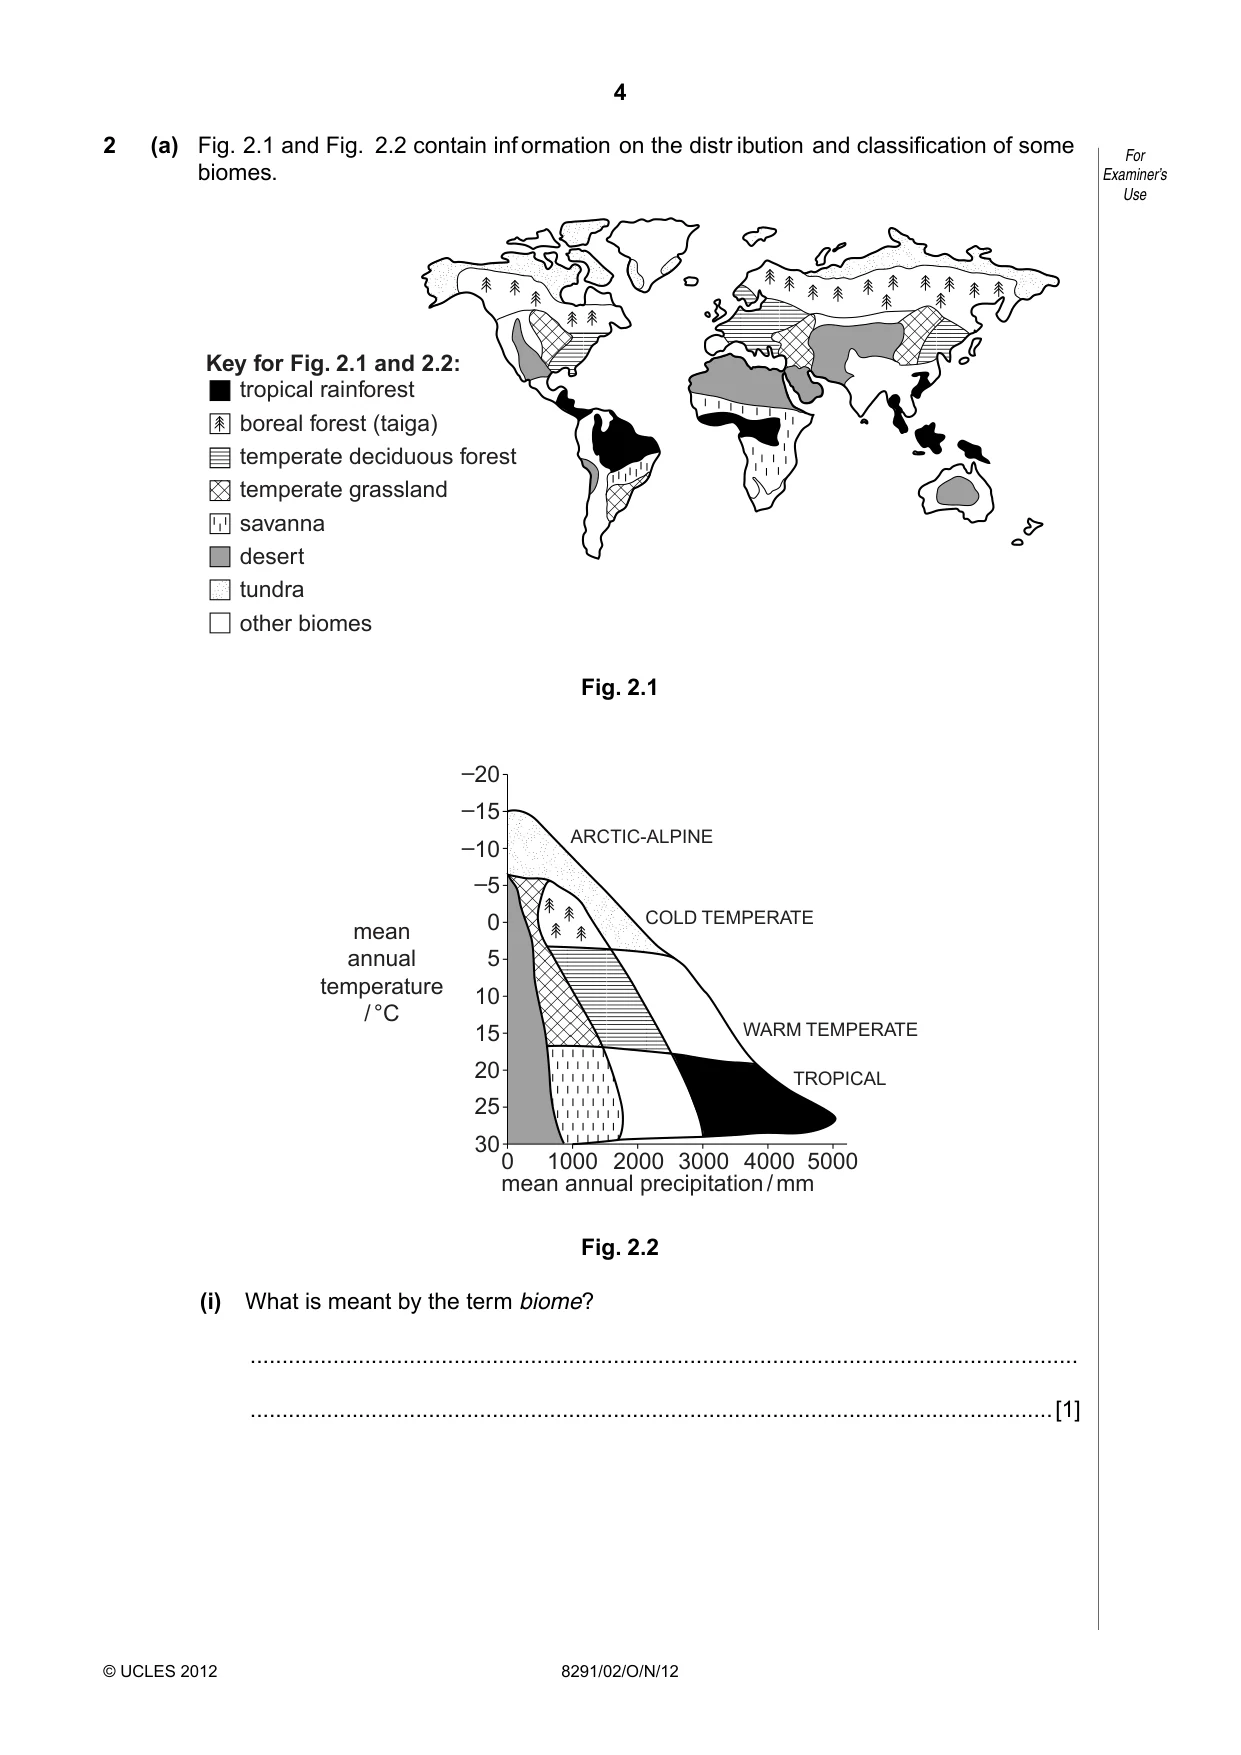
4 8291/02/O/N/12 © UCLES 2012 For Examiner’s Use 2 (a) Fig. 2.1 and Fig. 2.2 contain information on the distr ibution and classification of some biomes. tropical rainforest boreal forest (taiga) temperate deciduous forest temperate grassland savanna desert tundra other biomes Key for Fig. 2.1 and 2.2: Fig. 2.1 0 30 25 20 15 10 mean annual temperature / °C mean annual precipitation / mm 5 0 –5 –10 –15 –20 1000 2000 3000 4000 5000 ARCTIC-ALPINE COLD TEMPERATE WARM TEMPERATE TROPICAL Fig. 2.2 (i) What is meant by the term biome? … …[1]
Question paper, page 5
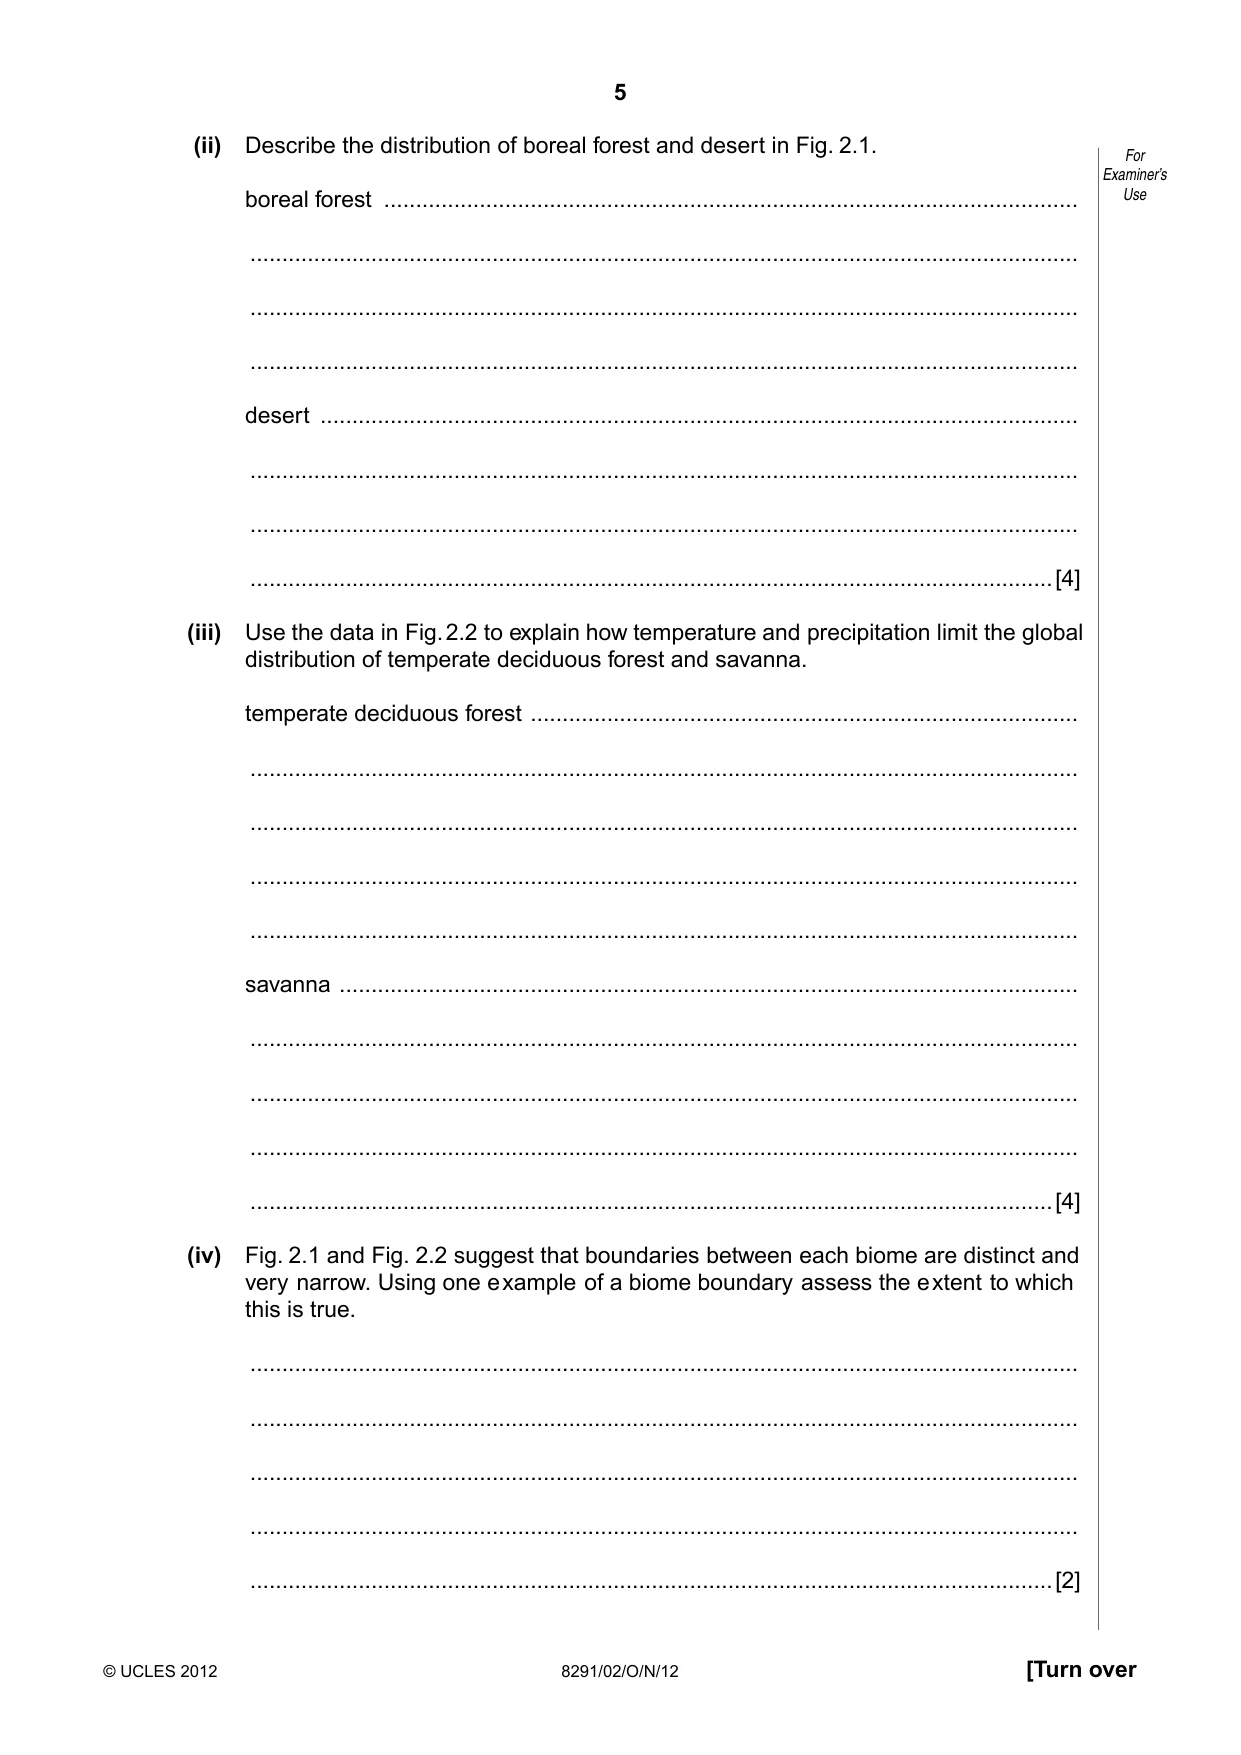
5 8291/02/O/N/12 © UCLES 2012 [Turn over For Examiner’s Use (ii) Describe the distribution of boreal forest and desert in Fig. 2.1. boreal forest … … … … desert … … … …[4] (iii) Use the data in Fig. 2.2 to explain how temperature and precipitation limit the global distribution of temperate deciduous forest and savanna. temperate deciduous forest … … … … … savanna … … … … …[4] (iv) Fig. 2.1 and Fig. 2.2 suggest that boundaries between each biome are distinct and very narrow. Using one example of a biome boundary assess the extent to which this is true. … … … … …[2]
Question paper, page 6
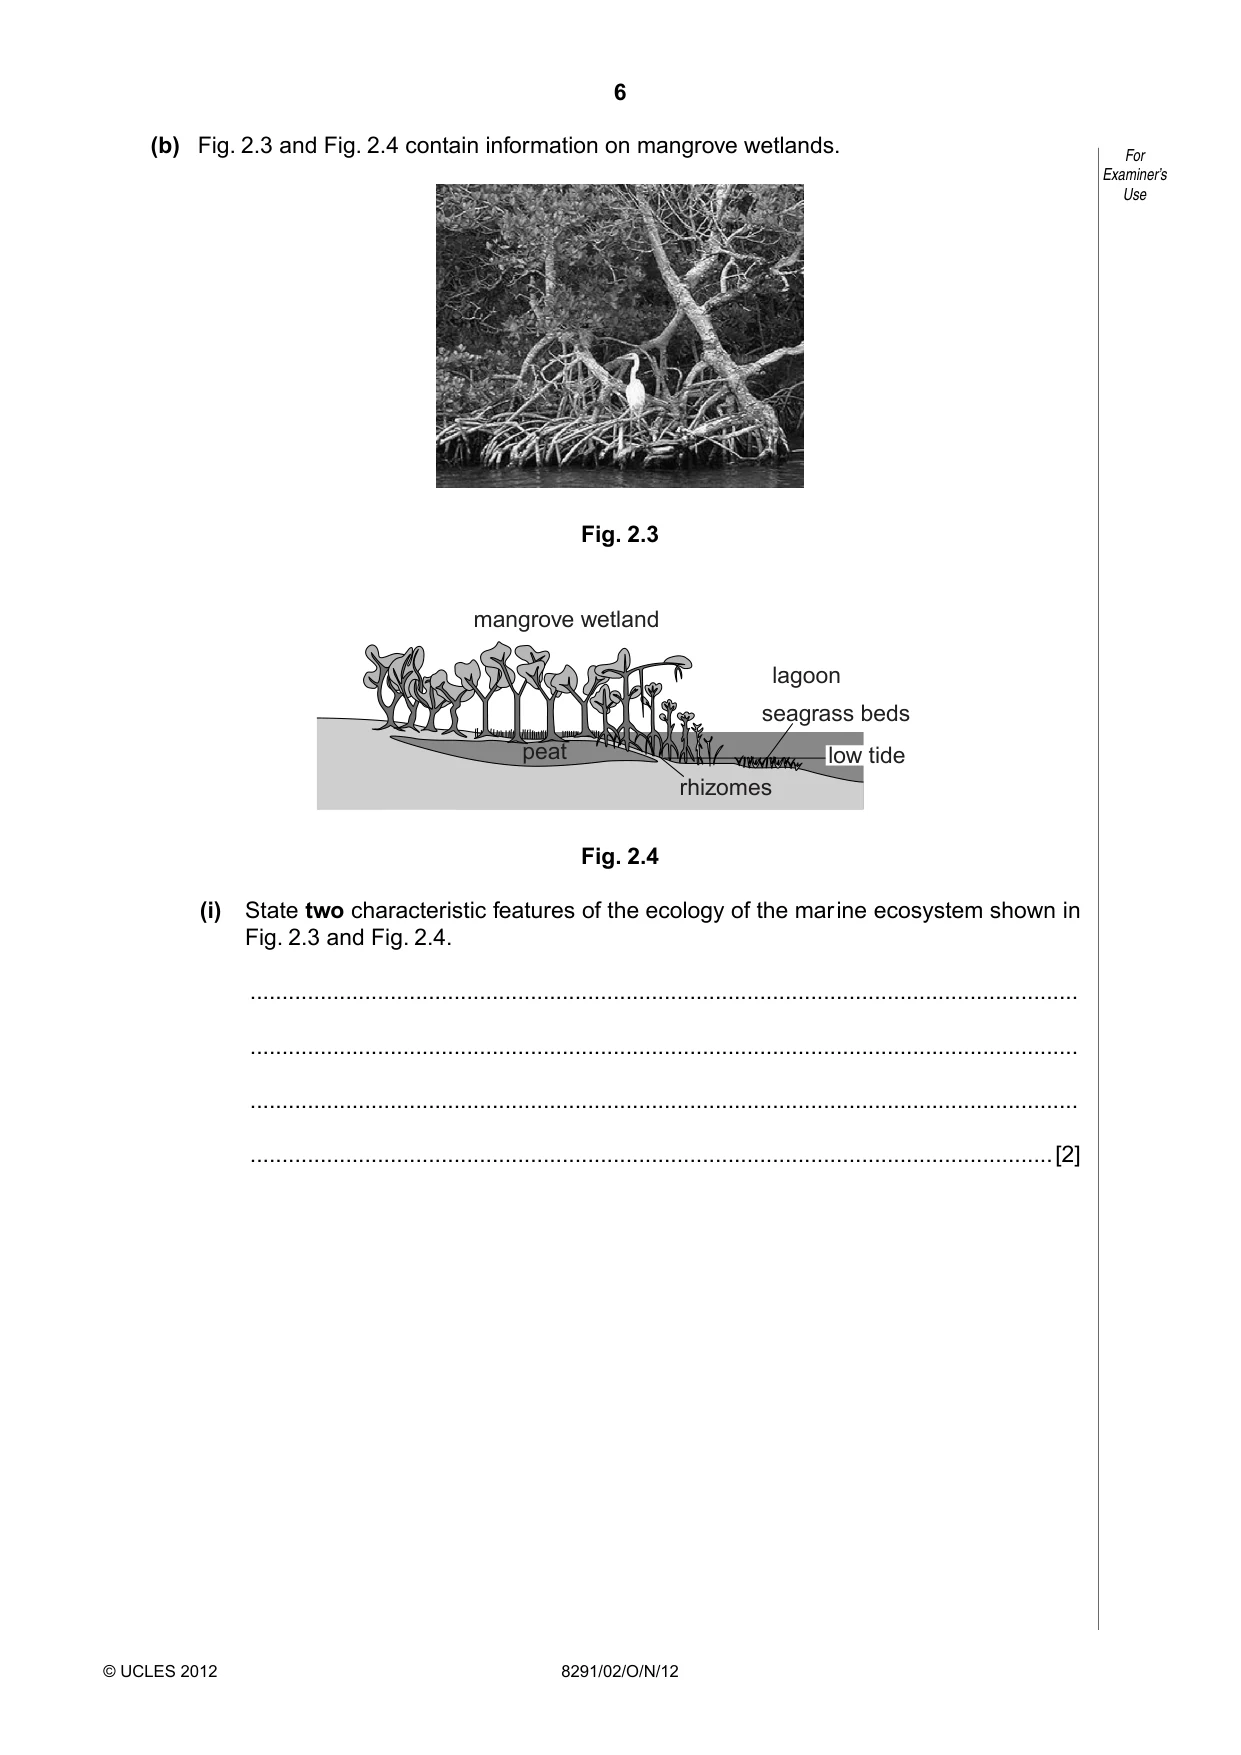
6 8291/02/O/N/12 © UCLES 2012 For Examiner’s Use (b) Fig. 2.3 and Fig. 2.4 contain information on mangrove wetlands. Fig. 2.3 peat rhizomes seagrass beds lagoon mangrove wetland low tide Fig. 2.4 (i) State two characteristic features of the ecology of the marine ecosystem shown in Fig. 2.3 and Fig. 2.4. … … … …[2]
Question paper, page 7
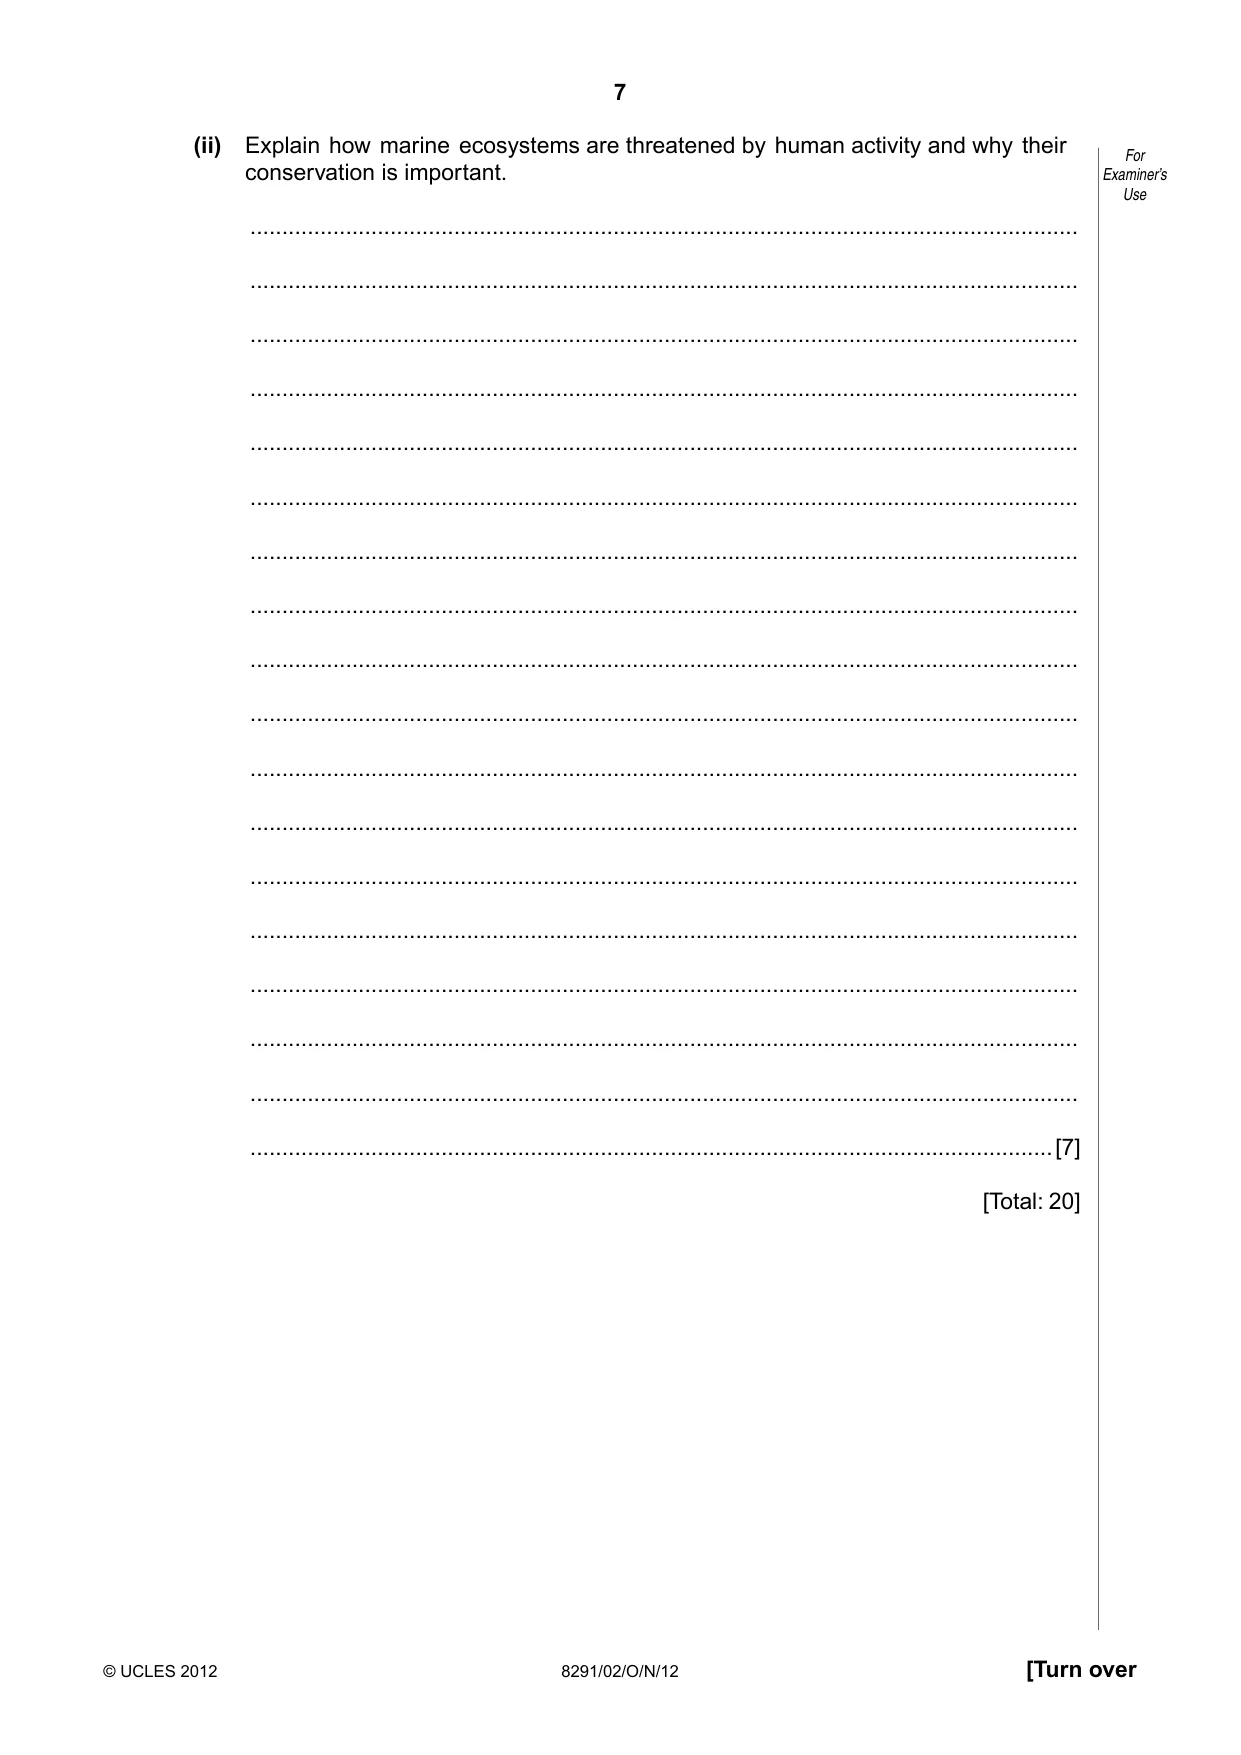
7 8291/02/O/N/12 © UCLES 2012 [Turn over For Examiner’s Use (ii) Explain how marine ecosystems are threatened by human activity and why their conservation is important. … … … … … … … … … … … … … … … … … …[7] [Total: 20]
Question paper, page 8
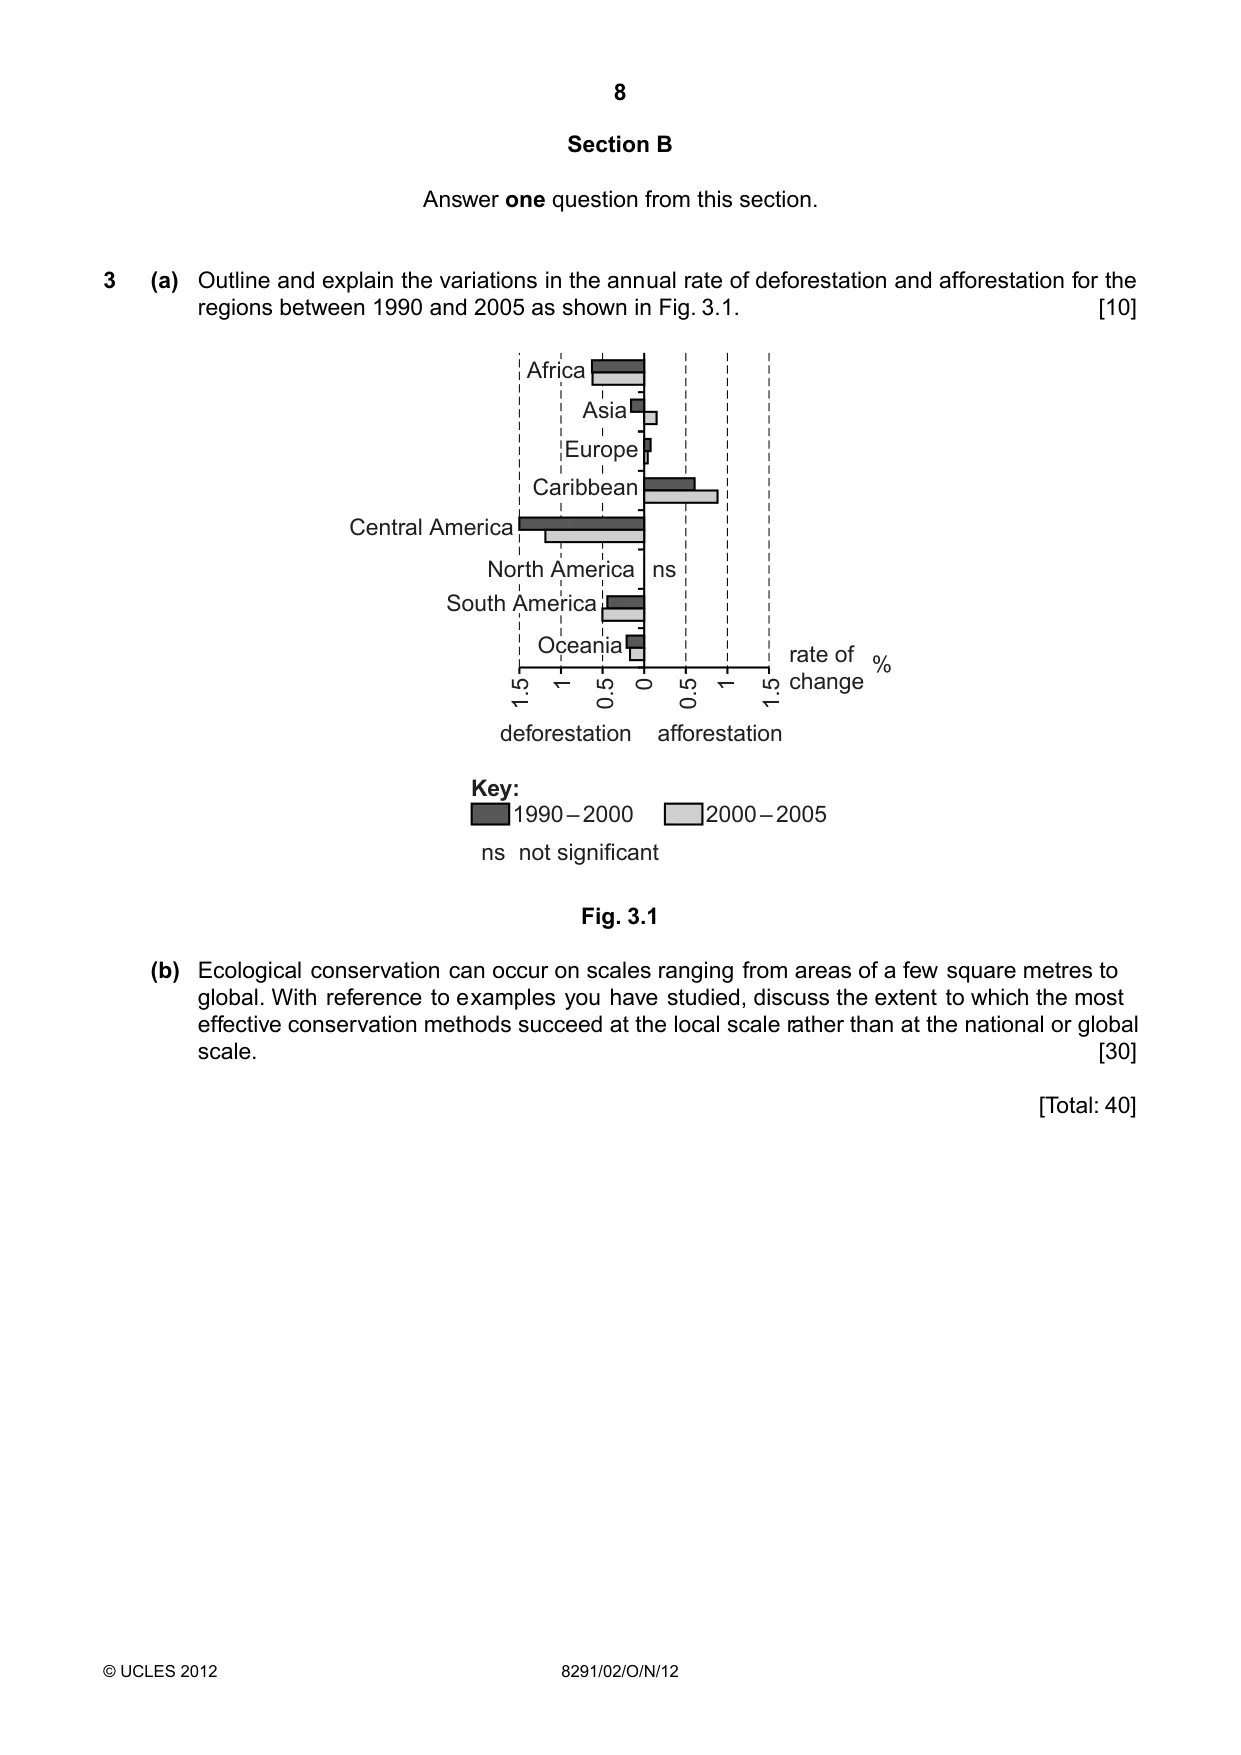
8 8291/02/O/N/12 © UCLES 2012 Section B Answer one question from this section. 3 (a) Outline and explain the variations in the annual rate of deforestation and afforestation for the regions between 1990 and 2005 as shown in Fig. 3.1. [10] Central America deforestation 1990 – 2000 not significant ns afforestation rate of change % 1.5 1 0.5 0 0.5 1 1.5 Caribbean Europe Asia Africa North America ns South America Oceania 2000 – 2005 Key: Fig. 3.1 (b) Ecological conservation can occur on scales ranging from areas of a few square metres to global. With reference to examples you have studied, discuss the extent to which the most effective conservation methods succeed at the local scale rather than at the national or global scale. [30] [Total: 40]
Question paper, page 9
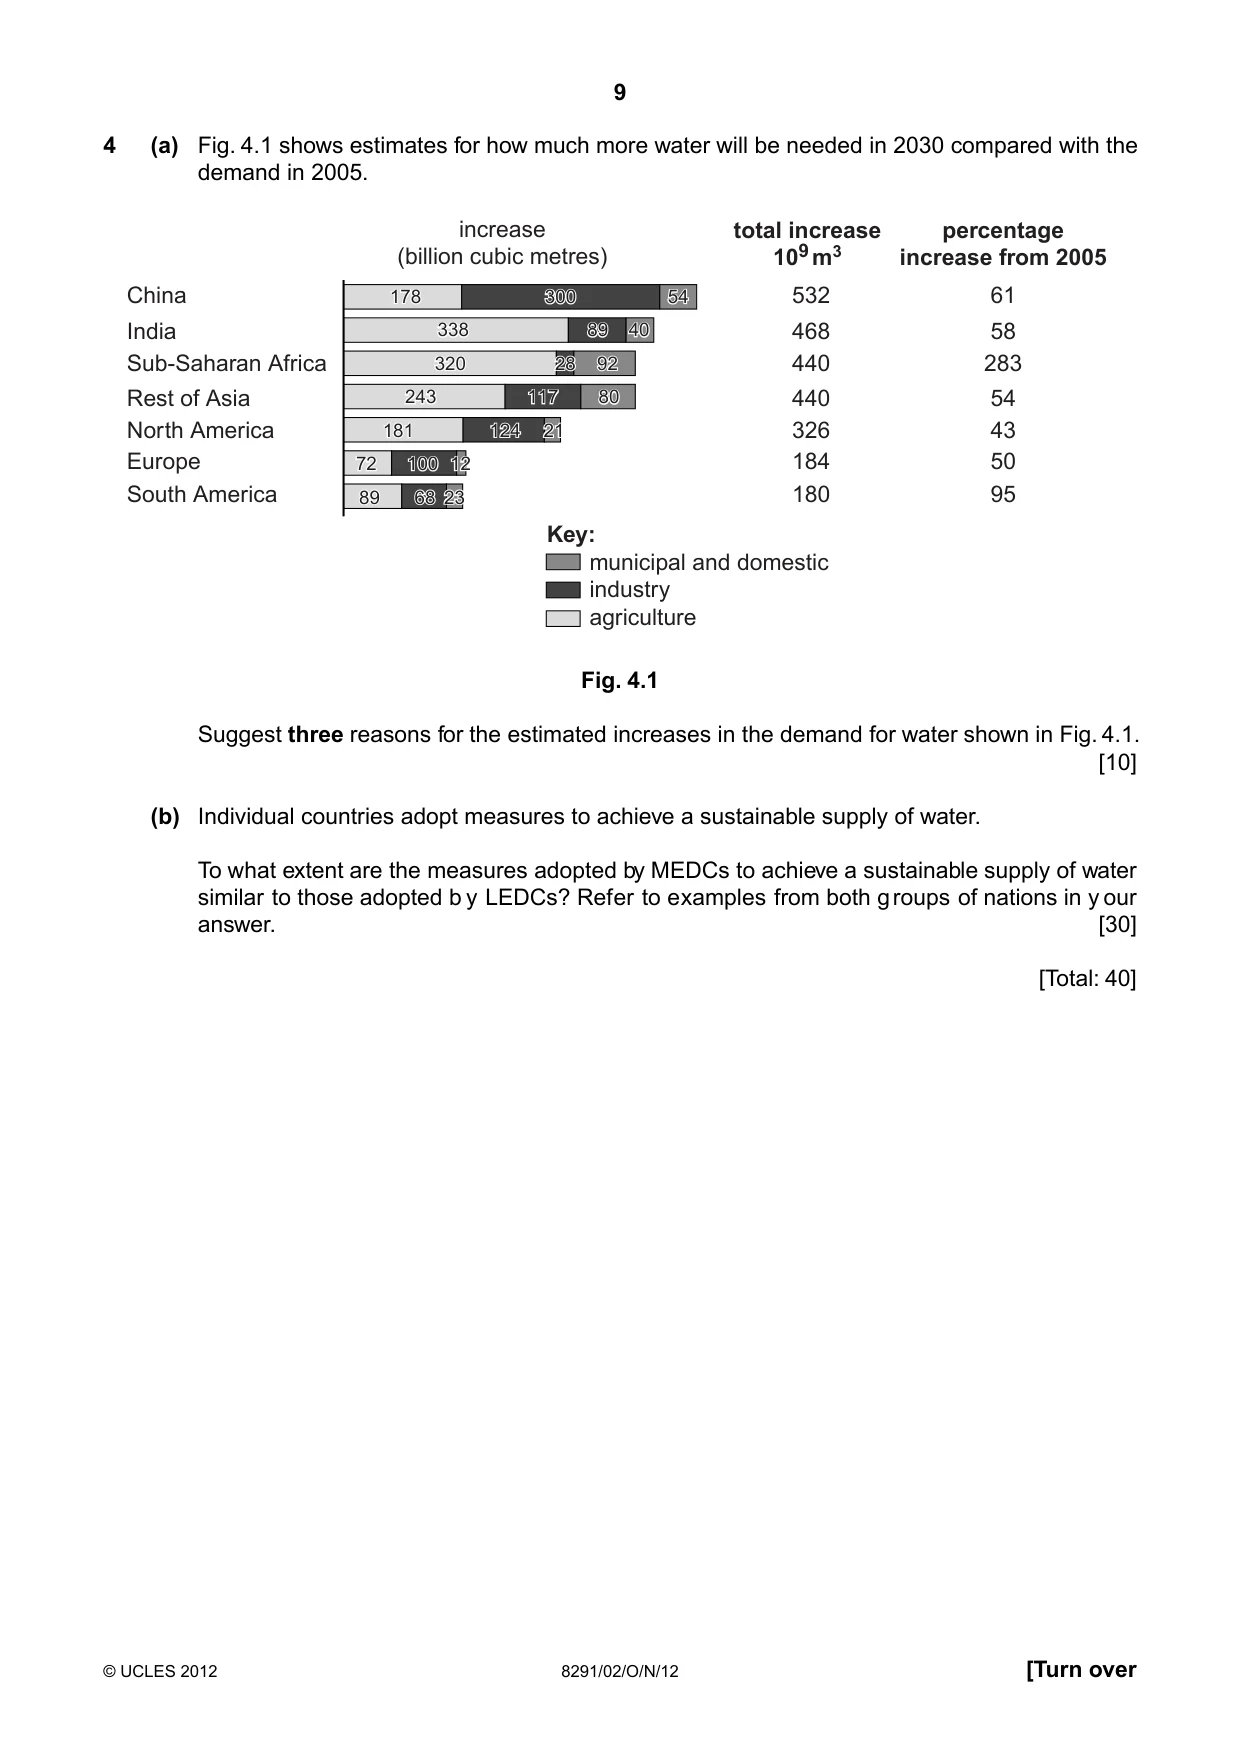
9 8291/02/O/N/12 © UCLES 2012 [Turn over 4 (a) Fig. 4.1 shows estimates for how much more water will be needed in 2030 compared with the demand in 2005. 178 China municipal and domestic industry agriculture Key: India Sub-Saharan Africa increase (billion cubic metres) Rest of Asia North America Europe South America 532 468 440 440 326 184 180 61 total increase 109 m3 percentage increase from 2005 58 283 54 43 50 95 300 54 338 89 40 320 28 92 243 117 80 181 124 21 72 100 12 89 68 23 Fig. 4.1 Suggest three reasons for the estimated increases in the demand for water shown in Fig. 4.1. [10] (b) Individual countries adopt measures to achieve a sustainable supply of water. To what extent are the measures adopted by MEDCs to achieve a sustainable supply of water similar to those adopted b y LEDCs? Refer to examples from both groups of nations in y our answer. [30] [Total: 40]
Question paper, page 10
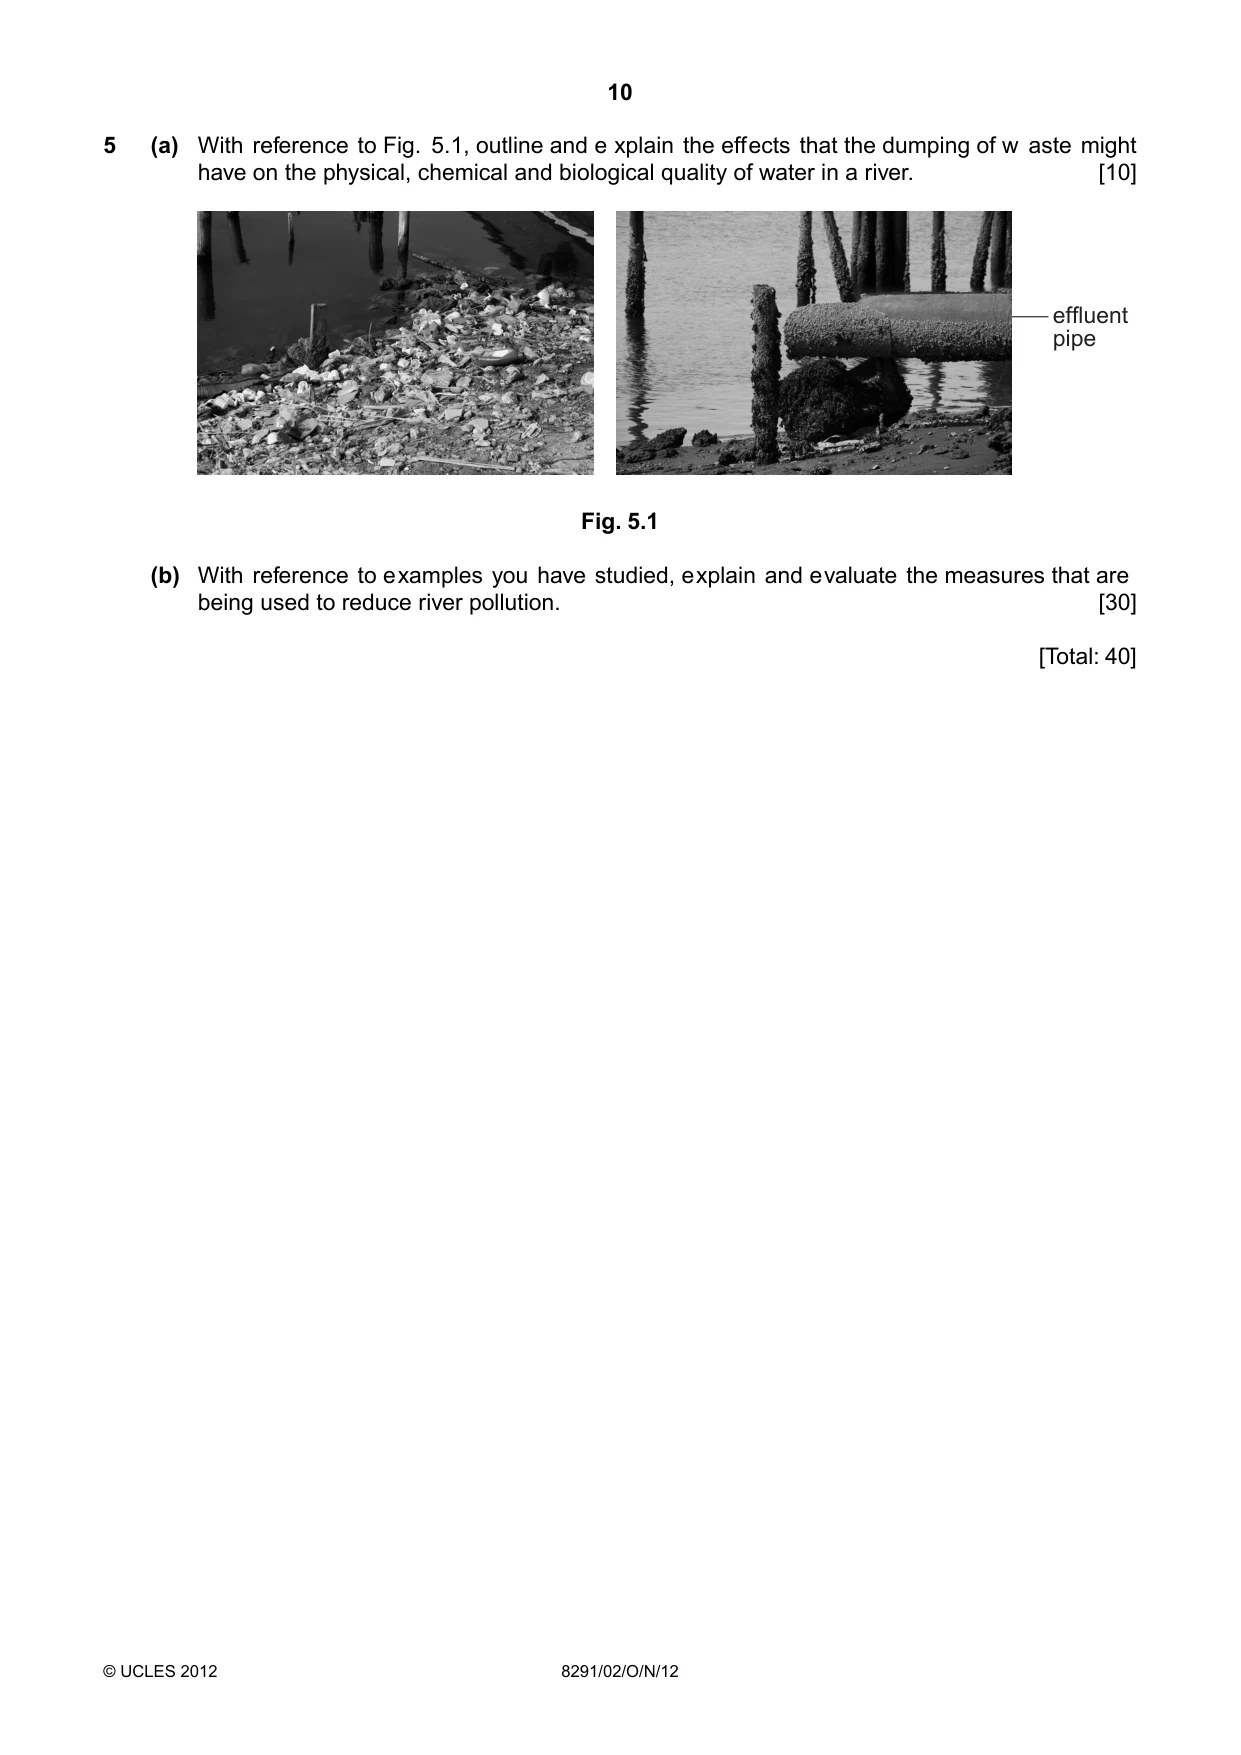
10 8291/02/O/N/12 © UCLES 2012 5 (a) With reference to Fig. 5.1, outline and e xplain the effects that the dumping of w aste might have on the physical, chemical and biological quality of water in a river. [10] effluent pipe Fig. 5.1 (b) With reference to examples you have studied, explain and evaluate the measures that are being used to reduce river pollution. [30] [Total: 40]
Question paper, page 11
12 8291/02/O/N/12 © UCLES 2012 Copyright Acknowledgements: Question 1a Figure 1.1 © http://www.environment.nsw.gov.au/salinity/basics/water.htm. Question 2a Figure 2.1 © http://students.ed.uiuc.ed/jtulley/Biomes.html. Question 2b Figure 2.3 © U.S. Geological Survey; http://gallery.usgs.gov/photos/k5Rj77ihc_4. Question 2b Figure 2.4 © http://www.dcbiodata.net/explorer/info/habitats. Question 3a Figure 3.1 © Food and Agriculture Organisation; http://www.fao.org. Question 4a Figure 4.1 © http://www.mckinsey.com/Client_Service/Sustainability/Latest_thinking/Charting_our_water_future. Question 5a Figure 5.1 © ToniFlap; Trash thrown on the bank of a river; http://www.istockphoto.com/stock-photo-12929125-garbage-dumped. php?st=45b49a4. carterdayne; Riverbed at low tide with sewage drain pipe showing how waste is dumped or piped into the river; http://www.istockphoto.com/stock-photo-7331647-river-at-low-tide-and-drain.php?st=bae448d. Permission to reproduce items where third-party owned material protected by copyright is included has been sought and cleared where possible. Every reasonable effort has been made by the publisher (UCLES) to trace copyright holders, but if any items requiring clearance have unwittingly been included, the publisher will be pleased to make amends at the earliest possible opportunity. University of Cambridge International Examinations is part of the Cambridge Assessment Group. Cambridge Assessment is the brand name of University of Cambridge Local Examinations Syndicate (UCLES), which is itself a department of the University of Cambridge. BLANK PAGE
Mark scheme, page 1
CAMBRIDGE INTERNATIONAL EXAMINATIONS GCE Advanced Subsidiary Level MARK SCHEME for the October/November 2012 series 8291 ENVIRONMENTAL MANAGEMENT 8291/02 Paper 2, maximum raw mark 80 This mark scheme is published as an aid to teachers and candidates, to indicate the requirements of the examination. It shows the basis on which Examiners were instructed to award marks. It does not indicate the details of the discussions that took place at an Examiners’ meeting before marking began, which would have considered the acceptability of alternative answers. Mark schemes should be read in conjunction with the question paper and the Principal Examiner Report for Teachers. Cambridge will not enter into discussions about these mark schemes. Cambridge is publishing the mark schemes for the October/November 2012 series for most IGCSE, GCE Advanced Level and Advanced Subsidiary Level components and some Ordinary Level components.
Mark scheme, page 2
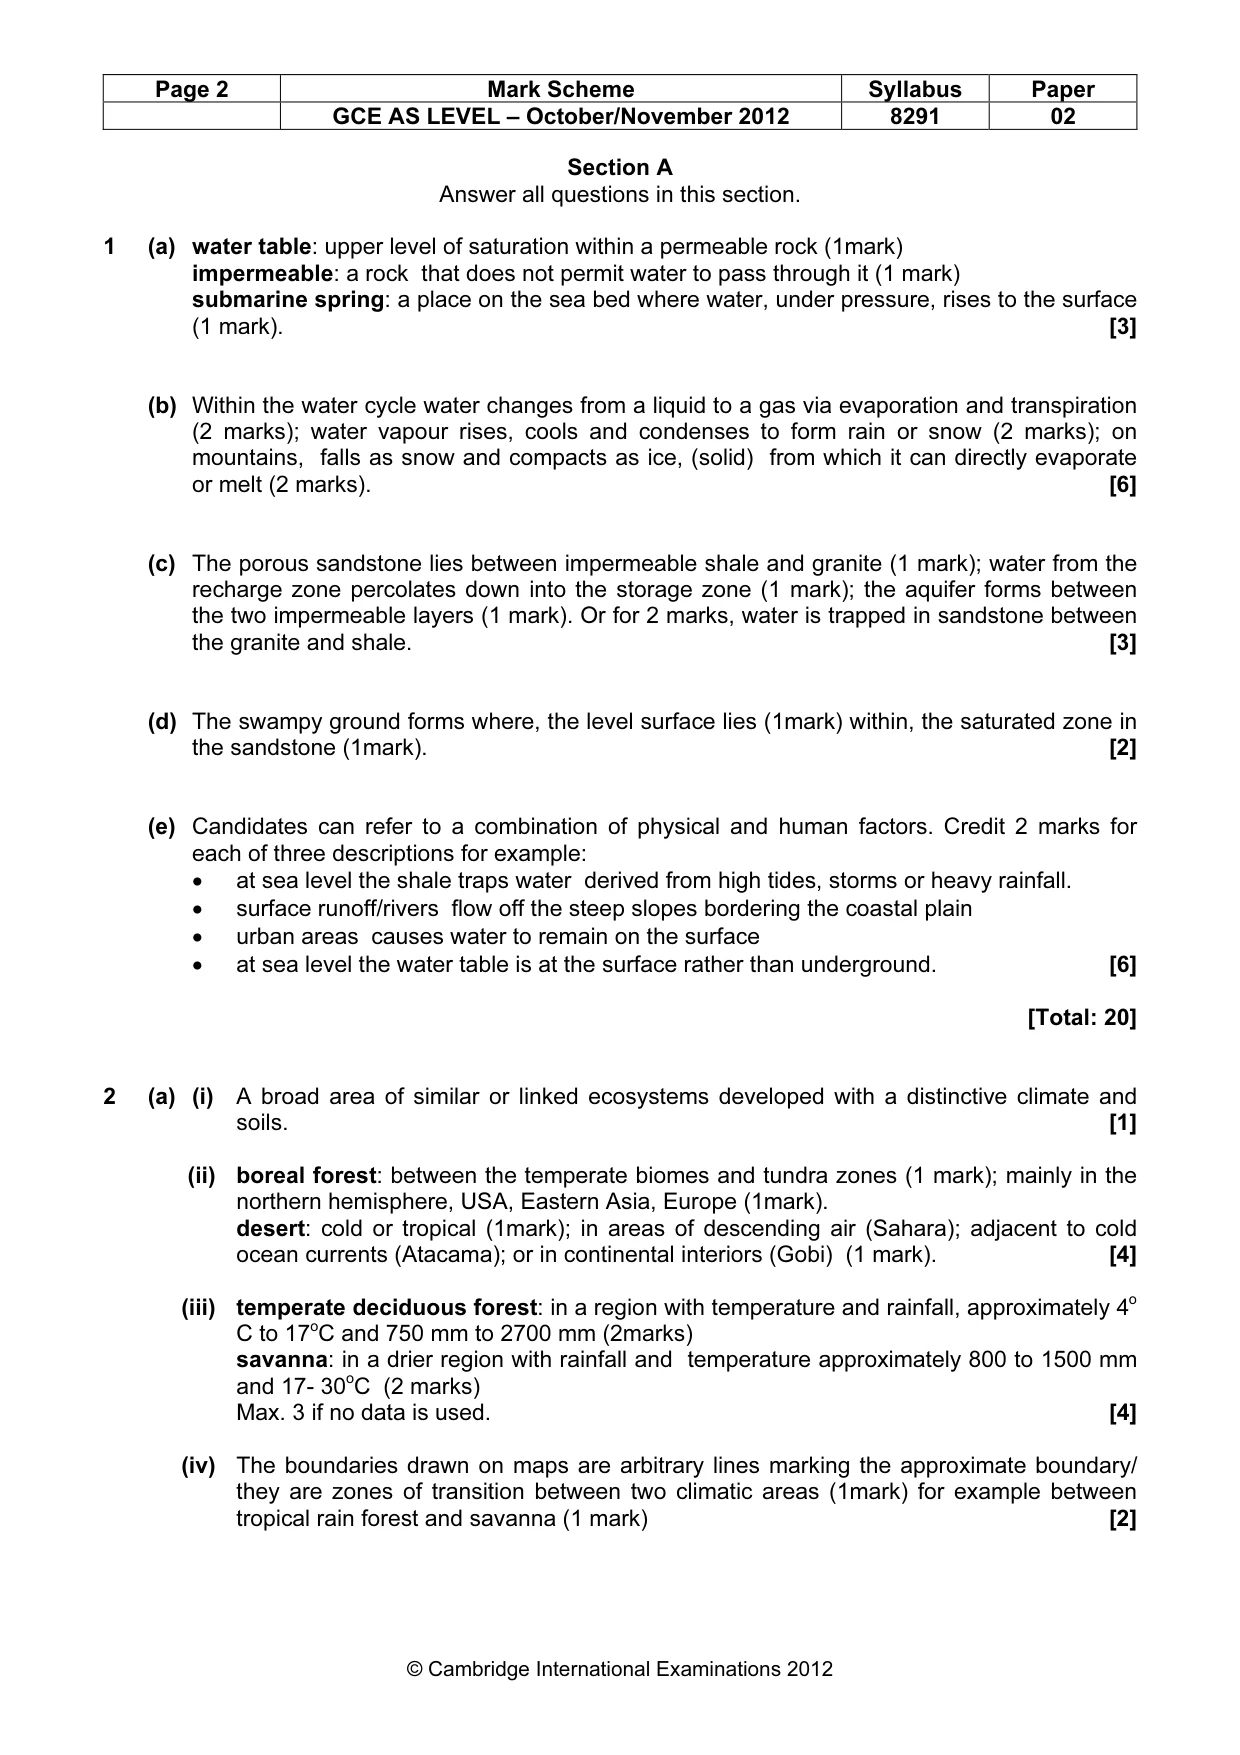
Page 2 Mark Scheme Syllabus Paper GCE AS LEVEL – October/November 2012 8291 02 © Cambridge International Examinations 2012 Section A Answer all questions in this section. 1 (a) water table: upper level of saturation within a permeable rock (1mark) impermeable: a rock that does not permit water to pass through it (1 mark) submarine spring: a place on the sea bed where water, under pressure, rises to the surface (1 mark). [3] (b) Within the water cycle water changes from a liquid to a gas via evaporation and transpiration (2 marks); water vapour rises, cools and condenses to form rain or snow (2 marks); on mountains, falls as snow and compacts as ice, (solid) from which it can directly evaporate or melt (2 marks). [6] (c) The porous sandstone lies between impermeable shale and granite (1 mark); water from the recharge zone percolates down into the storage zone (1 mark); the aquifer forms between the two impermeable layers (1 mark). Or for 2 marks, water is trapped in sandstone between the granite and shale. [3] (d) The swampy ground forms where, the level surface lies (1mark) within, the saturated zone in the sandstone (1mark). [2] (e) Candidates can refer to a combination of physical and human factors. Credit 2 marks for each of three descriptions for example: • at sea level the shale traps water derived from high tides, storms or heavy rainfall. • surface runoff/rivers flow off the steep slopes bordering the coastal plain • urban areas causes water to remain on the surface • at sea level the water table is at the surface rather than underground. [6] [Total: 20] 2 (a) (i) A broad area of similar or linked ecosystems developed with a distinctive climate and soils. [1] (ii) boreal forest: between the temperate biomes and tundra zones (1 mark); mainly in the northern hemisphere, USA, Eastern Asia, Europe (1mark). desert: cold or tropical (1mark); in areas of descending air (Sahara); adjacent to cold ocean currents (Atacama); or in continental interiors (Gobi) (1 mark). [4] (iii) temperate deciduous forest: in a region with temperature and rainfall, approximately 4o C to 17oC and 750 mm to 2700 mm (2marks) savanna: in a drier region with rainfall and temperature approximately 800 to 1500 mm and 17- 30oC (2 marks) Max. 3 if no data is used. [4] (iv) The boundaries drawn on maps are arbitrary lines marking the approximate boundary/ they are zones of transition between two climatic areas (1mark) for example between tropical rain forest and savanna (1 mark) [2]
Mark scheme, page 3
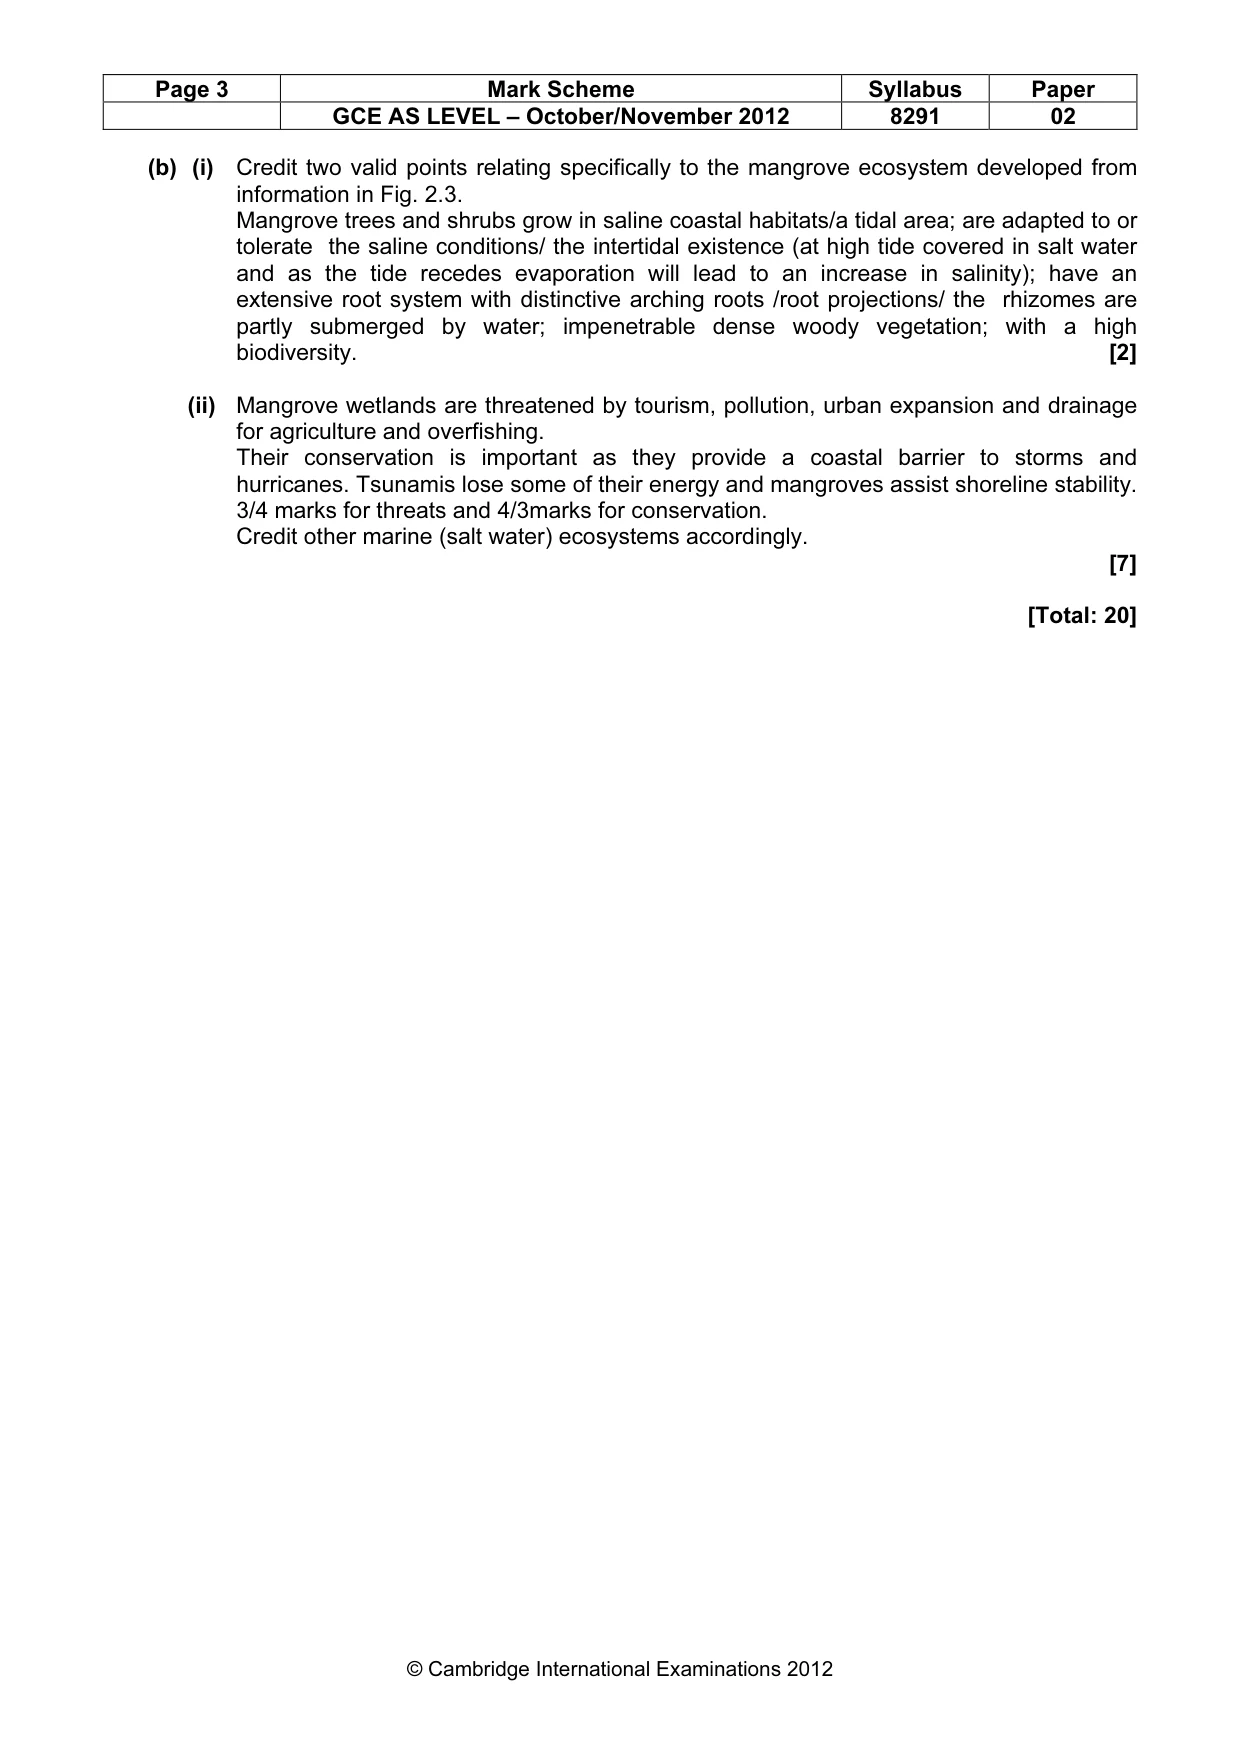
Page 3 Mark Scheme Syllabus Paper GCE AS LEVEL – October/November 2012 8291 02 © Cambridge International Examinations 2012 (b) (i) Credit two valid points relating specifically to the mangrove ecosystem developed from information in Fig. 2.3. Mangrove trees and shrubs grow in saline coastal habitats/a tidal area; are adapted to or tolerate the saline conditions/ the intertidal existence (at high tide covered in salt water and as the tide recedes evaporation will lead to an increase in salinity); have an extensive root system with distinctive arching roots /root projections/ the rhizomes are partly submerged by water; impenetrable dense woody vegetation; with a high biodiversity. [2] (ii) Mangrove wetlands are threatened by tourism, pollution, urban expansion and drainage for agriculture and overfishing. Their conservation is important as they provide a coastal barrier to storms and hurricanes. Tsunamis lose some of their energy and mangroves assist shoreline stability. 3/4 marks for threats and 4/3marks for conservation. Credit other marine (salt water) ecosystems accordingly. [7] [Total: 20]
Mark scheme, page 4
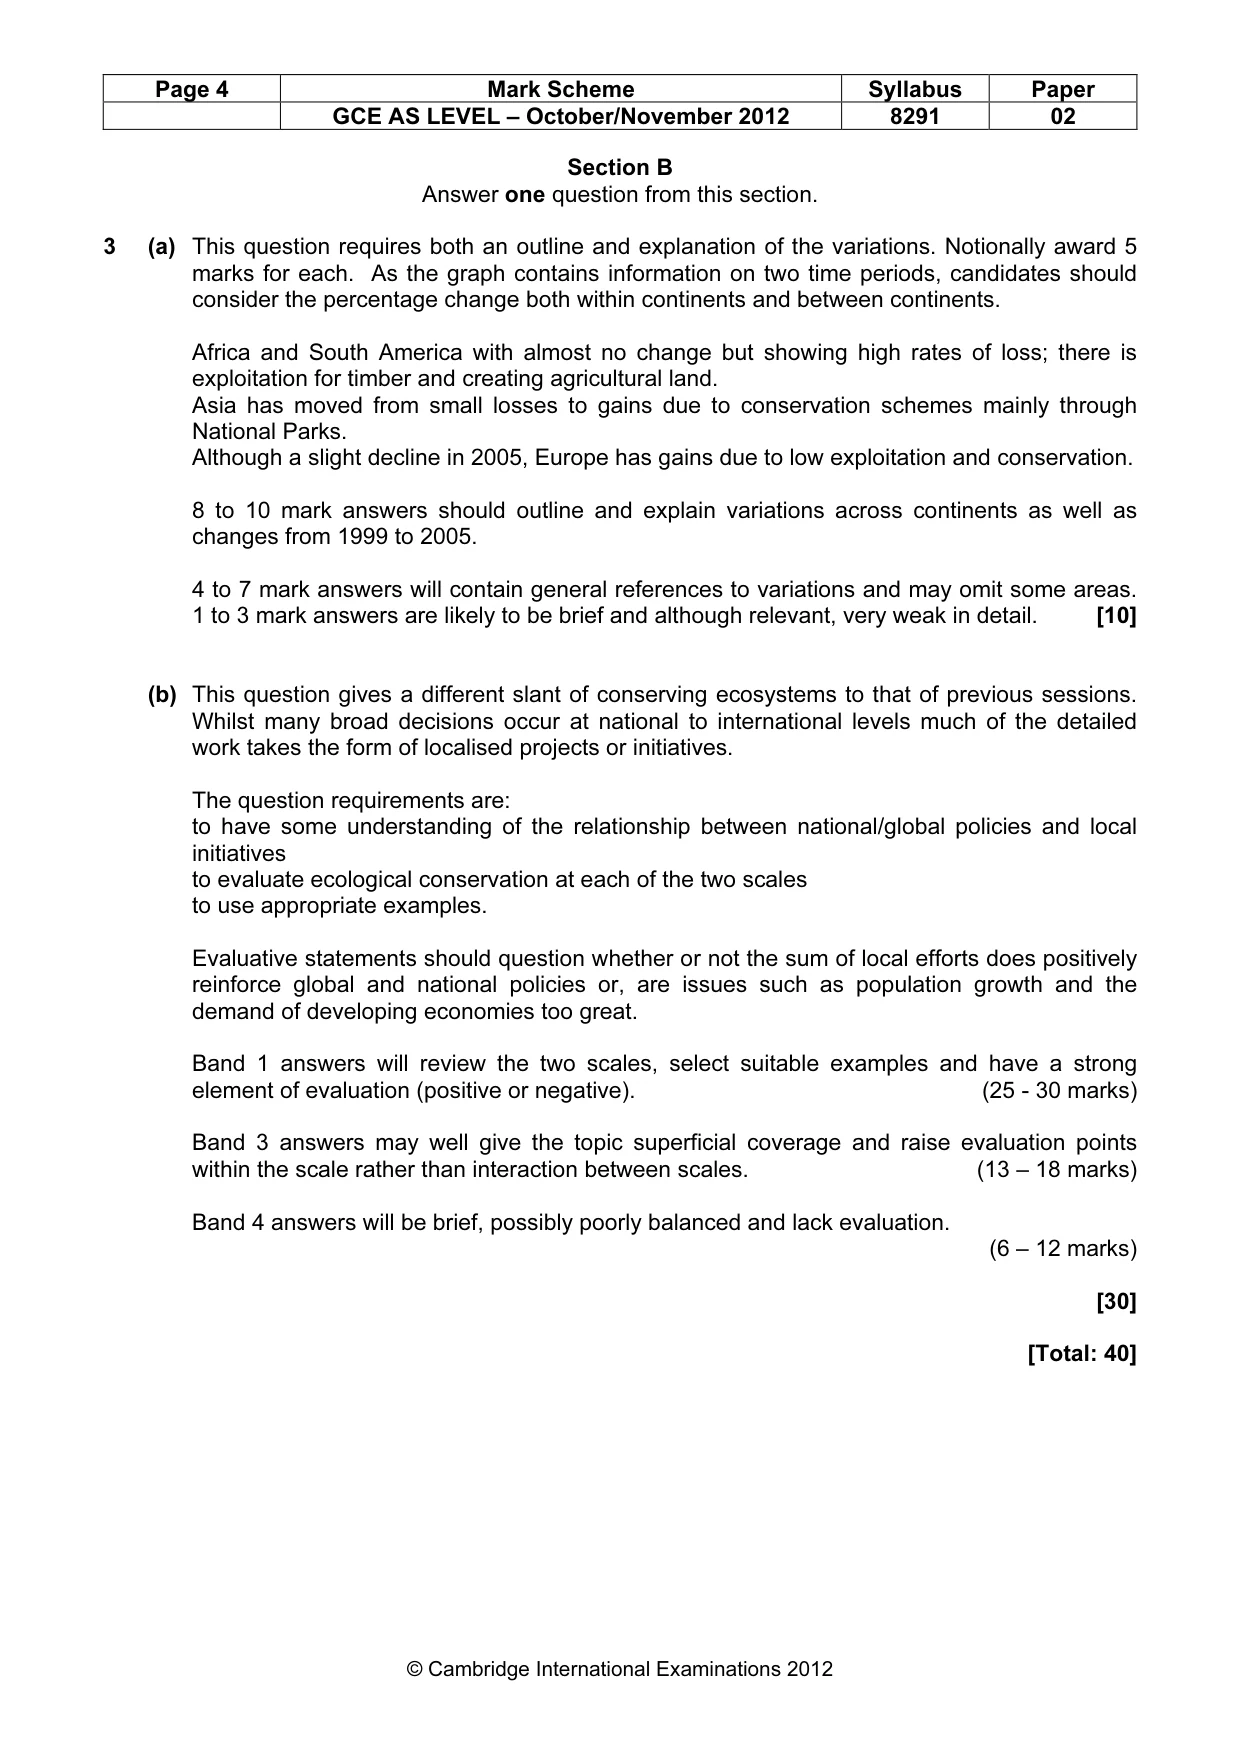
Page 4 Mark Scheme Syllabus Paper GCE AS LEVEL – October/November 2012 8291 02 © Cambridge International Examinations 2012 Section B Answer one question from this section. 3 (a) This question requires both an outline and explanation of the variations. Notionally award 5 marks for each. As the graph contains information on two time periods, candidates should consider the percentage change both within continents and between continents. Africa and South America with almost no change but showing high rates of loss; there is exploitation for timber and creating agricultural land. Asia has moved from small losses to gains due to conservation schemes mainly through National Parks. Although a slight decline in 2005, Europe has gains due to low exploitation and conservation. 8 to 10 mark answers should outline and explain variations across continents as well as changes from 1999 to 2005. 4 to 7 mark answers will contain general references to variations and may omit some areas. 1 to 3 mark answers are likely to be brief and although relevant, very weak in detail. [10] (b) This question gives a different slant of conserving ecosystems to that of previous sessions. Whilst many broad decisions occur at national to international levels much of the detailed work takes the form of localised projects or initiatives. The question requirements are: to have some understanding of the relationship between national/global policies and local initiatives to evaluate ecological conservation at each of the two scales to use appropriate examples. Evaluative statements should question whether or not the sum of local efforts does positively reinforce global and national policies or, are issues such as population growth and the demand of developing economies too great. Band 1 answers will review the two scales, select suitable examples and have a strong element of evaluation (positive or negative). (25 - 30 marks) Band 3 answers may well give the topic superficial coverage and raise evaluation points within the scale rather than interaction between scales. (13 – 18 marks) Band 4 answers will be brief, possibly poorly balanced and lack evaluation. (6 – 12 marks) [30] [Total: 40]
Mark scheme, page 5
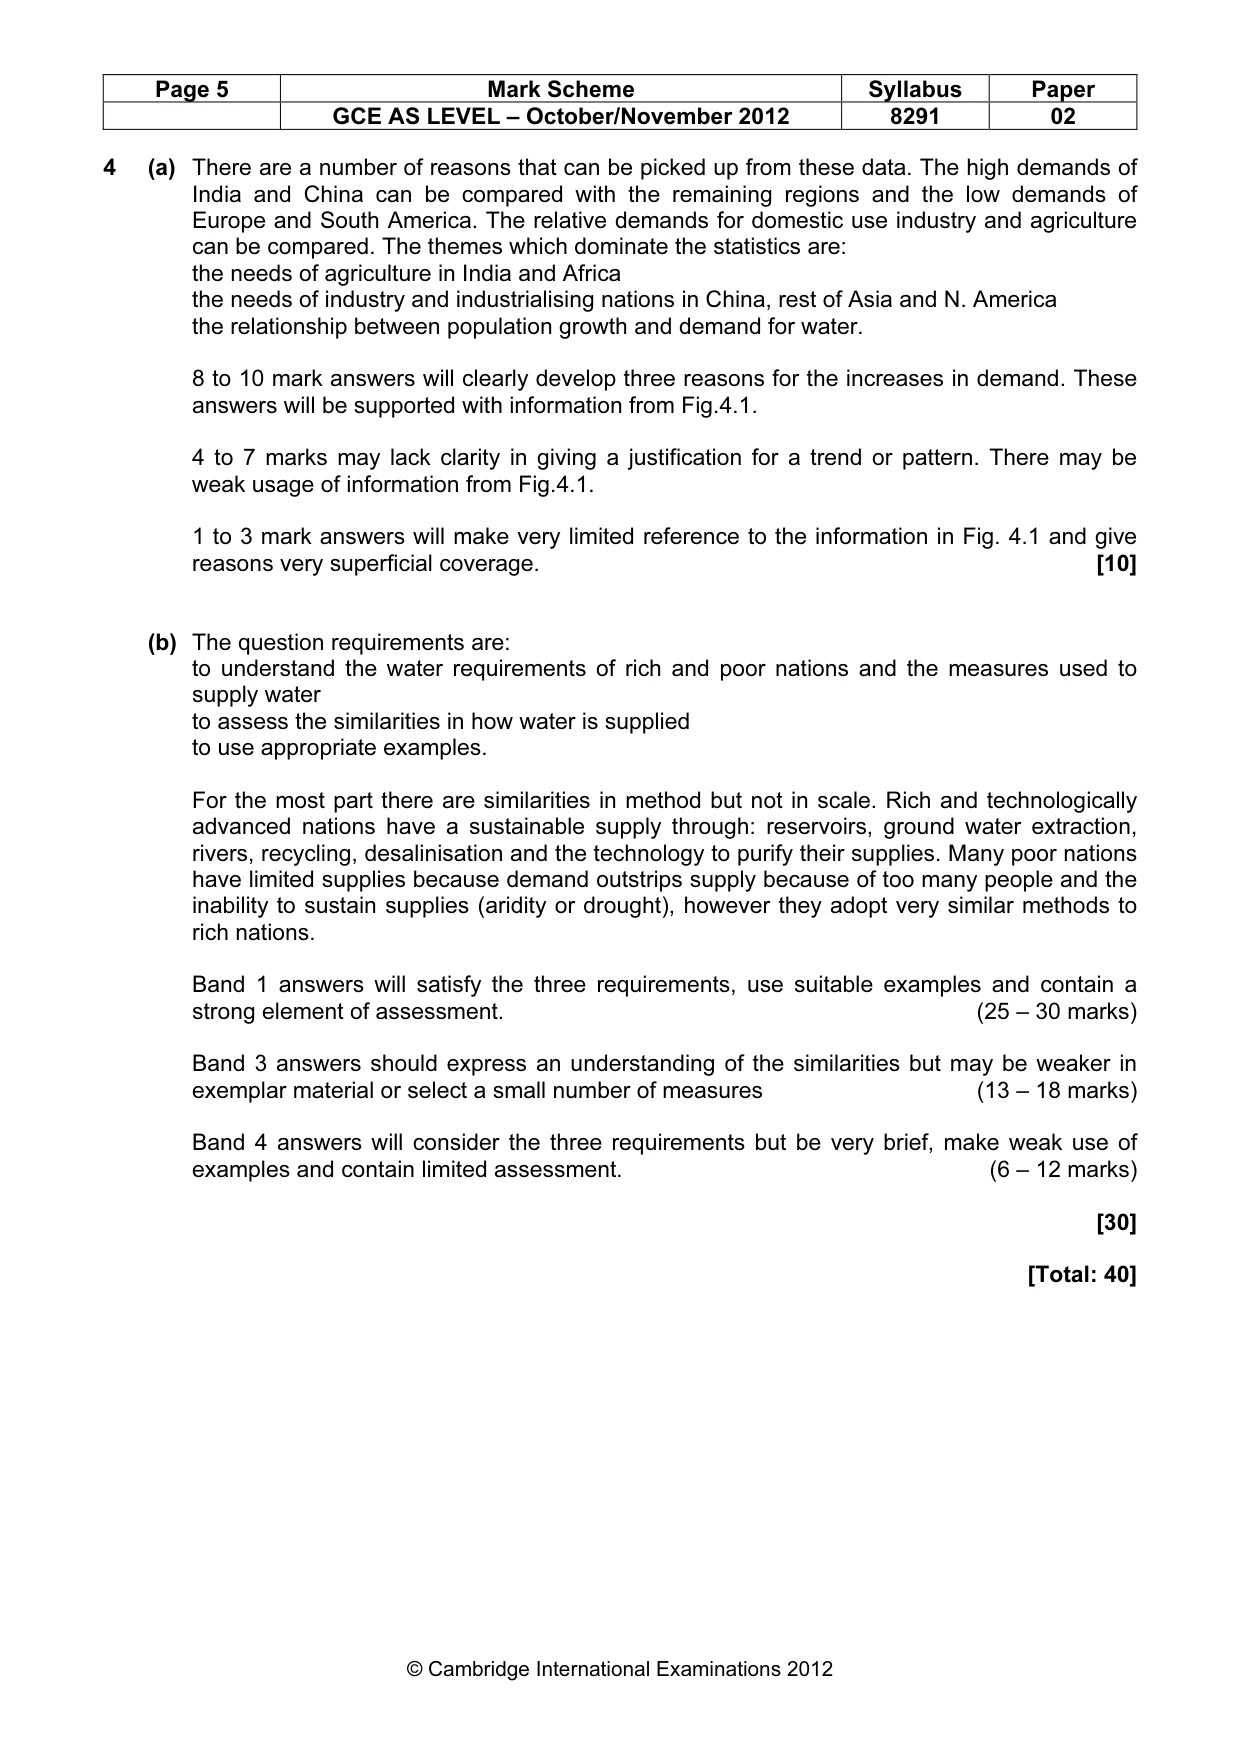
Page 5 Mark Scheme Syllabus Paper GCE AS LEVEL – October/November 2012 8291 02 © Cambridge International Examinations 2012 4 (a) There are a number of reasons that can be picked up from these data. The high demands of India and China can be compared with the remaining regions and the low demands of Europe and South America. The relative demands for domestic use industry and agriculture can be compared. The themes which dominate the statistics are: the needs of agriculture in India and Africa the needs of industry and industrialising nations in China, rest of Asia and N. America the relationship between population growth and demand for water. 8 to 10 mark answers will clearly develop three reasons for the increases in demand. These answers will be supported with information from Fig.4.1. 4 to 7 marks may lack clarity in giving a justification for a trend or pattern. There may be weak usage of information from Fig.4.1. 1 to 3 mark answers will make very limited reference to the information in Fig. 4.1 and give reasons very superficial coverage. [10] (b) The question requirements are: to understand the water requirements of rich and poor nations and the measures used to supply water to assess the similarities in how water is supplied to use appropriate examples. For the most part there are similarities in method but not in scale. Rich and technologically advanced nations have a sustainable supply through: reservoirs, ground water extraction, rivers, recycling, desalinisation and the technology to purify their supplies. Many poor nations have limited supplies because demand outstrips supply because of too many people and the inability to sustain supplies (aridity or drought), however they adopt very similar methods to rich nations. Band 1 answers will satisfy the three requirements, use suitable examples and contain a strong element of assessment. (25 – 30 marks) Band 3 answers should express an understanding of the similarities but may be weaker in exemplar material or select a small number of measures (13 – 18 marks) Band 4 answers will consider the three requirements but be very brief, make weak use of examples and contain limited assessment. (6 – 12 marks) [30] [Total: 40]
Mark scheme, page 6
Page 6 Mark Scheme Syllabus Paper GCE AS LEVEL – October/November 2012 8291 02 © Cambridge International Examinations 2012 5 (a) The photographs show different aspect of waste dumping, waste debris being left on the banks of a river and effluent entering the river though pipes or sewers. Physical quality: an increase in sediment, waste debris and increased suspended solids. Biological quality: increase in bacteria, increased BOD, loss of invertebrates and fish. Chemical quality: chemical pollution, increased alkalinity, a decrease in dissolved oxygen. 8 to 10 mark answers should consider both photographs and express a clear knowledge and understanding of the effect on the three areas of river quality. 4 to 7 mark answers may lack balance with one or two areas being better developed. Weaker answers will lack detail. 1 to 3 mark answers may be very weak on all three or only give brief consideration to one or two areas. [10] (b) The question requirements are to select their own examples of river pollution i.e. industrial, agricultural or domestic to explain the measures used to reduce pollution to make an evaluation of the measures, which can be either positive or negative or both. Measures can include cleaning rivers and legislation and for: Domestic sources: sewage disposal and treatment, waste collection Industrial sources: cleaning before disposal, chemical treatment Agricultural sources: organic farming, reductions in the use of pesticides and chemical fertilisers. Band 1 answers will make good use of exemplar material, express a good understanding of how river pollution is reduced using a range of methods and make positive and/or negative evaluations. (25 -30 marks) Band 3 answers will lack clarity or select a small number of ways in which river pollution is reduced. At this level evaluations will be brief and although present, superficial. (13 – 18marks) Band 4 answers will be brief, make weak use of examples and contain limited evaluation. (6 – 12 marks) [30] [Total: 40]
Mark scheme, page 7
Page 7 Mark Scheme Syllabus Paper GCE AS LEVEL – October/November 2012 8291 02 © Cambridge International Examinations 2012 Generic Mark Scheme This aims to provide a scheme for marking 30 mark answers in Section B. The marks are grouped into bands from which it should be possible to locate a mark. The assessment objectives outlined are developed out of the broad objectives for the examination and guideline for locating marks for essays. Criterion A. demonstrates relevant knowledge and understanding applied to a range of issues and problems. Criterion B. communicates clearly in a concise, logical and relevant way. Criterion C. marshal evidence, draw conclusions and make evaluations. Balance of marks for 30 mark questions; Criterion A = maximum of 15 Criterion B = maximum of 5 Criterion C = maximum of 10 Band Level Descriptors Marks Band 1 The candidate demonstrates the following abilities where appropriate to: 25–30 A • select and use a very good range of accurate and appropriate knowledge; • integrate knowledge from a wide range of areas; • show a good understanding of the concepts involved; • make good use of knowledge derived from personal experience and study; B • select and use a form and style of writing appropriate to purpose and complex subject matter with facility; • communicate complex ideas clearly and accurately, in a concise, logical and relevant way; C • analyse issues and problems well and evaluate them appropriately; • develop complex reasoned arguments and draw sound conclusions on the evidence; Band 2 The candidate demonstrates the following abilities where appropriate to: 19–24 A • select and use a good range of accurate and appropriate knowledge; • integrate knowledge from a wide range of areas; • show an understanding of the concepts involved; • demonstrate a range of awareness of personally derived and studied knowledge; B • select and use a form and style of writing appropriate to purpose and complex subject matter; • communicate complex ideas clearly and accurately, in a concise, logical and relevant way; C • analyse issues and problems and evaluate them competently; • develop complex reasoned arguments and draw conclusions on the
Mark scheme, page 8
Page 8 Mark Scheme Syllabus Paper GCE AS LEVEL – October/November 2012 8291 02 © Cambridge International Examinations 2012 evidence; Band 3 The candidate demonstrates the following abilities where appropriate to: 13–18 A • select and use some accurate and relevant knowledge. integrate knowledge from a limited range of areas; • show an adequate understanding of the concepts involved; • demonstrate a limited range of awareness of personally derived and studied knowledge; B • select and use a form and style of writing appropriate to purpose and subject matter; • communicate the ideas clearly and in a logical way C • undertake some analysis of issues and problems and make a superficial evaluation; • develop arguments and draw conclusions; Band 4 The candidate demonstrates the following abilities where appropriate to: 6-12 A • select a limited range of accurate and relevant knowledge; • integrate knowledge from a very limited range of areas; • show a modest understanding of the concepts involved; B • select and use a limited style of writing, appropriate to purpose and subject matter; • communicate ideas with limited clarity; C • demonstrate limited analysis of issues and problem with limited evaluation; • develop limited arguments and draw limited conclusions; Band 5 The candidate demonstrates the following abilities where appropriate to: 1–5 A • select and use some relevant knowledge; • integrate knowledge from a very limited area; • show a restricted understanding of the concepts involved; B When producing written communication: • select and use a very limited style of writing appropriate to purpose and subject matter • communicate with limited clarity; C • undertake a very limited analysis of issues, problems and evaluation; • recognise some arguments and conclusions
What you needed in this session
Cambridge’s own grade thresholds for 2012 Oct/Nov, Paper 2 · Variant 1. A higher threshold means an easier paper — the bar moves with how the cohort did.