Cambridge A Level Environmental Management (AS only) 8291 — 2012 Oct/Nov Paper 1 · Variant 1
8291/11/O/N/12 · 80 marks · ≈90 min
The question paper and its mark scheme, free to read here and free to download. This is Cambridge’s own paper, exactly as it was sat.
Question paper12 pages

Mark scheme10 pages
Answers below. Sit the paper first if you are practising.
Paper as text
Question paper, page 1
This document consists of 11 printed pages and 1 blank page. DC (CW/SW) 67093/8 R © UCLES 2012 [Turn over UNIVERSITY OF CAMBRIDGE INTERNATIONAL EXAMINATIONS General Certificate of Education Advanced Subsidiary Level * 6 5 7 9 1 2 3 4 0 9 * ENVIRONMENTAL MANAGEMENT 8291/01 Paper 1 Lithosphere and Atmosphere October/November 2012 1 hour 30 minutes Additional Materials: Answer Booklet/Paper READ THESE INSTRUCTIONS FIRST Write your Centre number, candidate number and name on all the work you hand in. Write in dark blue or black pen. You may use a soft pencil for any diagrams, graphs, tables or rough working. Do not use staples, paper clips, highlighters, glue or correction fluid. DO NOT WRITE IN ANY BARCODES. Section A Answer all questions. Write your answers in the spaces provided on the question paper. Section B Answer one question from this section. Answer the question on the separate answer paper provided. At the end of the examination, 1. fasten all separate answer paper securely to the question paper; 2. enter the question number from Section B in the grid opposite. For Examiner’s Use Section A 1 2 Section B Total
Question paper, page 2
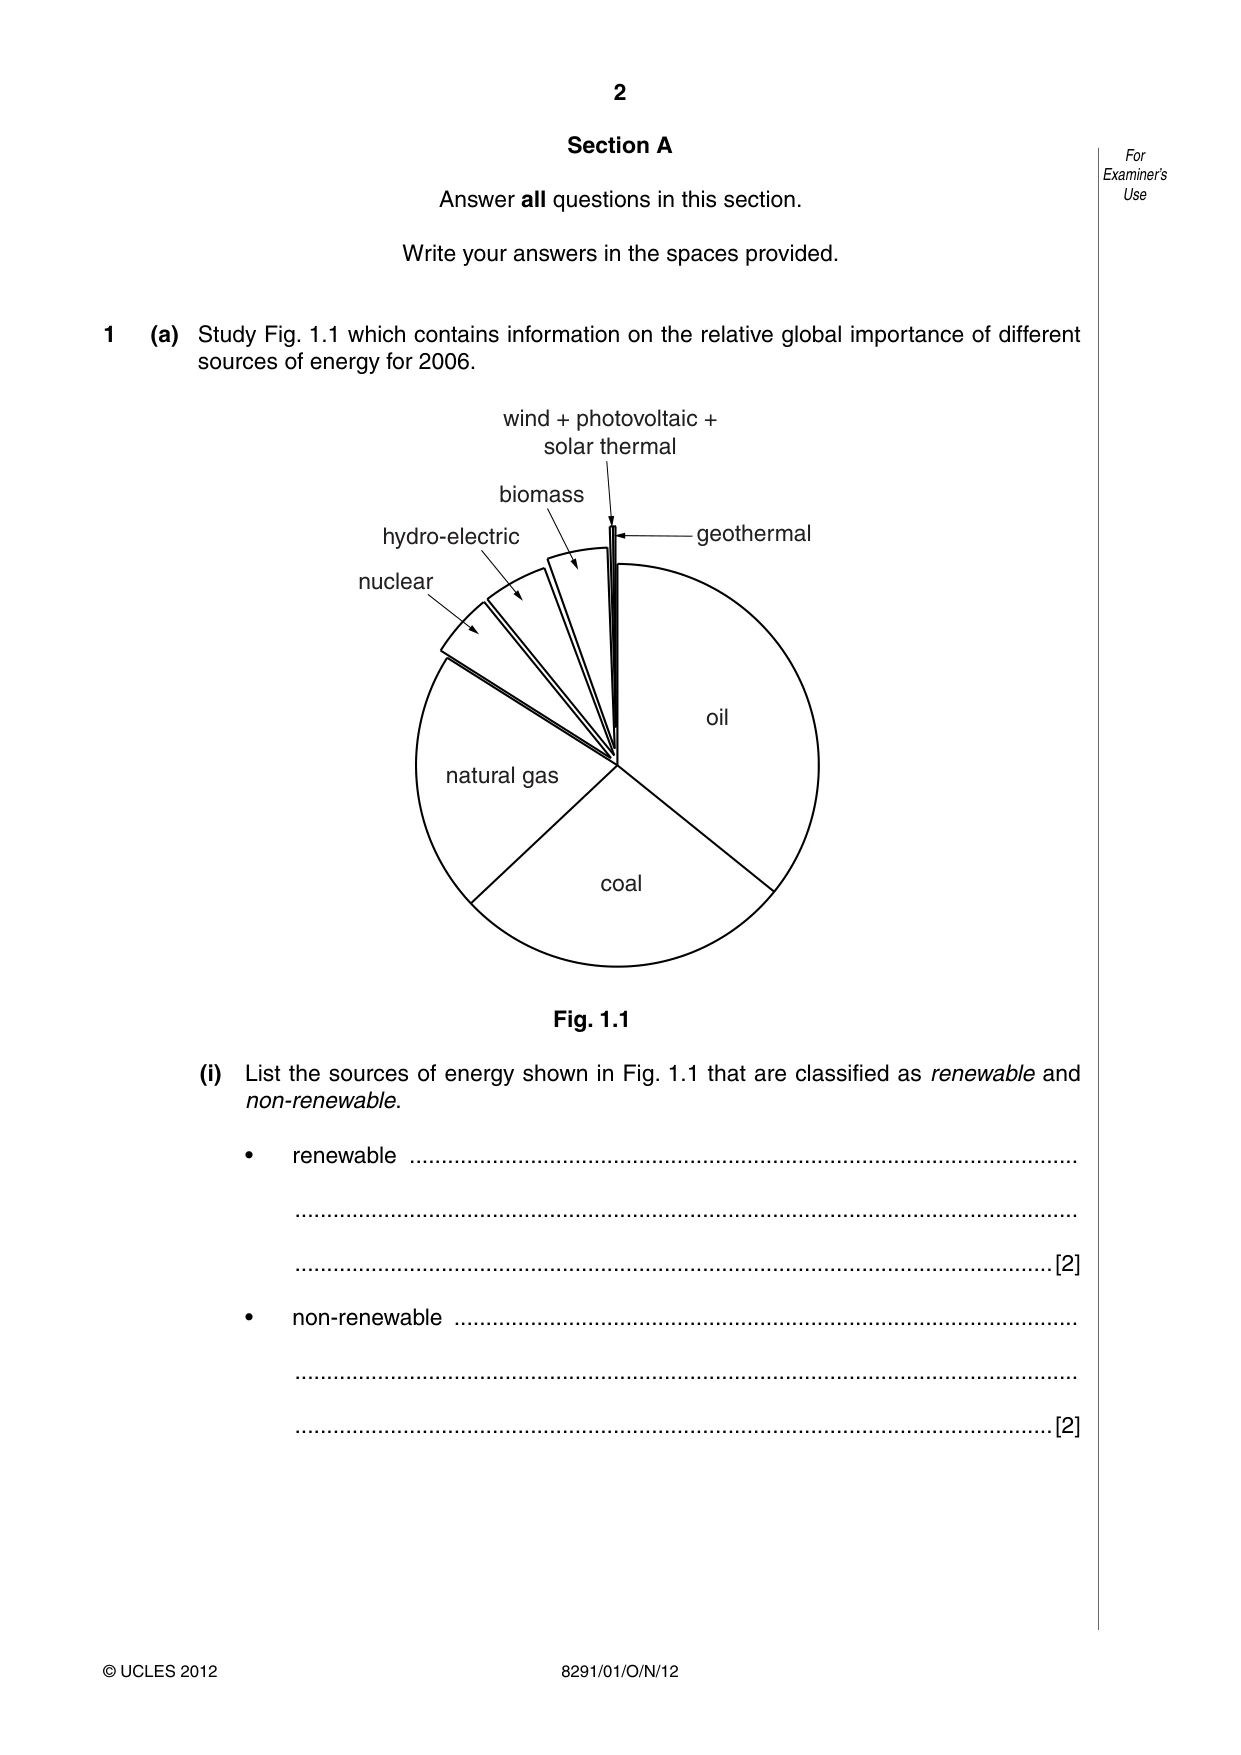
2 8291/01/O/N/12 © UCLES 2012 For Examiner’s Use Section A Answer all questions in this section. Write your answers in the spaces provided. 1 (a) Study Fig. 1.1 which contains information on the relative global importance of different sources of energy for 2006. nuclear hydro-electric biomass geothermal wind + photovoltaic + solar thermal oil coal natural gas Fig. 1.1 (i) List the sources of energy shown in Fig. 1.1 that are classified as renewable and non-renewable. • renewable … … …[2] • non-renewable … … …[2]
Question paper, page 3
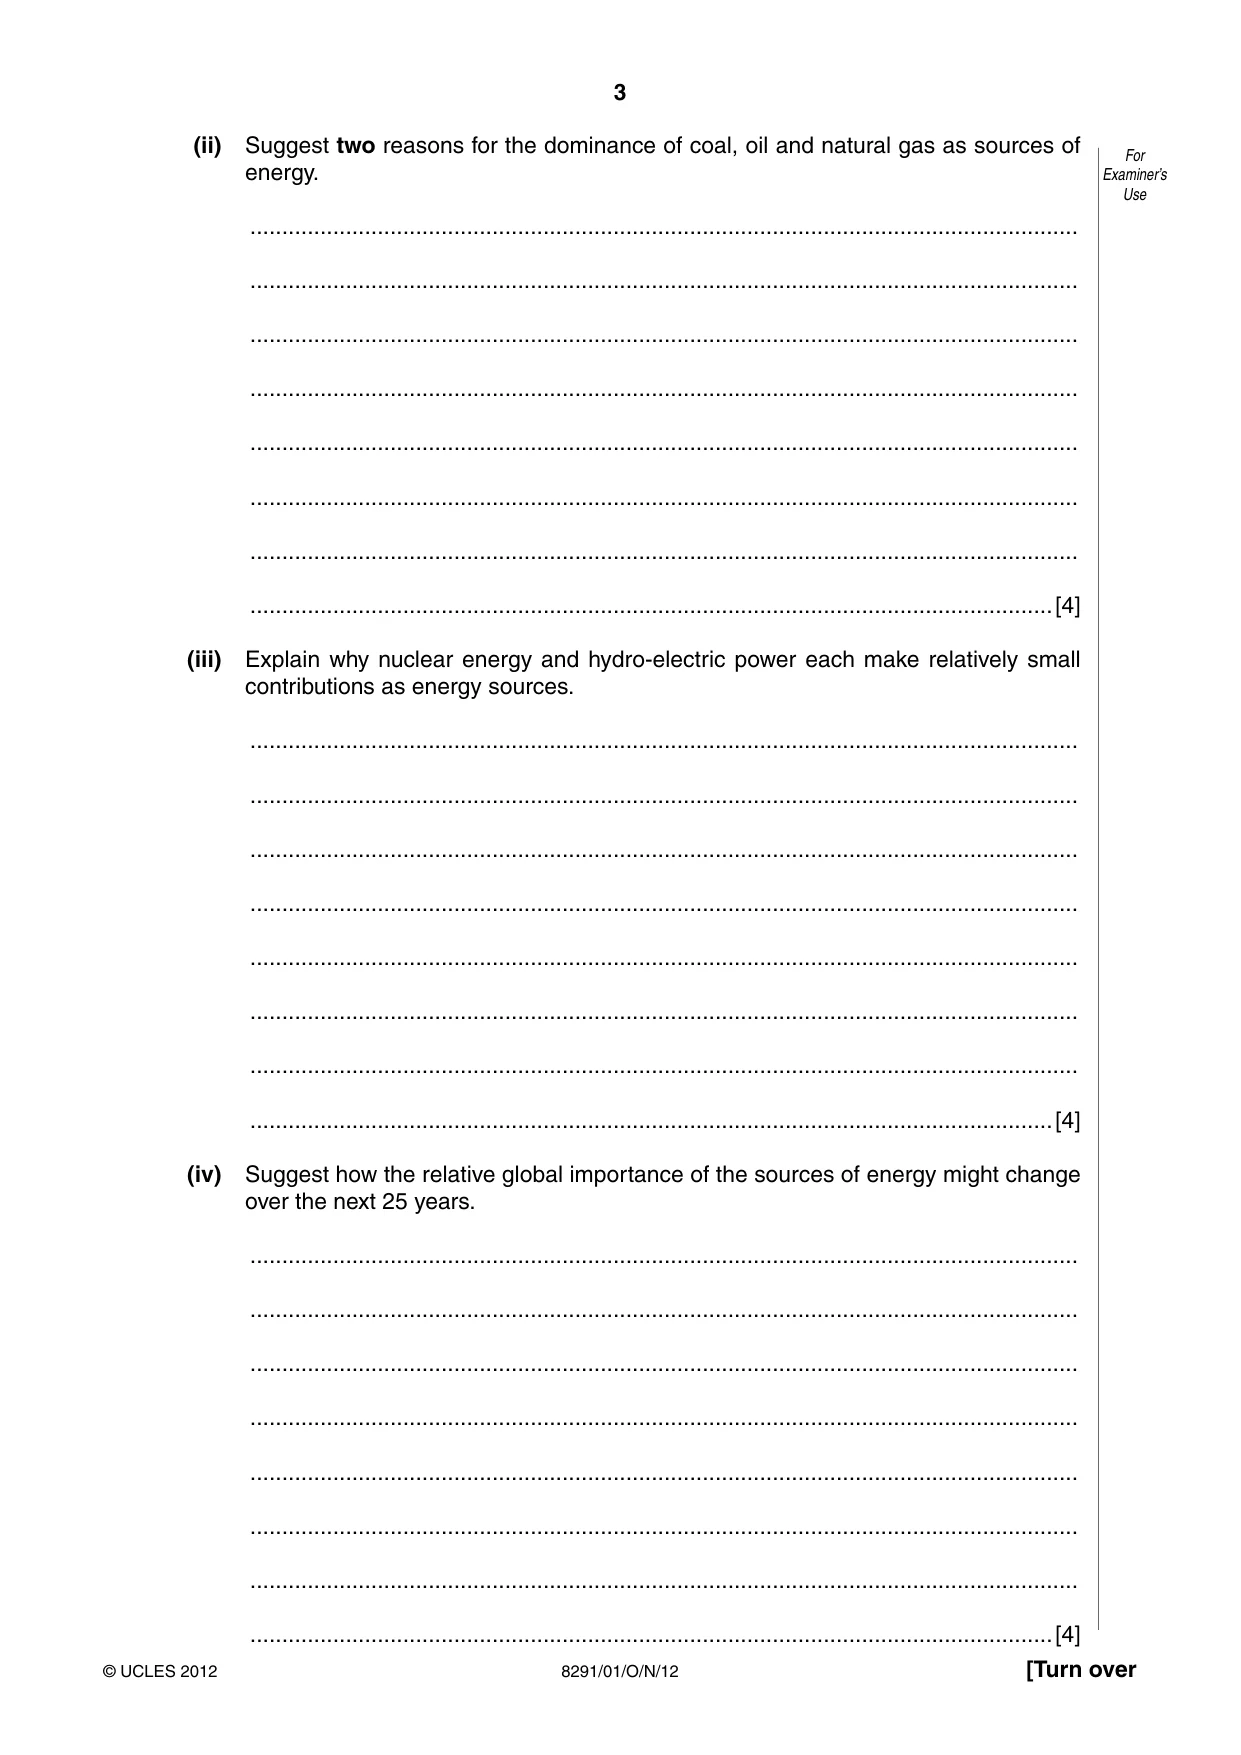
3 8291/01/O/N/12 © UCLES 2012 [Turn over For Examiner’s Use (ii) Suggest two reasons for the dominance of coal, oil and natural gas as sources of energy. … … … … … … … …[4] (iii) Explain why nuclear energy and hydro-electric power each make relatively small contributions as energy sources. … … … … … … … …[4] (iv) Suggest how the relative global importance of the sources of energy might change over the next 25 years. … … … … … … … …[4]
Question paper, page 4
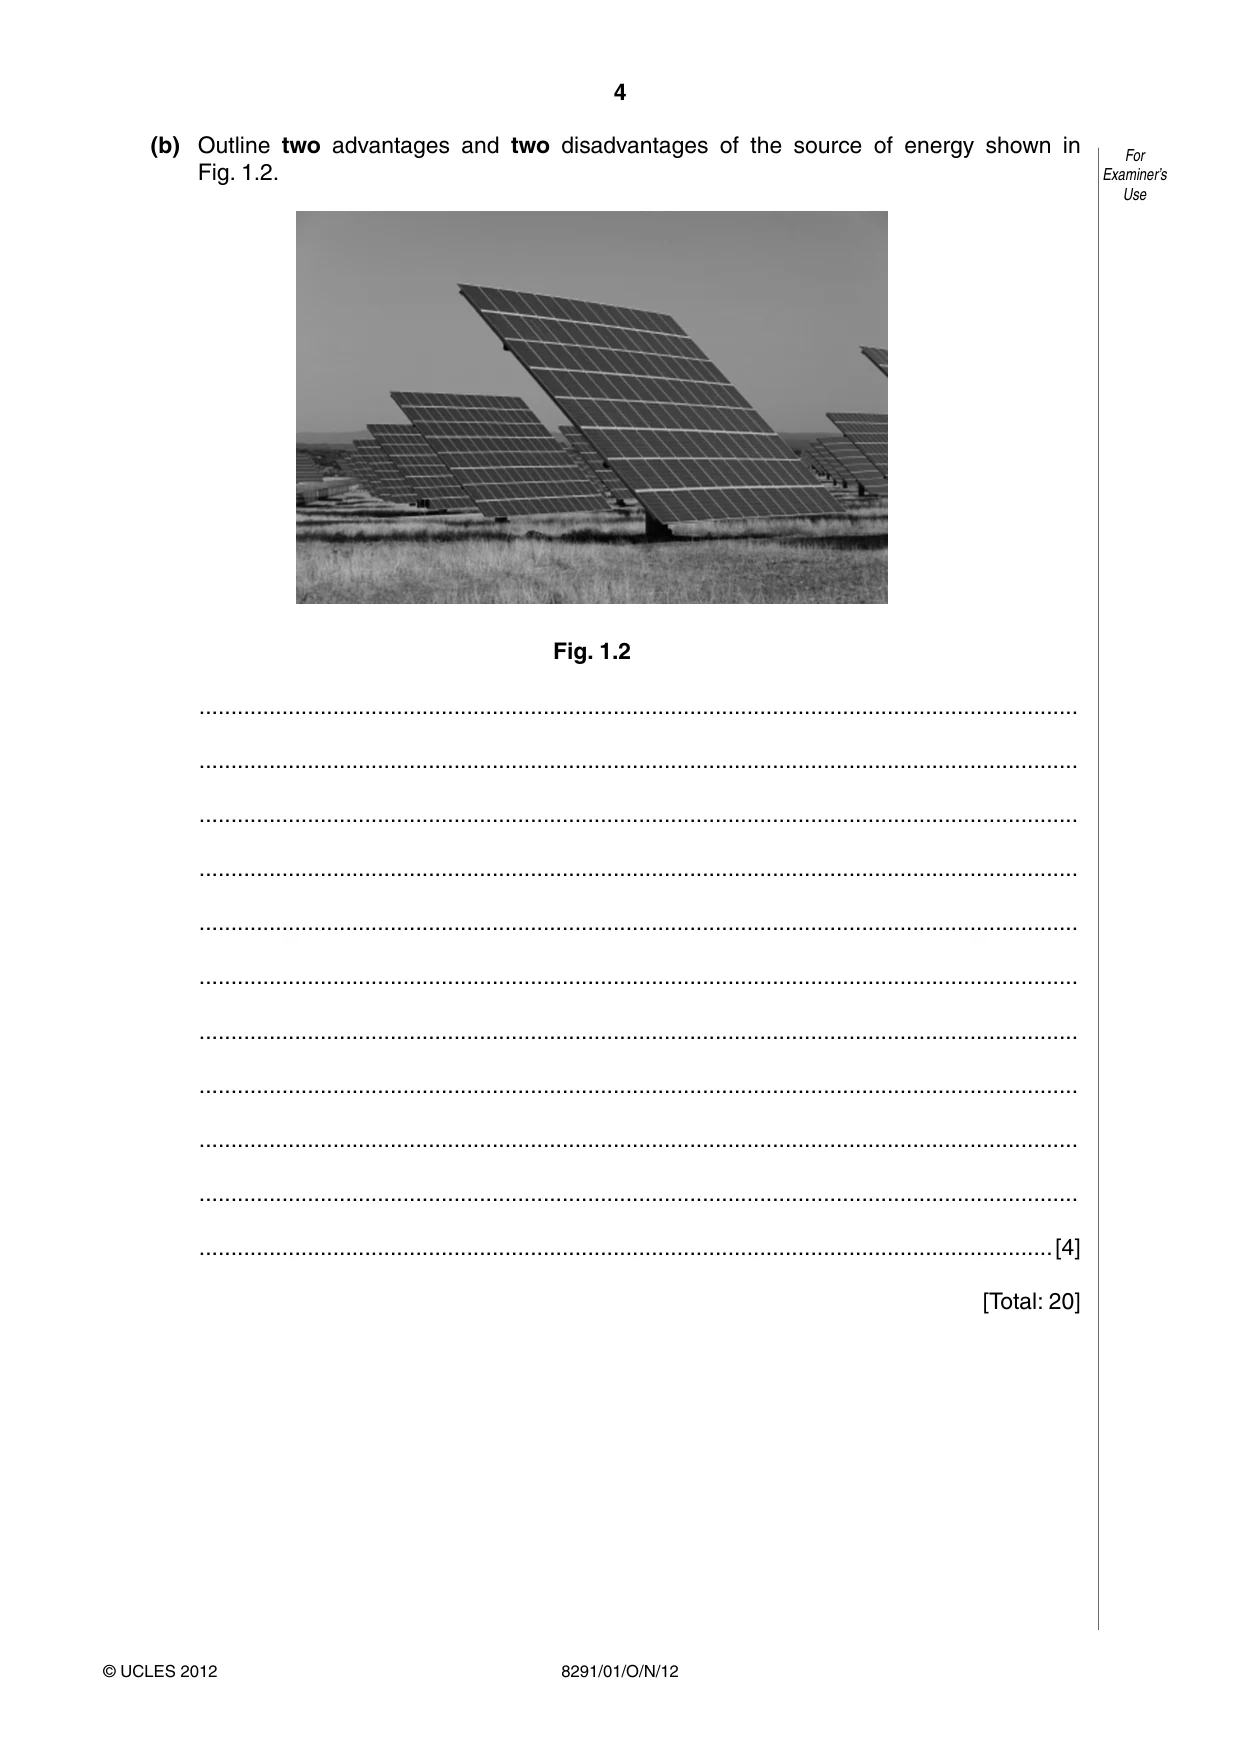
4 8291/01/O/N/12 © UCLES 2012 For Examiner’s Use (b) Outline two advantages and two disadvantages of the source of energy shown in Fig. 1.2. Fig. 1.2 … … … … … … … … … … …[4] [Total: 20]
Question paper, page 5
5 8291/01/O/N/12 © UCLES 2012 [Turn over BLANK PAGE
Question paper, page 6
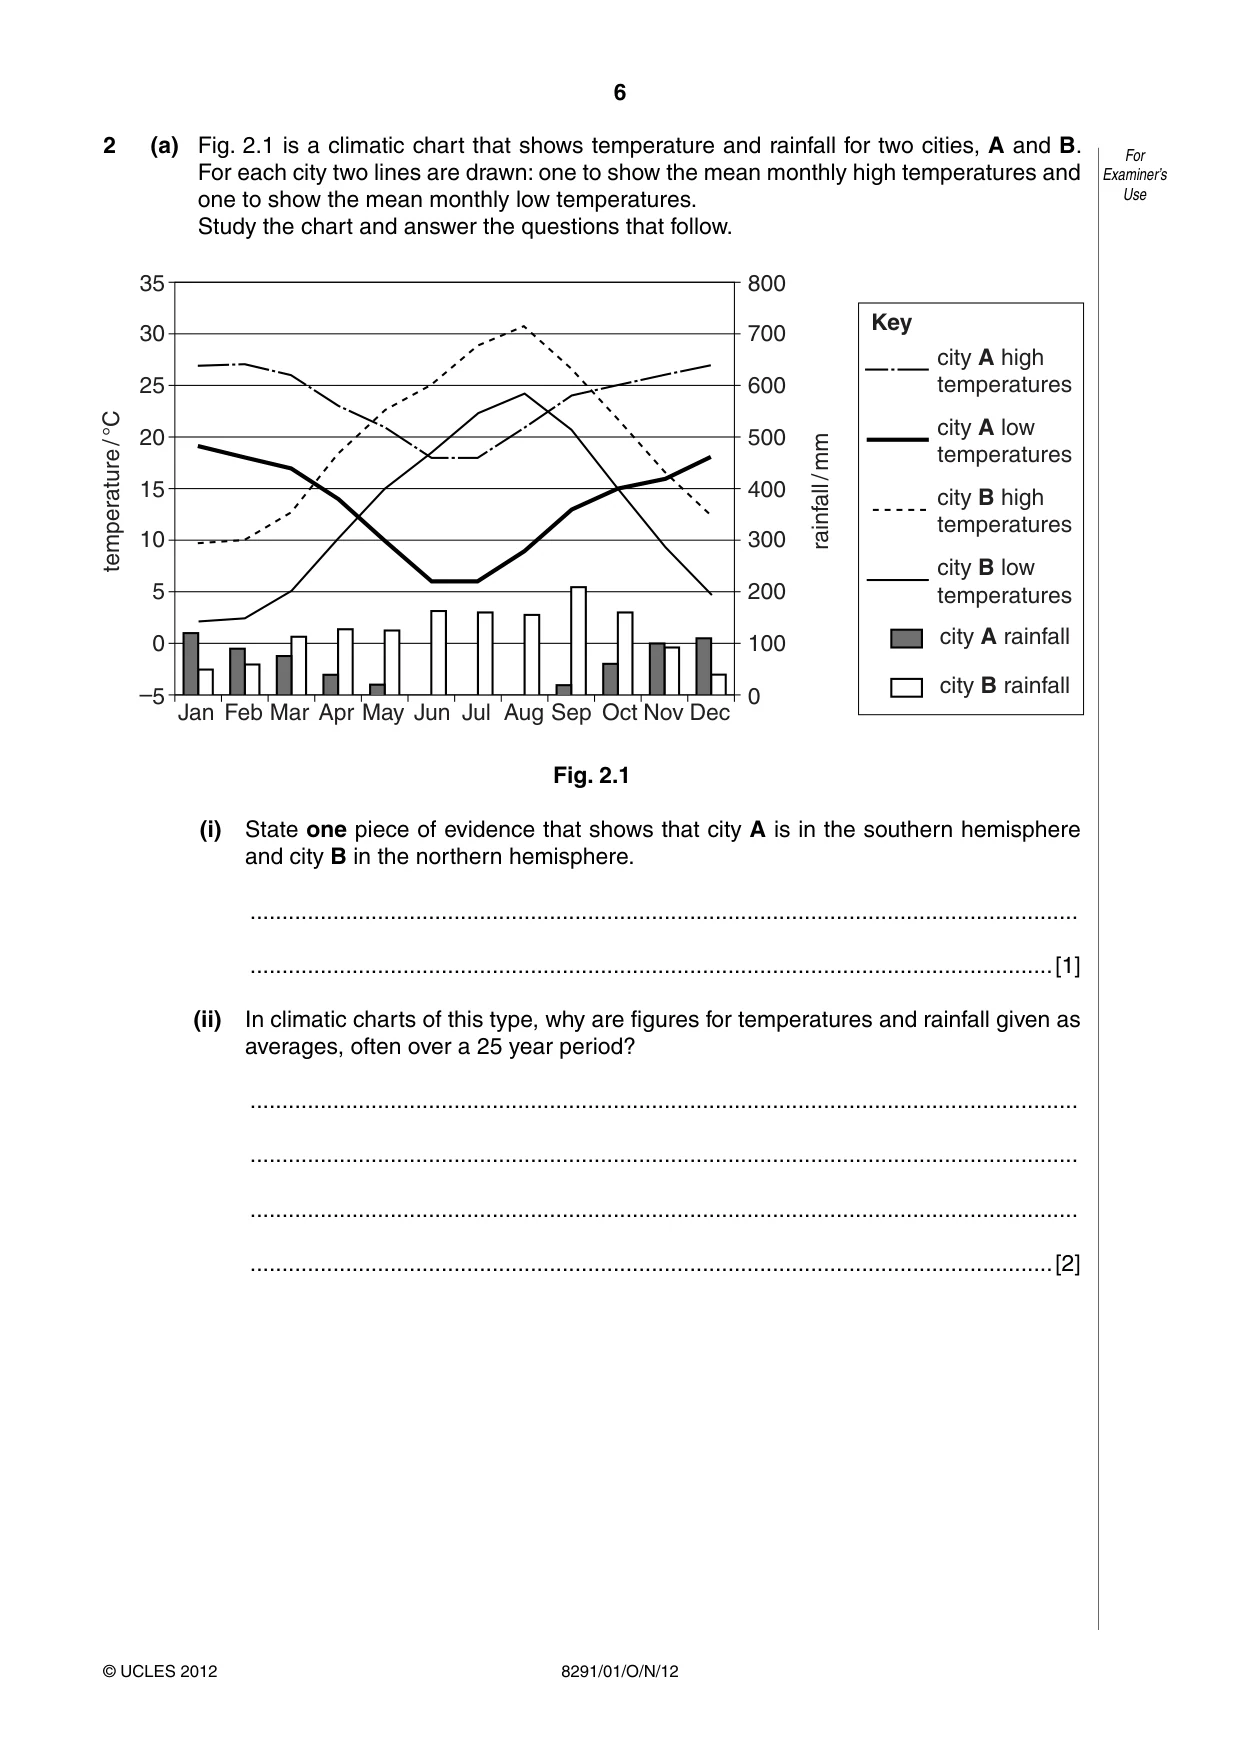
6 8291/01/O/N/12 © UCLES 2012 For Examiner’s Use 2 (a) Fig. 2.1 is a climatic chart that shows temperature and rainfall for two cities, A and B. For each city two lines are drawn: one to show the mean monthly high temperatures and one to show the mean monthly low temperatures. Study the chart and answer the questions that follow. Jan Feb Mar Apr May Jun Jul Aug Sep Oct Nov Dec –5 0 5 10 15 20 25 temperature / °C rainfall / mm 35 30 0 100 200 300 400 500 600 800 700 city A rainfall Key city B rainfall city A high temperatures city A low temperatures city B high temperatures city B low temperatures Fig. 2.1 (i) State one piece of evidence that shows that city A is in the southern hemisphere and city B in the northern hemisphere. … …[1] (ii) In climatic charts of this type, why are figures for temperatures and rainfall given as averages, often over a 25 year period? … … … …[2]
Question paper, page 7
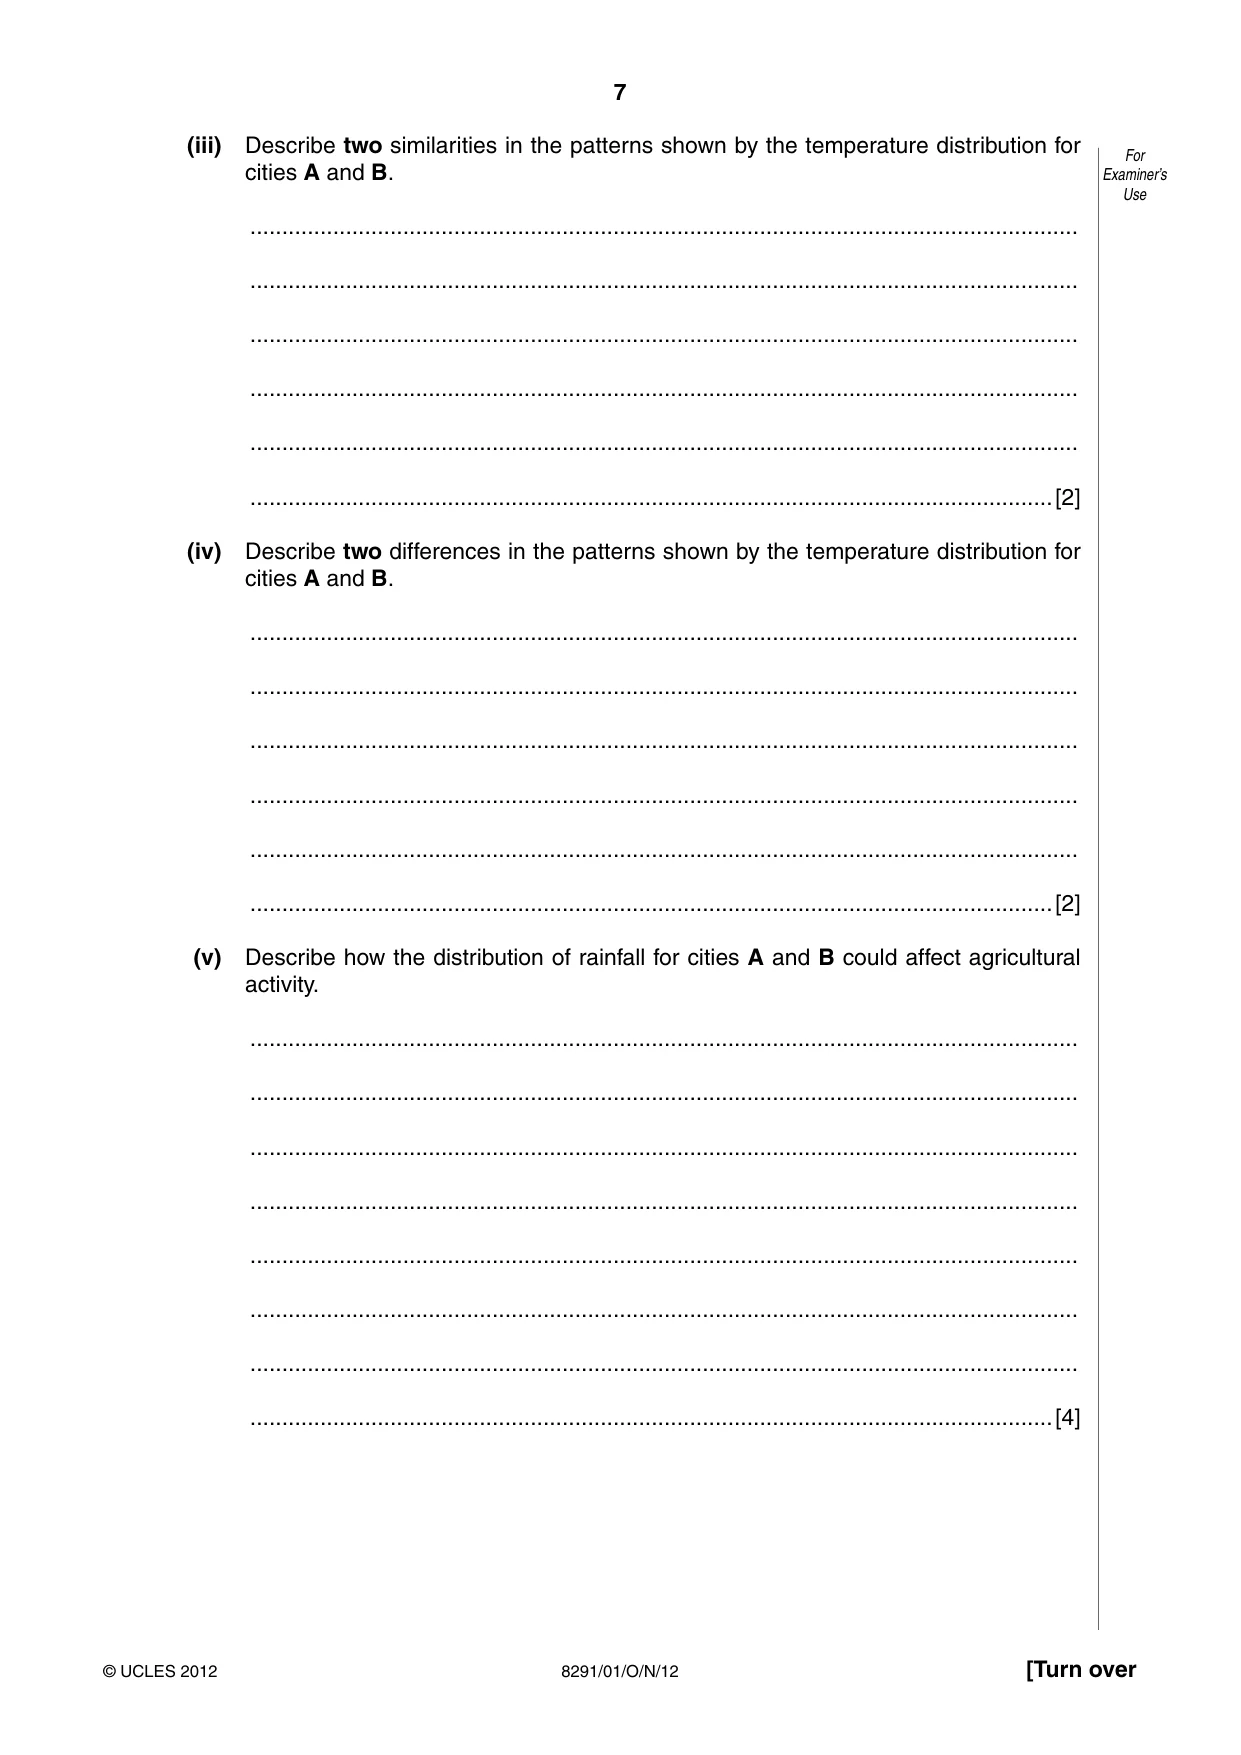
7 8291/01/O/N/12 © UCLES 2012 [Turn over For Examiner’s Use (iii) Describe two similarities in the patterns shown by the temperature distribution for cities A and B. … … … … … …[2] (iv) Describe two differences in the patterns shown by the temperature distribution for cities A and B. … … … … … …[2] (v) Describe how the distribution of rainfall for cities A and B could affect agricultural activity. … … … … … … … …[4]
Question paper, page 8
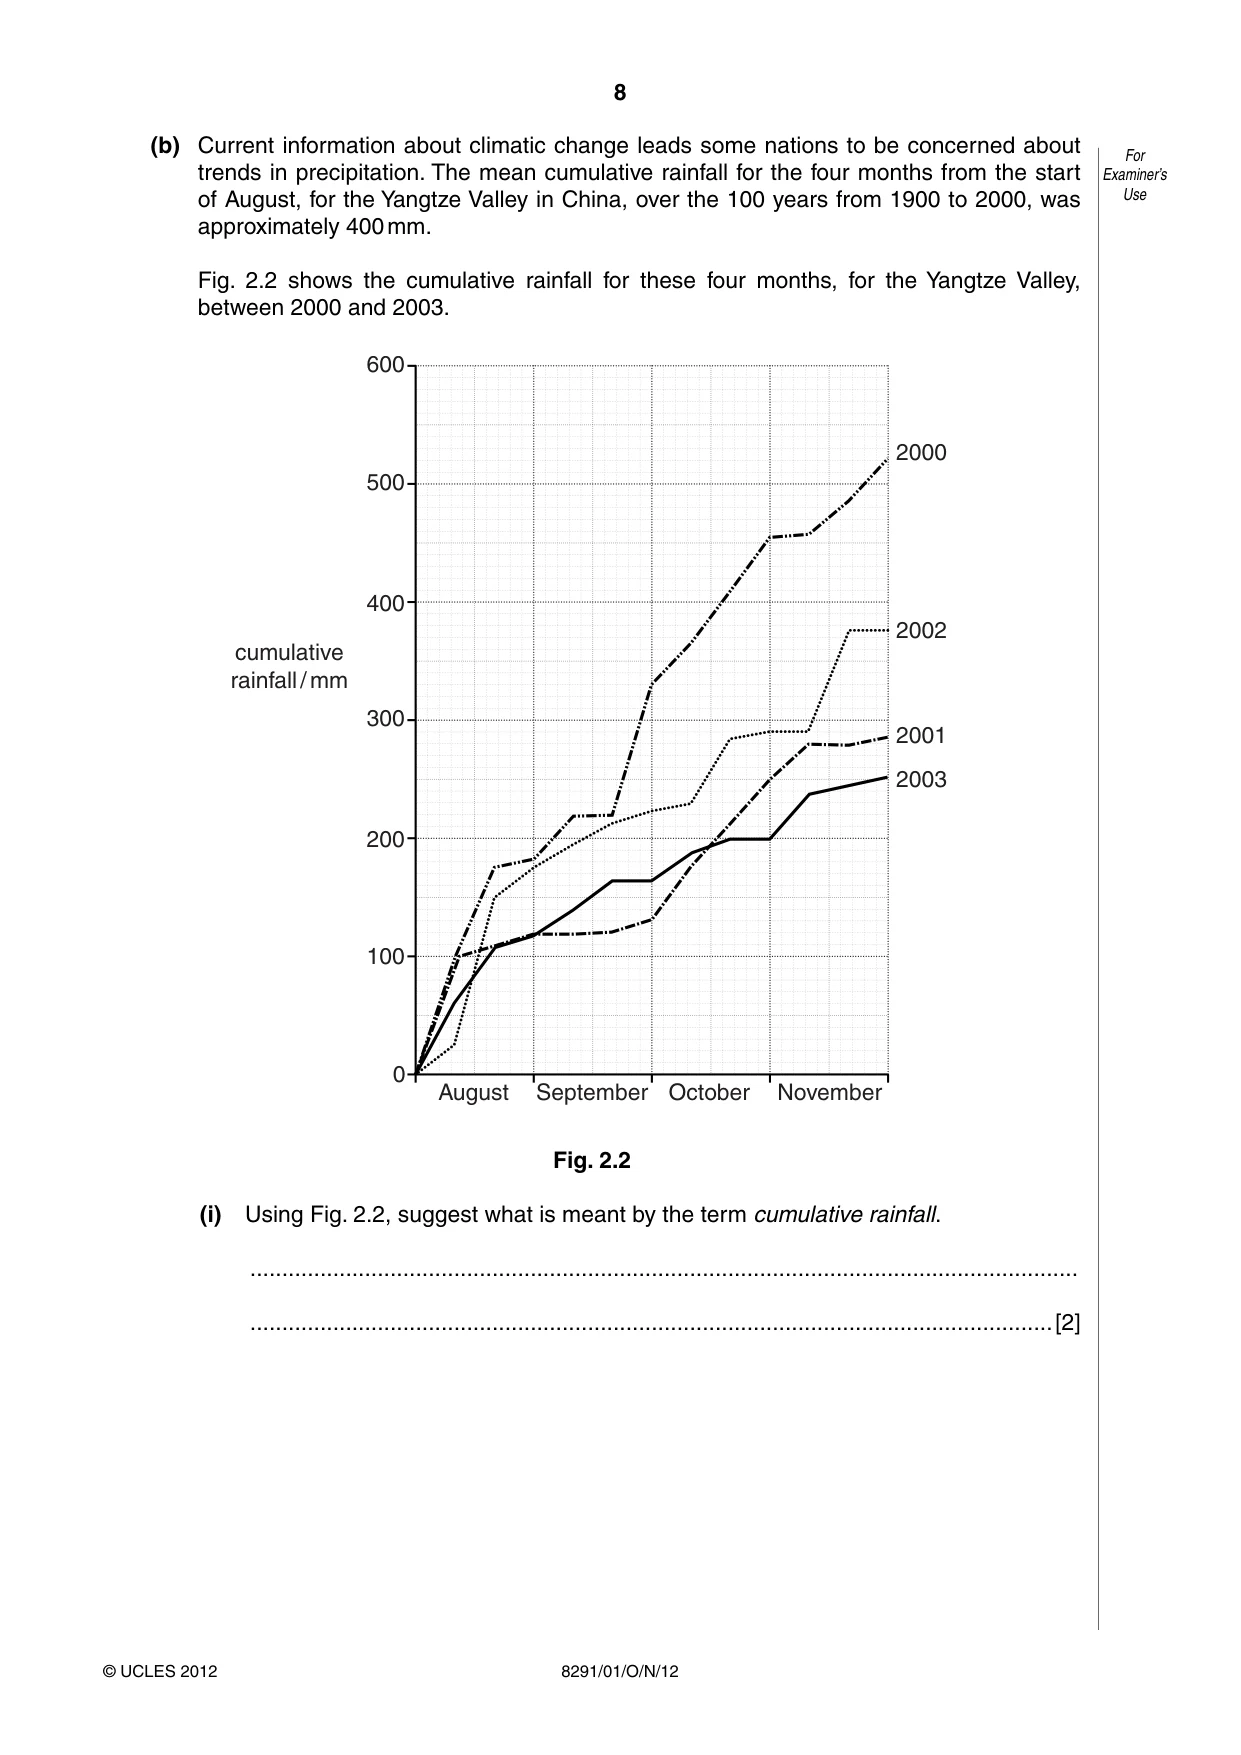
8 8291/01/O/N/12 © UCLES 2012 For Examiner’s Use (b) Current information about climatic change leads some nations to be concerned about trends in precipitation. The mean cumulative rainfall for the four months from the start of August, for the Yangtze Valley in China, over the 100 years from 1900 to 2000, was approximately 400 mm. Fig. 2.2 shows the cumulative rainfall for these four months, for the Yangtze Valley, between 2000 and 2003. 600 500 400 300 cumulative rainfall / mm 200 100 0 September August October November 2000 2002 2001 2003 Fig. 2.2 (i) Using Fig. 2.2, suggest what is meant by the term cumulative rainfall. … …[2]
Question paper, page 9
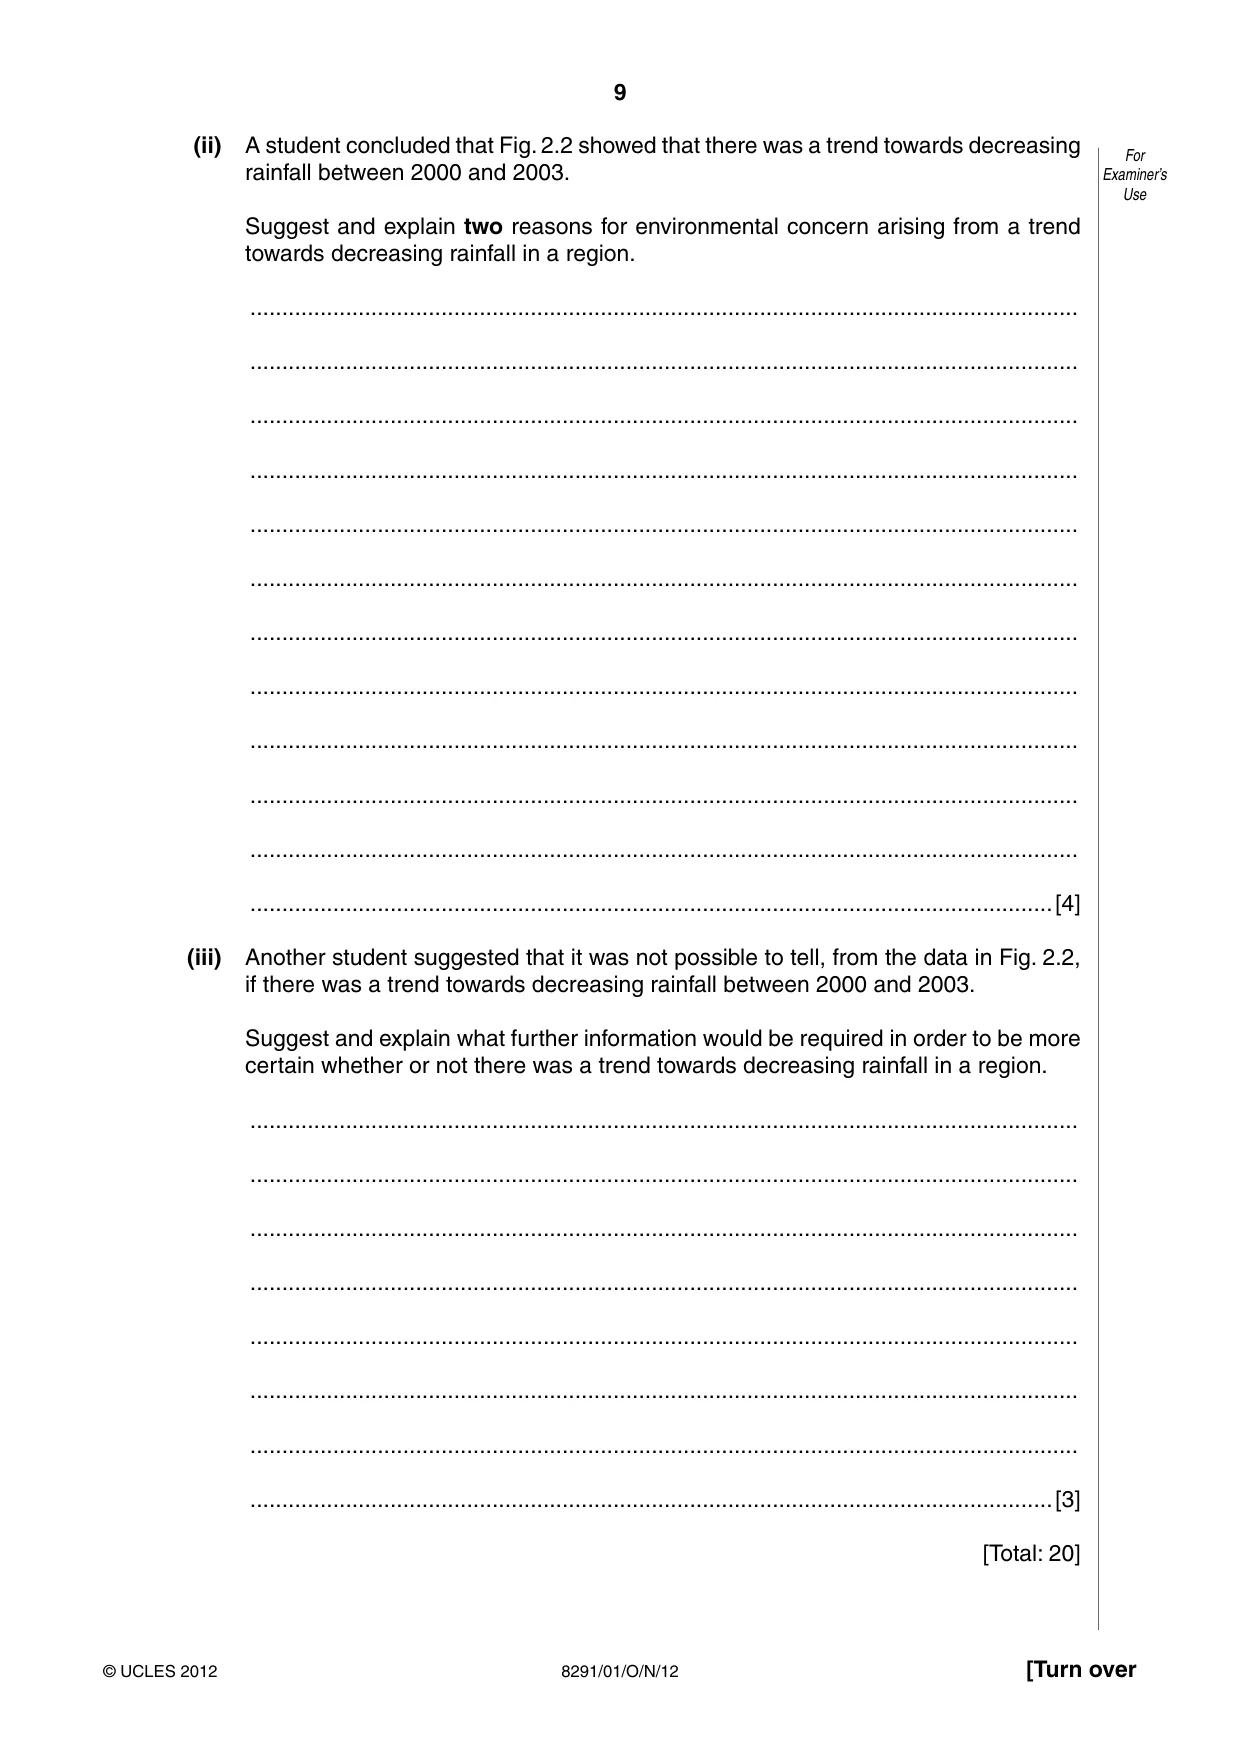
9 8291/01/O/N/12 © UCLES 2012 [Turn over For Examiner’s Use (ii) A student concluded that Fig. 2.2 showed that there was a trend towards decreasing rainfall between 2000 and 2003. Suggest and explain two reasons for environmental concern arising from a trend towards decreasing rainfall in a region. … … … … … … … … … … … …[4] (iii) Another student suggested that it was not possible to tell, from the data in Fig. 2.2, if there was a trend towards decreasing rainfall between 2000 and 2003. Suggest and explain what further information would be required in order to be more certain whether or not there was a trend towards decreasing rainfall in a region. … … … … … … … …[3] [Total: 20]
Question paper, page 10
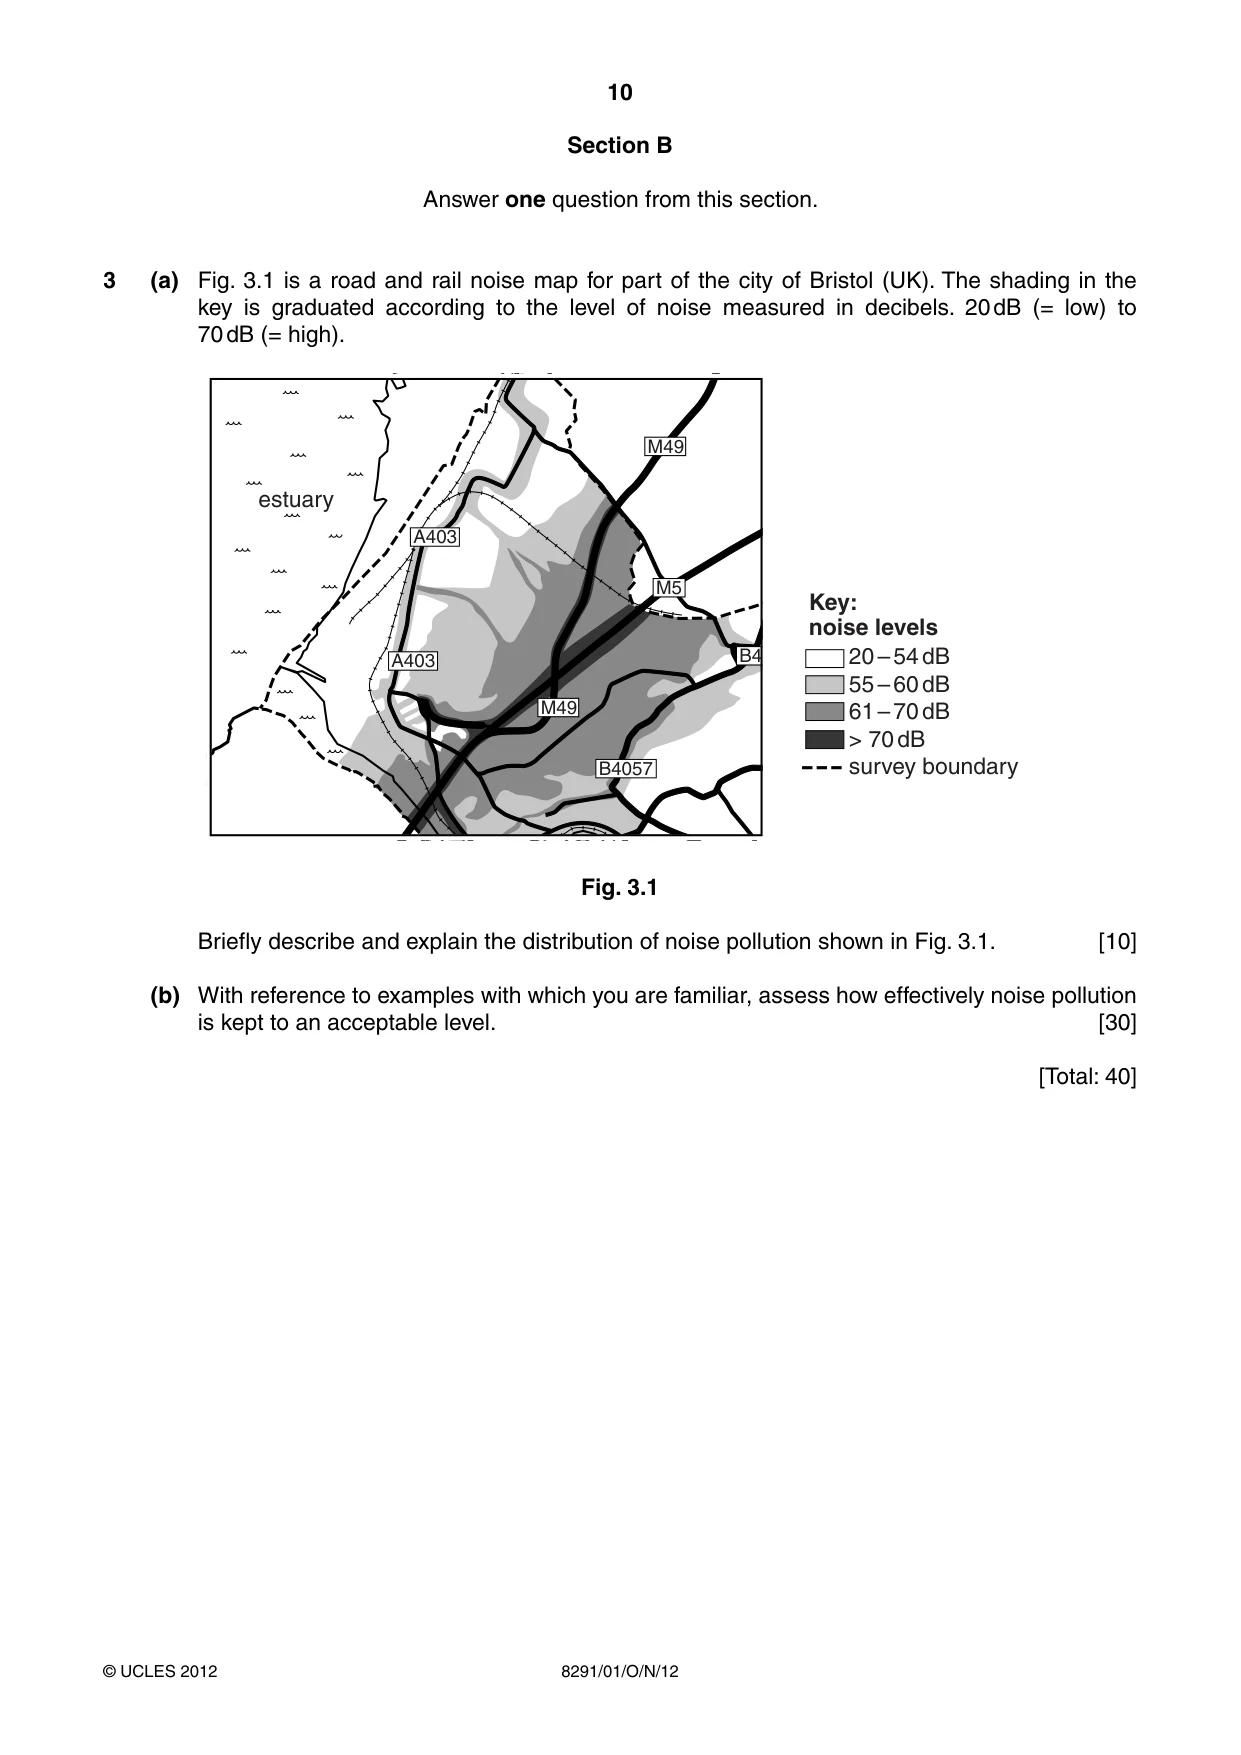
10 8291/01/O/N/12 © UCLES 2012 Section B Answer one question from this section. 3 (a) Fig. 3.1 is a road and rail noise map for part of the city of Bristol (UK). The shading in the key is graduated according to the level of noise measured in decibels. 20 dB (= low) to 70 dB (= high). A403 A403 B4057 B4057 M5 M49 M49 20 – 54 dB 55 – 60 dB 61 – 70 dB > 70 dB survey boundary Key: noise levels estuary Fig. 3.1 Briefly describe and explain the distribution of noise pollution shown in Fig. 3.1. [10] (b) With reference to examples with which you are familiar, assess how effectively noise pollution is kept to an acceptable level. [30] [Total: 40]
Question paper, page 11
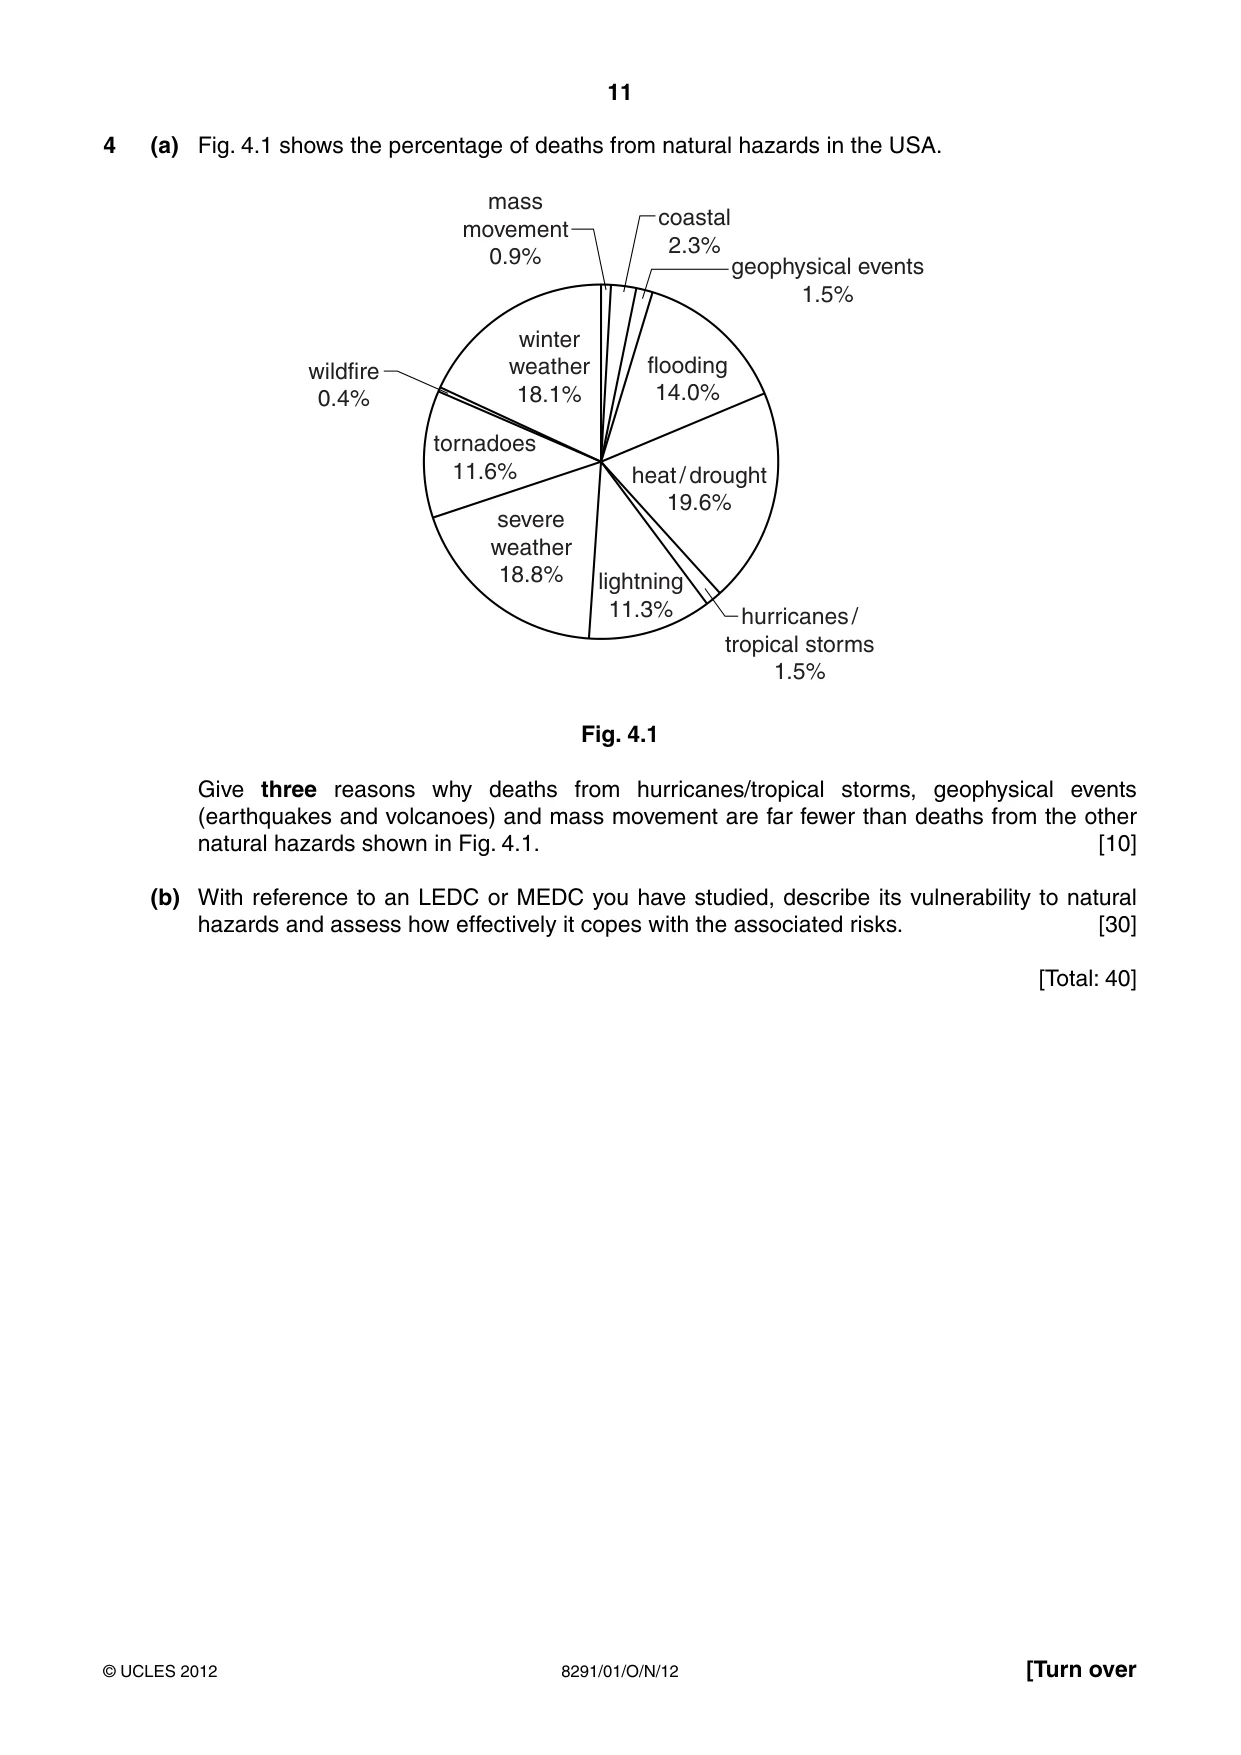
11 8291/01/O/N/12 © UCLES 2012 [Turn over 4 (a) Fig. 4.1 shows the percentage of deaths from natural hazards in the USA. flooding 14.0% lightning 11.3% severe weather 18.8% tornadoes 11.6% winter weather 18.1% wildfire 0.4% mass movement 0.9% coastal 2.3% geophysical events 1.5% hurricanes / tropical storms 1.5% heat / drought 19.6% Fig. 4.1 Give three reasons why deaths from hurricanes/tropical storms, geophysical events (earthquakes and volcanoes) and mass movement are far fewer than deaths from the other natural hazards shown in Fig. 4.1. [10] (b) With reference to an LEDC or MEDC you have studied, describe its vulnerability to natural hazards and assess how effectively it copes with the associated risks. [30] [Total: 40]
Question paper, page 12
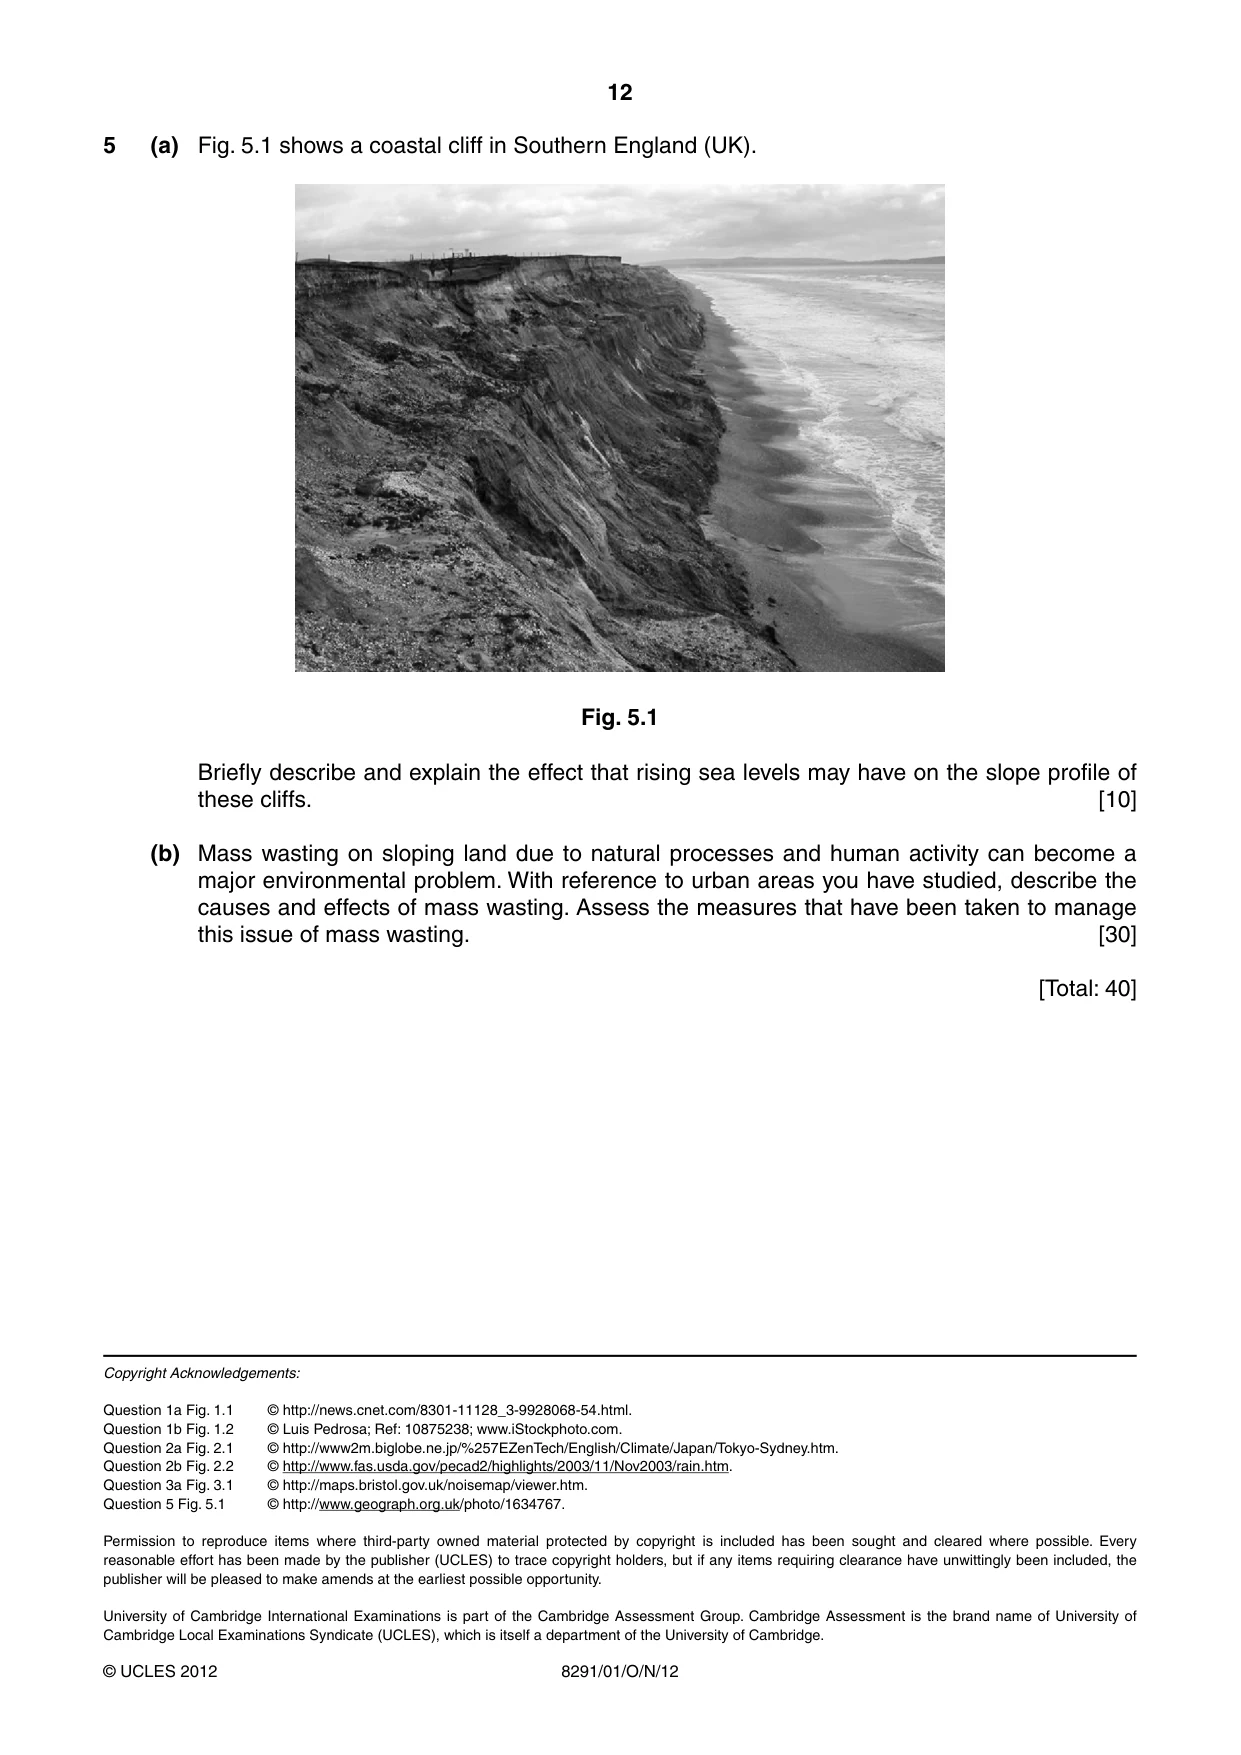
12 8291/01/O/N/12 © UCLES 2012 5 (a) Fig. 5.1 shows a coastal cliff in Southern England (UK). Fig. 5.1 Briefly describe and explain the effect that rising sea levels may have on the slope profile of these cliffs. [10] (b) Mass wasting on sloping land due to natural processes and human activity can become a major environmental problem. With reference to urban areas you have studied, describe the causes and effects of mass wasting. Assess the measures that have been taken to manage this issue of mass wasting. [30] [Total: 40] Copyright Acknowledgements: Question 1a Fig. 1.1 © http://news.cnet.com/8301-11128_3-9928068-54.html. Question 1b Fig. 1.2 © Luis Pedrosa; Ref: 10875238; www.iStockphoto.com. Question 2a Fig. 2.1 © http://www2m.biglobe.ne.jp/%257EZenTech/English/Climate/Japan/Tokyo-Sydney.htm. Question 2b Fig. 2.2 © http://www.fas.usda.gov/pecad2/highlights/2003/11/Nov2003/rain.htm. Question 3a Fig. 3.1 © http://maps.bristol.gov.uk/noisemap/viewer.htm. Question 5 Fig. 5.1 © http://www.geograph.org.uk/photo/1634767. Permission to reproduce items where third-party owned material protected by copyright is included has been sought and cleared where possible. Every reasonable effort has been made by the publisher (UCLES) to trace copyright holders, but if any items requiring clearance have unwittingly been included, the publisher will be pleased to make amends at the earliest possible opportunity. University of Cambridge International Examinations is part of the Cambridge Assessment Group. Cambridge Assessment is the brand name of University of Cambridge Local Examinations Syndicate (UCLES), which is itself a department of the University of Cambridge.
Mark scheme, page 1
CAMBRIDGE INTERNATIONAL EXAMINATIONS GCE Advanced Subsidiary Level MARK SCHEME for the October/November 2012 series 8291 ENVIRONMENTAL MANAGEMENT 8291/01 Paper 1, maximum raw mark 80 This mark scheme is published as an aid to teachers and candidates, to indicate the requirements of the examination. It shows the basis on which Examiners were instructed to award marks. It does not indicate the details of the discussions that took place at an Examiners’ meeting before marking began, which would have considered the acceptability of alternative answers. Mark schemes should be read in conjunction with the question paper and the Principal Examiner Report for Teachers. Cambridge will not enter into discussions about these mark schemes. Cambridge is publishing the mark schemes for the October/November 2012 series for most IGCSE, GCE Advanced Level and Advanced Subsidiary Level components and some Ordinary Level components.
Mark scheme, page 2
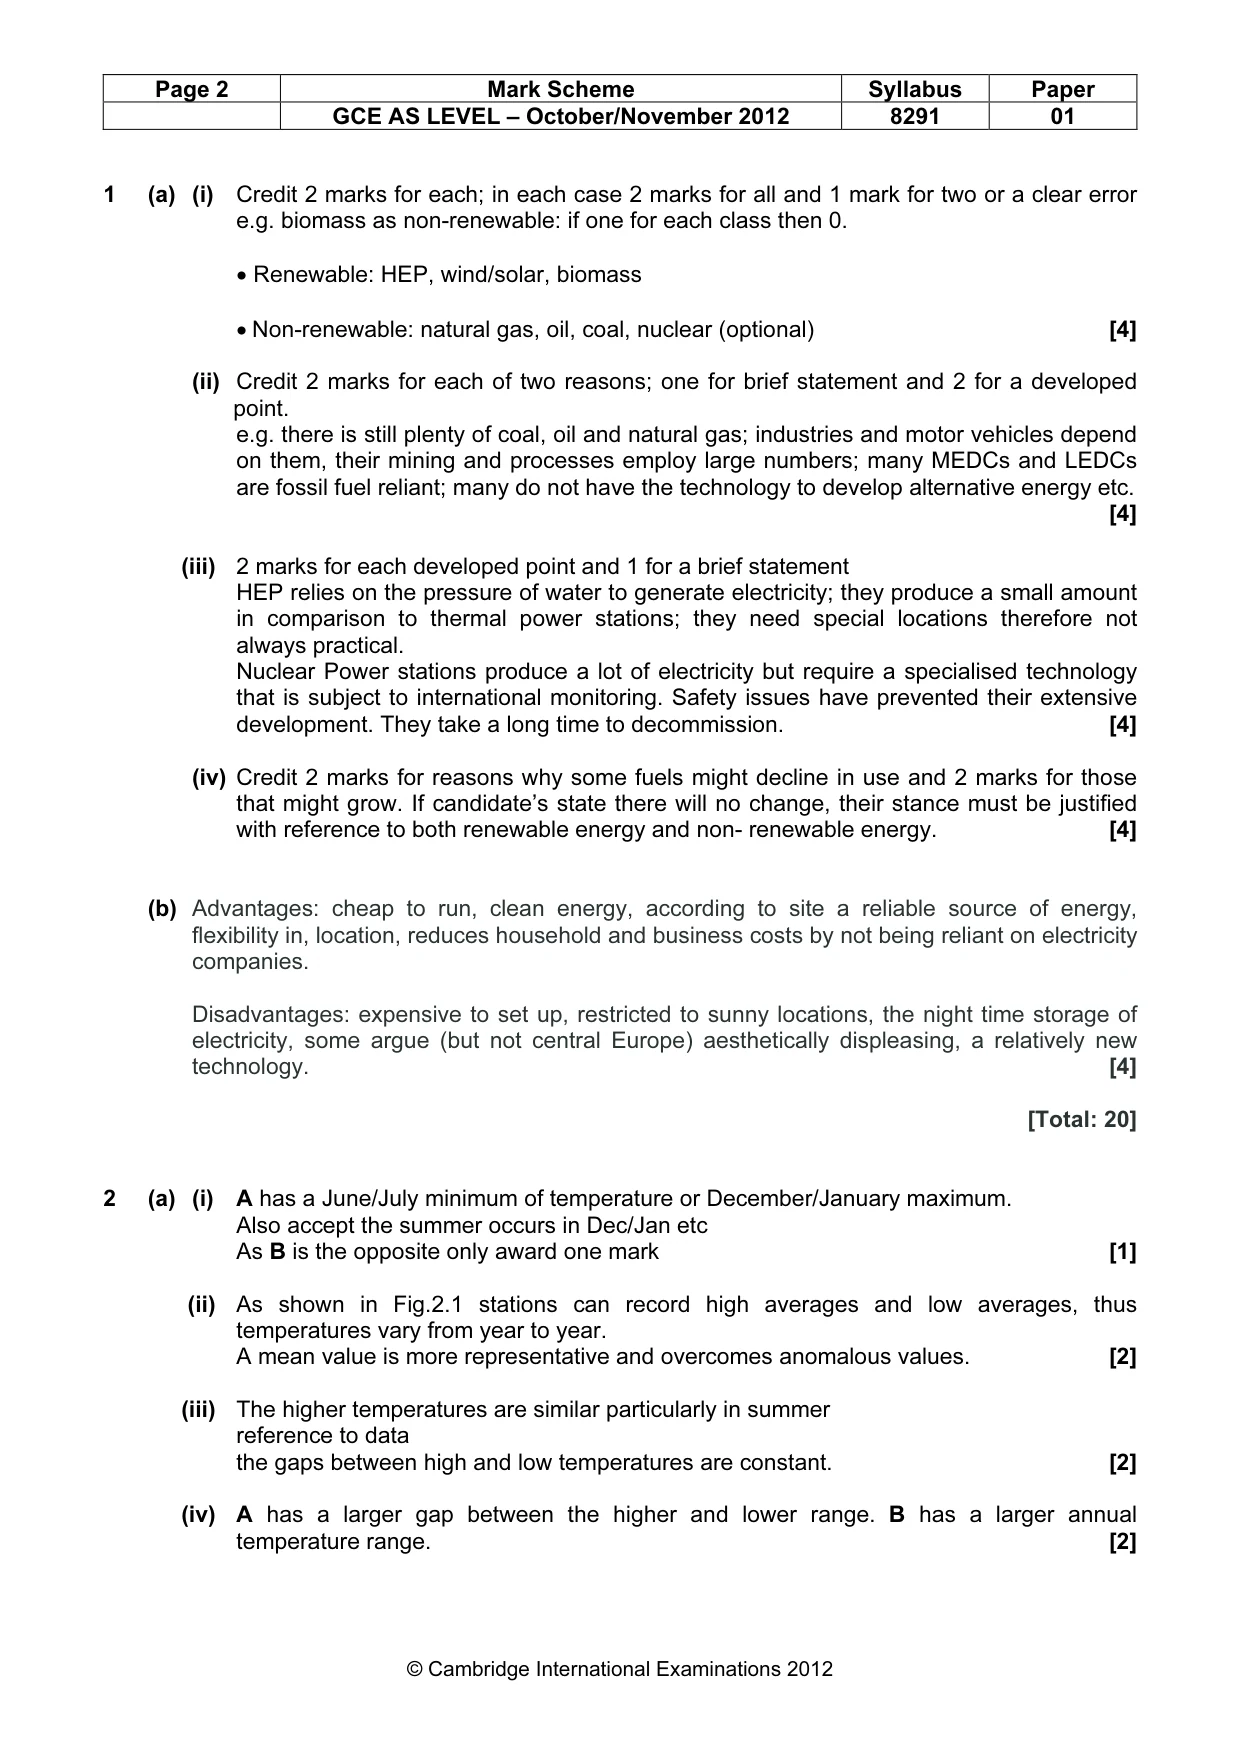
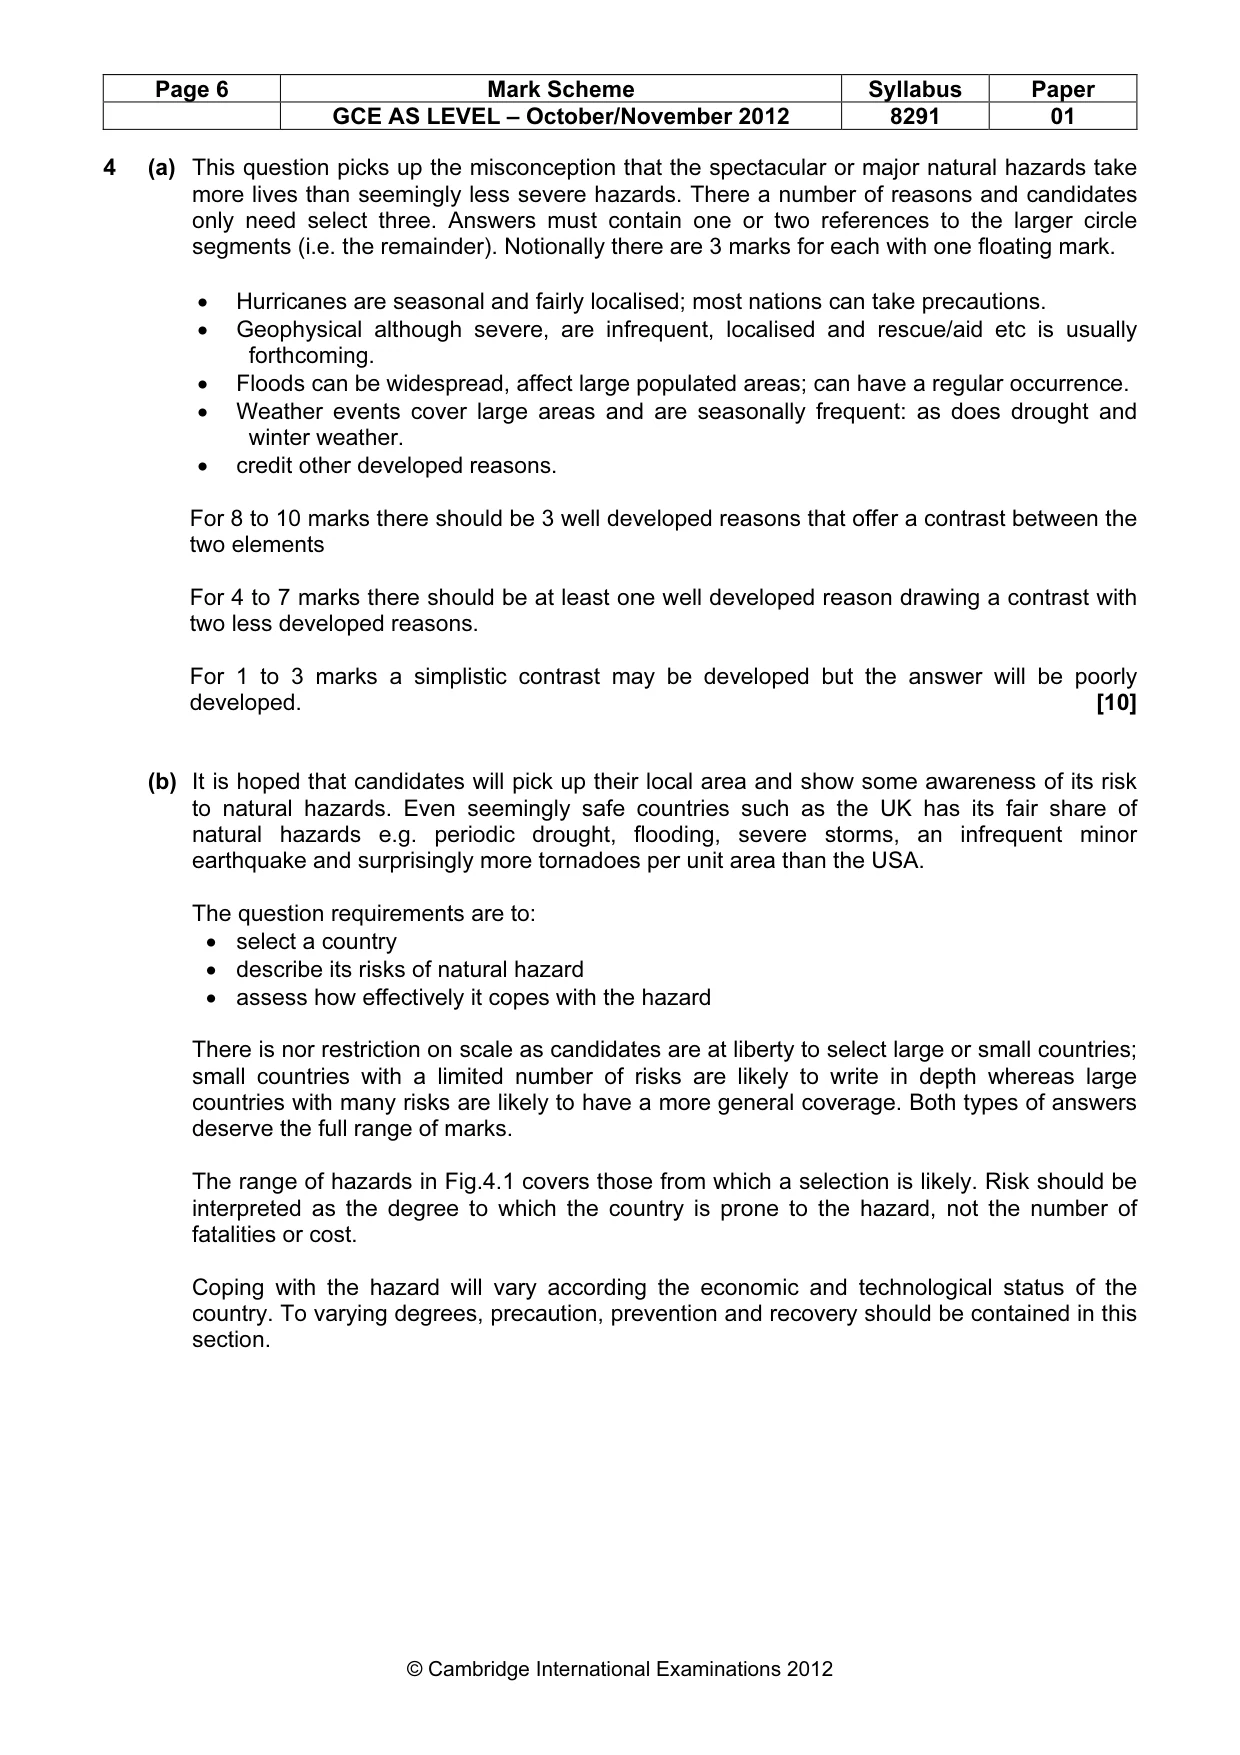
Page 2 Mark Scheme Syllabus Paper GCE AS LEVEL – October/November 2012 8291 01 © Cambridge International Examinations 2012 1 (a) (i) Credit 2 marks for each; in each case 2 marks for all and 1 mark for two or a clear error e.g. biomass as non-renewable: if one for each class then 0. • Renewable: HEP, wind/solar, biomass • Non-renewable: natural gas, oil, coal, nuclear (optional) [4] (ii) Credit 2 marks for each of two reasons; one for brief statement and 2 for a developed point. e.g. there is still plenty of coal, oil and natural gas; industries and motor vehicles depend on them, their mining and processes employ large numbers; many MEDCs and LEDCs are fossil fuel reliant; many do not have the technology to develop alternative energy etc. [4] (iii) 2 marks for each developed point and 1 for a brief statement HEP relies on the pressure of water to generate electricity; they produce a small amount in comparison to thermal power stations; they need special locations therefore not always practical. Nuclear Power stations produce a lot of electricity but require a specialised technology that is subject to international monitoring. Safety issues have prevented their extensive development. They take a long time to decommission. [4] (iv) Credit 2 marks for reasons why some fuels might decline in use and 2 marks for those that might grow. If candidate’s state there will no change, their stance must be justified with reference to both renewable energy and non- renewable energy. [4] (b) Advantages: cheap to run, clean energy, according to site a reliable source of energy, flexibility in, location, reduces household and business costs by not being reliant on electricity companies. Disadvantages: expensive to set up, restricted to sunny locations, the night time storage of electricity, some argue (but not central Europe) aesthetically displeasing, a relatively new technology. [4] [Total: 20] 2 (a) (i) A has a June/July minimum of temperature or December/January maximum. Also accept the summer occurs in Dec/Jan etc As B is the opposite only award one mark [1] (ii) As shown in Fig.2.1 stations can record high averages and low averages, thus temperatures vary from year to year. A mean value is more representative and overcomes anomalous values. [2] (iii) The higher temperatures are similar particularly in summer reference to data the gaps between high and low temperatures are constant. [2] (iv) A has a larger gap between the higher and lower range. B has a larger annual temperature range. [2]
Mark scheme, page 3
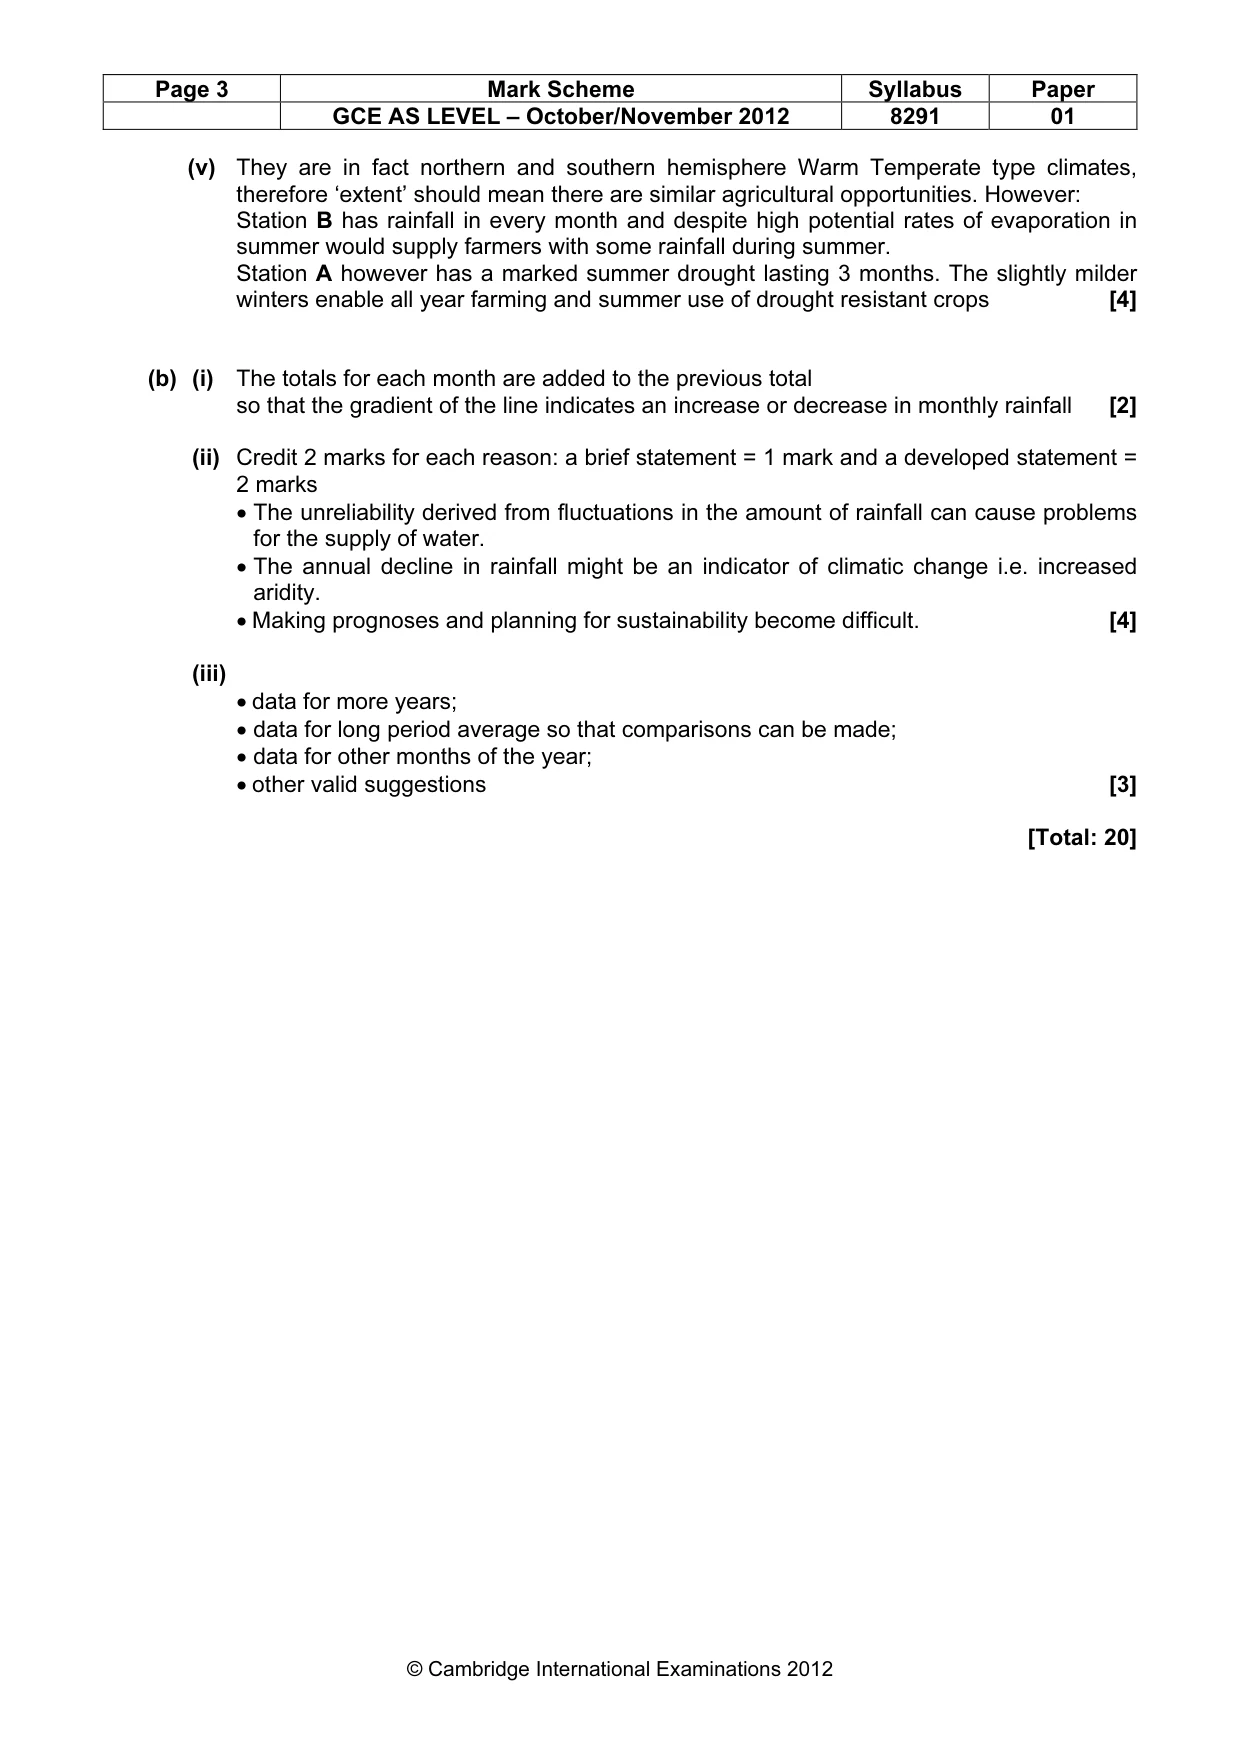
Page 3 Mark Scheme Syllabus Paper GCE AS LEVEL – October/November 2012 8291 01 © Cambridge International Examinations 2012 (v) They are in fact northern and southern hemisphere Warm Temperate type climates, therefore ‘extent’ should mean there are similar agricultural opportunities. However: Station B has rainfall in every month and despite high potential rates of evaporation in summer would supply farmers with some rainfall during summer. Station A however has a marked summer drought lasting 3 months. The slightly milder winters enable all year farming and summer use of drought resistant crops [4] (b) (i) The totals for each month are added to the previous total so that the gradient of the line indicates an increase or decrease in monthly rainfall [2] (ii) Credit 2 marks for each reason: a brief statement = 1 mark and a developed statement = 2 marks • The unreliability derived from fluctuations in the amount of rainfall can cause problems for the supply of water. • The annual decline in rainfall might be an indicator of climatic change i.e. increased aridity. • Making prognoses and planning for sustainability become difficult. [4] (iii) • data for more years; • data for long period average so that comparisons can be made; • data for other months of the year; • other valid suggestions [3] [Total: 20]
Mark scheme, page 4
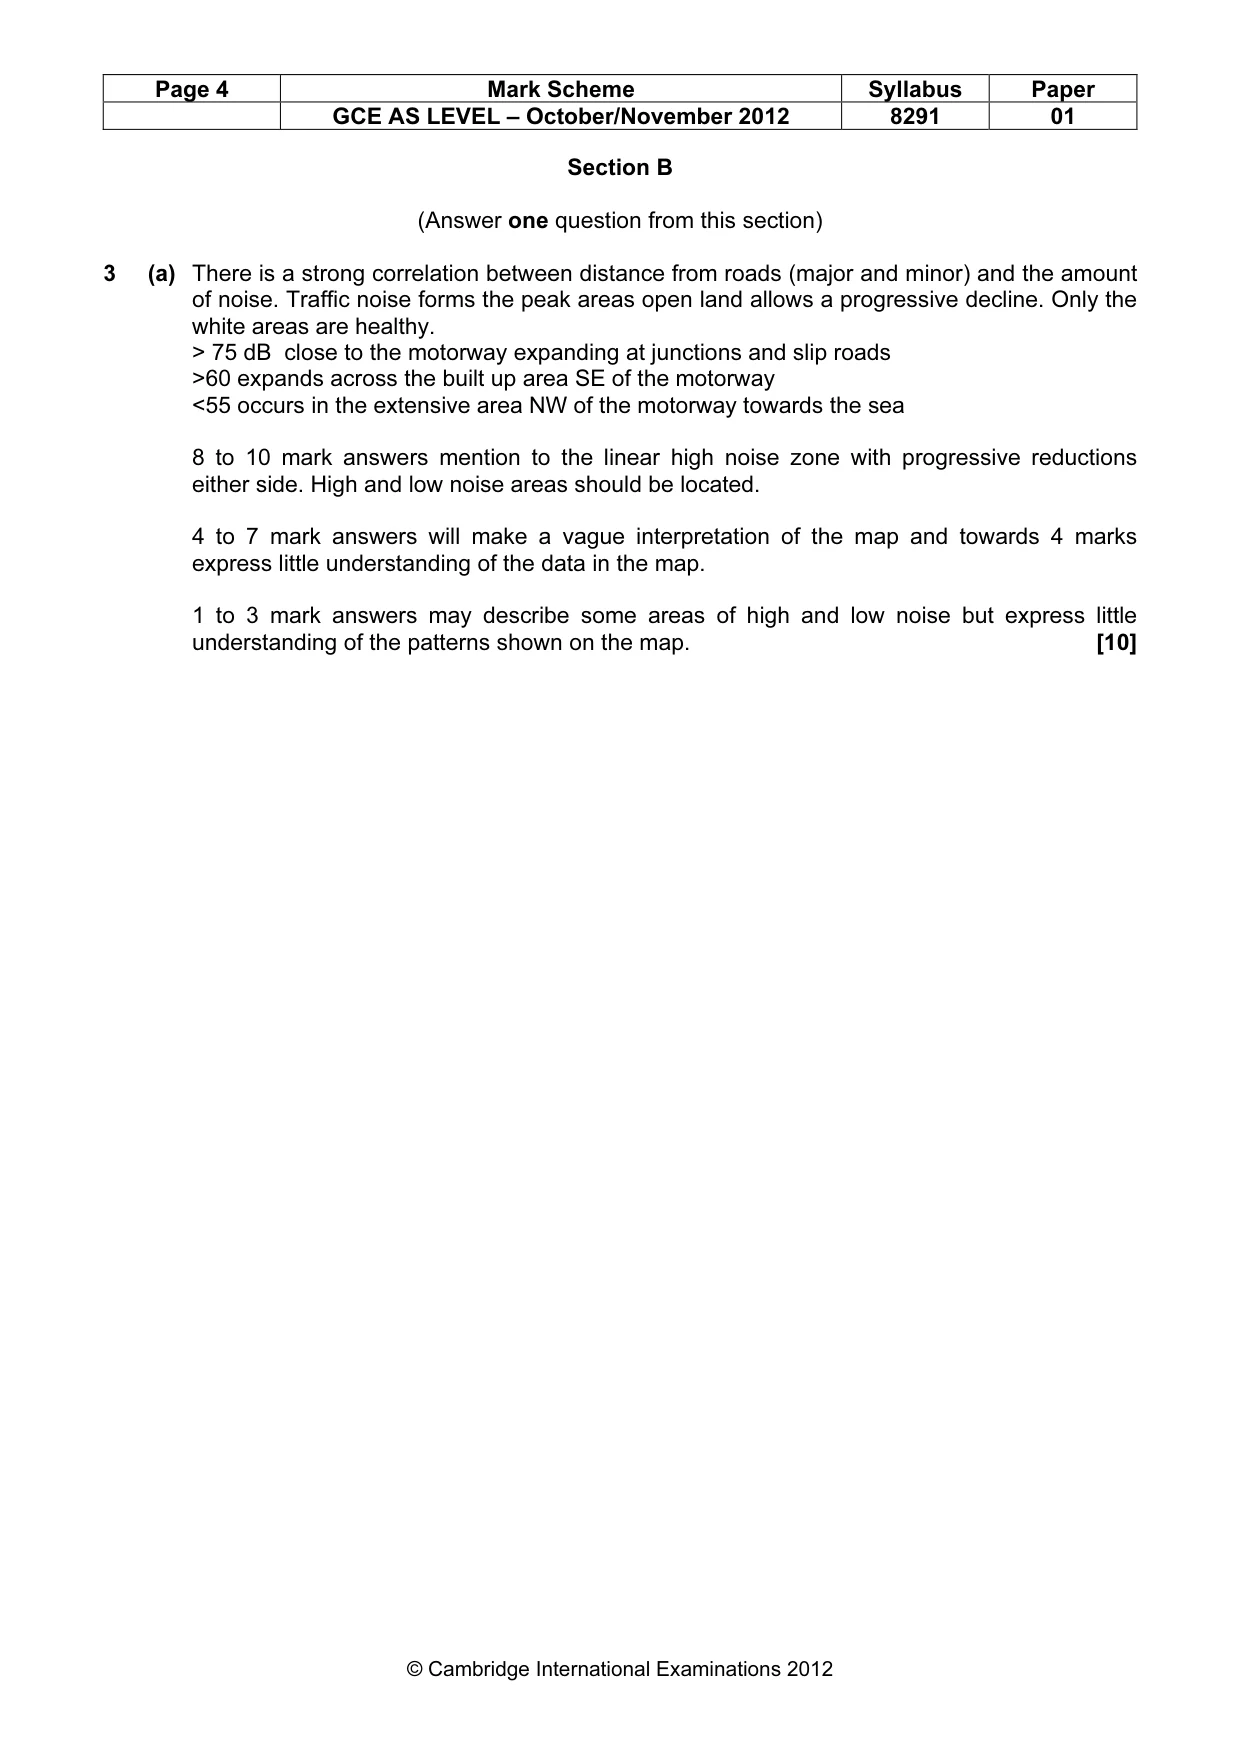
Page 4 Mark Scheme Syllabus Paper GCE AS LEVEL – October/November 2012 8291 01 © Cambridge International Examinations 2012 Section B (Answer one question from this section) 3 (a) There is a strong correlation between distance from roads (major and minor) and the amount of noise. Traffic noise forms the peak areas open land allows a progressive decline. Only the white areas are healthy. > 75 dB close to the motorway expanding at junctions and slip roads >60 expands across the built up area SE of the motorway <55 occurs in the extensive area NW of the motorway towards the sea 8 to 10 mark answers mention to the linear high noise zone with progressive reductions either side. High and low noise areas should be located. 4 to 7 mark answers will make a vague interpretation of the map and towards 4 marks express little understanding of the data in the map. 1 to 3 mark answers may describe some areas of high and low noise but express little understanding of the patterns shown on the map. [10]
Mark scheme, page 5
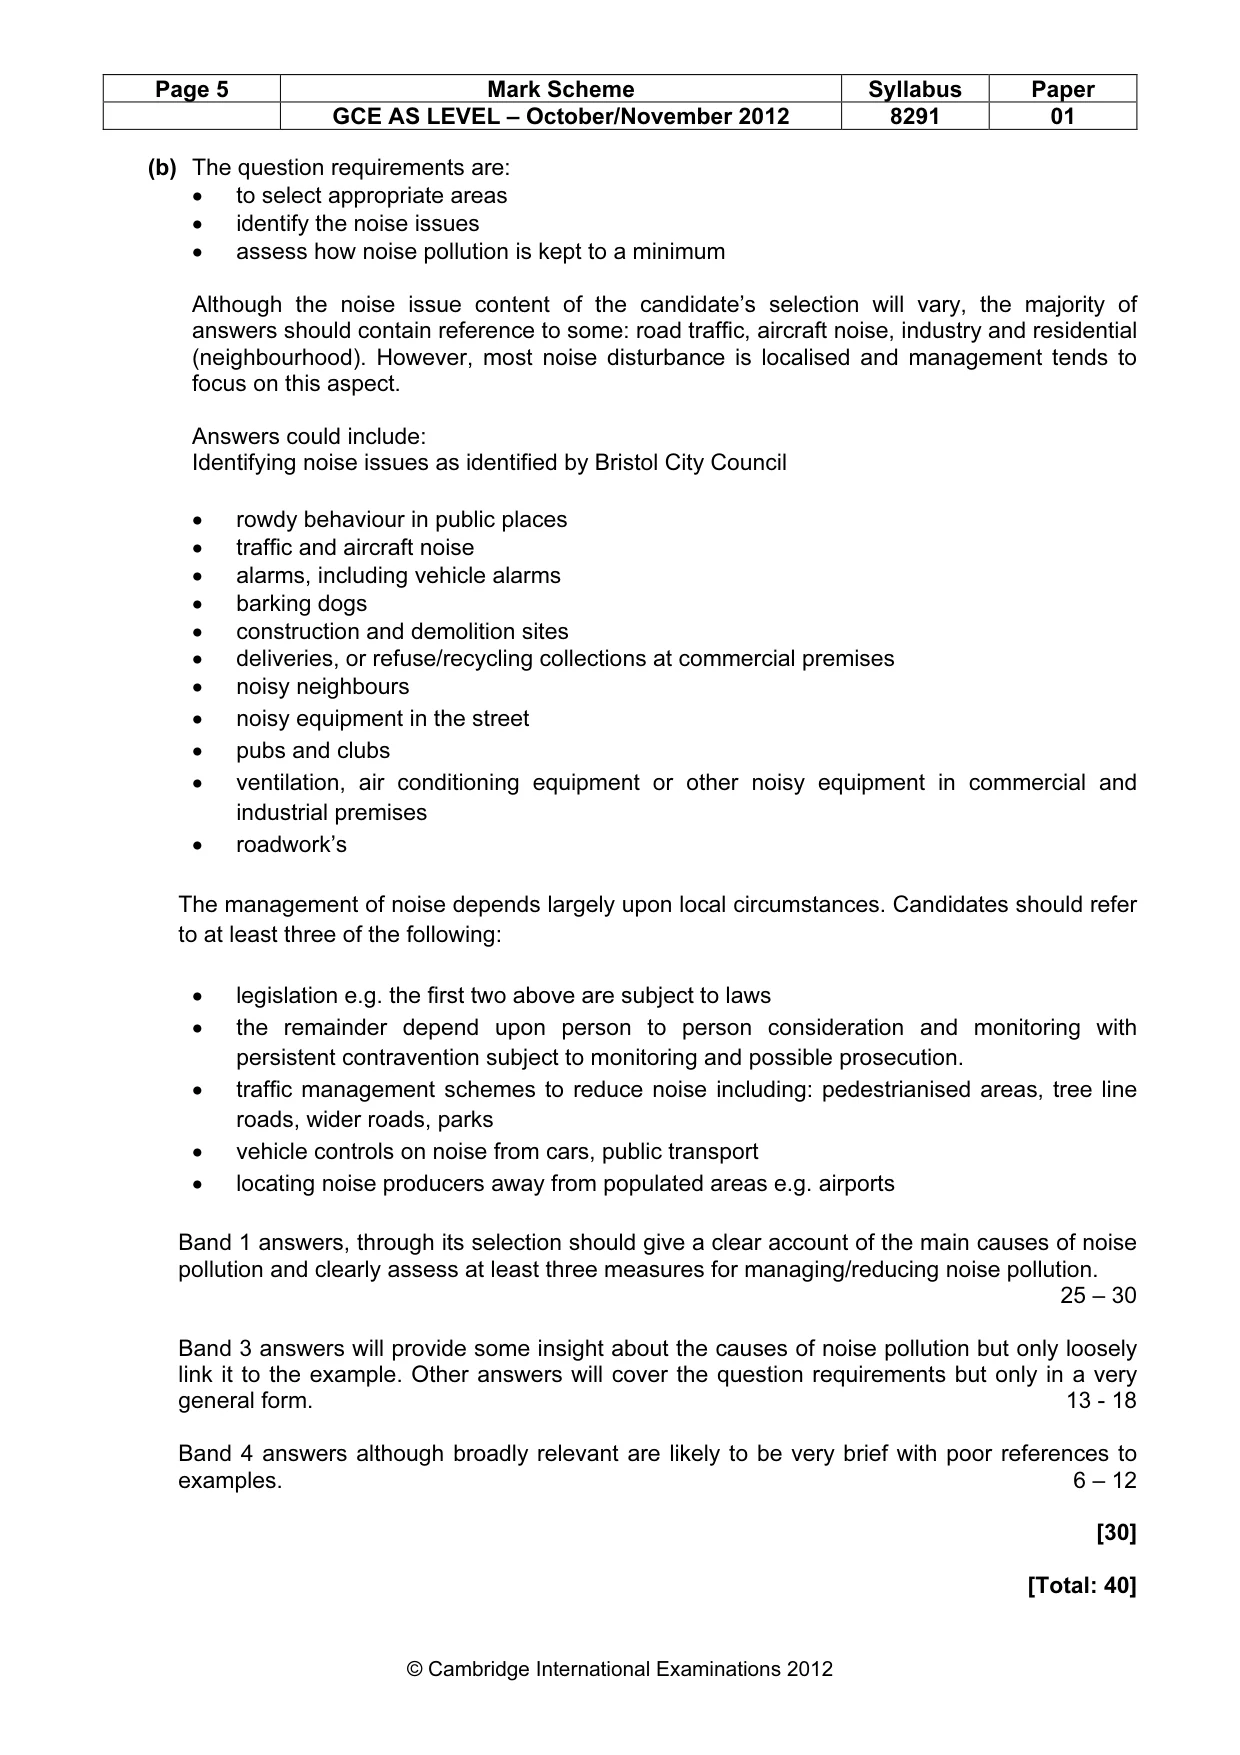
Page 5 Mark Scheme Syllabus Paper GCE AS LEVEL – October/November 2012 8291 01 © Cambridge International Examinations 2012 (b) The question requirements are: • to select appropriate areas • identify the noise issues • assess how noise pollution is kept to a minimum Although the noise issue content of the candidate’s selection will vary, the majority of answers should contain reference to some: road traffic, aircraft noise, industry and residential (neighbourhood). However, most noise disturbance is localised and management tends to focus on this aspect. Answers could include: Identifying noise issues as identified by Bristol City Council • rowdy behaviour in public places • traffic and aircraft noise • alarms, including vehicle alarms • barking dogs • construction and demolition sites • deliveries, or refuse/recycling collections at commercial premises • noisy neighbours • noisy equipment in the street • pubs and clubs • ventilation, air conditioning equipment or other noisy equipment in commercial and industrial premises • roadwork’s The management of noise depends largely upon local circumstances. Candidates should refer to at least three of the following: • legislation e.g. the first two above are subject to laws • the remainder depend upon person to person consideration and monitoring with persistent contravention subject to monitoring and possible prosecution. • traffic management schemes to reduce noise including: pedestrianised areas, tree line roads, wider roads, parks • vehicle controls on noise from cars, public transport • locating noise producers away from populated areas e.g. airports Band 1 answers, through its selection should give a clear account of the main causes of noise pollution and clearly assess at least three measures for managing/reducing noise pollution. 25 – 30 Band 3 answers will provide some insight about the causes of noise pollution but only loosely link it to the example. Other answers will cover the question requirements but only in a very general form. 13 - 18 Band 4 answers although broadly relevant are likely to be very brief with poor references to examples. 6 – 12 [30] [Total: 40]
Mark scheme, page 6
Page 6 Mark Scheme Syllabus Paper GCE AS LEVEL – October/November 2012 8291 01 © Cambridge International Examinations 2012 4 (a) This question picks up the misconception that the spectacular or major natural hazards take more lives than seemingly less severe hazards. There a number of reasons and candidates only need select three. Answers must contain one or two references to the larger circle segments (i.e. the remainder). Notionally there are 3 marks for each with one floating mark. • Hurricanes are seasonal and fairly localised; most nations can take precautions. • Geophysical although severe, are infrequent, localised and rescue/aid etc is usually forthcoming. • Floods can be widespread, affect large populated areas; can have a regular occurrence. • Weather events cover large areas and are seasonally frequent: as does drought and winter weather. • credit other developed reasons. For 8 to 10 marks there should be 3 well developed reasons that offer a contrast between the two elements For 4 to 7 marks there should be at least one well developed reason drawing a contrast with two less developed reasons. For 1 to 3 marks a simplistic contrast may be developed but the answer will be poorly developed. [10] (b) It is hoped that candidates will pick up their local area and show some awareness of its risk to natural hazards. Even seemingly safe countries such as the UK has its fair share of natural hazards e.g. periodic drought, flooding, severe storms, an infrequent minor earthquake and surprisingly more tornadoes per unit area than the USA. The question requirements are to: • select a country • describe its risks of natural hazard • assess how effectively it copes with the hazard There is nor restriction on scale as candidates are at liberty to select large or small countries; small countries with a limited number of risks are likely to write in depth whereas large countries with many risks are likely to have a more general coverage. Both types of answers deserve the full range of marks. The range of hazards in Fig.4.1 covers those from which a selection is likely. Risk should be interpreted as the degree to which the country is prone to the hazard, not the number of fatalities or cost. Coping with the hazard will vary according the economic and technological status of the country. To varying degrees, precaution, prevention and recovery should be contained in this section.
Mark scheme, page 7
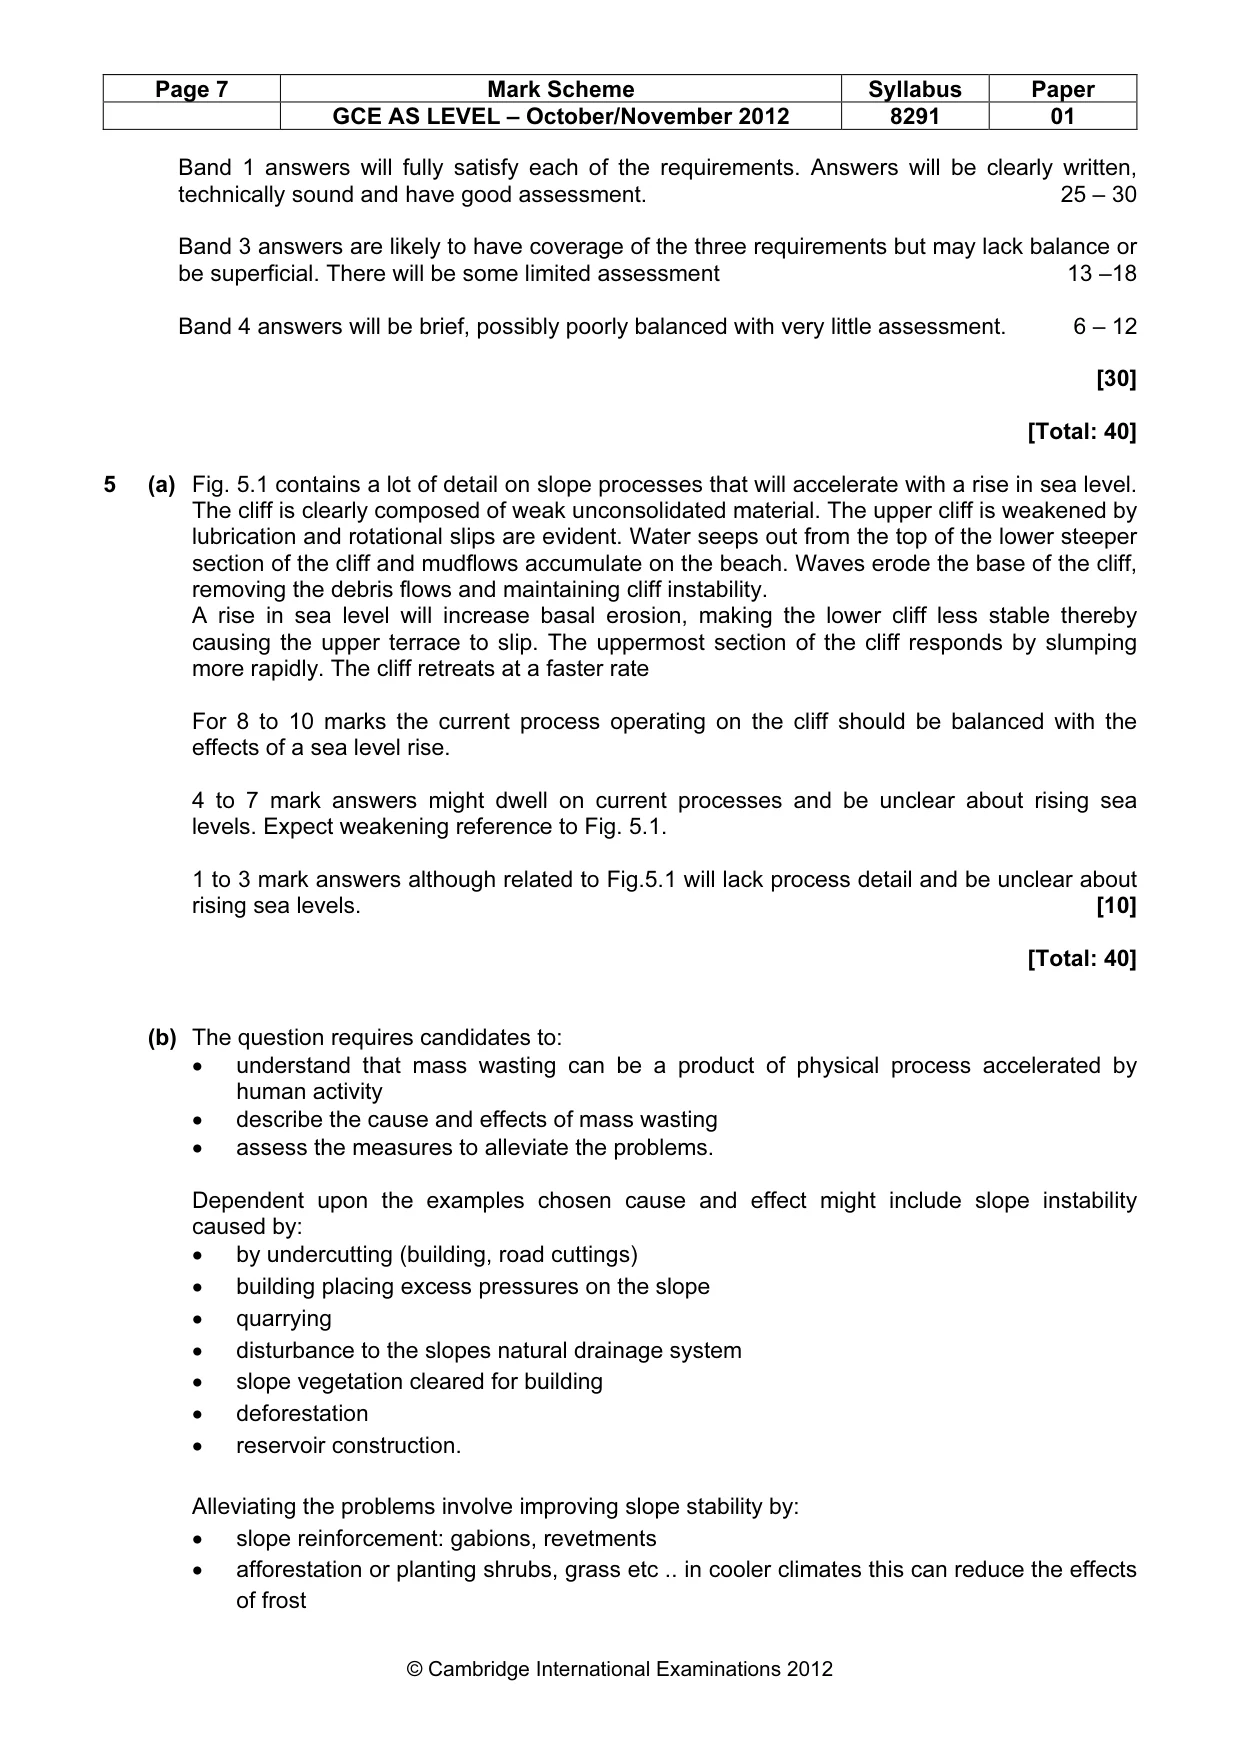
Page 7 Mark Scheme Syllabus Paper GCE AS LEVEL – October/November 2012 8291 01 © Cambridge International Examinations 2012 Band 1 answers will fully satisfy each of the requirements. Answers will be clearly written, technically sound and have good assessment. 25 – 30 Band 3 answers are likely to have coverage of the three requirements but may lack balance or be superficial. There will be some limited assessment 13 –18 Band 4 answers will be brief, possibly poorly balanced with very little assessment. 6 – 12 [30] [Total: 40] 5 (a) Fig. 5.1 contains a lot of detail on slope processes that will accelerate with a rise in sea level. The cliff is clearly composed of weak unconsolidated material. The upper cliff is weakened by lubrication and rotational slips are evident. Water seeps out from the top of the lower steeper section of the cliff and mudflows accumulate on the beach. Waves erode the base of the cliff, removing the debris flows and maintaining cliff instability. A rise in sea level will increase basal erosion, making the lower cliff less stable thereby causing the upper terrace to slip. The uppermost section of the cliff responds by slumping more rapidly. The cliff retreats at a faster rate For 8 to 10 marks the current process operating on the cliff should be balanced with the effects of a sea level rise. 4 to 7 mark answers might dwell on current processes and be unclear about rising sea levels. Expect weakening reference to Fig. 5.1. 1 to 3 mark answers although related to Fig.5.1 will lack process detail and be unclear about rising sea levels. [10] [Total: 40] (b) The question requires candidates to: • understand that mass wasting can be a product of physical process accelerated by human activity • describe the cause and effects of mass wasting • assess the measures to alleviate the problems. Dependent upon the examples chosen cause and effect might include slope instability caused by: • by undercutting (building, road cuttings) • building placing excess pressures on the slope • quarrying • disturbance to the slopes natural drainage system • slope vegetation cleared for building • deforestation • reservoir construction. Alleviating the problems involve improving slope stability by: • slope reinforcement: gabions, revetments • afforestation or planting shrubs, grass etc .. in cooler climates this can reduce the effects of frost
Mark scheme, page 8
Page 8 Mark Scheme Syllabus Paper GCE AS LEVEL – October/November 2012 8291 01 © Cambridge International Examinations 2012 • slope drainage • building elsewhere. Band 1 answers will cover the three requirements and will be clearly written with a good level of assessment. 25 – 30 Band 3 answers may be poorly balanced with more detail on mass wasting than alleviating measures. There will be little assessment. 13 – 18 Band 4 answers are likely to brief, poorly balanced and have little assessment 6 – 12 [30] [Total: 40]
Mark scheme, page 9
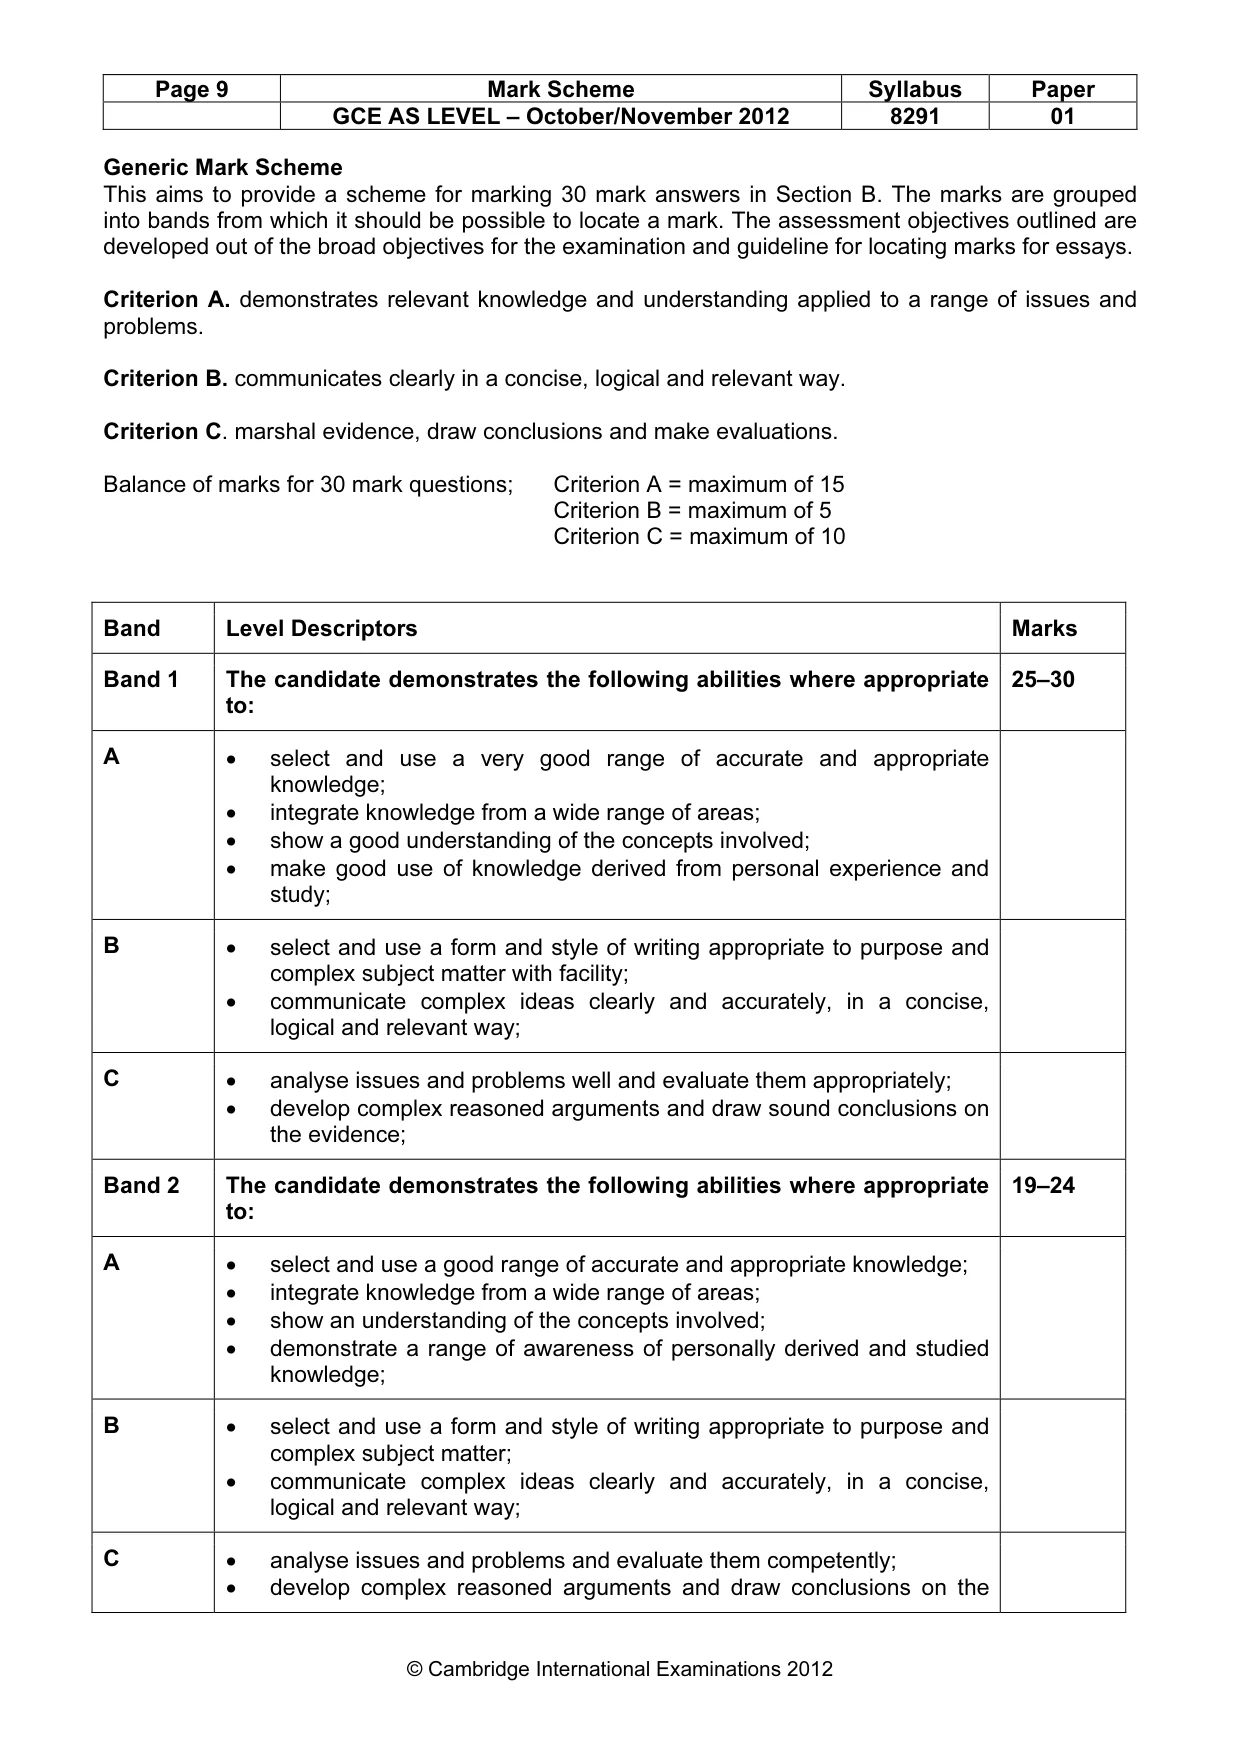
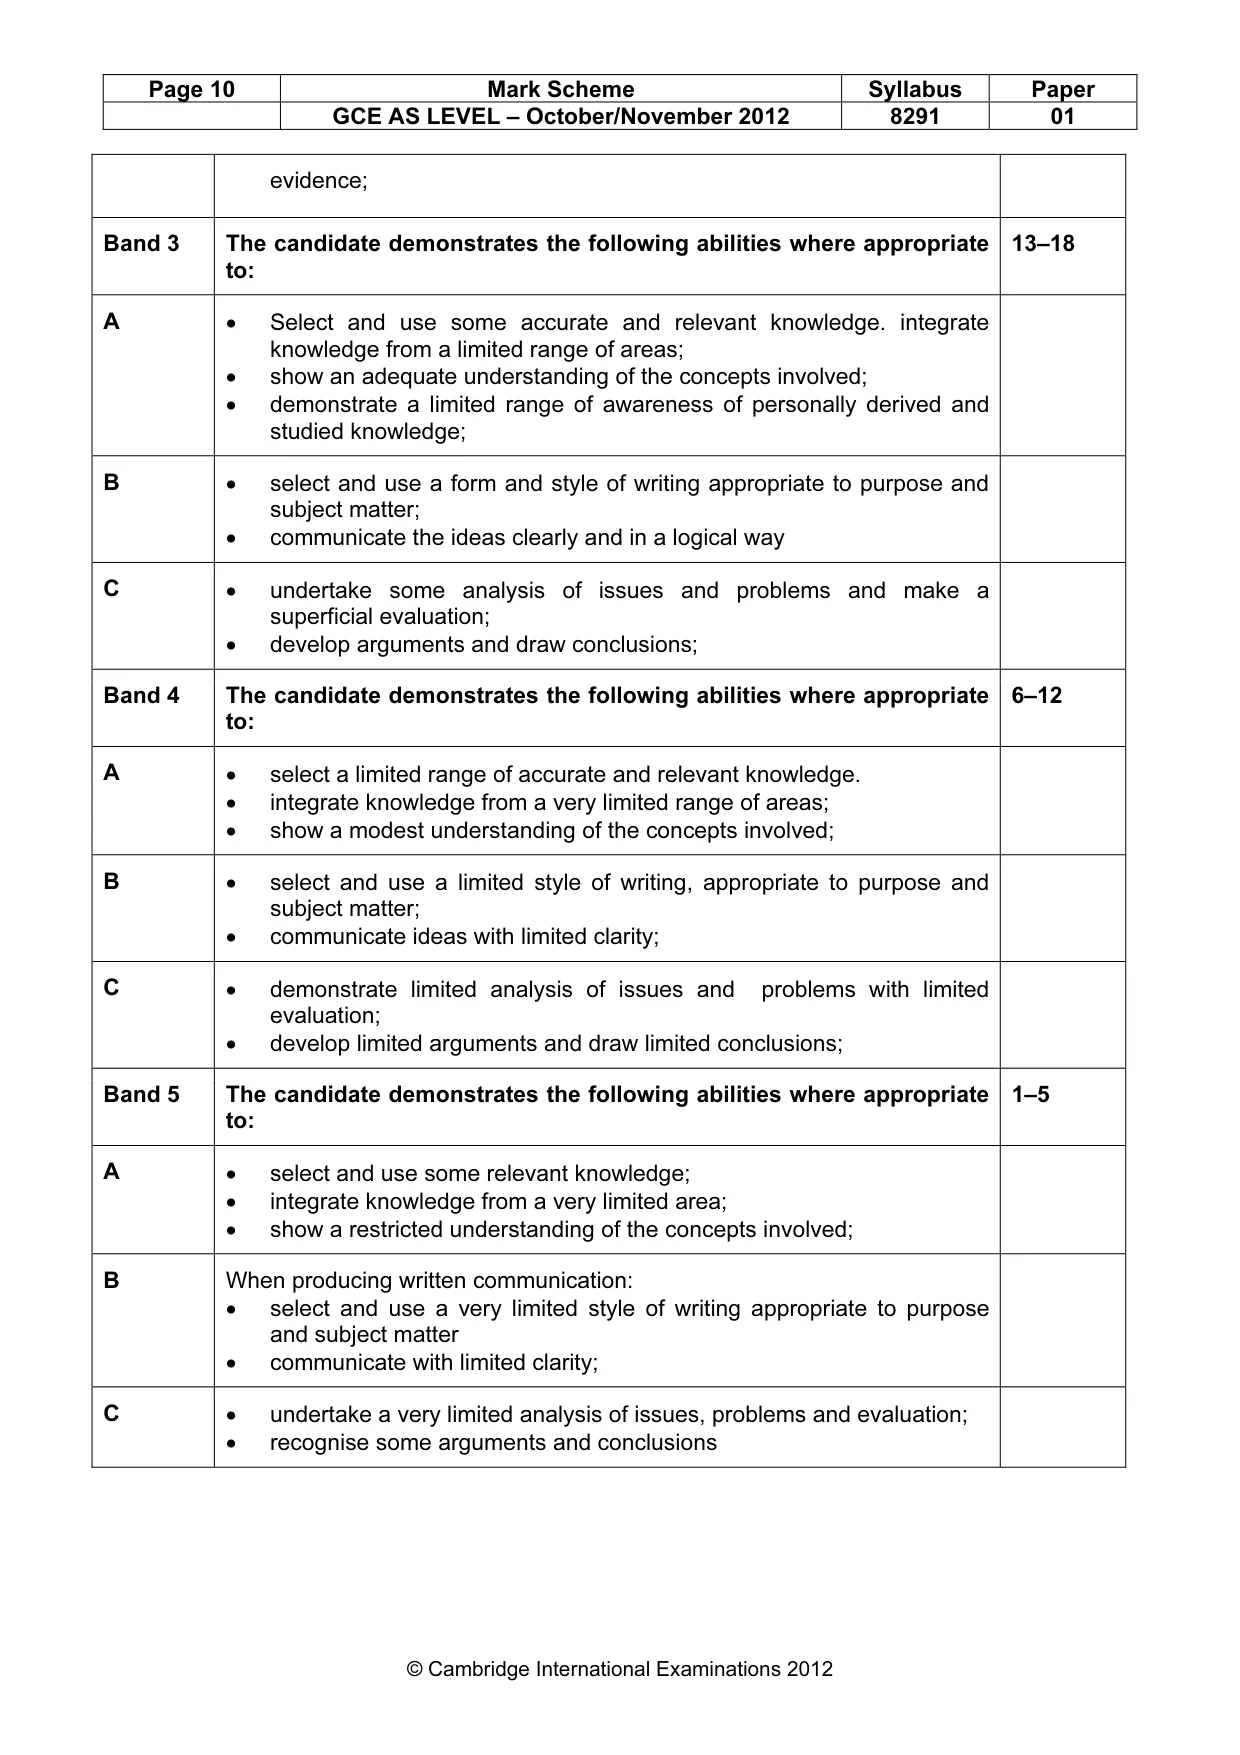
Page 9 Mark Scheme Syllabus Paper GCE AS LEVEL – October/November 2012 8291 01 © Cambridge International Examinations 2012 Generic Mark Scheme This aims to provide a scheme for marking 30 mark answers in Section B. The marks are grouped into bands from which it should be possible to locate a mark. The assessment objectives outlined are developed out of the broad objectives for the examination and guideline for locating marks for essays. Criterion A. demonstrates relevant knowledge and understanding applied to a range of issues and problems. Criterion B. communicates clearly in a concise, logical and relevant way. Criterion C. marshal evidence, draw conclusions and make evaluations. Balance of marks for 30 mark questions; Criterion A = maximum of 15 Criterion B = maximum of 5 Criterion C = maximum of 10 Band Level Descriptors Marks Band 1 The candidate demonstrates the following abilities where appropriate to: 25–30 A • select and use a very good range of accurate and appropriate knowledge; • integrate knowledge from a wide range of areas; • show a good understanding of the concepts involved; • make good use of knowledge derived from personal experience and study; B • select and use a form and style of writing appropriate to purpose and complex subject matter with facility; • communicate complex ideas clearly and accurately, in a concise, logical and relevant way; C • analyse issues and problems well and evaluate them appropriately; • develop complex reasoned arguments and draw sound conclusions on the evidence; Band 2 The candidate demonstrates the following abilities where appropriate to: 19–24 A • select and use a good range of accurate and appropriate knowledge; • integrate knowledge from a wide range of areas; • show an understanding of the concepts involved; • demonstrate a range of awareness of personally derived and studied knowledge; B • select and use a form and style of writing appropriate to purpose and complex subject matter; • communicate complex ideas clearly and accurately, in a concise, logical and relevant way; C • analyse issues and problems and evaluate them competently; • develop complex reasoned arguments and draw conclusions on the
Mark scheme, page 10
Page 10 Mark Scheme Syllabus Paper GCE AS LEVEL – October/November 2012 8291 01 © Cambridge International Examinations 2012 evidence; Band 3 The candidate demonstrates the following abilities where appropriate to: 13–18 A • Select and use some accurate and relevant knowledge. integrate knowledge from a limited range of areas; • show an adequate understanding of the concepts involved; • demonstrate a limited range of awareness of personally derived and studied knowledge; B • select and use a form and style of writing appropriate to purpose and subject matter; • communicate the ideas clearly and in a logical way C • undertake some analysis of issues and problems and make a superficial evaluation; • develop arguments and draw conclusions; Band 4 The candidate demonstrates the following abilities where appropriate to: 6–12 A • select a limited range of accurate and relevant knowledge. • integrate knowledge from a very limited range of areas; • show a modest understanding of the concepts involved; B • select and use a limited style of writing, appropriate to purpose and subject matter; • communicate ideas with limited clarity; C • demonstrate limited analysis of issues and problems with limited evaluation; • develop limited arguments and draw limited conclusions; Band 5 The candidate demonstrates the following abilities where appropriate to: 1–5 A • select and use some relevant knowledge; • integrate knowledge from a very limited area; • show a restricted understanding of the concepts involved; B When producing written communication: • select and use a very limited style of writing appropriate to purpose and subject matter • communicate with limited clarity; C • undertake a very limited analysis of issues, problems and evaluation; • recognise some arguments and conclusions
What you needed in this session
Cambridge’s own grade thresholds for 2012 Oct/Nov, Paper 1 · Variant 1. A higher threshold means an easier paper — the bar moves with how the cohort did.