Cambridge A Level Environmental Management (AS only) 8291 — 2011 May/June Paper 1 · Variant 1
8291/11/M/J/11 · 80 marks · ≈90 min
The question paper and its mark scheme, free to read here and free to download. This is Cambridge’s own paper, exactly as it was sat.
Question paper12 pages
Mark scheme10 pages
Answers below. Sit the paper first if you are practising.
Paper as text
Question paper, page 1
This document consists of 11 printed pages and 1 blank page. DC (LEO/CGW) 34237/4 © UCLES 2011 [Turn over UNIVERSITY OF CAMBRIDGE INTERNATIONAL EXAMINATIONS General Certificate of Education Advanced Subsidiary Level READ THESE INSTRUCTIONS FIRST Write your Centre number, candidate number and name on all the work you hand in. Write in dark blue or black pen. You may use a soft pencil for any diagrams, graphs, tables or rough working. Do not use staples, paper clips, highlighters, glue or correction fluid. DO NOT WRITE IN ANY BARCODES. Section A Answer all questions. Write your answers in the spaces provided on the question paper. Section B Answer one question from this section. Answer the question on the separate answer paper provided. At the end of the examination, 1. fasten all separate answer paper securely to the question paper; 2. enter the question number from Section B in the grid opposite. CANDIDATE NAME CENTRE NUMBER CANDIDATE NUMBER ENVIRONMENTAL MANAGEMENT 8291/11 Paper 1 Lithosphere and Atmosphere May/June 2011 1 hour 30 minutes Additional Materials: Answer Booklet/Paper * 6 3 6 4 8 4 5 2 0 5 * For Examiner’s Use Section A 1 2 Section B Total
Question paper, page 2
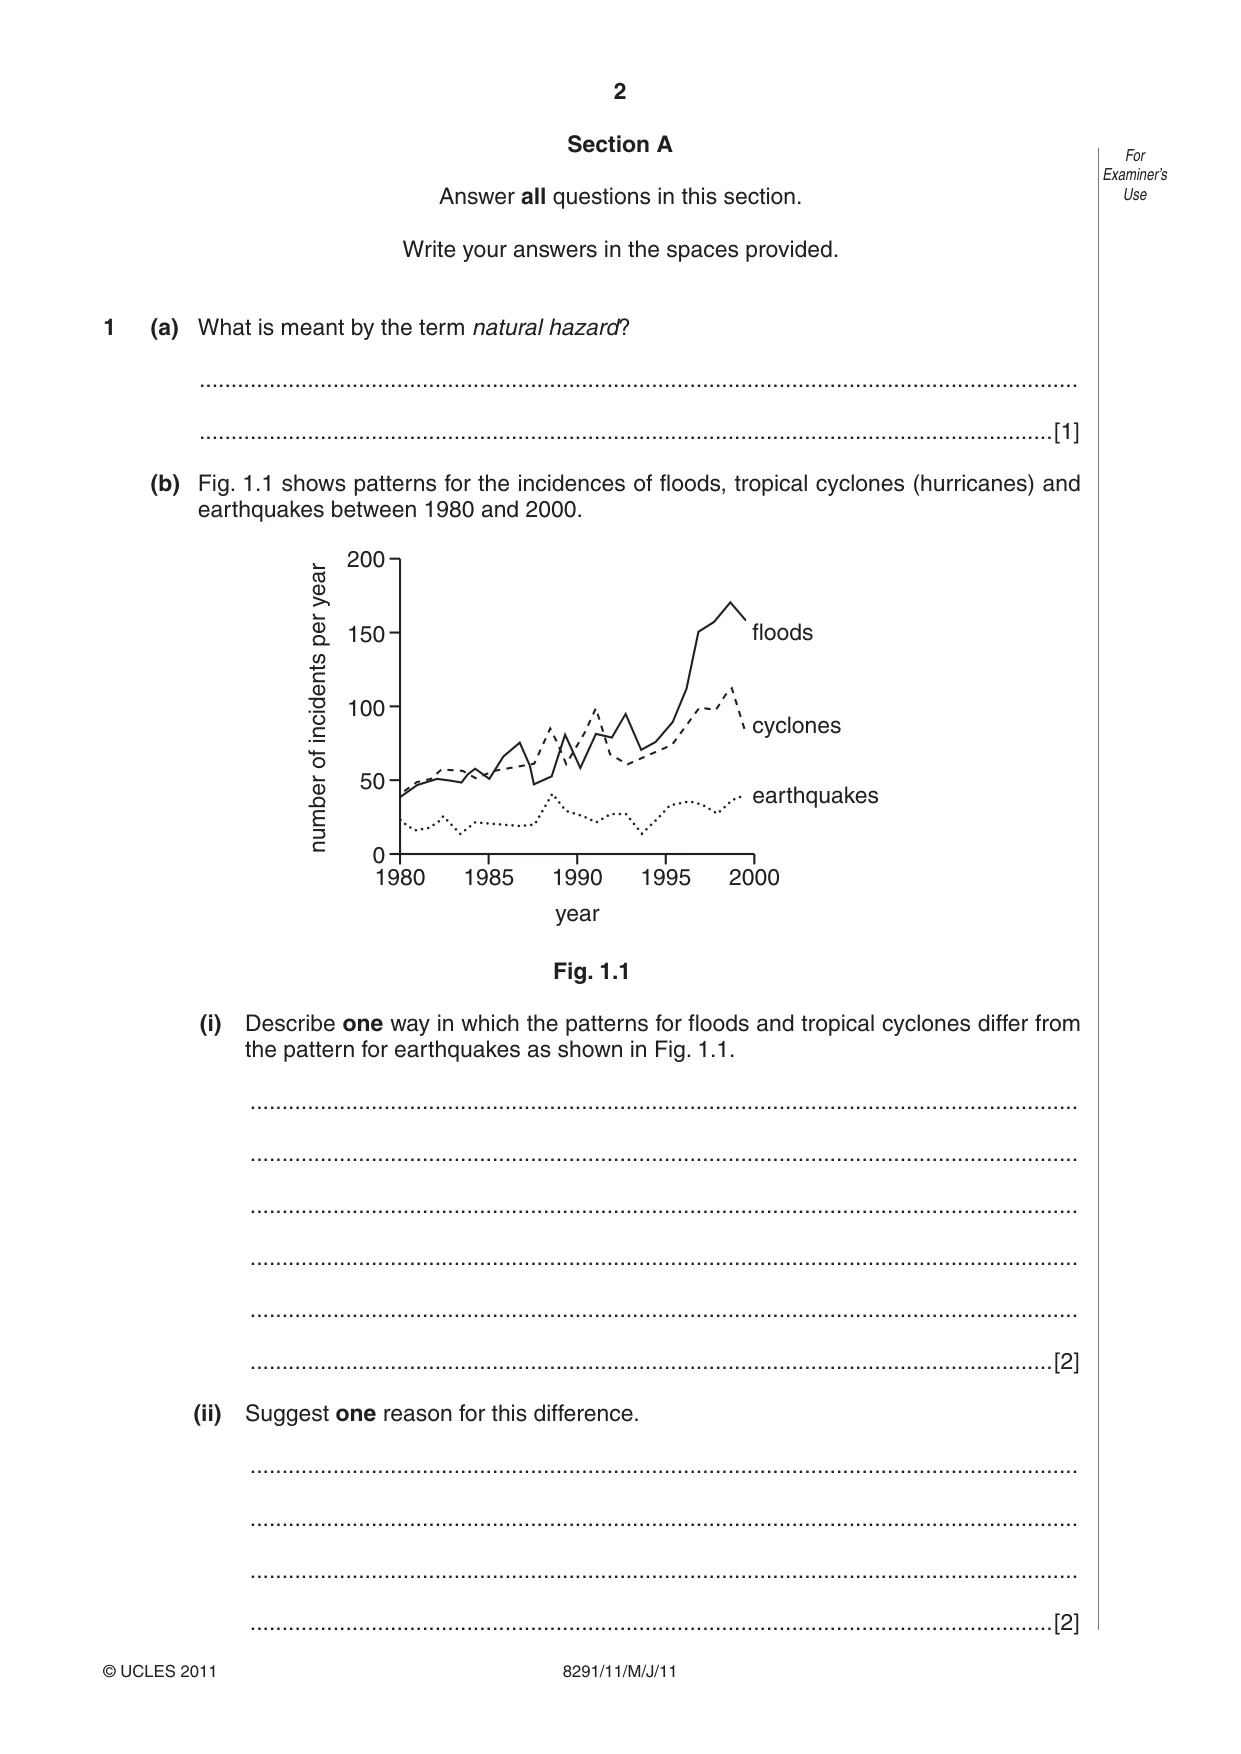
2 8291/11/M/J/11 For Examiner’s Use © UCLES 2011 Section A Answer all questions in this section. Write your answers in the spaces provided. 1 (a) What is meant by the term natural hazard? … …[1] (b) Fig. 1.1 shows patterns for the incidences of floods, tropical cyclones (hurricanes) and earthquakes between 1980 and 2000. 1980 1985 0 50 100 150 200 1990 year number of incidents per year 1995 2000 floods cyclones earthquakes Fig. 1.1 (i) Describe one way in which the patterns for floods and tropical cyclones differ from the pattern for earthquakes as shown in Fig. 1.1. … … … … … …[2] (ii) Suggest one reason for this difference. … … … …[2]
Question paper, page 3
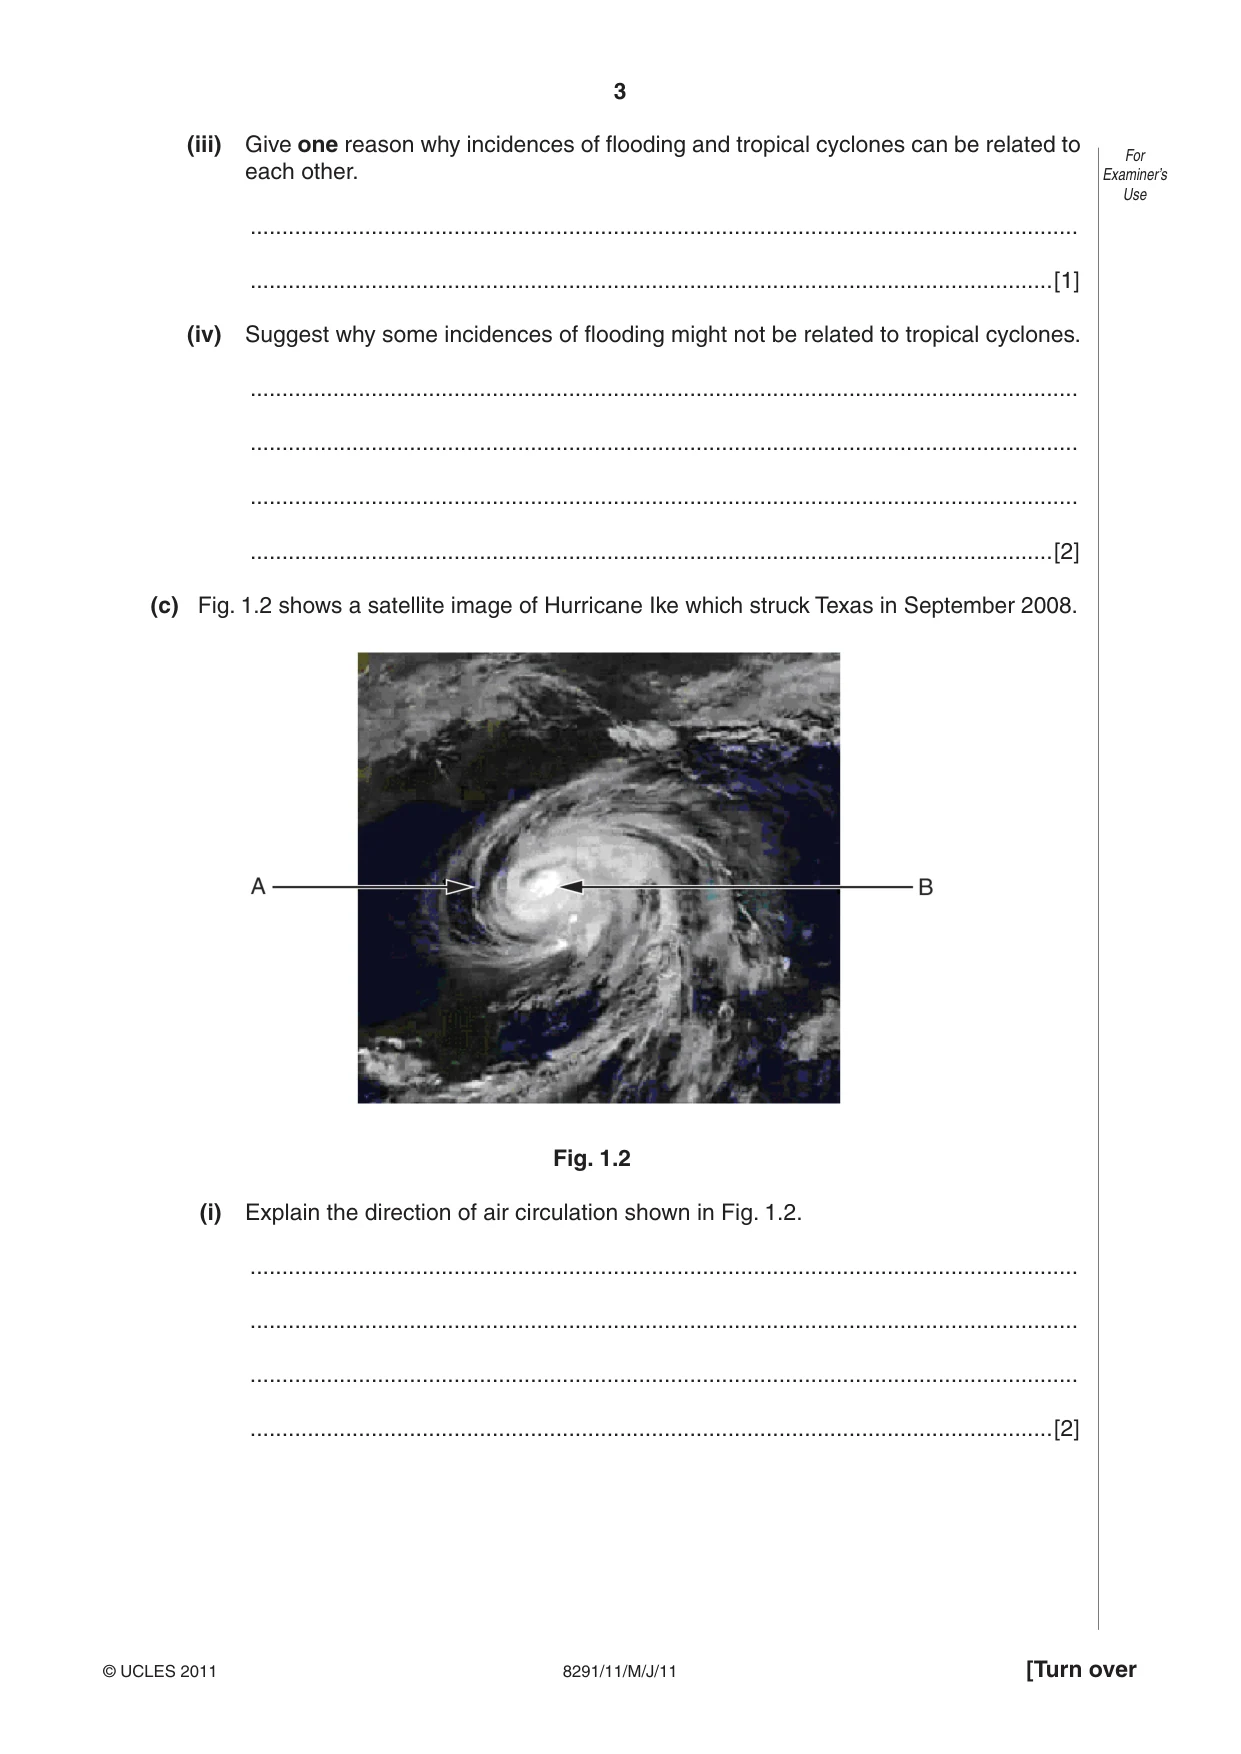
3 8291/11/M/J/11 [Turn over For Examiner’s Use © UCLES 2011 (iii) Give one reason why incidences of flooding and tropical cyclones can be related to each other. … …[1] (iv) Suggest why some incidences of flooding might not be related to tropical cyclones. … … … …[2] (c) Fig. 1.2 shows a satellite image of Hurricane Ike which struck Texas in September 2008. Fig. 1.2 (i) Explain the direction of air circulation shown in Fig. 1.2. … … … …[2]
Question paper, page 4
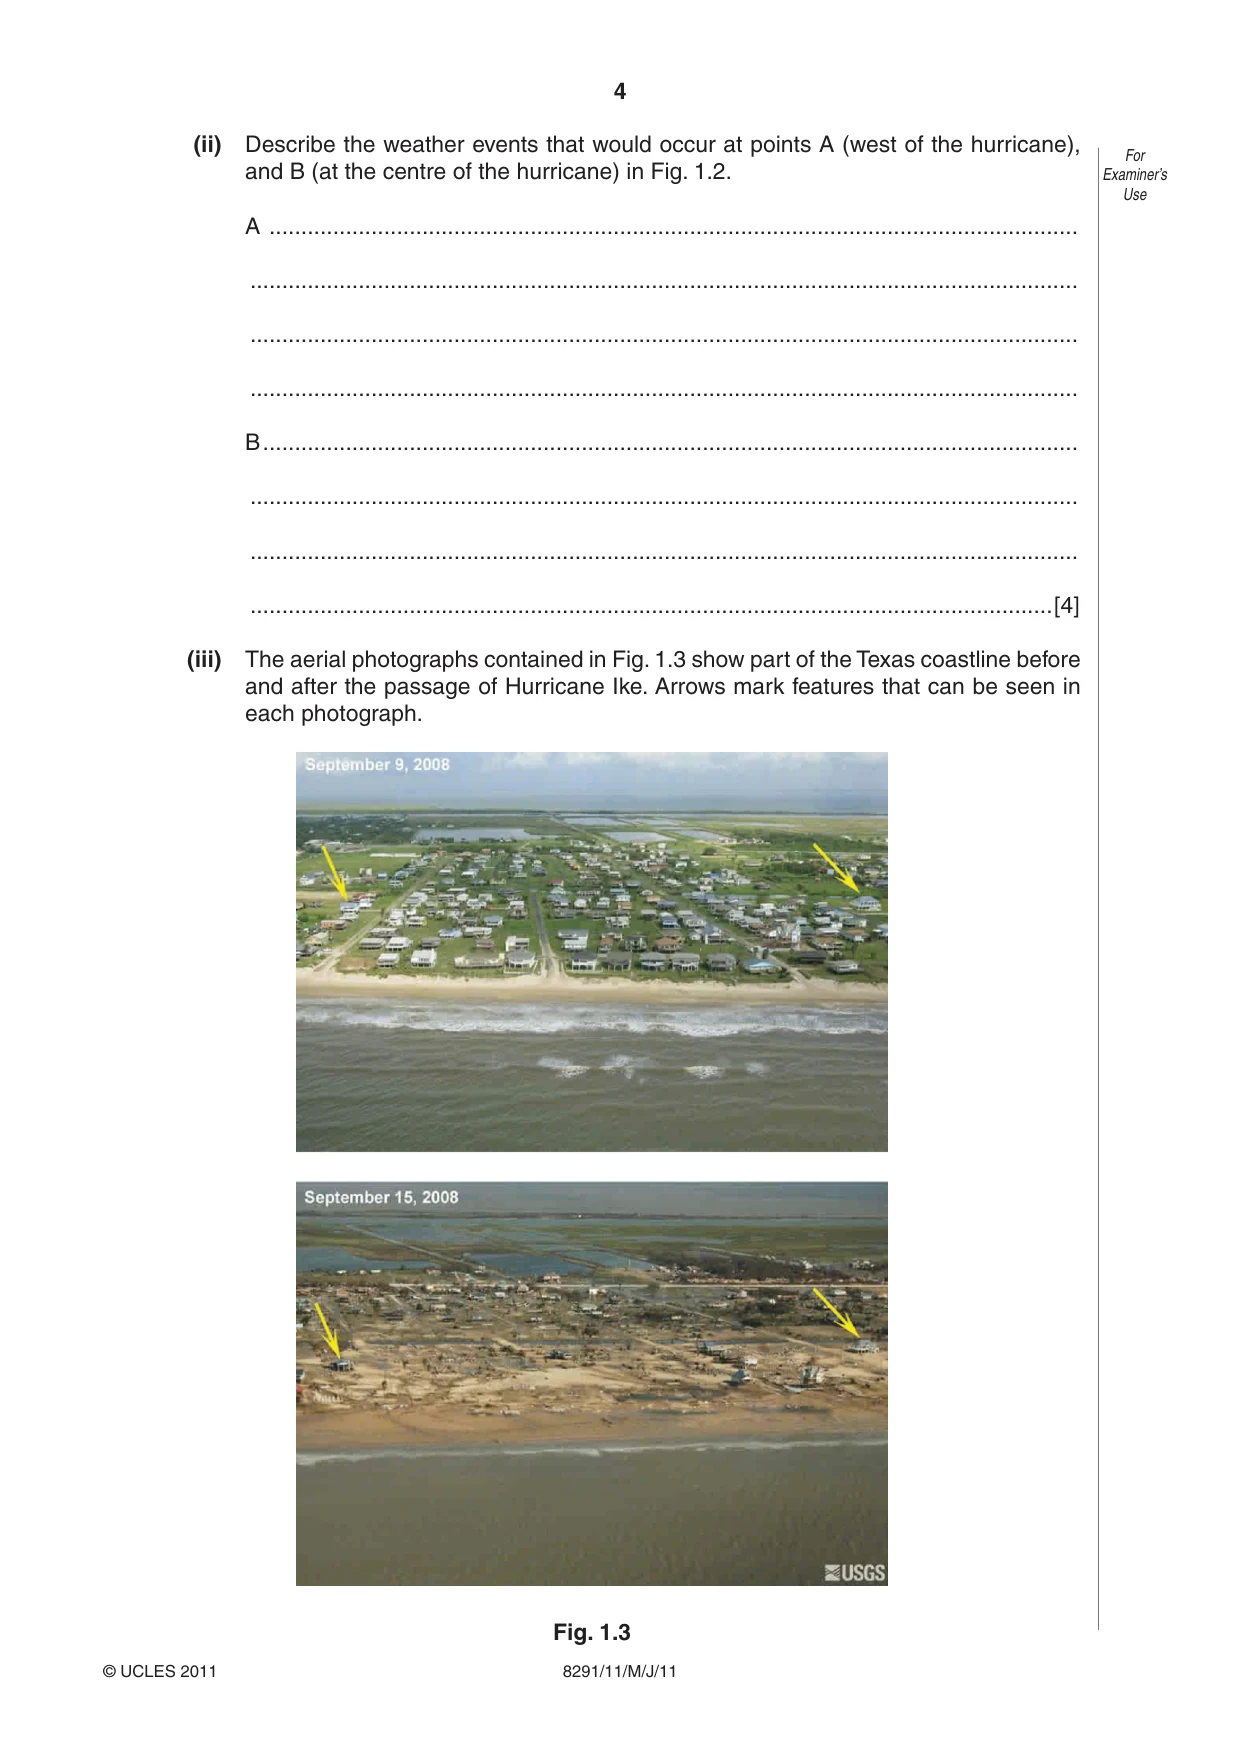
4 8291/11/M/J/11 For Examiner’s Use © UCLES 2011 (ii) Describe the weather events that would occur at points A (west of the hurricane), and B (at the centre of the hurricane) in Fig. 1.2. A … … … … B … … … …[4] (iii) The aerial photographs contained in Fig. 1.3 show part of the Texas coastline before and after the passage of Hurricane Ike. Arrows mark features that can be seen in each photograph. Fig. 1.3
Question paper, page 5
5 8291/11/M/J/11 [Turn over For Examiner’s Use © UCLES 2011 Describe and explain the effects that Hurricane Ike had upon the area shown in Fig. 1.3. … … … … … … … … … … … … …[6] [Total: 20]
Question paper, page 6
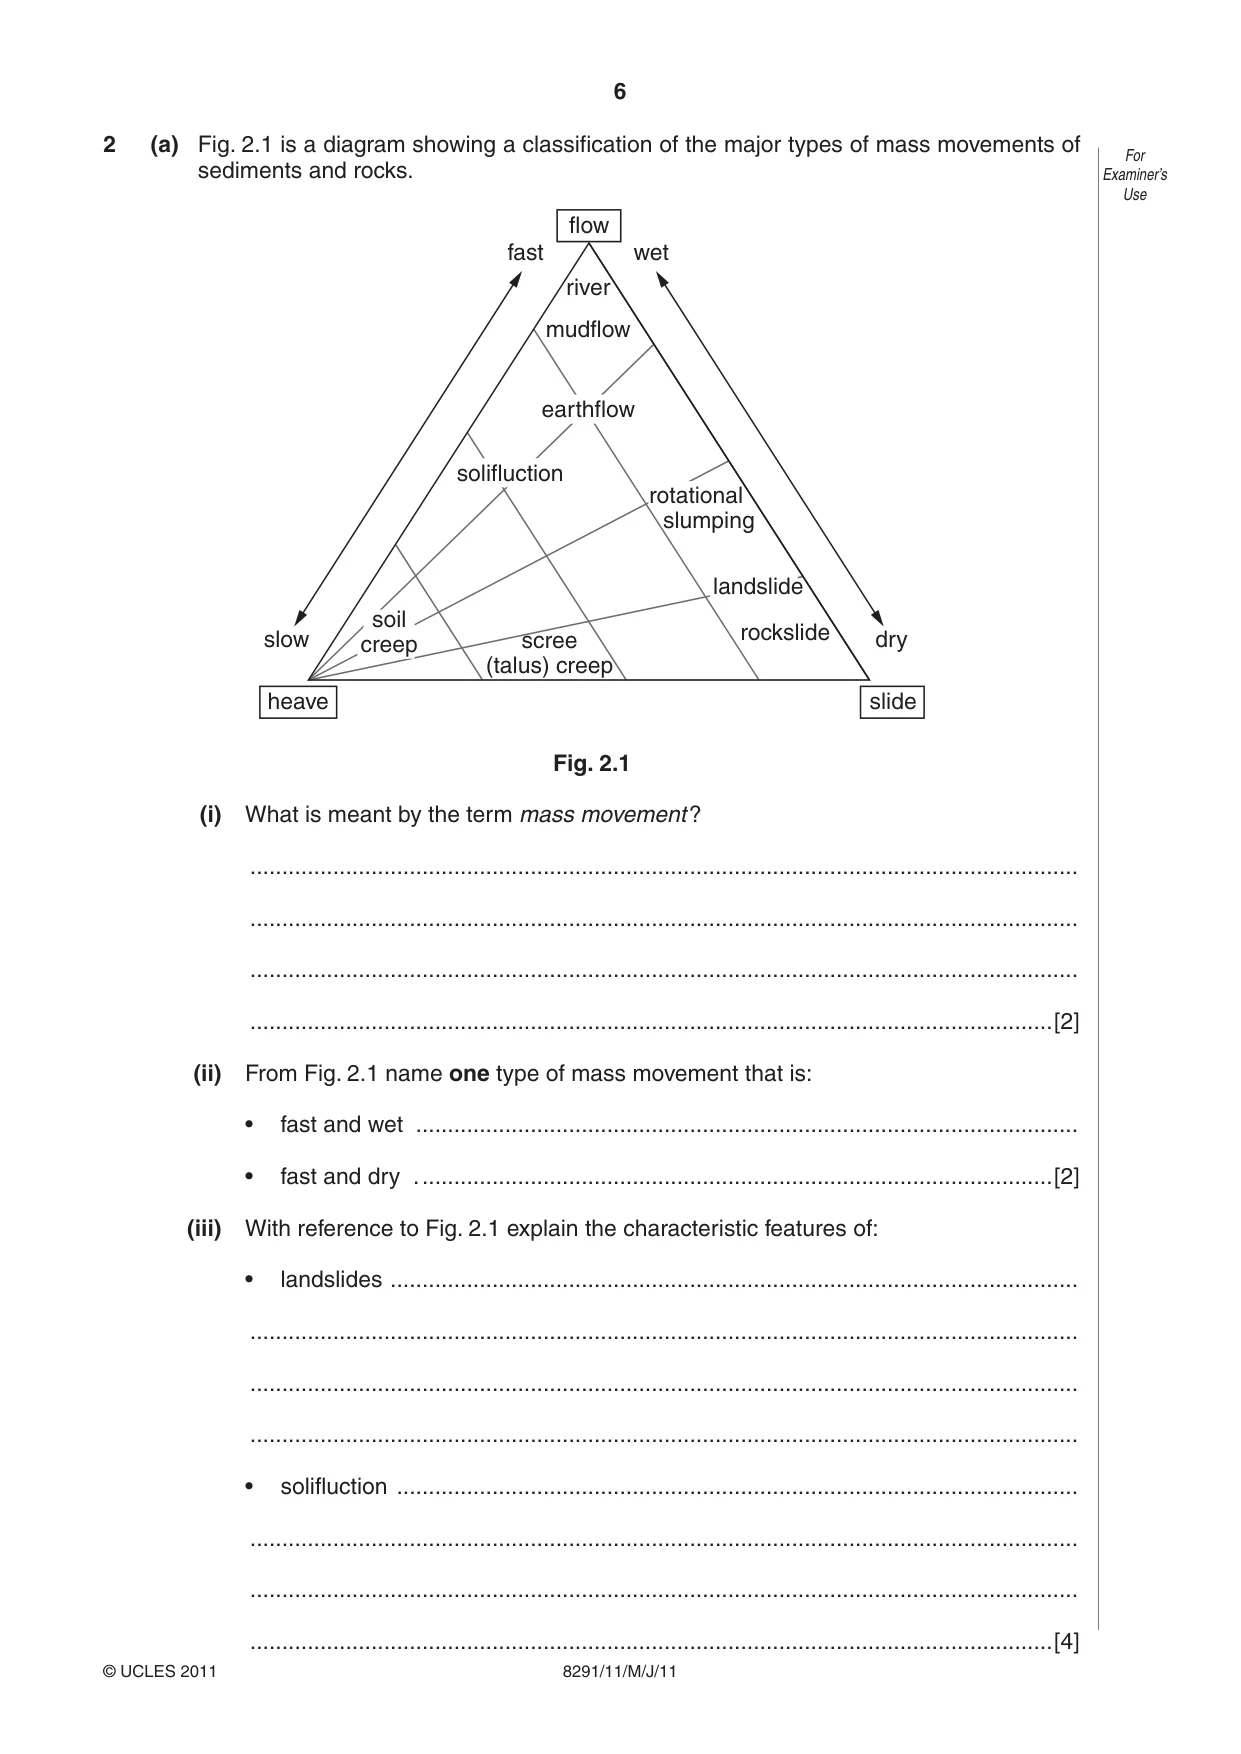
6 8291/11/M/J/11 For Examiner’s Use © UCLES 2011 2 (a) Fig. 2.1 is a diagram showing a classification of the major types of mass movements of sediments and rocks. flow wet fast slow dry slide heave river rockslide mudflow scree (talus) creep solifluction earthflow rotational slumping landslide soil creep Fig. 2.1 (i) What is meant by the term mass movement ? … … … …[2] (ii) From Fig. 2.1 name one type of mass movement that is: • fast and wet … • fast and dry . …[2] (iii) With reference to Fig. 2.1 explain the characteristic features of: • landslides … … … … • solifluction … … … …[4]
Question paper, page 7
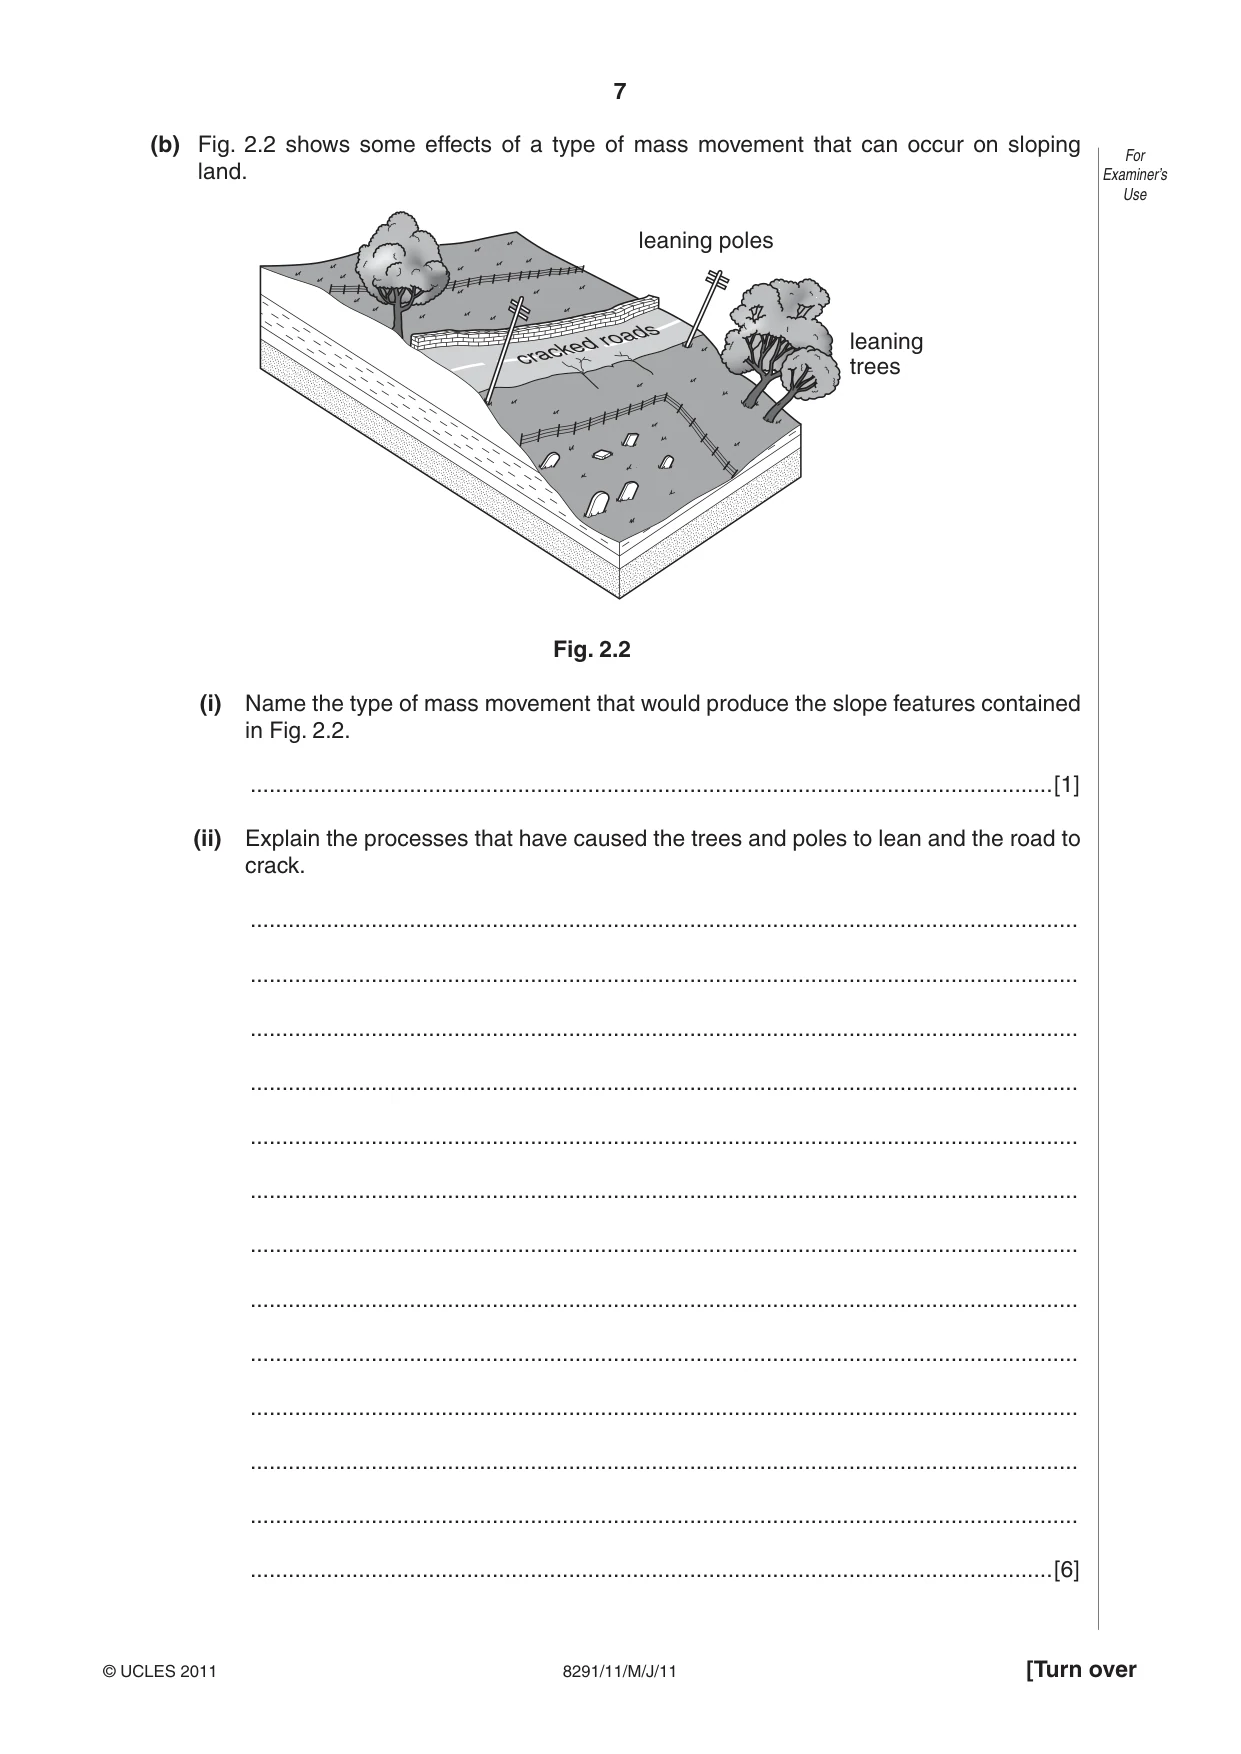
7 8291/11/M/J/11 [Turn over For Examiner’s Use © UCLES 2011 (b) Fig. 2.2 shows some effects of a type of mass movement that can occur on sloping land. leaning poles leaning trees cracked roads Fig. 2.2 (i) Name the type of mass movement that would produce the slope features contained in Fig. 2.2. …[1] (ii) Explain the processes that have caused the trees and poles to lean and the road to crack. … … … … … … … … … … … … …[6]
Question paper, page 8
8 8291/11/M/J/11 For Examiner’s Use © UCLES 2011 (iii) Suggest a management strategy that would help stabilise the slope and keep the road in good condition. … … … … … … … … … … …[5] [Total: 20]
Question paper, page 9
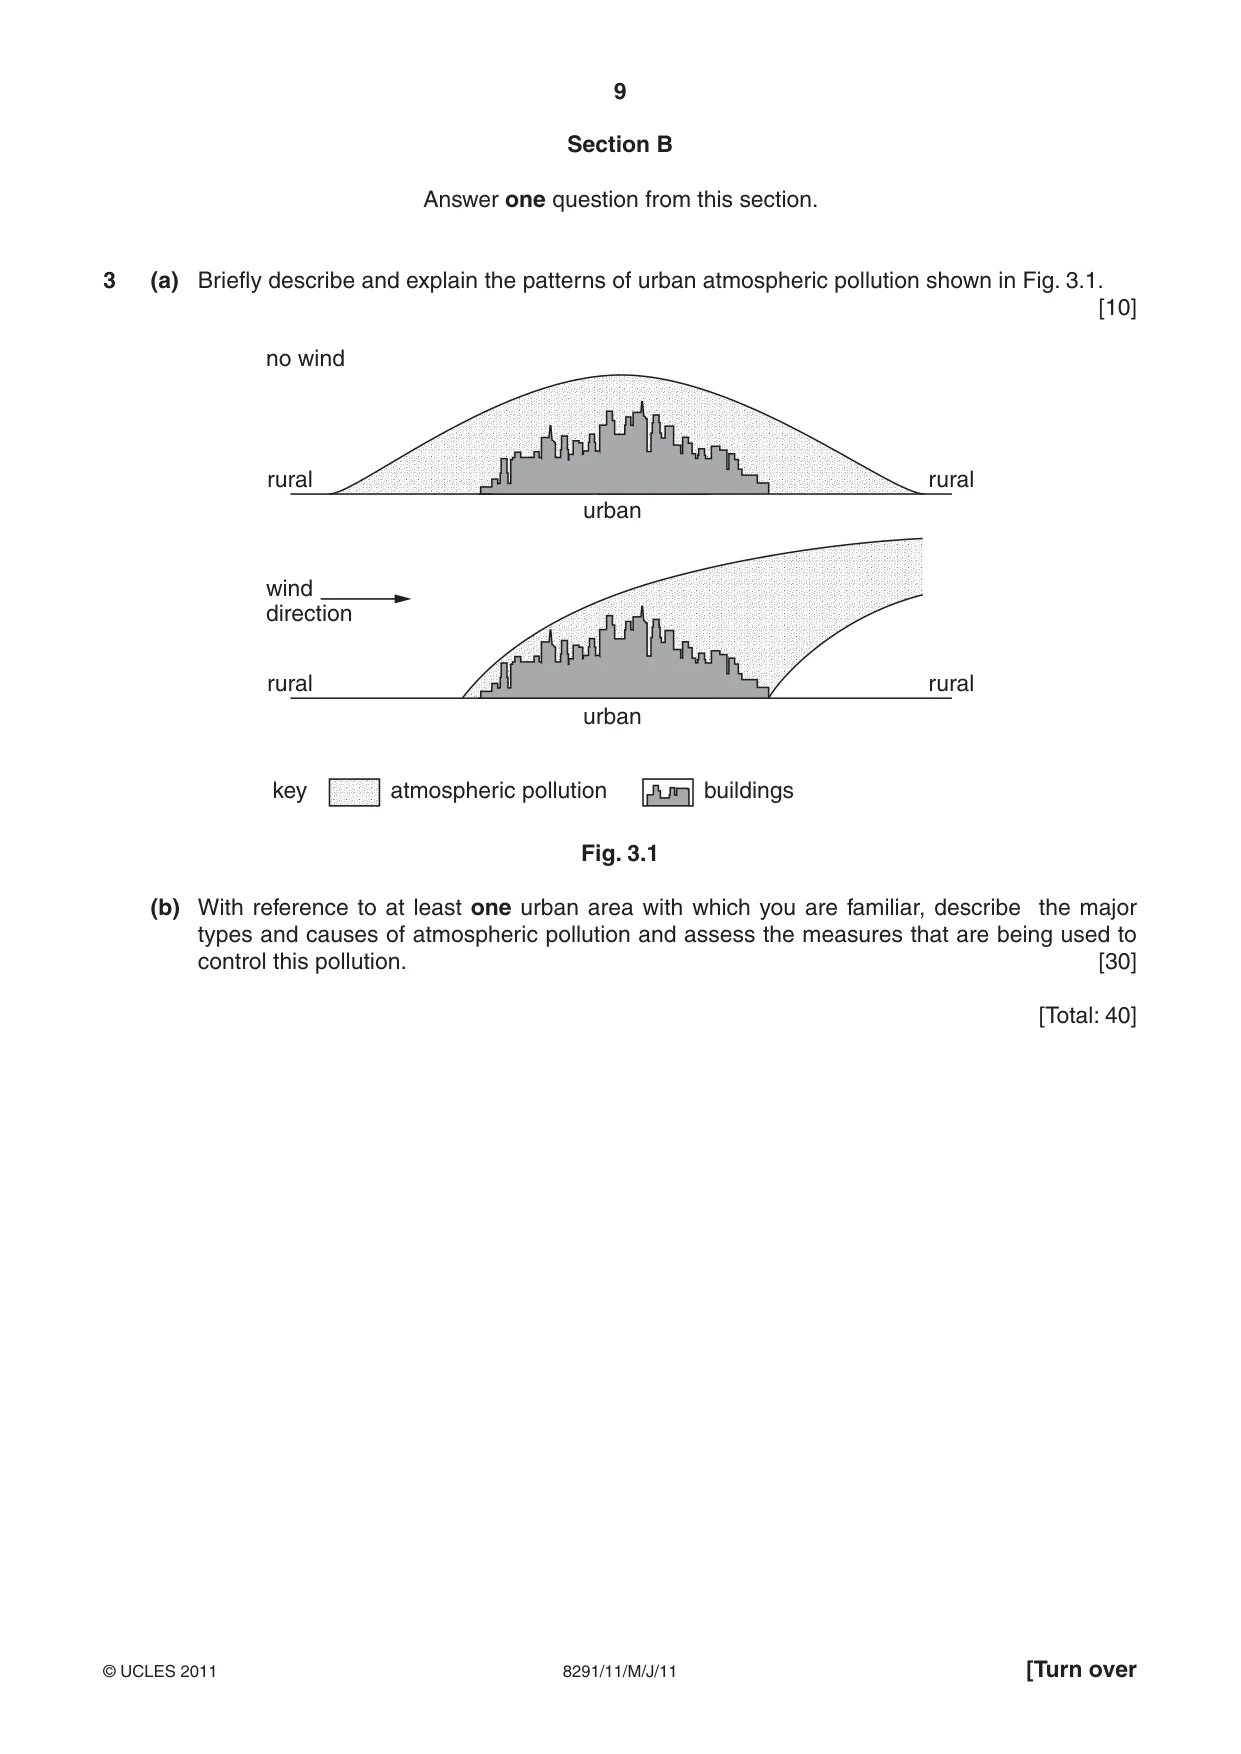
9 8291/11/M/J/11 © UCLES 2011 [Turn over Section B Answer one question from this section. 3 (a) Briefly describe and explain the patterns of urban atmospheric pollution shown in Fig. 3.1. [10] rural no wind wind direction urban urban rural rural key atmospheric pollution rural buildings Fig. 3.1 (b) With reference to at least one urban area with which you are familiar, describe the major types and causes of atmospheric pollution and assess the measures that are being used to control this pollution. [30] [Total: 40]
Question paper, page 10
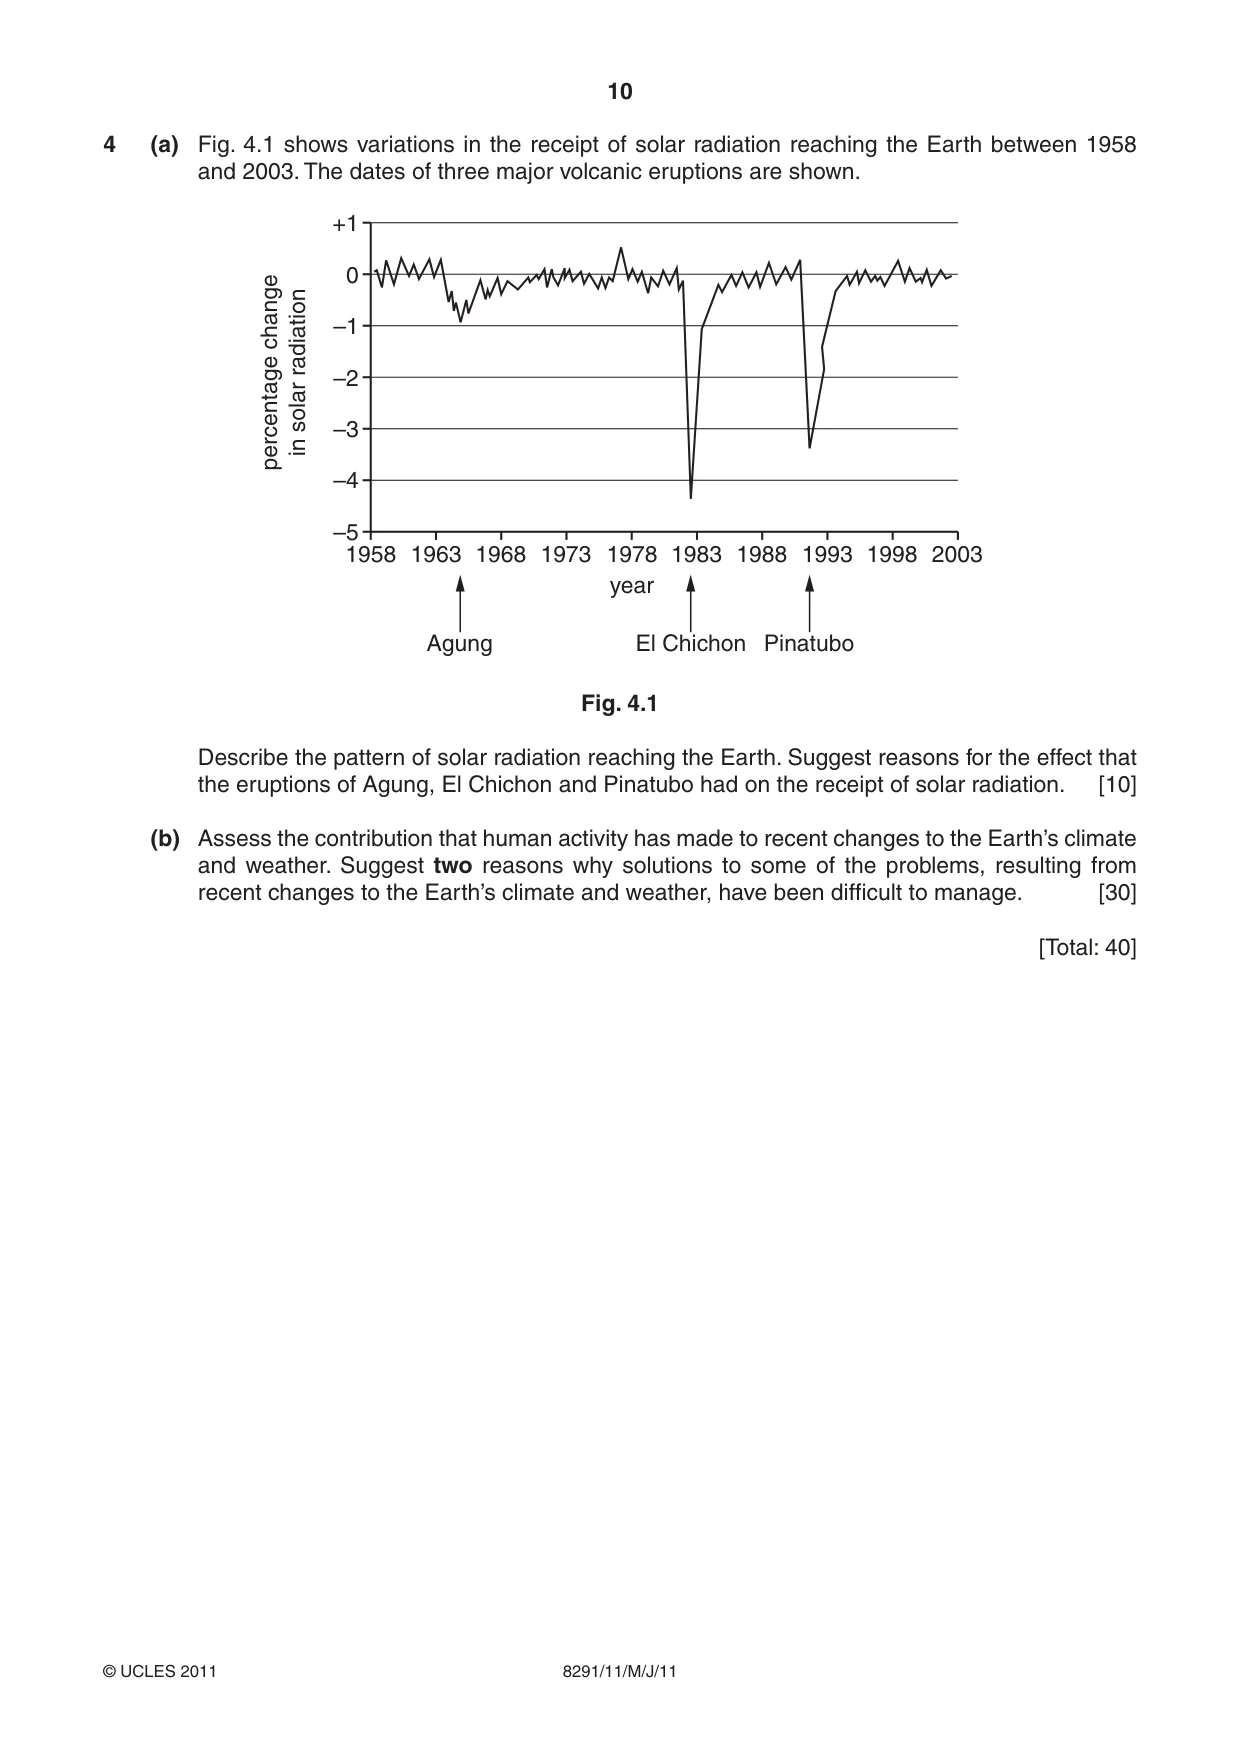
10 8291/11/M/J/11 © UCLES 2011 4 (a) Fig. 4.1 shows variations in the receipt of solar radiation reaching the Earth between 1958 and 2003. The dates of three major volcanic eruptions are shown. 0 1958 1963 1968 1973 Agung El Chichon Pinatubo 1978 year 1983 1988 1993 1998 2003 –1 –2 percentage change in solar radiation –3 –4 +1 –5 Fig. 4.1 Describe the pattern of solar radiation reaching the Earth. Suggest reasons for the effect that the eruptions of Agung, El Chichon and Pinatubo had on the receipt of solar radiation. [10] (b) Assess the contribution that human activity has made to recent changes to the Earth’s climate and weather. Suggest two reasons why solutions to some of the problems, resulting from recent changes to the Earth’s climate and weather, have been difficult to manage. [30] [Total: 40]
Question paper, page 11
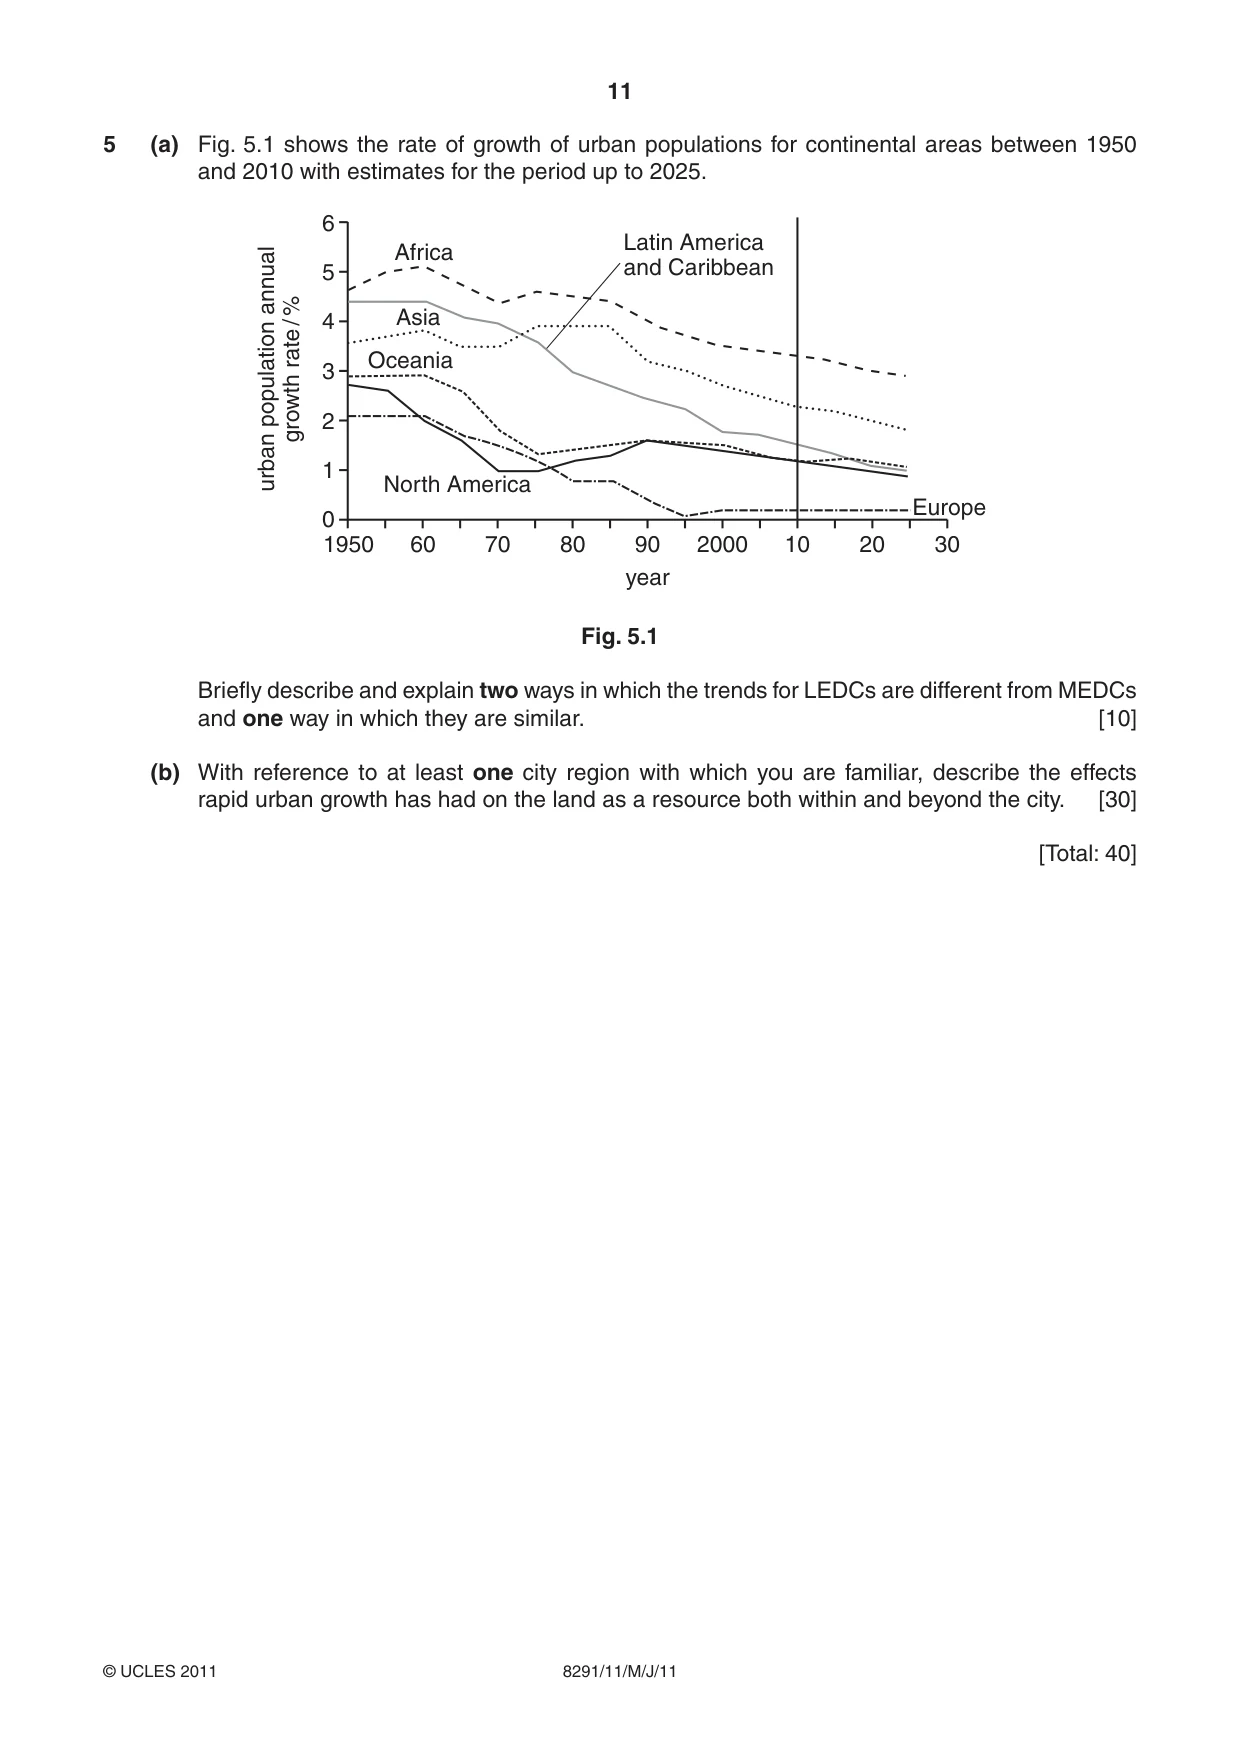
11 8291/11/M/J/11 © UCLES 2011 5 (a) Fig. 5.1 shows the rate of growth of urban populations for continental areas between 1950 and 2010 with estimates for the period up to 2025. 6 5 4 3 2 1 urban population annual growth rate / % 0 1950 30 20 10 2000 90 year 80 70 60 Europe Africa Asia Oceania North America Latin America and Caribbean Fig. 5.1 Briefly describe and explain two ways in which the trends for LEDCs are different from MEDCs and one way in which they are similar. [10] (b) With reference to at least one city region with which you are familiar, describe the effects rapid urban growth has had on the land as a resource both within and beyond the city. [30] [Total: 40]
Question paper, page 12
12 8291/11/M/J/11 © UCLES 2011 BLANK PAGE Copyright Acknowledgements: Question 1(c) Fig. 1.2 © Photograph of Hurricane Ike ; Die Welt; www.welt.de/english.news/article2427494/Texas. Question 1(c) Fig. 1.3 © Aerial Photographs (Texas); USGS; www.geology.com. Permission to reproduce items where third-party owned material protected by copyright is included has been sought and cleared where possible. Every reasonable effort has been made by the publisher (UCLES) to trace copyright holders, but if any items requiring clearance have unwittingly been included, the publisher will be pleased to make amends at the earliest possible opportunity. University of Cambridge International Examinations is part of the Cambridge Assessment Group. Cambridge Assessment is the brand name of University of Cambridge Local Examinations Syndicate (UCLES), which is itself a department of the University of Cambridge.
Mark scheme, page 1
UNIVERSITY OF CAMBRIDGE INTERNATIONAL EXAMINATIONS GCE Advanced Subsidiary Level MARK SCHEME for the May/June 2011 question paper for the guidance of teachers 8291 ENVIRONMENTAL MANAGEMENT 8291/11 Paper 1, maximum raw mark 80 This mark scheme is published as an aid to teachers and candidates, to indicate the requirements of the examination. It shows the basis on which Examiners were instructed to award marks. It does not indicate the details of the discussions that took place at an Examiners’ meeting before marking began, which would have considered the acceptability of alternative answers. Mark schemes must be read in conjunction with the question papers and the report on the examination. • Cambridge will not enter into discussions or correspondence in connection with these mark schemes. Cambridge is publishing the mark schemes for the May/June 2011 question papers for most IGCSE, GCE Advanced Level and Advanced Subsidiary Level syllabuses and some Ordinary Level syllabuses.
Mark scheme, page 2
Page 2 Mark Scheme: Teachers’ version Syllabus Paper GCE AS LEVEL – May/June 2011 8291 11 © University of Cambridge International Examinations 2011 Section A Answer all questions in this section. 1 (a) What is meant by the term natural hazard? [1] A natural feature that has the potential to be a hazard such as a flood plain, an active fault line or cause a disaster such as a hurricane, earthquake or volcano. Credit sole use of examples. (b) Fig. 1.1 shows patterns for the incidences of floods, tropical cyclones (hurricanes) and earthquakes between 1980 and 2000. (i) Describe one way in which the patterns for floods and tropical cyclones differ from the pattern for earthquakes. [2] Earthquakes fluctuate at a low level (1 mark) but floods and cyclones fluctuate at a high level and have shown an accelerating frequency. (1 mark) (ii) Suggest one reason for this difference. [2] Climatic processes are more variable and change more frequently (1 mark), than the tectonic processes that produce earthquakes. (1 mark) (iii) Give one reason why incidences of flooding and tropical cyclones can be related to each other. [1] Cyclones (temperate or tropical) produce high precipitation thereby increasing the likelihood of flooding (iv) Suggest why some incidences of flooding might not be related to tropical cyclones. [2] Flooding is also related to factors other than precipitation (1 mark); such events as excessive snow melt, building construction, deforestation, etc can contribute to flooding (1 mark).
Mark scheme, page 3
Page 3 Mark Scheme: Teachers’ version Syllabus Paper GCE AS LEVEL – May/June 2011 8291 11 © University of Cambridge International Examinations 2011 (c) Fig. 1.2 shows a satellite image of Hurricane Ike which struck Texas in September 2008. (i) Explain the direction of air circulation shown in Fig. 1.2. [2] Credit 1 mark for direction and one for explanation. • direction = anticlockwise • reason = Coriolis force or equivalent (ii) Describe the weather events that would occur at points A and B in Fig. 1.2. [4] A: to the front of the storm (1 mark) very strong winds, sometimes in bands from the north with cloud cover and storm intensity increasing. Credit other valid points (1 mark). Award 1 mark for very brief statements such as strong winds and rain. B: the eye of the storm, clear skies, no wind, descending air at its rim. Credit cold descending air at the edge of the eye; as the letter B covers more than the eye, credit weather conditions just beyond its rim. (iii) The aerial photographs contained in Fig. 1.3 shows part of the Texas coastline before and after the passage of Hurricane Ike. Arrows mark features that can be seen in each photograph. Describe and explain the effects that Hurricane Ike had upon the area shown. [6] There are 6 marks of which a maximum of 3 should be for description and up to 4 for explanation. i.e. up to 3/3 or 2/4 Description will refer to the narrow beach, grassed area with homes and lakes in the background. Explanation should refer to onshore winds and the storm surge across low lying land; thus a new landscape of sand washed ashore, homes destroyed and extensive flooding in the background. [Total: 20]
Mark scheme, page 4
Page 4 Mark Scheme: Teachers’ version Syllabus Paper GCE AS LEVEL – May/June 2011 8291 11 © University of Cambridge International Examinations 2011 2 (a) Fig. 2.1 shows a classification of the major types of mass movement of sediment and rocks. (i) What is meant by the term mass movement? [2] A large or small scale movement of dry to wet sediment on a slope; or due to gravity (ii) From Fig. 2.1 name one type of mass movement that is: [2] • fast and wet: mudflows/earthflows/rivers • fast and dry: rockslide/landslide (iii) With reference to Fig. 2.1 explain the characteristic features of: [4] • landslides: due to steep slope dry debris is able to overcome the frictional adhesion to the surface; such movements can be triggered. • solifluction: a wet movement of debris along a frozen surface; can occur on very gentle slopes due to lubrication. (b) Fig. 2.2 shows some effects of a type of mass movement that can occur on sloping land. (i) Name the type of mass movement that would produce the slope features contained in Fig. 2.2. [1] soil creep. (ii) Explain the processes that have caused the trees and poles to lean and the road to crack. [6] Soil creep requires: slope and gravity, soil (can have vegetation) and lubrication (1 mark), alternate wet and dry periods and freeze thaw causing alternate expansion and contraction; both allowing the regolith to move downslope (3 marks). trees bend as their base is turned downslope and roads crack as the downslope edge of the road collapses (2 marks) (iii) Suggest a management strategy that would help stabilise the slope and keep the road in good condition. [5] For full marks candidates must show that slope stability and the condition of the road are linked (1 mark); then two marks for each. slope stabilisation: more vegetation as roots bind the soil together: slope reinforcement using wire mesh, gabions, artificial terracing. road conditions: supporting the downslope side; constant repairs, treating the road as part of the whole slope solution, slope drainage both sides of the road. [Total: 20]
Mark scheme, page 5
Page 5 Mark Scheme: Teachers’ version Syllabus Paper GCE AS LEVEL – May/June 2011 8291 11 © University of Cambridge International Examinations 2011 Section B Answer one question from this section. 3 (a) Briefly describe and explain the patterns of urban atmospheric pollution shown in Fig. 3.1. [10] upper diagram, on windless days urban pollutants collect as a dome above the city, the dome shallows in all directions away from the city centre where there are fewer sources of pollution; it peaks over central parts of the city due to the heat island effect (air rises); lower diagram, wind from the west carries the air over the city towards the east; producing a shallow gradient in the west and an atmospheric haze to the east. 8 to 10 mark answers will give full consideration to the shape of the pollution dome combining accurate description with explanation. 4 to 7 mark answers may be brief, lack explanatory detail, reference to shape or have poor balance. 1 to 3 mark answers will be brief and express little understanding of the effect and why. (b) With reference to at least one urban area with which you are familiar, describe the major types and causes of atmospheric pollution and assess the measures that are being used to reduce this pollution. [30] This question should give candidates the opportunity to develop an example that is local to them. The question requirements are: • select appropriate urban areas; full marks can be achieved with one very well developed example. • describe the major causes of atmospheric pollution: traffic, industry, noise, domestic plus ‘imported pollution’ • these causes should be linked to the types of pollution: carbon monoxide, carbon dioxide, particulates, nitrogen oxides, ozone, etc. • measures can be drawn from: cleaner fuels, traffic management, park and ride schemes, creating parks, wider roads; whatever has been developed in the chosen example. • the level of success or failure of the measure i.e. assessment Band 1 answers will satisfy all question requirements as related to their example. There will be a clear link between cause and types. The measures will be described and assessed. (25–30) Band 3 answers may be more general in coverage and linkages between cause and type will be loose or tenuous. Measures if described may lack assessment. (13–18) Band 4 answers will be relevant but brief and may dwell on causes without reference to types. Measures will be briefly described and not assessed. (6–12) [Total: 40]
Mark scheme, page 6
Page 6 Mark Scheme: Teachers’ version Syllabus Paper GCE AS LEVEL – May/June 2011 8291 11 © University of Cambridge International Examinations 2011 4 (a) Fig. 4.1 shows variations in the receipt of solar radiation reaching the Earth between 1958 and 2003. The dates of three major volcanic eruptions are shown. Describe the pattern of solar radiation reaching the Earth. Suggest reasons for the effect that the eruptions of Agung, El Chichon and Pinatubo had on the receipt of solar radiation. [10] The main features are: • solar radiation fluctuates either side of the bench mark 0, • three dips in the line correspond to volcanic eruptions with Pinatubo and El Chichon reaching –4, • volcanic ash reduces the amount of solar radiation reaching the Earth’s surface, • Agung, El Chichon and Pinatubo were major volcanic eruptions involving pyroclastic flows and vast quantities of ash reaching the upper troposphere and stratosphere. It then spread to cover large areas of the Earth. 8 to 10 mark answers will consider all bullet points and make clear reference to the data. 4 to 7 mark answers will be descriptively secure but fail to assess the data in terms of the scale of the volcanic eruptions. 1 to 3 marks will make a brief description, will be vague and not point out the special features of the quoted volcanoes. (b) Assess the contribution that human activity has made to recent changes to the Earth’s climate and weather. Suggest two reasons why solutions to some of the problems, resulting from recent changes to the Earth’s climate and weather, have been difficult to manage. [30] The question suggests that human activity has made a significant contribution to recent climatic change. However the hint provided in part (a) should suggest to candidates that other factors influence Earth’s weather and climate. Additionally climatic change may not just mean global warming. The question requires: • an assessment of the contribution of human activity through: greenhouse gases, deforestation; references should be made to carbon dioxide and methane i.e. the knock- on effect. • references to data on climatic change including enhanced global warming, increases in drought and seasonal change. • references to changes in the weather: increased storm intensity, unusual temperature peaks (Greece). • some assessment of other possible causes of change: sunspots, volcanic activity, natural cycles. • two reasons why solutions have been difficult to manage: the scale of the issue, politics, economic commitments and priorities, MEDC and LEDC policies. Band 1 answers will contain a clear, informed and balanced assessment of the contribution of human activity. There will be reference to the above requirements with at least three well developed. (25–30) Band 3 answers will contain less assessment and probably ignore alternatives to human activity. The management of the issue will amount to one or two very briefly stated points. (13–18) Band 4 answers will be brief and descriptive. There will be little assessment and management almost ignored. (6–12) [Total: 40]
Mark scheme, page 7
Page 7 Mark Scheme: Teachers’ version Syllabus Paper GCE AS LEVEL – May/June 2011 8291 11 © University of Cambridge International Examinations 2011 5 (a) Fig. 5.1 shows the rate of growth of urban populations for continental areas between 1950 and 2010 with estimates for the period up to 2025. Briefly describe and explain two ways in which the trends for LEDCs are different to MEDCs and one way in which they are similar. [10] Notionally credit 5/6 marks for the differences and 5/4 for the similarities. Differences: Africa, Latin America and Asia occupy high position, indicating rapid urbanisation; rural-urban migration; push and pull factors attracting people to the cities. MEDCs urbanised earlier with the industrial revolution therefore recent and current rates are lower. Other differences could just focus on the different periods when the decline began. Similarities are that all are showing a decline in urbanisation that from 2000 has started to level off. Rural-urban migration is less and the slower rise in urban population is due to births and greater life expectancy. 8 to 10 mark answers should be well balanced; contain both description and explanation with the best answers (9/10) using data from Fig. 5.1. 4 to 7 mark answers will be less well balanced and whilst descriptive explanations will be weak. 1 to 3 mark answers may only get as far as description and have poor balance. (b) With reference to at least one city region with which you are familiar, describe the effects rapid urban growth has had on the land as a resource both within and beyond the city. [30] The requirements of this question are to: • select a city, • express knowledge of the city in terms of the region within its boundaries and the area beyond its limits, • describe how urban growth has affected the area within, • describe how urban growth has affected the area beyond. The effects of urban growth in MEDCs will be different to LEDCs; the following indicative content should be applied as is appropriate: The area within may: experience congestion (traffic and people); housing pressures, increased pollution, strains on urban services (waste disposal, water supply, municipal neglect), new transport routes, etc. Positives will include modern construction to cope with the population increase (building, transport, services). The area beyond will experience: loss of non-urban land, abandoned settlements, new urban development (urban sprawl), industrial and transport development (airports), loss of agricultural land and food production. Positives may include: counter-urbanisation policies (new towns, rural investment, green belt etc).
Mark scheme, page 8
Page 8 Mark Scheme: Teachers’ version Syllabus Paper GCE AS LEVEL – May/June 2011 8291 11 © University of Cambridge International Examinations 2011 Band 1 answers will satisfy the four question requirements with a clear and developed relationship between the growth of the urban region and its problems. At this level there will be good use of exemplar material for which there are some positive effects rather than all negatives. (25–30) Band 3 answers will be relevant but either lack detail or be poorly balanced. Answers may focus on negatives and the link between the issues and urban growth may be tenuous. (13–18) Band 4 answers will be brief and be unclear about the negative and positive effects of urban growth. Other answers may contain relevance but lack a link with the example. (6–12) [Total: 40]
Mark scheme, page 9
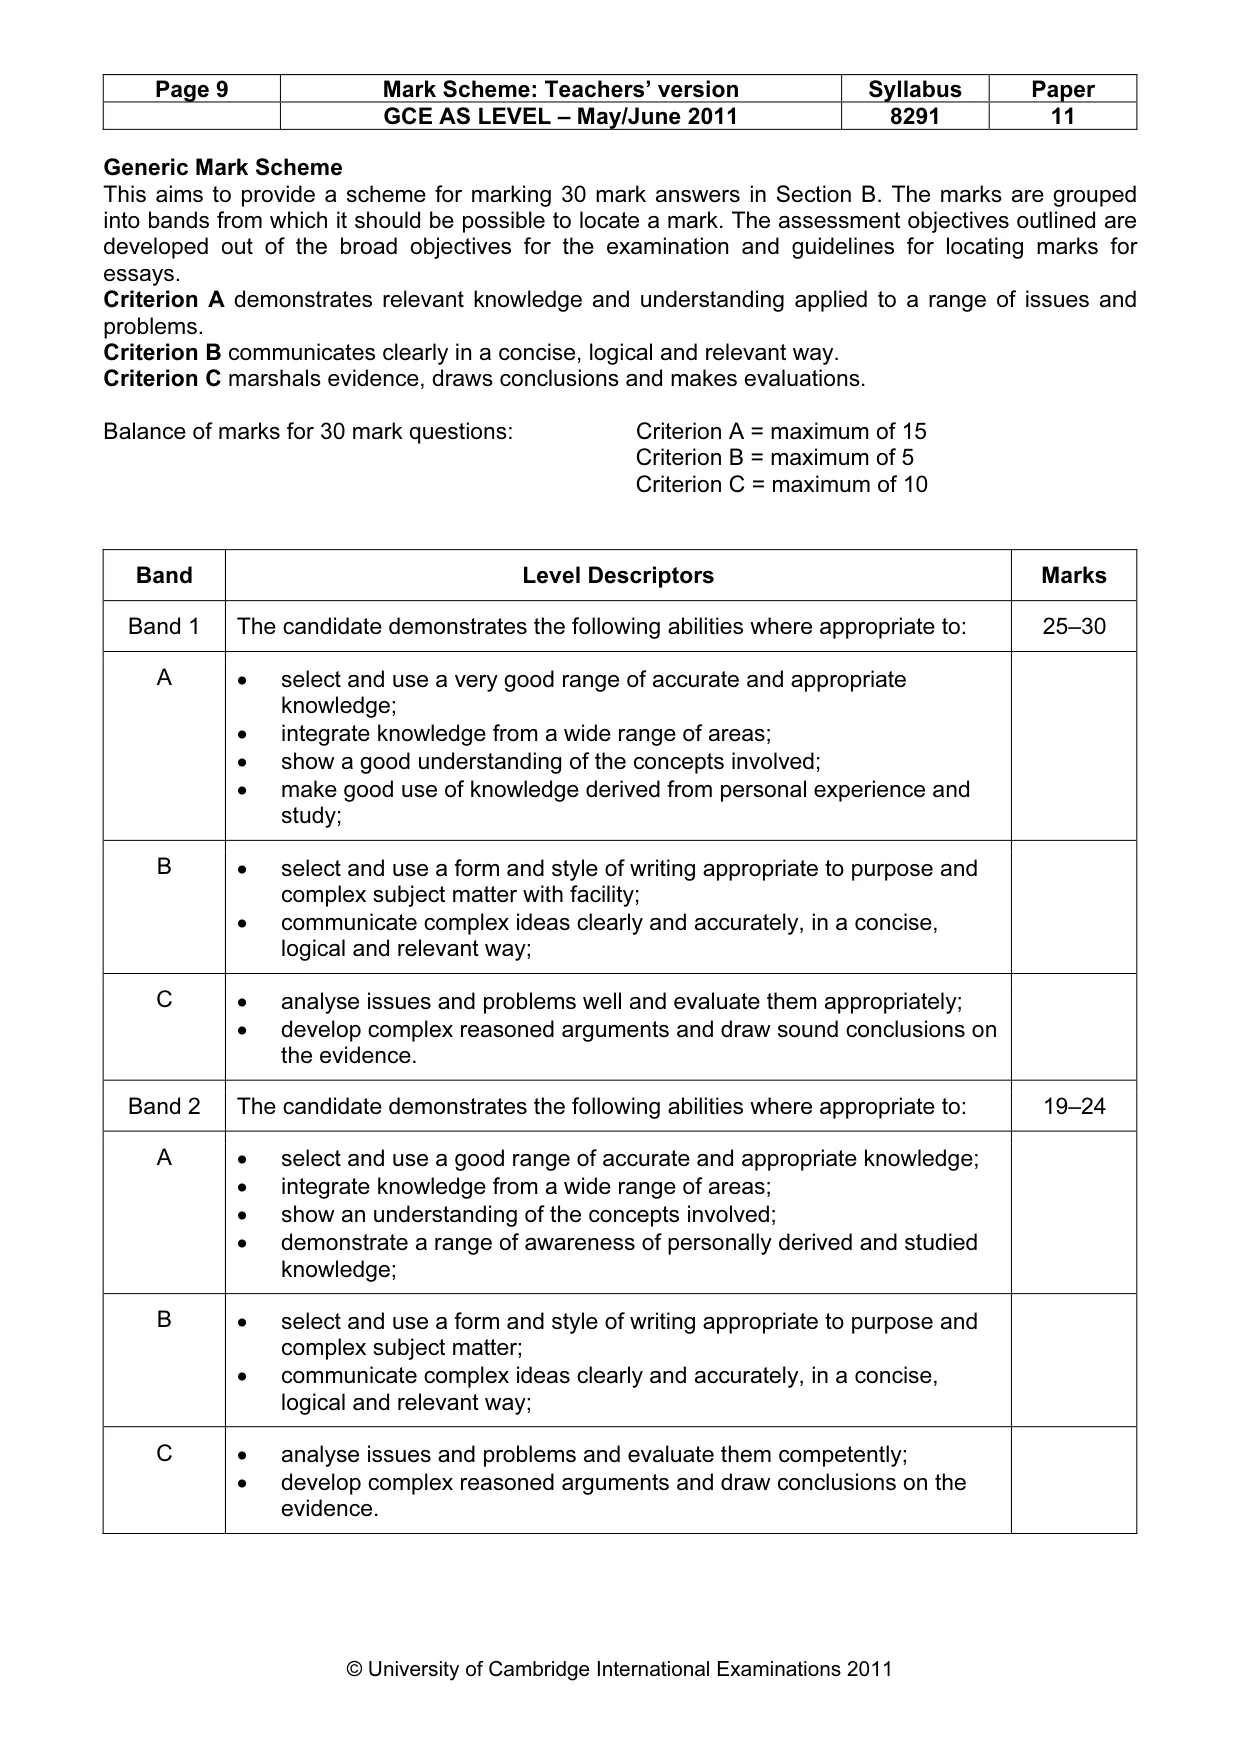
Page 9 Mark Scheme: Teachers’ version Syllabus Paper GCE AS LEVEL – May/June 2011 8291 11 © University of Cambridge International Examinations 2011 Generic Mark Scheme This aims to provide a scheme for marking 30 mark answers in Section B. The marks are grouped into bands from which it should be possible to locate a mark. The assessment objectives outlined are developed out of the broad objectives for the examination and guidelines for locating marks for essays. Criterion A demonstrates relevant knowledge and understanding applied to a range of issues and problems. Criterion B communicates clearly in a concise, logical and relevant way. Criterion C marshals evidence, draws conclusions and makes evaluations. Balance of marks for 30 mark questions: Criterion A = maximum of 15 Criterion B = maximum of 5 Criterion C = maximum of 10 Band Level Descriptors Marks Band 1 The candidate demonstrates the following abilities where appropriate to: 25–30 A • select and use a very good range of accurate and appropriate knowledge; • integrate knowledge from a wide range of areas; • show a good understanding of the concepts involved; • make good use of knowledge derived from personal experience and study; B • select and use a form and style of writing appropriate to purpose and complex subject matter with facility; • communicate complex ideas clearly and accurately, in a concise, logical and relevant way; C • analyse issues and problems well and evaluate them appropriately; • develop complex reasoned arguments and draw sound conclusions on the evidence. Band 2 The candidate demonstrates the following abilities where appropriate to: 19–24 A • select and use a good range of accurate and appropriate knowledge; • integrate knowledge from a wide range of areas; • show an understanding of the concepts involved; • demonstrate a range of awareness of personally derived and studied knowledge; B • select and use a form and style of writing appropriate to purpose and complex subject matter; • communicate complex ideas clearly and accurately, in a concise, logical and relevant way; C • analyse issues and problems and evaluate them competently; • develop complex reasoned arguments and draw conclusions on the evidence.
Mark scheme, page 10
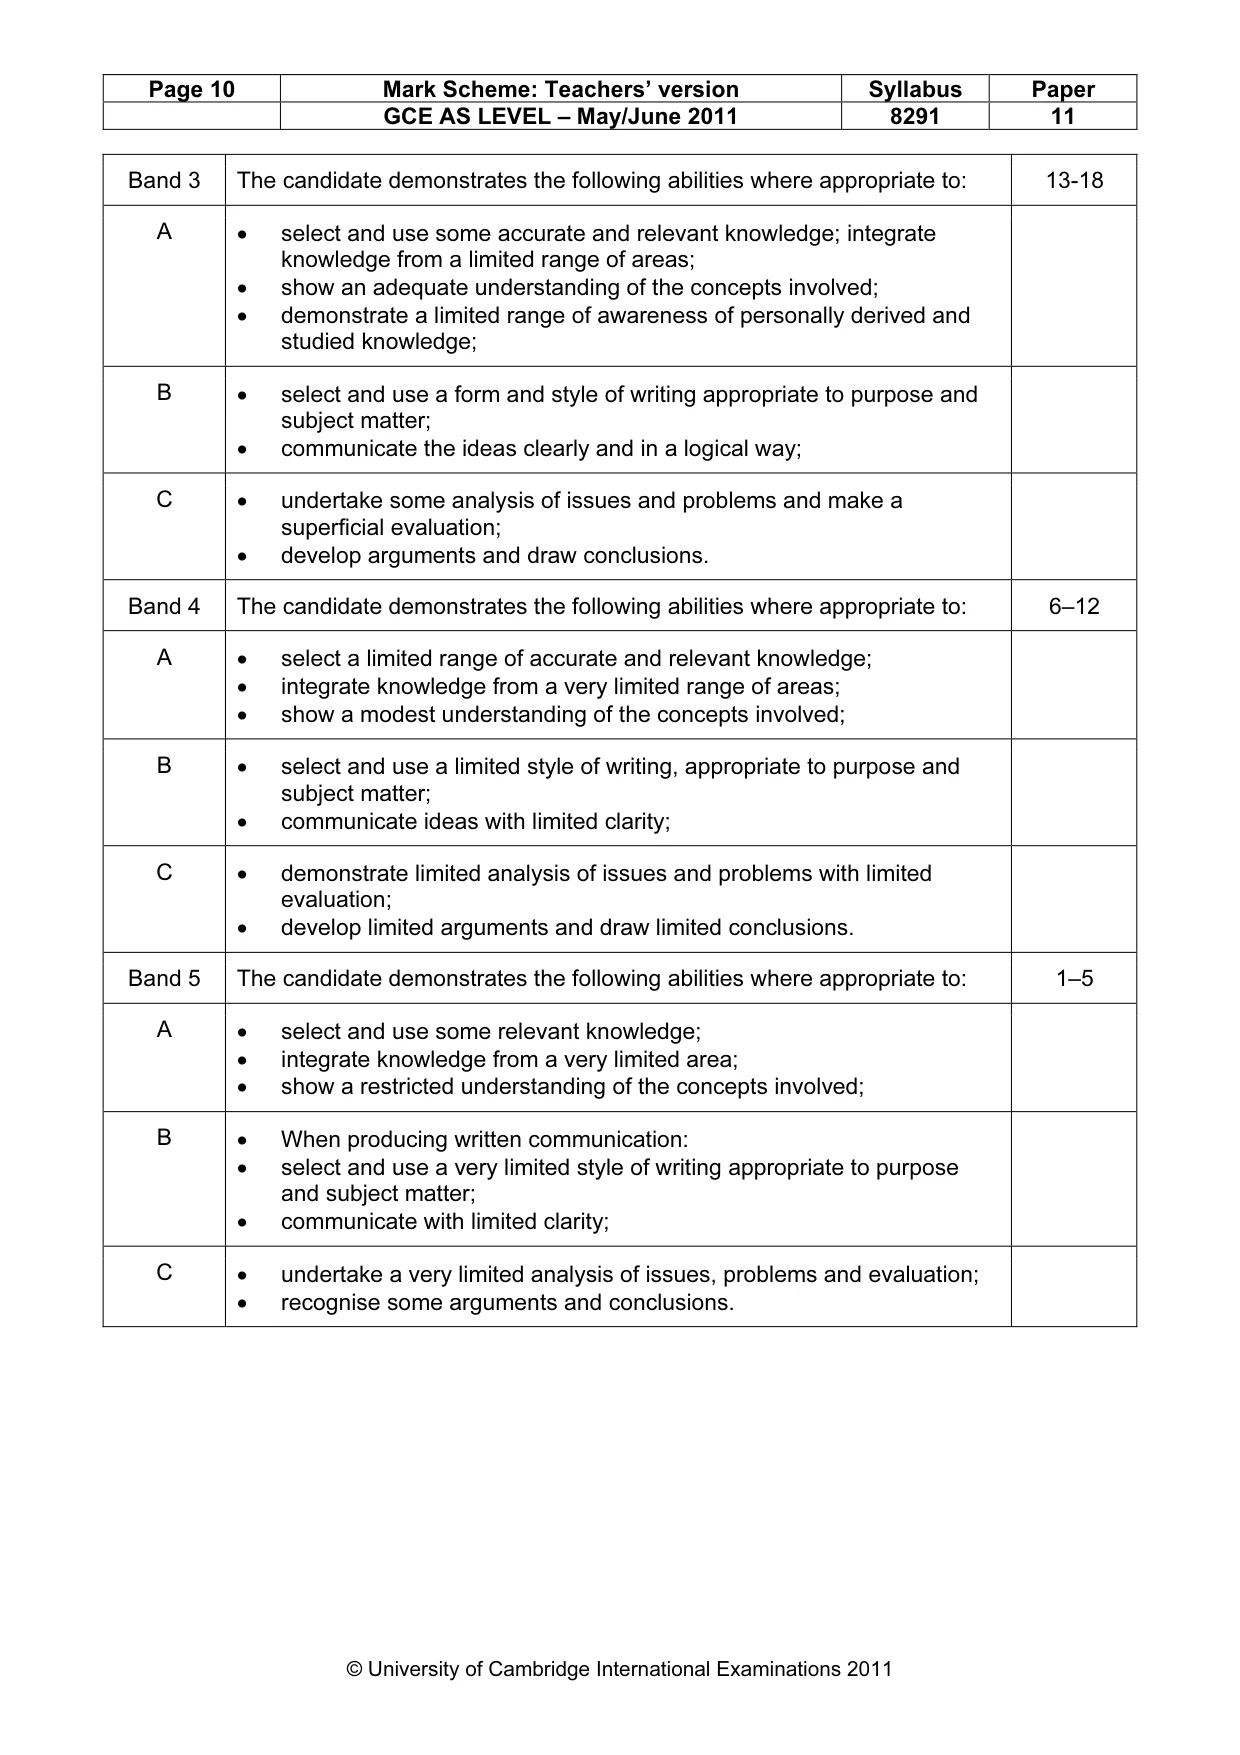
Page 10 Mark Scheme: Teachers’ version Syllabus Paper GCE AS LEVEL – May/June 2011 8291 11 © University of Cambridge International Examinations 2011 Band 3 The candidate demonstrates the following abilities where appropriate to: 13-18 A • select and use some accurate and relevant knowledge; integrate knowledge from a limited range of areas; • show an adequate understanding of the concepts involved; • demonstrate a limited range of awareness of personally derived and studied knowledge; B • select and use a form and style of writing appropriate to purpose and subject matter; • communicate the ideas clearly and in a logical way; C • undertake some analysis of issues and problems and make a superficial evaluation; • develop arguments and draw conclusions. Band 4 The candidate demonstrates the following abilities where appropriate to: 6–12 A • select a limited range of accurate and relevant knowledge; • integrate knowledge from a very limited range of areas; • show a modest understanding of the concepts involved; B • select and use a limited style of writing, appropriate to purpose and subject matter; • communicate ideas with limited clarity; C • demonstrate limited analysis of issues and problems with limited evaluation; • develop limited arguments and draw limited conclusions. Band 5 The candidate demonstrates the following abilities where appropriate to: 1–5 A • select and use some relevant knowledge; • integrate knowledge from a very limited area; • show a restricted understanding of the concepts involved; B • When producing written communication: • select and use a very limited style of writing appropriate to purpose and subject matter; • communicate with limited clarity; C • undertake a very limited analysis of issues, problems and evaluation; • recognise some arguments and conclusions.
What you needed in this session
Cambridge’s own grade thresholds for 2011 May/June, Paper 1 · Variant 1. A higher threshold means an easier paper — the bar moves with how the cohort did.