Cambridge A Level Environmental Management (AS only) 8291 — 2010 Oct/Nov Paper 2 · Variant 1
8291/21/O/N/10 · 80 marks · ≈90 min
The question paper and its mark scheme, free to read here and free to download. This is Cambridge’s own paper, exactly as it was sat.
Question paper12 pages

Mark scheme10 pages
Answers below. Sit the paper first if you are practising.
Paper as text
Question paper, page 1
This document consists of 12 printed pages. DC (CB (LD/DJ)) 17629/3 © UCLES 2010 [Turn over UNIVERSITY OF CAMBRIDGE INTERNATIONAL EXAMINATIONS General Certificate of Education Advanced Subsidiary Level * 9 8 7 1 4 7 3 2 7 7 * READ THESE INSTRUCTIONS FIRST Write your Centre number, candidate number and name on all the work you hand in. Write in dark blue or black pen. You may use a soft pencil for any diagrams, graphs, tables or rough working. Do not use staples, paper clips, highlighters, glue or correction fluid. DO NOT WRITE IN ANY BARCODES. Section A Answer all questions. Write your answers in the spaces provided on the question paper. Section B Answer one question from this section. Answer the question on the separate answer paper provided. At the end of the examination, 1. fasten all separate answer paper securely to the question paper; 2. enter the question number from Section B in the grid opposite. ENVIRONMENTAL MANAGEMENT 8291/02 Paper 2 Hydrosphere and Biosphere October/November 2010 1 hour 30 minutes Additional Materials: Answer Booklet/Paper For Examiner’s Use Section A 1 2 Section B Total
Question paper, page 2
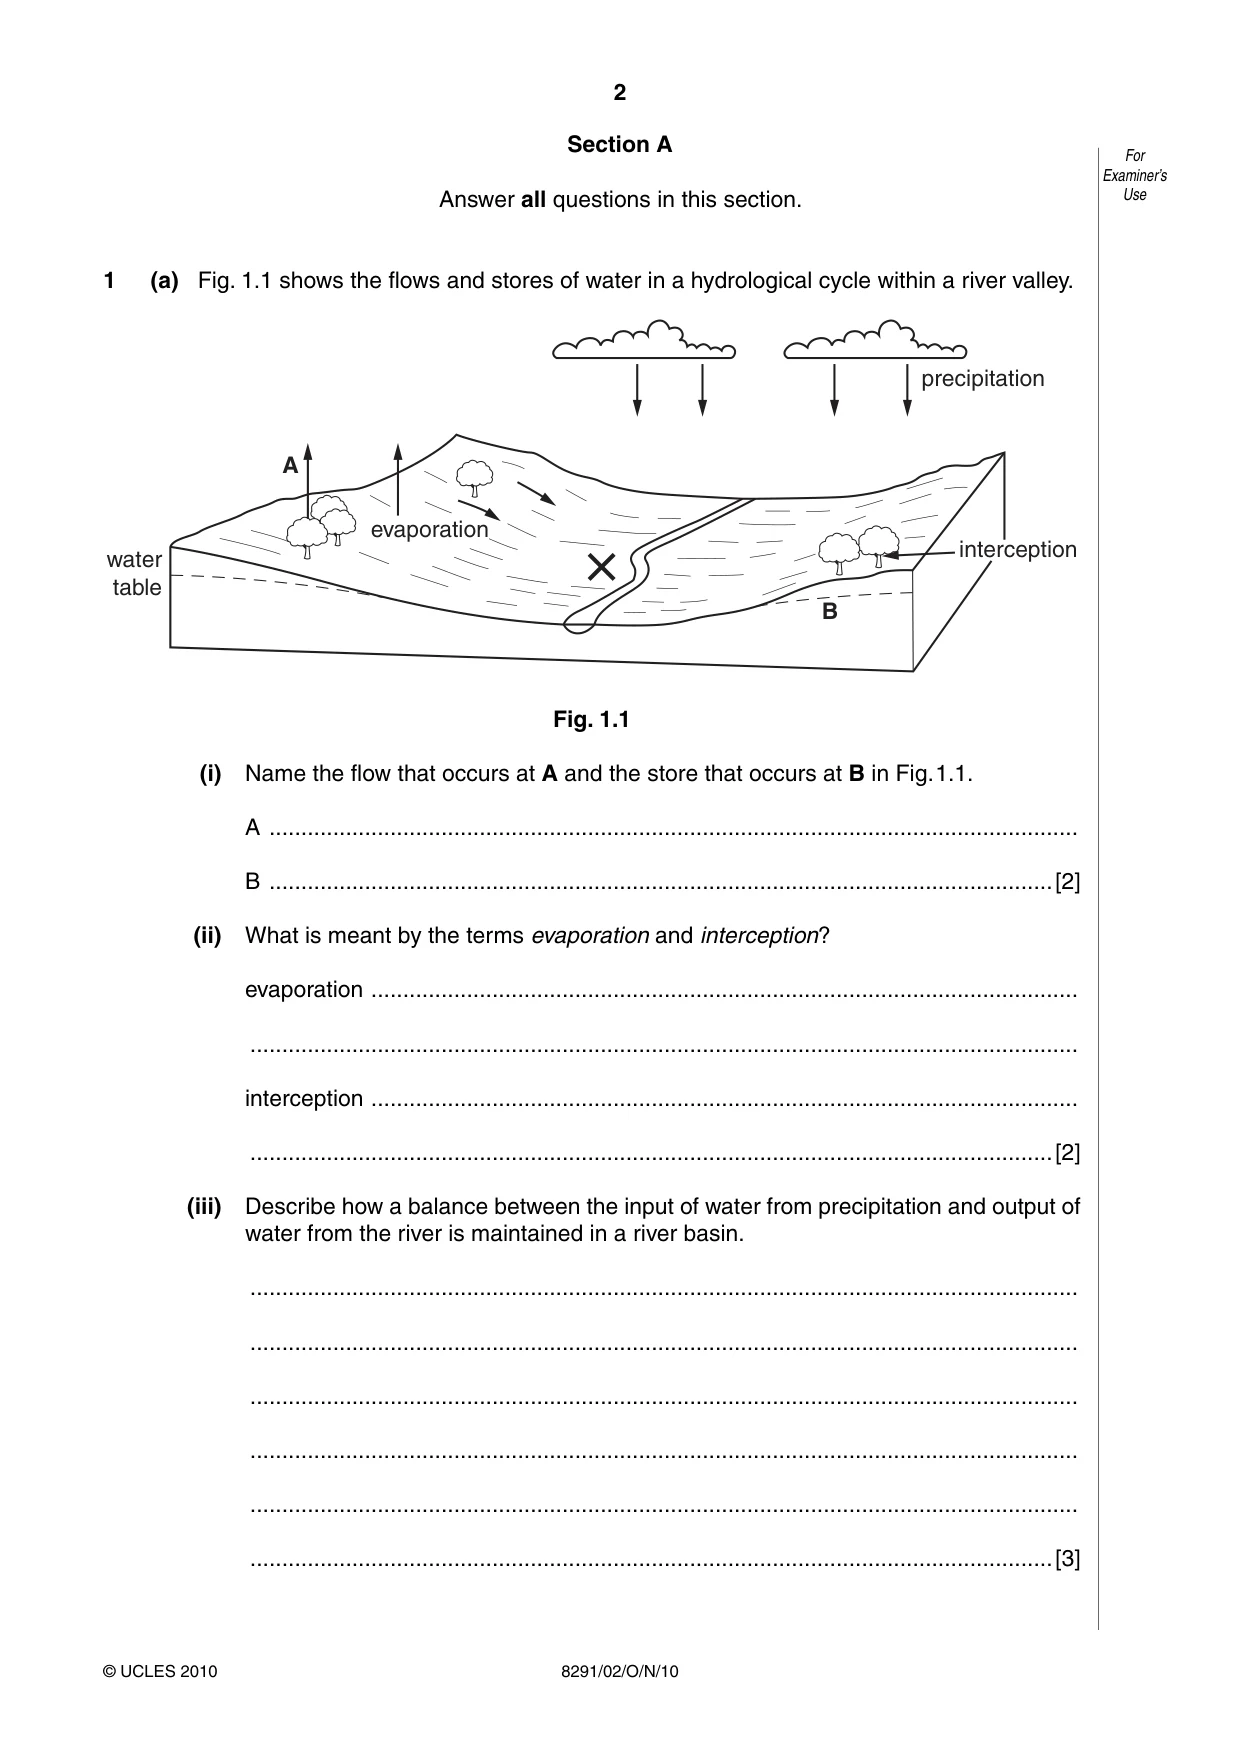
2 8291/02/O/N/10 © UCLES 2010 For Examiner’s Use Section A Answer all questions in this section. 1 (a) Fig. 1.1 shows the flows and stores of water in a hydrological cycle within a river valley. water table A B evaporation precipitation interception Fig. 1.1 (i) Name the flow that occurs at A and the store that occurs at B in Fig. 1.1. A … B …[2] (ii) What is meant by the terms evaporation and interception? evaporation … … interception … …[2] (iii) Describe how a balance between the input of water from precipitation and output of water from the river is maintained in a river basin. … … … … … …[3]
Question paper, page 3
3 8291/02/O/N/10 © UCLES 2010 [Turn over For Examiner’s Use (iv) What effects would the construction of a large town in area X in Fig. 1.1 have upon the discharge of water into the river? … … … … … …[3]
Question paper, page 4
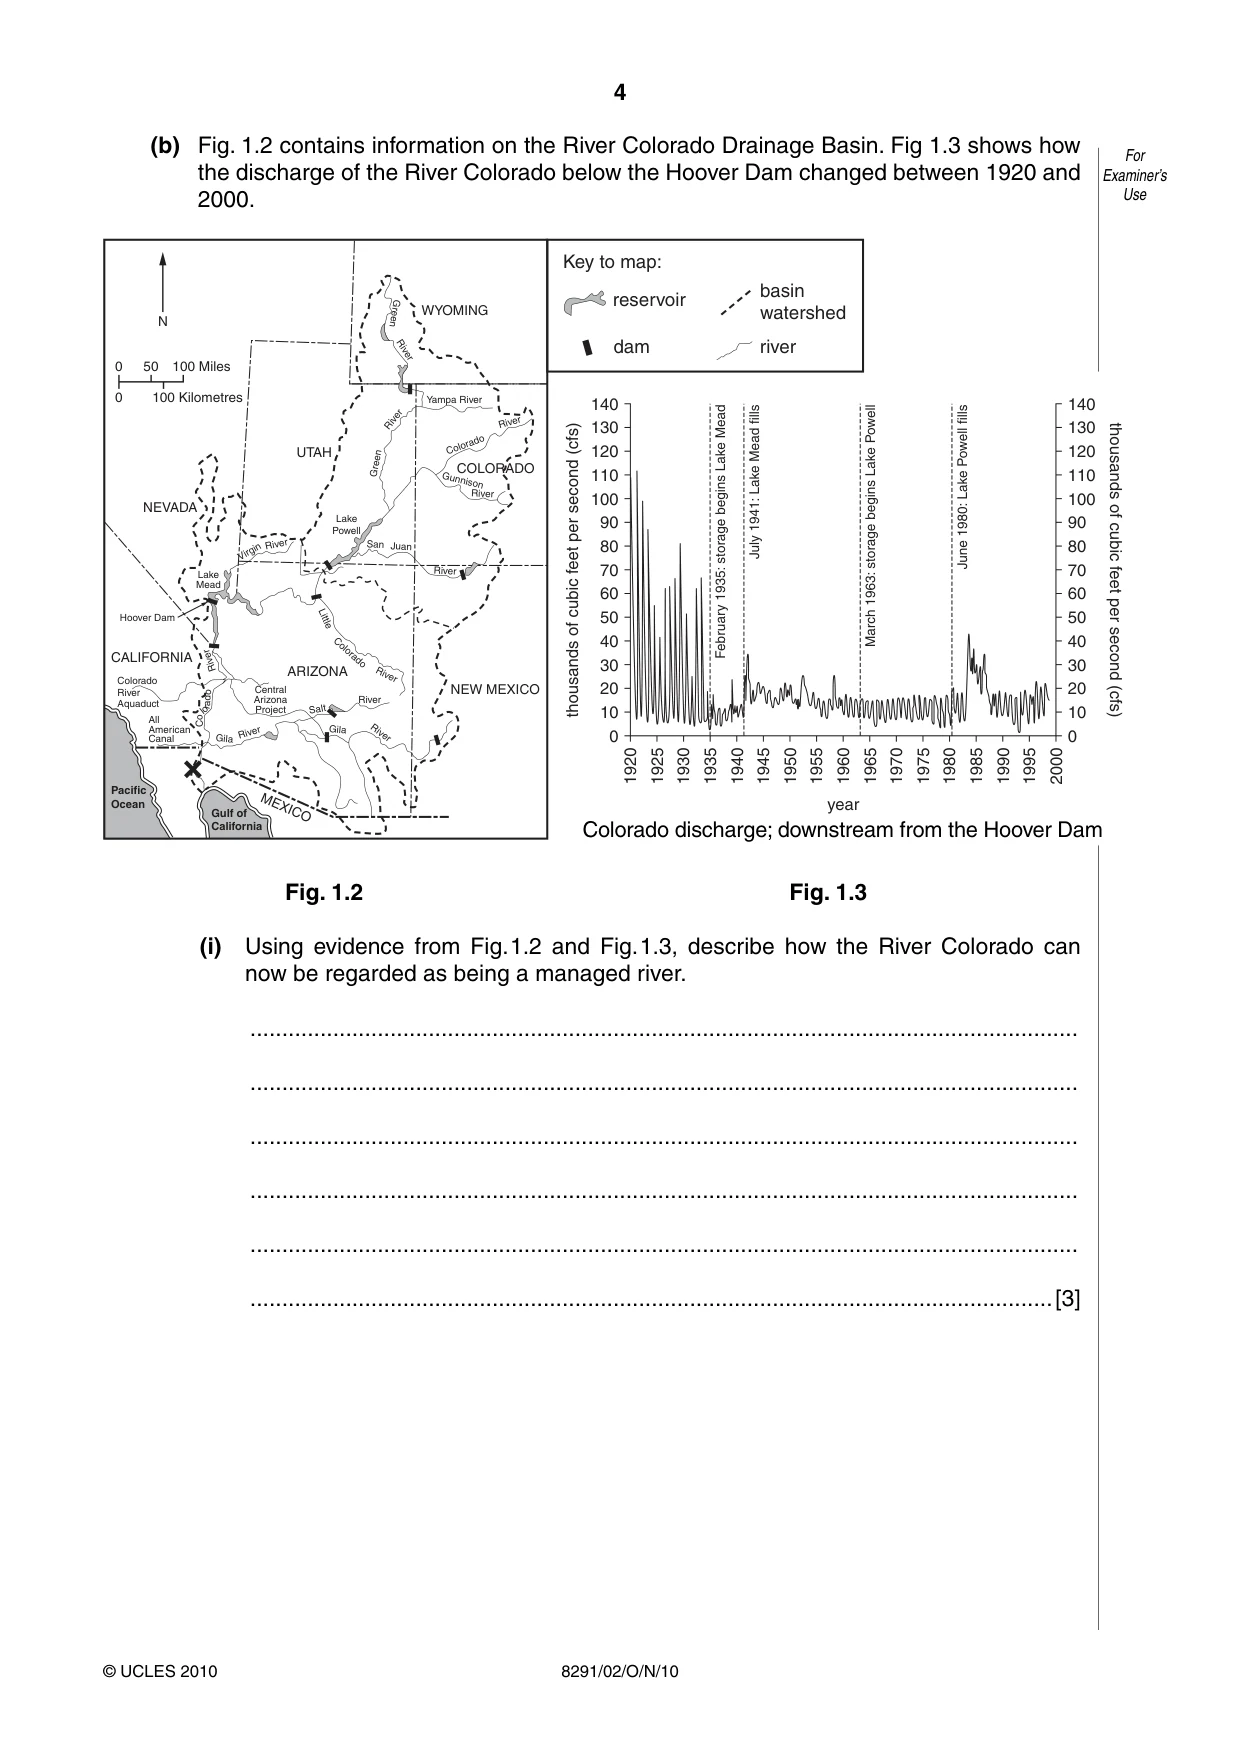
4 8291/02/O/N/10 © UCLES 2010 For Examiner’s Use (b) Fig. 1.2 contains information on the River Colorado Drainage Basin. Fig 1.3 shows how the discharge of the River Colorado below the Hoover Dam changed between 1920 and 2000. WYOMING Key to map: COLORADO UTAH NEW MEXICO MEXICO ARIZONA CALIFORNIA NEVADA Green River Yampa River Colorado River River Green Lake Powell Little Colorado River San Juan Gunnison River River River Central Arizona Project Lake Mead Hoover Dam Salt River River River Gila Gila All American Canal Pacific Ocean Gulf of California Colorado River Aquaduct Co l o r ad o Virgin River 0 50 100 Miles N 0 100 Kilometres reservoir basin watershed river dam 0 1920 1925 1930 1935 1940 1945 1950 1955 1960 1965 1970 1975 1980 1985 1990 2000 1995 10 20 30 40 year thousands of cubic feet per second (cfs) February 1935: storage begins Lake Mead July 1941: Lake Mead fills March 1963: storage begins Lake Powell June 1980: Lake Powell fills thousands of cubic feet per second (cfs) 50 60 70 80 90 100 110 120 130 140 0 10 20 30 40 50 60 70 80 90 100 110 120 130 140 Colorado discharge; downstream from the Hoover Dam Fig. 1.2 Fig. 1.3 (i) Using evidence from Fig. 1.2 and Fig. 1.3, describe how the River Colorado can now be regarded as being a managed river. … … … … … …[3]
Question paper, page 5
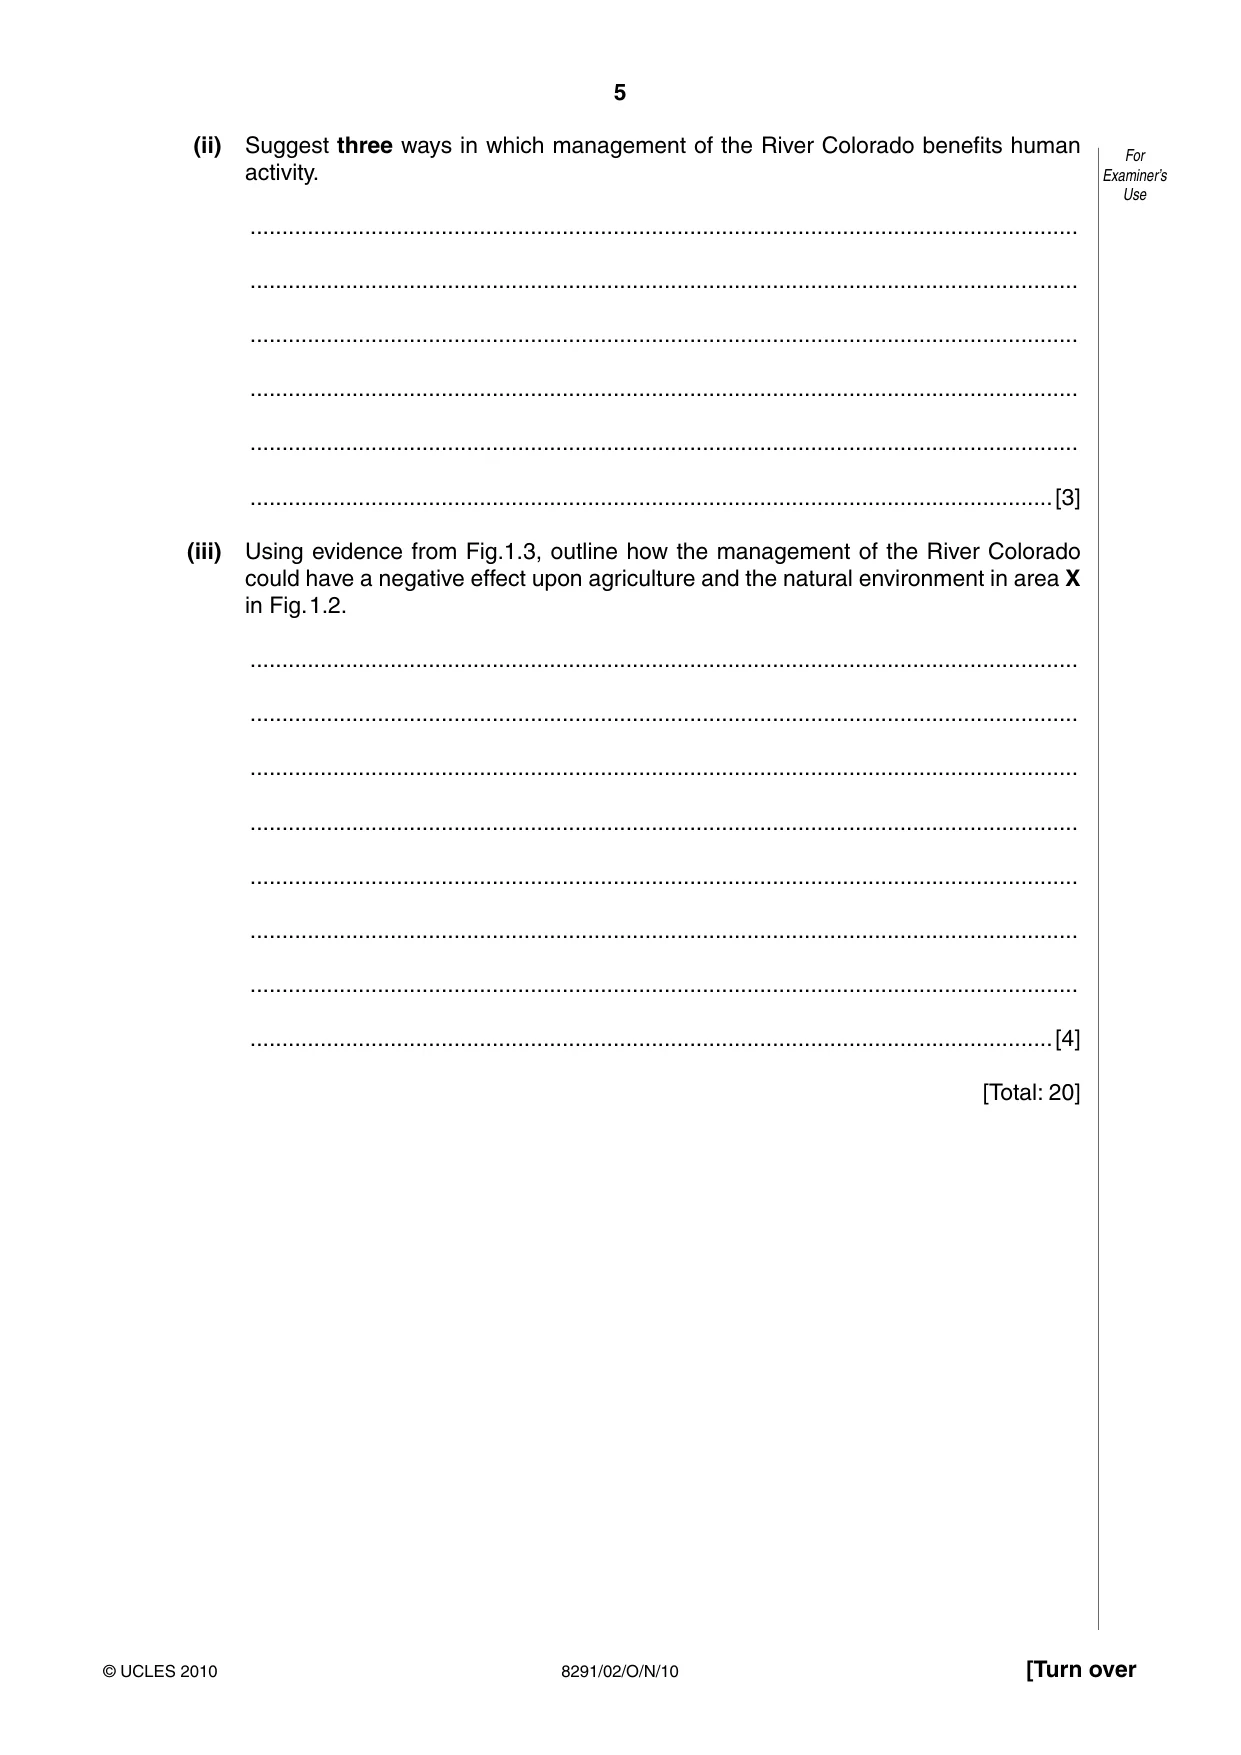
5 8291/02/O/N/10 © UCLES 2010 [Turn over For Examiner’s Use (ii) Suggest three ways in which management of the River Colorado benefits human activity. … … … … … …[3] (iii) Using evidence from Fig.1.3, outline how the management of the River Colorado could have a negative effect upon agriculture and the natural environment in area X in Fig. 1.2. … … … … … … … …[4] [Total: 20]
Question paper, page 6
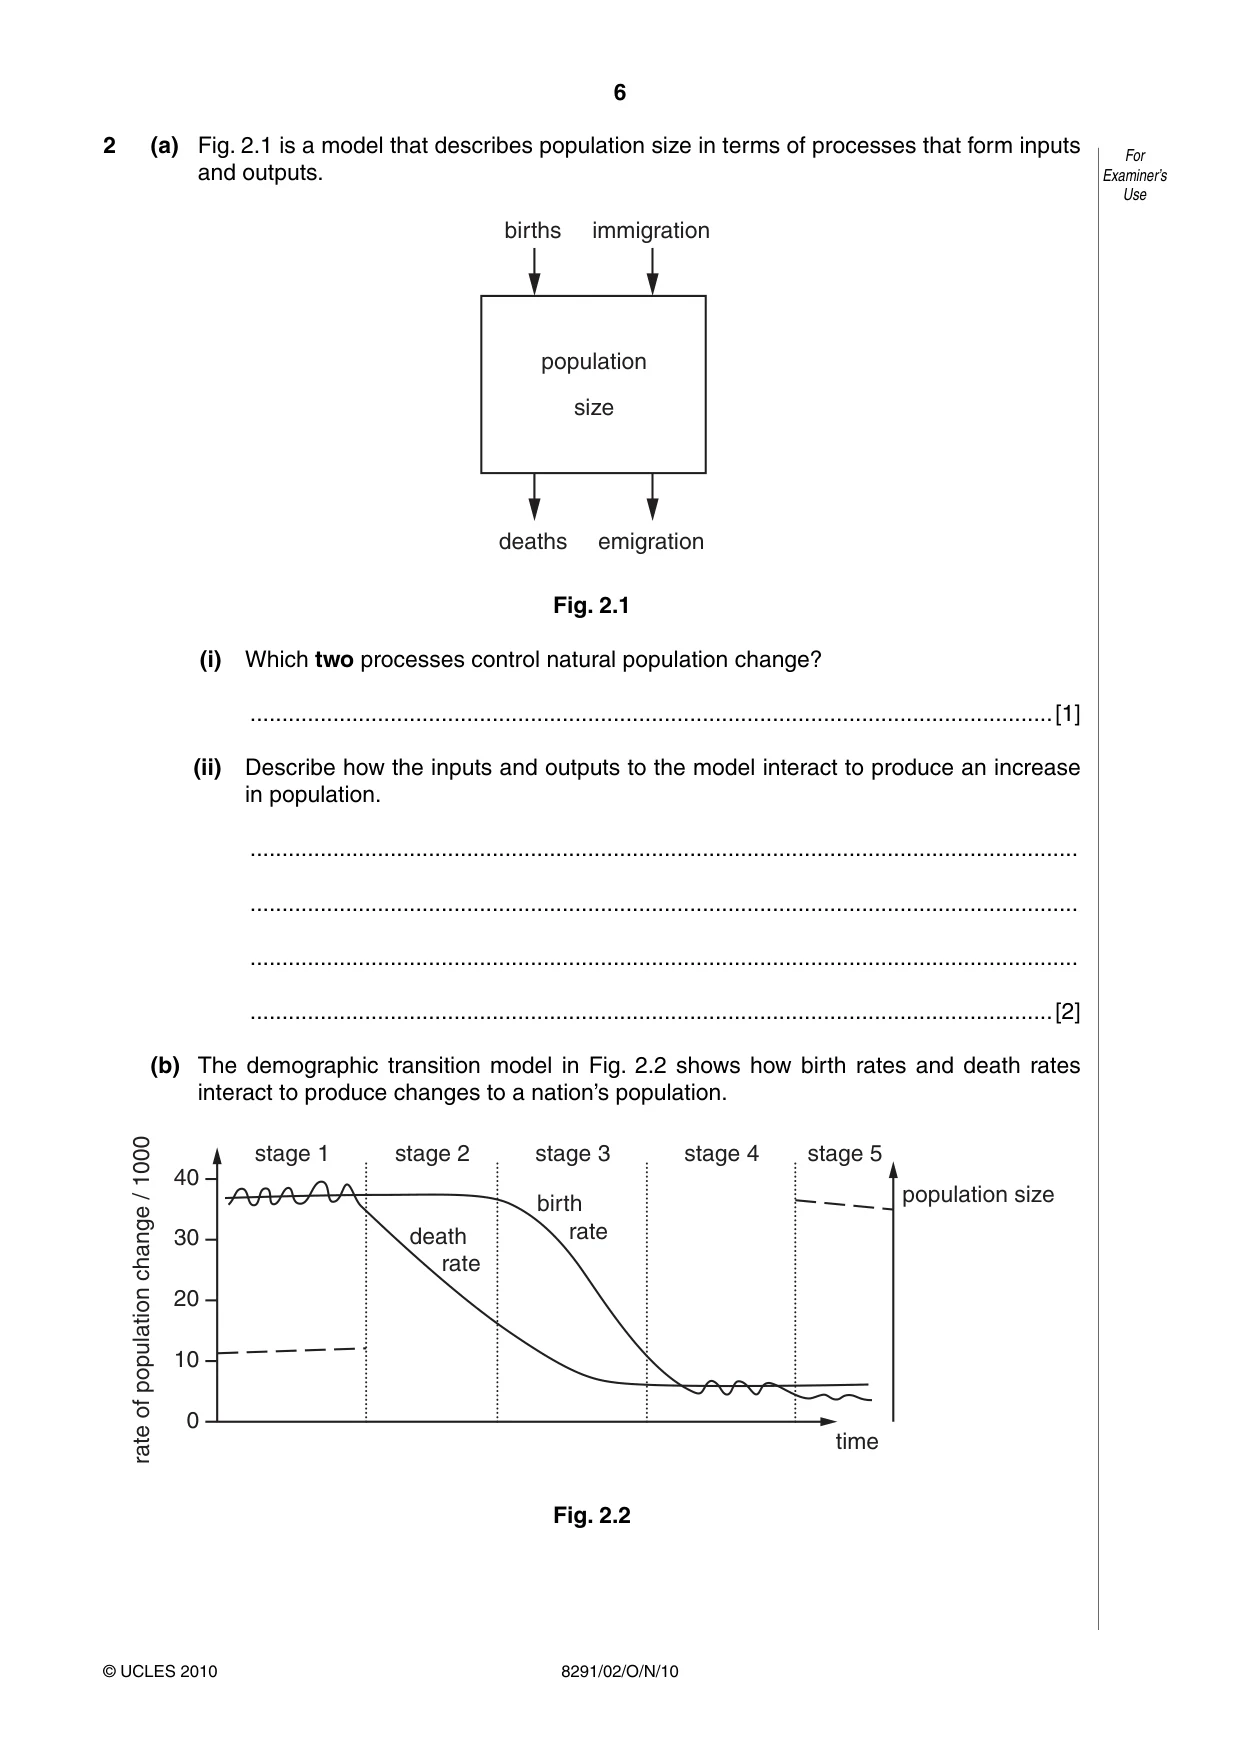
6 8291/02/O/N/10 © UCLES 2010 For Examiner’s Use 2 (a) Fig. 2.1 is a model that describes population size in terms of processes that form inputs and outputs. births population size immigration deaths emigration Fig. 2.1 (i) Which two processes control natural population change? …[1] (ii) Describe how the inputs and outputs to the model interact to produce an increase in population. … … … …[2] (b) The demographic transition model in Fig. 2.2 shows how birth rates and death rates interact to produce changes to a nation’s population. population size time stage 5 stage 4 stage 3 stage 2 stage 1 40 30 20 10 0 rate of population change / 1000 birth rate death rate Fig. 2.2
Question paper, page 7
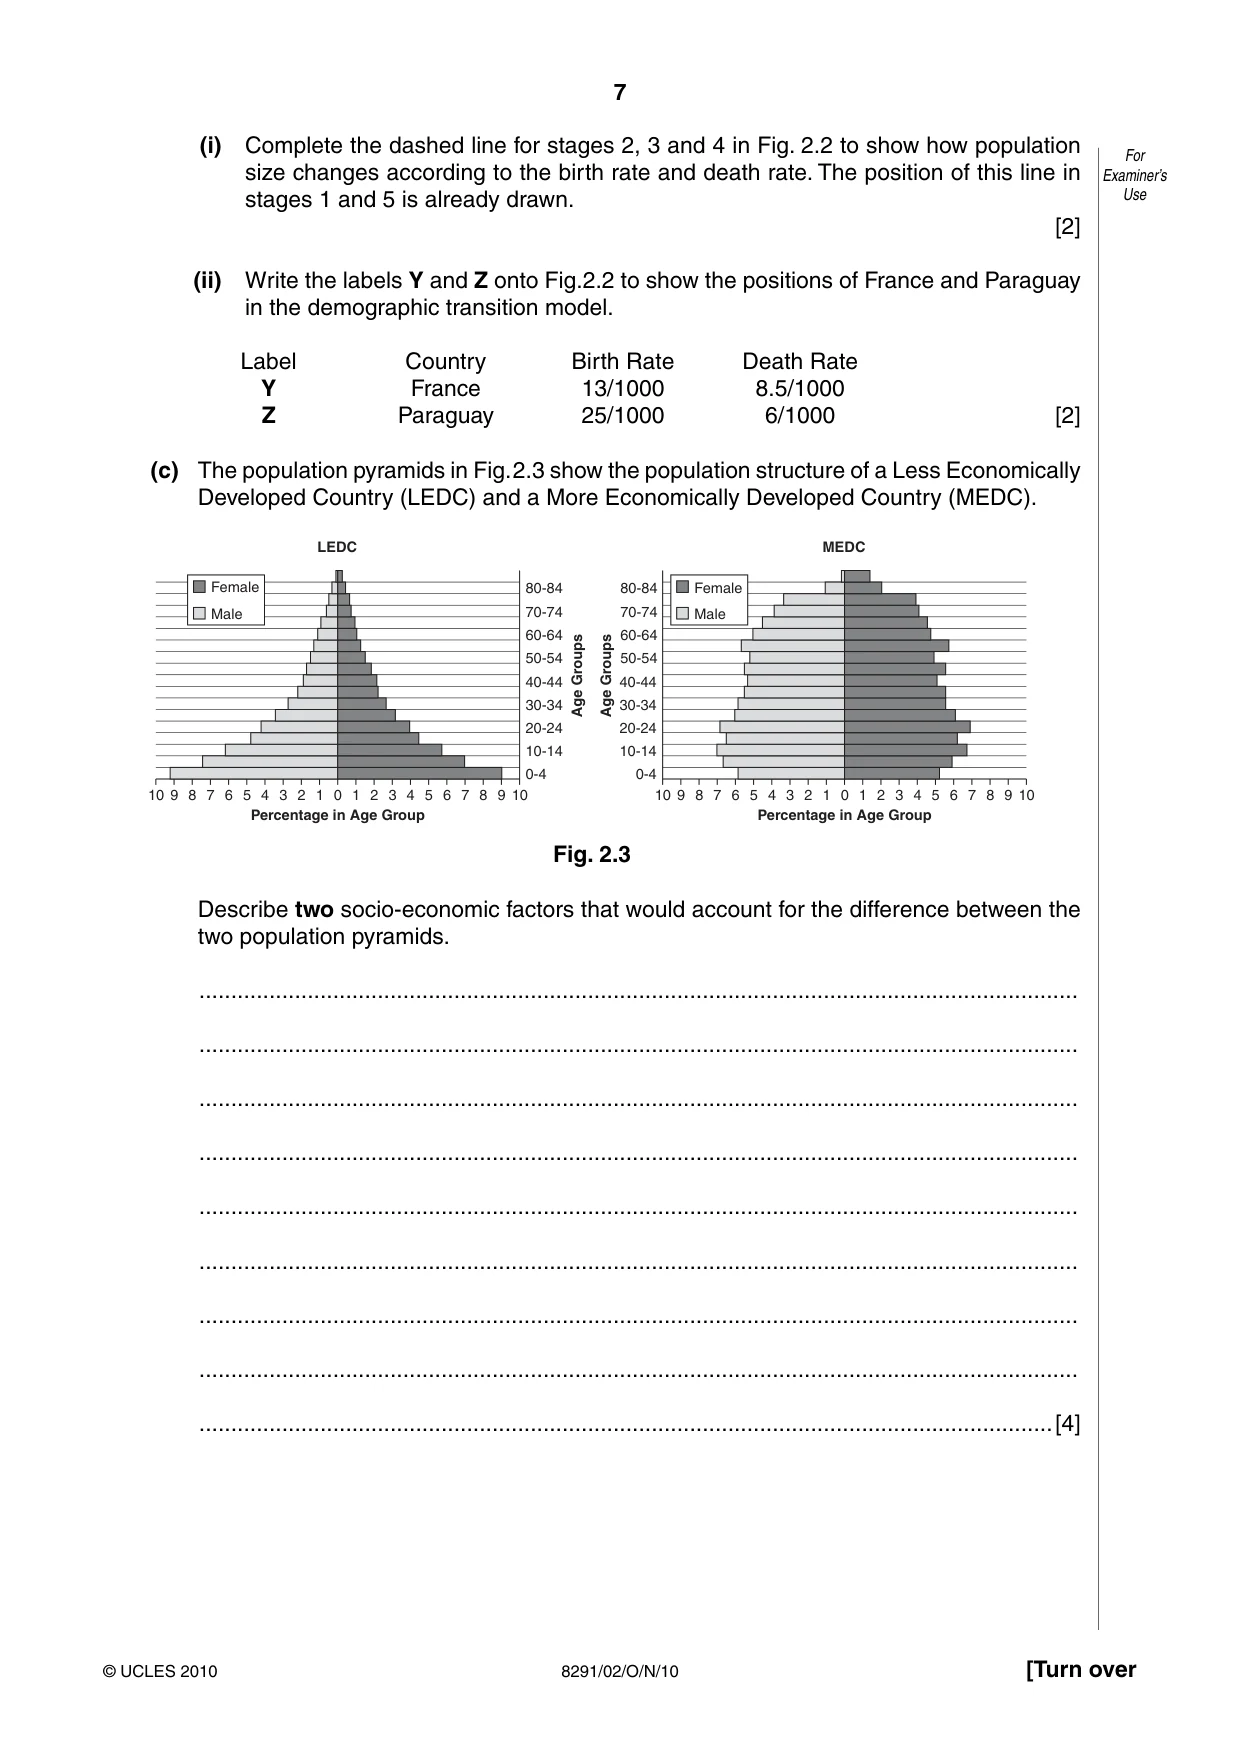
7 8291/02/O/N/10 © UCLES 2010 [Turn over For Examiner’s Use (i) Complete the dashed line for stages 2, 3 and 4 in Fig. 2.2 to show how population size changes according to the birth rate and death rate. The position of this line in stages 1 and 5 is already drawn. [2] (ii) Write the labels Y and Z onto Fig.2.2 to show the positions of France and Paraguay in the demographic transition model. Label Country Birth Rate Death Rate Y France 13/1000 8.5/1000 Z Paraguay 25/1000 6/1000 [2] (c) The population pyramids in Fig. 2.3 show the population structure of a Less Economically Developed Country (LEDC) and a More Economically Developed Country (MEDC). 10 9 8 7 6 5 4 3 2 1 0 1 2 4 3 5 6 7 8 9 10 0-4 Age Groups Age Groups 10-14 20-24 30-34 40-44 0-4 10-14 20-24 30-34 40-44 50-54 60-64 70-74 80-84 Female LEDC Male Percentage in Age Group 10 9 8 7 6 5 4 3 2 1 0 1 2 4 3 5 6 7 8 9 10 50-54 60-64 70-74 80-84 Female MEDC Male Percentage in Age Group Fig. 2.3 Describe two socio-economic factors that would account for the difference between the two population pyramids. … … … … … … … … …[4]
Question paper, page 8
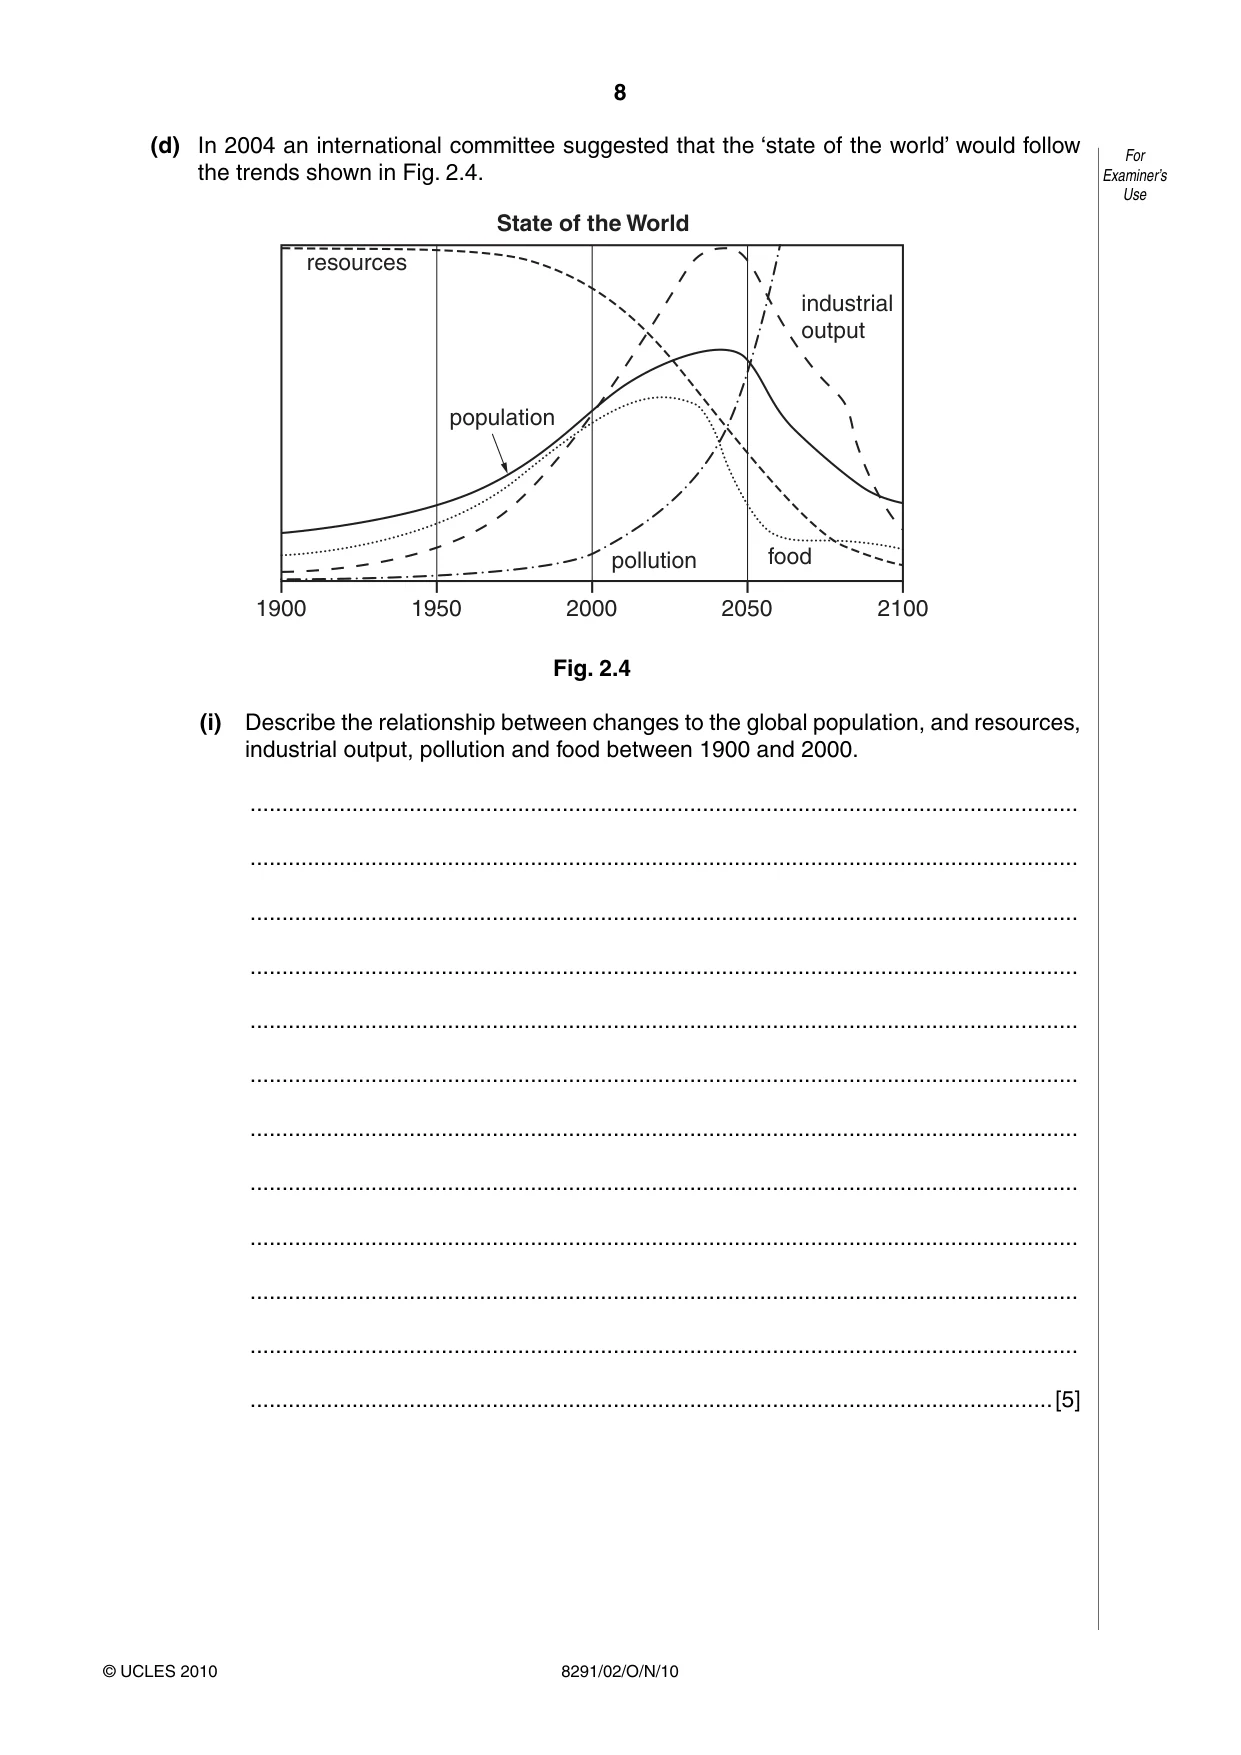
8 8291/02/O/N/10 © UCLES 2010 For Examiner’s Use (d) In 2004 an international committee suggested that the ‘state of the world’ would follow the trends shown in Fig. 2.4. 1900 1950 2000 2050 2100 State of the World resources population industrial output food pollution Fig. 2.4 (i) Describe the relationship between changes to the global population, and resources, industrial output, pollution and food between 1900 and 2000. … … … … … … … … … … … …[5]
Question paper, page 9
9 8291/02/O/N/10 © UCLES 2010 [Turn over For Examiner’s Use (ii) Explain the possible state of the world scenario for the period 2050 to 2100. … … … … … … … … …[4] [Total: 20]
Question paper, page 10
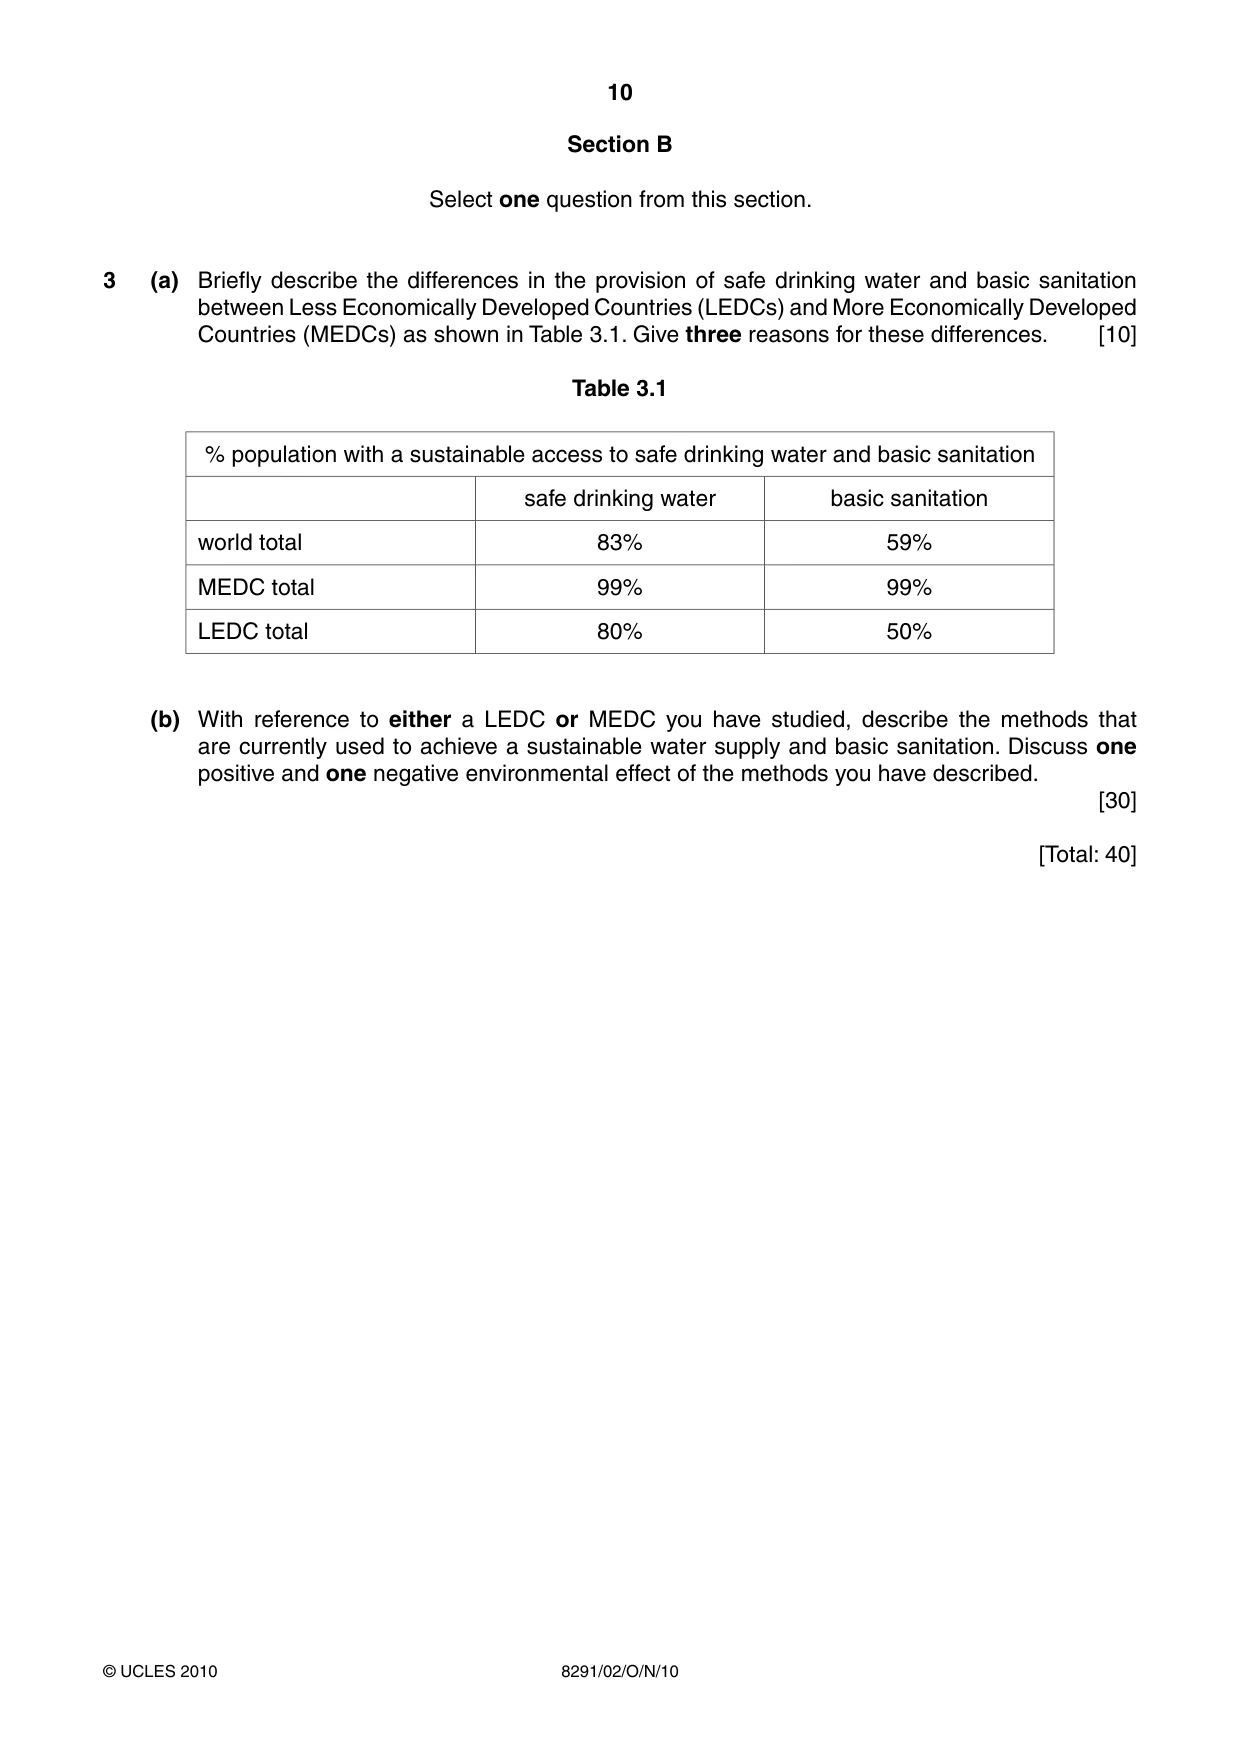
10 8291/02/O/N/10 © UCLES 2010 Section B Select one question from this section. 3 (a) Briefly describe the differences in the provision of safe drinking water and basic sanitation between Less Economically Developed Countries (LEDCs) and More Economically Developed Countries (MEDCs) as shown in Table 3.1. Give three reasons for these differences. [10] Table 3.1 % population with a sustainable access to safe drinking water and basic sanitation safe drinking water basic sanitation world total 83% 59% MEDC total 99% 99% LEDC total 80% 50% (b) With reference to either a LEDC or MEDC you have studied, describe the methods that are currently used to achieve a sustainable water supply and basic sanitation. Discuss one positive and one negative environmental effect of the methods you have described. [30] [Total: 40]
Question paper, page 11
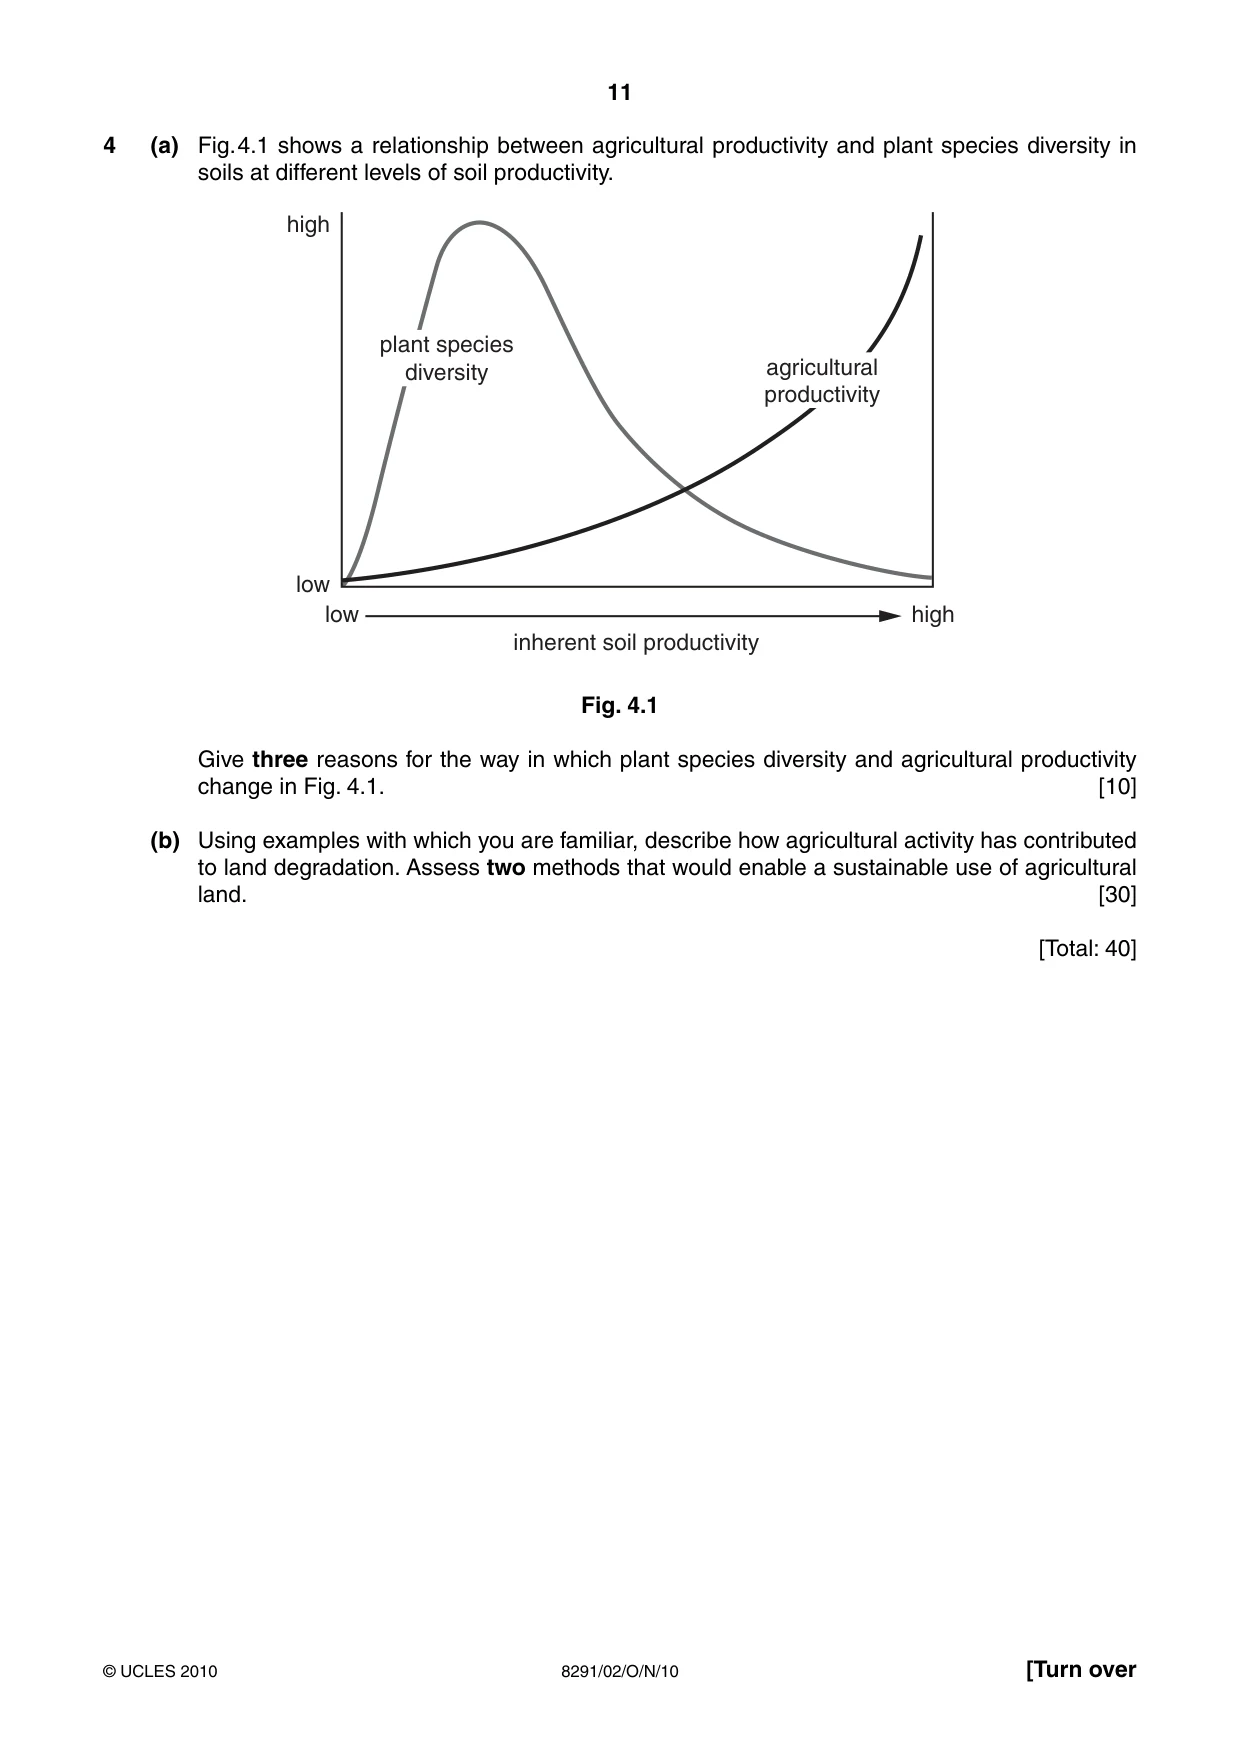
11 8291/02/O/N/10 © UCLES 2010 [Turn over 4 (a) Fig. 4.1 shows a relationship between agricultural productivity and plant species diversity in soils at different levels of soil productivity. high low low high inherent soil productivity plant species diversity agricultural productivity Fig. 4.1 Give three reasons for the way in which plant species diversity and agricultural productivity change in Fig. 4.1. [10] (b) Using examples with which you are familiar, describe how agricultural activity has contributed to land degradation. Assess two methods that would enable a sustainable use of agricultural land. [30] [Total: 40]
Question paper, page 12
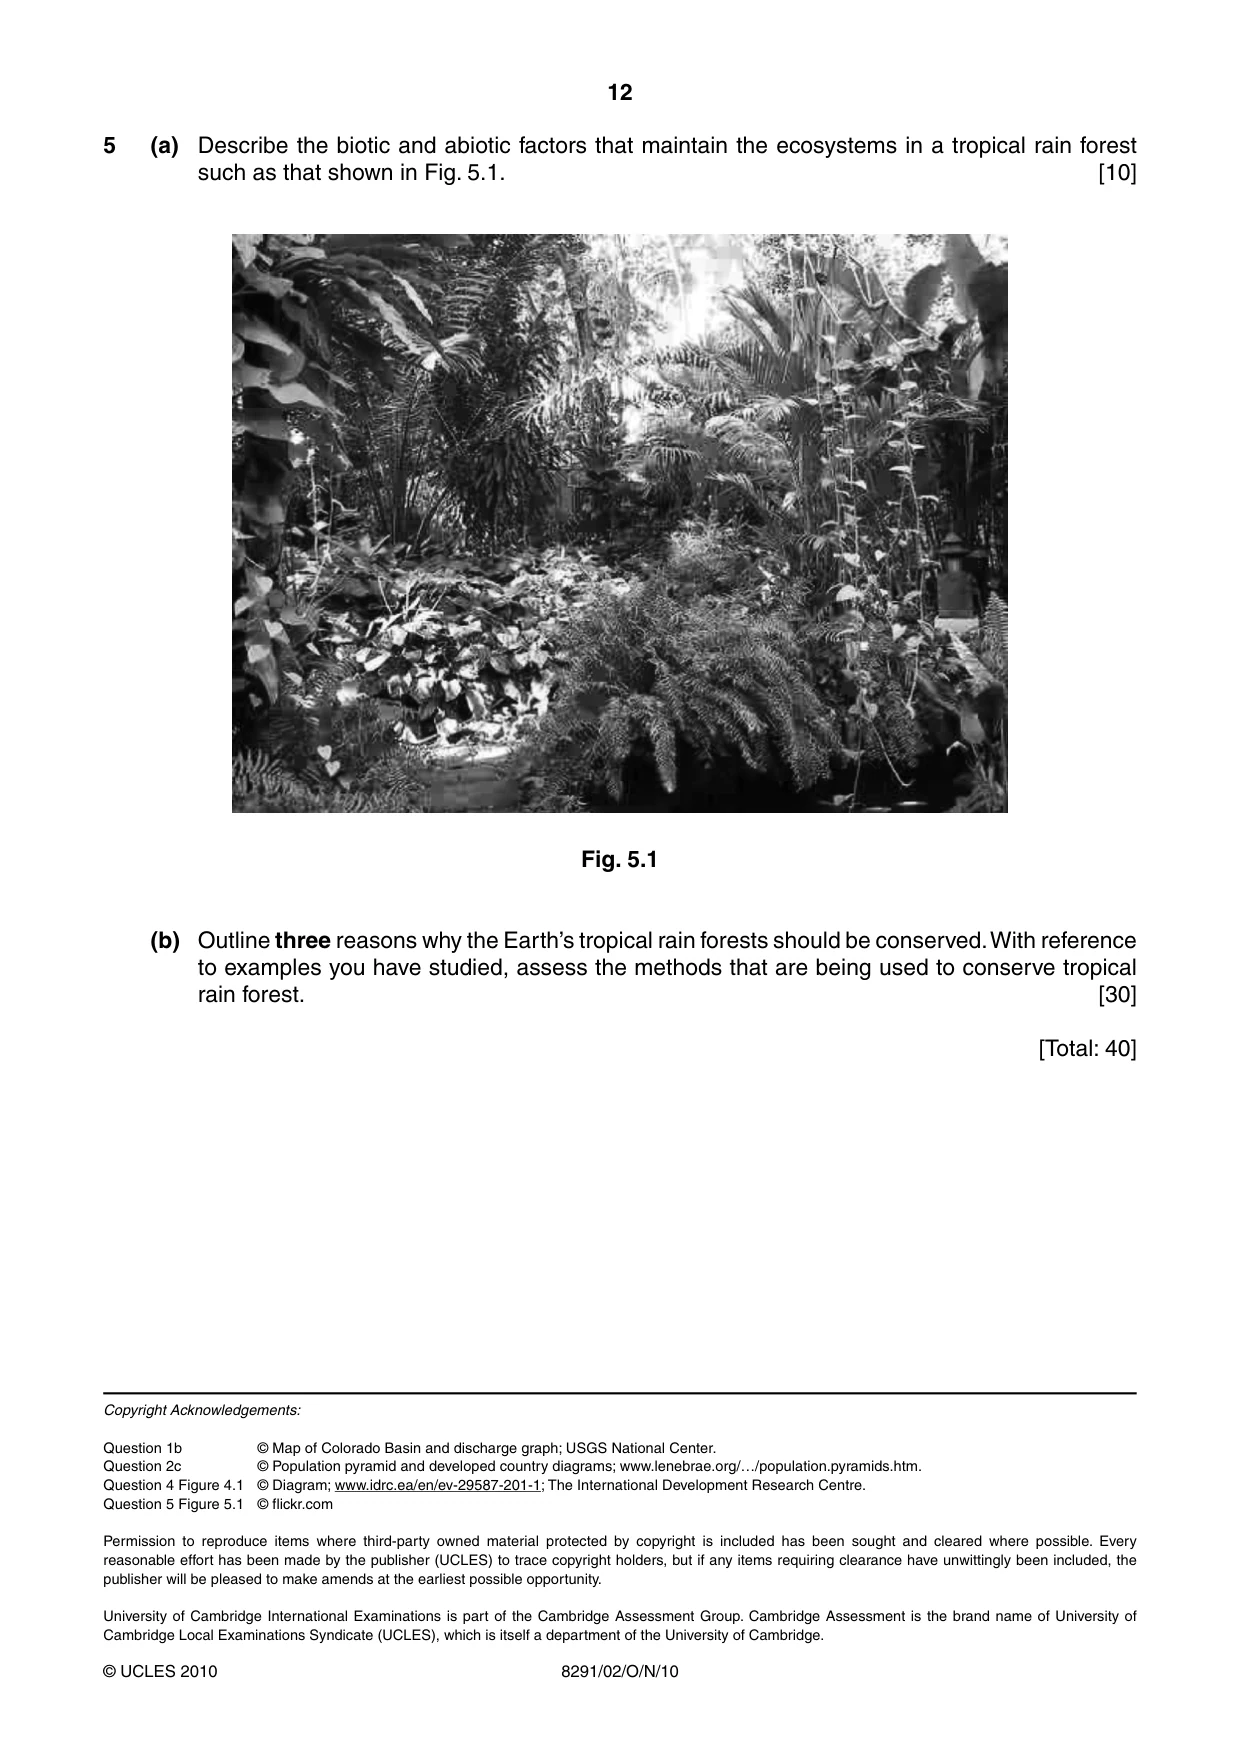
12 8291/02/O/N/10 © UCLES 2010 5 (a) Describe the biotic and abiotic factors that maintain the ecosystems in a tropical rain forest such as that shown in Fig. 5.1. …[10] Fig. 5.1 (b) Outline three reasons why the Earth’s tropical rain forests should be conserved. With reference to examples you have studied, assess the methods that are being used to conserve tropical rain forest. [30] [Total: 40] Copyright Acknowledgements: Question 1b © Map of Colorado Basin and discharge graph; USGS National Center. Question 2c © Population pyramid and developed country diagrams; www.lenebrae.org/…/population.pyramids.htm. Question 4 Figure 4.1 © Diagram; www.idrc.ea/en/ev-29587-201-1; The International Development Research Centre. Question 5 Figure 5.1 © flickr.com Permission to reproduce items where third-party owned material protected by copyright is included has been sought and cleared where possible. Every reasonable effort has been made by the publisher (UCLES) to trace copyright holders, but if any items requiring clearance have unwittingly been included, the publisher will be pleased to make amends at the earliest possible opportunity. University of Cambridge International Examinations is part of the Cambridge Assessment Group. Cambridge Assessment is the brand name of University of Cambridge Local Examinations Syndicate (UCLES), which is itself a department of the University of Cambridge.
Mark scheme, page 1
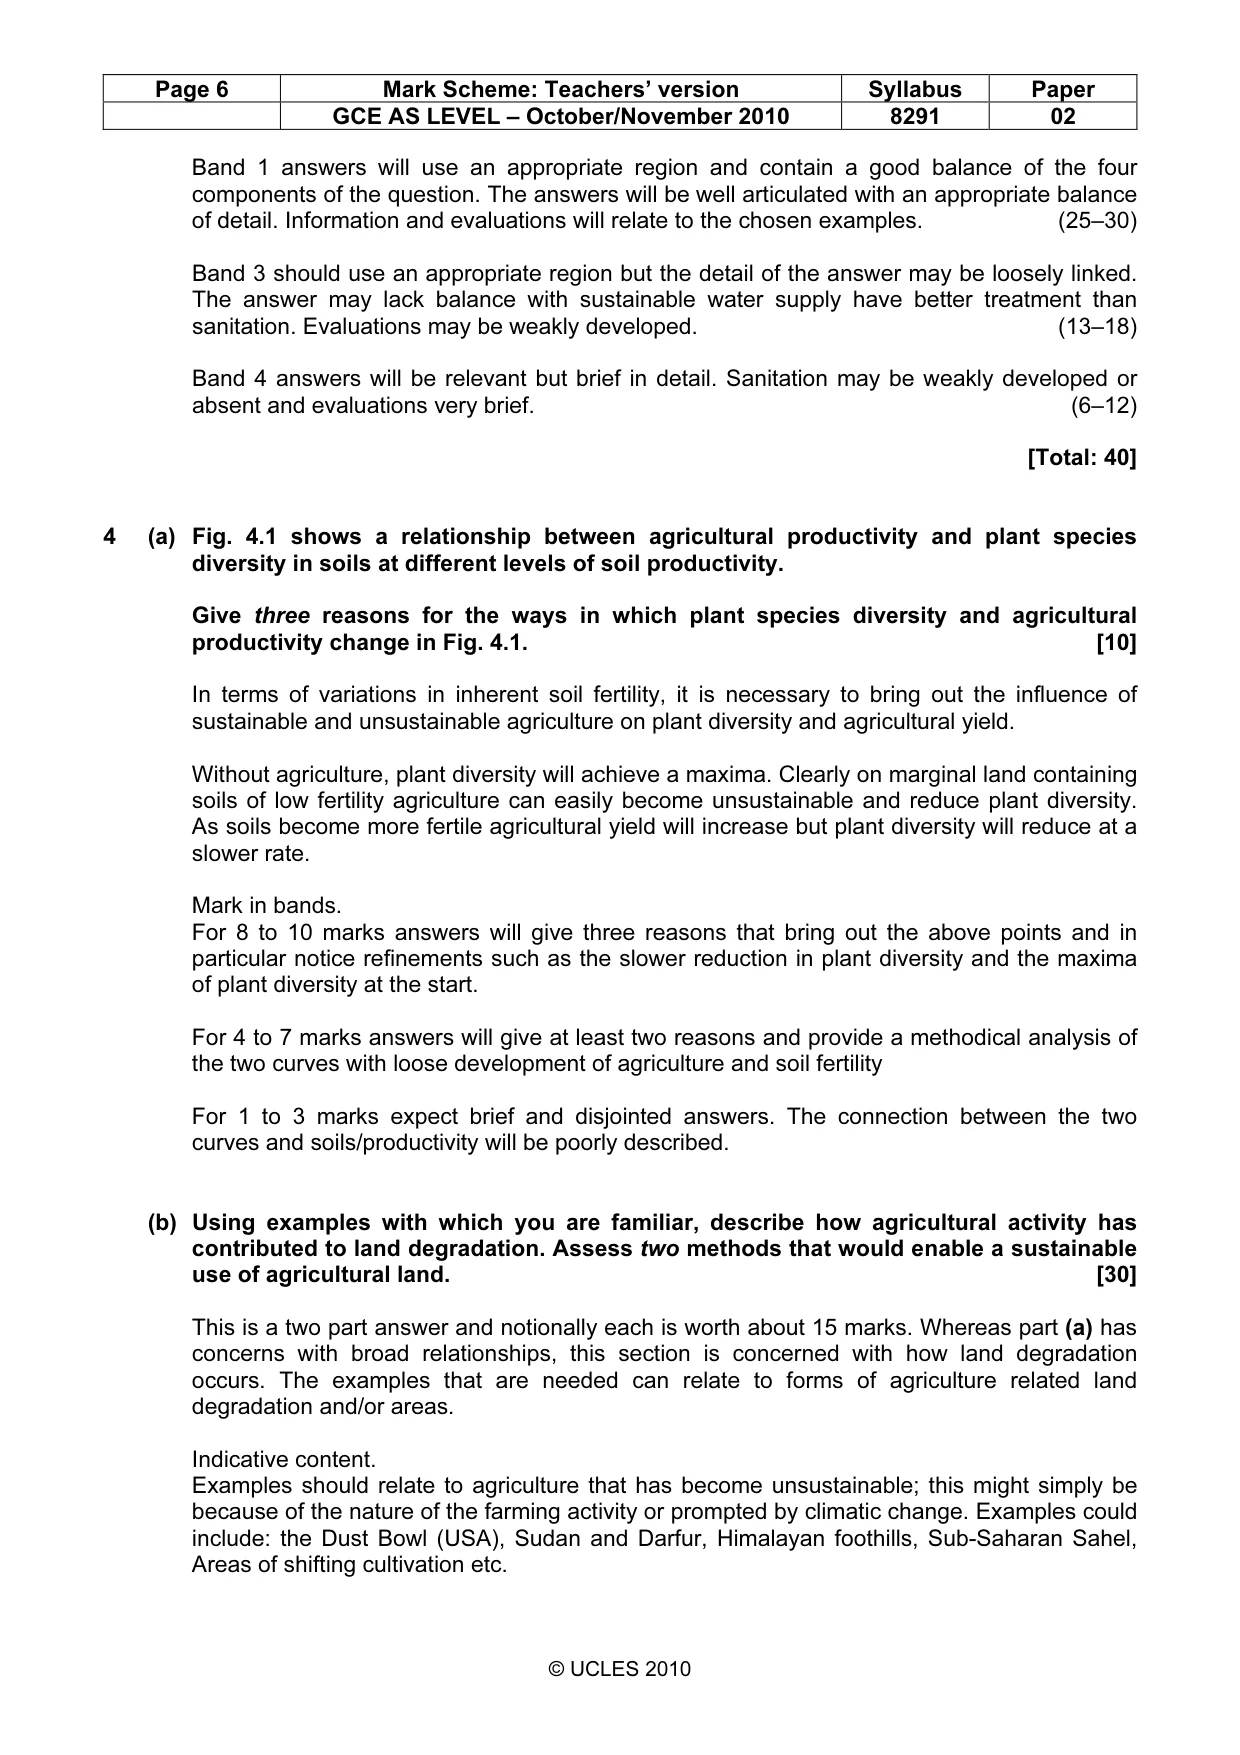
UNIVERSITY OF CAMBRIDGE INTERNATIONAL EXAMINATIONS GCE Advanced Subsidiary Level MARK SCHEME for the October/November 2010 question paper for the guidance of teachers 8291 ENVIRONMENTAL MANAGEMENT 8291/02 Paper 2, maximum raw mark 80 This mark scheme is published as an aid to teachers and candidates, to indicate the requirements of the examination. It shows the basis on which Examiners were instructed to award marks. It does not indicate the details of the discussions that took place at an Examiners’ meeting before marking began, which would have considered the acceptability of alternative answers. Mark schemes must be read in conjunction with the question papers and the report on the examination. • CIE will not enter into discussions or correspondence in connection with these mark schemes. CIE is publishing the mark schemes for the October/November 2010 question papers for most IGCSE, GCE Advanced Level and Advanced Subsidiary Level syllabuses and some Ordinary Level syllabuses.
Mark scheme, page 2
Page 2 Mark Scheme: Teachers’ version Syllabus Paper GCE AS LEVEL – October/November 2010 8291 02 © UCLES 2010 Section A (Answer all questions in this section) 1 (a) Fig. 1.1 shows the flows and stores of water in a hydrological cycle within a river valley. (i) Name the flow that occurs at A and the store that occurs at B in Fig. 1.1. [2] A = transpiration (or evapotranspiration) = 1 B = ground water = 1 (ii) What is meant by the terms evaporation and interception? [2] evaporation = the process whereby liquid water is transformed into water vapour (usually by heat or air movement) = 1 interception = the capture of precipitation by leaves etc before reaching the ground = 1 (iii) Describe how a balance between the input of water from precipitation and output of water from the river is maintained in a river basin. [3] Credit three distinct points from below. Whilst 1 is a requirement credit with one mark two other points. 1 inputs of precipitation should equal losses e.g. flows, evapotranspiration etc 2 down slope movement of water towards the floodplain and river 3 removal of water by the river 4 credit other relevant points as long as they relate to balance. (iv) What effects would the construction of a large town in area X in Fig. 1.1 have upon discharge of water into the river. [3] Credit one mark for each of three points or 2/3 for well developed points. The question is concerned with the rate of discharge not water quality. 1 river discharge becomes erratic with a tendency for downstream flooding 2 precipitation is quickly directed from gutters in to drains and sewers 3 impermeable surfaces means less infiltration and rapid flow into the river. (b) Fig. 1.2 contains information on the River Colorado Drainage Basin. Fig. 1.3 shows how the discharge of the River Colorado below the Hoover Dam changed between 1920 and 2000. (i) Using evidence from Fig. 1.2 and Fig. 1.3 describe how the River Colorado can now be regarded as being a managed river. [3] For 3 marks there must be reference to Fig. 1.2 and Fig. 1.3 (i.e. 1/2 or 2/1). Credit to a maximum of 1 mark references to natural flow. Fig. 1.2 contains information on dams, reservoirs, drainage diversions Fig. 1.3 refers to losses in discharge due to dammed reservoirs.
Mark scheme, page 3
Page 3 Mark Scheme: Teachers’ version Syllabus Paper GCE AS LEVEL – October/November 2010 8291 02 © UCLES 2010 (ii) Suggest three ways in which management of the River Colorado benefits human activity. [3] Credit three distinct points: Reservoirs and dams contribute: water storage for human consumption, HEP, and leisure. Irrigation of golf courses (Palm Springs); water to Las Vegas (iii) Using evidence from Fig. 1.3, outline how the management of the Colorado could have a negative effect upon agriculture and the natural environment in area X in Fig. 1.2. [4] Max 3 for agriculture and max 3 for environment. Award 1 mark for each brief point or 2 for a well argued point. Agricultural effects include: loss of sediment that formerly replenished soils; loss of water for irrigation; increased salinity of soils (max 3) Loss of freshwater discharge into Baja California, ecological impacts, erosion of delta, desertification (max 3). [Total: 20] 2 (a) Fig. 2.1 is a model that describes population size in terms of processes that form inputs and outputs. (i) Which two processes control natural population change? [1] Births and deaths (ii) Describe how the inputs and outputs to the model interact to produce an increase in population. [2] For two marks answers; births exceed deaths (1 mark) and immigration exceeds emigration (1 mark). Answers that emphasise natural change as the dominant process over very small rates of migration deserve 2 marks. (b) The Demographic Transition Model in Fig. 2.2 shows how birth rates and death rates interact to produce changes to a nation’s population. (i) Complete a dashed line for stages 2, 3 and 4 onto Fig. 2.2 to show how population size changes according to the birth rate and death rate. The position of this line in stages 1 and 5 is already drawn. [2] Correctly shaped curve (steep upwards in 2, gentler in 3 and level in 4) The curve must be concave. (ii) Write the labels Y and Z onto Fig. 2.2 to show the positions of France and Paraguay in the demographic transition model. [2] One mark for each: France in stage 4 Paraguay in stage 2 or on 2/3 boundary. Correct positioning need not relate to the drawn curve.
Mark scheme, page 4
Page 4 Mark Scheme: Teachers’ version Syllabus Paper GCE AS LEVEL – October/November 2010 8291 02 © UCLES 2010 (c) The population pyramids in Fig. 2.3 show the population structure of a Less Economically Developed Country (LEDC) and a More Economically Developed Country (MEDC). [4] Describe two socio-economic factors that would account for the difference between the two population pyramids. The question is concerned with differences in socio-economic conditions and notionally there are 2 marks for each. Credit mark for recognising the difference in shape (= 1) Differences in life expectancy (LEDC low and MEDC is high) = 1; a valid reason for the difference = 1. Differences in the birth rate (LEDC is high and LEDC is lower) = 1: a valid reason = 1 Credit 1 mark for another relevant factor e.g. disease, HIV, food etc. (d) In 2004 an international committee suggested that the ‘state of the world’ would follow the trends shown in Fig. 2.4. (i) Describe the relationship between changes to the global population and resources, industrial output, pollution and food between 1990 and 2000. [5] Population in this phase shows exponential growth (= 1), which increases demand for resources that show a decline from 1950 (= 1), increased industrial output links with development and demand (= 1), more people means more demand for food (= 1), a combination of all factors produces an exponential rise in pollution (= 1) (ii) Explain the possible state of the world scenario for the period 2050 to 2100. [4] Very much a Malthusian projection with population stabilising at a lower level (1 mark) along with lower food supply + less demand (1 mark). As resources continue to decline (1 mark) industry declines (1 mark). Credit other valid interpretations with single marks for each interactive point. [Total: 20]
Mark scheme, page 5
Page 5 Mark Scheme: Teachers’ version Syllabus Paper GCE AS LEVEL – October/November 2010 8291 02 © UCLES 2010 Section B (Select one question from this section) 3 (a) Briefly describe the differences in the provision of safe drinking water and basic sanitation between Less Economically Developed Countries (LEDCs) and More Economically Developed Countries (MEDCs) as shown in Table 3.1. Give three reasons for these differences. [10] Marks should be allocated with 3 marks for the description and 3 × 2 for each reason. 1 mark reserved for pointing out the strength of the contrast. Description; 1 mark for each of developing and developed (= 2 marks) and 1 mark for use of data. Reasons could include: 1 contrasts in wealth and the ability to invest in water purification/supply 2 infrastructure refers to provision to urban and rural areas through pipe linked to reservoirs and plants 3 poor sanitation and waste disposal in developing countries contrast with developed i.e. a supply and demand issue 4 contrasts in types of provision via examples. For 8 to 10 marks there should be a good description and 3 well developed reasons. For 4 to 7 marks an accurate description might be followed by weak or limited reasoning. For 1 to 3 marks both components of the question will be weak or one may be absent. (b) With reference to either a LEDC or MEDC you have studied, describe the methods that are currently used to achieve a sustainable water supply and basic sanitation. Discuss one positive and one negative environmental effect of the methods you have described. [30] Notionally credit 20 marks for the first part of the question with a suggested balance of up to a maximum of 10 for a safe supply and up to a maximum of 10 for sanitation. The remaining 10 marks are for the positive (5) and negative effects (5). Use the band descriptors to determine the final mark. Indicative content as is appropriate for MEDC’s and LEDC’s Sustainable water supply could include: capital investment in dams and reservoirs; desalination plants; wells; ground water and river extraction and supply infrastructure; measures to clean and maintain the quality of river and ground water; infrastructural development. Basic sanitation could include: investment in domestic and commercial waste disposal; sewage disposal; investment in urban infrastructure e.g. covered sewers, treatment before disposal into rivers etc. Positive and negative environmental evaluation: can include the human and natural environment.
Mark scheme, page 6
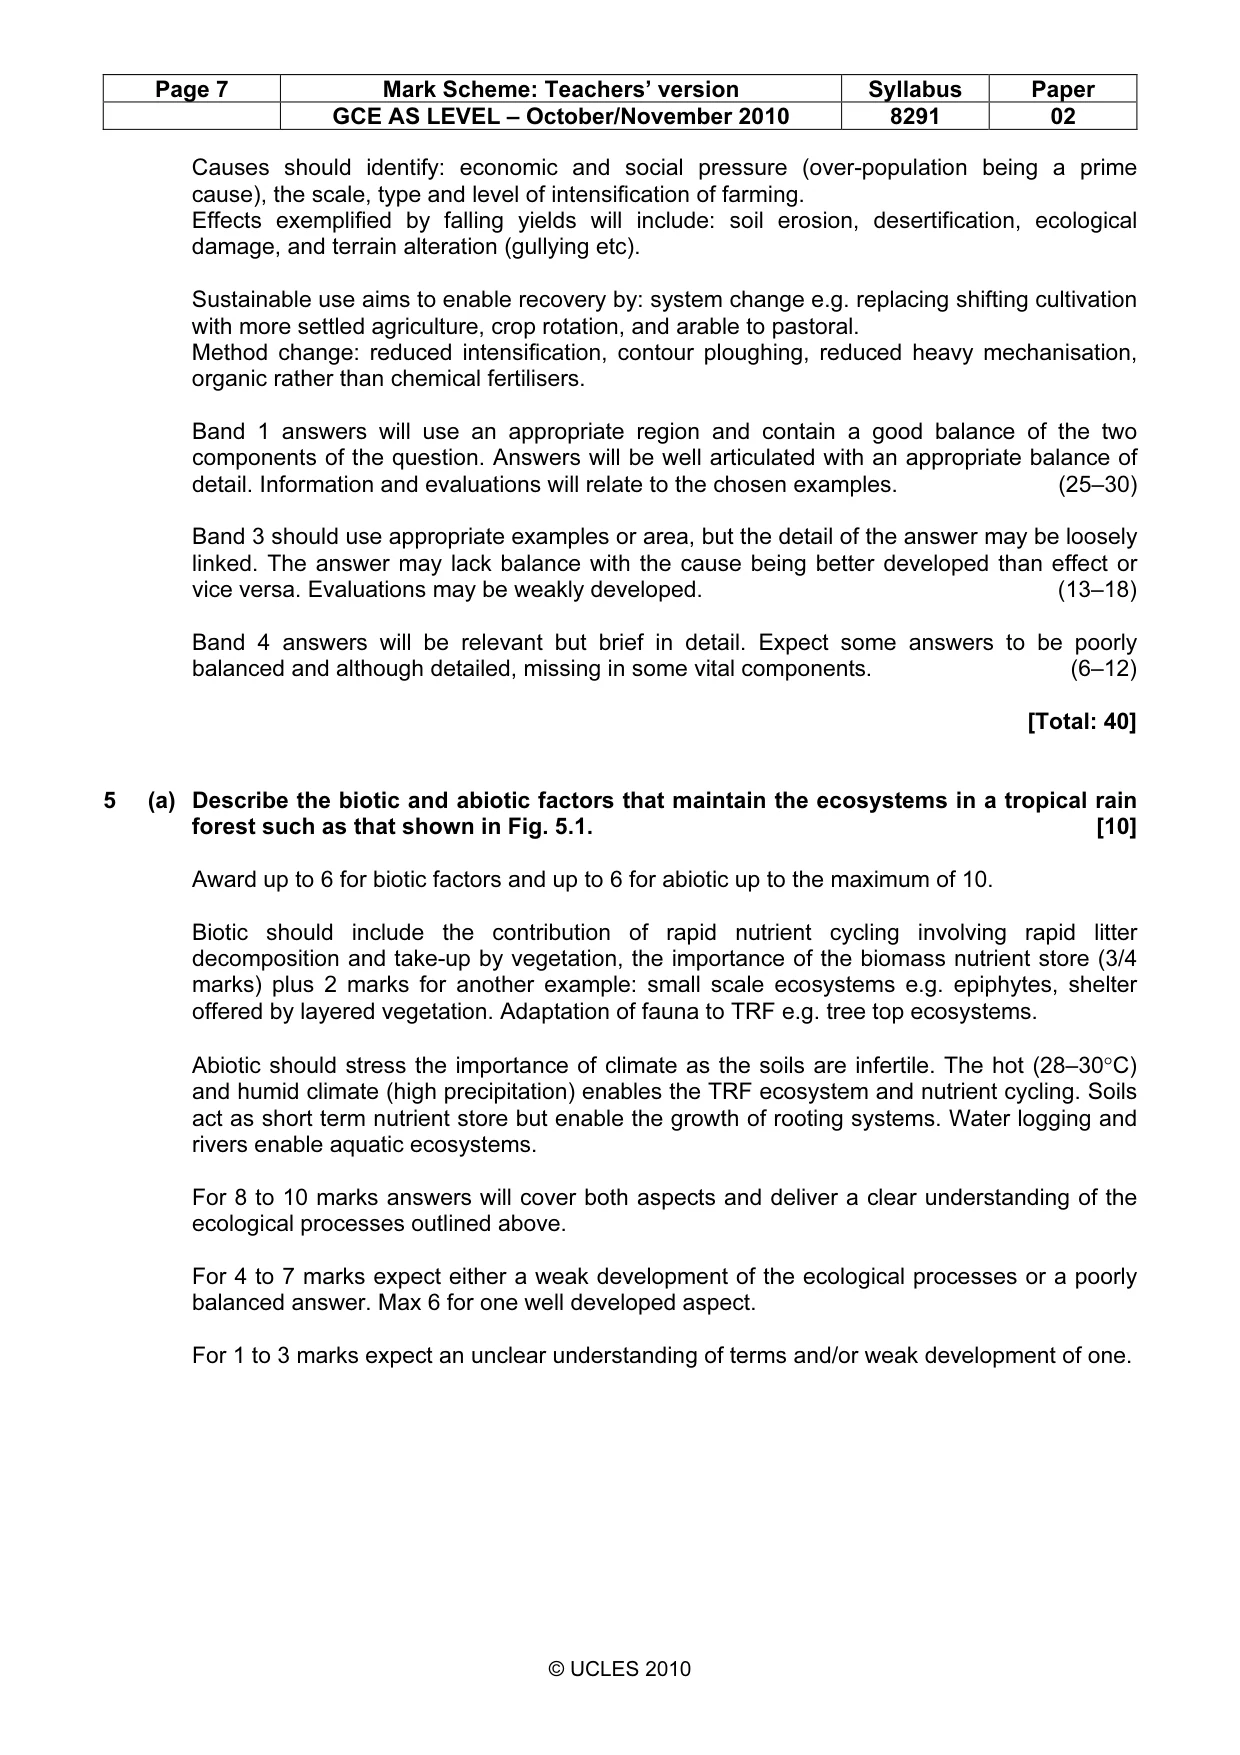
Page 6 Mark Scheme: Teachers’ version Syllabus Paper GCE AS LEVEL – October/November 2010 8291 02 © UCLES 2010 Band 1 answers will use an appropriate region and contain a good balance of the four components of the question. The answers will be well articulated with an appropriate balance of detail. Information and evaluations will relate to the chosen examples. (25–30) Band 3 should use an appropriate region but the detail of the answer may be loosely linked. The answer may lack balance with sustainable water supply have better treatment than sanitation. Evaluations may be weakly developed. (13–18) Band 4 answers will be relevant but brief in detail. Sanitation may be weakly developed or absent and evaluations very brief. (6–12) [Total: 40] 4 (a) Fig. 4.1 shows a relationship between agricultural productivity and plant species diversity in soils at different levels of soil productivity. Give three reasons for the ways in which plant species diversity and agricultural productivity change in Fig. 4.1. [10] In terms of variations in inherent soil fertility, it is necessary to bring out the influence of sustainable and unsustainable agriculture on plant diversity and agricultural yield. Without agriculture, plant diversity will achieve a maxima. Clearly on marginal land containing soils of low fertility agriculture can easily become unsustainable and reduce plant diversity. As soils become more fertile agricultural yield will increase but plant diversity will reduce at a slower rate. Mark in bands. For 8 to 10 marks answers will give three reasons that bring out the above points and in particular notice refinements such as the slower reduction in plant diversity and the maxima of plant diversity at the start. For 4 to 7 marks answers will give at least two reasons and provide a methodical analysis of the two curves with loose development of agriculture and soil fertility For 1 to 3 marks expect brief and disjointed answers. The connection between the two curves and soils/productivity will be poorly described. (b) Using examples with which you are familiar, describe how agricultural activity has contributed to land degradation. Assess two methods that would enable a sustainable use of agricultural land. [30] This is a two part answer and notionally each is worth about 15 marks. Whereas part (a) has concerns with broad relationships, this section is concerned with how land degradation occurs. The examples that are needed can relate to forms of agriculture related land degradation and/or areas. Indicative content. Examples should relate to agriculture that has become unsustainable; this might simply be because of the nature of the farming activity or prompted by climatic change. Examples could include: the Dust Bowl (USA), Sudan and Darfur, Himalayan foothills, Sub-Saharan Sahel, Areas of shifting cultivation etc.
Mark scheme, page 7
Page 7 Mark Scheme: Teachers’ version Syllabus Paper GCE AS LEVEL – October/November 2010 8291 02 © UCLES 2010 Causes should identify: economic and social pressure (over-population being a prime cause), the scale, type and level of intensification of farming. Effects exemplified by falling yields will include: soil erosion, desertification, ecological damage, and terrain alteration (gullying etc). Sustainable use aims to enable recovery by: system change e.g. replacing shifting cultivation with more settled agriculture, crop rotation, and arable to pastoral. Method change: reduced intensification, contour ploughing, reduced heavy mechanisation, organic rather than chemical fertilisers. Band 1 answers will use an appropriate region and contain a good balance of the two components of the question. Answers will be well articulated with an appropriate balance of detail. Information and evaluations will relate to the chosen examples. (25–30) Band 3 should use appropriate examples or area, but the detail of the answer may be loosely linked. The answer may lack balance with the cause being better developed than effect or vice versa. Evaluations may be weakly developed. (13–18) Band 4 answers will be relevant but brief in detail. Expect some answers to be poorly balanced and although detailed, missing in some vital components. (6–12) [Total: 40] 5 (a) Describe the biotic and abiotic factors that maintain the ecosystems in a tropical rain forest such as that shown in Fig. 5.1. [10] Award up to 6 for biotic factors and up to 6 for abiotic up to the maximum of 10. Biotic should include the contribution of rapid nutrient cycling involving rapid litter decomposition and take-up by vegetation, the importance of the biomass nutrient store (3/4 marks) plus 2 marks for another example: small scale ecosystems e.g. epiphytes, shelter offered by layered vegetation. Adaptation of fauna to TRF e.g. tree top ecosystems. Abiotic should stress the importance of climate as the soils are infertile. The hot (28–30°C) and humid climate (high precipitation) enables the TRF ecosystem and nutrient cycling. Soils act as short term nutrient store but enable the growth of rooting systems. Water logging and rivers enable aquatic ecosystems. For 8 to 10 marks answers will cover both aspects and deliver a clear understanding of the ecological processes outlined above. For 4 to 7 marks expect either a weak development of the ecological processes or a poorly balanced answer. Max 6 for one well developed aspect. For 1 to 3 marks expect an unclear understanding of terms and/or weak development of one.
Mark scheme, page 8
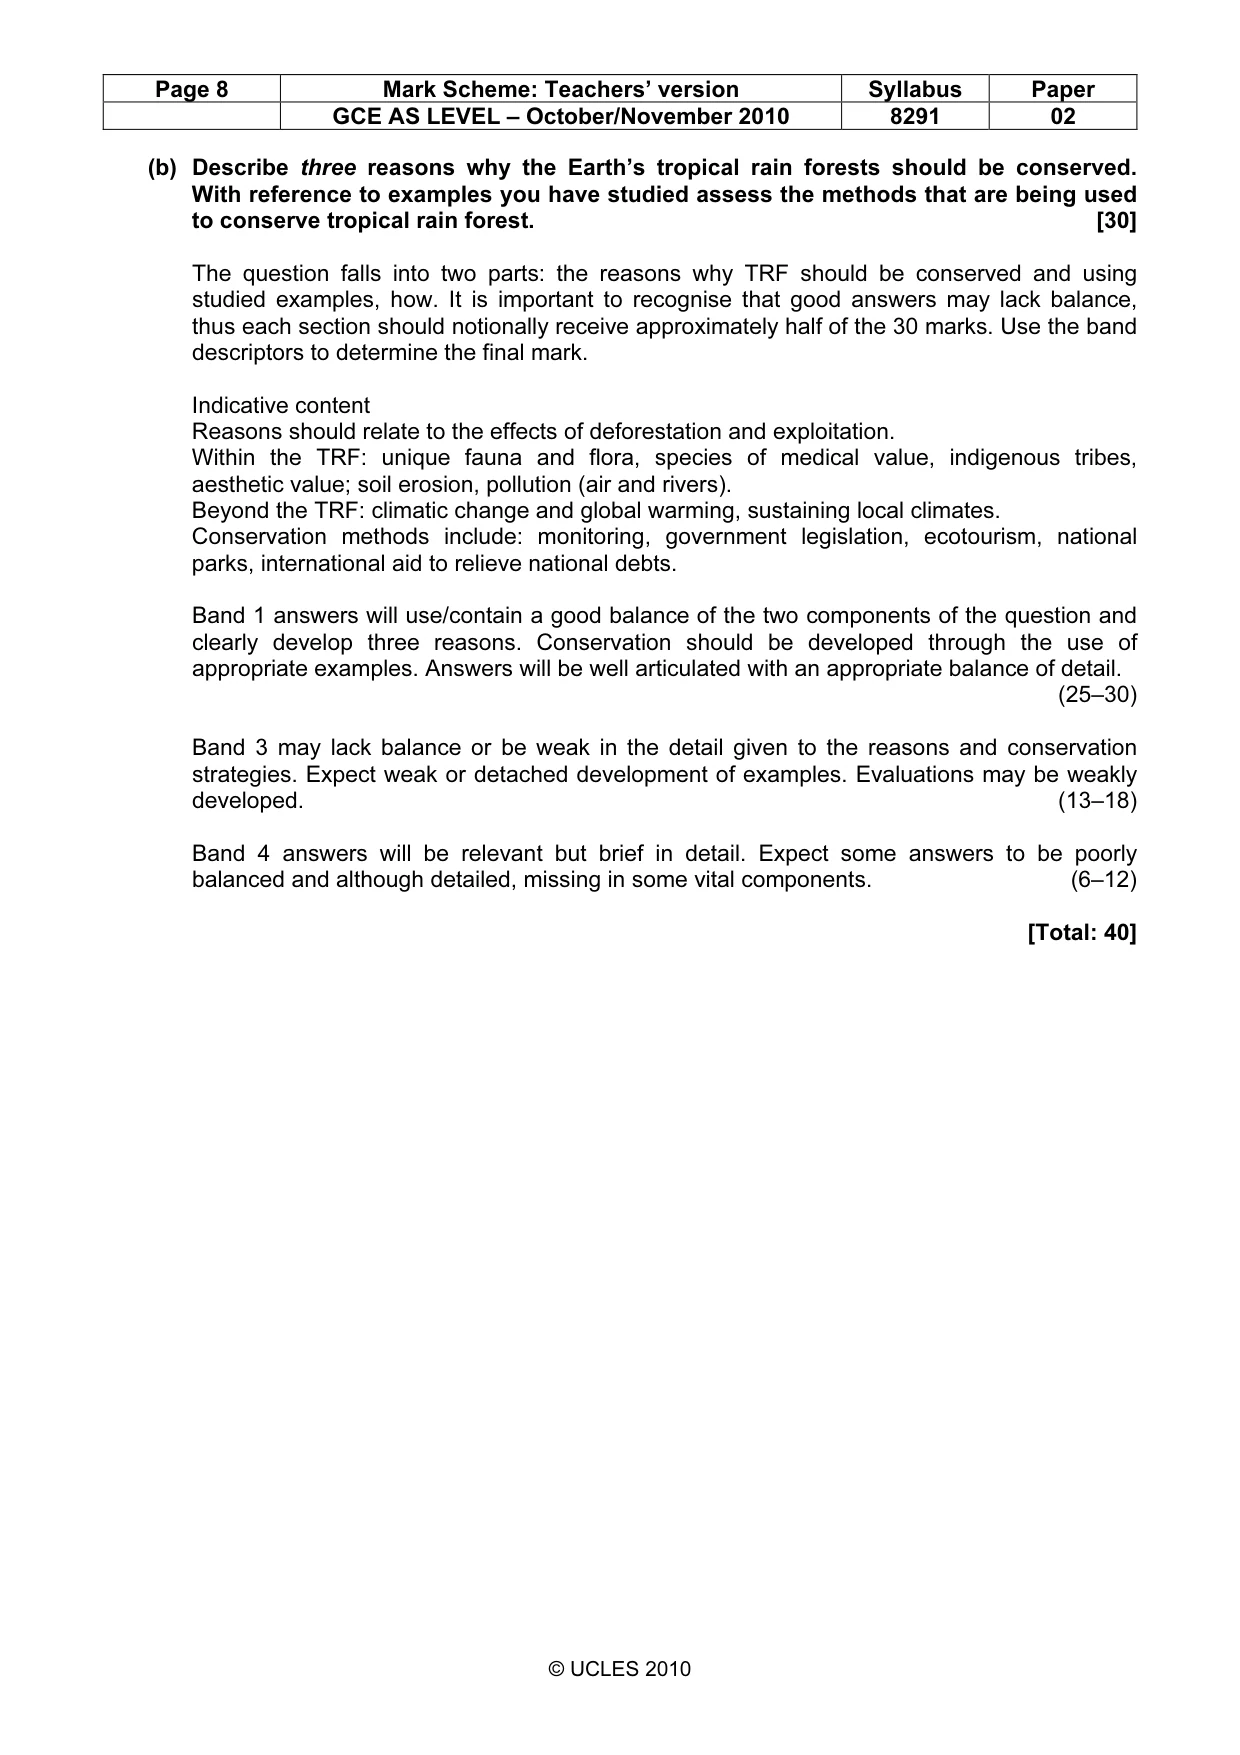
Page 8 Mark Scheme: Teachers’ version Syllabus Paper GCE AS LEVEL – October/November 2010 8291 02 © UCLES 2010 (b) Describe three reasons why the Earth’s tropical rain forests should be conserved. With reference to examples you have studied assess the methods that are being used to conserve tropical rain forest. [30] The question falls into two parts: the reasons why TRF should be conserved and using studied examples, how. It is important to recognise that good answers may lack balance, thus each section should notionally receive approximately half of the 30 marks. Use the band descriptors to determine the final mark. Indicative content Reasons should relate to the effects of deforestation and exploitation. Within the TRF: unique fauna and flora, species of medical value, indigenous tribes, aesthetic value; soil erosion, pollution (air and rivers). Beyond the TRF: climatic change and global warming, sustaining local climates. Conservation methods include: monitoring, government legislation, ecotourism, national parks, international aid to relieve national debts. Band 1 answers will use/contain a good balance of the two components of the question and clearly develop three reasons. Conservation should be developed through the use of appropriate examples. Answers will be well articulated with an appropriate balance of detail. (25–30) Band 3 may lack balance or be weak in the detail given to the reasons and conservation strategies. Expect weak or detached development of examples. Evaluations may be weakly developed. (13–18) Band 4 answers will be relevant but brief in detail. Expect some answers to be poorly balanced and although detailed, missing in some vital components. (6–12) [Total: 40]
Mark scheme, page 9
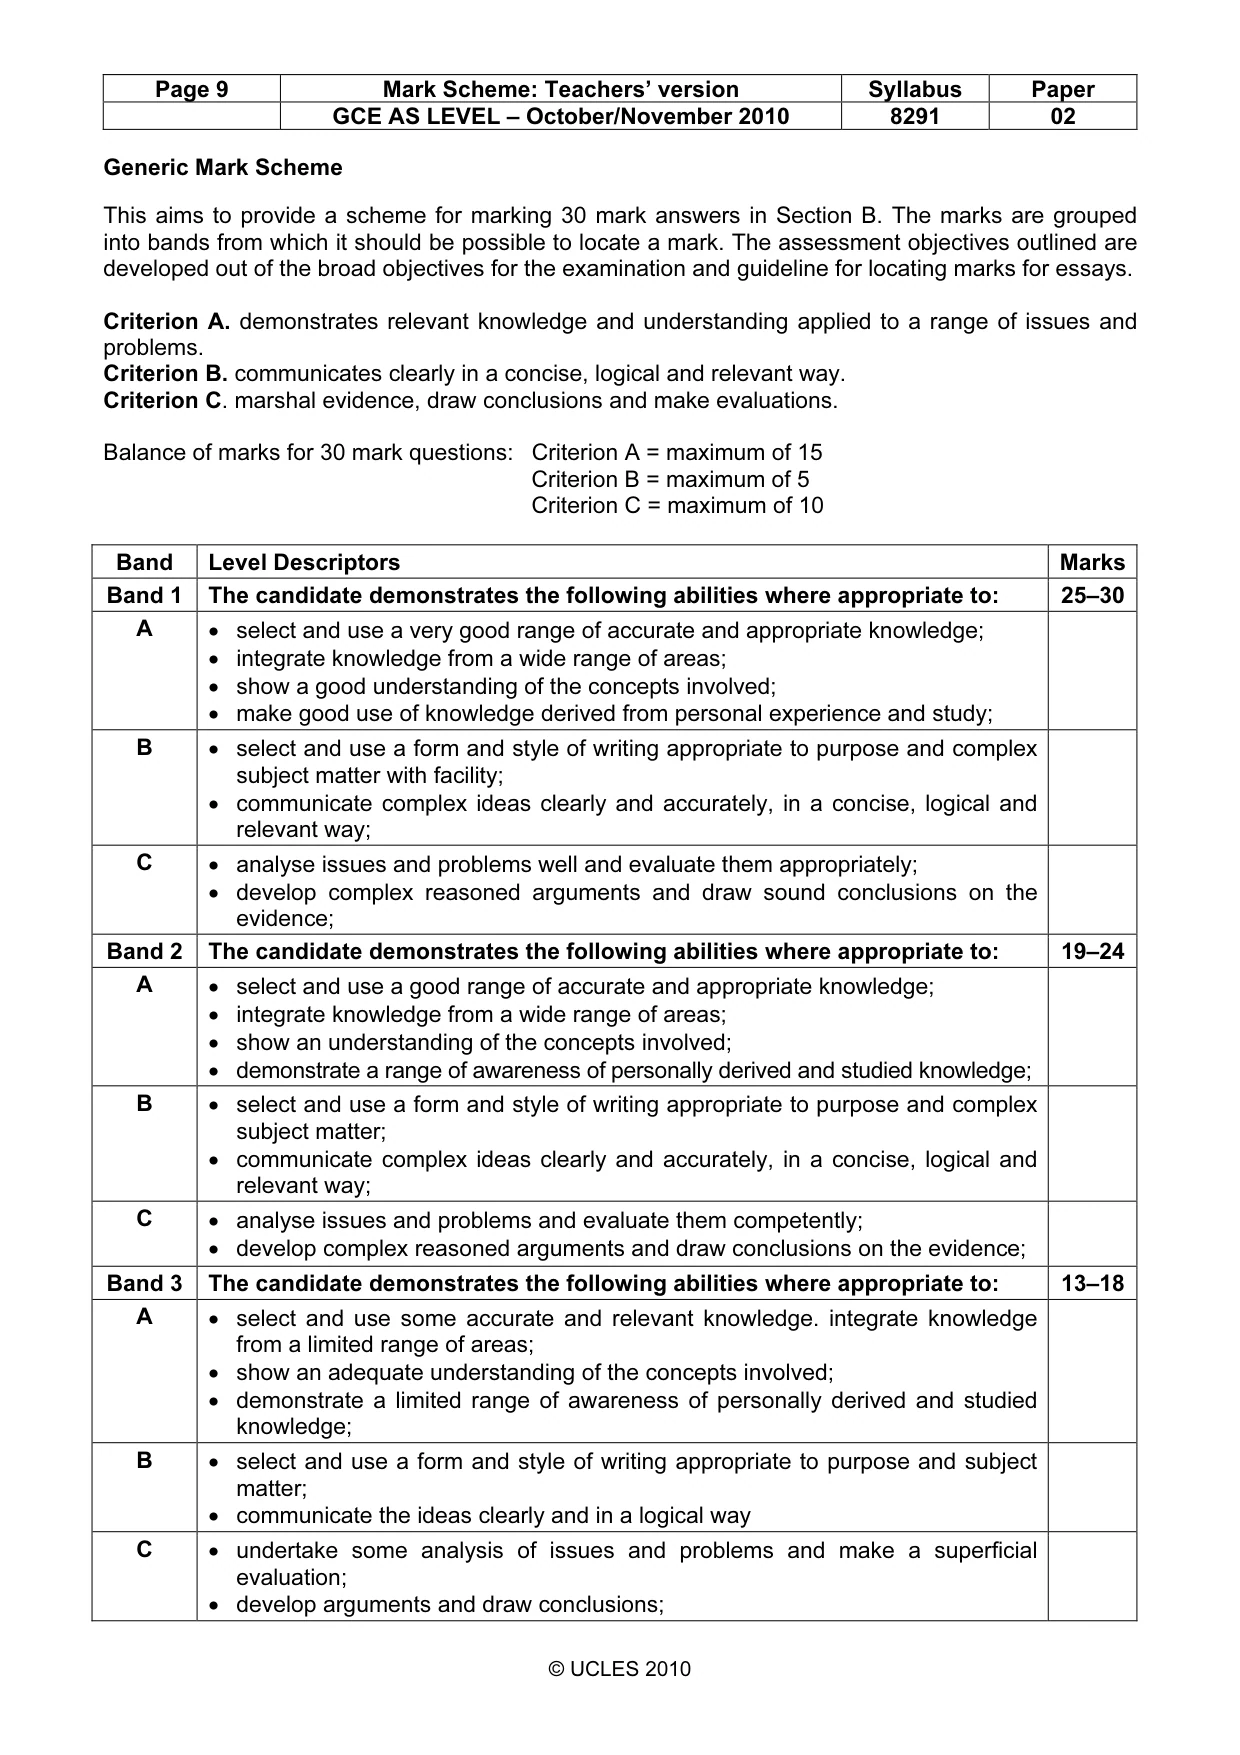
Page 9 Mark Scheme: Teachers’ version Syllabus Paper GCE AS LEVEL – October/November 2010 8291 02 © UCLES 2010 Generic Mark Scheme This aims to provide a scheme for marking 30 mark answers in Section B. The marks are grouped into bands from which it should be possible to locate a mark. The assessment objectives outlined are developed out of the broad objectives for the examination and guideline for locating marks for essays. Criterion A. demonstrates relevant knowledge and understanding applied to a range of issues and problems. Criterion B. communicates clearly in a concise, logical and relevant way. Criterion C. marshal evidence, draw conclusions and make evaluations. Balance of marks for 30 mark questions: Criterion A = maximum of 15 Criterion B = maximum of 5 Criterion C = maximum of 10 Band Level Descriptors Marks Band 1 The candidate demonstrates the following abilities where appropriate to: 25–30 A • select and use a very good range of accurate and appropriate knowledge; • integrate knowledge from a wide range of areas; • show a good understanding of the concepts involved; • make good use of knowledge derived from personal experience and study; B • select and use a form and style of writing appropriate to purpose and complex subject matter with facility; • communicate complex ideas clearly and accurately, in a concise, logical and relevant way; C • analyse issues and problems well and evaluate them appropriately; • develop complex reasoned arguments and draw sound conclusions on the evidence; Band 2 The candidate demonstrates the following abilities where appropriate to: 19–24 A • select and use a good range of accurate and appropriate knowledge; • integrate knowledge from a wide range of areas; • show an understanding of the concepts involved; • demonstrate a range of awareness of personally derived and studied knowledge; B • select and use a form and style of writing appropriate to purpose and complex subject matter; • communicate complex ideas clearly and accurately, in a concise, logical and relevant way; C • analyse issues and problems and evaluate them competently; • develop complex reasoned arguments and draw conclusions on the evidence; Band 3 The candidate demonstrates the following abilities where appropriate to: 13–18 A • select and use some accurate and relevant knowledge. integrate knowledge from a limited range of areas; • show an adequate understanding of the concepts involved; • demonstrate a limited range of awareness of personally derived and studied knowledge; B • select and use a form and style of writing appropriate to purpose and subject matter; • communicate the ideas clearly and in a logical way C • undertake some analysis of issues and problems and make a superficial evaluation; • develop arguments and draw conclusions;
Mark scheme, page 10
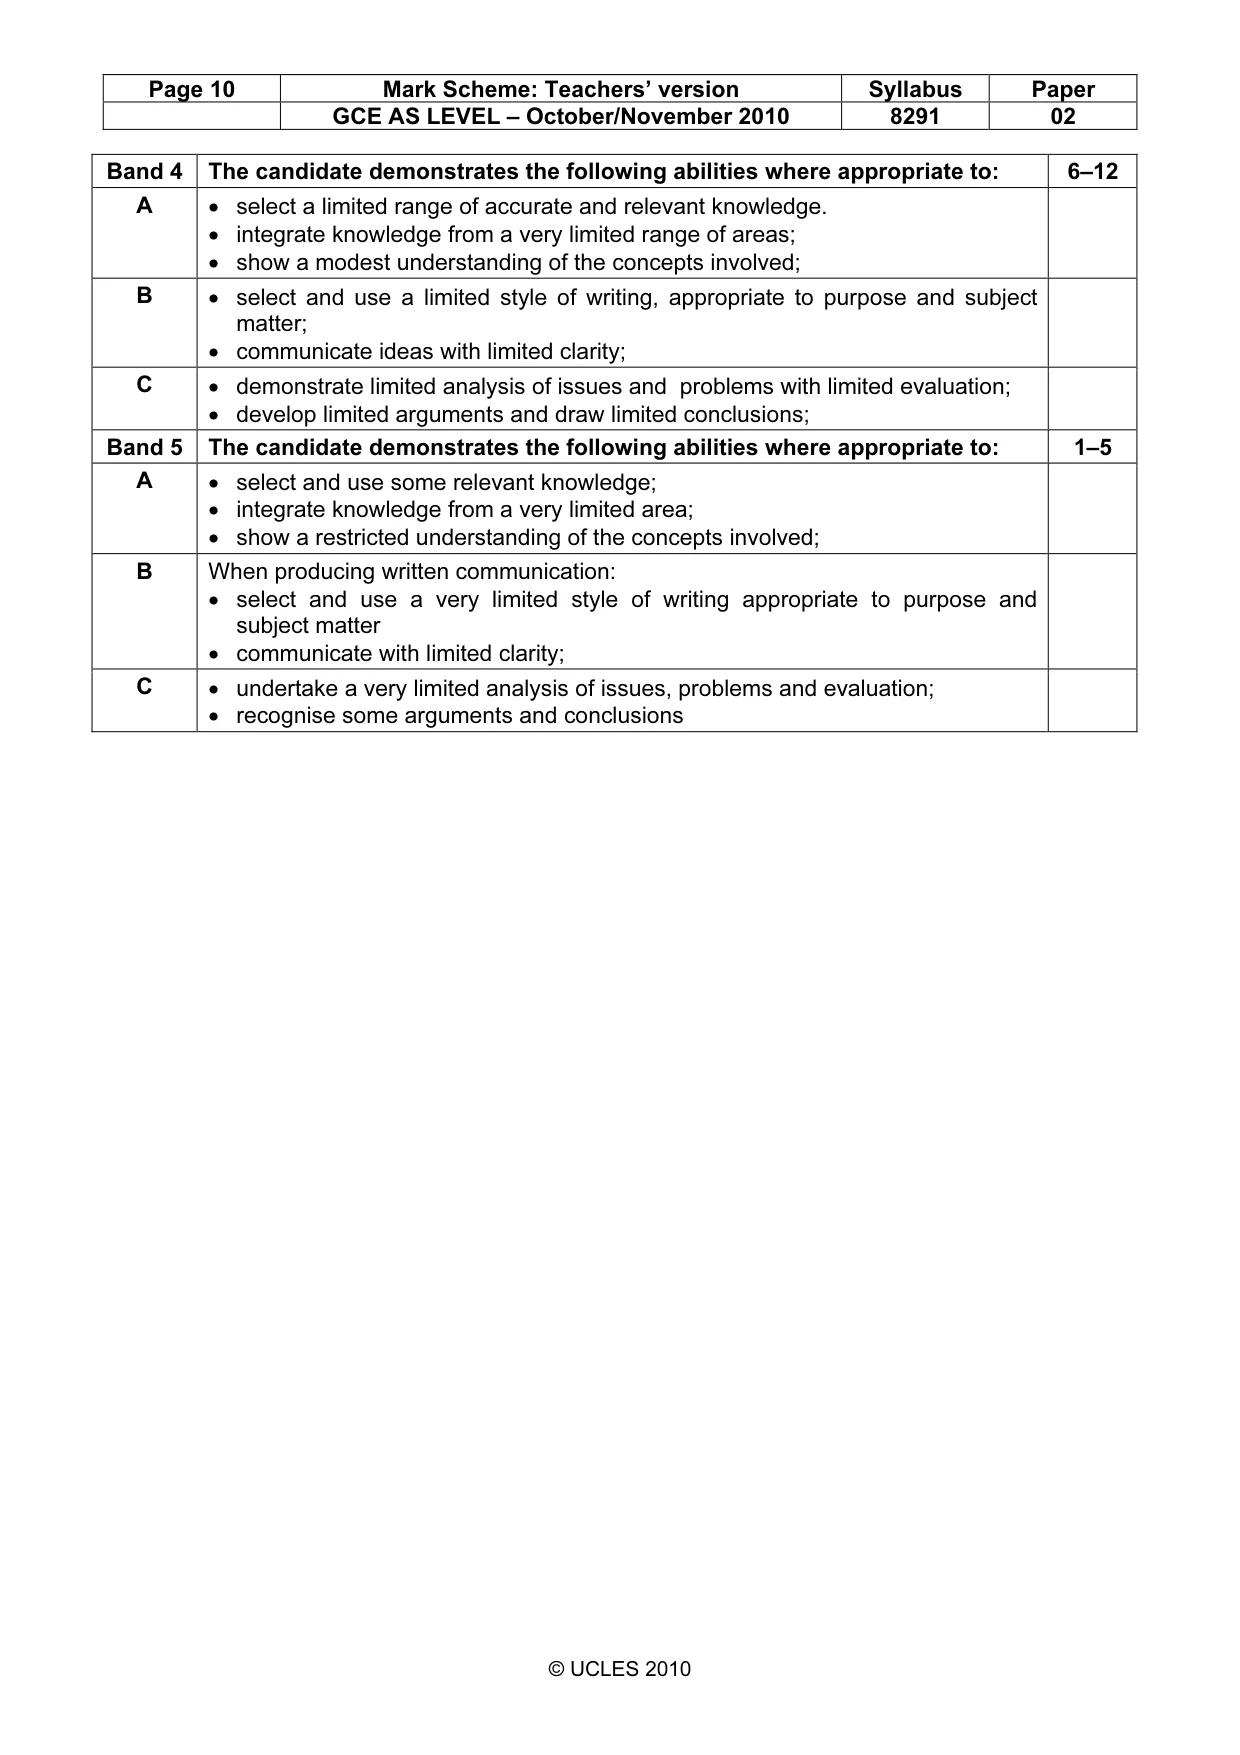
Page 10 Mark Scheme: Teachers’ version Syllabus Paper GCE AS LEVEL – October/November 2010 8291 02 © UCLES 2010 Band 4 The candidate demonstrates the following abilities where appropriate to: 6–12 A • select a limited range of accurate and relevant knowledge. • integrate knowledge from a very limited range of areas; • show a modest understanding of the concepts involved; B • select and use a limited style of writing, appropriate to purpose and subject matter; • communicate ideas with limited clarity; C • demonstrate limited analysis of issues and problems with limited evaluation; • develop limited arguments and draw limited conclusions; Band 5 The candidate demonstrates the following abilities where appropriate to: 1–5 A • select and use some relevant knowledge; • integrate knowledge from a very limited area; • show a restricted understanding of the concepts involved; B When producing written communication: • select and use a very limited style of writing appropriate to purpose and subject matter • communicate with limited clarity; C • undertake a very limited analysis of issues, problems and evaluation; • recognise some arguments and conclusions
What you needed in this session
Cambridge’s own grade thresholds for 2010 Oct/Nov, Paper 2 · Variant 1. A higher threshold means an easier paper — the bar moves with how the cohort did.