Cambridge A Level Environmental Management (AS only) 8291 — 2009 Oct/Nov Paper 1 · Variant 1
8291/11/O/N/09 · 80 marks · ≈90 min
The question paper and its mark scheme, free to read here and free to download. This is Cambridge’s own paper, exactly as it was sat.
Question paper12 pages

Mark scheme10 pages
Answers below. Sit the paper first if you are practising.
Paper as text
Question paper, page 1
This document consists of 12 printed pages. SP (DR/DR) T78920/2 © UCLES 2009 [Turn over UNIVERSITY OF CAMBRIDGE INTERNATIONAL EXAMINATIONS General Certificate of Education Advanced Subsidiary Level and Advanced Level READ THESE INSTRUCTIONS FIRST Write your Centre number, candidate number and name on all the work you hand in. Write in dark blue or black pen. You may use a soft pencil for any diagrams, graphs, tables or rough working. Do not use staples, paper clips, highlighters, glue or correction fluid. DO NOT WRITE IN ANY BARCODES. Section A Answer all questions. Write your answers in the spaces provided on the question paper. Section B Answer one question from this section. Answer the question on the separate answer paper provided. At the end of the examination, 1. fasten all separate answer paper securely to the question paper; 2. enter the question number from Section B in the grid opposite. ENVIRONMENTAL MANAGEMENT 8291/01 Paper 1 Lithosphere and Atmosphere October/November 2009 1 hour 30 minutes Additional Materials: Answer Booklet/Paper For Examiner’s Use Section A 1 2 Section B Total * 7 9 5 7 4 4 4 3 7 0 *
Question paper, page 2
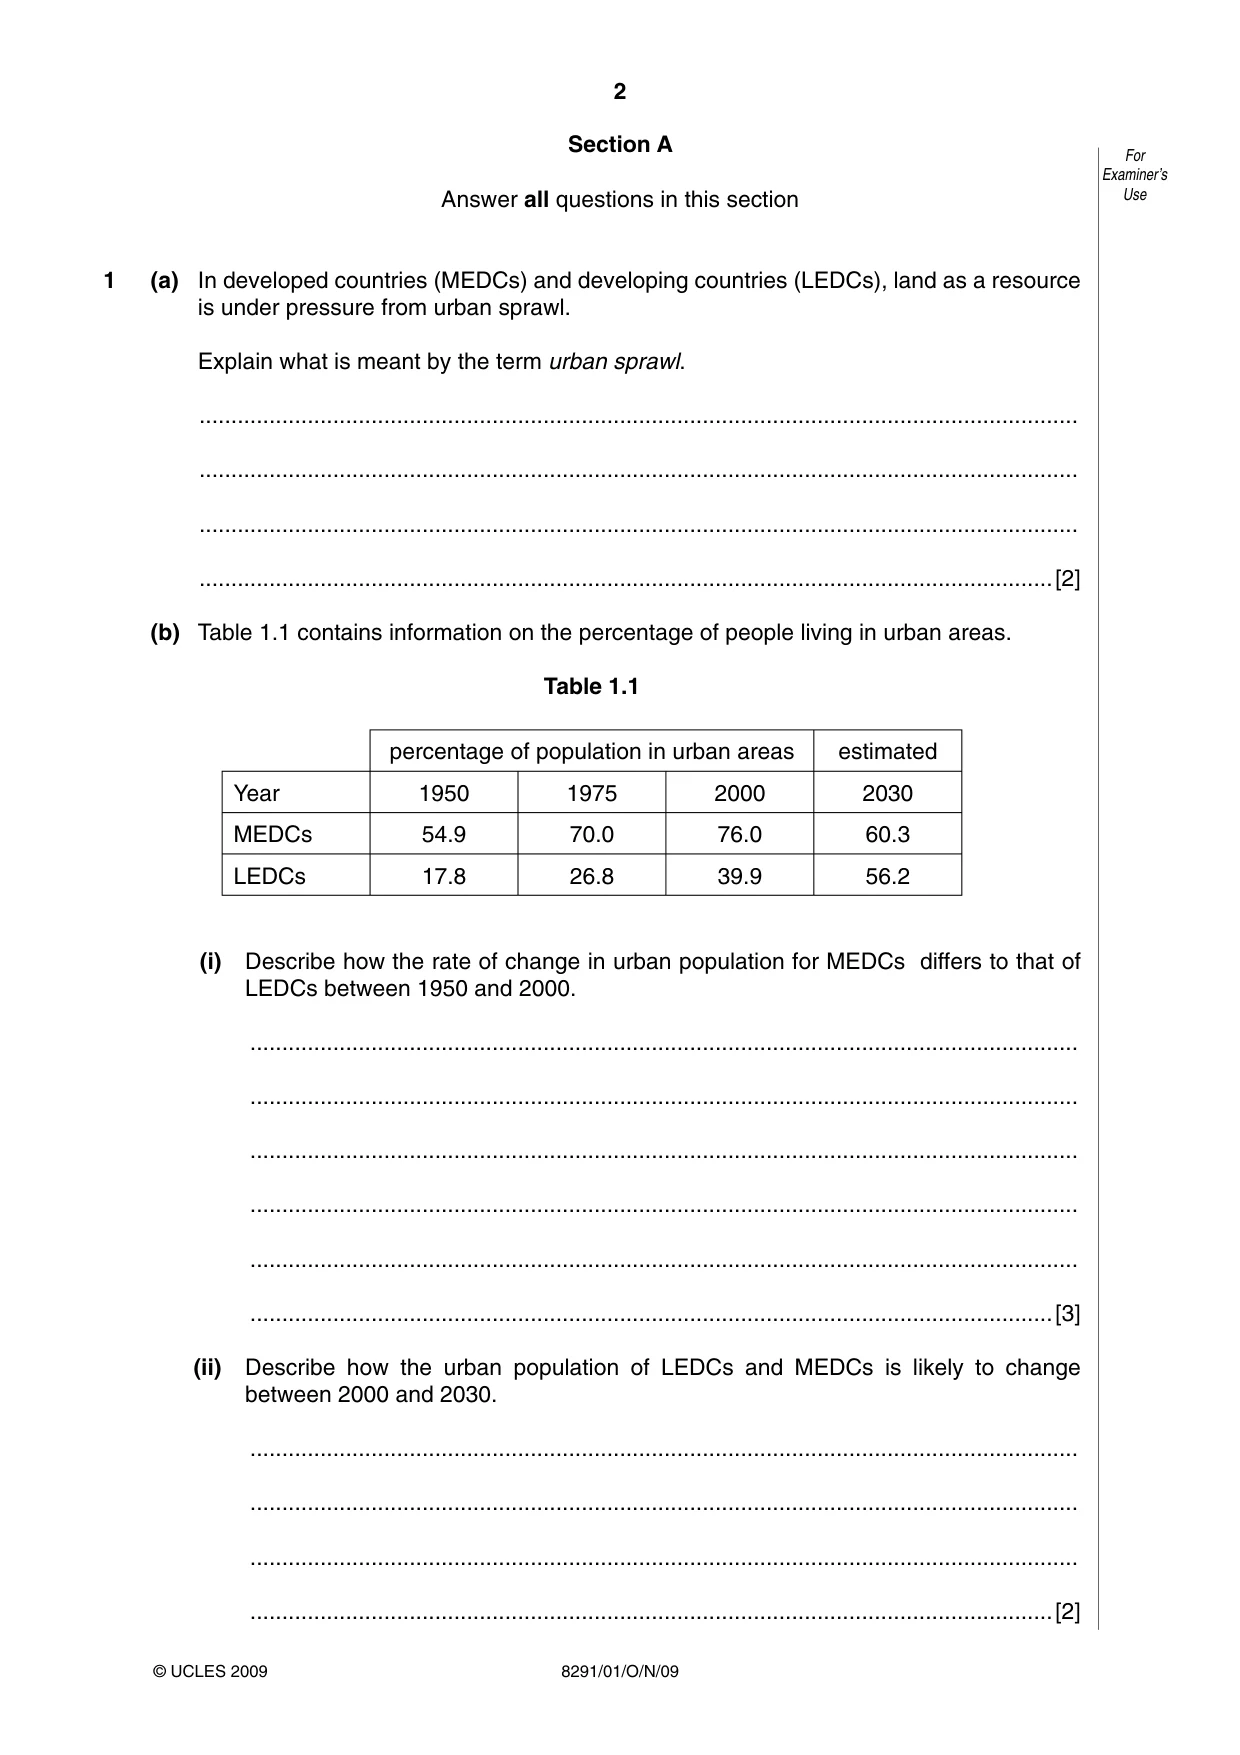
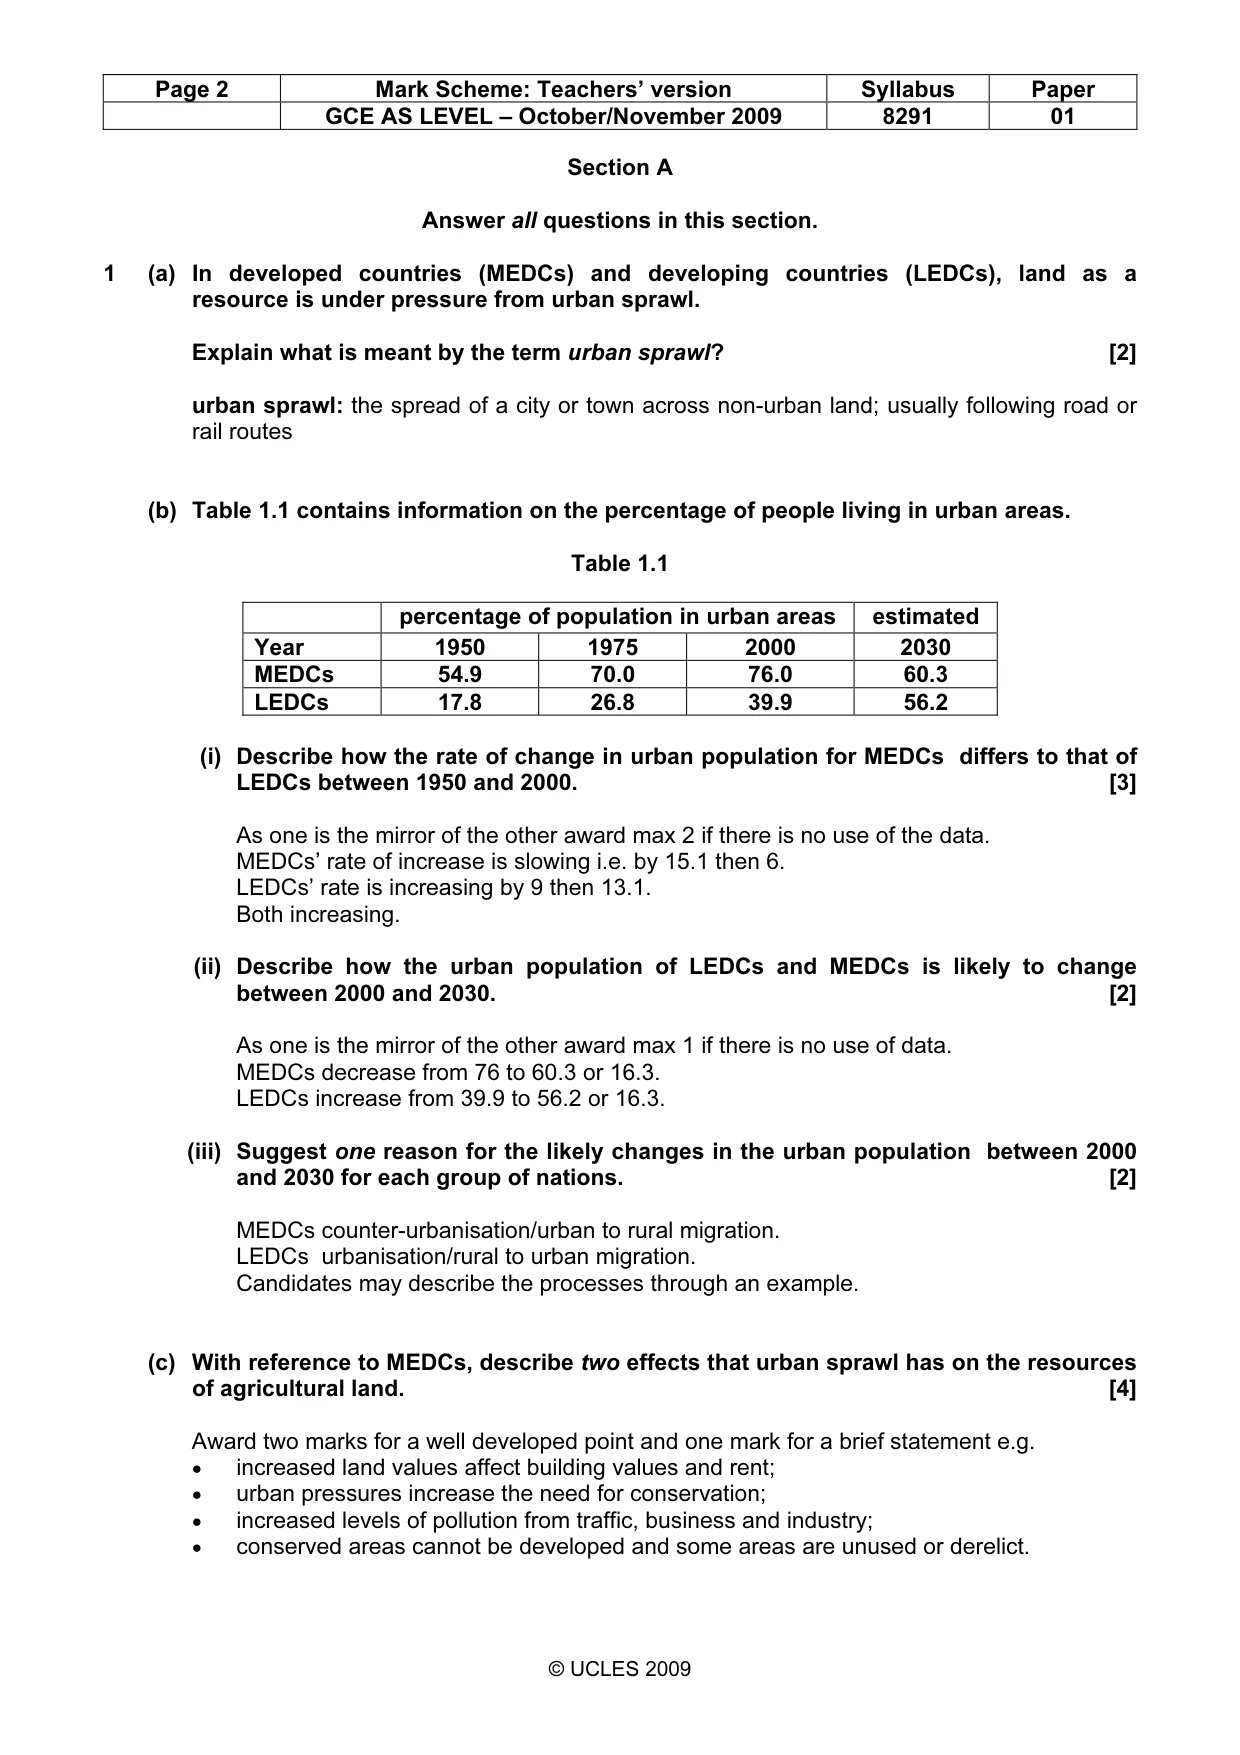
2 8291/01/O/N/09 For Examiner’s Use © UCLES 2009 Section A Answer all questions in this section 1 (a) In developed countries (MEDCs) and developing countries (LEDCs), land as a resource is under pressure from urban sprawl. Explain what is meant by the term urban sprawl. … … … …[2] (b) Table 1.1 contains information on the percentage of people living in urban areas. Table 1.1 percentage of population in urban areas estimated Year 1950 1975 2000 2030 MEDCs 54.9 70.0 76.0 60.3 LEDCs 17.8 26.8 39.9 56.2 (i) Describe how the rate of change in urban population for MEDCs differs to that of LEDCs between 1950 and 2000. … … … … … …[3] (ii) Describe how the urban population of LEDCs and MEDCs is likely to change between 2000 and 2030. … … … …[2]
Question paper, page 3
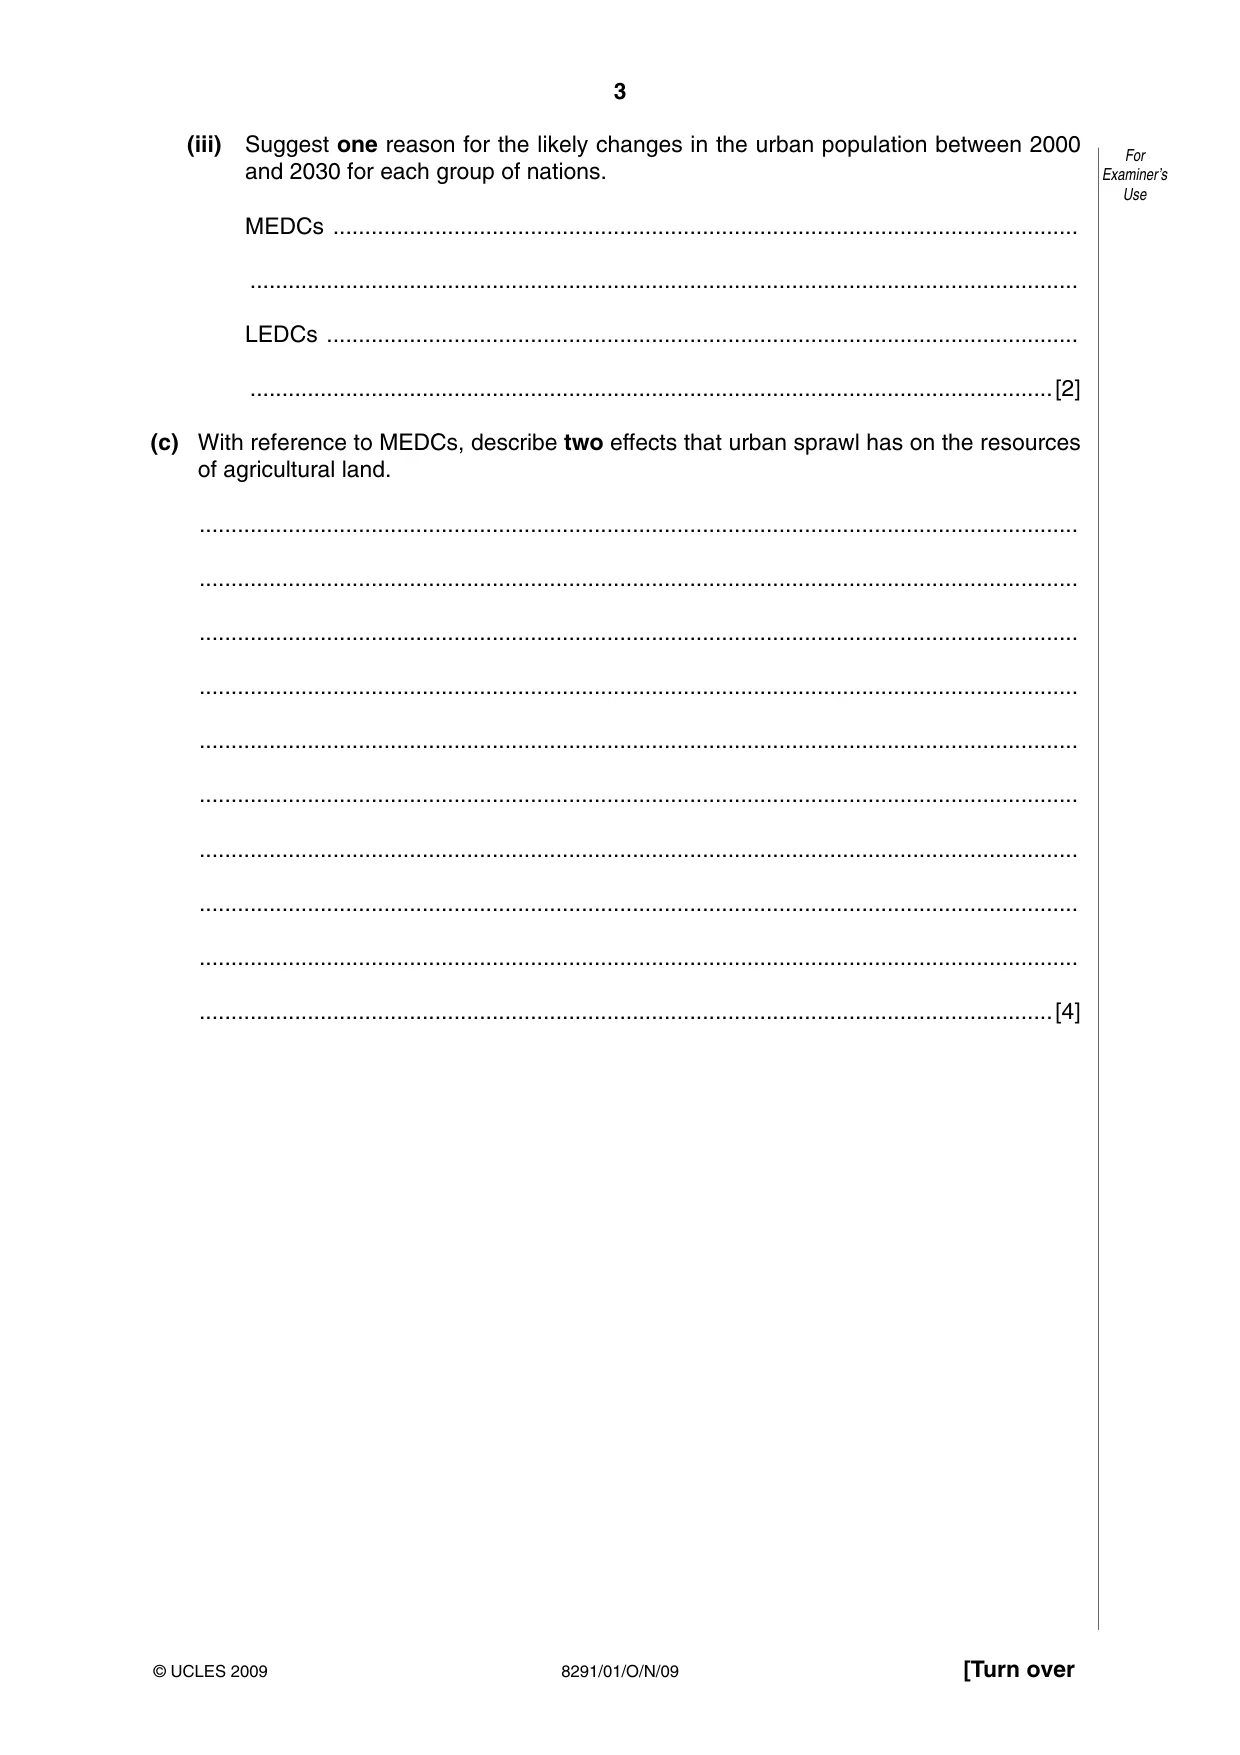
3 8291/01/O/N/09 [Turn over For Examiner’s Use © UCLES 2009 (iii) Suggest one reason for the likely changes in the urban population between 2000 and 2030 for each group of nations. MEDCs … … LEDCs … …[2] (c) With reference to MEDCs, describe two effects that urban sprawl has on the resources of agricultural land. … … … … … … … … … …[4]
Question paper, page 4
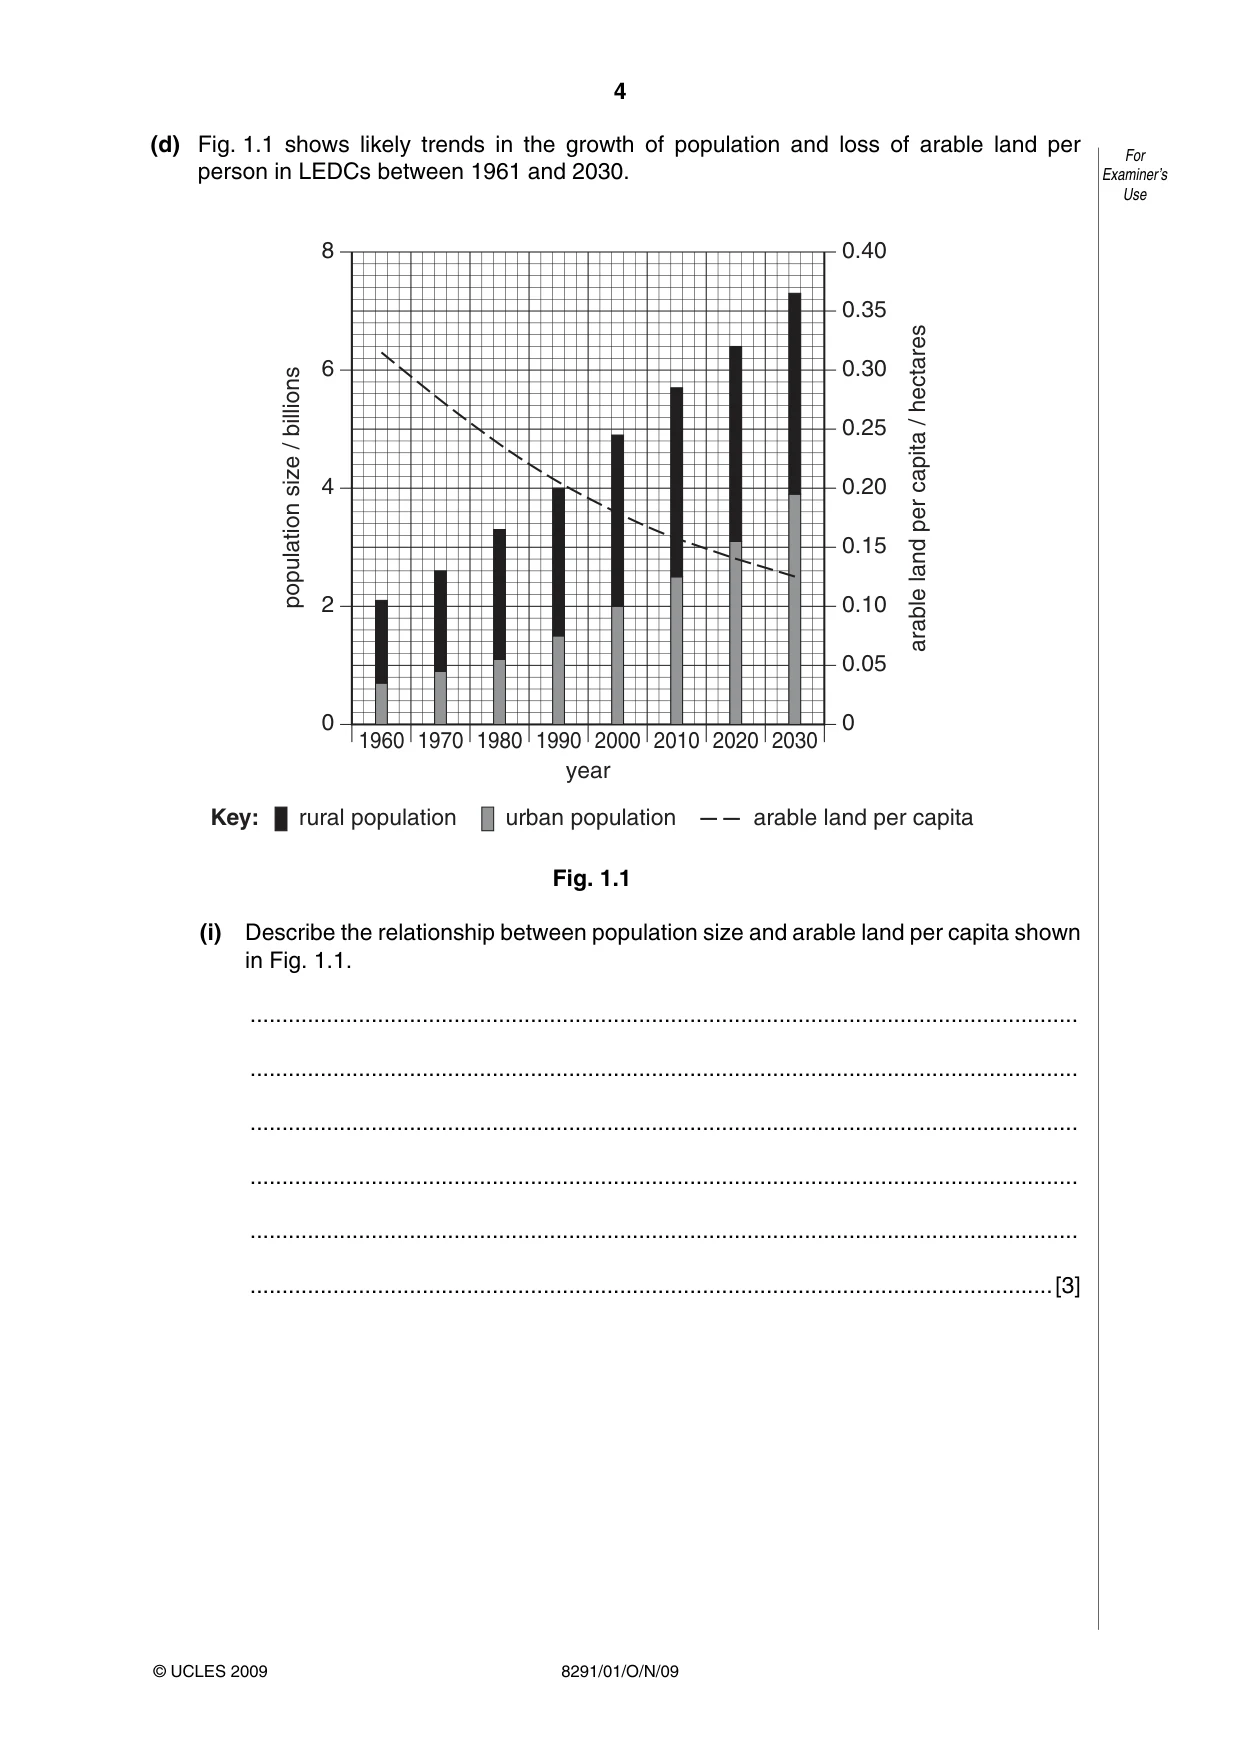
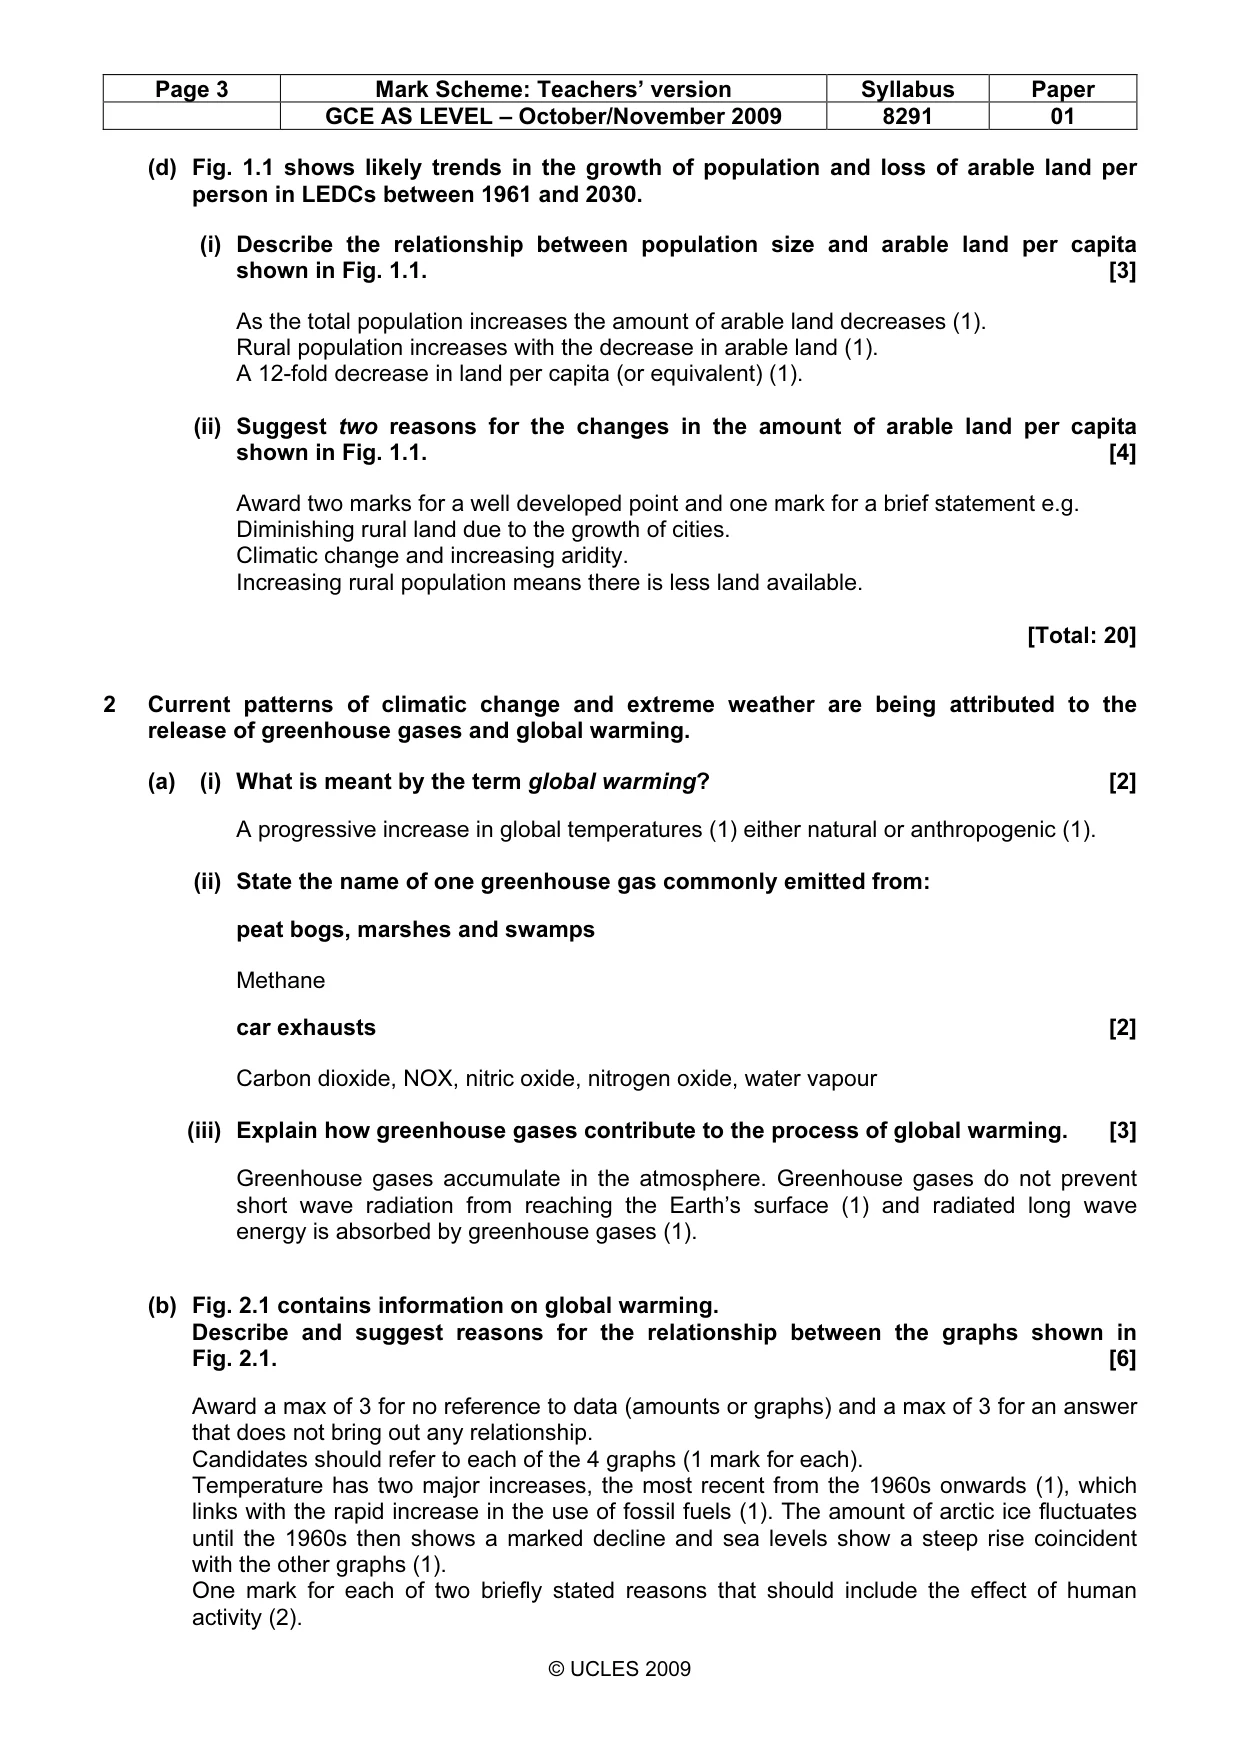
4 8291/01/O/N/09 For Examiner’s Use © UCLES 2009 (d) Fig. 1.1 shows likely trends in the growth of population and loss of arable land per person in LEDCs between 1961 and 2030. 1960 1970 1980 1990 2000 2010 2020 2030 0 0 0.05 0.10 0.15 0.20 0.25 0.30 0.35 0.40 2 4 6 8 population size / billions arable land per capita / hectares year Key: rural population urban population arable land per capita Fig. 1.1 (i) Describe the relationship between population size and arable land per capita shown in Fig. 1.1. … … … … … …[3]
Question paper, page 5
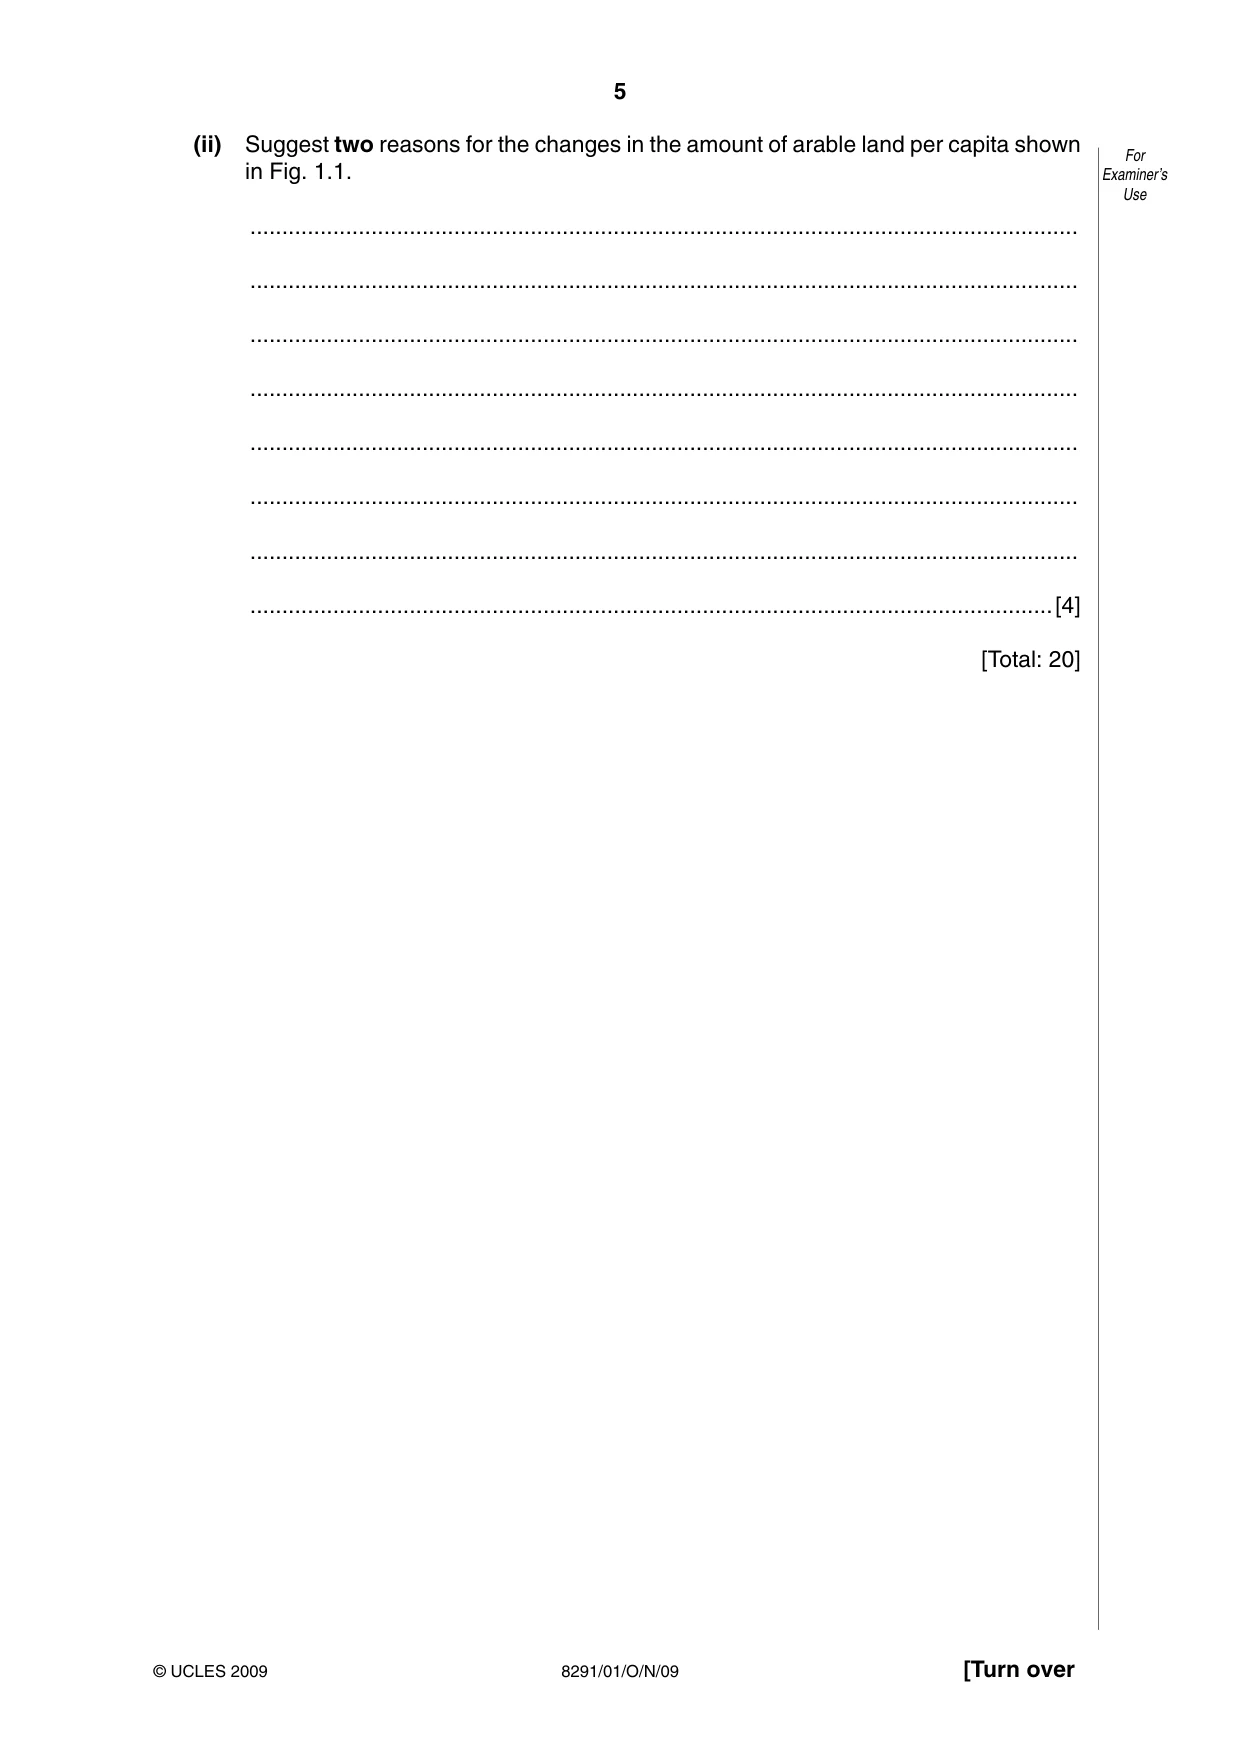
5 8291/01/O/N/09 [Turn over For Examiner’s Use © UCLES 2009 (ii) Suggest two reasons for the changes in the amount of arable land per capita shown in Fig. 1.1. … … … … … … … …[4] [Total: 20]
Question paper, page 6
6 8291/01/O/N/09 For Examiner’s Use © UCLES 2009 2 Current patterns of climatic change and extreme weather are being attributed to the release of greenhouse gases and global warming. (a) (i) What is meant by the term global warming? … … …[2] (ii) State the name of one greenhouse gas commonly emitted from: peat bogs, marshes and swamps … car exhausts …[2] (iii) Explain how greenhouse gases contribute to the process of global warming. … … … … … …[3]
Question paper, page 7
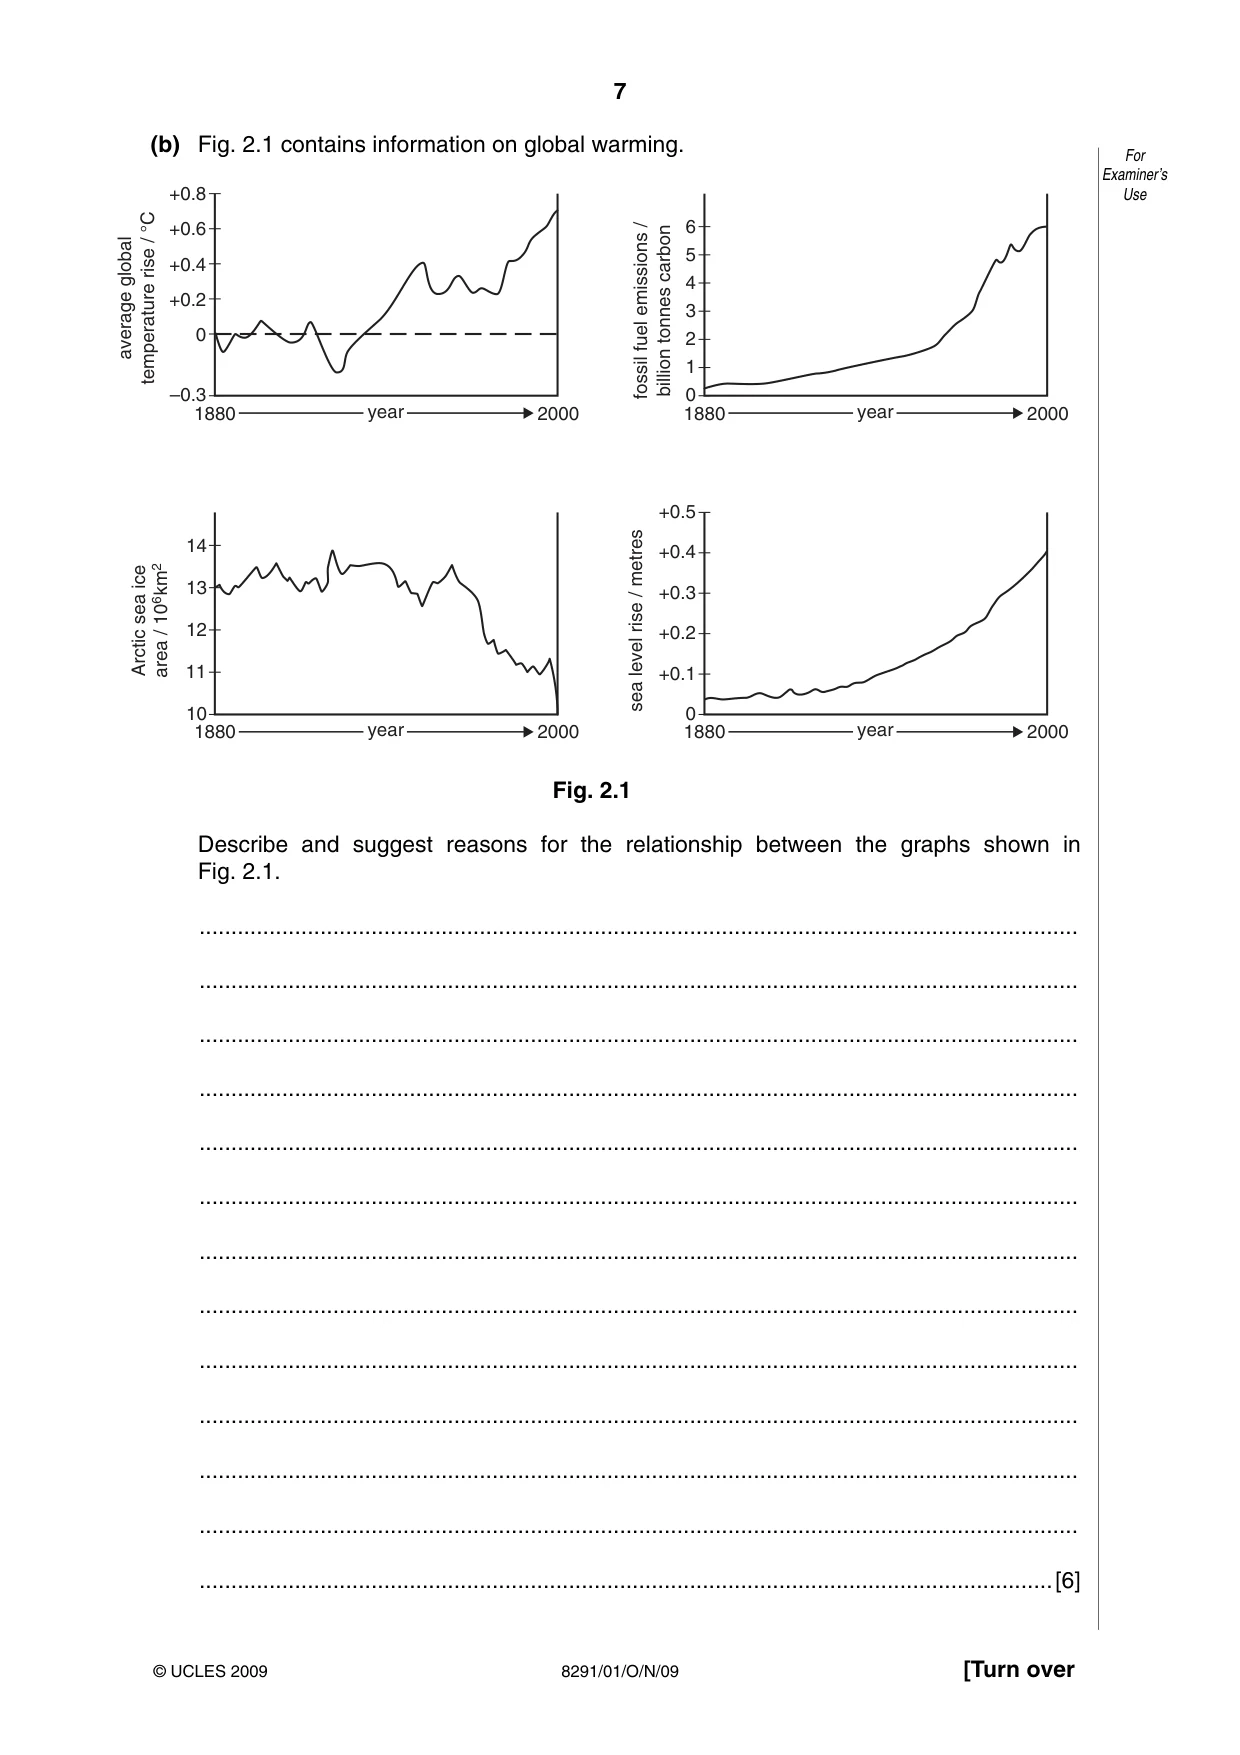
7 8291/01/O/N/09 [Turn over For Examiner’s Use © UCLES 2009 (b) Fig. 2.1 contains information on global warming. 0 –0.3 +0.2 +0.4 +0.6 +0.8 1880 2000 2 1 0 4 3 5 6 1880 2000 11 10 12 13 14 1880 2000 +0.2 +0.1 0 +0.4 +0.3 +0.5 1880 2000 average global temperature rise / °C fossil fuel emissions / billion tonnes carbon Arctic sea ice area / 106km2 sea level rise / metres year year year year Fig. 2.1 Describe and suggest reasons for the relationship between the graphs shown in Fig. 2.1. … … … … … … … … … … … … …[6]
Question paper, page 8
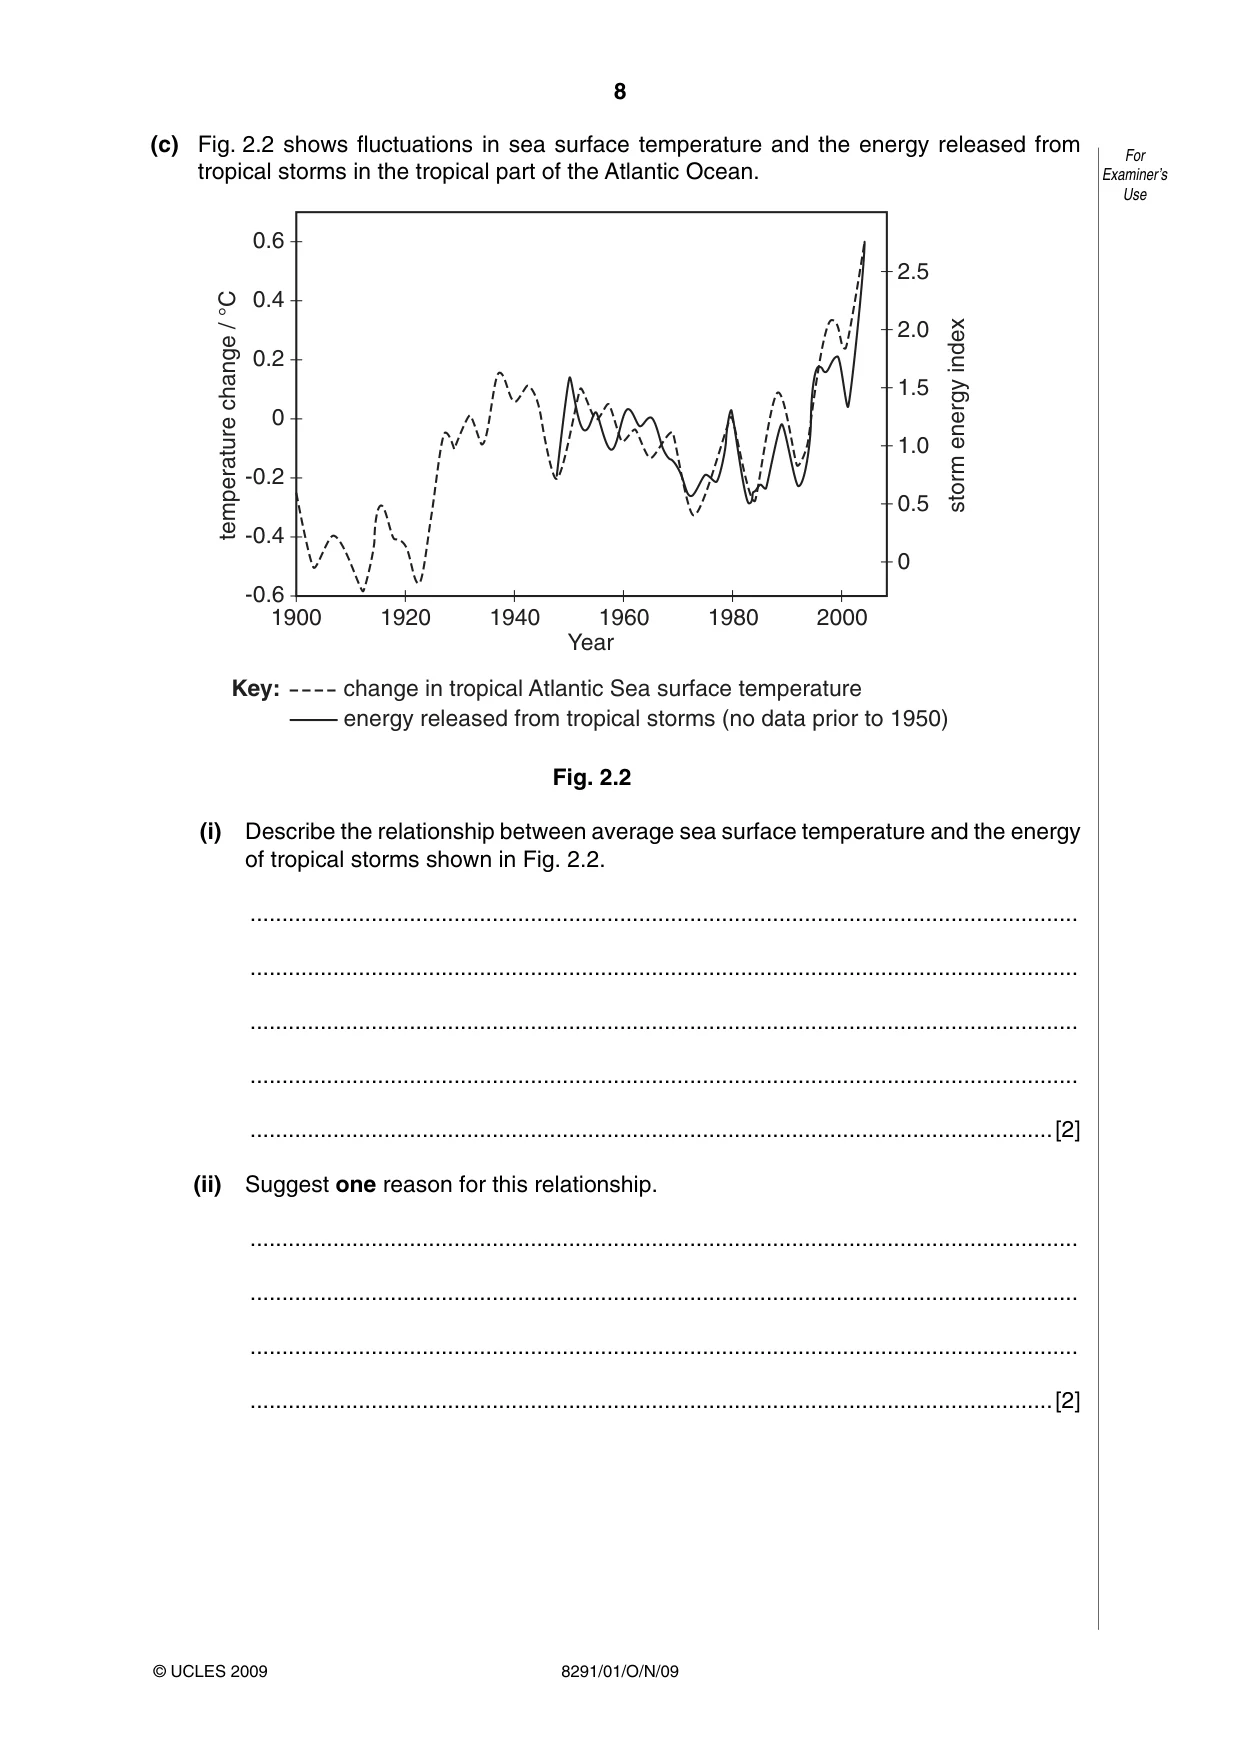
8 8291/01/O/N/09 For Examiner’s Use © UCLES 2009 (c) Fig. 2.2 shows fluctuations in sea surface temperature and the energy released from tropical storms in the tropical part of the Atlantic Ocean. -0.6 -0.4 -0.2 0 0.2 0.4 0.6 1900 1920 1940 1960 1980 2000 Year 0 0.5 1.0 1.5 2.0 2.5 temperature change / °C storm energy index Key: change in tropical Atlantic Sea surface temperature energy released from tropical storms (no data prior to 1950) Fig. 2.2 (i) Describe the relationship between average sea surface temperature and the energy of tropical storms shown in Fig. 2.2. … … … … …[2] (ii) Suggest one reason for this relationship. … … … …[2]
Question paper, page 9
9 8291/01/O/N/09 [Turn over For Examiner’s Use © UCLES 2009 (iii) With reference to a named example, describe one form of extreme weather, other than tropical storms, that has been attributed to global warming. … … … … … …[3] [Total: 20]
Question paper, page 10
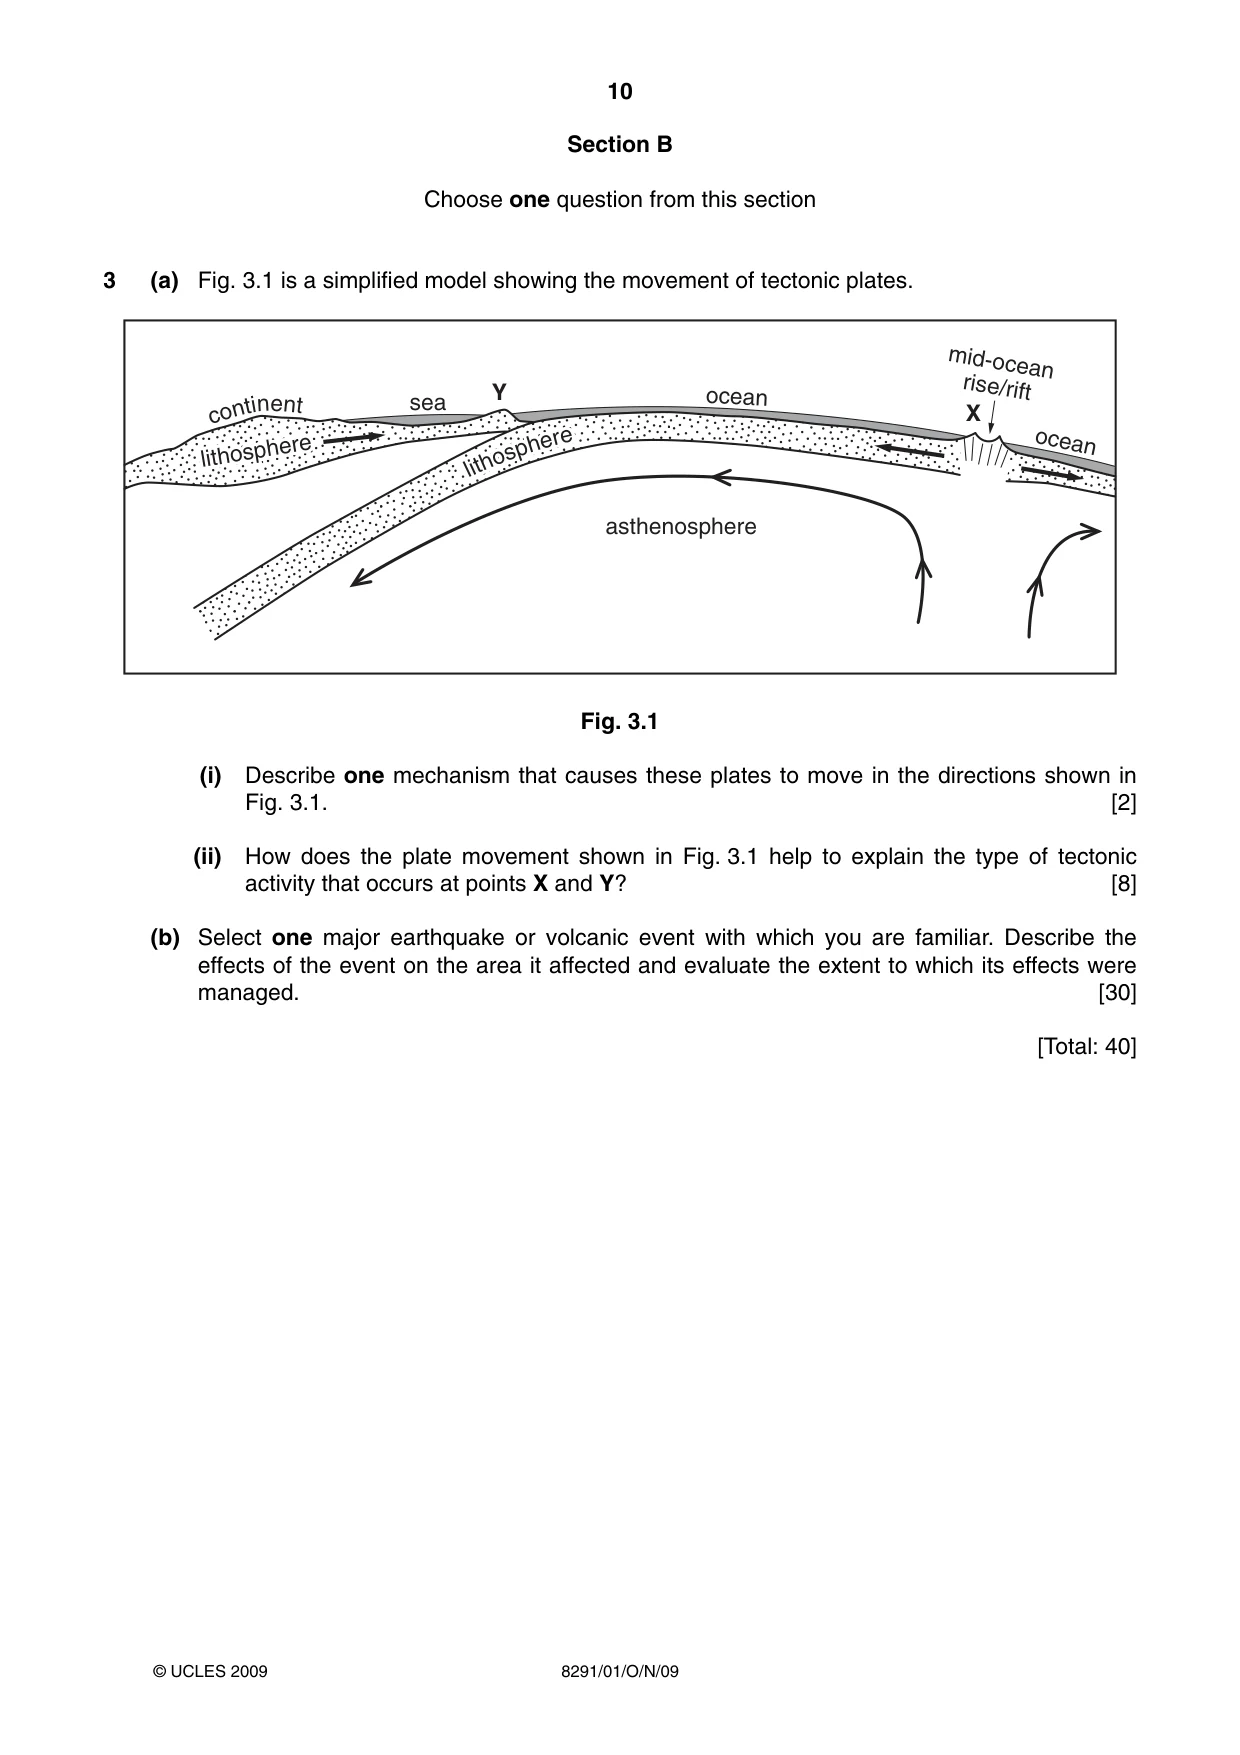
10 8291/01/O/N/09 © UCLES 2009 Section B Choose one question from this section 3 (a) Fig. 3.1 is a simplified model showing the movement of tectonic plates. lithosphere lithosphere sea ocean ocean mid-ocean rise/rift asthenosphere co nt i n e nt lithosphere X Y lith os ph er e lith os ph er e Fig. 3.1 (i) Describe one mechanism that causes these plates to move in the directions shown in Fig. 3.1. [2] (ii) How does the plate movement shown in Fig. 3.1 help to explain the type of tectonic activity that occurs at points X and Y? [8] (b) Select one major earthquake or volcanic event with which you are familiar. Describe the effects of the event on the area it affected and evaluate the extent to which its effects were managed. [30] [Total: 40]
Question paper, page 11
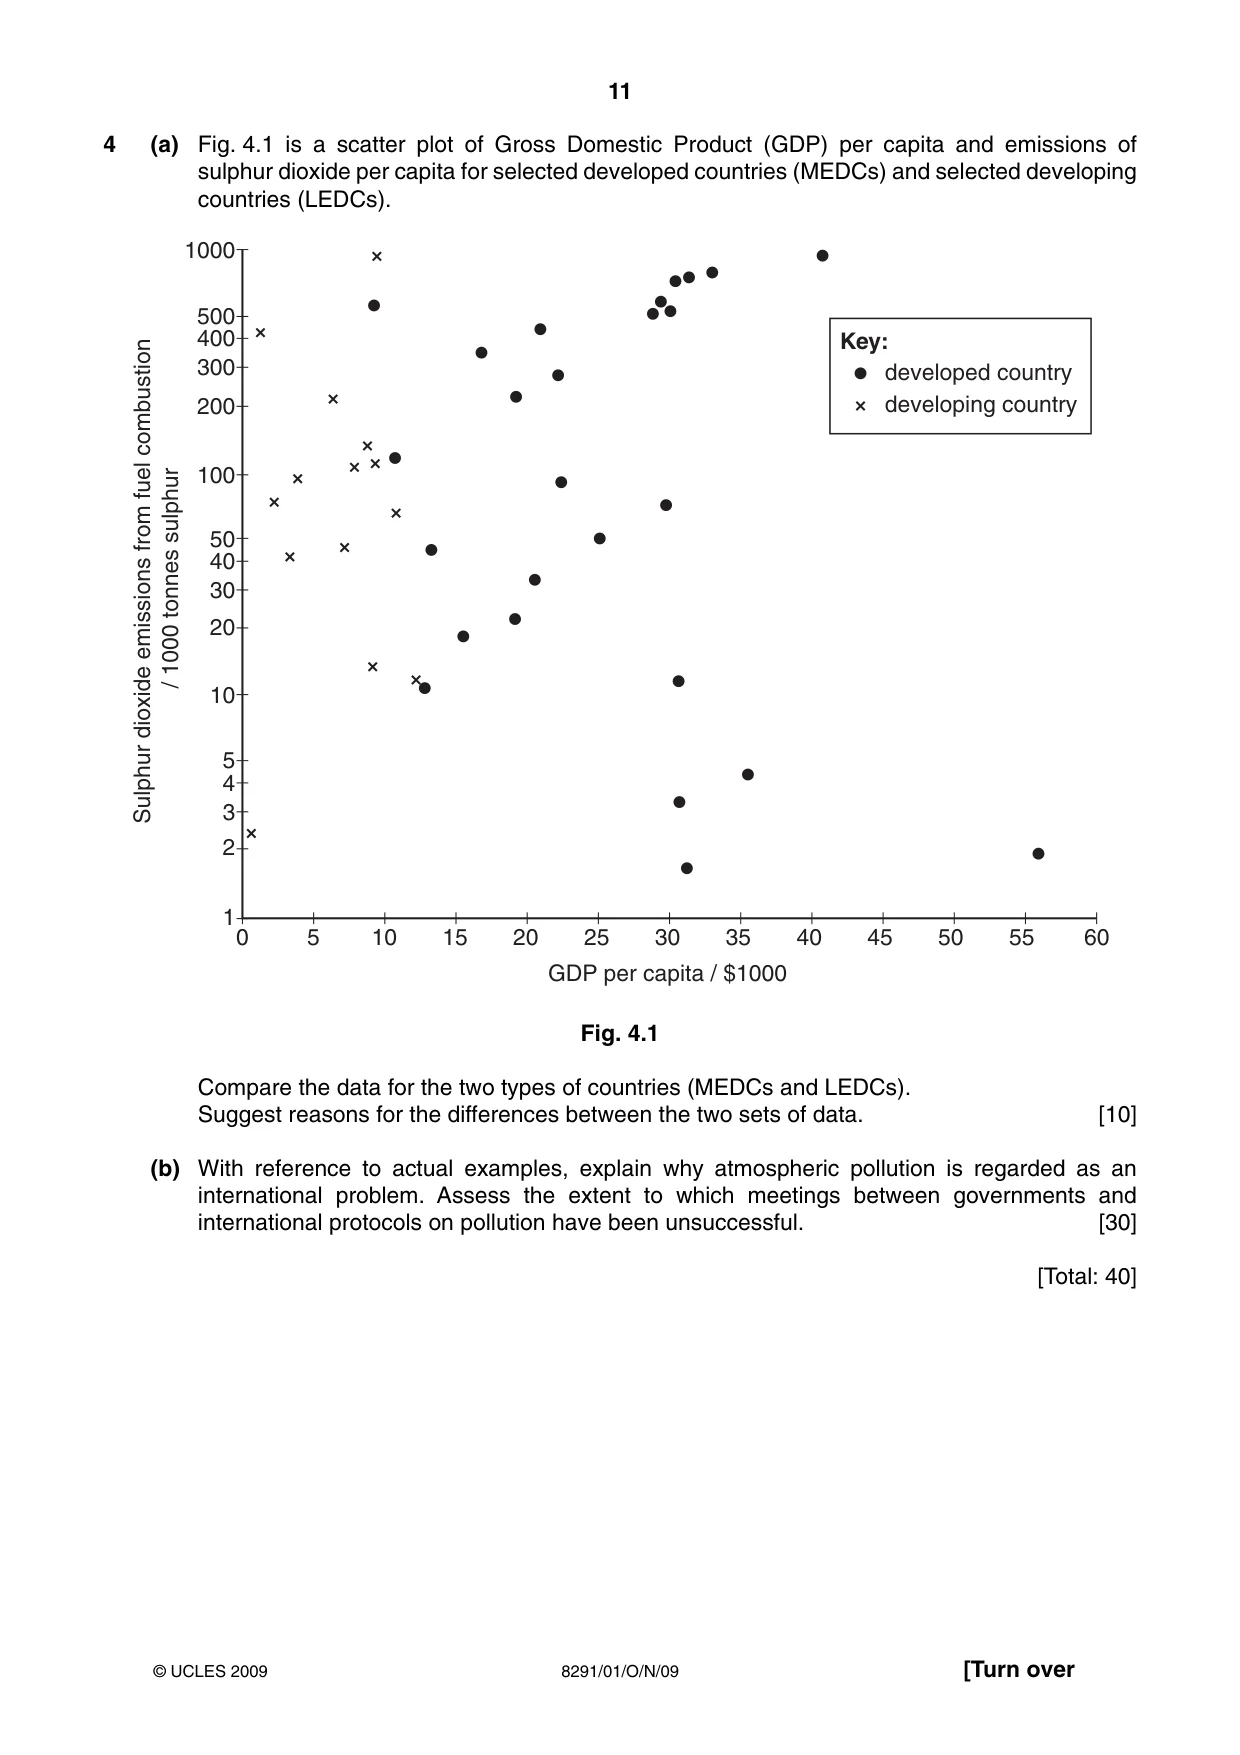
11 8291/01/O/N/09 © UCLES 2009 [Turn over 4 (a) Fig. 4.1 is a scatter plot of Gross Domestic Product (GDP) per capita and emissions of sulphur dioxide per capita for selected developed countries (MEDCs) and selected developing countries (LEDCs). 0 5 10 15 20 25 30 GDP per capita / $1000 35 40 45 50 55 60 1 2 3 4 5 10 20 30 40 50 100 200 300 400 500 1000 Sulphur dioxide emissions from fuel combustion / 1000 tonnes sulphur Key: developed country developing country Fig. 4.1 Compare the data for the two types of countries (MEDCs and LEDCs). Suggest reasons for the differences between the two sets of data. [10] (b) With reference to actual examples, explain why atmospheric pollution is regarded as an international problem. Assess the extent to which meetings between governments and international protocols on pollution have been unsuccessful. [30] [Total: 40]
Question paper, page 12
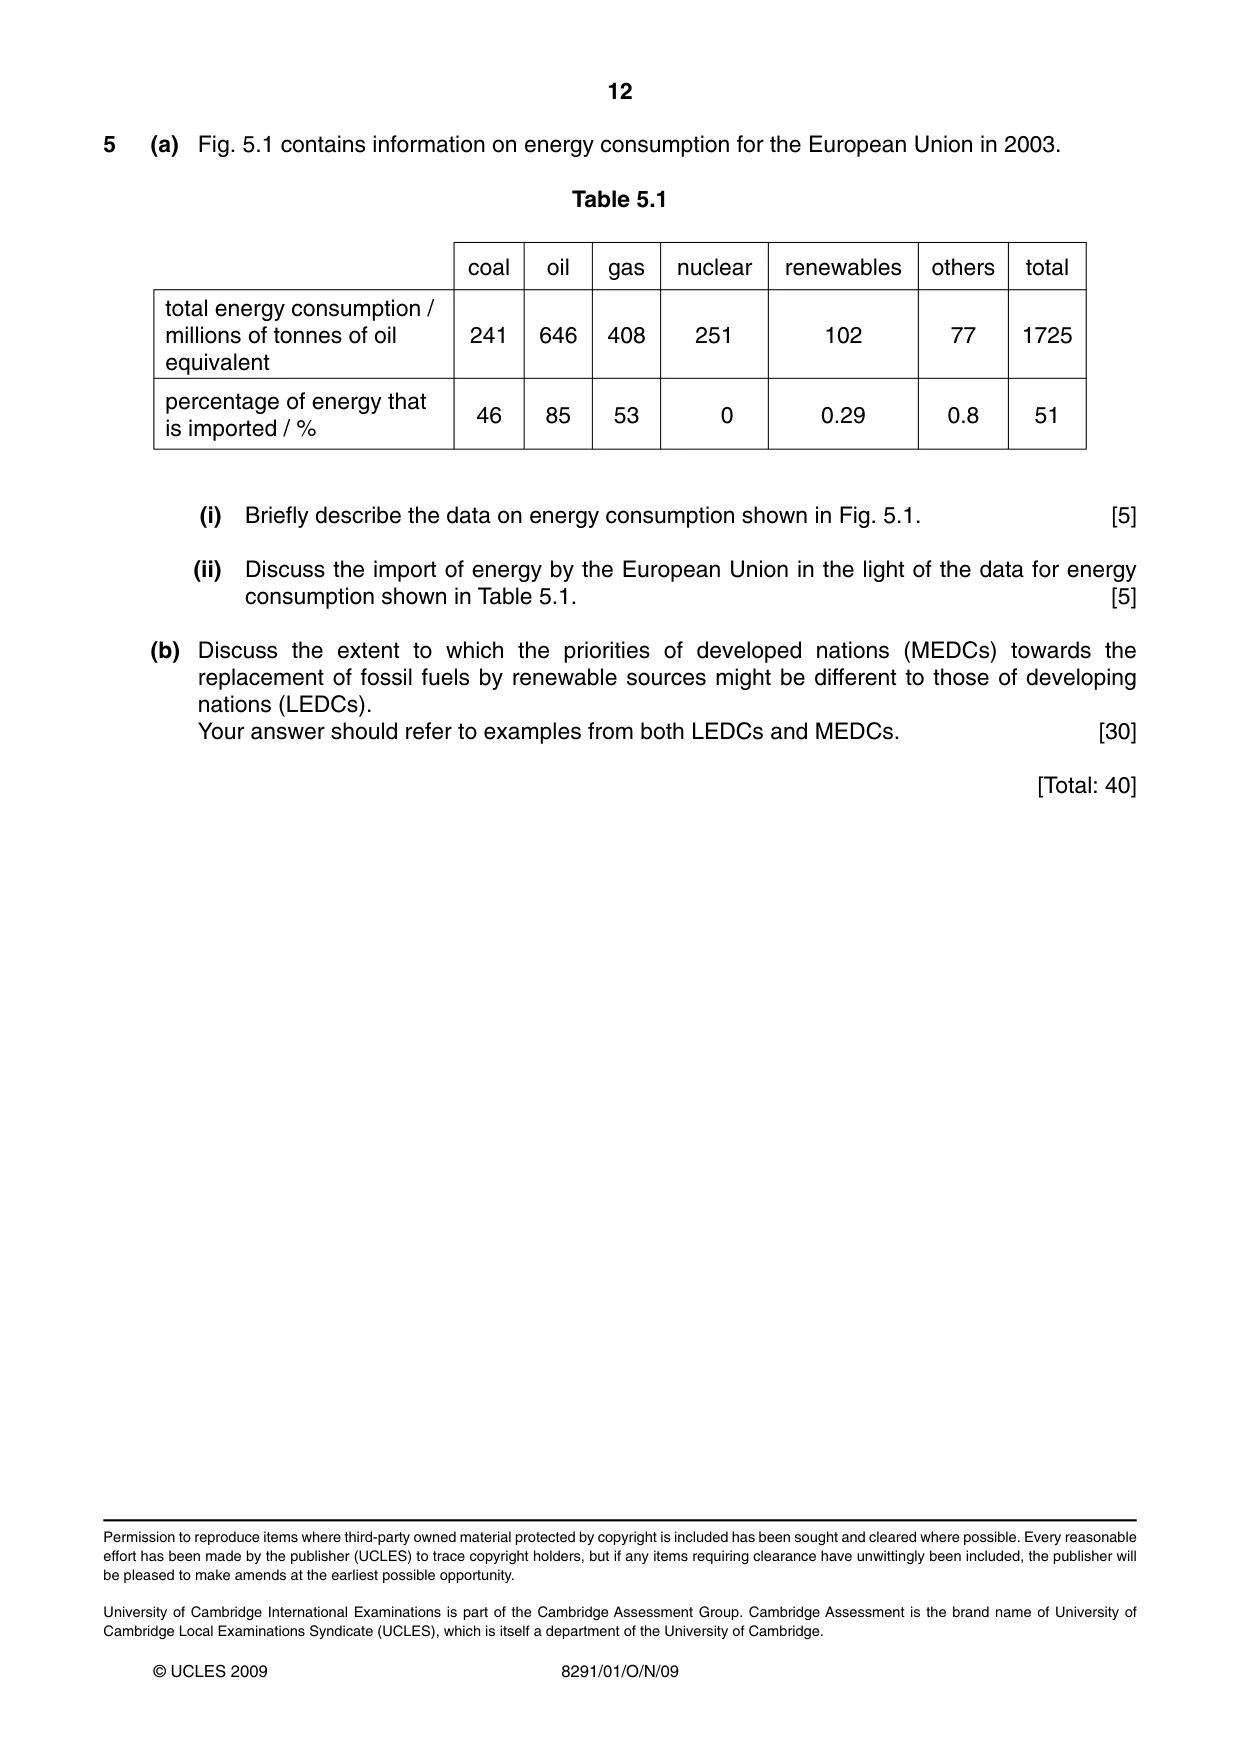
12 8291/01/O/N/09 © UCLES 2009 5 (a) Fig. 5.1 contains information on energy consumption for the European Union in 2003. Table 5.1 coal oil gas nuclear renewables others total total energy consumption / millions of tonnes of oil equivalent 241 646 408 251 102 77 1725 percentage of energy that is imported / % 46 85 53 0 0.29 0.8 51 (i) Briefly describe the data on energy consumption shown in Fig. 5.1. [5] (ii) Discuss the import of energy by the European Union in the light of the data for energy consumption shown in Table 5.1. [5] (b) Discuss the extent to which the priorities of developed nations (MEDCs) towards the replacement of fossil fuels by renewable sources might be different to those of developing nations (LEDCs). Your answer should refer to examples from both LEDCs and MEDCs. [30] [Total: 40] Permission to reproduce items where third-party owned material protected by copyright is included has been sought and cleared where possible. Every reasonable effort has been made by the publisher (UCLES) to trace copyright holders, but if any items requiring clearance have unwittingly been included, the publisher will be pleased to make amends at the earliest possible opportunity. University of Cambridge International Examinations is part of the Cambridge Assessment Group. Cambridge Assessment is the brand name of University of Cambridge Local Examinations Syndicate (UCLES), which is itself a department of the University of Cambridge.
Mark scheme, page 1
UNIVERSITY OF CAMBRIDGE INTERNATIONAL EXAMINATIONS GCE Advanced Subsidiary Level MARK SCHEME for the October/November 2009 question paper for the guidance of teachers 8291 ENVIRONMENTAL MANAGEMENT 8291/01 Paper 1, maximum raw mark 80 This mark scheme is published as an aid to teachers and candidates, to indicate the requirements of the examination. It shows the basis on which Examiners were instructed to award marks. It does not indicate the details of the discussions that took place at an Examiners’ meeting before marking began, which would have considered the acceptability of alternative answers. Mark schemes must be read in conjunction with the question papers and the report on the examination. • CIE will not enter into discussions or correspondence in connection with these mark schemes. CIE is publishing the mark schemes for the October/November 2009 question papers for most IGCSE, GCE Advanced Level and Advanced Subsidiary Level syllabuses and some Ordinary Level syllabuses.
Mark scheme, page 2
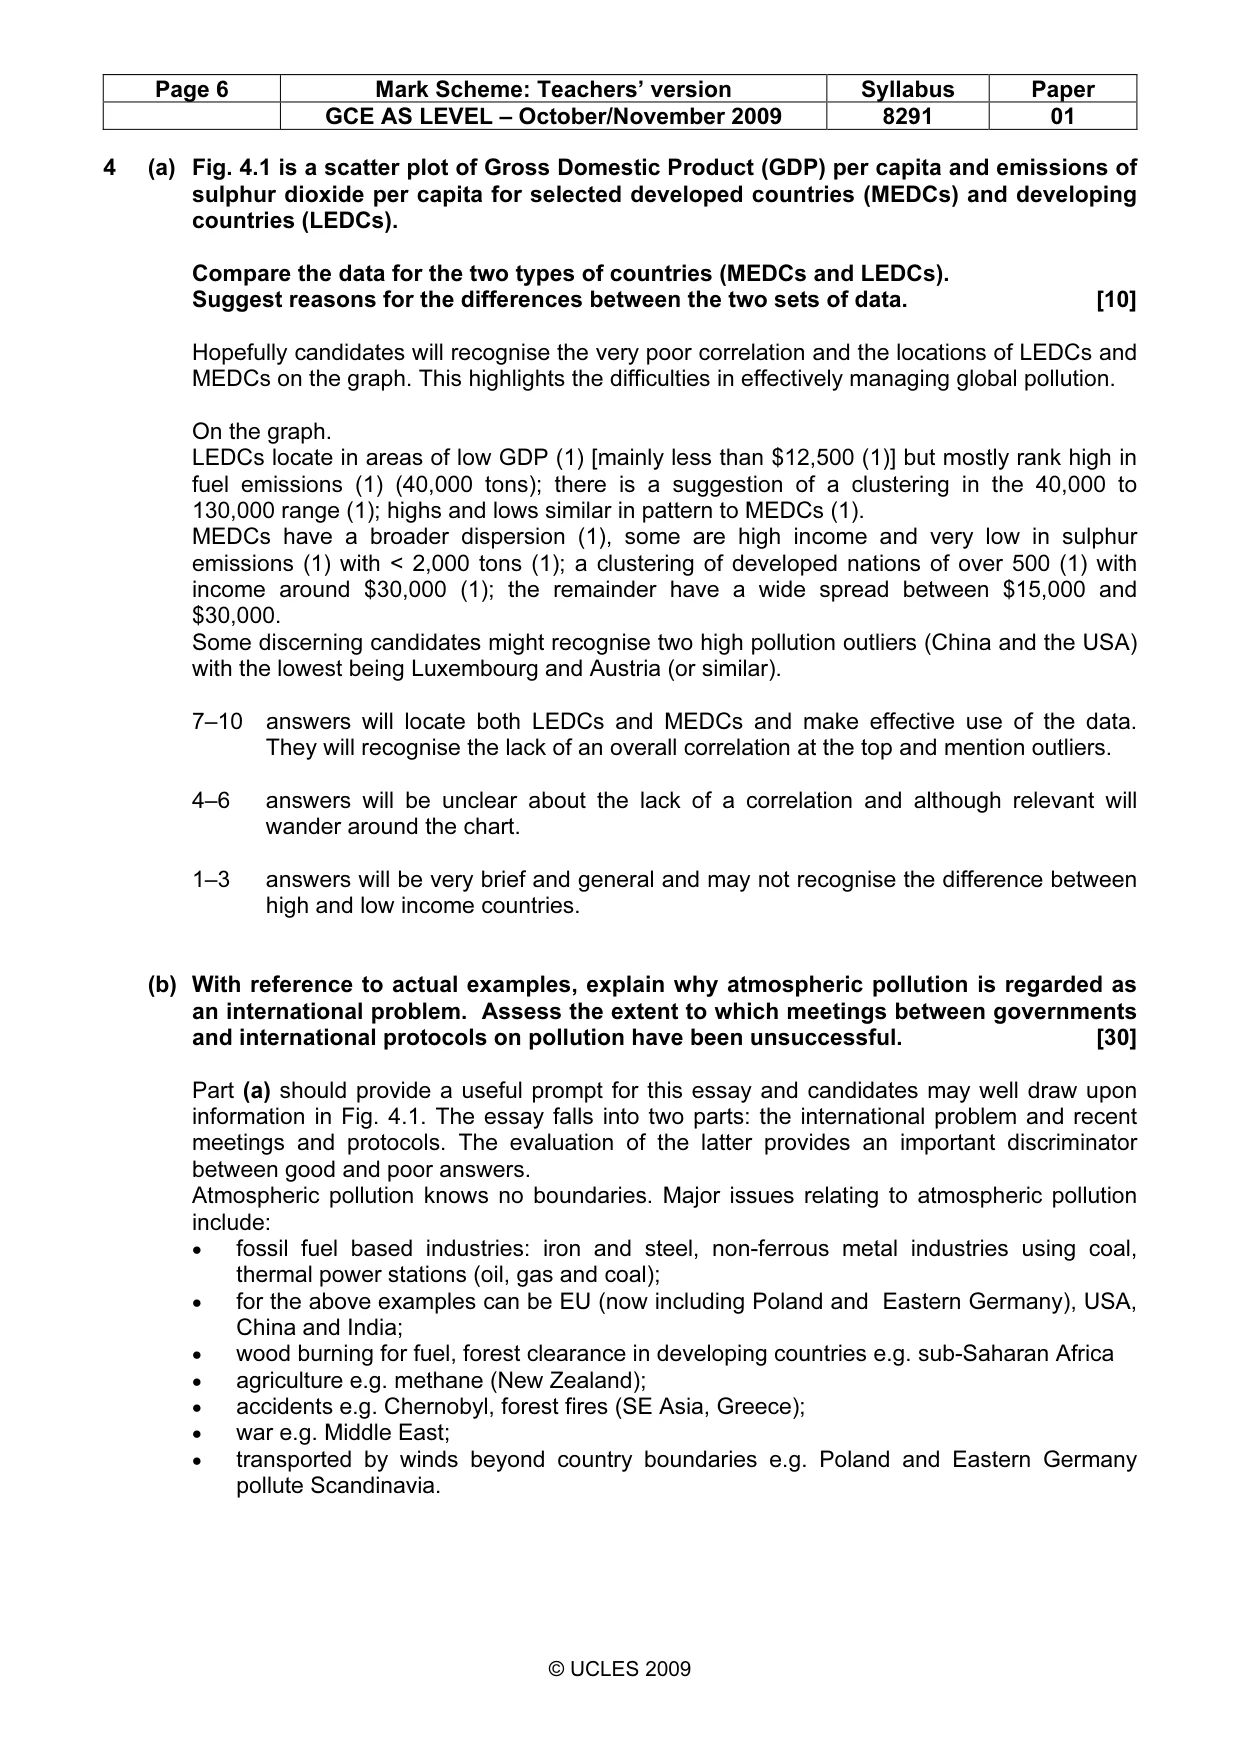
Page 2 Mark Scheme: Teachers’ version Syllabus Paper GCE AS LEVEL – October/November 2009 8291 01 © UCLES 2009 Section A Answer all questions in this section. 1 (a) In developed countries (MEDCs) and developing countries (LEDCs), land as a resource is under pressure from urban sprawl. Explain what is meant by the term urban sprawl? [2] urban sprawl: the spread of a city or town across non-urban land; usually following road or rail routes (b) Table 1.1 contains information on the percentage of people living in urban areas. Table 1.1 percentage of population in urban areas estimated Year 1950 1975 2000 2030 MEDCs 54.9 70.0 76.0 60.3 LEDCs 17.8 26.8 39.9 56.2 (i) Describe how the rate of change in urban population for MEDCs differs to that of LEDCs between 1950 and 2000. [3] As one is the mirror of the other award max 2 if there is no use of the data. MEDCs’ rate of increase is slowing i.e. by 15.1 then 6. LEDCs’ rate is increasing by 9 then 13.1. Both increasing. (ii) Describe how the urban population of LEDCs and MEDCs is likely to change between 2000 and 2030. [2] As one is the mirror of the other award max 1 if there is no use of data. MEDCs decrease from 76 to 60.3 or 16.3. LEDCs increase from 39.9 to 56.2 or 16.3. (iii) Suggest one reason for the likely changes in the urban population between 2000 and 2030 for each group of nations. [2] MEDCs counter-urbanisation/urban to rural migration. LEDCs urbanisation/rural to urban migration. Candidates may describe the processes through an example. (c) With reference to MEDCs, describe two effects that urban sprawl has on the resources of agricultural land. [4] Award two marks for a well developed point and one mark for a brief statement e.g. • increased land values affect building values and rent; • urban pressures increase the need for conservation; • increased levels of pollution from traffic, business and industry; • conserved areas cannot be developed and some areas are unused or derelict.
Mark scheme, page 3
Page 3 Mark Scheme: Teachers’ version Syllabus Paper GCE AS LEVEL – October/November 2009 8291 01 © UCLES 2009 (d) Fig. 1.1 shows likely trends in the growth of population and loss of arable land per person in LEDCs between 1961 and 2030. (i) Describe the relationship between population size and arable land per capita shown in Fig. 1.1. [3] As the total population increases the amount of arable land decreases (1). Rural population increases with the decrease in arable land (1). A 12-fold decrease in land per capita (or equivalent) (1). (ii) Suggest two reasons for the changes in the amount of arable land per capita shown in Fig. 1.1. [4] Award two marks for a well developed point and one mark for a brief statement e.g. Diminishing rural land due to the growth of cities. Climatic change and increasing aridity. Increasing rural population means there is less land available. [Total: 20] 2 Current patterns of climatic change and extreme weather are being attributed to the release of greenhouse gases and global warming. (a) (i) What is meant by the term global warming? [2] A progressive increase in global temperatures (1) either natural or anthropogenic (1). (ii) State the name of one greenhouse gas commonly emitted from: peat bogs, marshes and swamps Methane car exhausts [2] Carbon dioxide, NOX, nitric oxide, nitrogen oxide, water vapour (iii) Explain how greenhouse gases contribute to the process of global warming. [3] Greenhouse gases accumulate in the atmosphere. Greenhouse gases do not prevent short wave radiation from reaching the Earth’s surface (1) and radiated long wave energy is absorbed by greenhouse gases (1). (b) Fig. 2.1 contains information on global warming. Describe and suggest reasons for the relationship between the graphs shown in Fig. 2.1. [6] Award a max of 3 for no reference to data (amounts or graphs) and a max of 3 for an answer that does not bring out any relationship. Candidates should refer to each of the 4 graphs (1 mark for each). Temperature has two major increases, the most recent from the 1960s onwards (1), which links with the rapid increase in the use of fossil fuels (1). The amount of arctic ice fluctuates until the 1960s then shows a marked decline and sea levels show a steep rise coincident with the other graphs (1). One mark for each of two briefly stated reasons that should include the effect of human activity (2).
Mark scheme, page 4
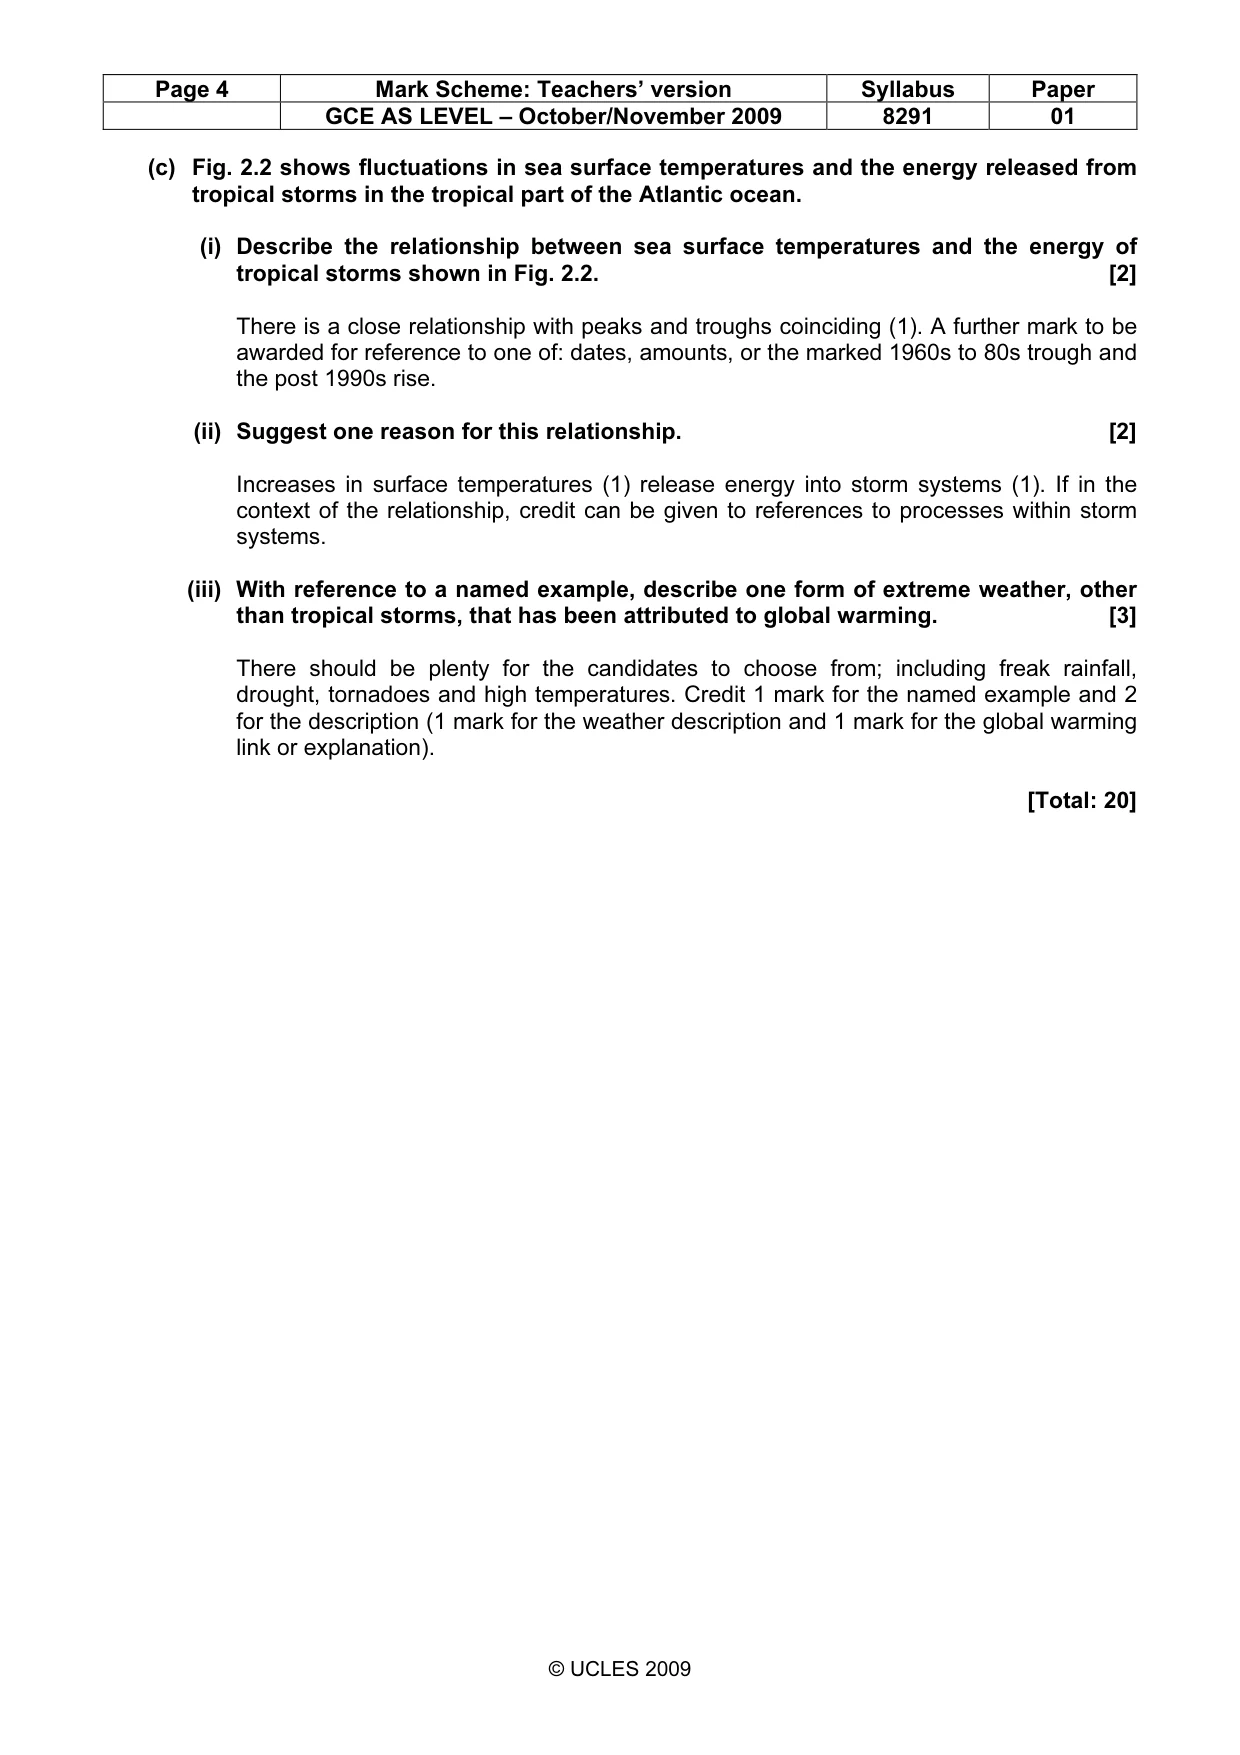
Page 4 Mark Scheme: Teachers’ version Syllabus Paper GCE AS LEVEL – October/November 2009 8291 01 © UCLES 2009 (c) Fig. 2.2 shows fluctuations in sea surface temperatures and the energy released from tropical storms in the tropical part of the Atlantic ocean. (i) Describe the relationship between sea surface temperatures and the energy of tropical storms shown in Fig. 2.2. [2] There is a close relationship with peaks and troughs coinciding (1). A further mark to be awarded for reference to one of: dates, amounts, or the marked 1960s to 80s trough and the post 1990s rise. (ii) Suggest one reason for this relationship. [2] Increases in surface temperatures (1) release energy into storm systems (1). If in the context of the relationship, credit can be given to references to processes within storm systems. (iii) With reference to a named example, describe one form of extreme weather, other than tropical storms, that has been attributed to global warming. [3] There should be plenty for the candidates to choose from; including freak rainfall, drought, tornadoes and high temperatures. Credit 1 mark for the named example and 2 for the description (1 mark for the weather description and 1 mark for the global warming link or explanation). [Total: 20]
Mark scheme, page 5
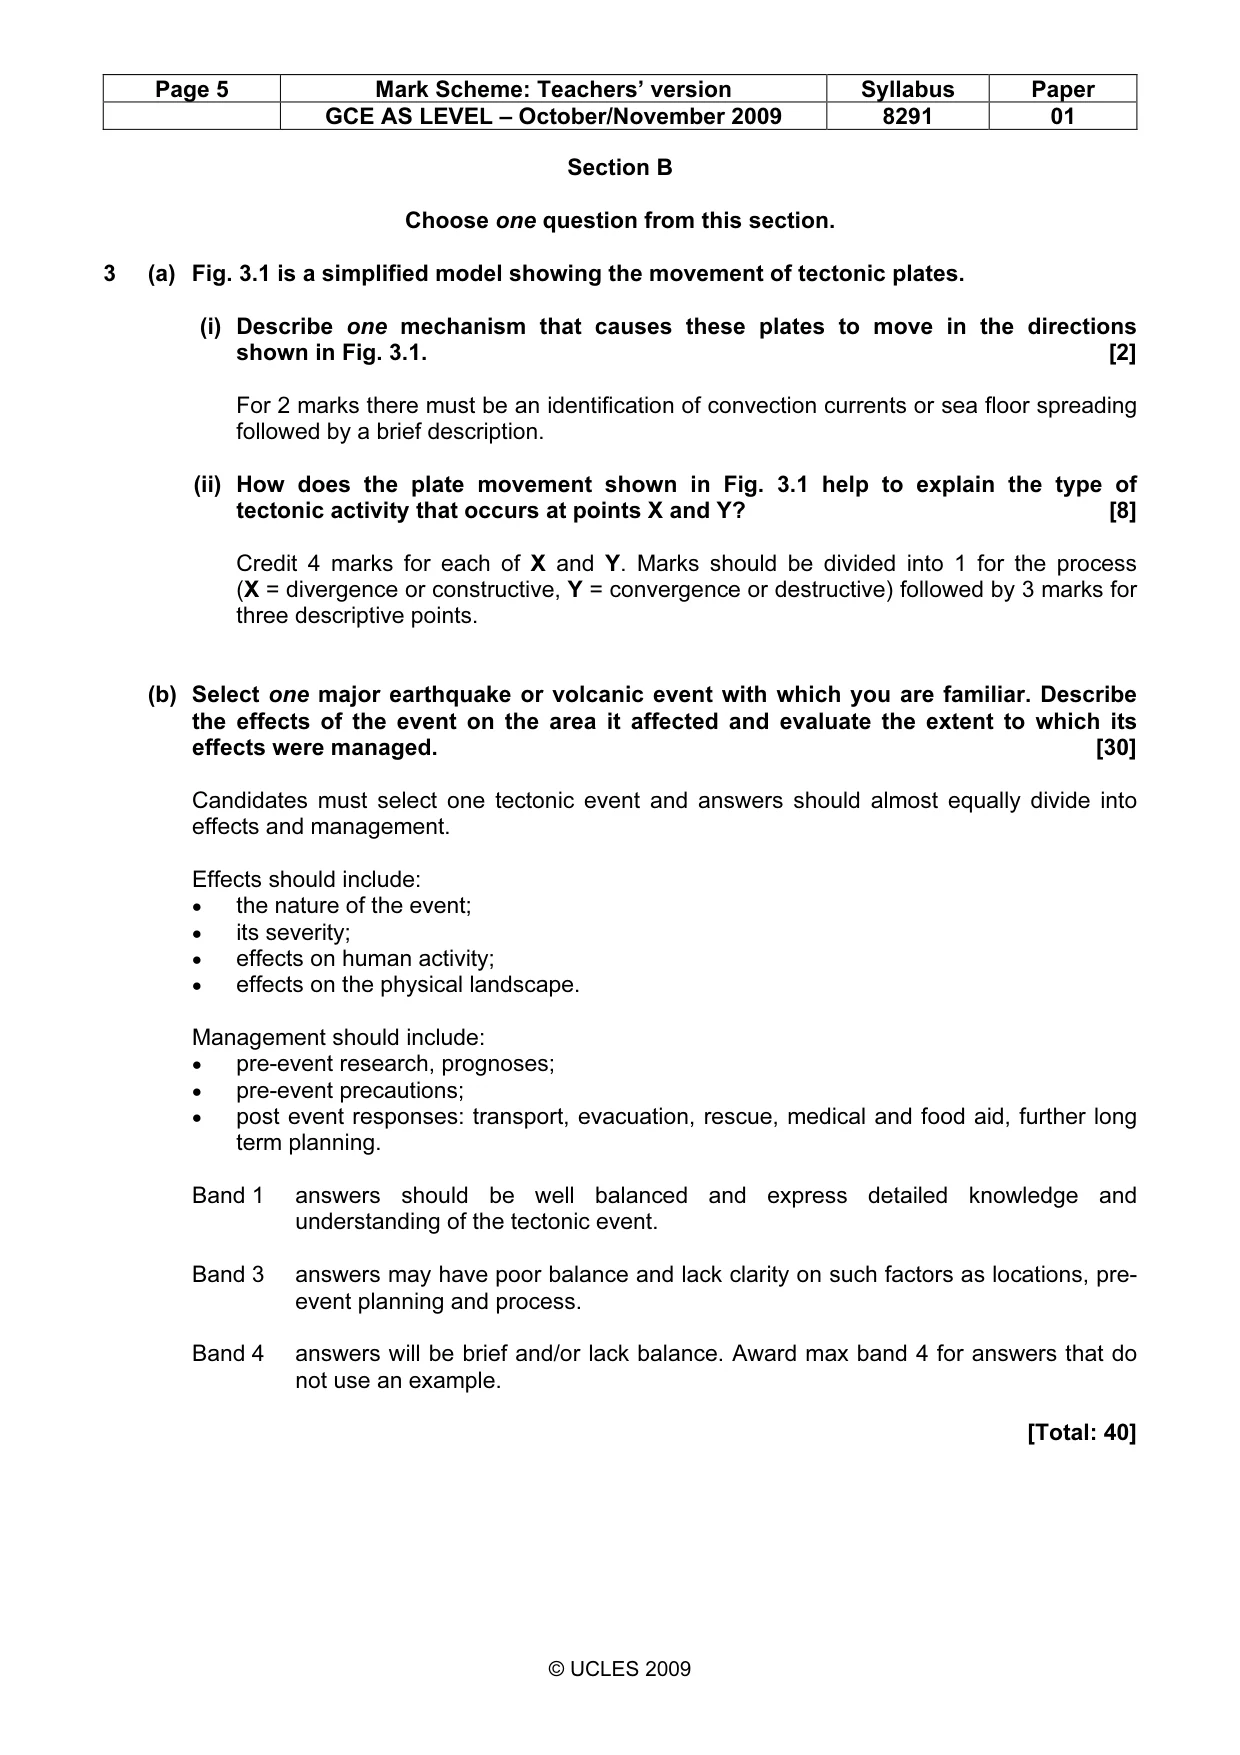
Page 5 Mark Scheme: Teachers’ version Syllabus Paper GCE AS LEVEL – October/November 2009 8291 01 © UCLES 2009 Section B Choose one question from this section. 3 (a) Fig. 3.1 is a simplified model showing the movement of tectonic plates. (i) Describe one mechanism that causes these plates to move in the directions shown in Fig. 3.1. [2] For 2 marks there must be an identification of convection currents or sea floor spreading followed by a brief description. (ii) How does the plate movement shown in Fig. 3.1 help to explain the type of tectonic activity that occurs at points X and Y? [8] Credit 4 marks for each of X and Y. Marks should be divided into 1 for the process (X = divergence or constructive, Y = convergence or destructive) followed by 3 marks for three descriptive points. (b) Select one major earthquake or volcanic event with which you are familiar. Describe the effects of the event on the area it affected and evaluate the extent to which its effects were managed. [30] Candidates must select one tectonic event and answers should almost equally divide into effects and management. Effects should include: • the nature of the event; • its severity; • effects on human activity; • effects on the physical landscape. Management should include: • pre-event research, prognoses; • pre-event precautions; • post event responses: transport, evacuation, rescue, medical and food aid, further long term planning. Band 1 answers should be well balanced and express detailed knowledge and understanding of the tectonic event. Band 3 answers may have poor balance and lack clarity on such factors as locations, pre- event planning and process. Band 4 answers will be brief and/or lack balance. Award max band 4 for answers that do not use an example. [Total: 40]
Mark scheme, page 6
Page 6 Mark Scheme: Teachers’ version Syllabus Paper GCE AS LEVEL – October/November 2009 8291 01 © UCLES 2009 4 (a) Fig. 4.1 is a scatter plot of Gross Domestic Product (GDP) per capita and emissions of sulphur dioxide per capita for selected developed countries (MEDCs) and developing countries (LEDCs). Compare the data for the two types of countries (MEDCs and LEDCs). Suggest reasons for the differences between the two sets of data. [10] Hopefully candidates will recognise the very poor correlation and the locations of LEDCs and MEDCs on the graph. This highlights the difficulties in effectively managing global pollution. On the graph. LEDCs locate in areas of low GDP (1) [mainly less than $12,500 (1)] but mostly rank high in fuel emissions (1) (40,000 tons); there is a suggestion of a clustering in the 40,000 to 130,000 range (1); highs and lows similar in pattern to MEDCs (1). MEDCs have a broader dispersion (1), some are high income and very low in sulphur emissions (1) with < 2,000 tons (1); a clustering of developed nations of over 500 (1) with income around $30,000 (1); the remainder have a wide spread between $15,000 and $30,000. Some discerning candidates might recognise two high pollution outliers (China and the USA) with the lowest being Luxembourg and Austria (or similar). 7–10 answers will locate both LEDCs and MEDCs and make effective use of the data. They will recognise the lack of an overall correlation at the top and mention outliers. 4–6 answers will be unclear about the lack of a correlation and although relevant will wander around the chart. 1–3 answers will be very brief and general and may not recognise the difference between high and low income countries. (b) With reference to actual examples, explain why atmospheric pollution is regarded as an international problem. Assess the extent to which meetings between governments and international protocols on pollution have been unsuccessful. [30] Part (a) should provide a useful prompt for this essay and candidates may well draw upon information in Fig. 4.1. The essay falls into two parts: the international problem and recent meetings and protocols. The evaluation of the latter provides an important discriminator between good and poor answers. Atmospheric pollution knows no boundaries. Major issues relating to atmospheric pollution include: • fossil fuel based industries: iron and steel, non-ferrous metal industries using coal, thermal power stations (oil, gas and coal); • for the above examples can be EU (now including Poland and Eastern Germany), USA, China and India; • wood burning for fuel, forest clearance in developing countries e.g. sub-Saharan Africa • agriculture e.g. methane (New Zealand); • accidents e.g. Chernobyl, forest fires (SE Asia, Greece); • war e.g. Middle East; • transported by winds beyond country boundaries e.g. Poland and Eastern Germany pollute Scandinavia.
Mark scheme, page 7
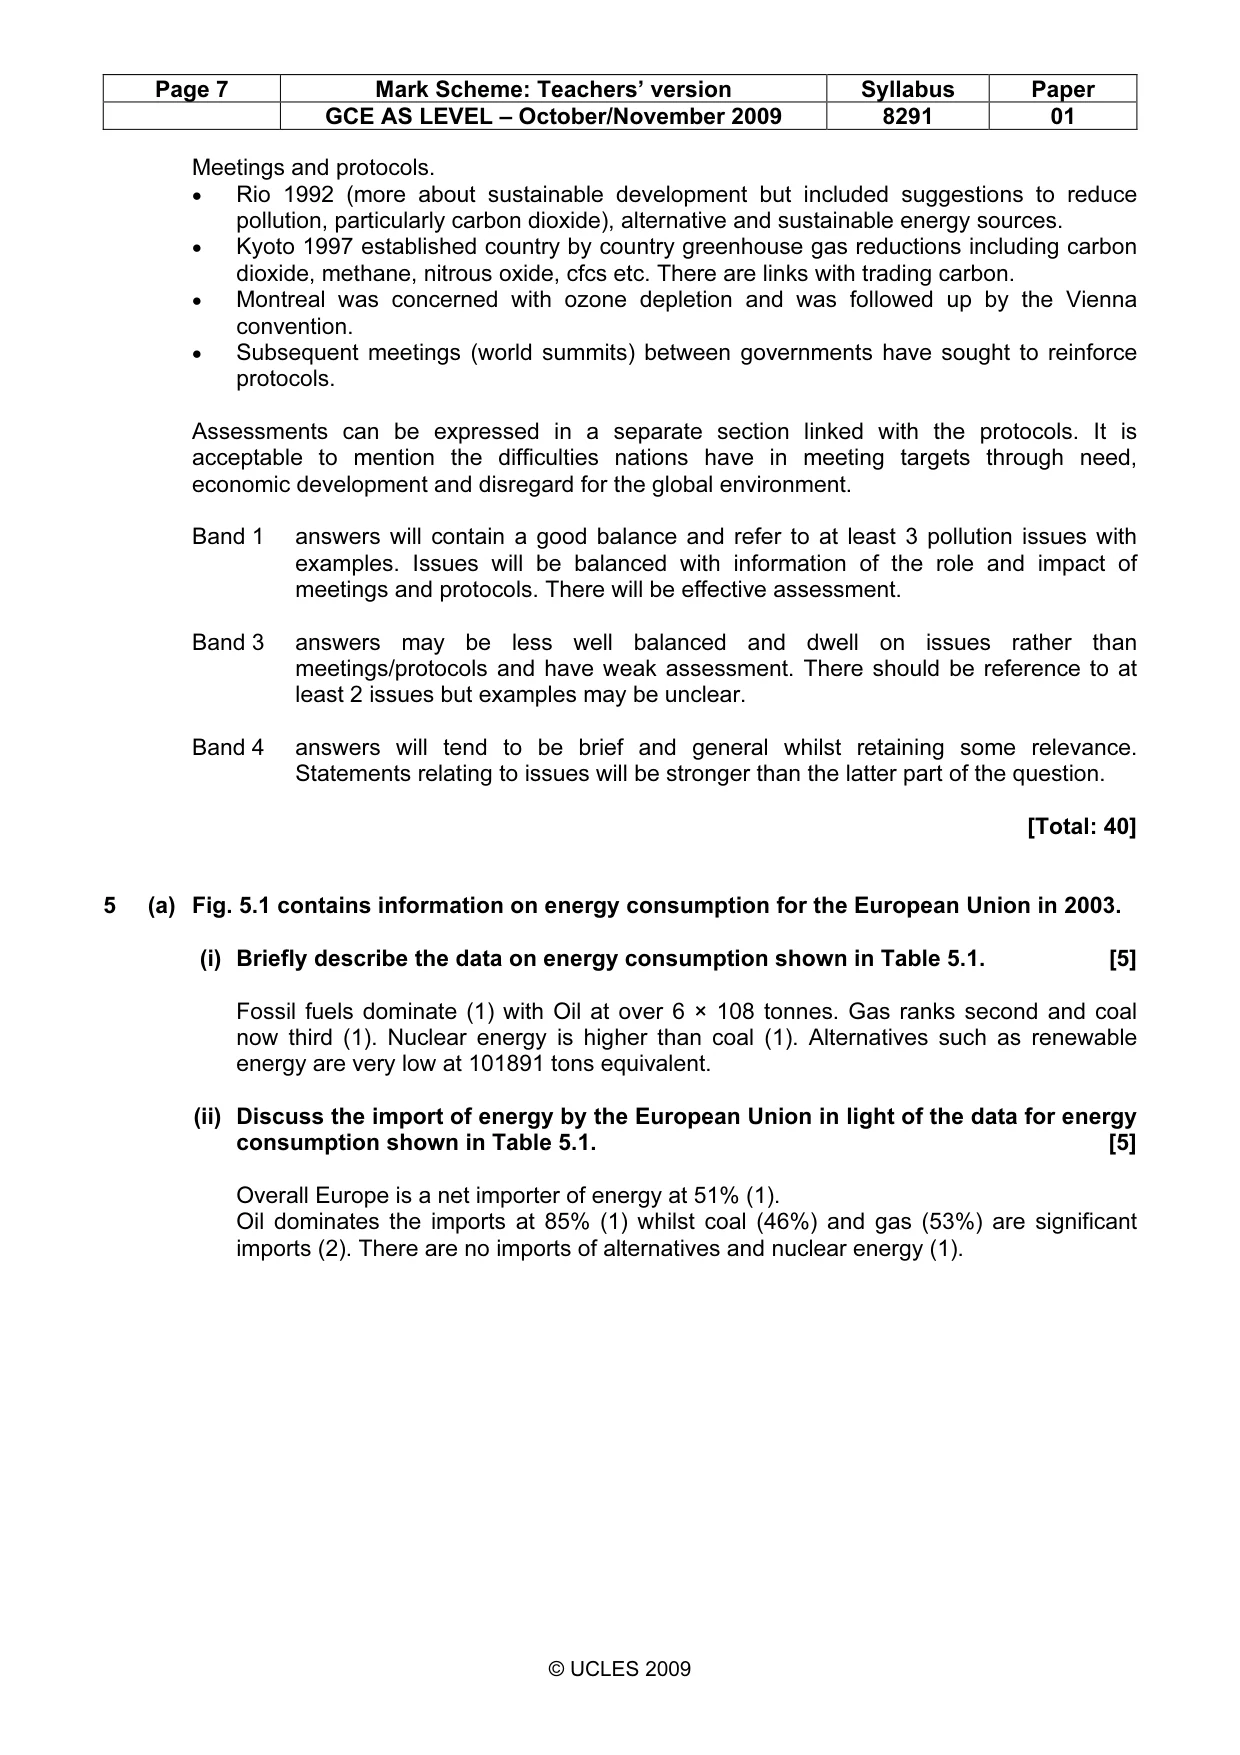
Page 7 Mark Scheme: Teachers’ version Syllabus Paper GCE AS LEVEL – October/November 2009 8291 01 © UCLES 2009 Meetings and protocols. • Rio 1992 (more about sustainable development but included suggestions to reduce pollution, particularly carbon dioxide), alternative and sustainable energy sources. • Kyoto 1997 established country by country greenhouse gas reductions including carbon dioxide, methane, nitrous oxide, cfcs etc. There are links with trading carbon. • Montreal was concerned with ozone depletion and was followed up by the Vienna convention. • Subsequent meetings (world summits) between governments have sought to reinforce protocols. Assessments can be expressed in a separate section linked with the protocols. It is acceptable to mention the difficulties nations have in meeting targets through need, economic development and disregard for the global environment. Band 1 answers will contain a good balance and refer to at least 3 pollution issues with examples. Issues will be balanced with information of the role and impact of meetings and protocols. There will be effective assessment. Band 3 answers may be less well balanced and dwell on issues rather than meetings/protocols and have weak assessment. There should be reference to at least 2 issues but examples may be unclear. Band 4 answers will tend to be brief and general whilst retaining some relevance. Statements relating to issues will be stronger than the latter part of the question. [Total: 40] 5 (a) Fig. 5.1 contains information on energy consumption for the European Union in 2003. (i) Briefly describe the data on energy consumption shown in Table 5.1. [5] Fossil fuels dominate (1) with Oil at over 6 × 10⁸ tonnes. Gas ranks second and coal now third (1). Nuclear energy is higher than coal (1). Alternatives such as renewable energy are very low at 101891 tons equivalent. (ii) Discuss the import of energy by the European Union in light of the data for energy consumption shown in Table 5.1. [5] Overall Europe is a net importer of energy at 51% (1). Oil dominates the imports at 85% (1) whilst coal (46%) and gas (53%) are significant imports (2). There are no imports of alternatives and nuclear energy (1).
Mark scheme, page 8
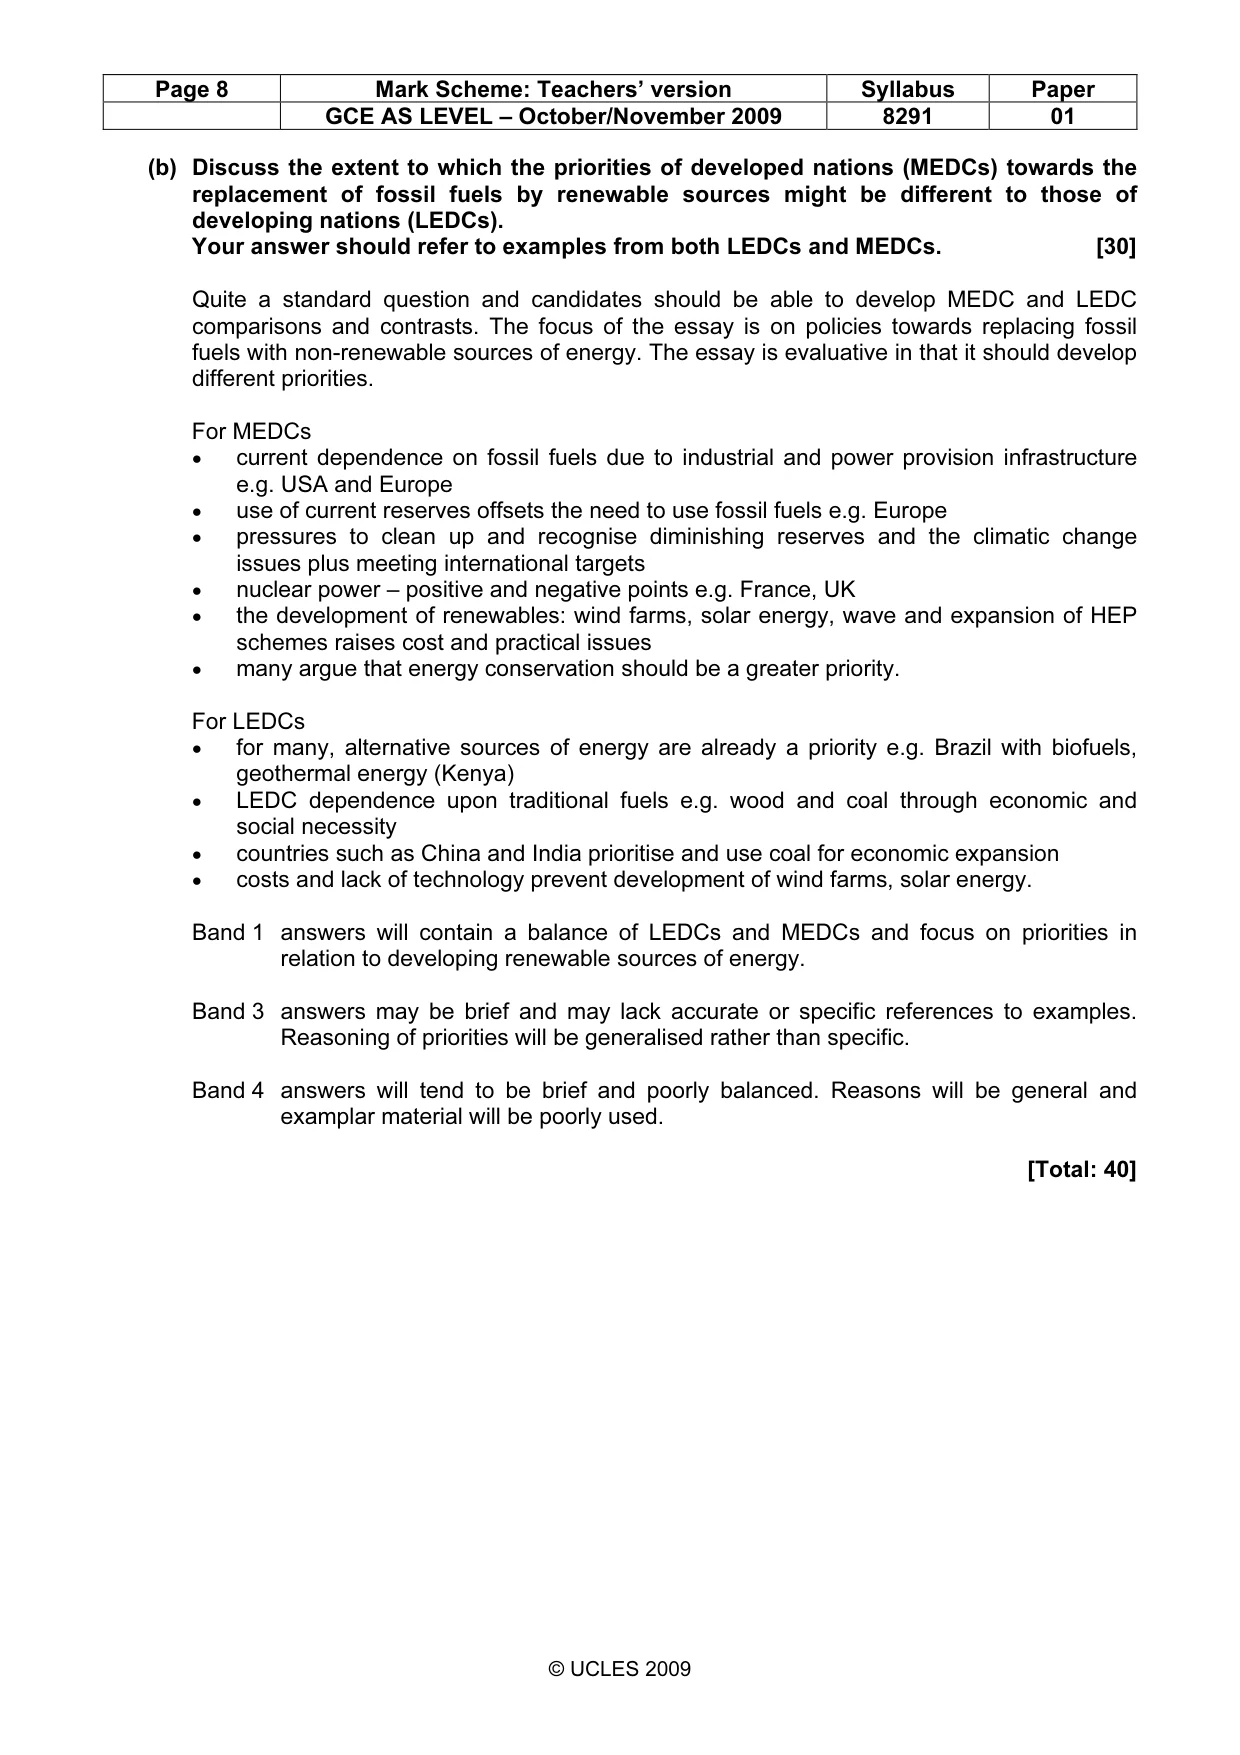
Page 8 Mark Scheme: Teachers’ version Syllabus Paper GCE AS LEVEL – October/November 2009 8291 01 © UCLES 2009 (b) Discuss the extent to which the priorities of developed nations (MEDCs) towards the replacement of fossil fuels by renewable sources might be different to those of developing nations (LEDCs). Your answer should refer to examples from both LEDCs and MEDCs. [30] Quite a standard question and candidates should be able to develop MEDC and LEDC comparisons and contrasts. The focus of the essay is on policies towards replacing fossil fuels with non-renewable sources of energy. The essay is evaluative in that it should develop different priorities. For MEDCs • current dependence on fossil fuels due to industrial and power provision infrastructure e.g. USA and Europe • use of current reserves offsets the need to use fossil fuels e.g. Europe • pressures to clean up and recognise diminishing reserves and the climatic change issues plus meeting international targets • nuclear power – positive and negative points e.g. France, UK • the development of renewables: wind farms, solar energy, wave and expansion of HEP schemes raises cost and practical issues • many argue that energy conservation should be a greater priority. For LEDCs • for many, alternative sources of energy are already a priority e.g. Brazil with biofuels, geothermal energy (Kenya) • LEDC dependence upon traditional fuels e.g. wood and coal through economic and social necessity • countries such as China and India prioritise and use coal for economic expansion • costs and lack of technology prevent development of wind farms, solar energy. Band 1 answers will contain a balance of LEDCs and MEDCs and focus on priorities in relation to developing renewable sources of energy. Band 3 answers may be brief and may lack accurate or specific references to examples. Reasoning of priorities will be generalised rather than specific. Band 4 answers will tend to be brief and poorly balanced. Reasons will be general and examplar material will be poorly used. [Total: 40]
Mark scheme, page 9
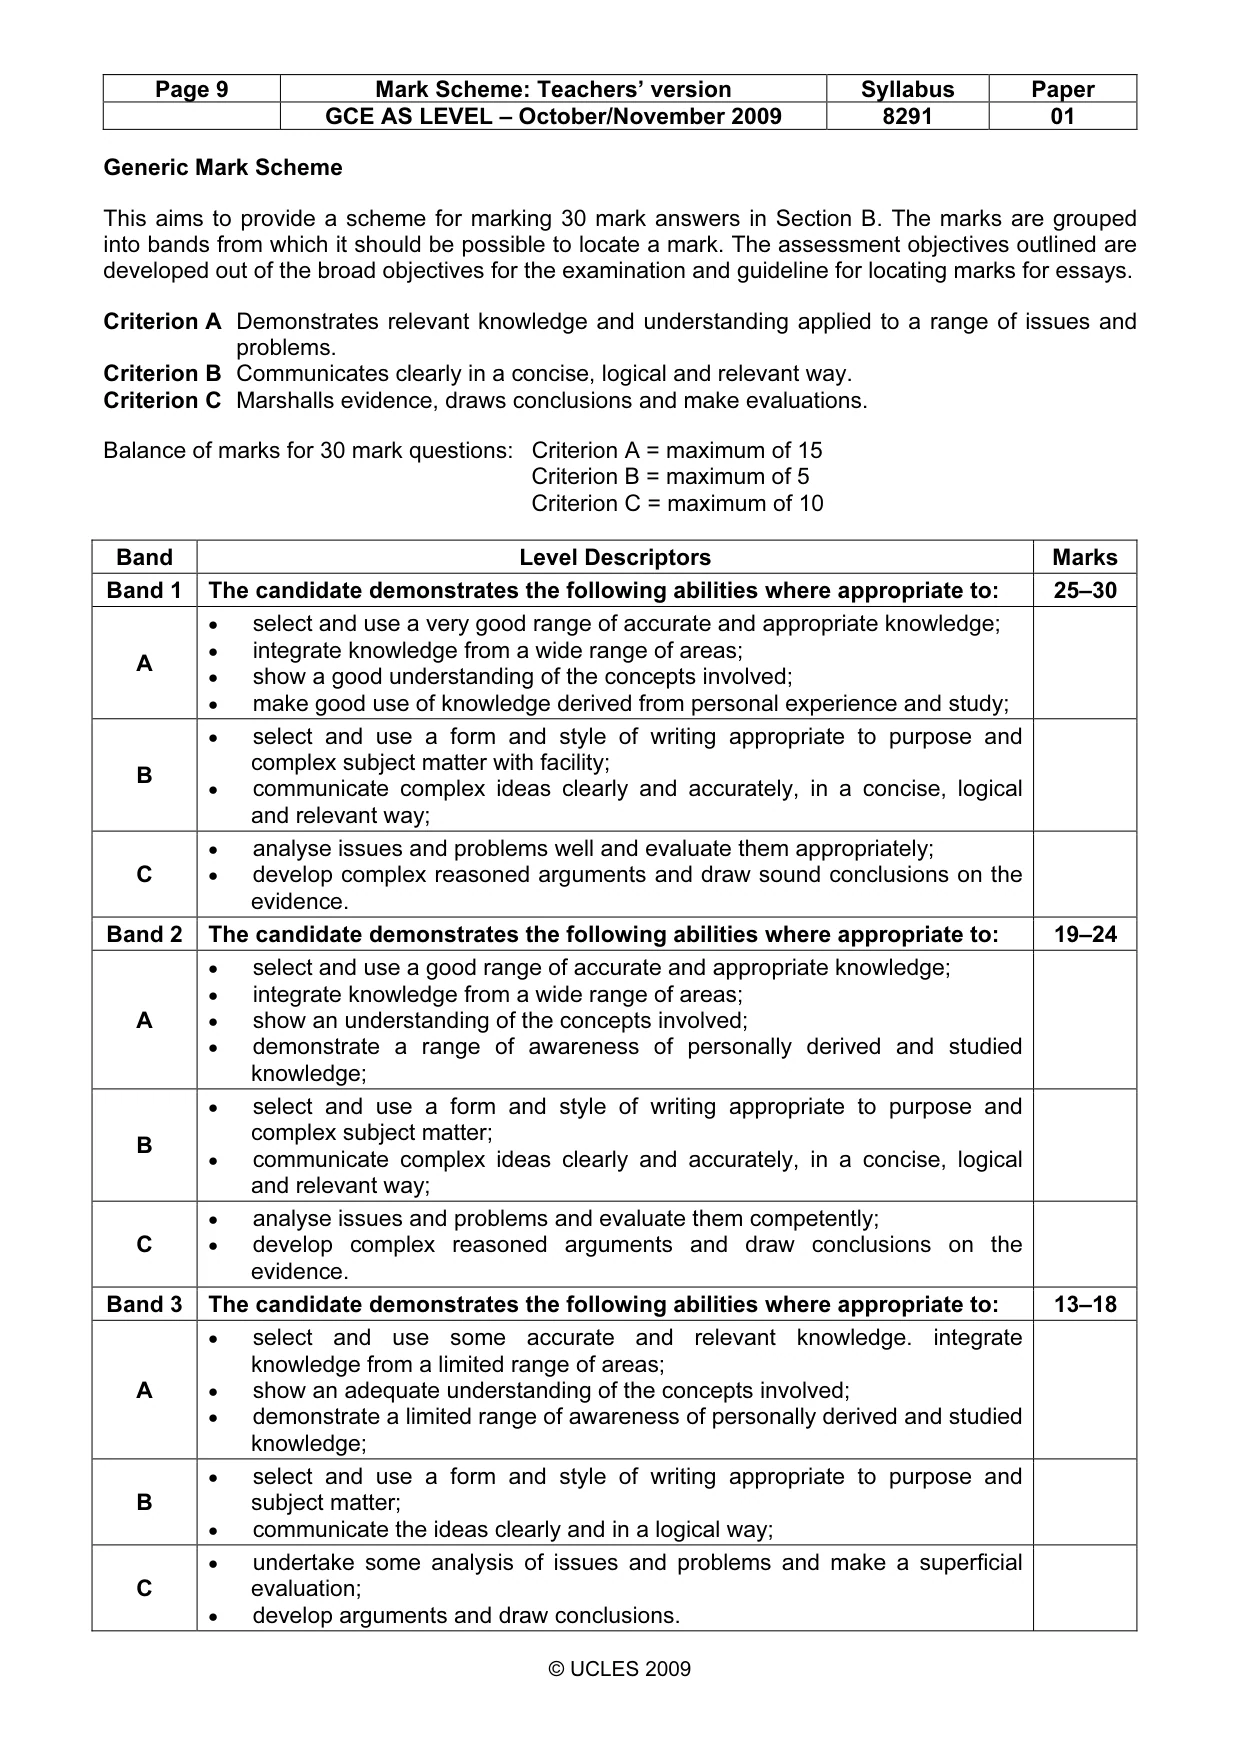
Page 9 Mark Scheme: Teachers’ version Syllabus Paper GCE AS LEVEL – October/November 2009 8291 01 © UCLES 2009 Generic Mark Scheme This aims to provide a scheme for marking 30 mark answers in Section B. The marks are grouped into bands from which it should be possible to locate a mark. The assessment objectives outlined are developed out of the broad objectives for the examination and guideline for locating marks for essays. Criterion A Demonstrates relevant knowledge and understanding applied to a range of issues and problems. Criterion B Communicates clearly in a concise, logical and relevant way. Criterion C Marshalls evidence, draws conclusions and make evaluations. Balance of marks for 30 mark questions: Criterion A = maximum of 15 Criterion B = maximum of 5 Criterion C = maximum of 10 Band Level Descriptors Marks Band 1 The candidate demonstrates the following abilities where appropriate to: 25–30 A • select and use a very good range of accurate and appropriate knowledge; • integrate knowledge from a wide range of areas; • show a good understanding of the concepts involved; • make good use of knowledge derived from personal experience and study; B • select and use a form and style of writing appropriate to purpose and complex subject matter with facility; • communicate complex ideas clearly and accurately, in a concise, logical and relevant way; C • analyse issues and problems well and evaluate them appropriately; • develop complex reasoned arguments and draw sound conclusions on the evidence. Band 2 The candidate demonstrates the following abilities where appropriate to: 19–24 A • select and use a good range of accurate and appropriate knowledge; • integrate knowledge from a wide range of areas; • show an understanding of the concepts involved; • demonstrate a range of awareness of personally derived and studied knowledge; B • select and use a form and style of writing appropriate to purpose and complex subject matter; • communicate complex ideas clearly and accurately, in a concise, logical and relevant way; C • analyse issues and problems and evaluate them competently; • develop complex reasoned arguments and draw conclusions on the evidence. Band 3 The candidate demonstrates the following abilities where appropriate to: 13–18 A • select and use some accurate and relevant knowledge. integrate knowledge from a limited range of areas; • show an adequate understanding of the concepts involved; • demonstrate a limited range of awareness of personally derived and studied knowledge; B • select and use a form and style of writing appropriate to purpose and subject matter; • communicate the ideas clearly and in a logical way; C • undertake some analysis of issues and problems and make a superficial evaluation; • develop arguments and draw conclusions.
Mark scheme, page 10
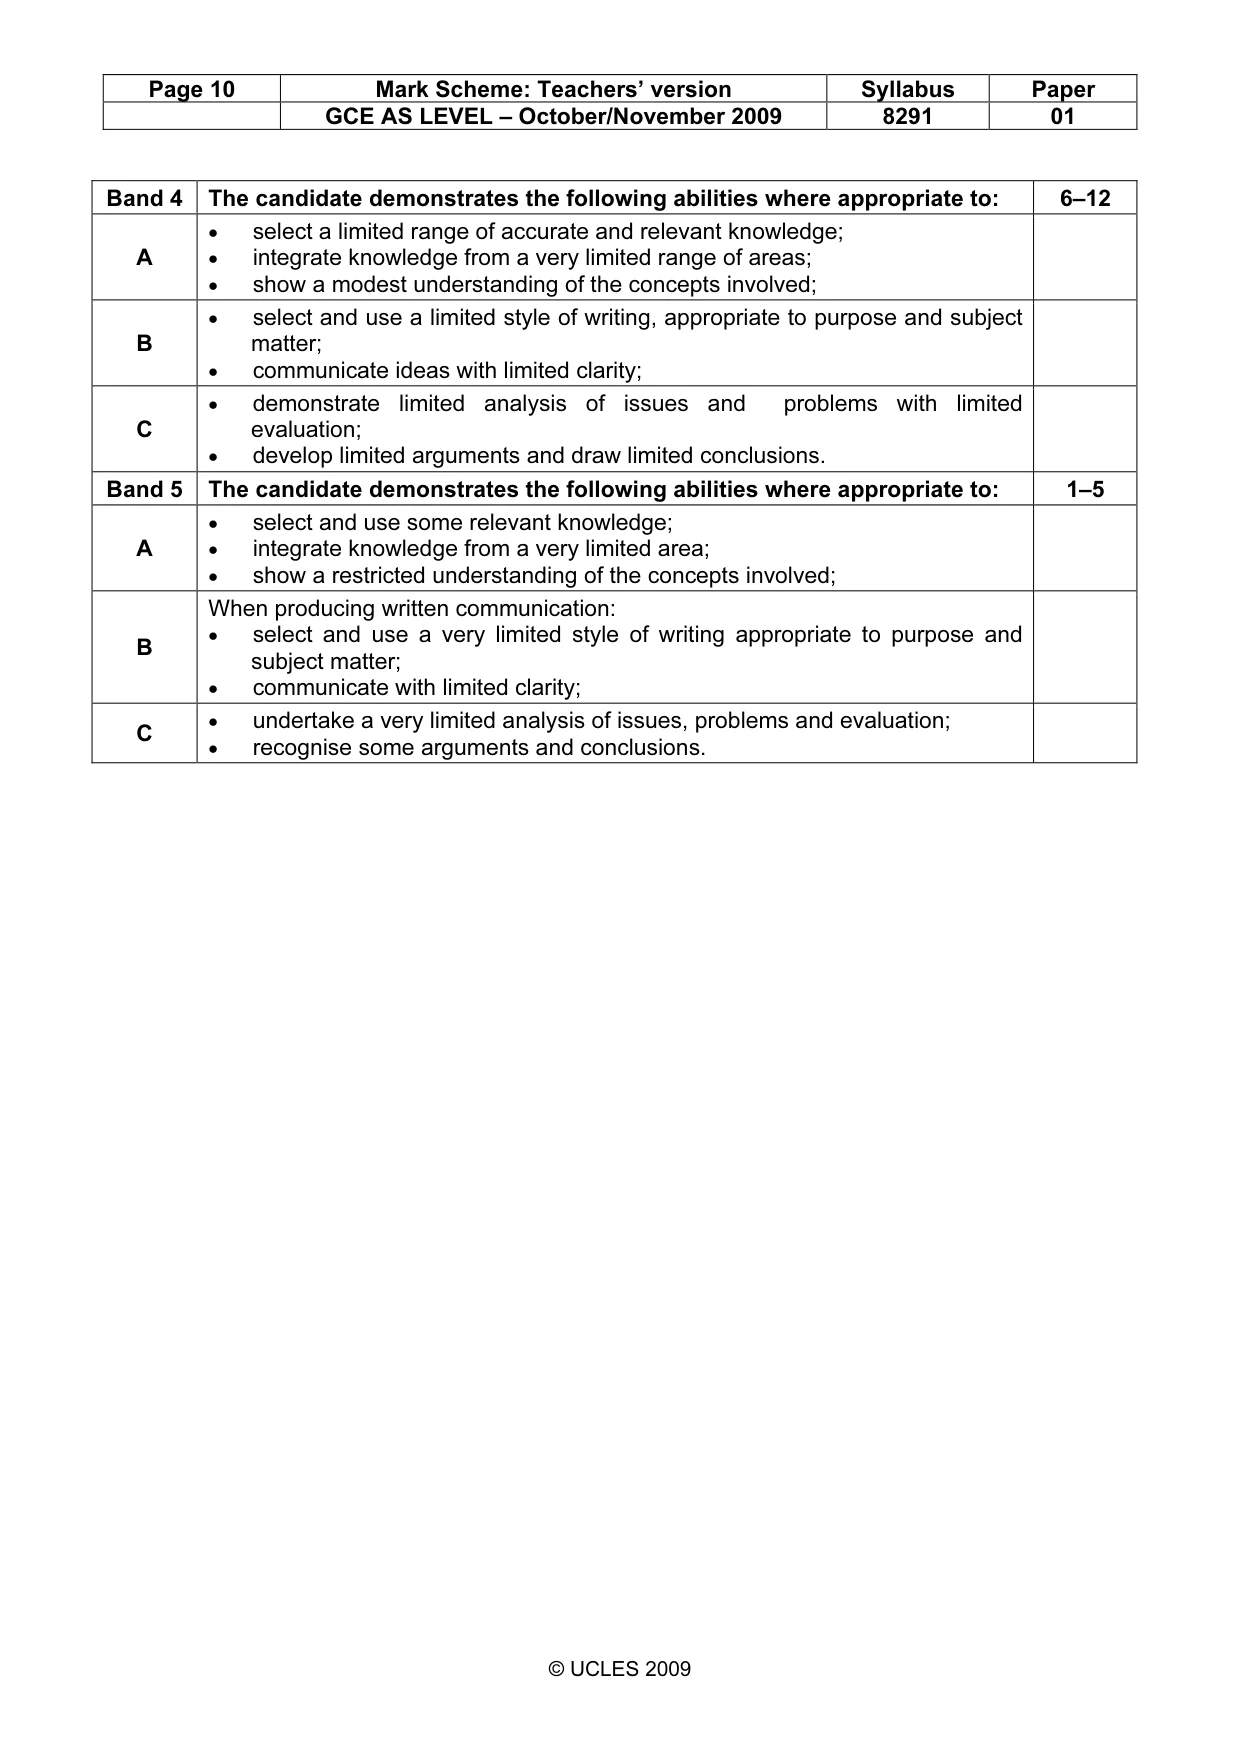
Page 10 Mark Scheme: Teachers’ version Syllabus Paper GCE AS LEVEL – October/November 2009 8291 01 © UCLES 2009 Band 4 The candidate demonstrates the following abilities where appropriate to: 6–12 A • select a limited range of accurate and relevant knowledge; • integrate knowledge from a very limited range of areas; • show a modest understanding of the concepts involved; B • select and use a limited style of writing, appropriate to purpose and subject matter; • communicate ideas with limited clarity; C • demonstrate limited analysis of issues and problems with limited evaluation; • develop limited arguments and draw limited conclusions. Band 5 The candidate demonstrates the following abilities where appropriate to: 1–5 A • select and use some relevant knowledge; • integrate knowledge from a very limited area; • show a restricted understanding of the concepts involved; B When producing written communication: • select and use a very limited style of writing appropriate to purpose and subject matter; • communicate with limited clarity; C • undertake a very limited analysis of issues, problems and evaluation; • recognise some arguments and conclusions.
What you needed in this session
Cambridge’s own grade thresholds for 2009 Oct/Nov, Paper 1 · Variant 1. A higher threshold means an easier paper — the bar moves with how the cohort did.