Cambridge A Level Environmental Management (AS only) 8291 — 2009 May/June Paper 2 · Variant 1
8291/21/M/J/09 · 80 marks · ≈90 min
The question paper and its mark scheme, free to read here and free to download. This is Cambridge’s own paper, exactly as it was sat.
Question paper12 pages

Mark scheme12 pages
Answers below. Sit the paper first if you are practising.

Paper as text
Question paper, page 1
For Examiner’s Use Section A 1 2 Section B Total This document consists of 11 printed pages and 1 blank page. SPA (KN) T78919/2 © UCLES 2009 [Turn over UNIVERSITY OF CAMBRIDGE INTERNATIONAL EXAMINATIONS General Certificate of Education Advanced Subsidiary Level and Advanced Level READ THESE INSTRUCTIONS FIRST Write your Centre number, candidate number and name on all the work you hand in. Write in dark blue or black pen. You may use a soft pencil for any diagrams, graphs, tables or rough working. Do not use staples, paper clips, highlighters, glue or correction fluid. DO NOT WRITE IN ANY BARCODES. Section A Answer all questions. Write your answers in the spaces provided on the question paper. Section B Answer one question from this section. Answer the question on the separate answer paper provided. At the end of the examination, 1. fasten all separate answer paper securely to the question paper; 2. enter the question number from Section B in the grid opposite. CANDIDATE NAME CENTRE NUMBER CANDIDATE NUMBER ENVIRONMENTAL MANAGEMENT 8291/02 Paper 2 Hydrosphere and Biosphere May/June 2009 1 hour 30 minutes Additional Materials: Answer Booklet/Paper * 9 4 2 2 1 4 5 7 0 6 *
Question paper, page 2
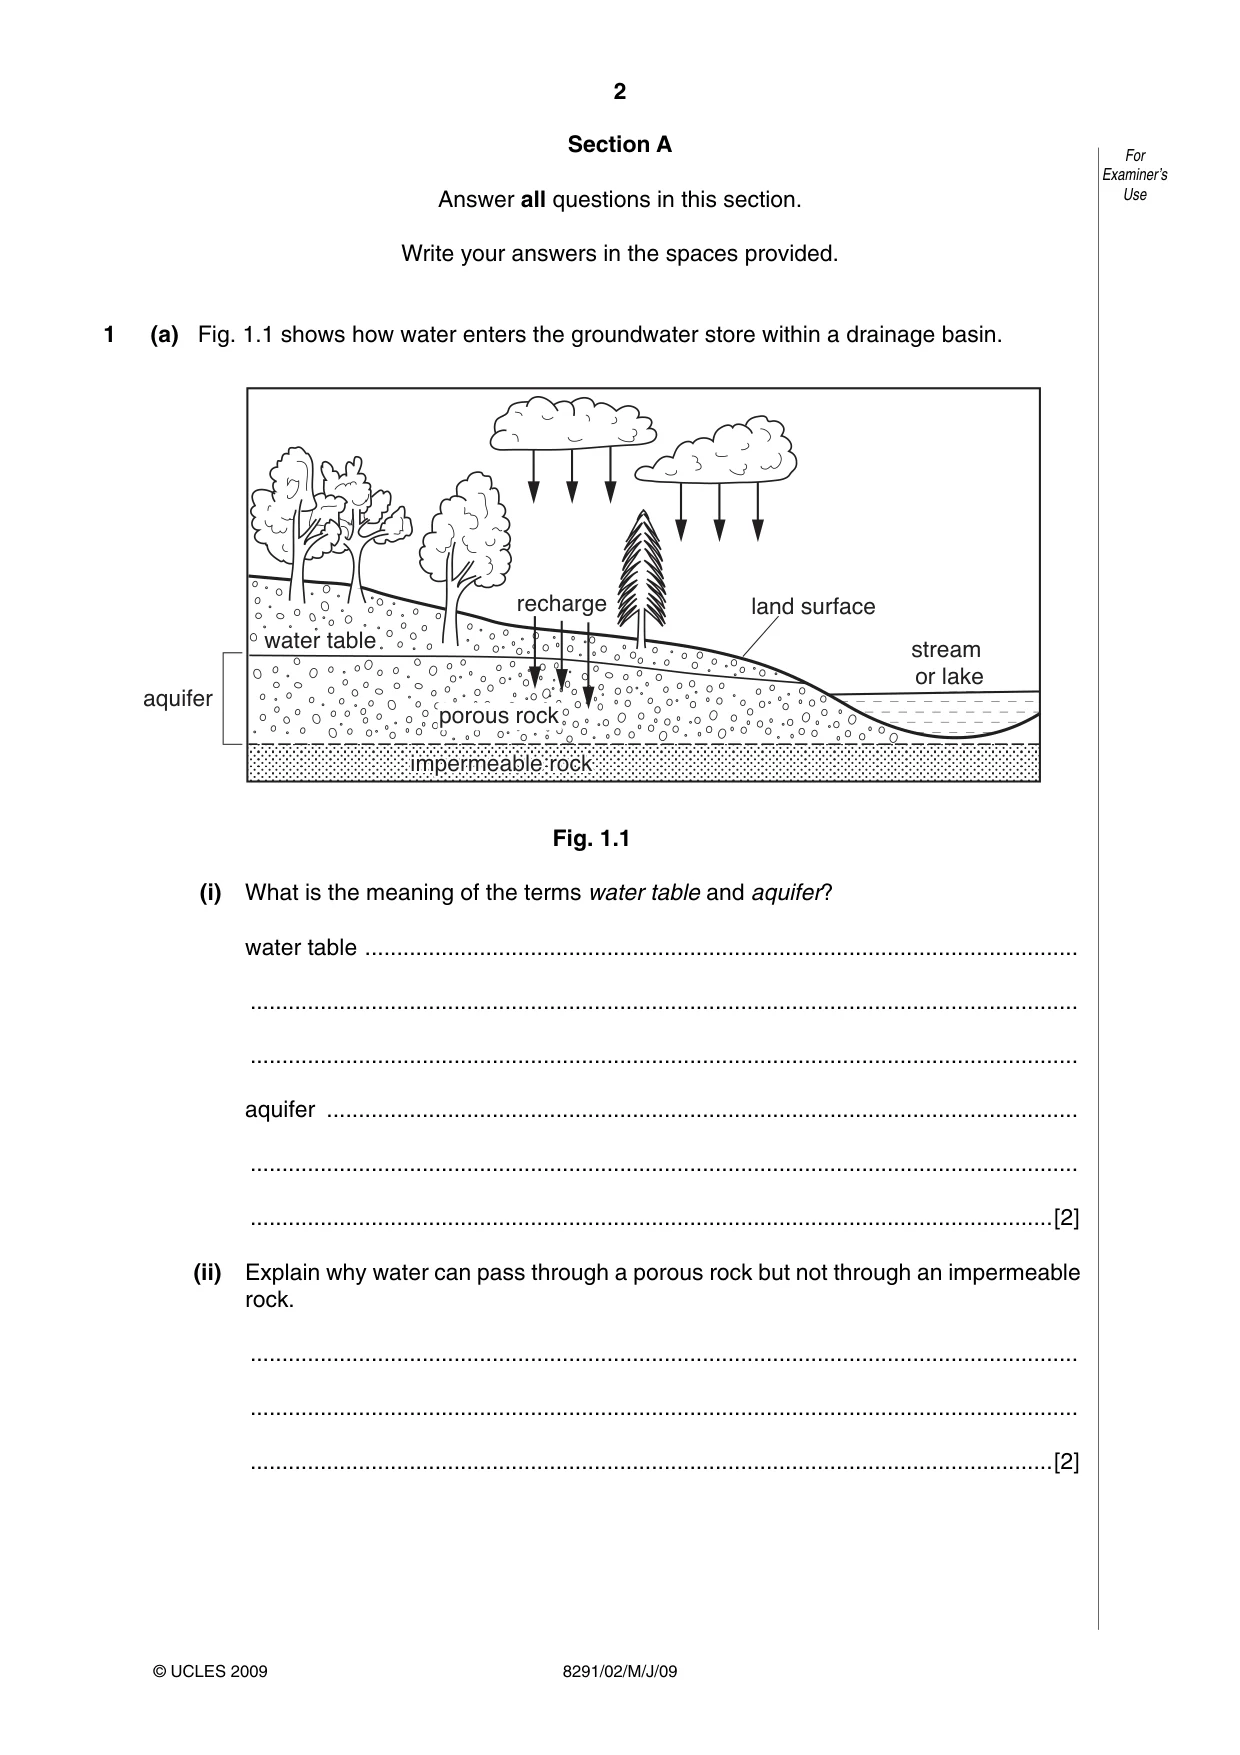
2 8291/02/M/J/09 For Examiner’s Use © UCLES 2009 Section A Answer all questions in this section. Write your answers in the spaces provided. 1 (a) Fig. 1.1 shows how water enters the groundwater store within a drainage basin. water table recharge porous rock impermeable rock impermeable rock impermeable rock stream or lake land surface aquifer Fig. 1.1 (i) What is the meaning of the terms water table and aquifer? water table … … … aquifer … … …[2] (ii) Explain why water can pass through a porous rock but not through an impermeable rock. … … …[2]
Question paper, page 3
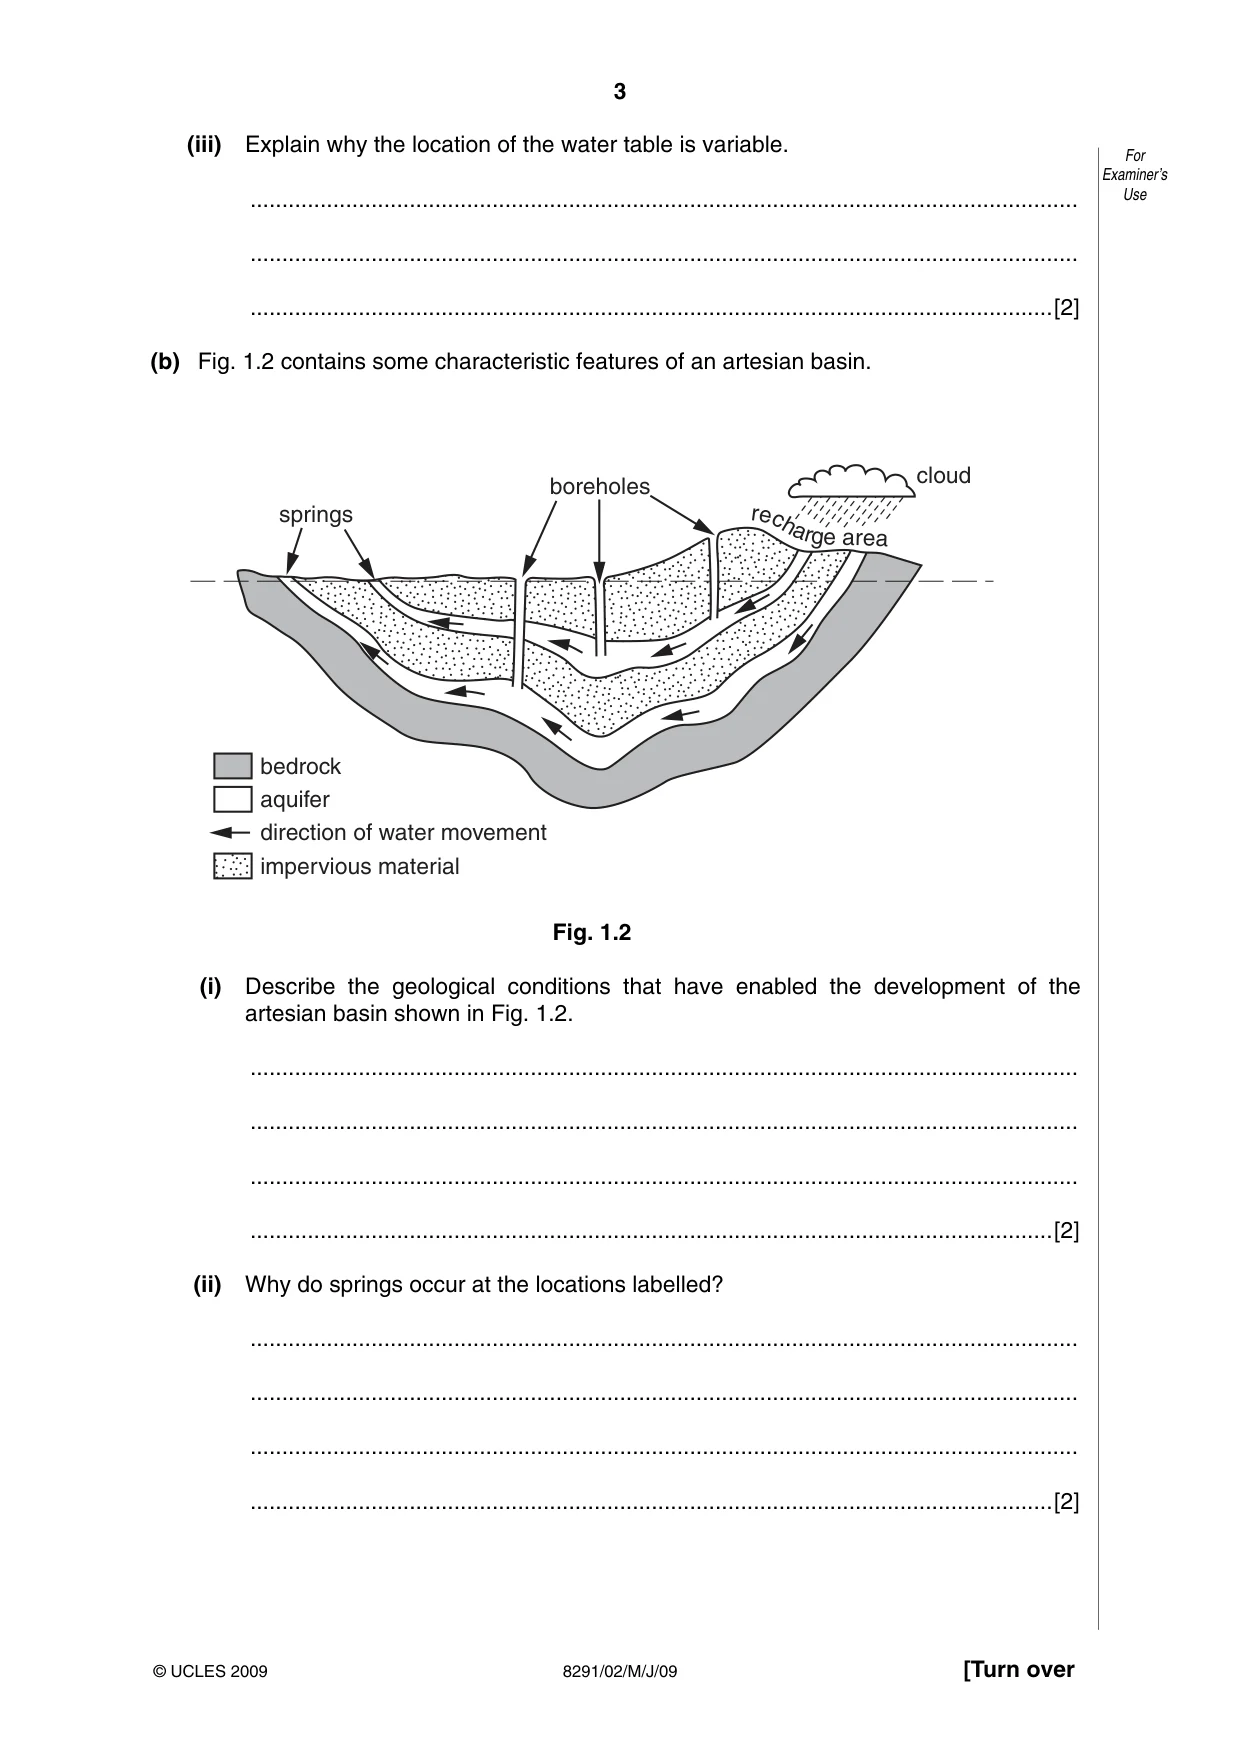
3 8291/02/M/J/09 [Turn over For Examiner’s Use © UCLES 2009 (iii) Explain why the location of the water table is variable. … … …[2] (b) Fig. 1.2 contains some characteristic features of an artesian basin. springs boreholes r e c h a r g e area cloud bedrock aquifer direction of water movement impervious material Fig. 1.2 (i) Describe the geological conditions that have enabled the development of the artesian basin shown in Fig. 1.2. … … … …[2] (ii) Why do springs occur at the locations labelled? … … … …[2]
Question paper, page 4
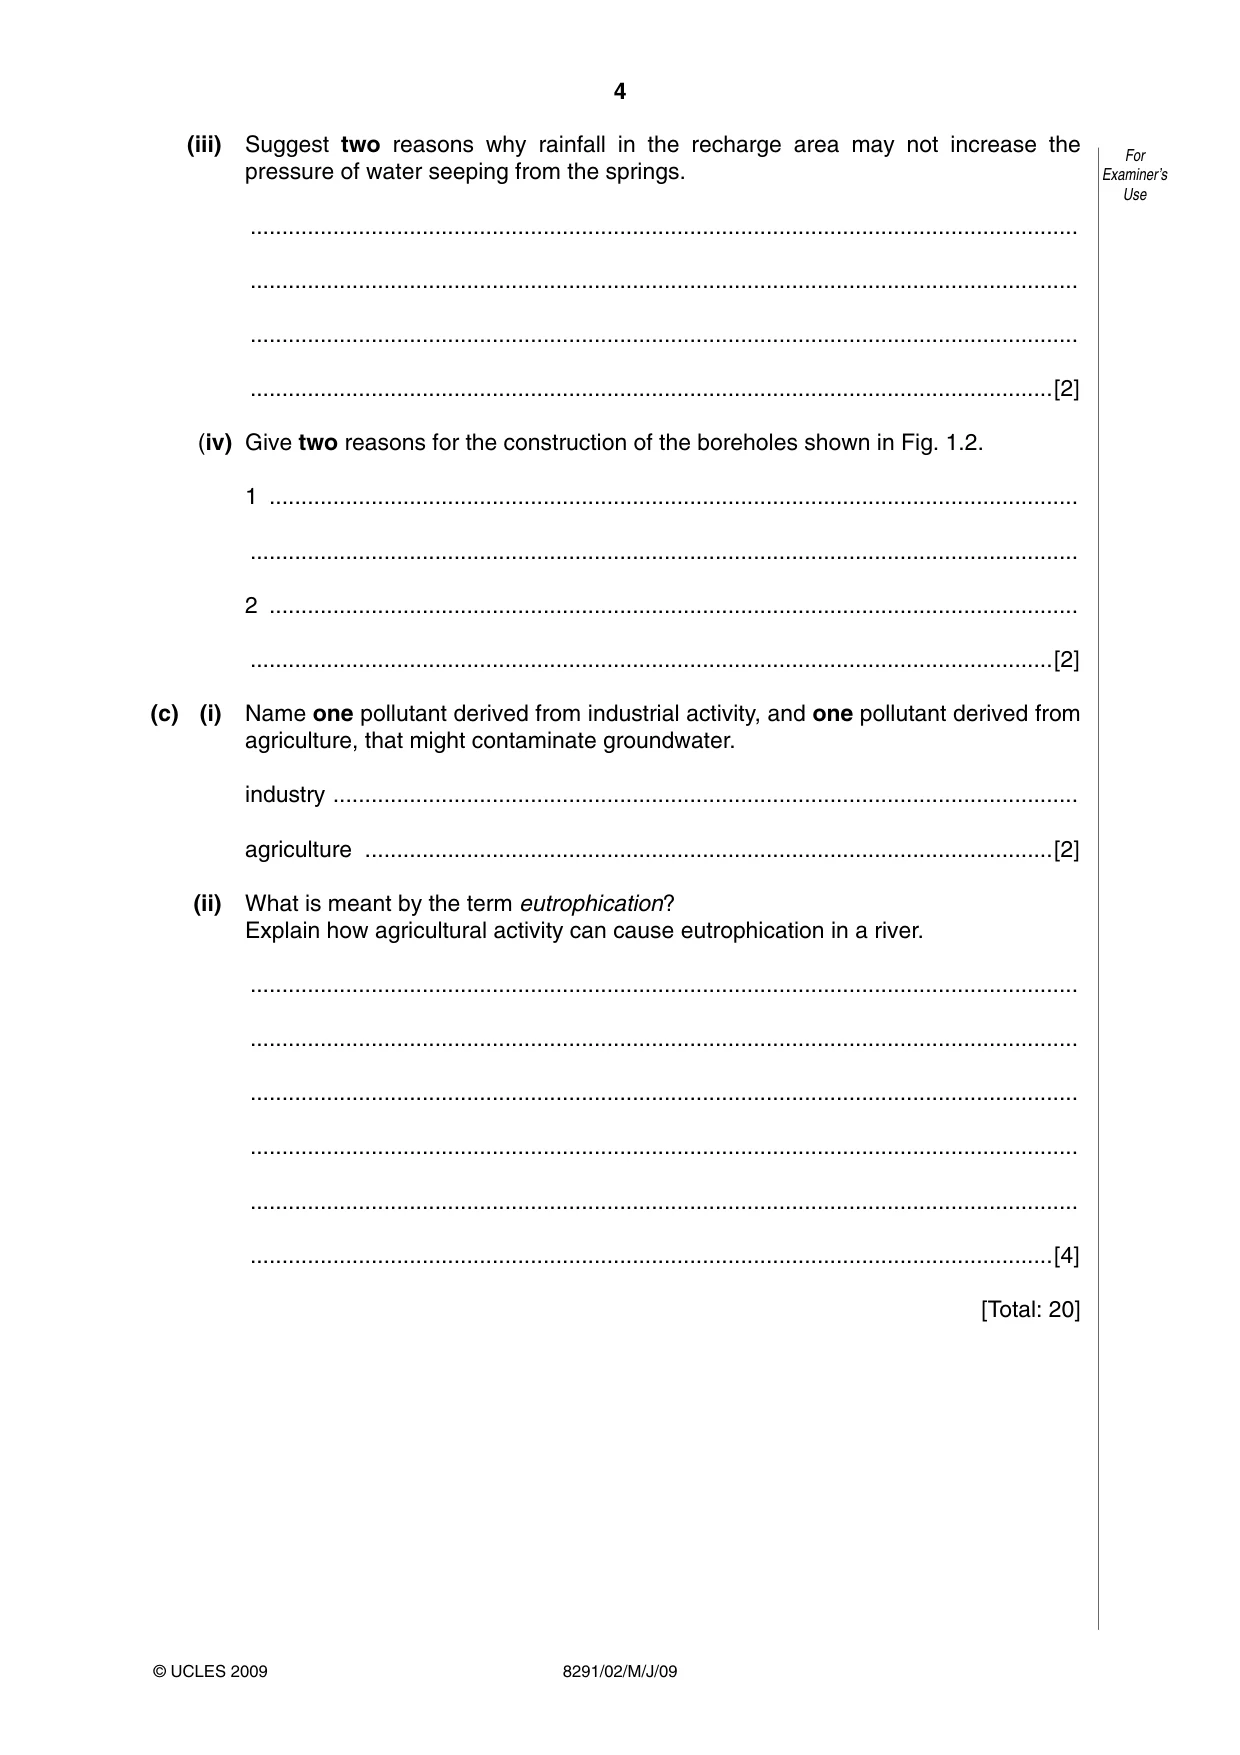
4 8291/02/M/J/09 For Examiner’s Use © UCLES 2009 (iii) Suggest two reasons why rainfall in the recharge area may not increase the pressure of water seeping from the springs. … … … …[2] (iv) Give two reasons for the construction of the boreholes shown in Fig. 1.2. 1 … … 2 … …[2] (c) (i) Name one pollutant derived from industrial activity, and one pollutant derived from agriculture, that might contaminate groundwater. industry … agriculture …[2] (ii) What is meant by the term eutrophication? Explain how agricultural activity can cause eutrophication in a river. … … … … … …[4] [Total: 20]
Question paper, page 5
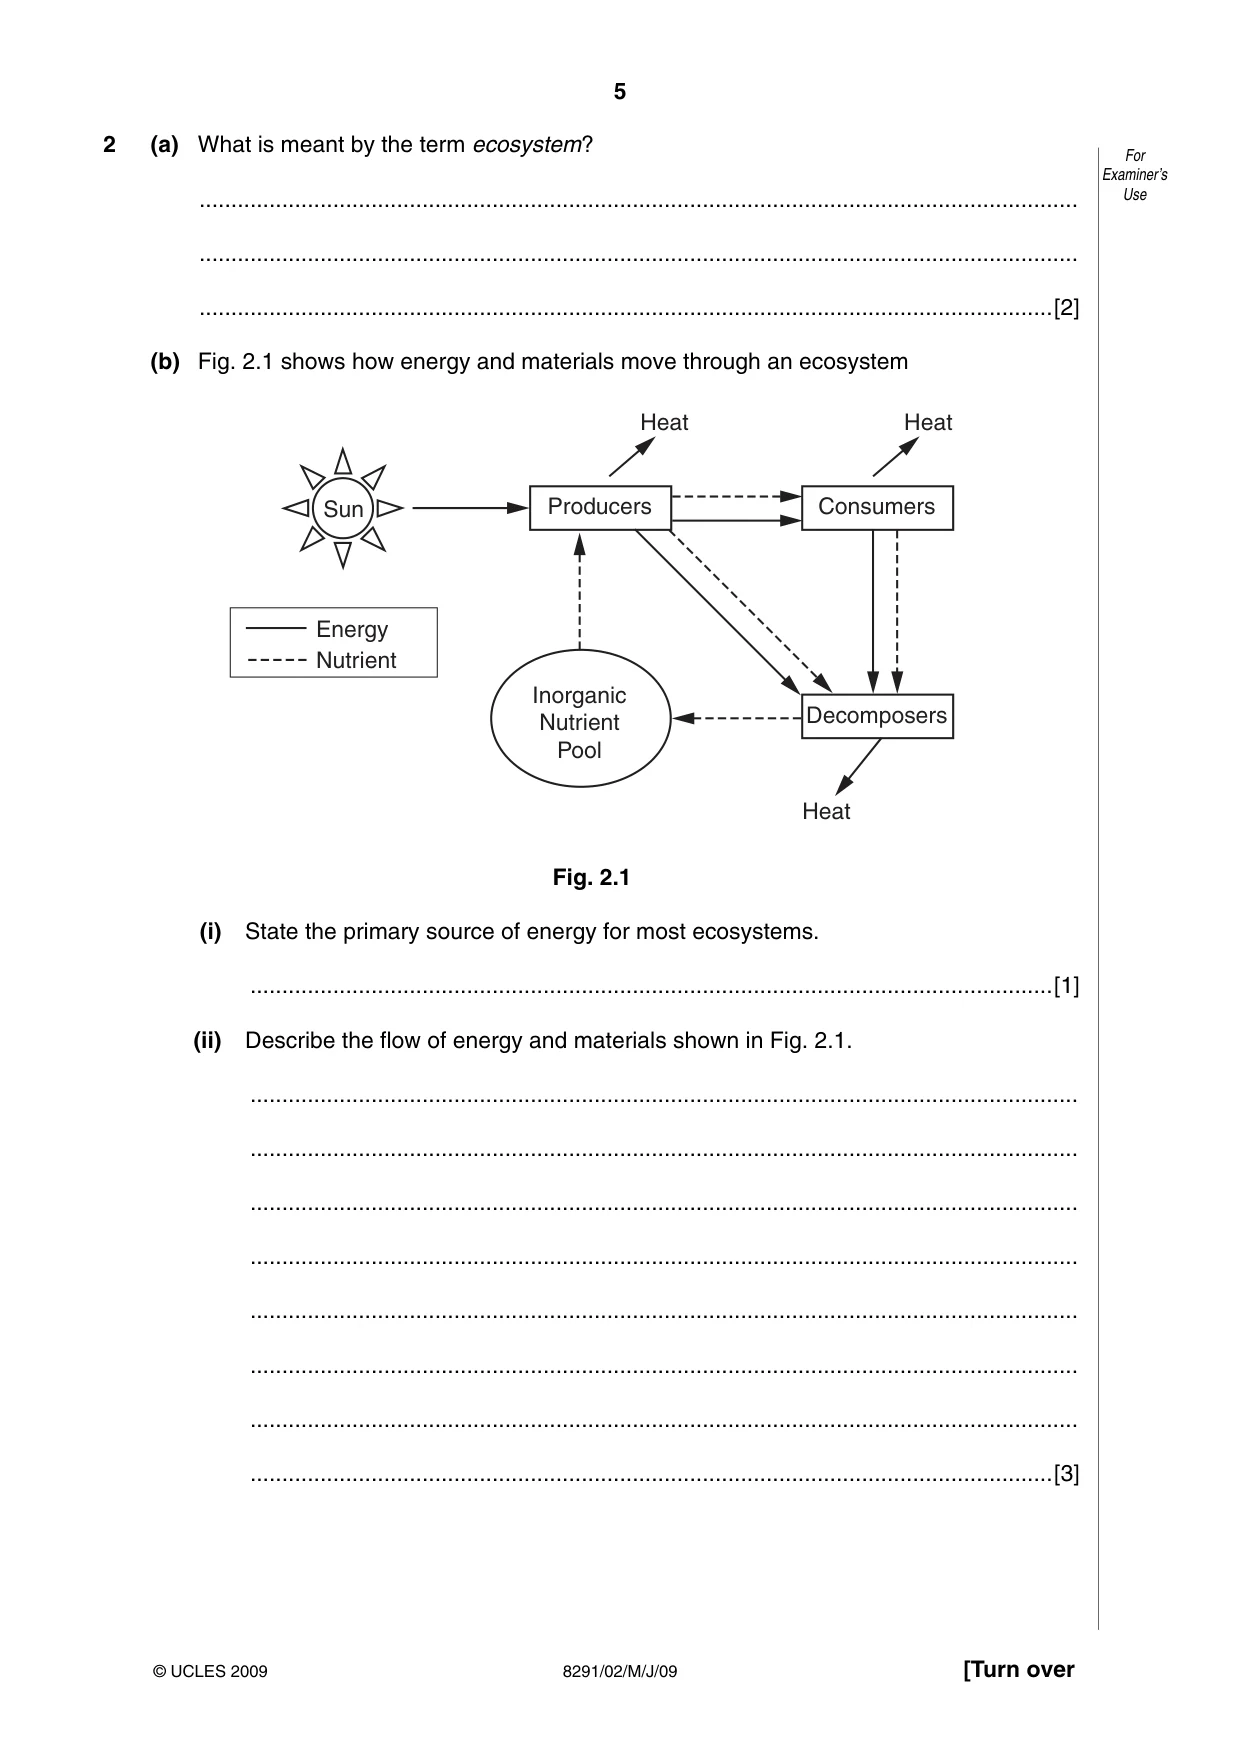
5 8291/02/M/J/09 [Turn over For Examiner’s Use © UCLES 2009 2 (a) What is meant by the term ecosystem? … … …[2] (b) Fig. 2.1 shows how energy and materials move through an ecosystem Sun Producers Inorganic Nutrient Pool Consumers Decomposers Heat Heat Heat Energy Nutrient Fig. 2.1 (i) State the primary source of energy for most ecosystems. …[1] (ii) Describe the flow of energy and materials shown in Fig. 2.1. … … … … … … … …[3]
Question paper, page 6
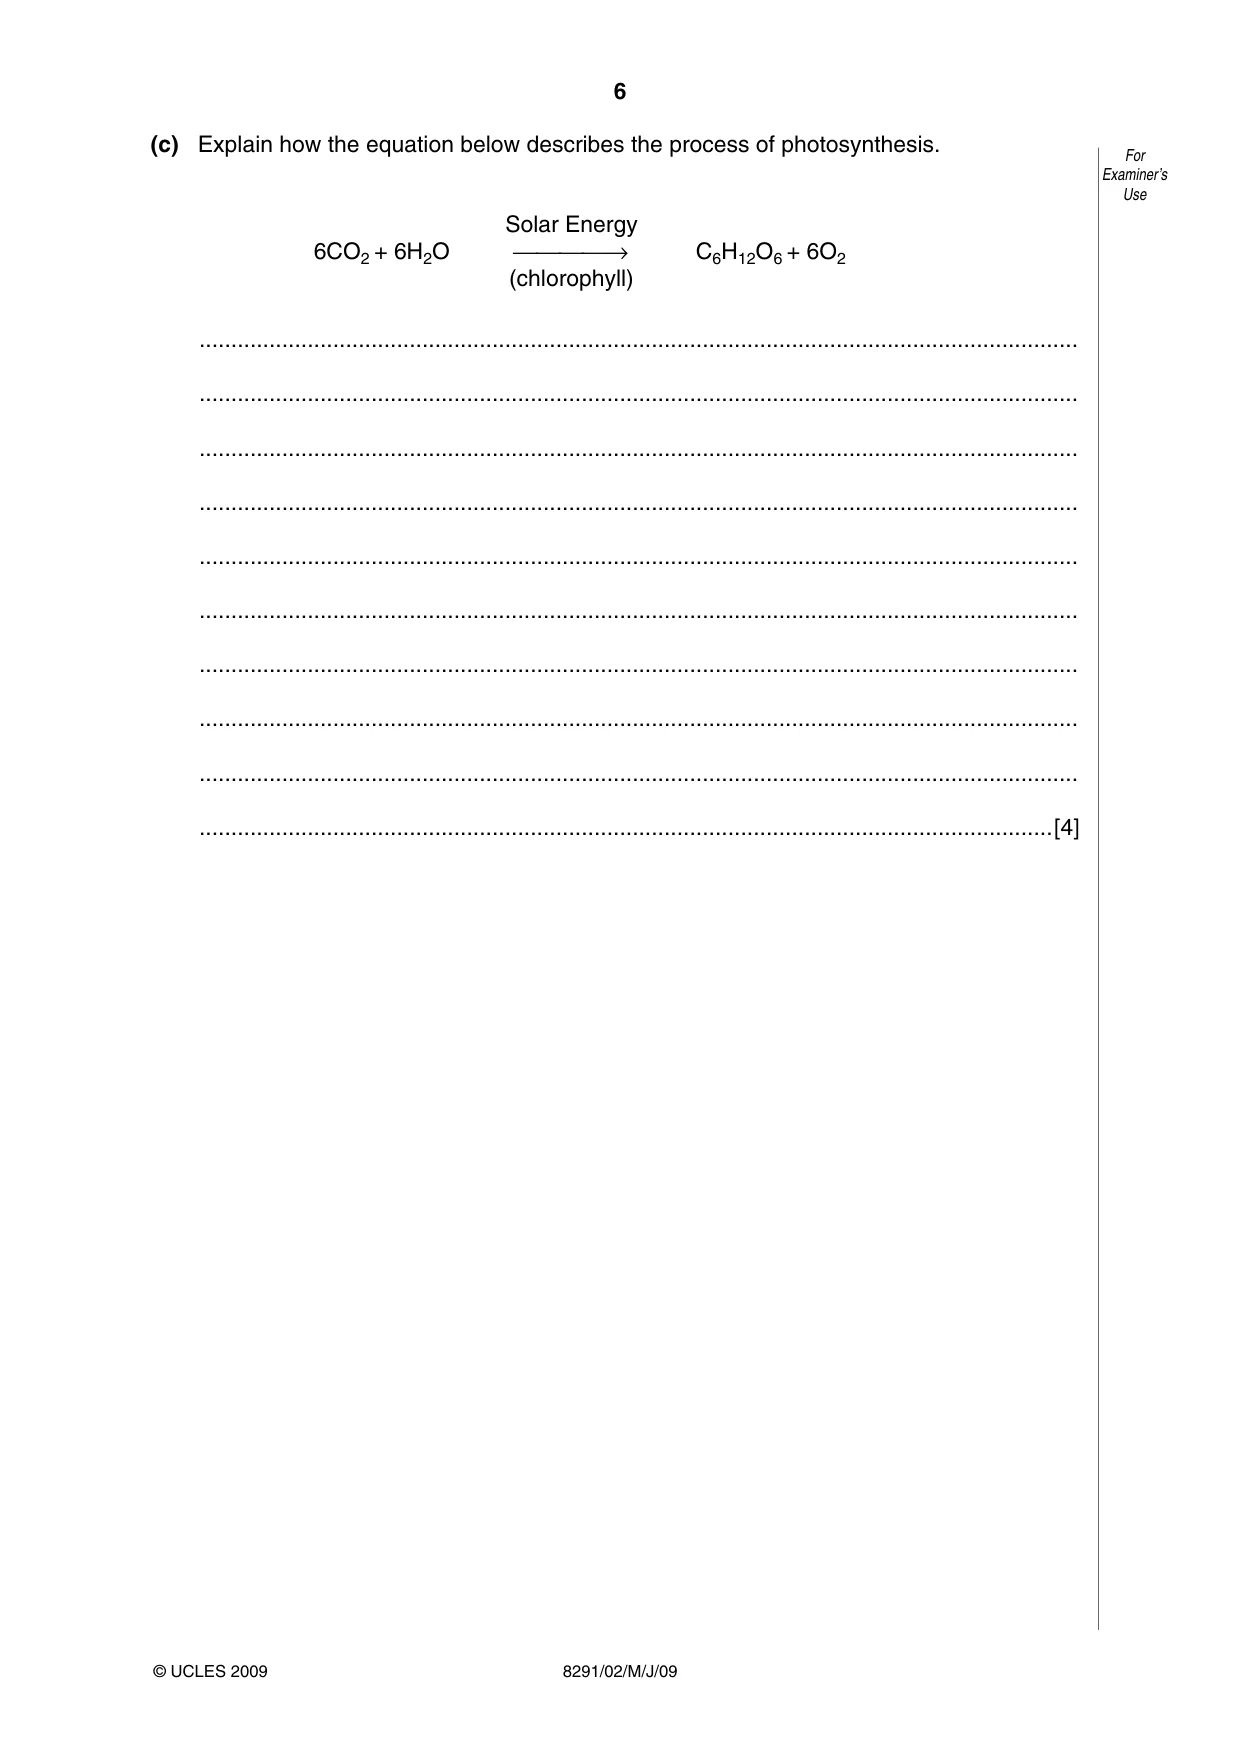
6 8291/02/M/J/09 For Examiner’s Use © UCLES 2009 (c) Explain how the equation below describes the process of photosynthesis. 6CO2 + 6H2O Solar Energy ⎯⎯⎯⎯→ (chlorophyll) C6H12O6 + 6O2 … … … … … … … … … …[4]
Question paper, page 7
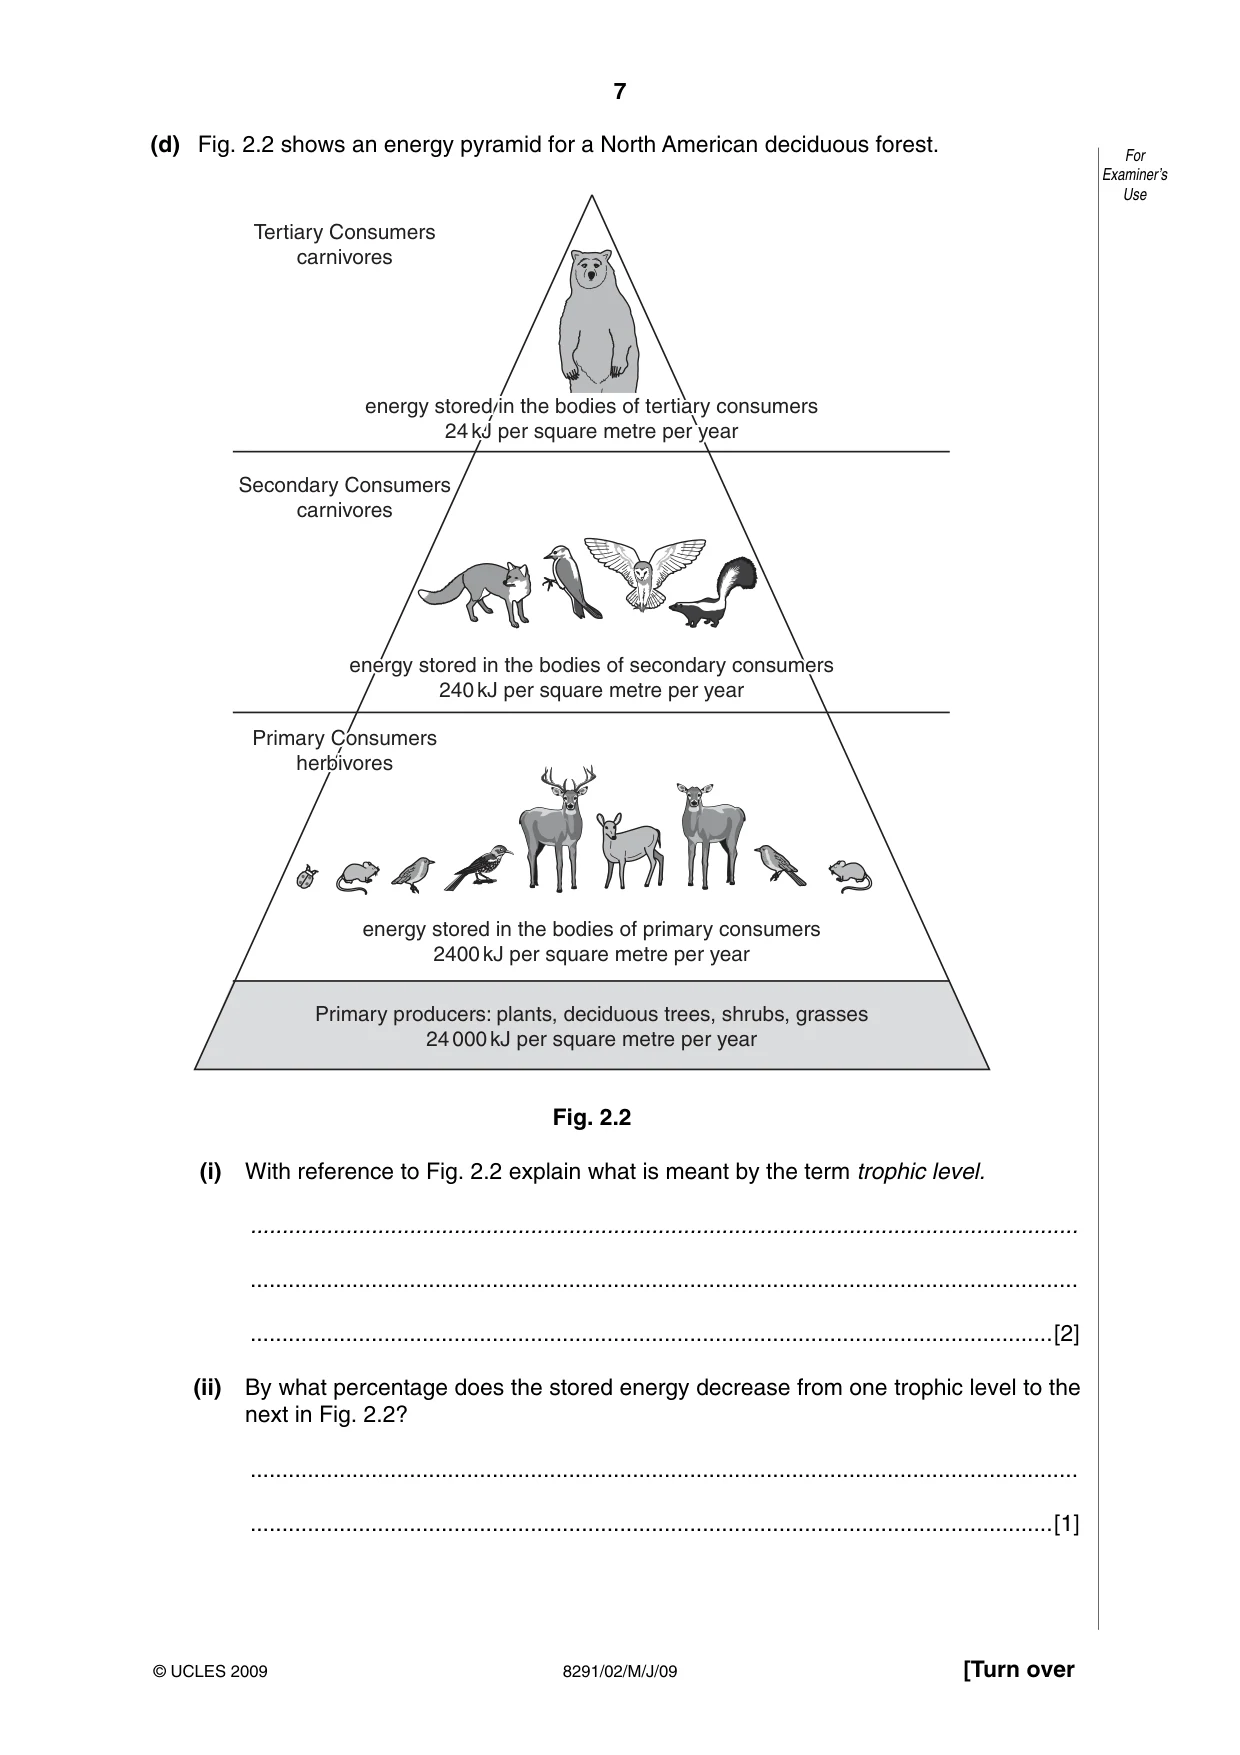
7 8291/02/M/J/09 [Turn over For Examiner’s Use © UCLES 2009 (d) Fig. 2.2 shows an energy pyramid for a North American deciduous forest. energy stored in the bodies of tertiary consumers energy stored in the bodies of tertiary consumers 24 24 kJ per square metre per year kJ per square metre per year energy stored in the bodies of tertiary consumers 24 kJ per square metre per year energy stored in the bodies of secondary consumers energy stored in the bodies of secondary consumers 240 240 kJ per square metre per year kJ per square metre per year Tertiary Consumers carnivores Secondary Consumers carnivores Primary Consumers Primary Consumers herbivores herbivores energy stored in the bodies of secondary consumers 240 kJ per square metre per year energy stored in the bodies of primary consumers 2400 kJ per square metre per year Primary producers: plants, deciduous trees, shrubs, grasses 24 000 kJ per square metre per year Primary Consumers herbivores Fig. 2.2 (i) With reference to Fig. 2.2 explain what is meant by the term trophic level. … … …[2] (ii) By what percentage does the stored energy decrease from one trophic level to the next in Fig. 2.2? … …[1]
Question paper, page 8
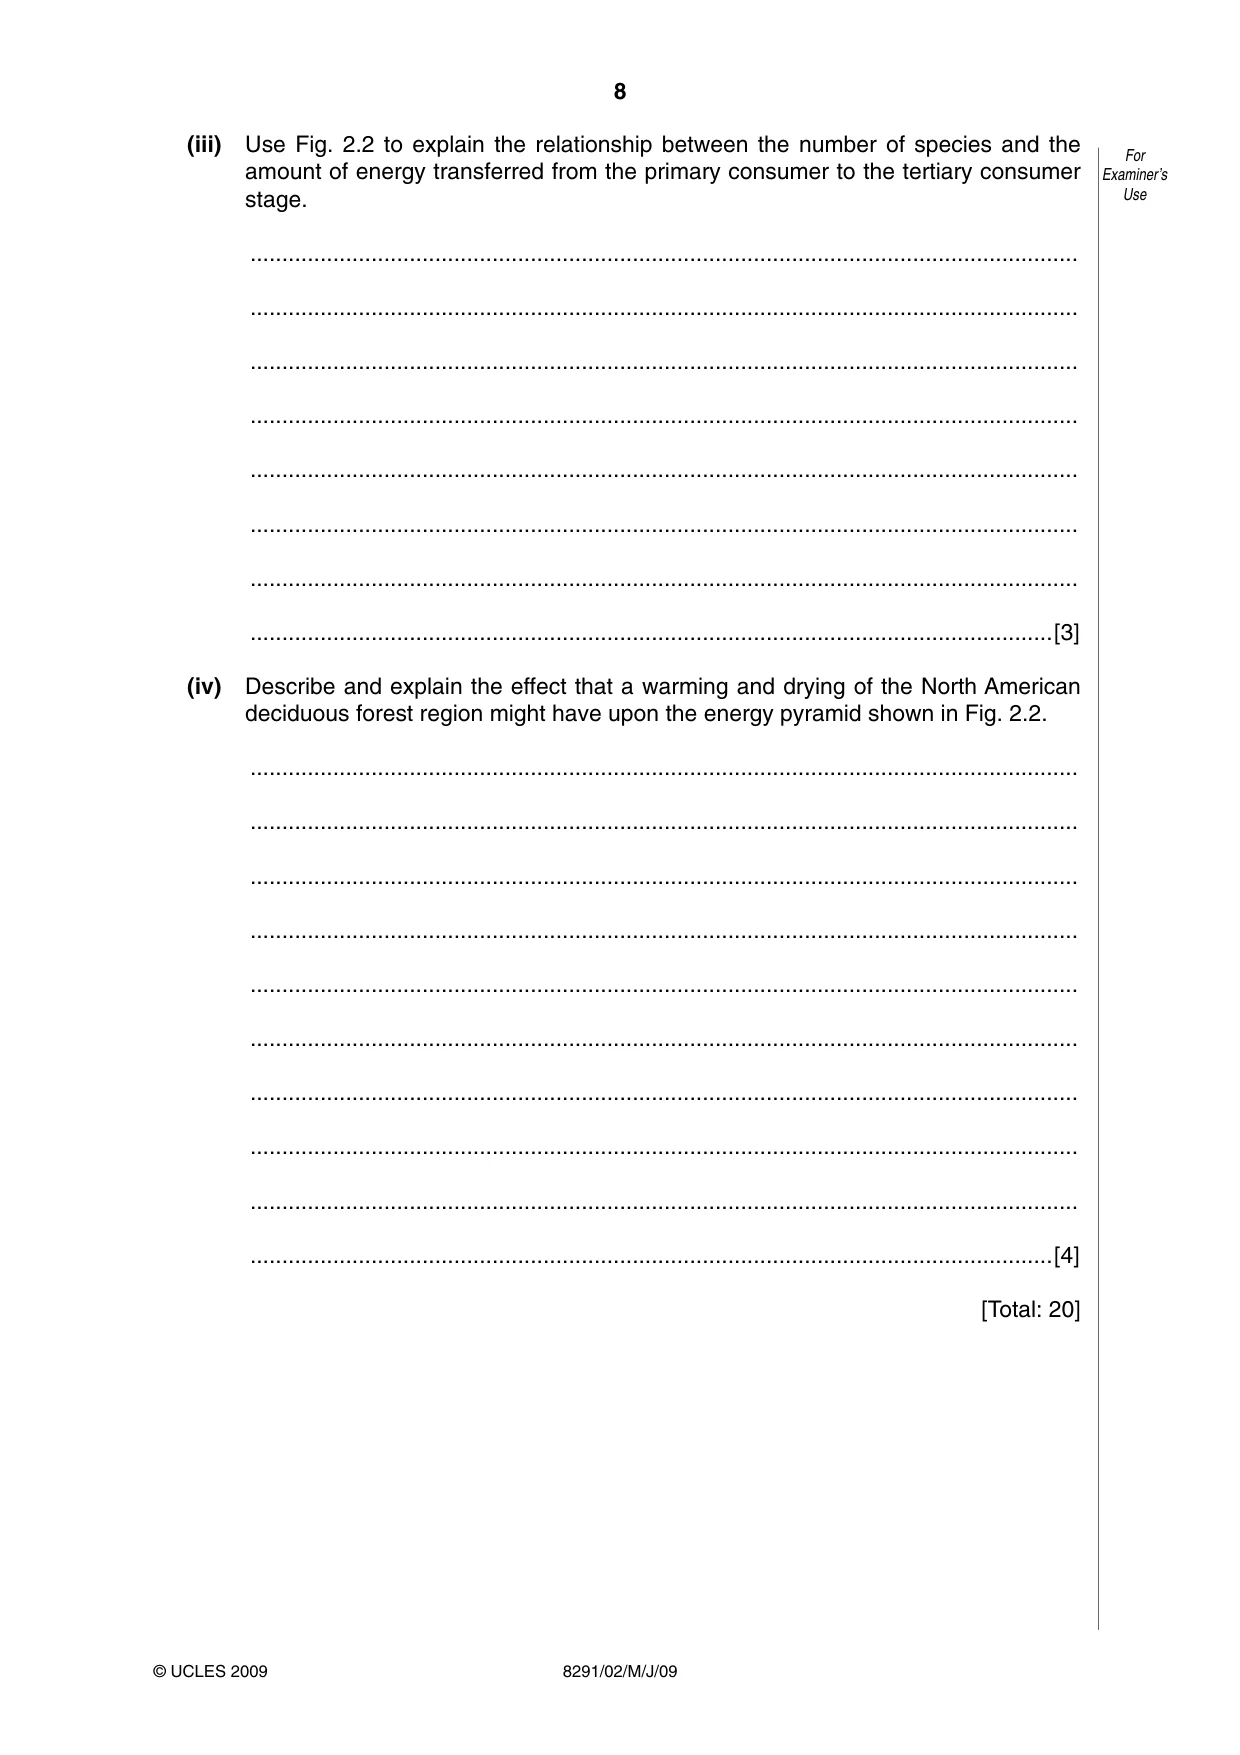
8 8291/02/M/J/09 For Examiner’s Use © UCLES 2009 (iii) Use Fig. 2.2 to explain the relationship between the number of species and the amount of energy transferred from the primary consumer to the tertiary consumer stage. … … … … … … … …[3] (iv) Describe and explain the effect that a warming and drying of the North American deciduous forest region might have upon the energy pyramid shown in Fig. 2.2. … … … … … … … … … …[4] [Total: 20]
Question paper, page 9
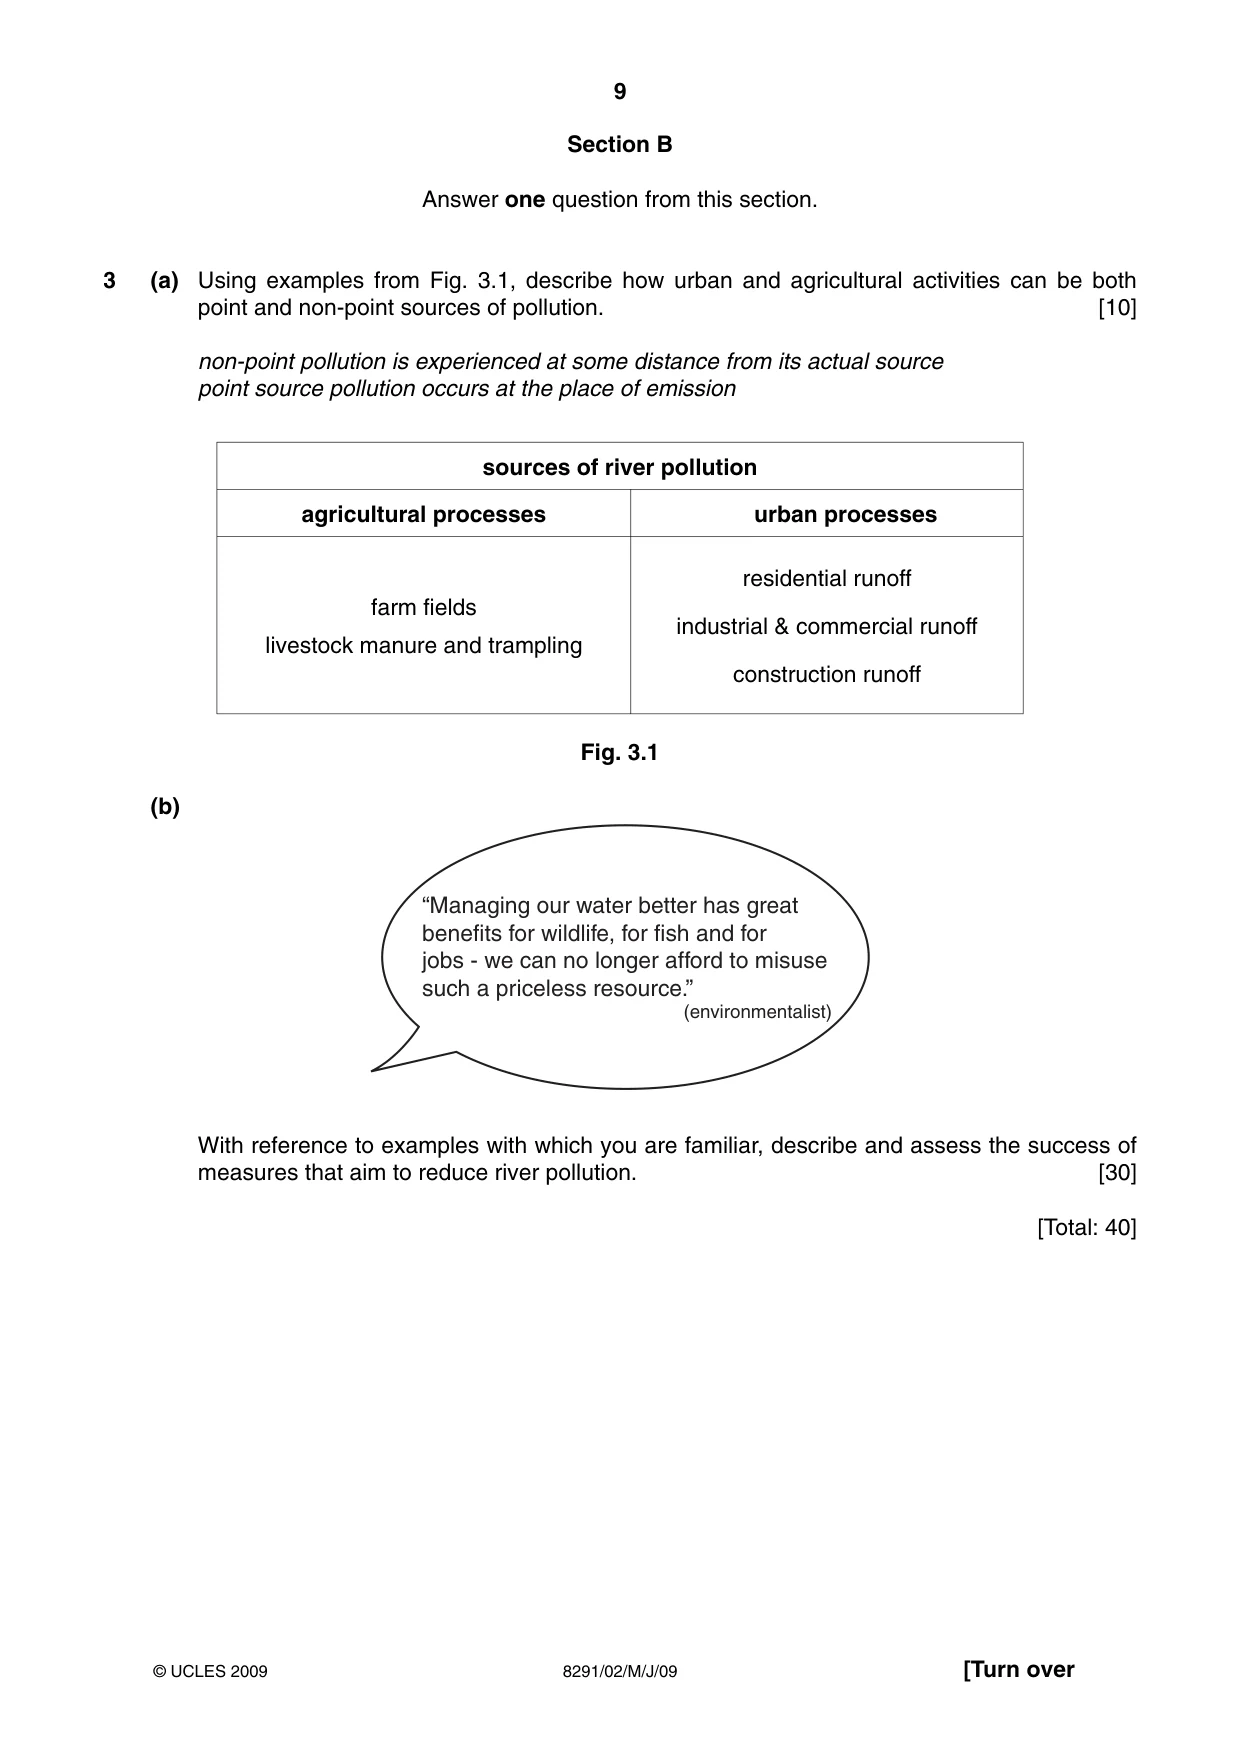
9 8291/02/M/J/09 © UCLES 2009 [Turn over Section B Answer one question from this section. 3 (a) Using examples from Fig. 3.1, describe how urban and agricultural activities can be both point and non-point sources of pollution. [10] non-point pollution is experienced at some distance from its actual source point source pollution occurs at the place of emission sources of river pollution agricultural processes urban processes farm fields livestock manure and trampling residential runoff industrial & commercial runoff construction runoff Fig. 3.1 (b) “Managing our water better has great benefits for wildlife, for fish and for jobs - we can no longer afford to misuse such a priceless resource.” (environmentalist) With reference to examples with which you are familiar, describe and assess the success of measures that aim to reduce river pollution. [30] [Total: 40]
Question paper, page 10
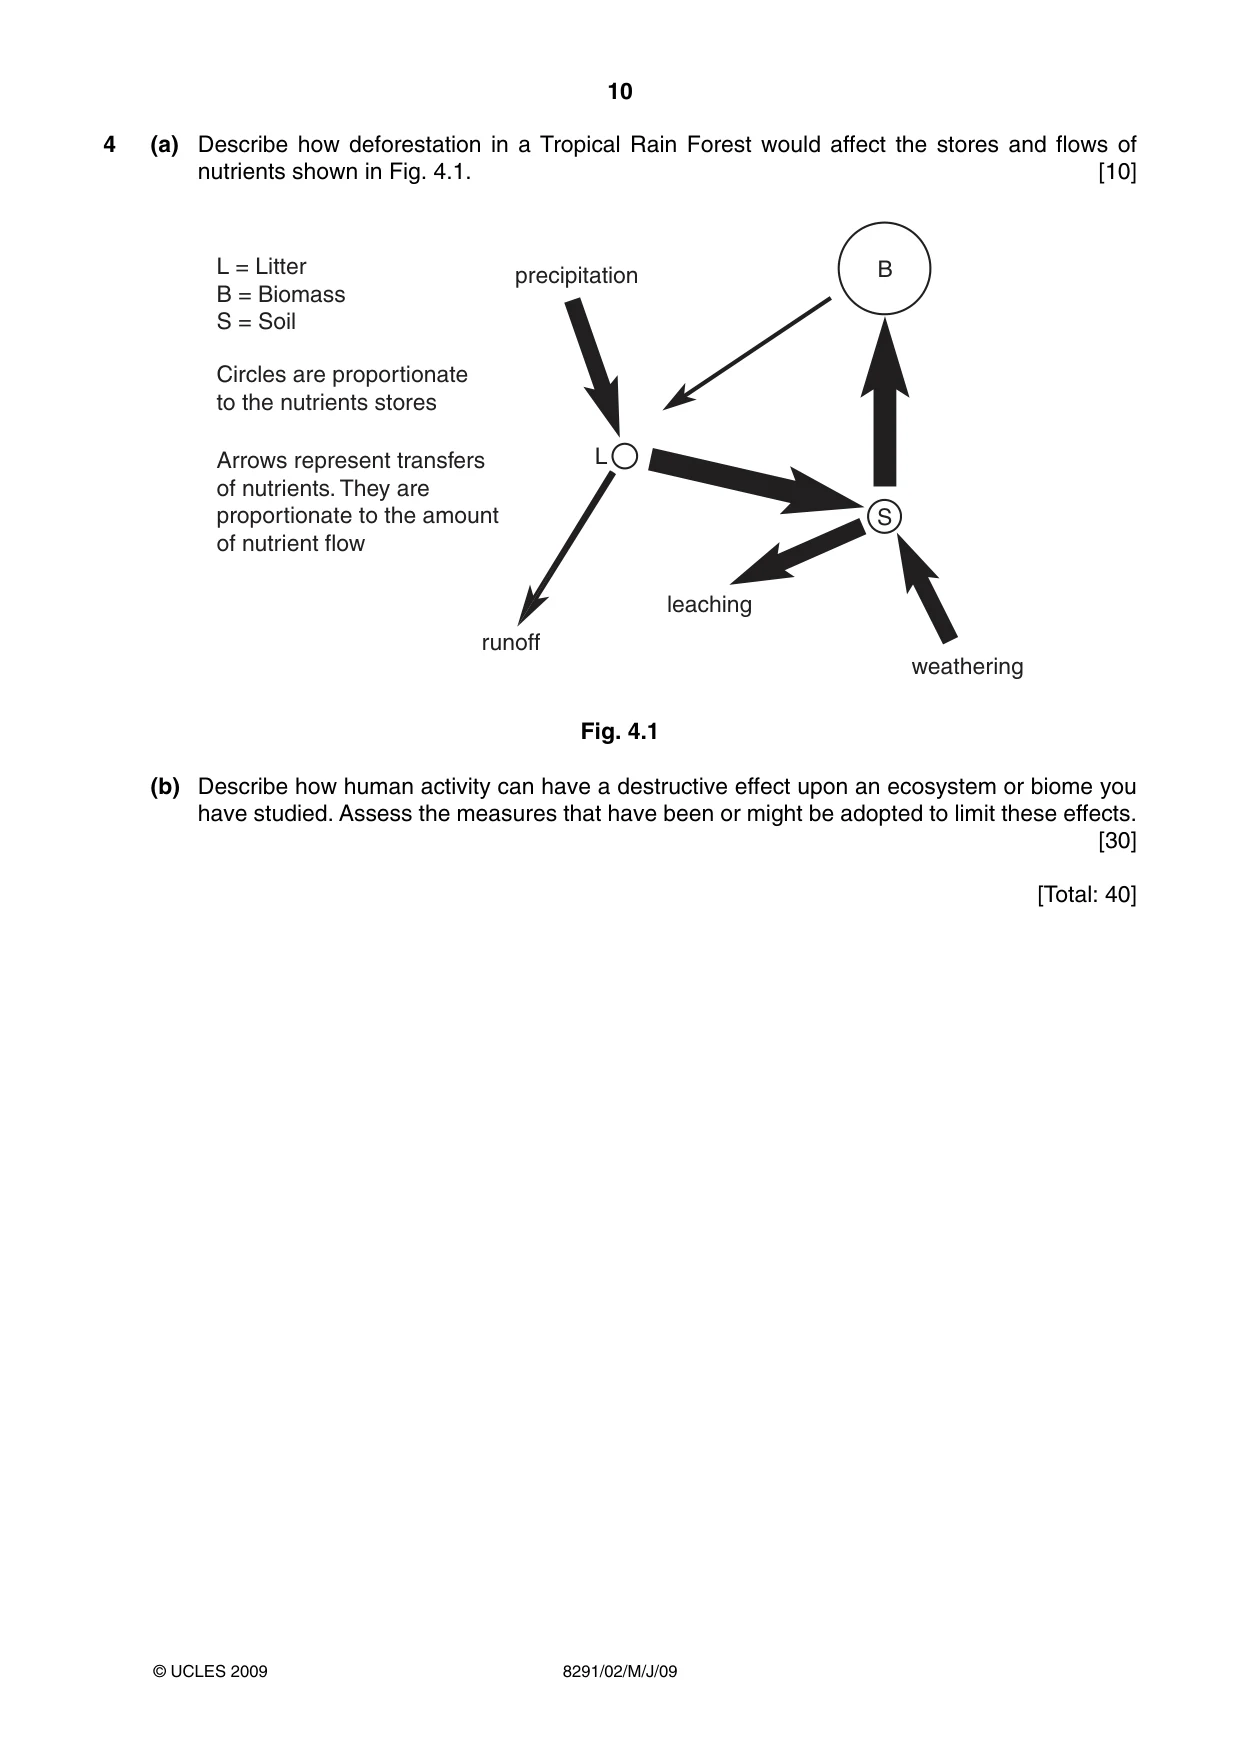
10 8291/02/M/J/09 © UCLES 2009 4 (a) Describe how deforestation in a Tropical Rain Forest would affect the stores and flows of nutrients shown in Fig. 4.1. [10] B L S L = Litter B = Biomass S = Soil precipitation runoff leaching weathering Circles are proportionate to the nutrients stores Arrows represent transfers of nutrients. They are proportionate to the amount of nutrient flow Fig. 4.1 (b) Describe how human activity can have a destructive effect upon an ecosystem or biome you have studied. Assess the measures that have been or might be adopted to limit these effects. [30] [Total: 40]
Question paper, page 11
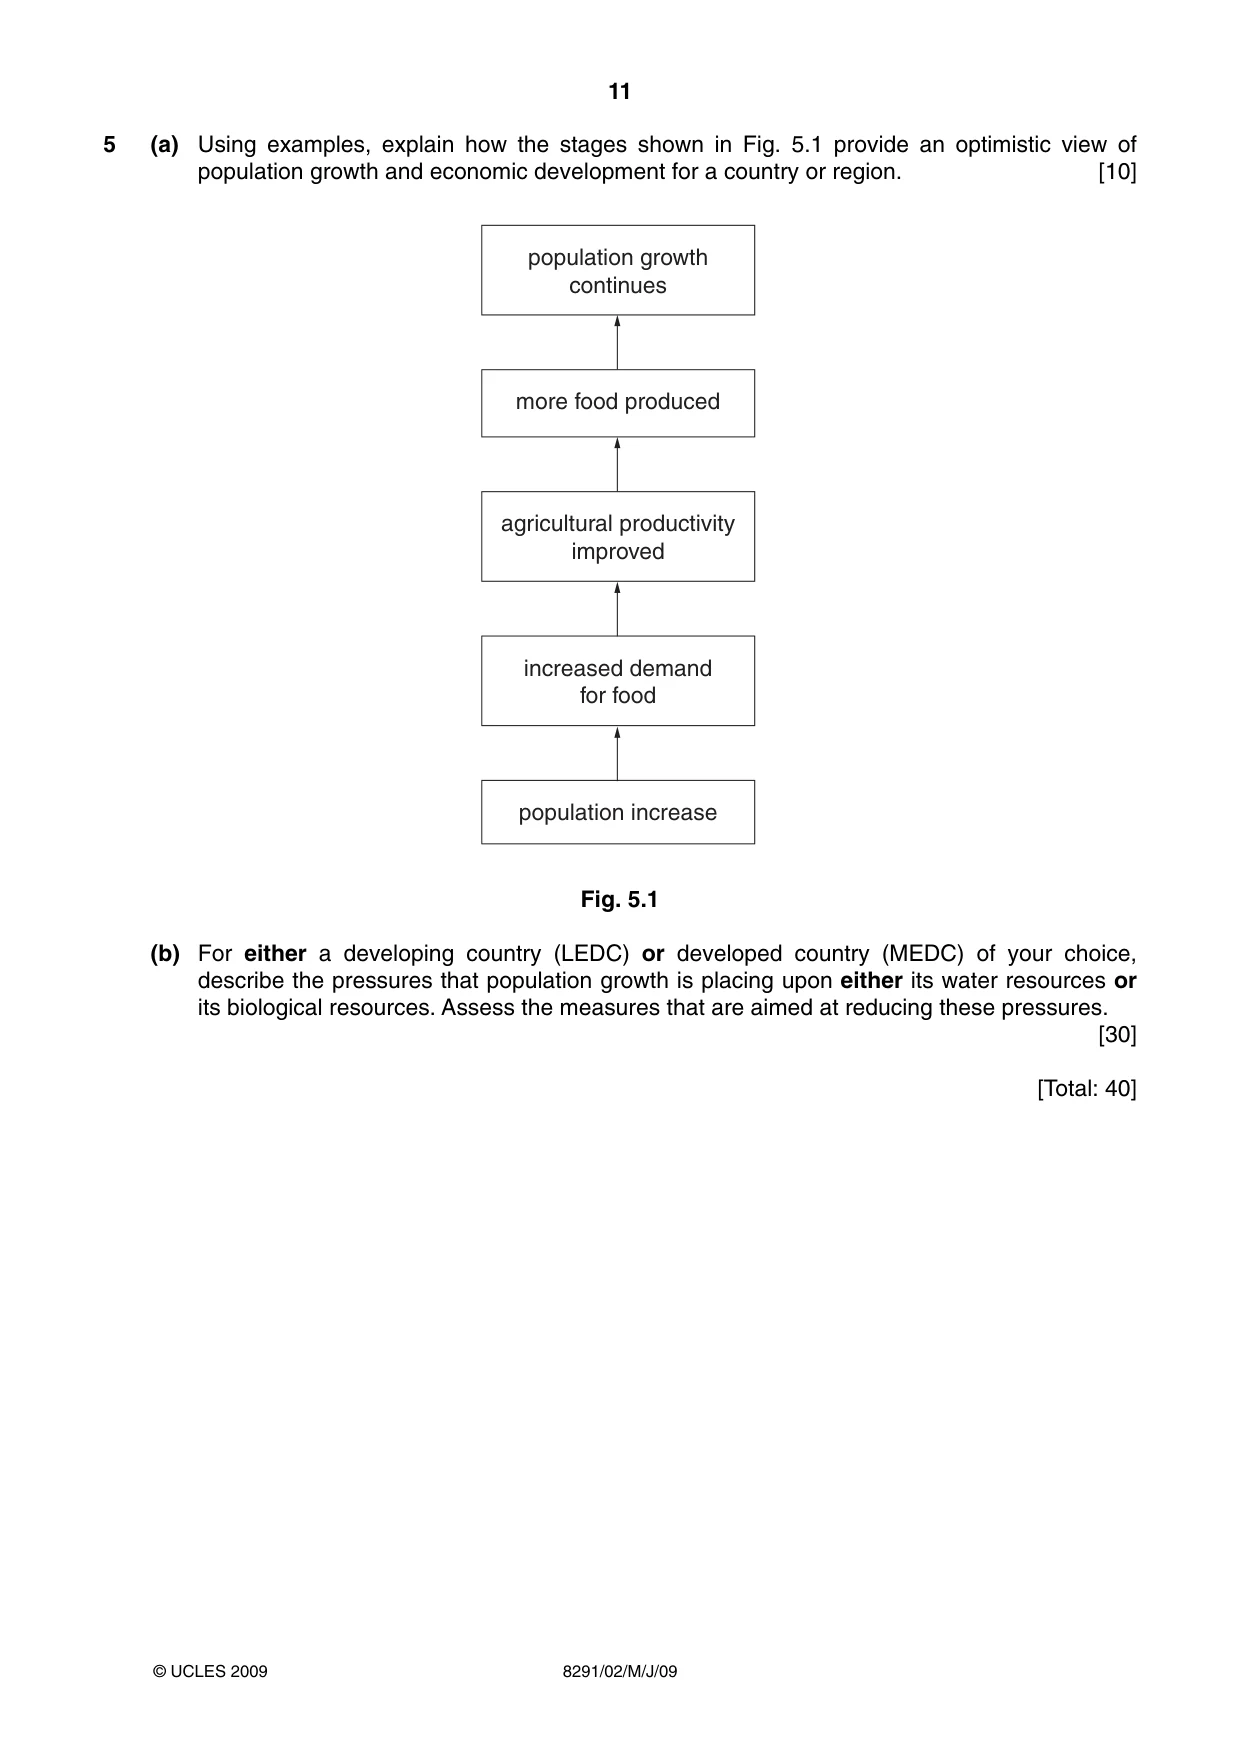
11 8291/02/M/J/09 © UCLES 2009 5 (a) Using examples, explain how the stages shown in Fig. 5.1 provide an optimistic view of population growth and economic development for a country or region. [10] population growth continues more food produced agricultural productivity improved increased demand for food population increase Fig. 5.1 (b) For either a developing country (LEDC) or developed country (MEDC) of your choice, describe the pressures that population growth is placing upon either its water resources or its biological resources. Assess the measures that are aimed at reducing these pressures. [30] [Total: 40]
Question paper, page 12
12 8291/02/M/J/09 BLANK PAGE Permission to reproduce items where third-party owned material protected by copyright is included has been sought and cleared where possible. Every reasonable effort has been made by the publisher (UCLES) to trace copyright holders, but if any items requiring clearance have unwittingly been included, the publisher will be pleased to make amends at the earliest possible opportunity. University of Cambridge International Examinations is part of the Cambridge Assessment Group. Cambridge Assessment is the brand name of University of Cambridge Local Examinations Syndicate (UCLES), which is itself a department of the University of Cambridge.
Mark scheme, page 1
UNIVERSITY OF CAMBRIDGE INTERNATIONAL EXAMINATIONS GCE Advanced Subsidiary Level MARK SCHEME for the May/June 2009 question paper for the guidance of teachers 8291 ENVIRONMENTAL MANAGEMENT 8291/02 Paper 2, maximum raw mark 80 This mark scheme is published as an aid to teachers and candidates, to indicate the requirements of the examination. It shows the basis on which Examiners were instructed to award marks. It does not indicate the details of the discussions that took place at an Examiners’ meeting before marking began, which would have considered the acceptability of alternative answers. Mark schemes must be read in conjunction with the question papers and the report on the examination. • CIE will not enter into discussions or correspondence in connection with these mark schemes. CIE is publishing the mark schemes for the May/June 2009 question papers for most IGCSE, GCE Advanced Level and Advanced Subsidiary Level syllabuses and some Ordinary Level syllabuses.
Mark scheme, page 2
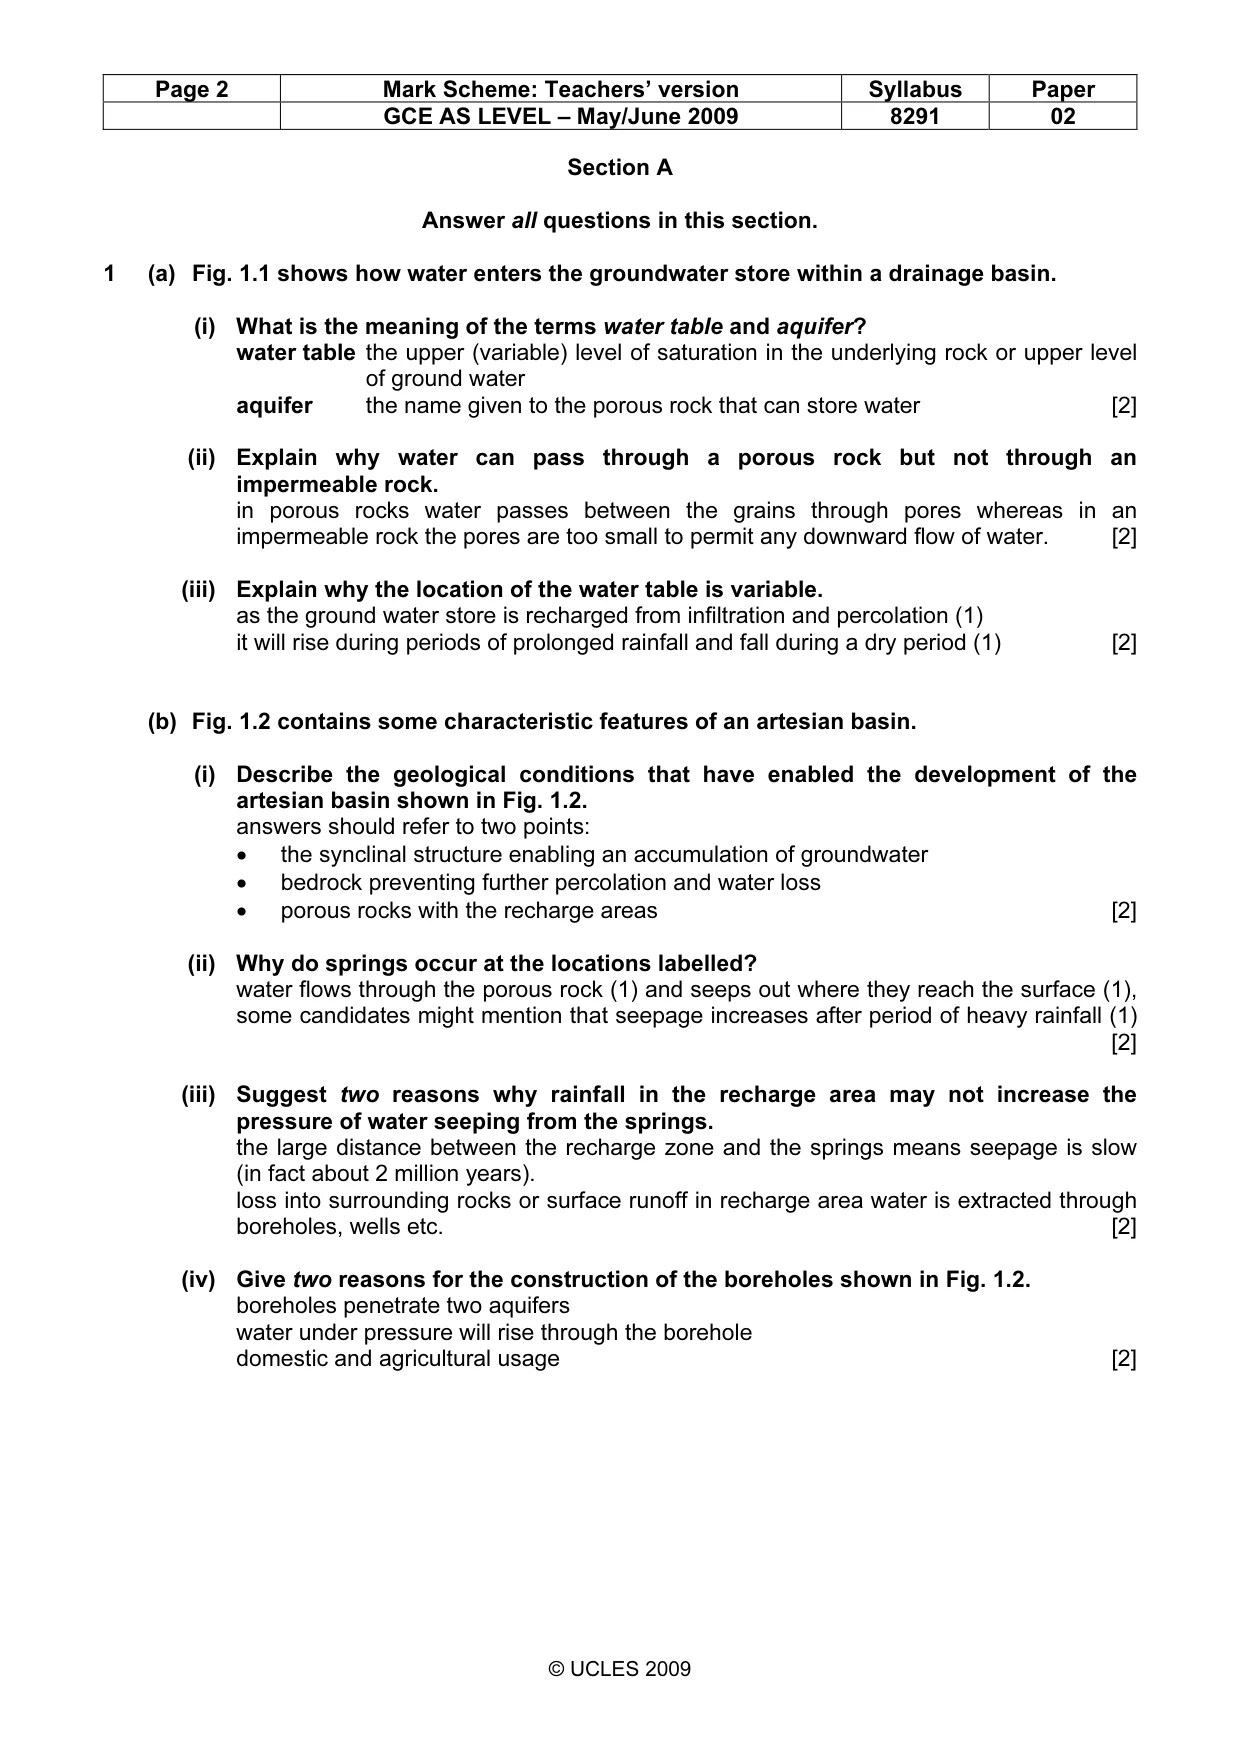
Page 2 Mark Scheme: Teachers’ version Syllabus Paper GCE AS LEVEL – May/June 2009 8291 02 © UCLES 2009 Section A Answer all questions in this section. 1 (a) Fig. 1.1 shows how water enters the groundwater store within a drainage basin. (i) What is the meaning of the terms water table and aquifer? water table the upper (variable) level of saturation in the underlying rock or upper level of ground water aquifer the name given to the porous rock that can store water [2] (ii) Explain why water can pass through a porous rock but not through an impermeable rock. in porous rocks water passes between the grains through pores whereas in an impermeable rock the pores are too small to permit any downward flow of water. [2] (iii) Explain why the location of the water table is variable. as the ground water store is recharged from infiltration and percolation (1) it will rise during periods of prolonged rainfall and fall during a dry period (1) [2] (b) Fig. 1.2 contains some characteristic features of an artesian basin. (i) Describe the geological conditions that have enabled the development of the artesian basin shown in Fig. 1.2. answers should refer to two points: • the synclinal structure enabling an accumulation of groundwater • bedrock preventing further percolation and water loss • porous rocks with the recharge areas [2] (ii) Why do springs occur at the locations labelled? water flows through the porous rock (1) and seeps out where they reach the surface (1), some candidates might mention that seepage increases after period of heavy rainfall (1) [2] (iii) Suggest two reasons why rainfall in the recharge area may not increase the pressure of water seeping from the springs. the large distance between the recharge zone and the springs means seepage is slow (in fact about 2 million years). loss into surrounding rocks or surface runoff in recharge area water is extracted through boreholes, wells etc. [2] (iv) Give two reasons for the construction of the boreholes shown in Fig. 1.2. boreholes penetrate two aquifers water under pressure will rise through the borehole domestic and agricultural usage [2]
Mark scheme, page 3
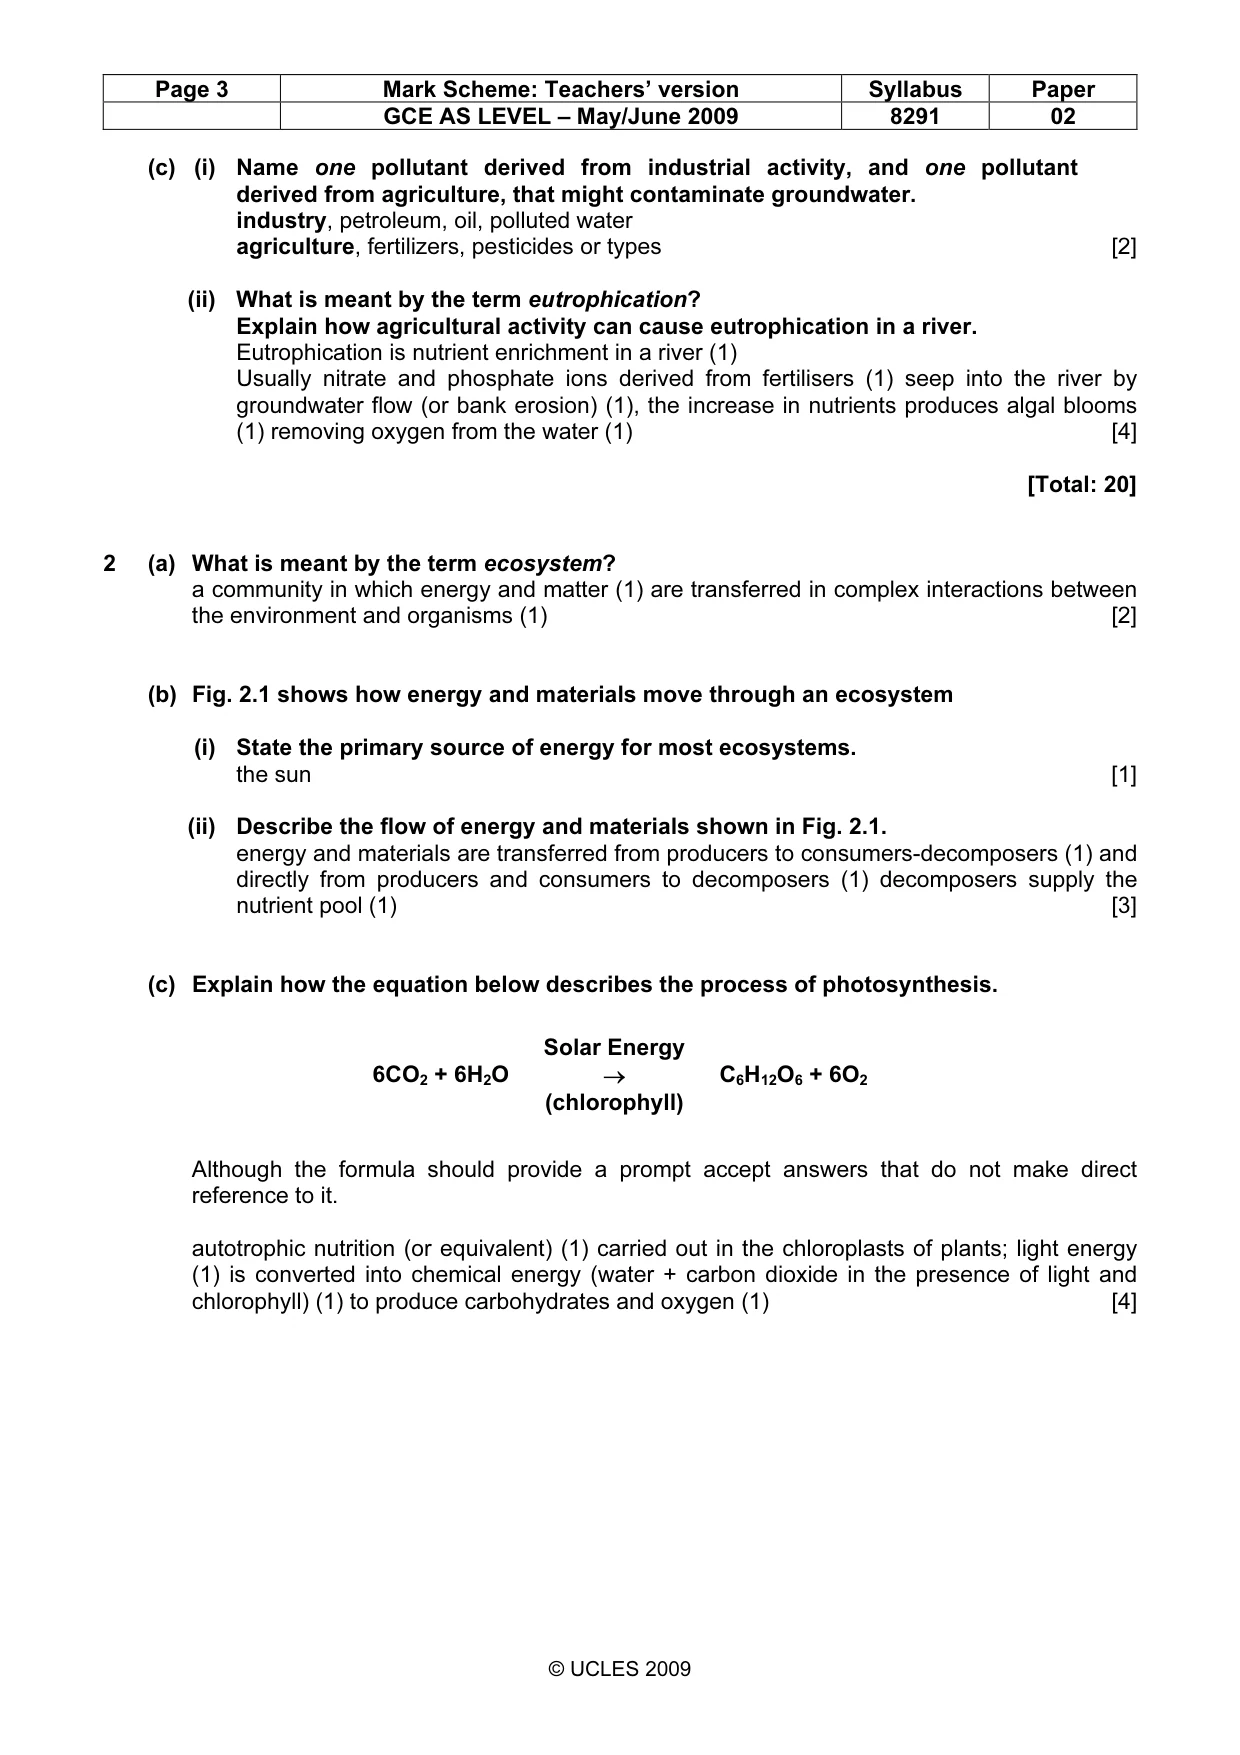
Page 3 Mark Scheme: Teachers’ version Syllabus Paper GCE AS LEVEL – May/June 2009 8291 02 © UCLES 2009 (c) (i) Name one pollutant derived from industrial activity, and one pollutant derived from agriculture, that might contaminate groundwater. industry, petroleum, oil, polluted water agriculture, fertilizers, pesticides or types [2] (ii) What is meant by the term eutrophication? Explain how agricultural activity can cause eutrophication in a river. Eutrophication is nutrient enrichment in a river (1) Usually nitrate and phosphate ions derived from fertilisers (1) seep into the river by groundwater flow (or bank erosion) (1), the increase in nutrients produces algal blooms (1) removing oxygen from the water (1) [4] [Total: 20] 2 (a) What is meant by the term ecosystem? a community in which energy and matter (1) are transferred in complex interactions between the environment and organisms (1) [2] (b) Fig. 2.1 shows how energy and materials move through an ecosystem (i) State the primary source of energy for most ecosystems. the sun [1] (ii) Describe the flow of energy and materials shown in Fig. 2.1. energy and materials are transferred from producers to consumers-decomposers (1) and directly from producers and consumers to decomposers (1) decomposers supply the nutrient pool (1) [3] (c) Explain how the equation below describes the process of photosynthesis. Although the formula should provide a prompt accept answers that do not make direct reference to it. autotrophic nutrition (or equivalent) (1) carried out in the chloroplasts of plants; light energy (1) is converted into chemical energy (water + carbon dioxide in the presence of light and chlorophyll) (1) to produce carbohydrates and oxygen (1) [4] 6CO2 + 6H2O Solar Energy → (chlorophyll) C6H12O6 + 6O2
Mark scheme, page 4
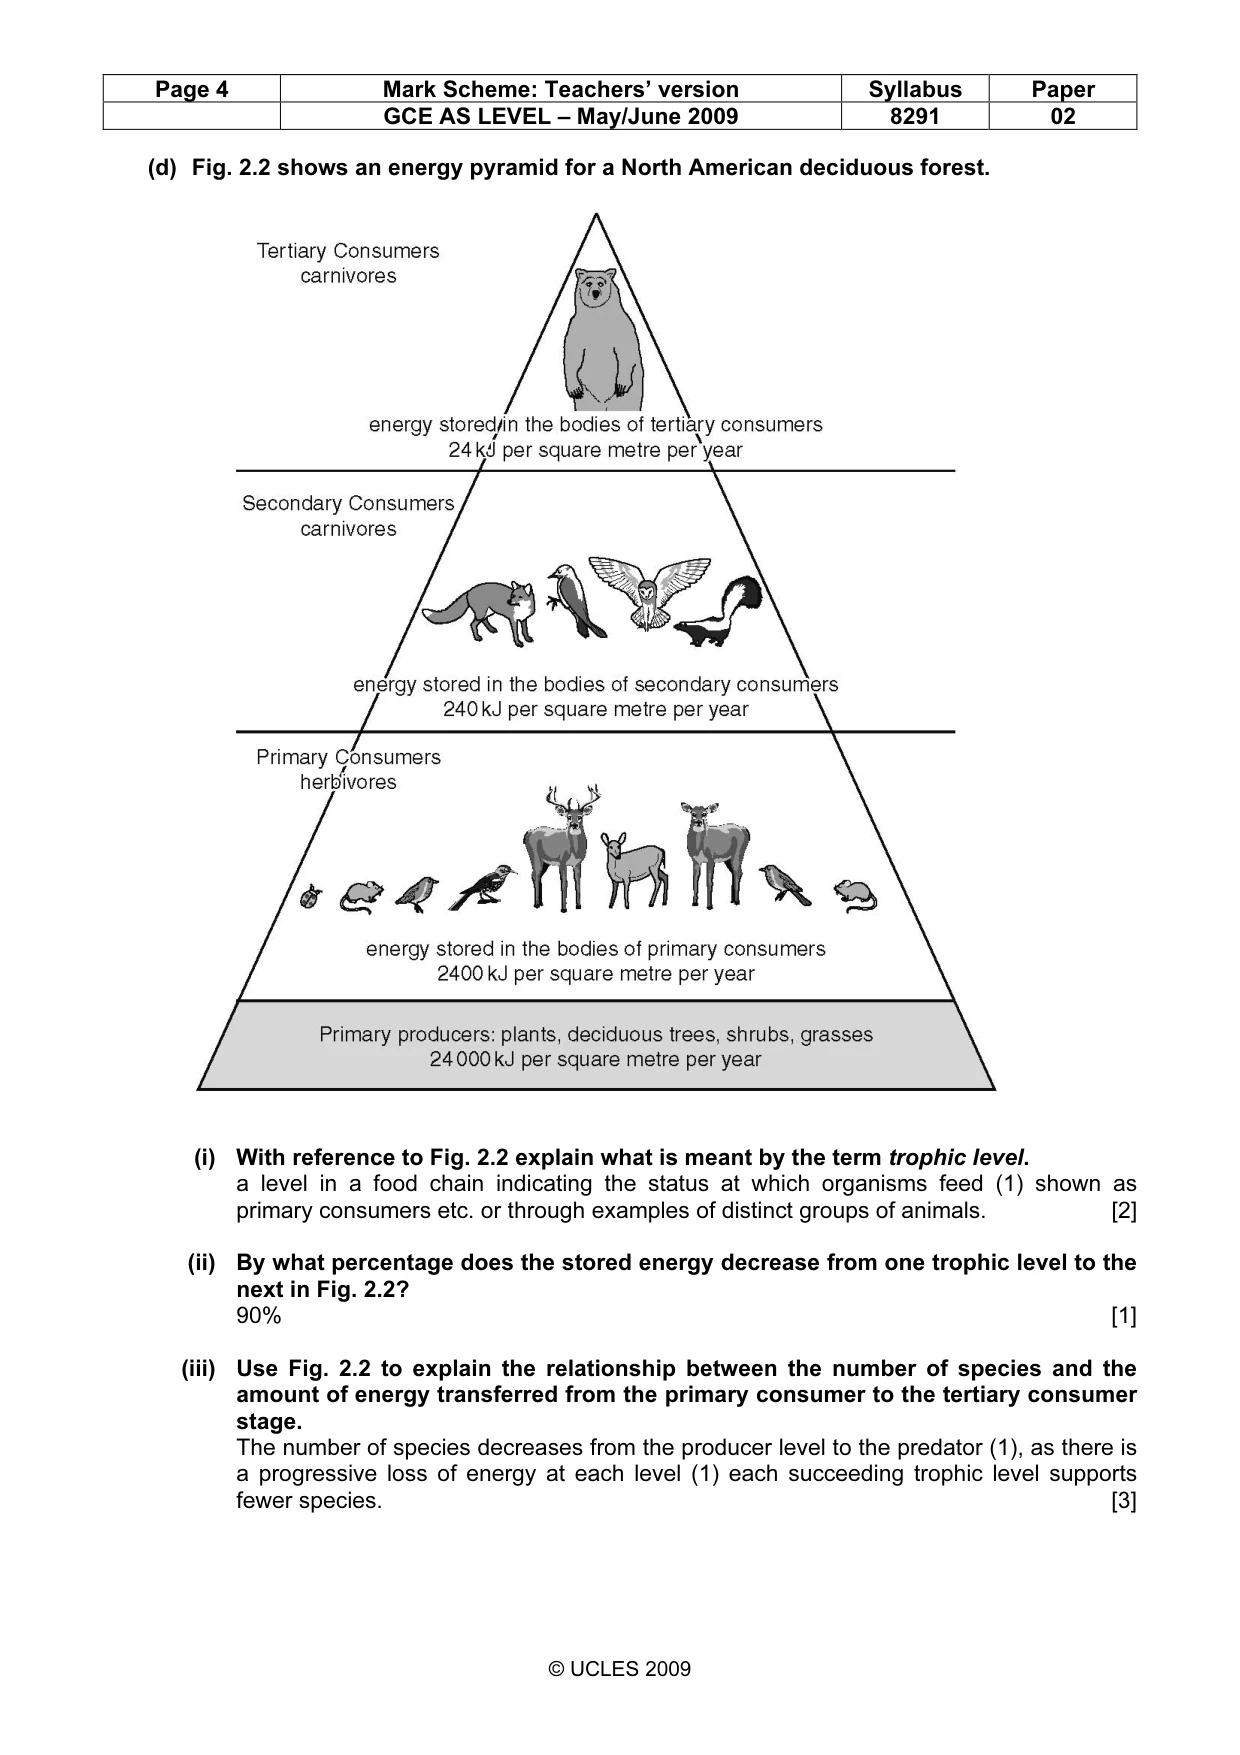
Page 4 Mark Scheme: Teachers’ version Syllabus Paper GCE AS LEVEL – May/June 2009 8291 02 © UCLES 2009 (d) Fig. 2.2 shows an energy pyramid for a North American deciduous forest. (i) With reference to Fig. 2.2 explain what is meant by the term trophic level. a level in a food chain indicating the status at which organisms feed (1) shown as primary consumers etc. or through examples of distinct groups of animals. [2] (ii) By what percentage does the stored energy decrease from one trophic level to the next in Fig. 2.2? 90% [1] (iii) Use Fig. 2.2 to explain the relationship between the number of species and the amount of energy transferred from the primary consumer to the tertiary consumer stage. The number of species decreases from the producer level to the predator (1), as there is a progressive loss of energy at each level (1) each succeeding trophic level supports fewer species. [3]
Mark scheme, page 5
Page 5 Mark Scheme: Teachers’ version Syllabus Paper GCE AS LEVEL – May/June 2009 8291 02 © UCLES 2009 (iv) Describe and explain the effect that a warming and drying of the North American deciduous forest region might have upon the energy pyramid shown in Fig. 2.2. Credit simple statements with one mark or two marks for a developed point. Effects can occur at each level with different impacts. The example given illustrates the bottom to top approach. Warming and drying may reduce and alter the producer level (1) thereby removing/modifying habitats for birds, deer etc. (1), causing migration or death (1) as a result secondary and tertiary consumers lose their sources of food and reduce in numbers (1). [4] [Total: 20]
Mark scheme, page 6
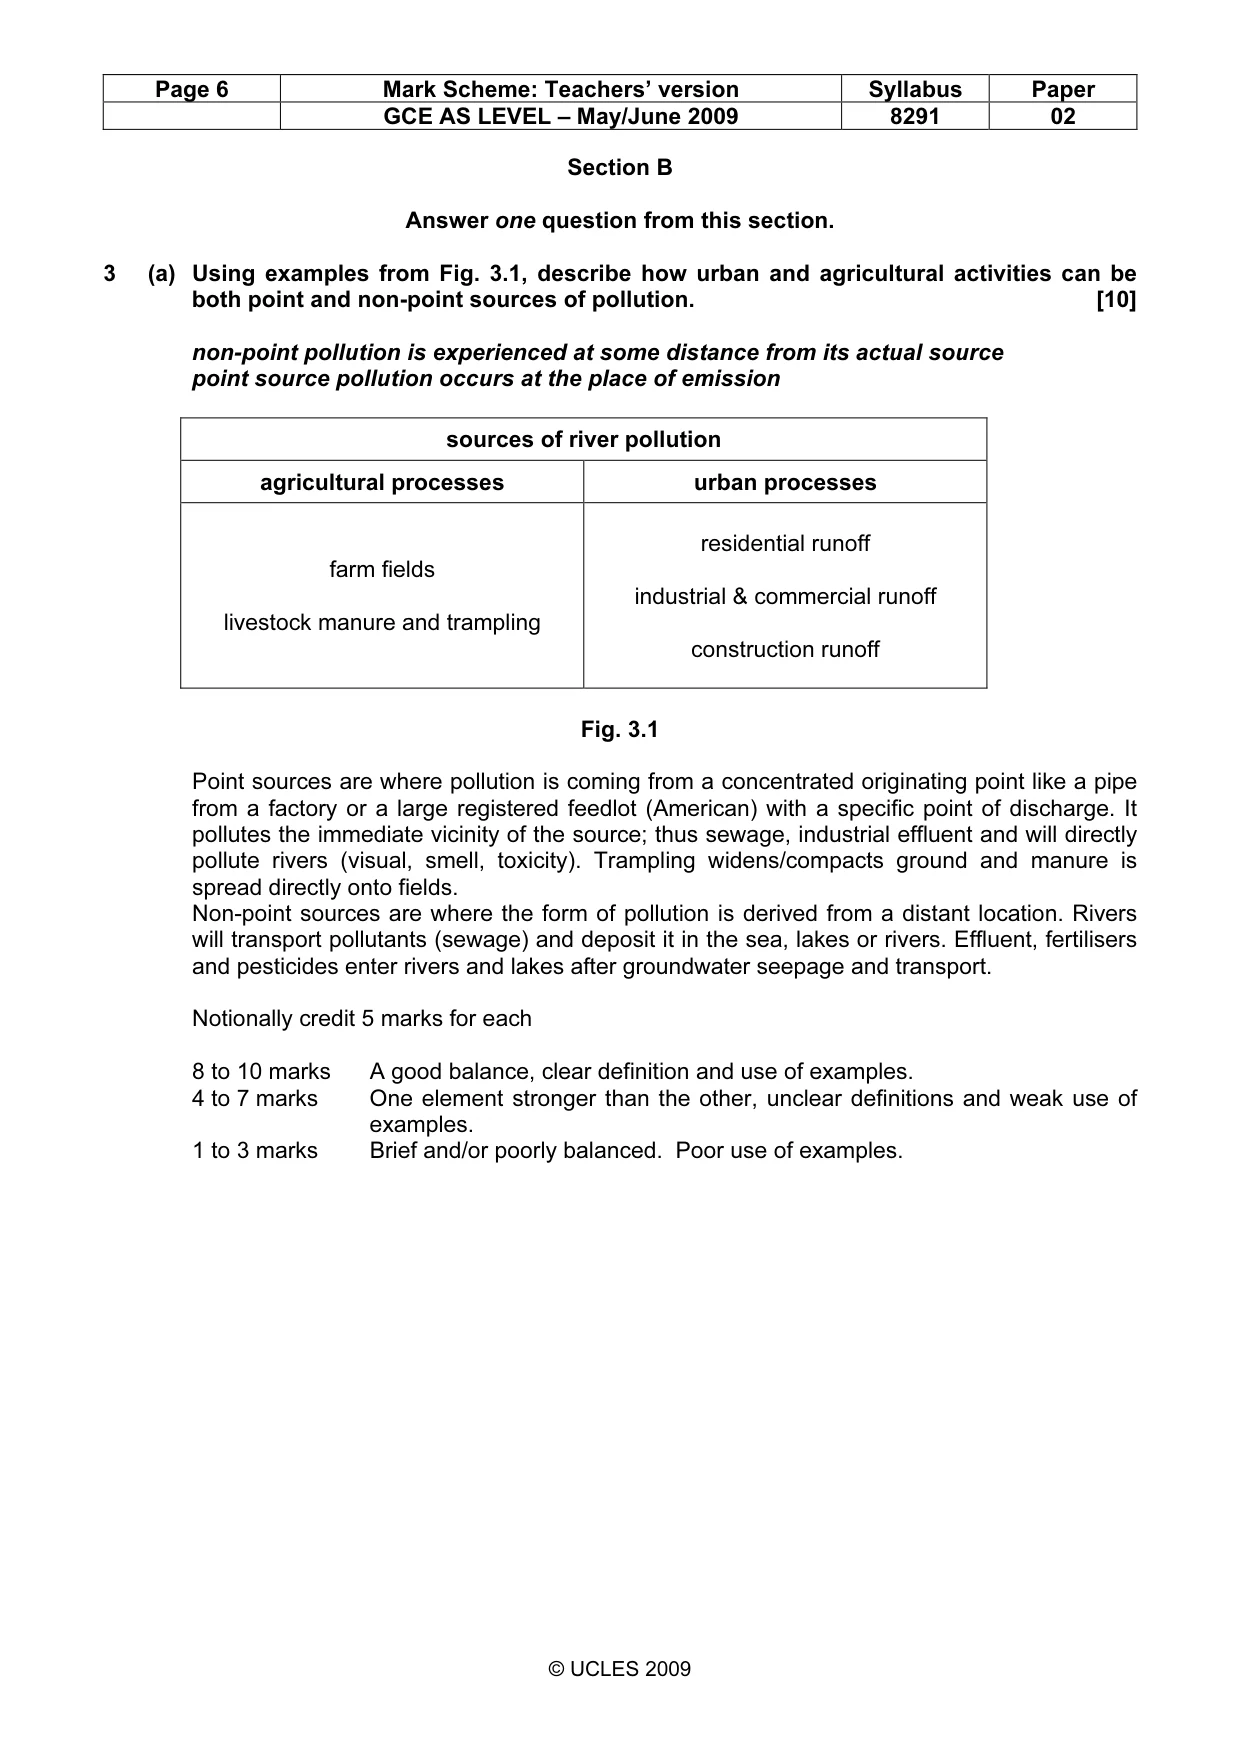
Page 6 Mark Scheme: Teachers’ version Syllabus Paper GCE AS LEVEL – May/June 2009 8291 02 © UCLES 2009 Section B Answer one question from this section. 3 (a) Using examples from Fig. 3.1, describe how urban and agricultural activities can be both point and non-point sources of pollution. [10] non-point pollution is experienced at some distance from its actual source point source pollution occurs at the place of emission sources of river pollution agricultural processes urban processes farm fields livestock manure and trampling residential runoff industrial & commercial runoff construction runoff Fig. 3.1 Point sources are where pollution is coming from a concentrated originating point like a pipe from a factory or a large registered feedlot (American) with a specific point of discharge. It pollutes the immediate vicinity of the source; thus sewage, industrial effluent and will directly pollute rivers (visual, smell, toxicity). Trampling widens/compacts ground and manure is spread directly onto fields. Non-point sources are where the form of pollution is derived from a distant location. Rivers will transport pollutants (sewage) and deposit it in the sea, lakes or rivers. Effluent, fertilisers and pesticides enter rivers and lakes after groundwater seepage and transport. Notionally credit 5 marks for each 8 to 10 marks A good balance, clear definition and use of examples. 4 to 7 marks One element stronger than the other, unclear definitions and weak use of examples. 1 to 3 marks Brief and/or poorly balanced. Poor use of examples.
Mark scheme, page 7
Page 7 Mark Scheme: Teachers’ version Syllabus Paper GCE AS LEVEL – May/June 2009 8291 02 © UCLES 2009 (b) "Managing our water better has great benefits for wildlife, for fish and for jobs – we can no longer afford to misuse such a priceless resource." With reference to examples with which you are familiar, describe and assess the success of measures that aim to reduce river pollution. [30] The choice of the example is up to the candidate. The initial statement is a prompt which should provide candidates with some direction. Managing river pollution involves a number of stages to be successful. Levels of pollution need to be determined which might include measurements of visual pollution, BOD, biodiversity and species population. The sources of pollution need to be identified; point or non-point; continuous or accident. Management is directed towards both the point source and the non-point source. Point sources can be managed by legislation on the quality and volume of outflow and non-point by cleaning, location/length of pipelines, toxic waste legislation, street cleaning, controlling runoff, equipment maintenance, organic methods of pest control etc. Other measures include: public education, recycling. Evaluations should point to levels of success/failure with reasons. Band 1 answers should consider the management strategies outlined above and through the example make clear assessments of cause, management and level of success. (25–33) Band 3 answers, although relevant, may focus on one or two elements of management, exhibit a weak development of the case study and make generalised assessments. (13–18) Band 4 answers should contain general reference to the pollution issues of a chosen example but be brief and unclear about management policies. (6–12) [Total: 40]
Mark scheme, page 8
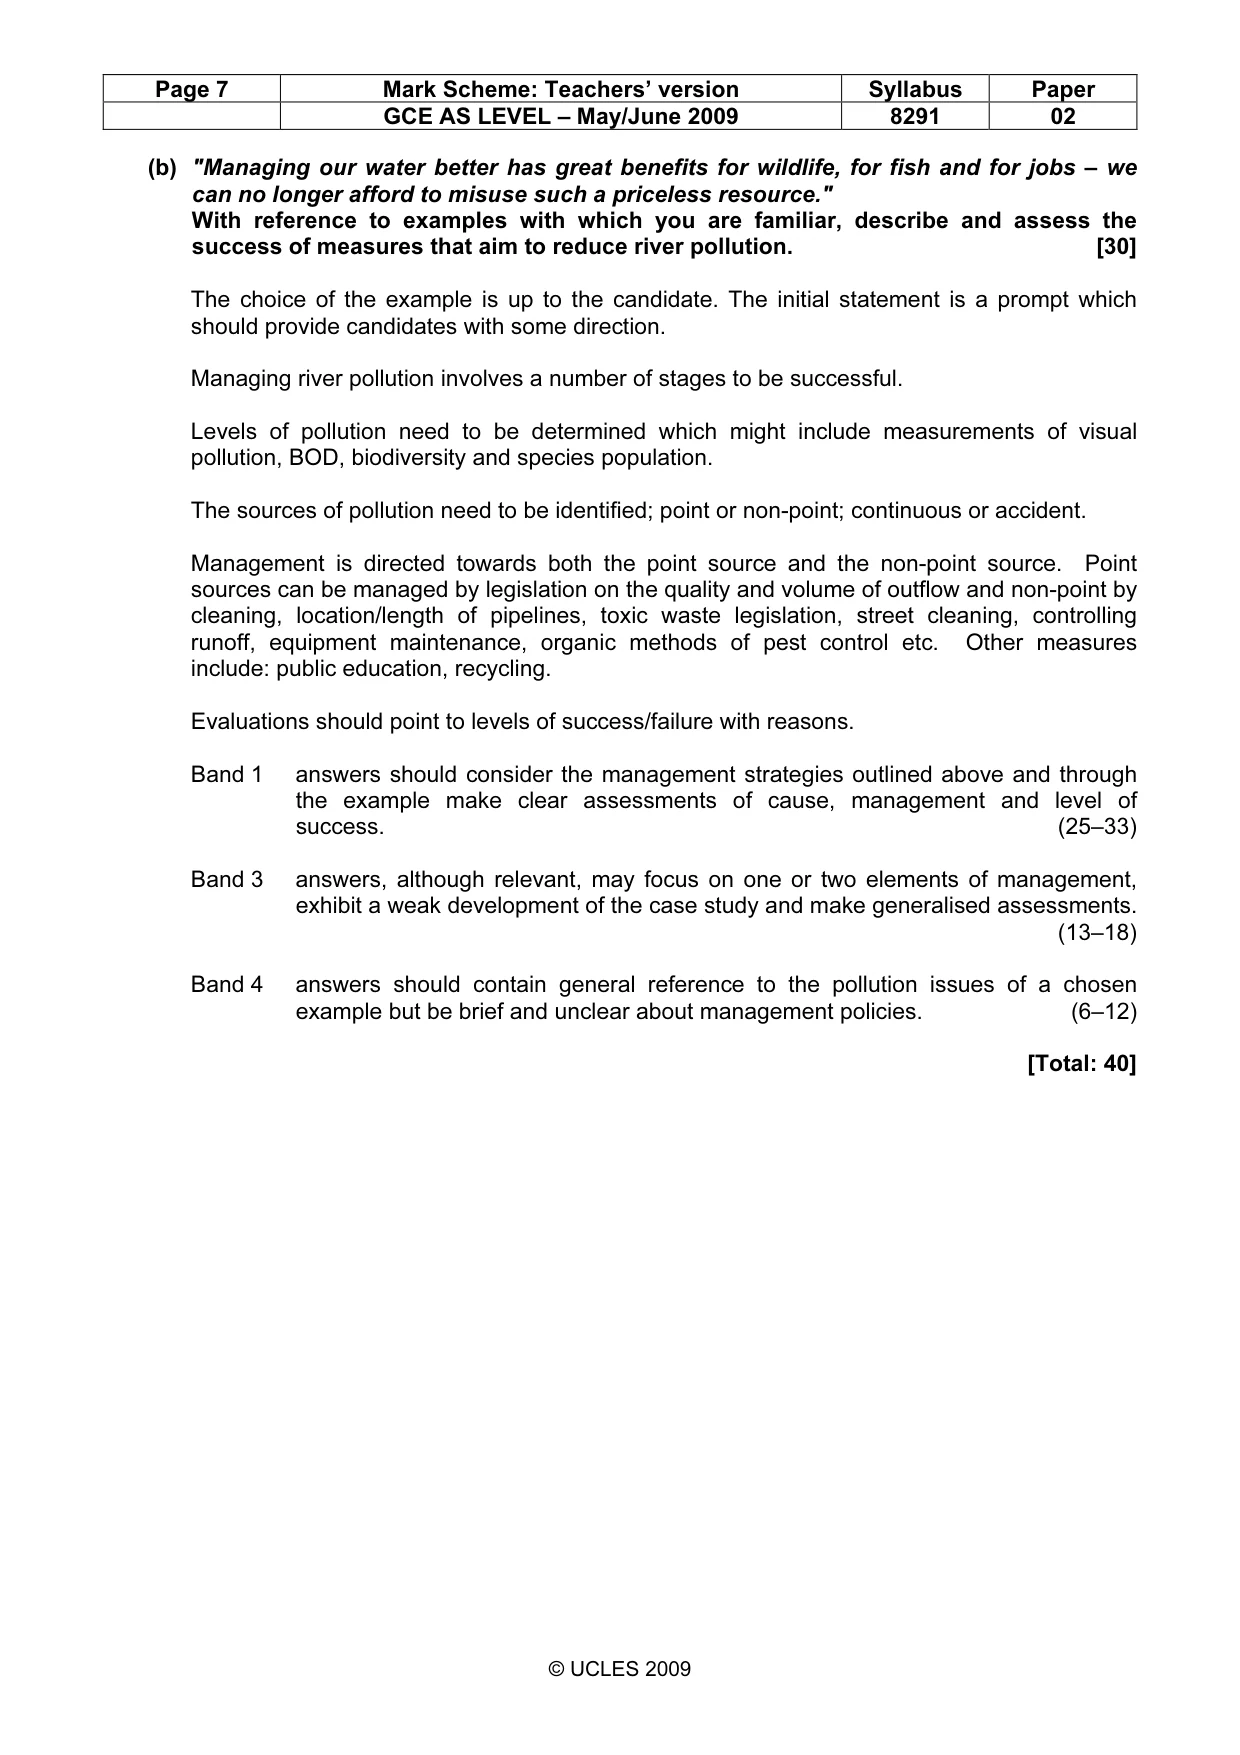
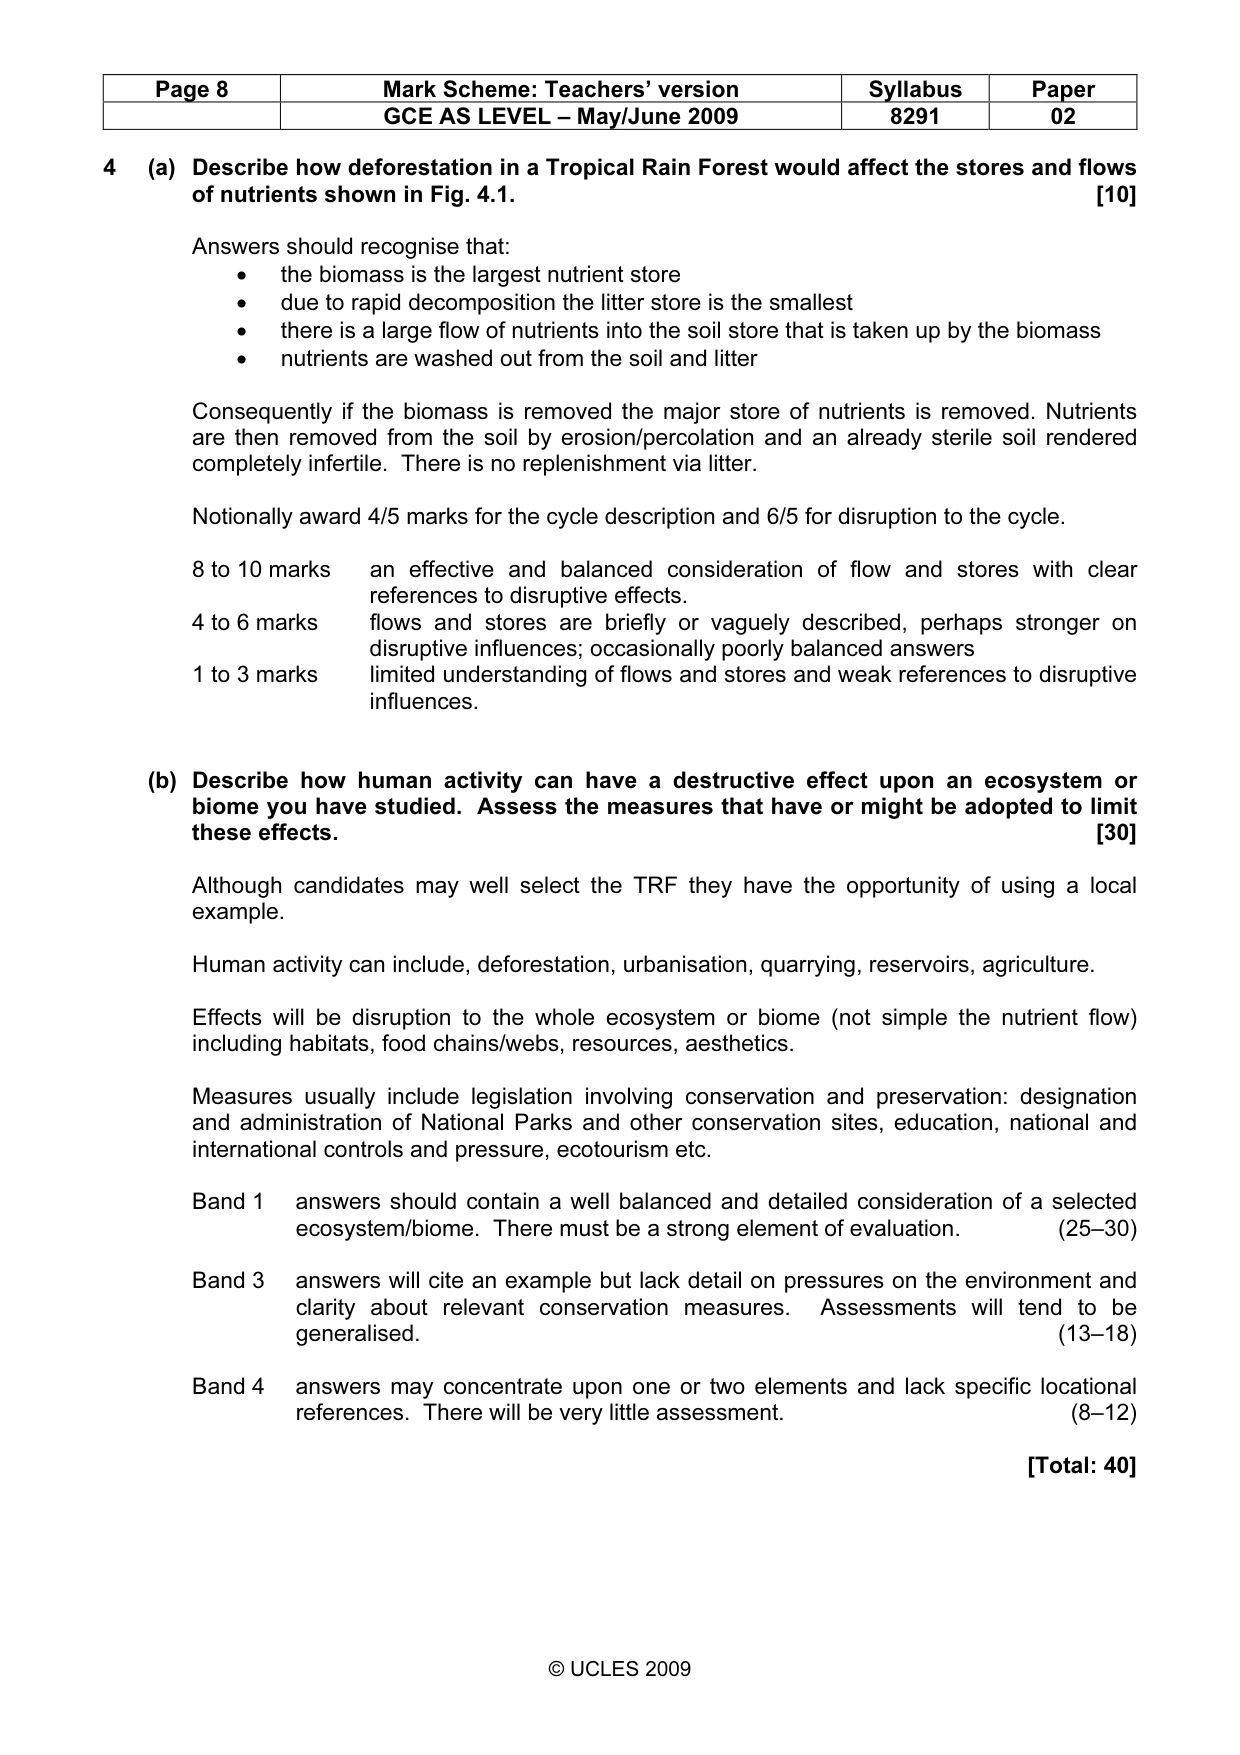
Page 8 Mark Scheme: Teachers’ version Syllabus Paper GCE AS LEVEL – May/June 2009 8291 02 © UCLES 2009 4 (a) Describe how deforestation in a Tropical Rain Forest would affect the stores and flows of nutrients shown in Fig. 4.1. [10] Answers should recognise that: • the biomass is the largest nutrient store • due to rapid decomposition the litter store is the smallest • there is a large flow of nutrients into the soil store that is taken up by the biomass • nutrients are washed out from the soil and litter Consequently if the biomass is removed the major store of nutrients is removed. Nutrients are then removed from the soil by erosion/percolation and an already sterile soil rendered completely infertile. There is no replenishment via litter. Notionally award 4/5 marks for the cycle description and 6/5 for disruption to the cycle. 8 to 10 marks an effective and balanced consideration of flow and stores with clear references to disruptive effects. 4 to 6 marks flows and stores are briefly or vaguely described, perhaps stronger on disruptive influences; occasionally poorly balanced answers 1 to 3 marks limited understanding of flows and stores and weak references to disruptive influences. (b) Describe how human activity can have a destructive effect upon an ecosystem or biome you have studied. Assess the measures that have or might be adopted to limit these effects. [30] Although candidates may well select the TRF they have the opportunity of using a local example. Human activity can include, deforestation, urbanisation, quarrying, reservoirs, agriculture. Effects will be disruption to the whole ecosystem or biome (not simple the nutrient flow) including habitats, food chains/webs, resources, aesthetics. Measures usually include legislation involving conservation and preservation: designation and administration of National Parks and other conservation sites, education, national and international controls and pressure, ecotourism etc. Band 1 answers should contain a well balanced and detailed consideration of a selected ecosystem/biome. There must be a strong element of evaluation. (25–30) Band 3 answers will cite an example but lack detail on pressures on the environment and clarity about relevant conservation measures. Assessments will tend to be generalised. (13–18) Band 4 answers may concentrate upon one or two elements and lack specific locational references. There will be very little assessment. (8–12) [Total: 40]
Mark scheme, page 9
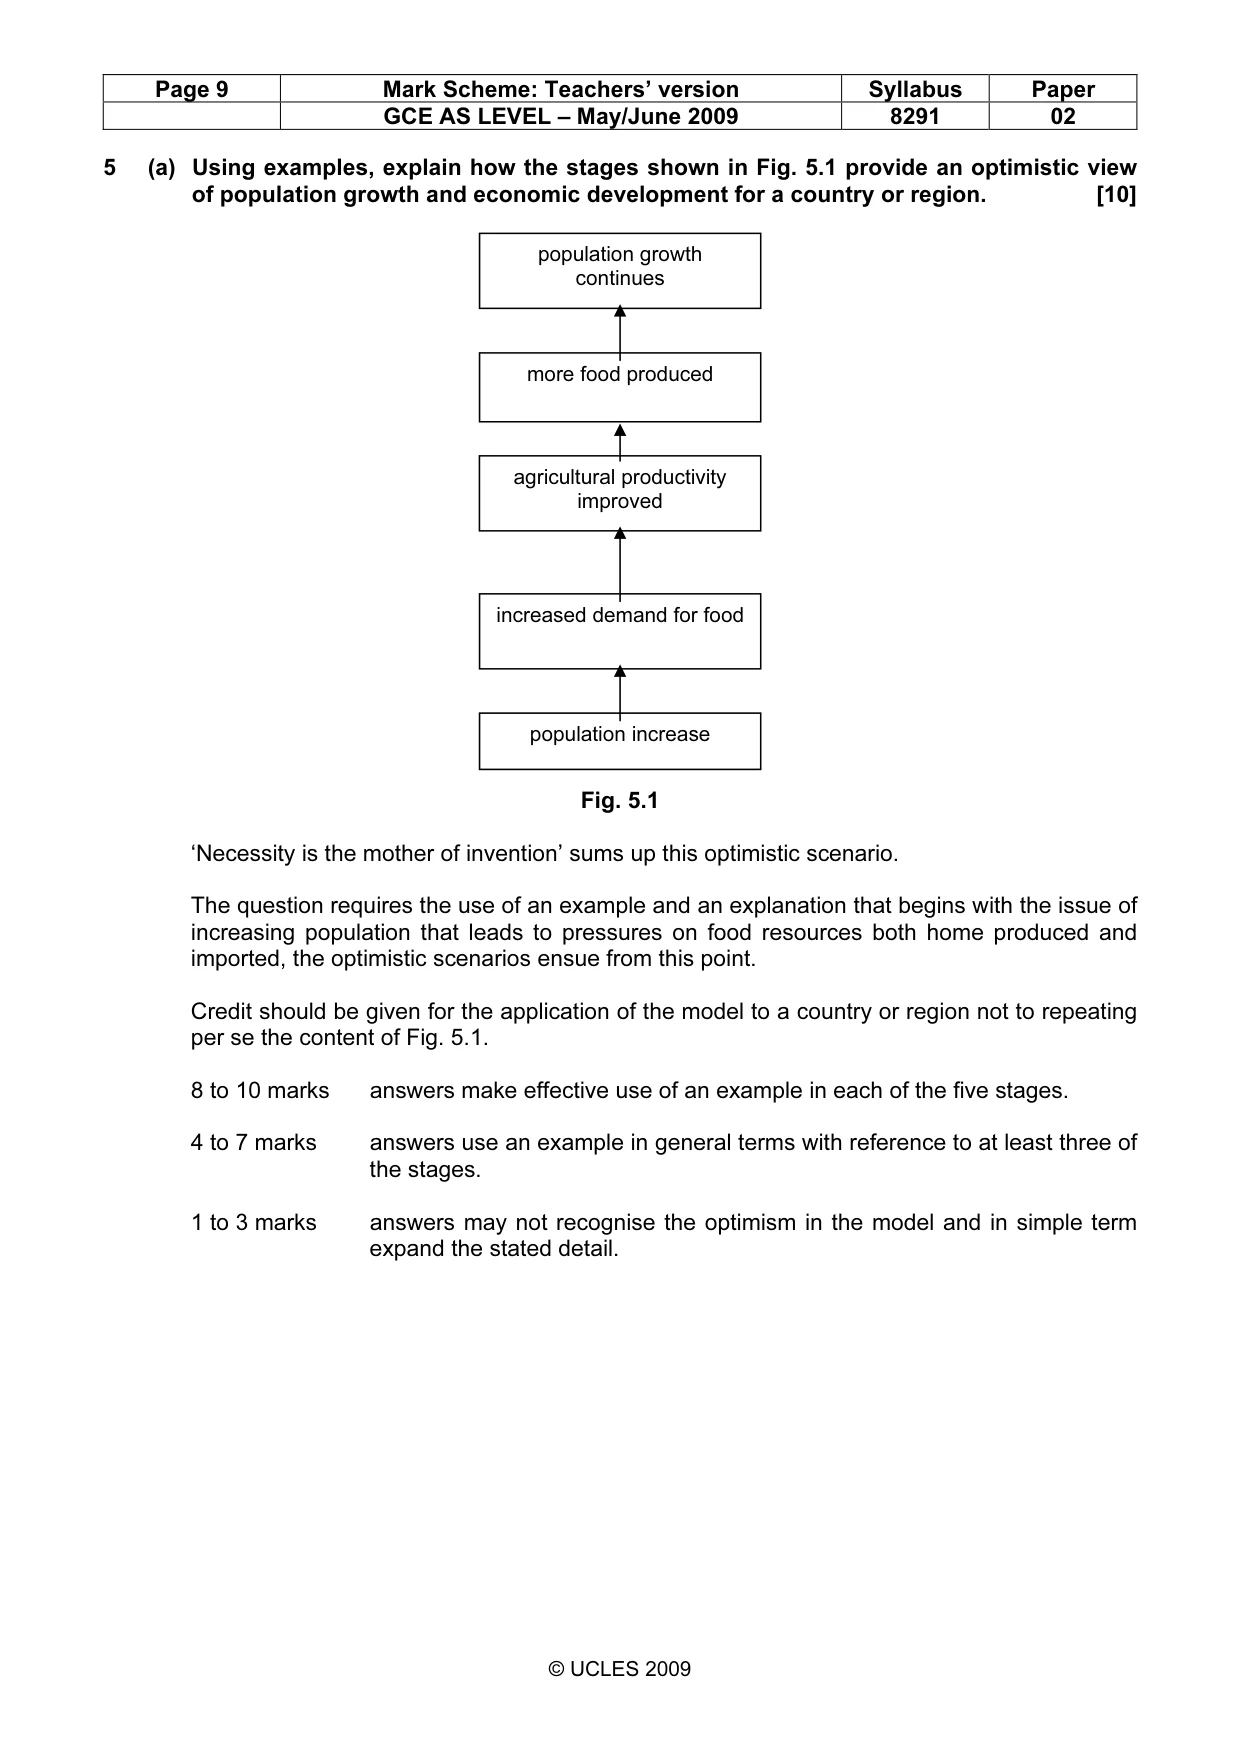
Page 9 Mark Scheme: Teachers’ version Syllabus Paper GCE AS LEVEL – May/June 2009 8291 02 © UCLES 2009 5 (a) Using examples, explain how the stages shown in Fig. 5.1 provide an optimistic view of population growth and economic development for a country or region. [10] Fig. 5.1 ‘Necessity is the mother of invention’ sums up this optimistic scenario. The question requires the use of an example and an explanation that begins with the issue of increasing population that leads to pressures on food resources both home produced and imported, the optimistic scenarios ensue from this point. Credit should be given for the application of the model to a country or region not to repeating per se the content of Fig. 5.1. 8 to 10 marks answers make effective use of an example in each of the five stages. 4 to 7 marks answers use an example in general terms with reference to at least three of the stages. 1 to 3 marks answers may not recognise the optimism in the model and in simple term expand the stated detail. population growth continues more food produced agricultural productivity improved increased demand for food population increase
Mark scheme, page 10
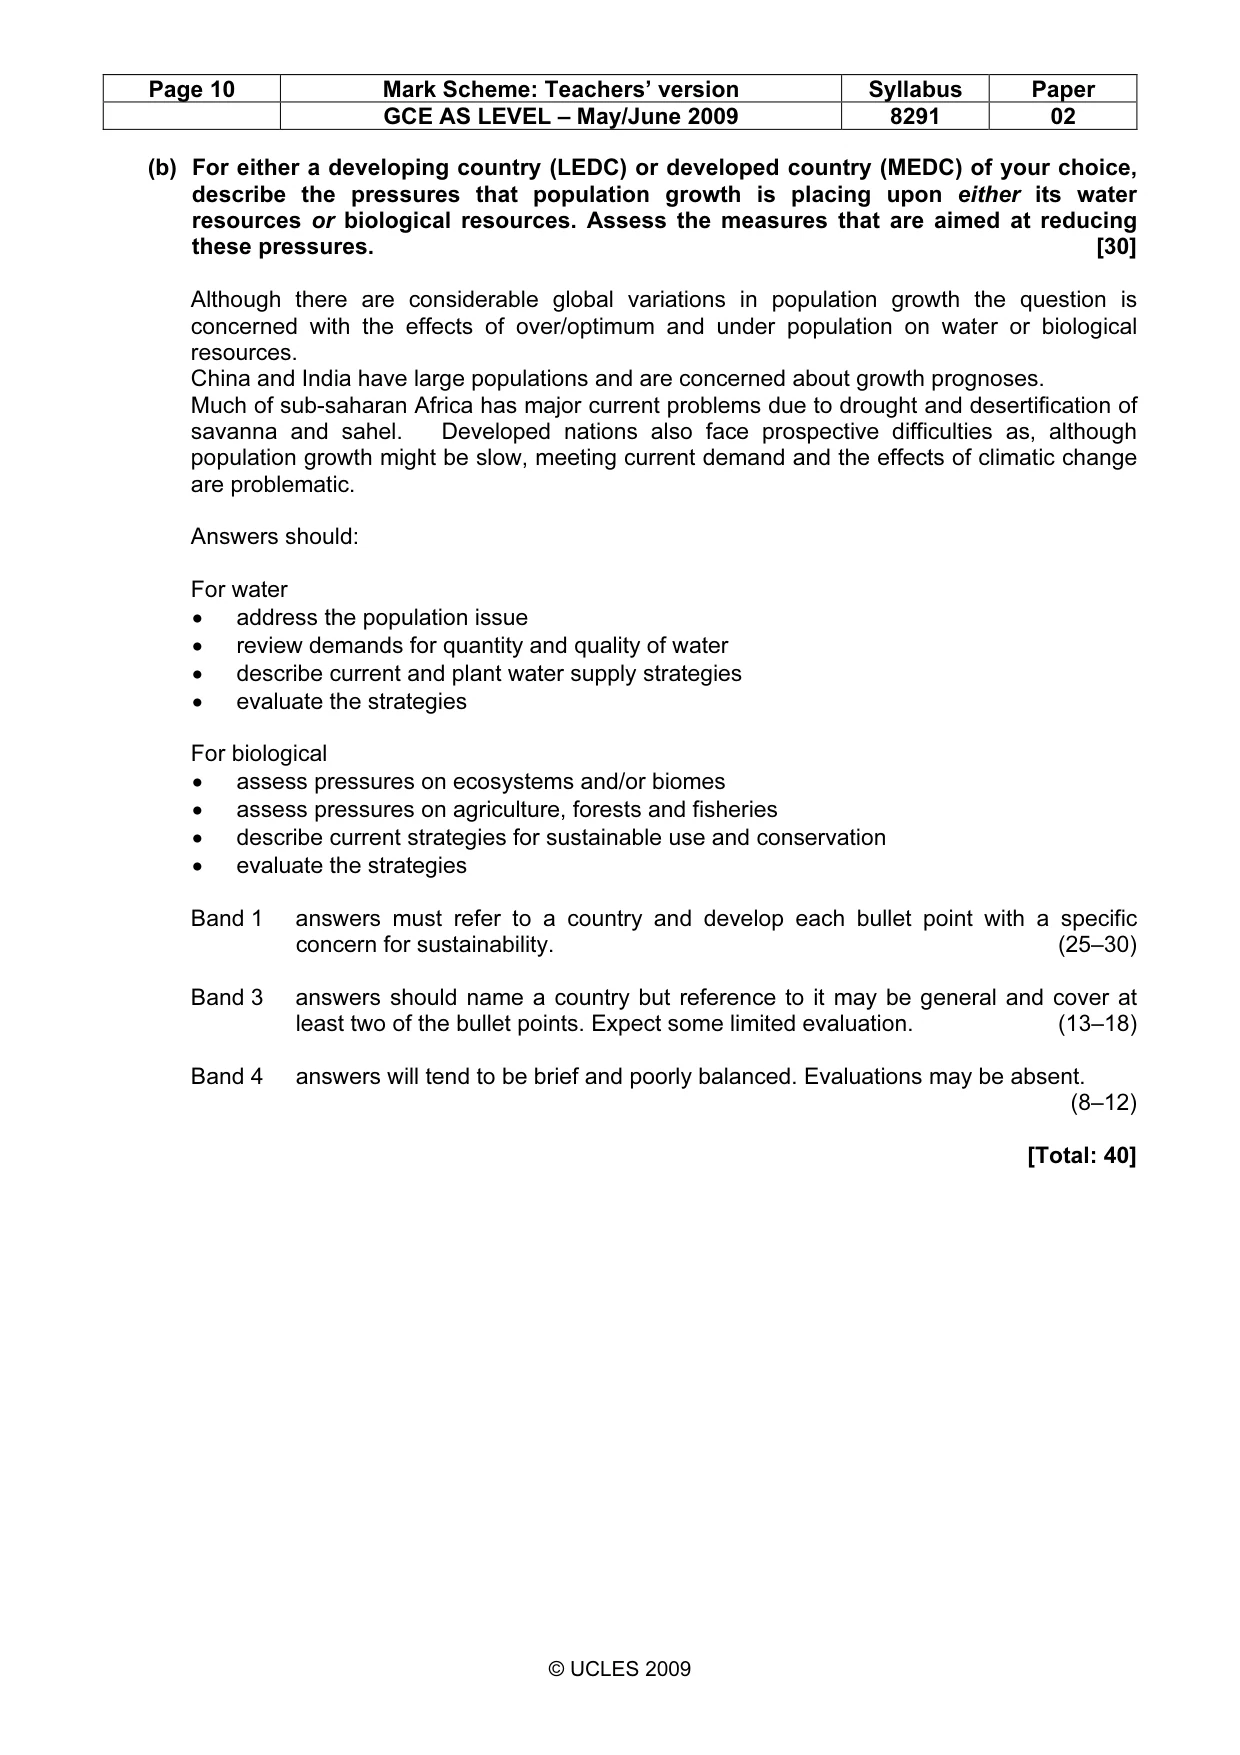
Page 10 Mark Scheme: Teachers’ version Syllabus Paper GCE AS LEVEL – May/June 2009 8291 02 © UCLES 2009 (b) For either a developing country (LEDC) or developed country (MEDC) of your choice, describe the pressures that population growth is placing upon either its water resources or biological resources. Assess the measures that are aimed at reducing these pressures. [30] Although there are considerable global variations in population growth the question is concerned with the effects of over/optimum and under population on water or biological resources. China and India have large populations and are concerned about growth prognoses. Much of sub-saharan Africa has major current problems due to drought and desertification of savanna and sahel. Developed nations also face prospective difficulties as, although population growth might be slow, meeting current demand and the effects of climatic change are problematic. Answers should: For water • address the population issue • review demands for quantity and quality of water • describe current and plant water supply strategies • evaluate the strategies For biological • assess pressures on ecosystems and/or biomes • assess pressures on agriculture, forests and fisheries • describe current strategies for sustainable use and conservation • evaluate the strategies Band 1 answers must refer to a country and develop each bullet point with a specific concern for sustainability. (25–30) Band 3 answers should name a country but reference to it may be general and cover at least two of the bullet points. Expect some limited evaluation. (13–18) Band 4 answers will tend to be brief and poorly balanced. Evaluations may be absent. (8–12) [Total: 40]
Mark scheme, page 11
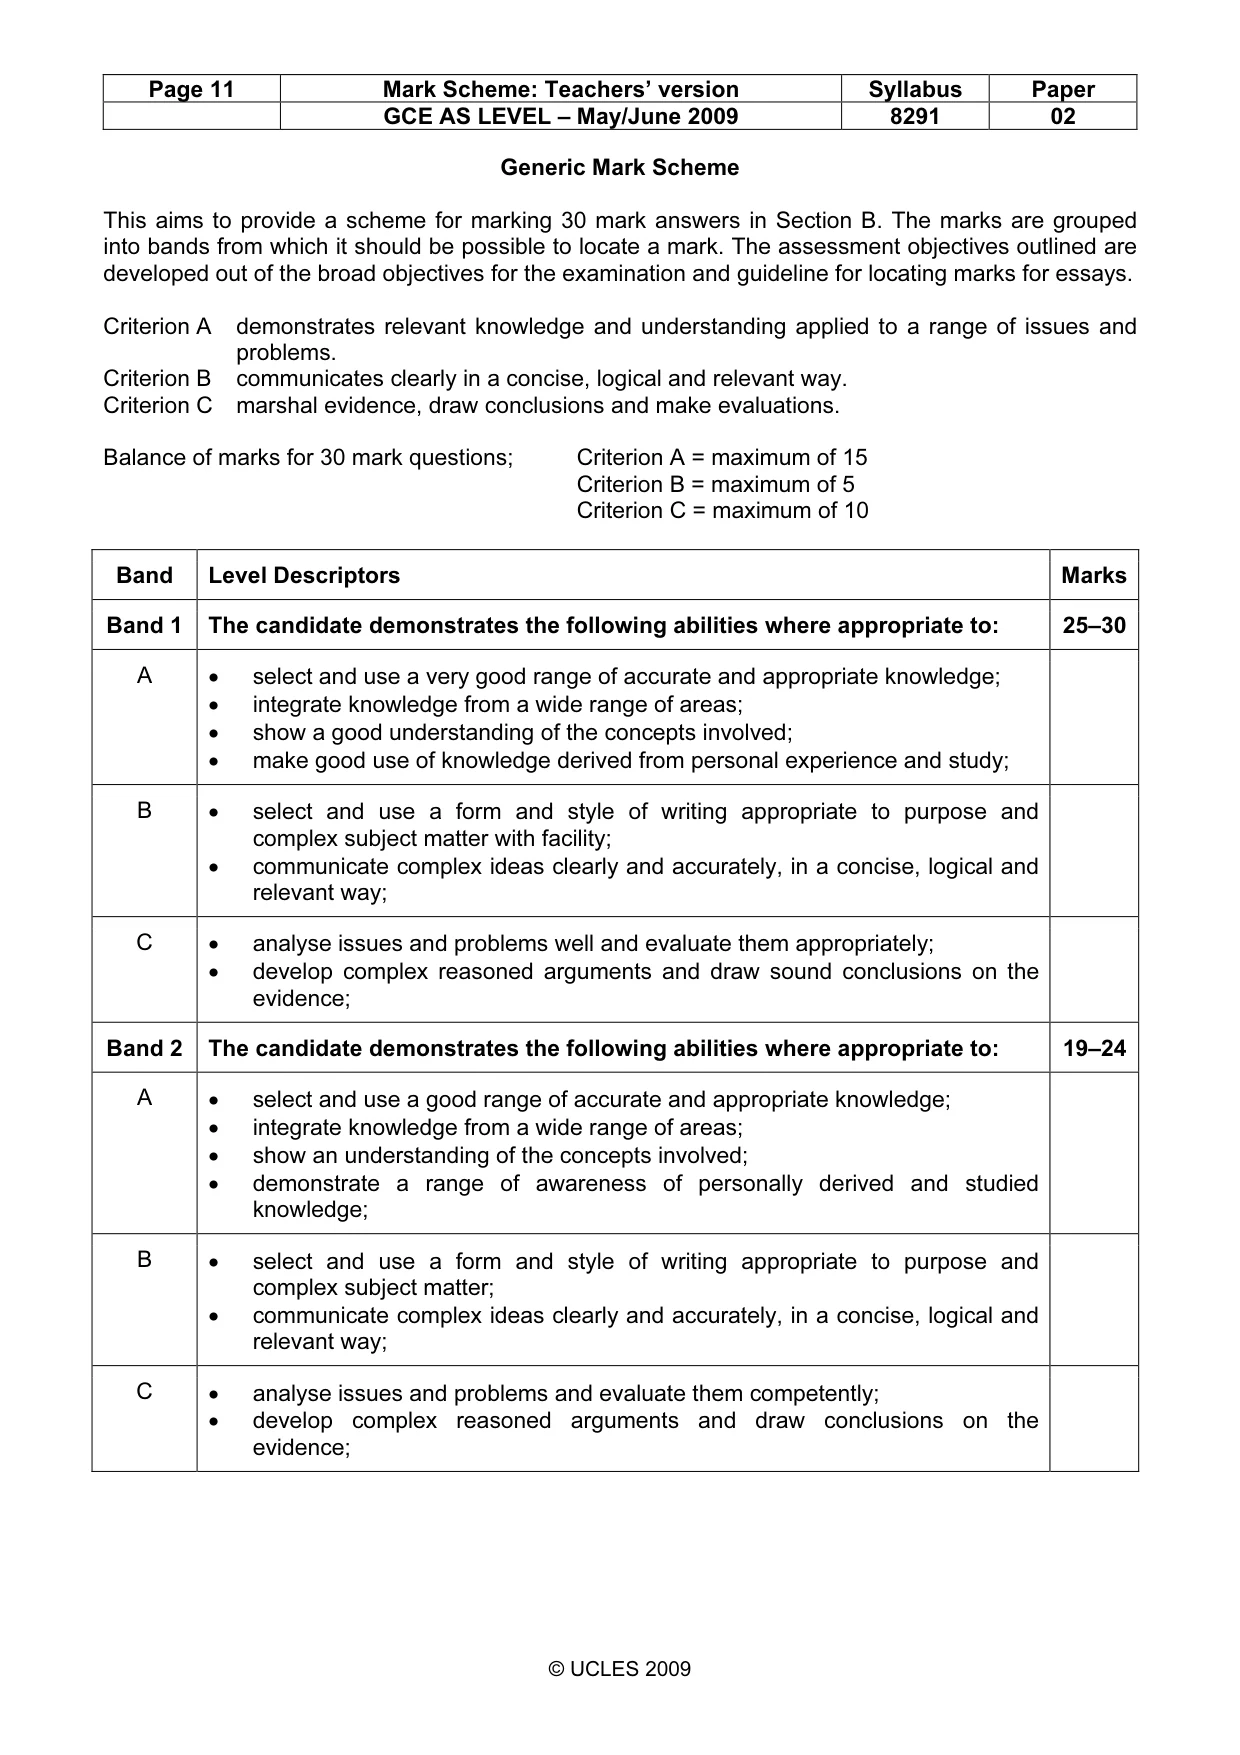
Page 11 Mark Scheme: Teachers’ version Syllabus Paper GCE AS LEVEL – May/June 2009 8291 02 © UCLES 2009 Generic Mark Scheme This aims to provide a scheme for marking 30 mark answers in Section B. The marks are grouped into bands from which it should be possible to locate a mark. The assessment objectives outlined are developed out of the broad objectives for the examination and guideline for locating marks for essays. Criterion A demonstrates relevant knowledge and understanding applied to a range of issues and problems. Criterion B communicates clearly in a concise, logical and relevant way. Criterion C marshal evidence, draw conclusions and make evaluations. Balance of marks for 30 mark questions; Criterion A = maximum of 15 Criterion B = maximum of 5 Criterion C = maximum of 10 Band Level Descriptors Marks Band 1 The candidate demonstrates the following abilities where appropriate to: 25–30 A • select and use a very good range of accurate and appropriate knowledge; • integrate knowledge from a wide range of areas; • show a good understanding of the concepts involved; • make good use of knowledge derived from personal experience and study; B • select and use a form and style of writing appropriate to purpose and complex subject matter with facility; • communicate complex ideas clearly and accurately, in a concise, logical and relevant way; C • analyse issues and problems well and evaluate them appropriately; • develop complex reasoned arguments and draw sound conclusions on the evidence; Band 2 The candidate demonstrates the following abilities where appropriate to: 19–24 A • select and use a good range of accurate and appropriate knowledge; • integrate knowledge from a wide range of areas; • show an understanding of the concepts involved; • demonstrate a range of awareness of personally derived and studied knowledge; B • select and use a form and style of writing appropriate to purpose and complex subject matter; • communicate complex ideas clearly and accurately, in a concise, logical and relevant way; C • analyse issues and problems and evaluate them competently; • develop complex reasoned arguments and draw conclusions on the evidence;
Mark scheme, page 12
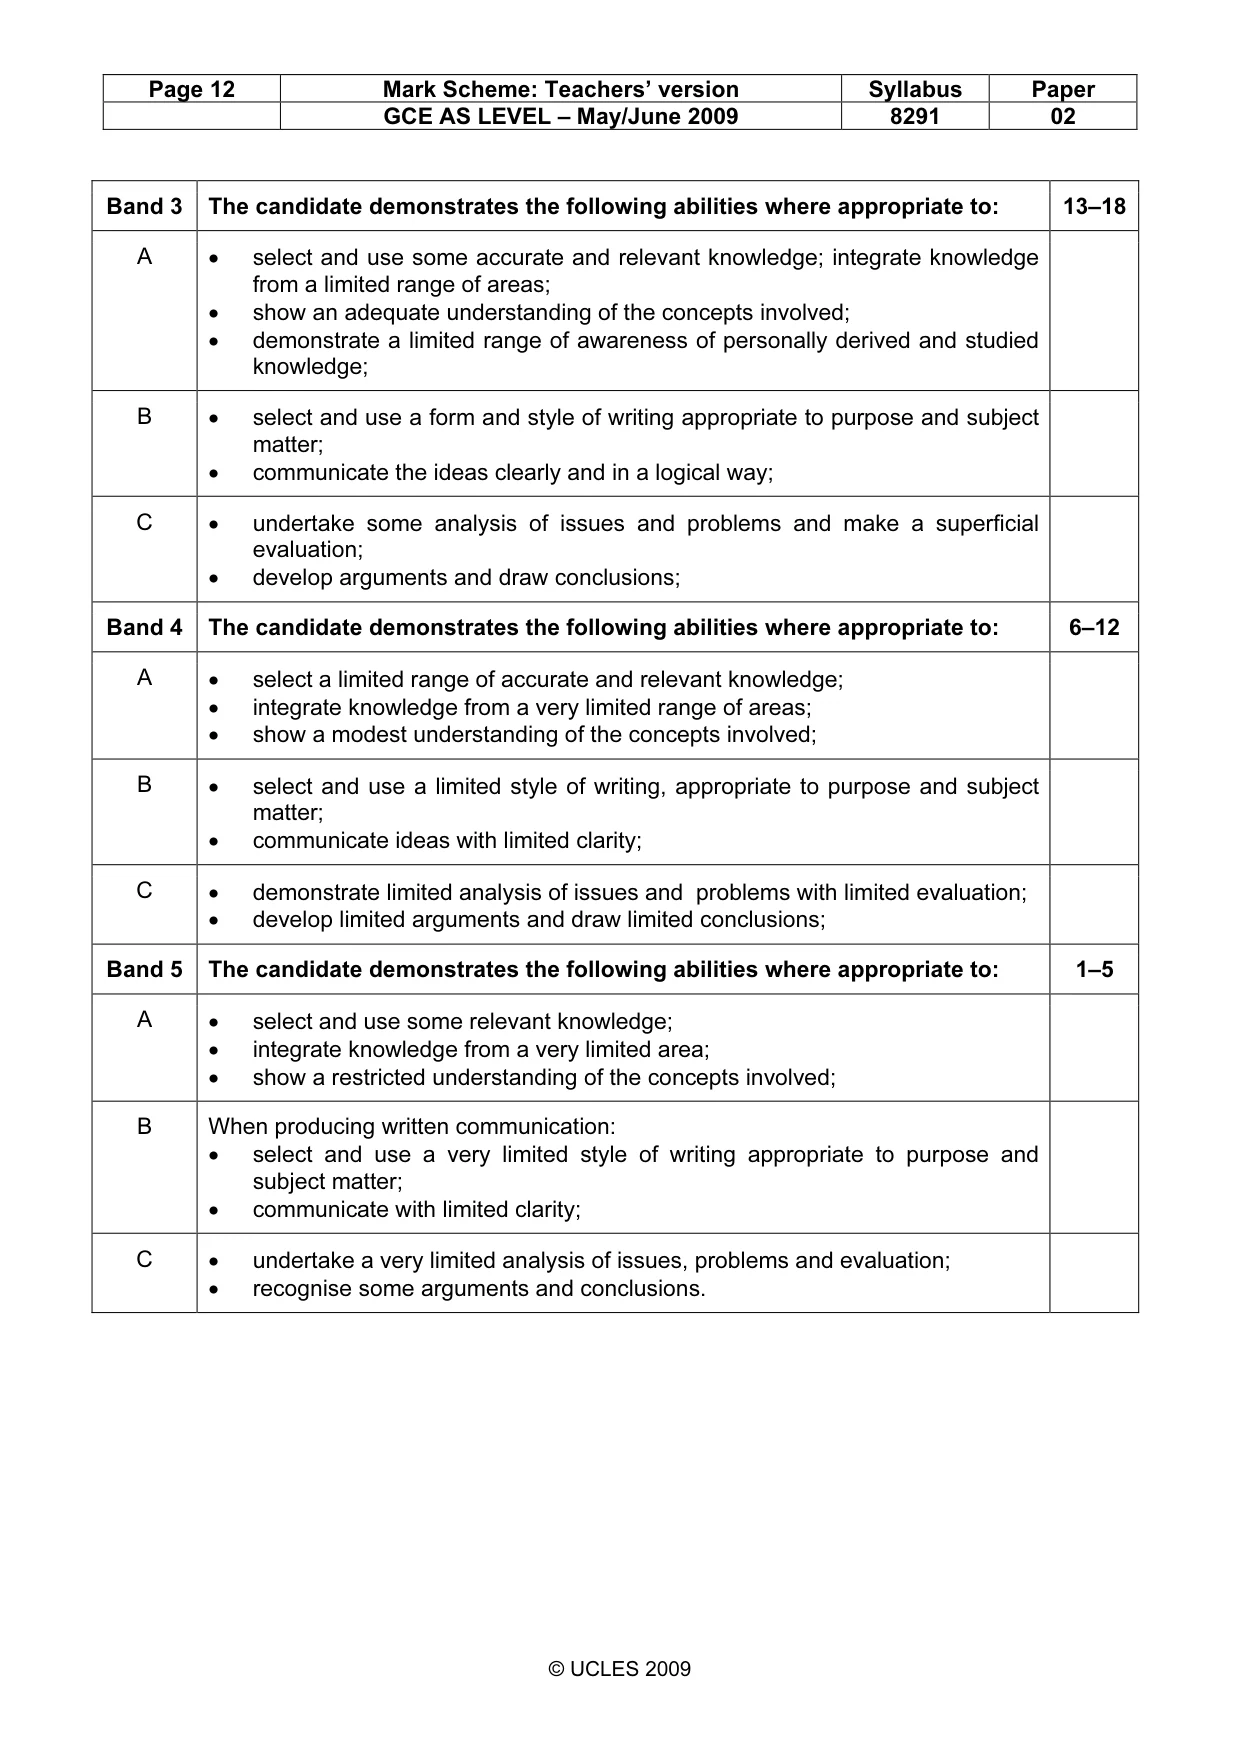
Page 12 Mark Scheme: Teachers’ version Syllabus Paper GCE AS LEVEL – May/June 2009 8291 02 © UCLES 2009 Band 3 The candidate demonstrates the following abilities where appropriate to: 13–18 A • select and use some accurate and relevant knowledge; integrate knowledge from a limited range of areas; • show an adequate understanding of the concepts involved; • demonstrate a limited range of awareness of personally derived and studied knowledge; B • select and use a form and style of writing appropriate to purpose and subject matter; • communicate the ideas clearly and in a logical way; C • undertake some analysis of issues and problems and make a superficial evaluation; • develop arguments and draw conclusions; Band 4 The candidate demonstrates the following abilities where appropriate to: 6–12 A • select a limited range of accurate and relevant knowledge; • integrate knowledge from a very limited range of areas; • show a modest understanding of the concepts involved; B • select and use a limited style of writing, appropriate to purpose and subject matter; • communicate ideas with limited clarity; C • demonstrate limited analysis of issues and problems with limited evaluation; • develop limited arguments and draw limited conclusions; Band 5 The candidate demonstrates the following abilities where appropriate to: 1–5 A • select and use some relevant knowledge; • integrate knowledge from a very limited area; • show a restricted understanding of the concepts involved; B When producing written communication: • select and use a very limited style of writing appropriate to purpose and subject matter; • communicate with limited clarity; C • undertake a very limited analysis of issues, problems and evaluation; • recognise some arguments and conclusions.
What you needed in this session
Cambridge’s own grade thresholds for 2009 May/June, Paper 2 · Variant 1. A higher threshold means an easier paper — the bar moves with how the cohort did.