Cambridge A Level Chemistry 9701 — 2013 Oct/Nov Paper 5 · Variant 3
9701/53/O/N/13 · 30 marks · ≈34 min
The question paper and its mark scheme, free to read here and free to download. This is Cambridge’s own paper, exactly as it was sat.
Question paper12 pages
Mark scheme3 pages
Answers below. Sit the paper first if you are practising.
Paper as text
Question paper, page 1
READ THESE INSTRUCTIONS FIRST Write your Centre number, candidate number and name on all the work you hand in. Write in dark blue or black pen. You may use a soft pencil for any diagrams, graphs or rough working. Do not use staples, paper clips, highlighters, glue or correction fl uid. DO NOT WRITE IN ANY BARCODES. Answer all questions. Electronic calculators may be used. You may lose marks if you do not show your working or if you do not use appropriate units. Use of a Data Booklet is unnecessary. At the end of the examination, fasten all your work securely together. The number of marks is given in brackets [ ] at the end of each question or part question. CHEMISTRY 9701/53 Paper 5 Planning, Analysis and Evaluation October/November 2013 1 hour 15 minutes Candidates answer on the Question Paper. No Additional Materials are required. UNIVERSITY OF CAMBRIDGE INTERNATIONAL EXAMINATIONS General Certifi cate of Education Advanced Level This document consists of 9 printed pages and 3 blank pages. [Turn over IB13 11_9701_53/4RP © UCLES 2013 *9145905666* For Examiner’s Use 1 2 3 Total
Question paper, page 2
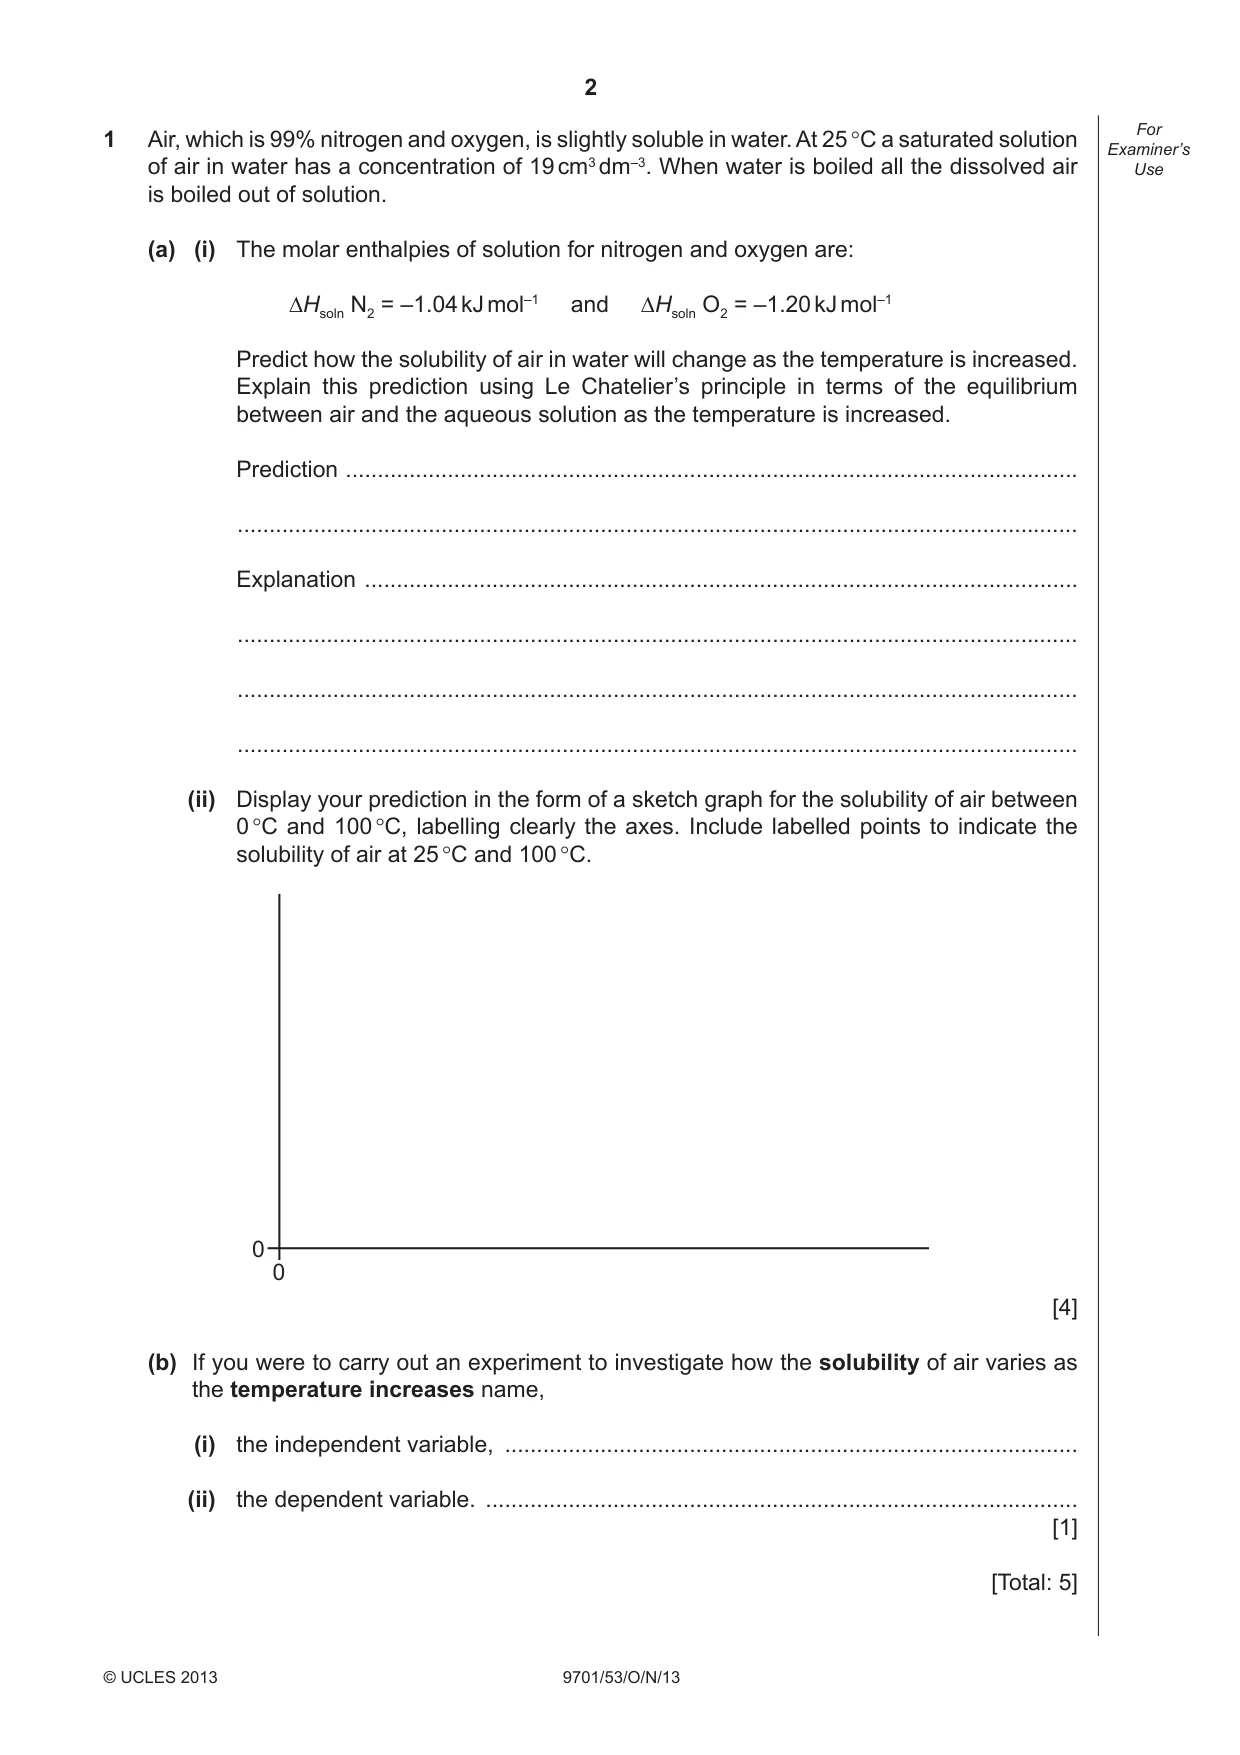
2 9701/53/O/N/13 © UCLES 2013 For Examiner’s Use 1 Air, which is 99% nitrogen and oxygen, is slightly soluble in water. At 25 °C a saturated solution of air in water has a concentration of 19 cm3 dm–3. When water is boiled all the dissolved air is boiled out of solution. (a) (i) The molar enthalpies of solution for nitrogen and oxygen are: ∆Hsoln N2 = –1.04 kJ mol–1 and ∆Hsoln O2 = –1.20 kJ mol–1 Predict how the solubility of air in water will change as the temperature is increased. Explain this prediction using Le Chatelier’s principle in terms of the equilibrium between air and the aqueous solution as the temperature is increased. Prediction … … Explanation … … … … (ii) Display your prediction in the form of a sketch graph for the solubility of air between 0 °C and 100 °C, labelling clearly the axes. Include labelled points to indicate the solubility of air at 25 °C and 100 °C. 0 0 [4] (b) If you were to carry out an experiment to investigate how the solubility of air varies as the temperature increases name, (i) the independent variable, … (ii) the dependent variable. … [1] [Total: 5]
Question paper, page 3
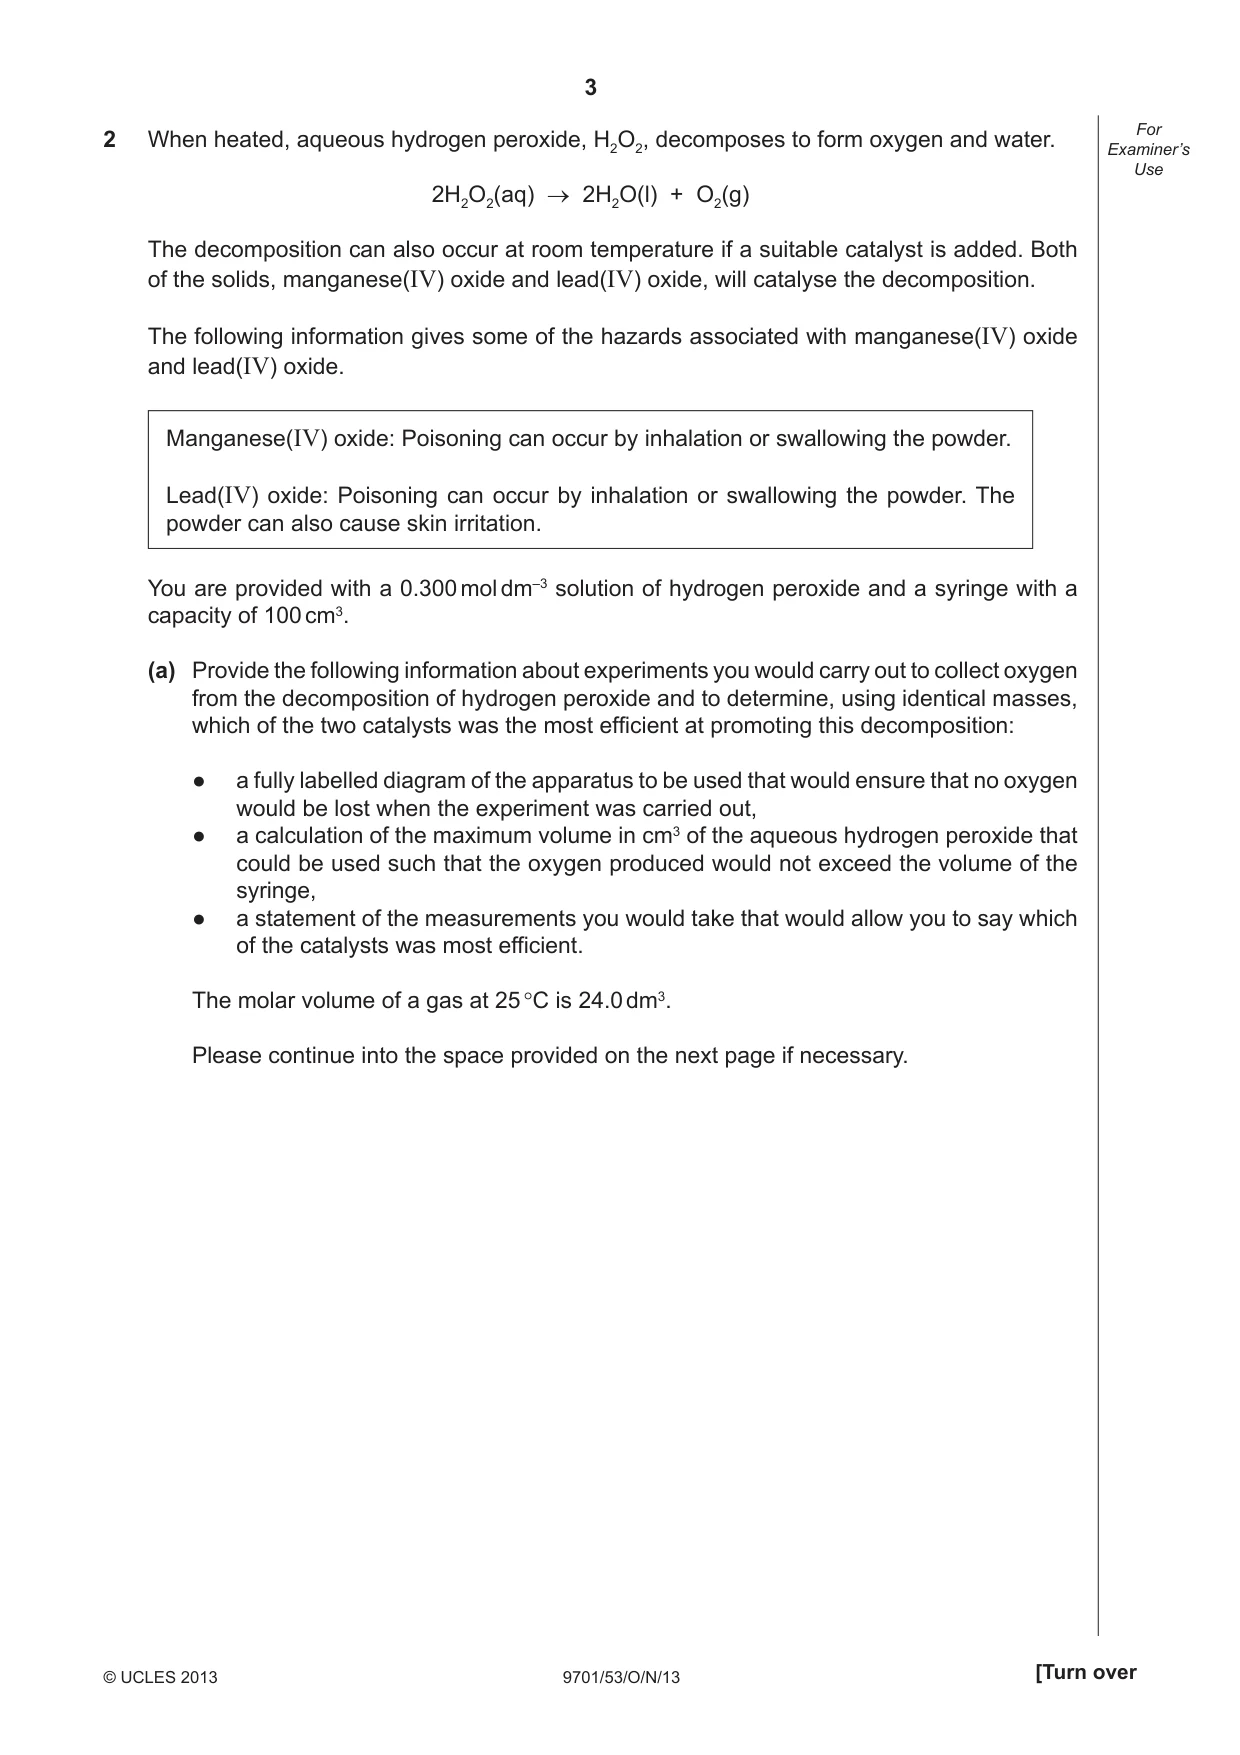
3 9701/53/O/N/13 © UCLES 2013 [Turn over For Examiner’s Use 2 When heated, aqueous hydrogen peroxide, H2O2, decomposes to form oxygen and water. 2H2O2(aq) → 2H2O(l) + O2(g) The decomposition can also occur at room temperature if a suitable catalyst is added. Both of the solids, manganese(IV) oxide and lead(IV) oxide, will catalyse the decomposition. The following information gives some of the hazards associated with manganese(IV) oxide and lead(IV) oxide. Manganese(IV) oxide: Poisoning can occur by inhalation or swallowing the powder. Lead(IV) oxide: Poisoning can occur by inhalation or swallowing the powder. The powder can also cause skin irritation. You are provided with a 0.300 mol dm–3 solution of hydrogen peroxide and a syringe with a capacity of 100 cm3. (a) Provide the following information about experiments you would carry out to collect oxygen from the decomposition of hydrogen peroxide and to determine, using identical masses, which of the two catalysts was the most effi cient at promoting this decomposition: ● a fully labelled diagram of the apparatus to be used that would ensure that no oxygen would be lost when the experiment was carried out, ● a calculation of the maximum volume in cm3 of the aqueous hydrogen peroxide that could be used such that the oxygen produced would not exceed the volume of the syringe, ● a statement of the measurements you would take that would allow you to say which of the catalysts was most efficient. The molar volume of a gas at 25 °C is 24.0 dm3. Please continue into the space provided on the next page if necessary.
Question paper, page 4
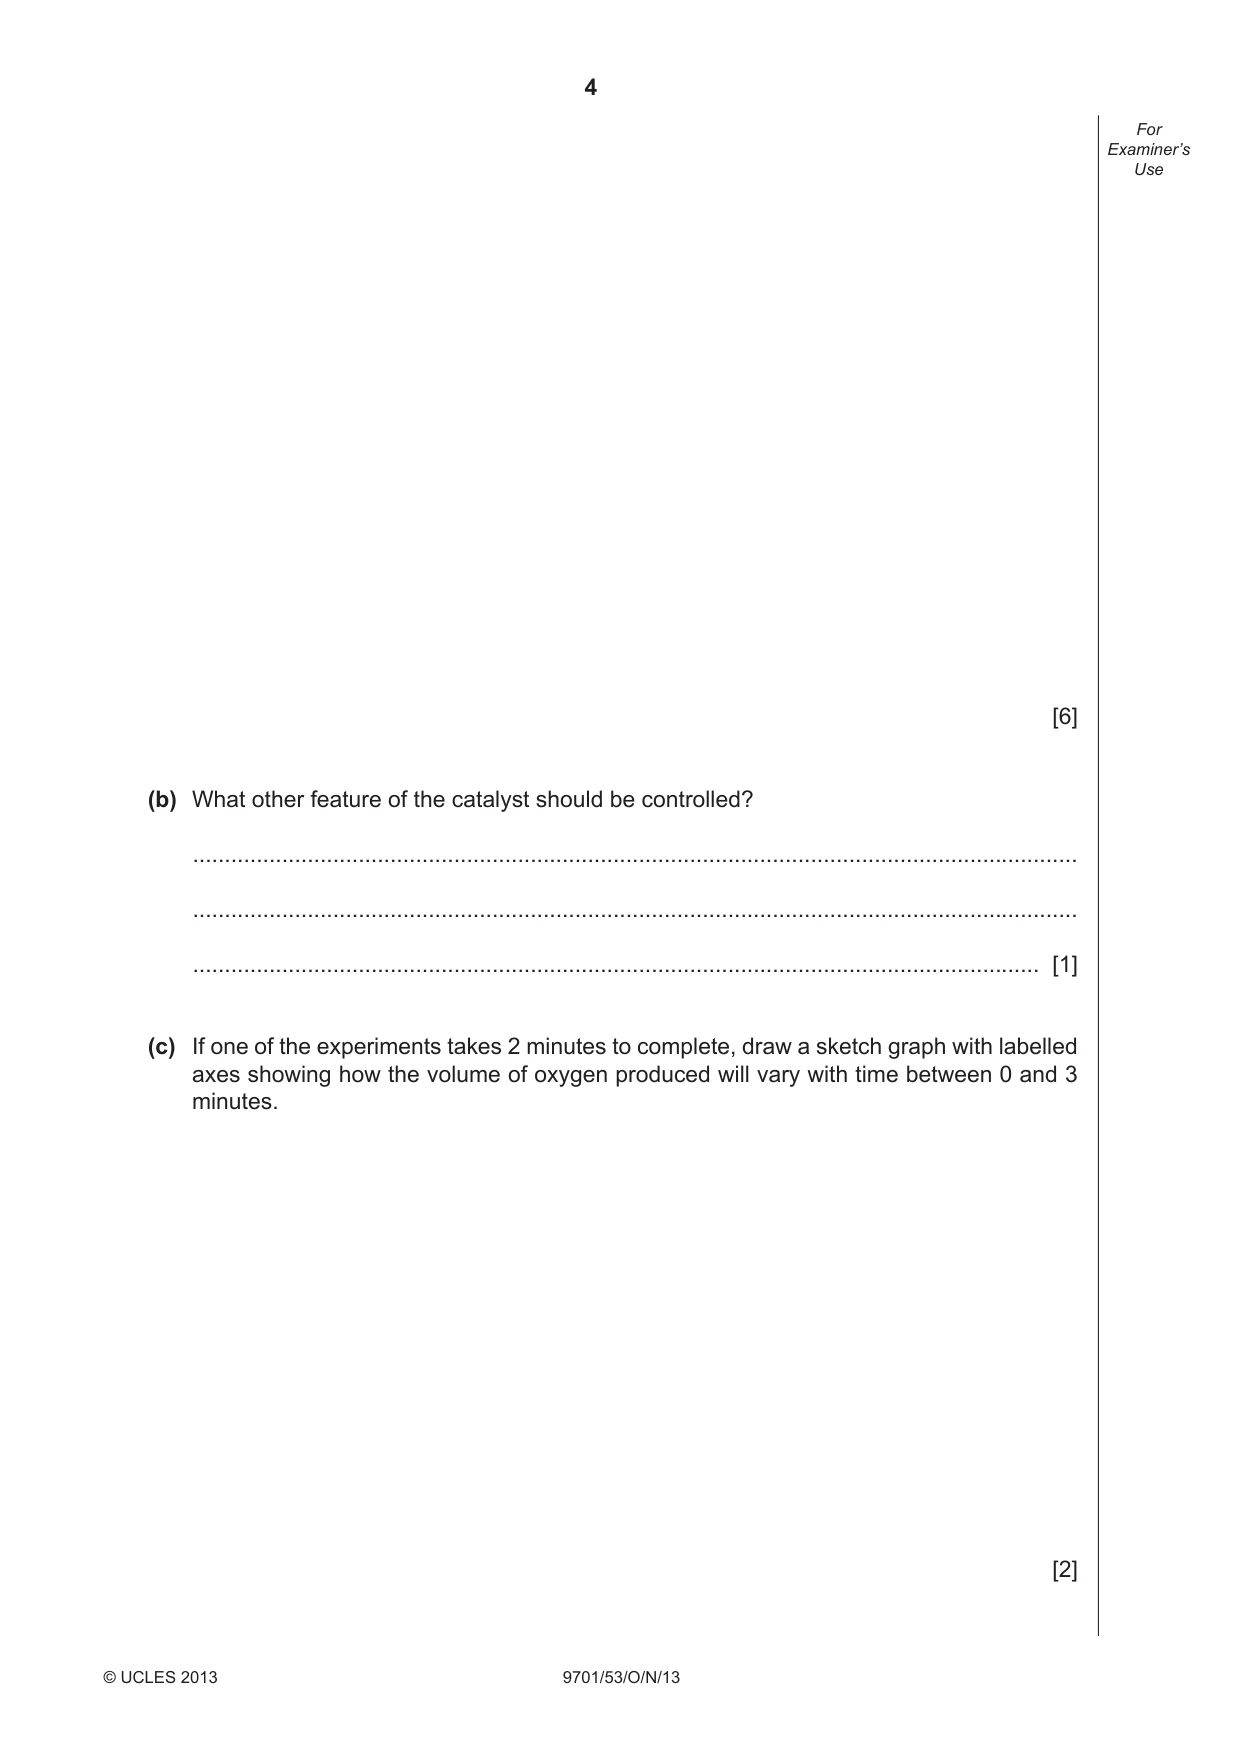
4 9701/53/O/N/13 © UCLES 2013 For Examiner’s Use [6] (b) What other feature of the catalyst should be controlled? … … … [1] (c) If one of the experiments takes 2 minutes to complete, draw a sketch graph with labelled axes showing how the volume of oxygen produced will vary with time between 0 and 3 minutes. [2]
Question paper, page 5
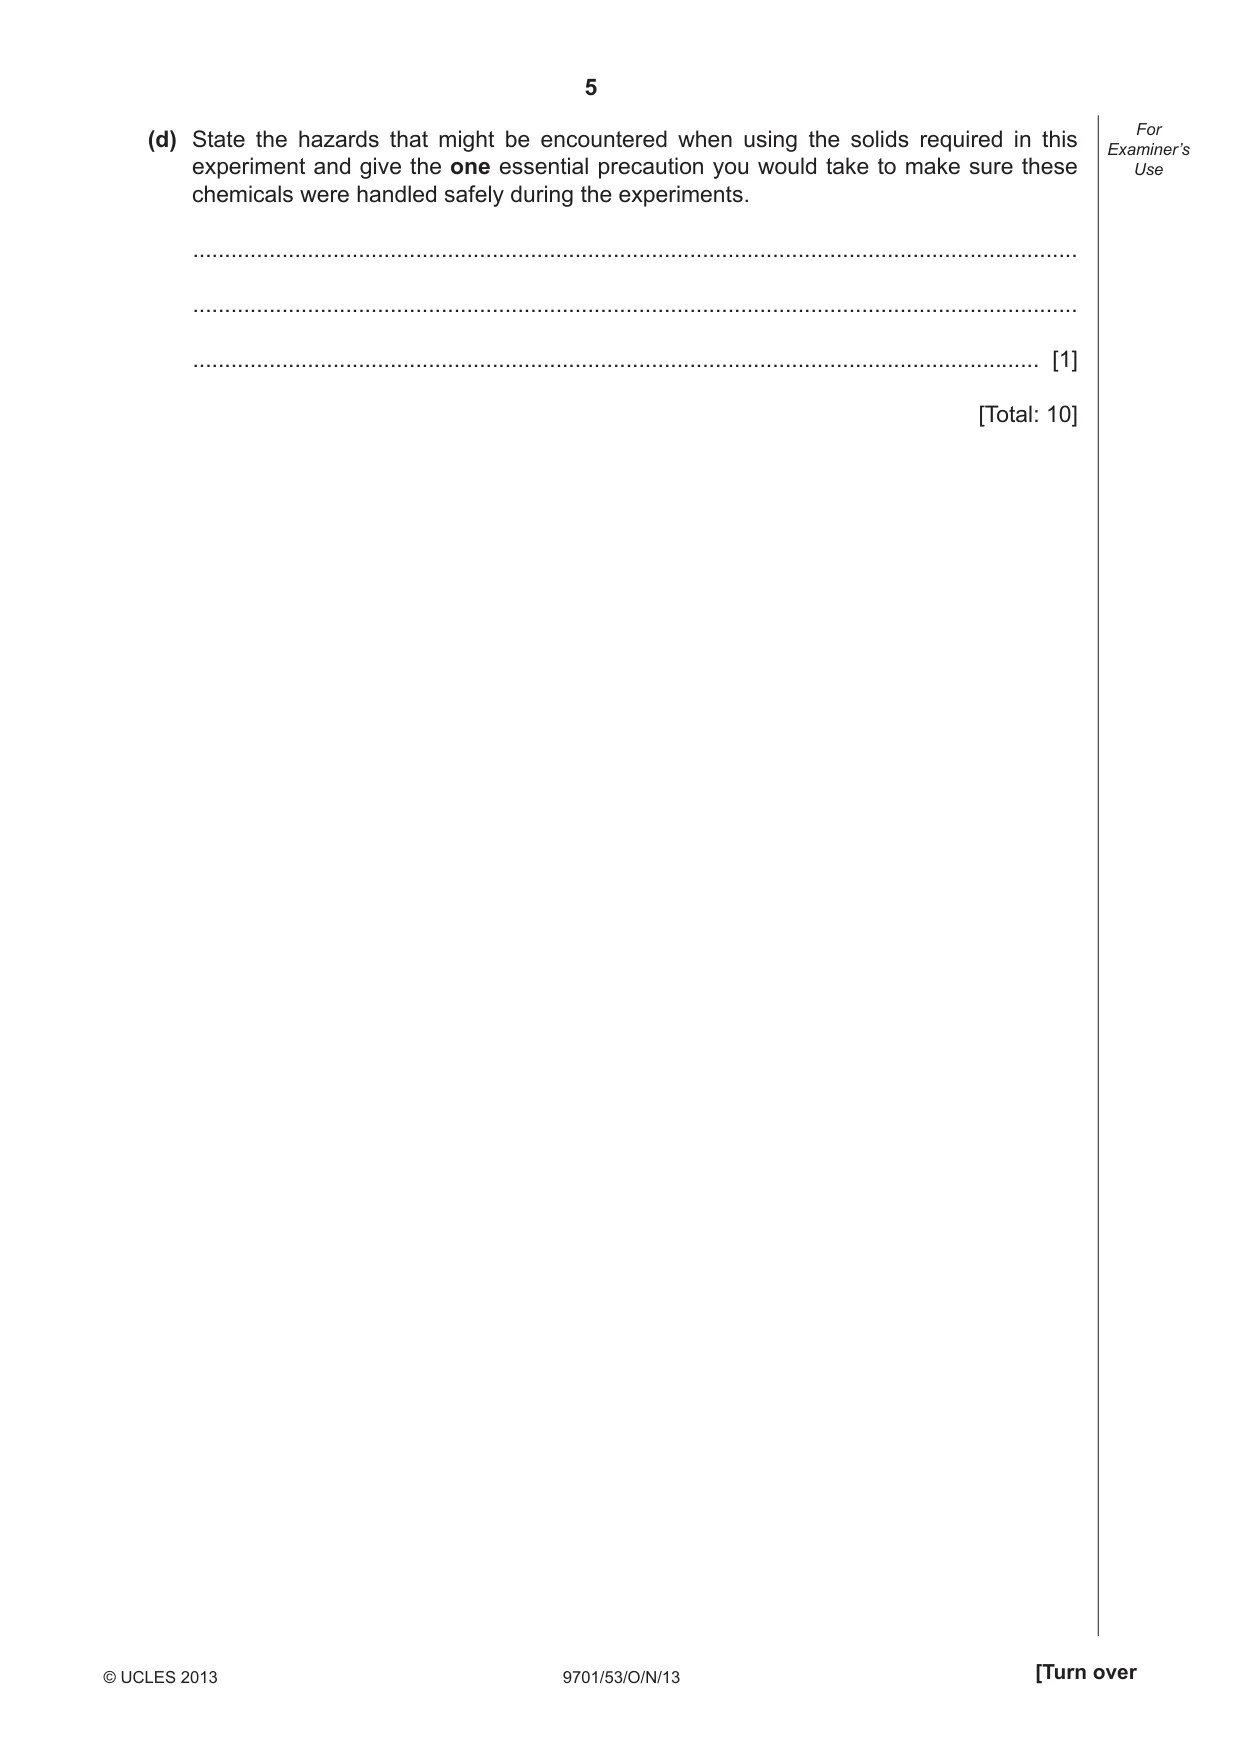
5 9701/53/O/N/13 © UCLES 2013 [Turn over For Examiner’s Use (d) State the hazards that might be encountered when using the solids required in this experiment and give the one essential precaution you would take to make sure these chemicals were handled safely during the experiments. … … … [1] [Total: 10]
Question paper, page 6
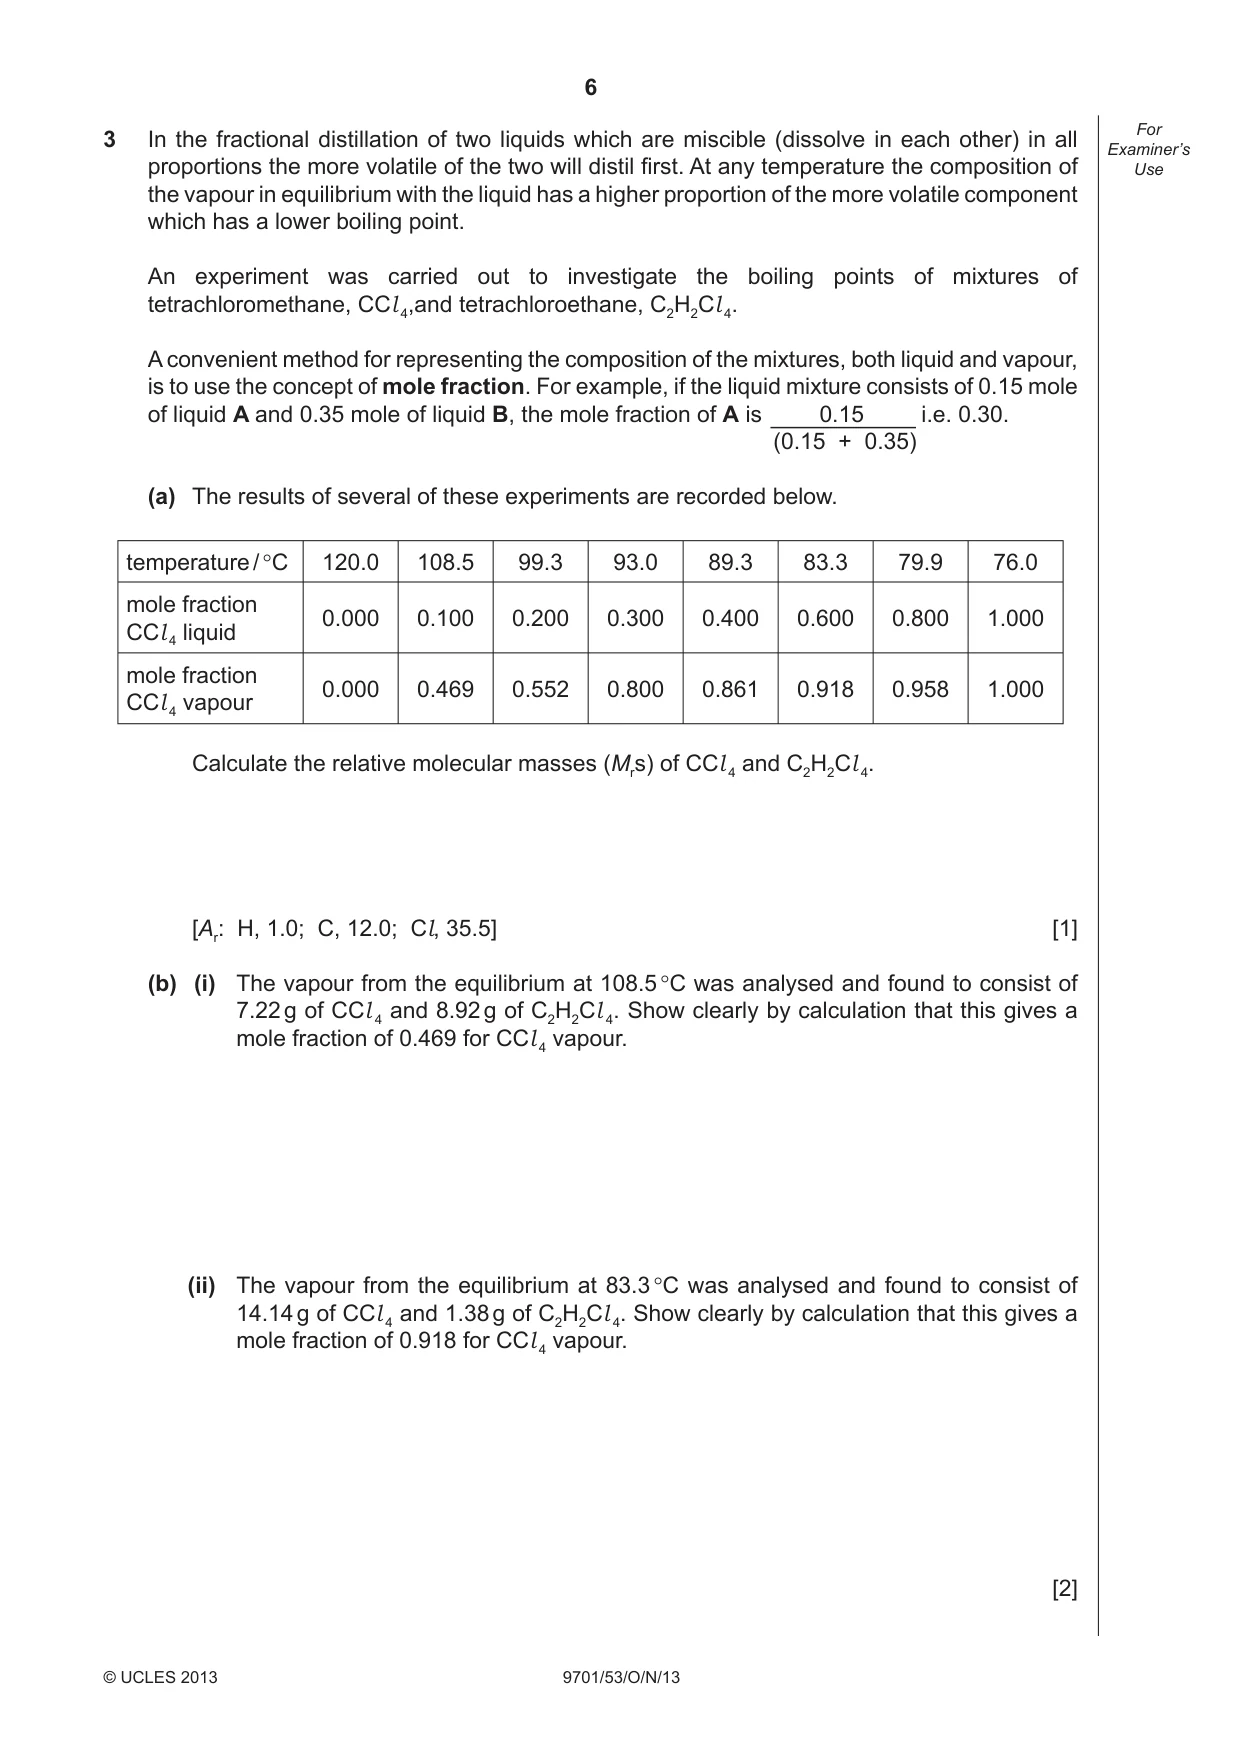
6 9701/53/O/N/13 © UCLES 2013 For Examiner’s Use 3 In the fractional distillation of two liquids which are miscible (dissolve in each other) in all proportions the more volatile of the two will distil fi rst. At any temperature the composition of the vapour in equilibrium with the liquid has a higher proportion of the more volatile component which has a lower boiling point. An experiment was carried out to investigate the boiling points of mixtures of tetrachloromethane, CCl 4,and tetrachloroethane, C2H2Cl 4. A convenient method for representing the composition of the mixtures, both liquid and vapour, is to use the concept of mole fraction. For example, if the liquid mixture consists of 0.15 mole of liquid A and 0.35 mole of liquid B, the mole fraction of A is 0.15 i.e. 0.30. (0.15 + 0.35) (a) The results of several of these experiments are recorded below. temperature / °C 120.0 108.5 99.3 93.0 89.3 83.3 79.9 76.0 mole fraction CCl 4 liquid 0.000 0.100 0.200 0.300 0.400 0.600 0.800 1.000 mole fraction CCl 4 vapour 0.000 0.469 0.552 0.800 0.861 0.918 0.958 1.000 Calculate the relative molecular masses (Mrs) of CCl 4 and C2H2Cl 4. [Ar: H, 1.0; C, 12.0; Cl, 35.5] [1] (b) (i) The vapour from the equilibrium at 108.5 °C was analysed and found to consist of 7.22 g of CCl 4 and 8.92 g of C2H2Cl 4. Show clearly by calculation that this gives a mole fraction of 0.469 for CCl 4 vapour. (ii) The vapour from the equilibrium at 83.3 °C was analysed and found to consist of 14.14 g of CCl 4 and 1.38 g of C2H2Cl 4. Show clearly by calculation that this gives a mole fraction of 0.918 for CCl 4 vapour. [2]
Question paper, page 7
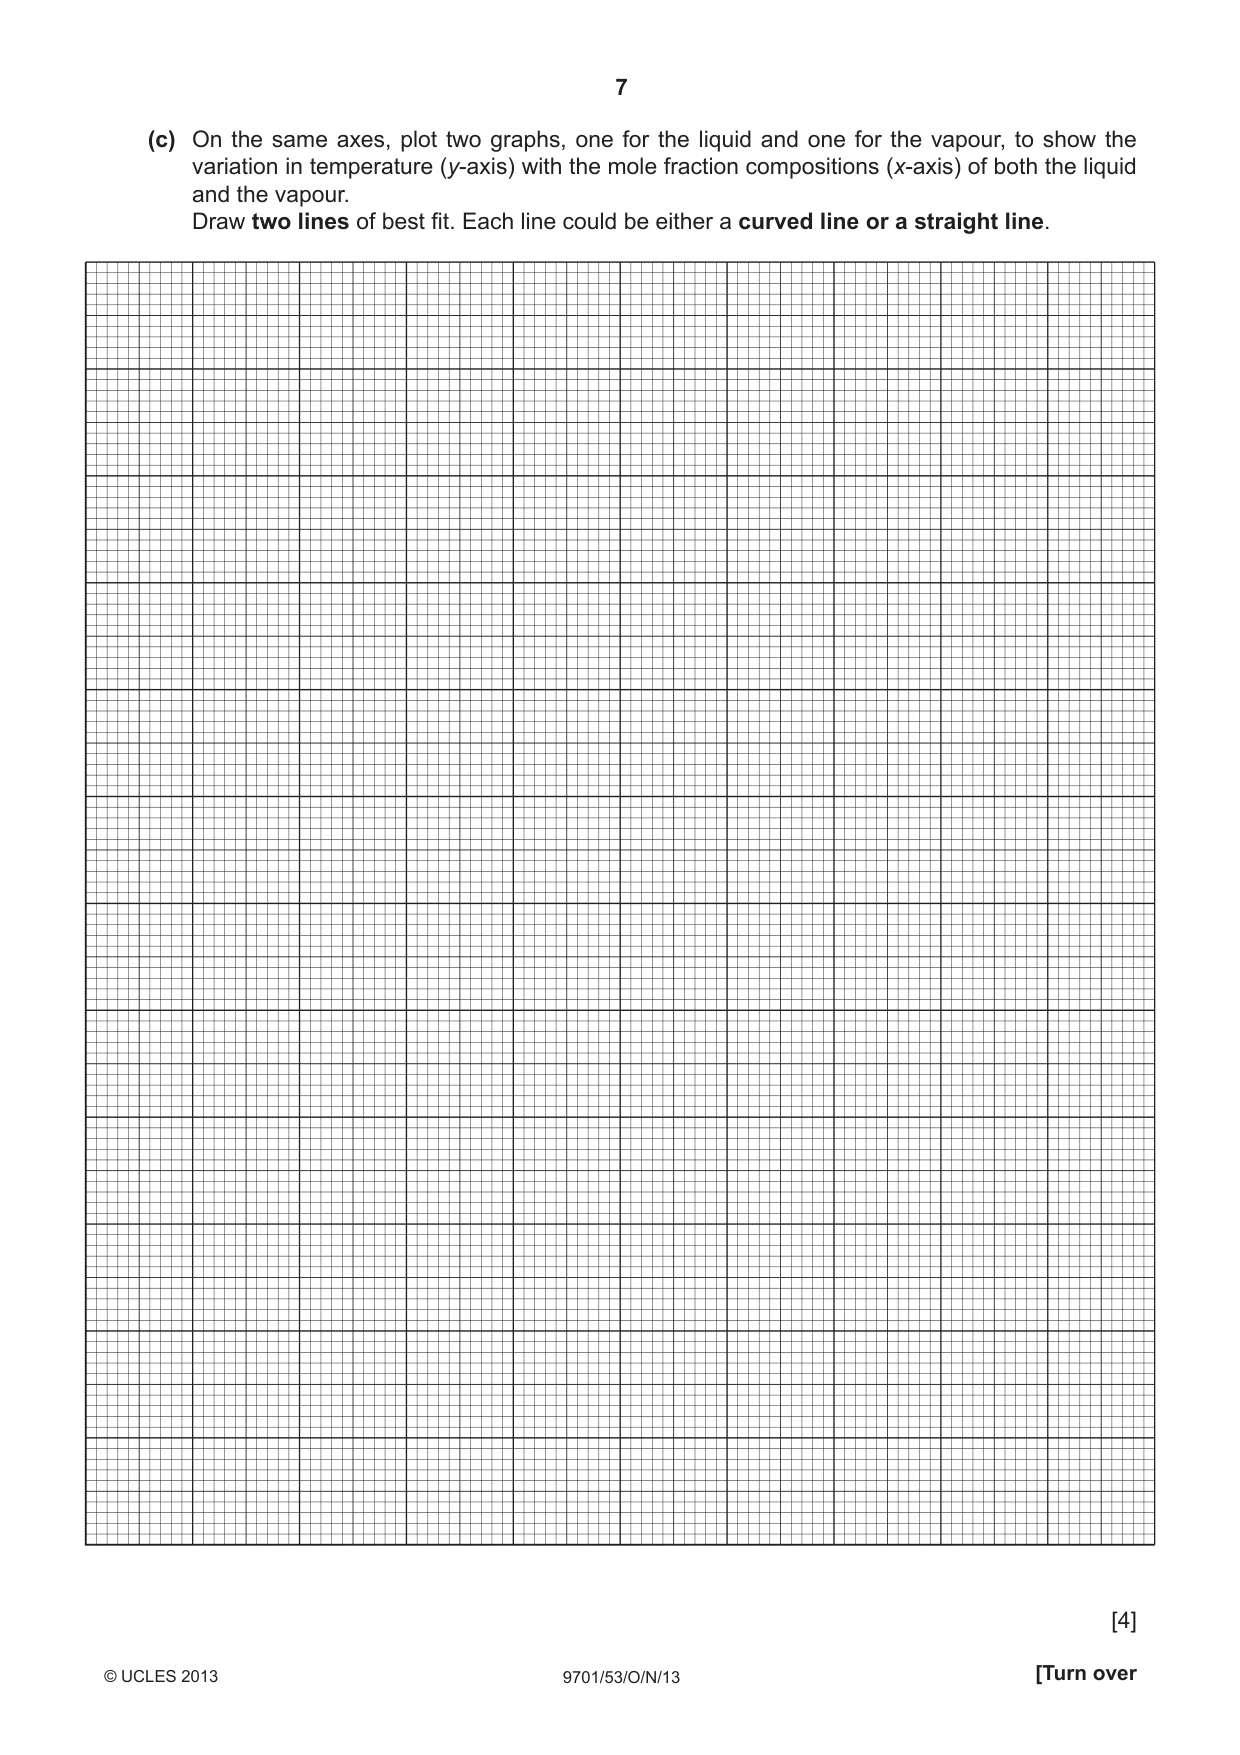
7 9701/53/O/N/13 © UCLES 2013 [Turn over (c) On the same axes, plot two graphs, one for the liquid and one for the vapour, to show the variation in temperature (y-axis) with the mole fraction compositions (x-axis) of both the liquid and the vapour. Draw two lines of best fi t. Each line could be either a curved line or a straight line. [4]
Question paper, page 8
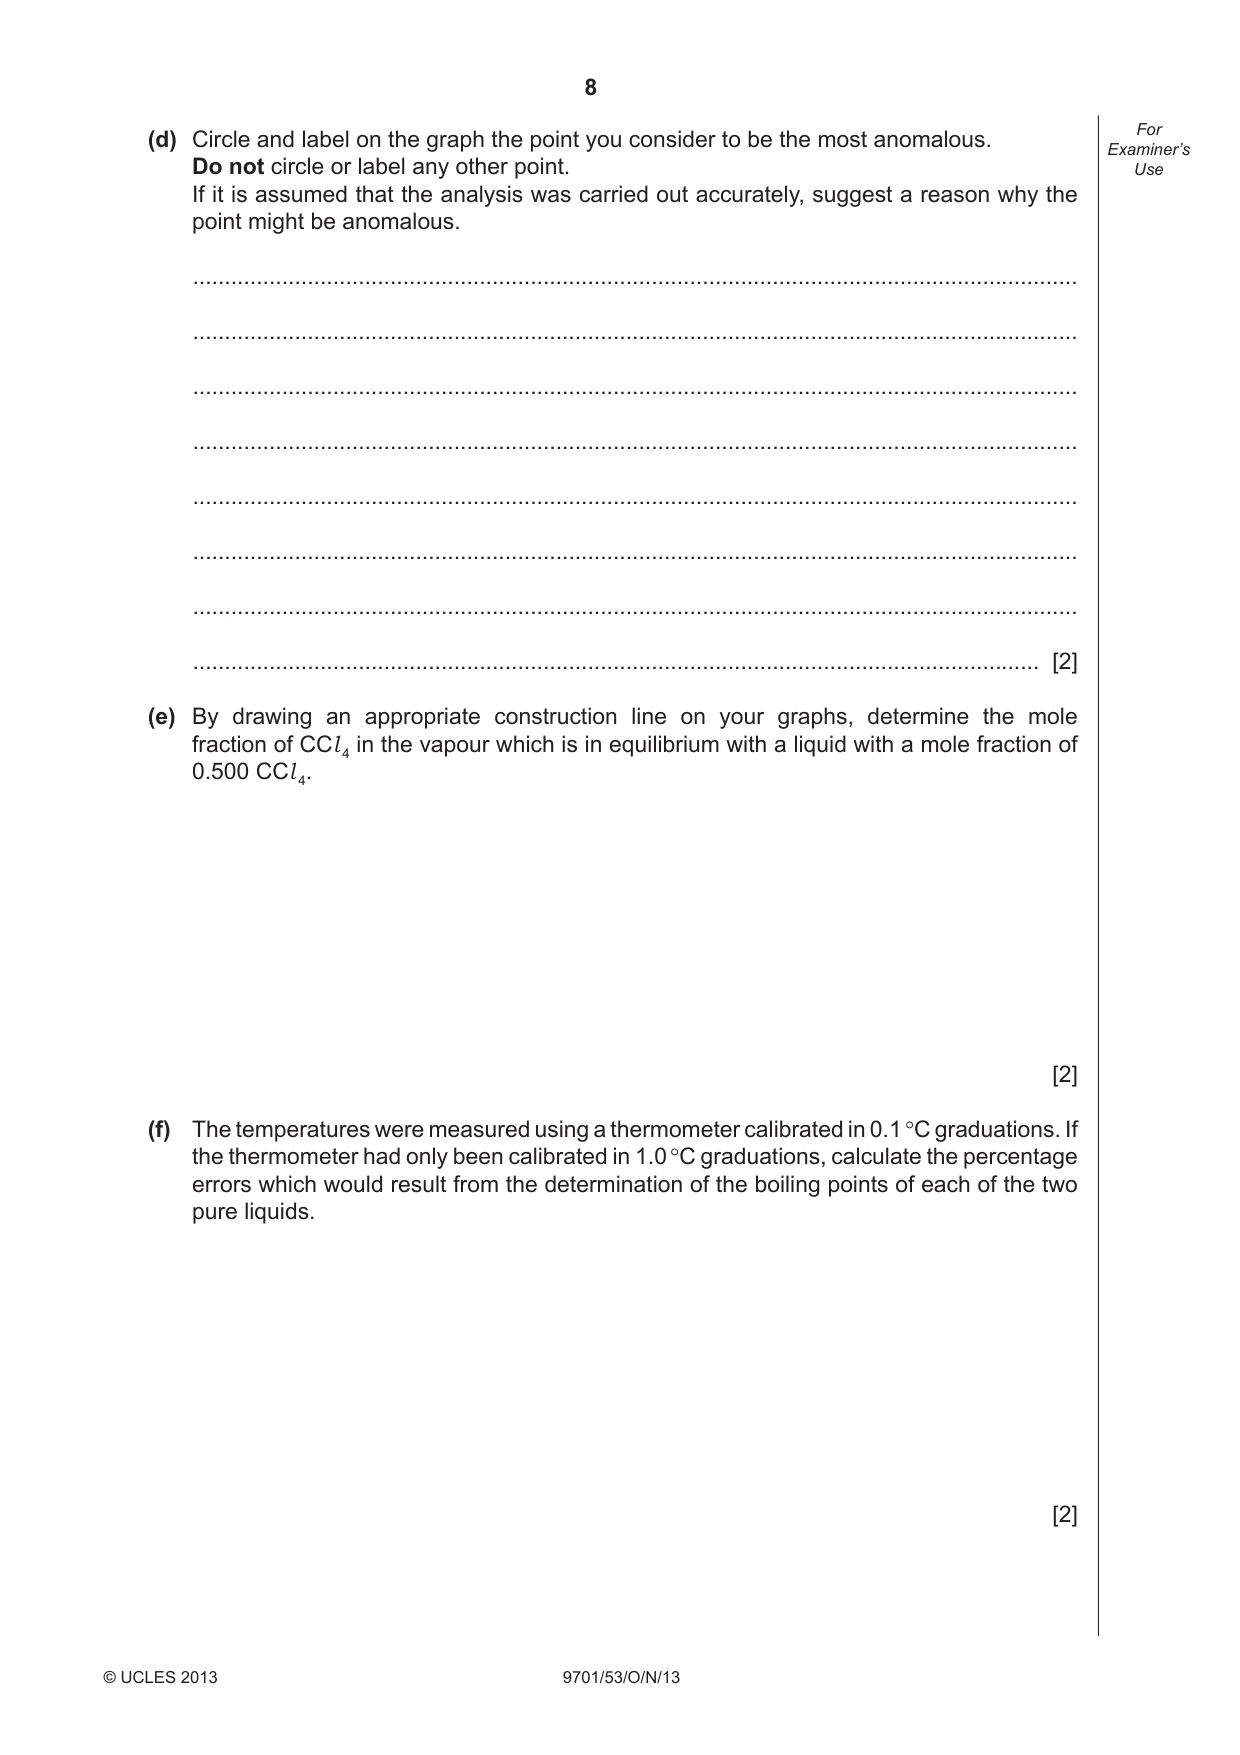
8 9701/53/O/N/13 © UCLES 2013 For Examiner’s Use (d) Circle and label on the graph the point you consider to be the most anomalous. Do not circle or label any other point. If it is assumed that the analysis was carried out accurately, suggest a reason why the point might be anomalous. … … … … … … … … [2] (e) By drawing an appropriate construction line on your graphs, determine the mole fraction of CCl 4 in the vapour which is in equilibrium with a liquid with a mole fraction of 0.500 CCl 4. [2] (f) The temperatures were measured using a thermometer calibrated in 0.1 °C graduations. If the thermometer had only been calibrated in 1.0 °C graduations, calculate the percentage errors which would result from the determination of the boiling points of each of the two pure liquids. [2]
Question paper, page 9
9 9701/53/O/N/13 © UCLES 2013 [Turn over For Examiner’s Use (g) (i) Use your graphs to state whether CCl 4 or C2H2Cl 4 distills fi rst from a mixture of the two liquids. … (ii) Explain your answer (i). … … … … [2] [Total: 15]
Question paper, page 10
10 9701/53/O/N/13 BLANK PAGE © UCLES 2013
Question paper, page 11
11 9701/53/O/N/13 BLANK PAGE © UCLES 2013
Question paper, page 12
12 Permission to reproduce items where third-party owned material protected by copyright is included has been sought and cleared where possible. Every reasonable effort has been made by the publisher (UCLES) to trace copyright holders, but if any items requiring clearance have unwittingly been included the publisher will be pleased to make amends at the earliest possible opportunity. University of Cambridge International Examinations is part of the Cambridge Assessment Group. Cambridge Assessment is the brand name of University of Cambridge Local Examinations Syndicate (UCLES), which is itself a department of the University of Cambridge. 9701/53/O/N/13 © UCLES 2013 BLANK PAGE
Mark scheme, page 1
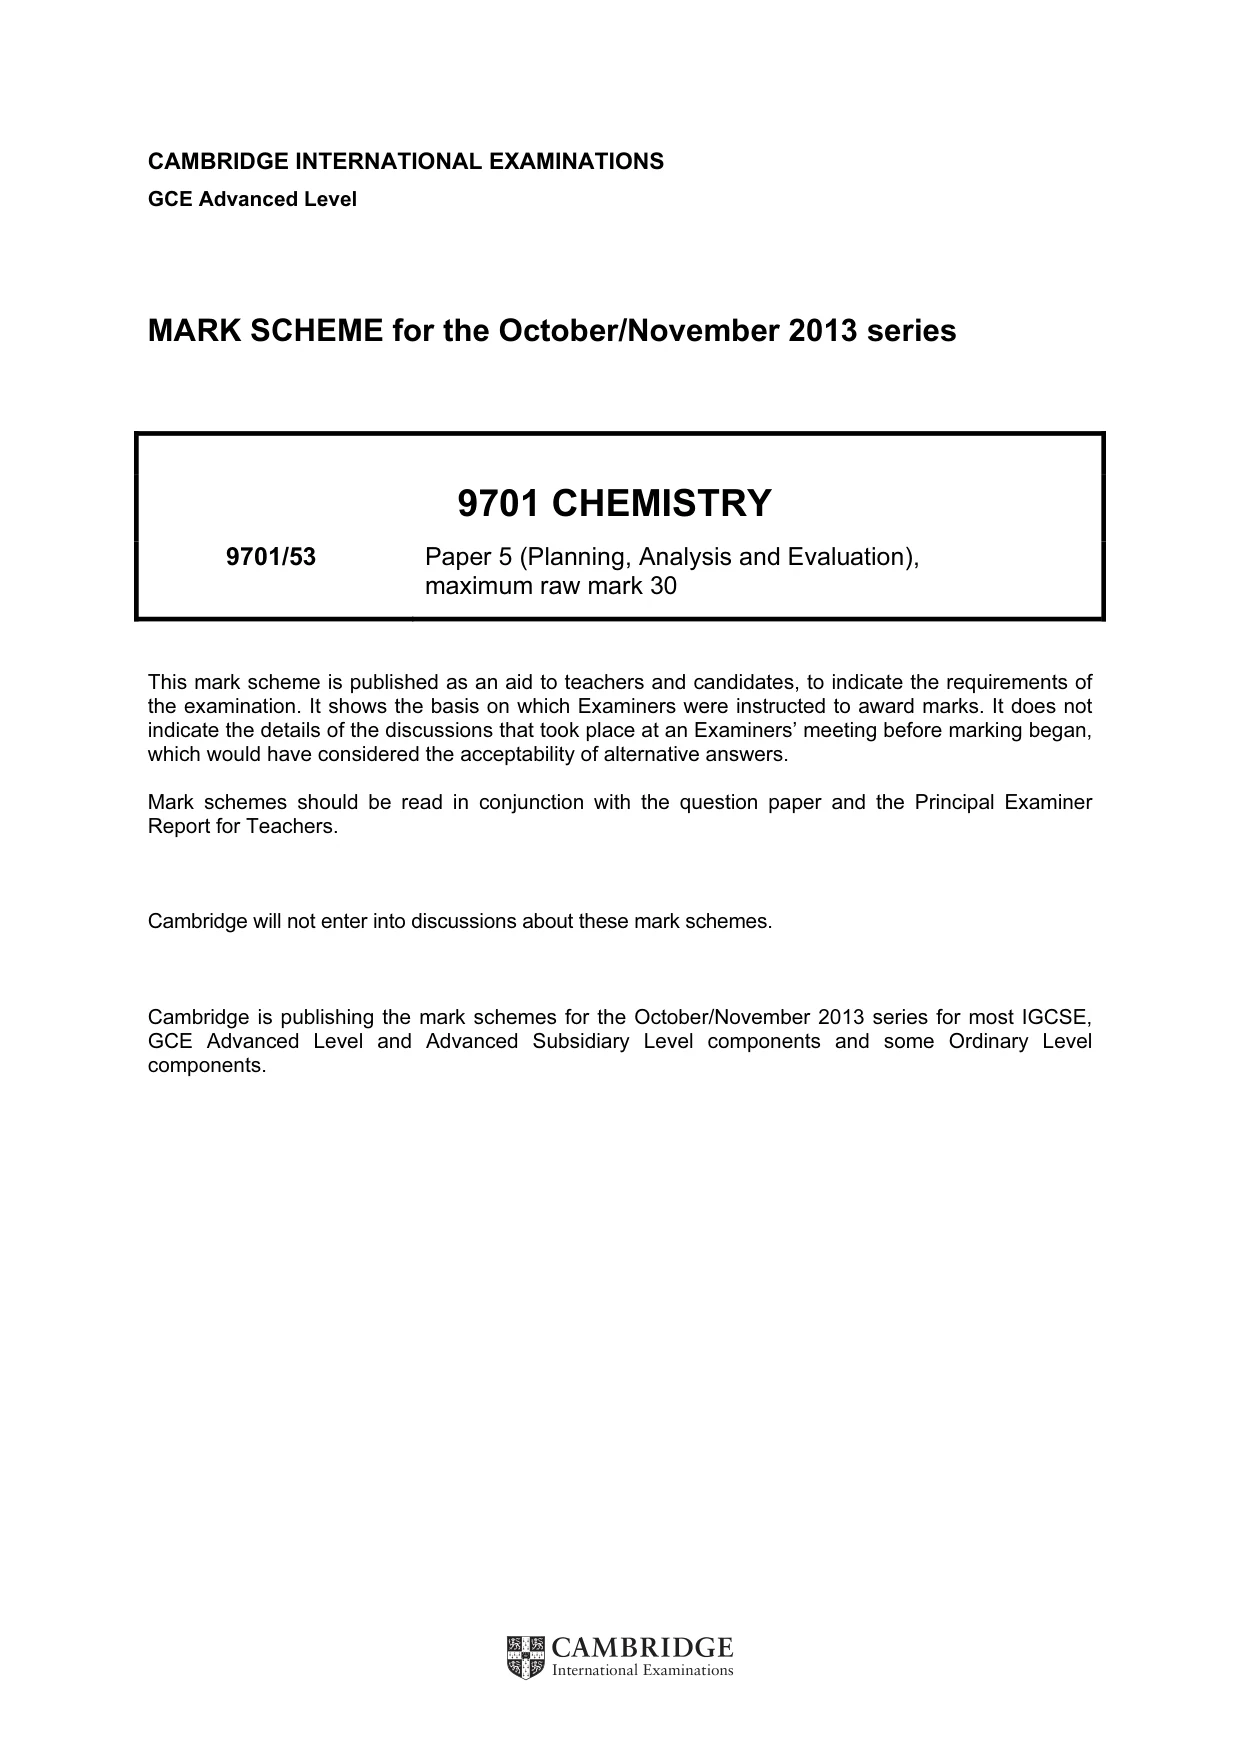
CAMBRIDGE INTERNATIONAL EXAMINATIONS GCE Advanced Level MARK SCHEME for the October/November 2013 series 9701 CHEMISTRY 9701/53 Paper 5 (Planning, Analysis and Evaluation), maximum raw mark 30 This mark scheme is published as an aid to teachers and candidates, to indicate the requirements of the examination. It shows the basis on which Examiners were instructed to award marks. It does not indicate the details of the discussions that took place at an Examiners’ meeting before marking began, which would have considered the acceptability of alternative answers. Mark schemes should be read in conjunction with the question paper and the Principal Examiner Report for Teachers. Cambridge will not enter into discussions about these mark schemes. Cambridge is publishing the mark schemes for the October/November 2013 series for most IGCSE, GCE Advanced Level and Advanced Subsidiary Level components and some Ordinary Level components.
Mark scheme, page 2
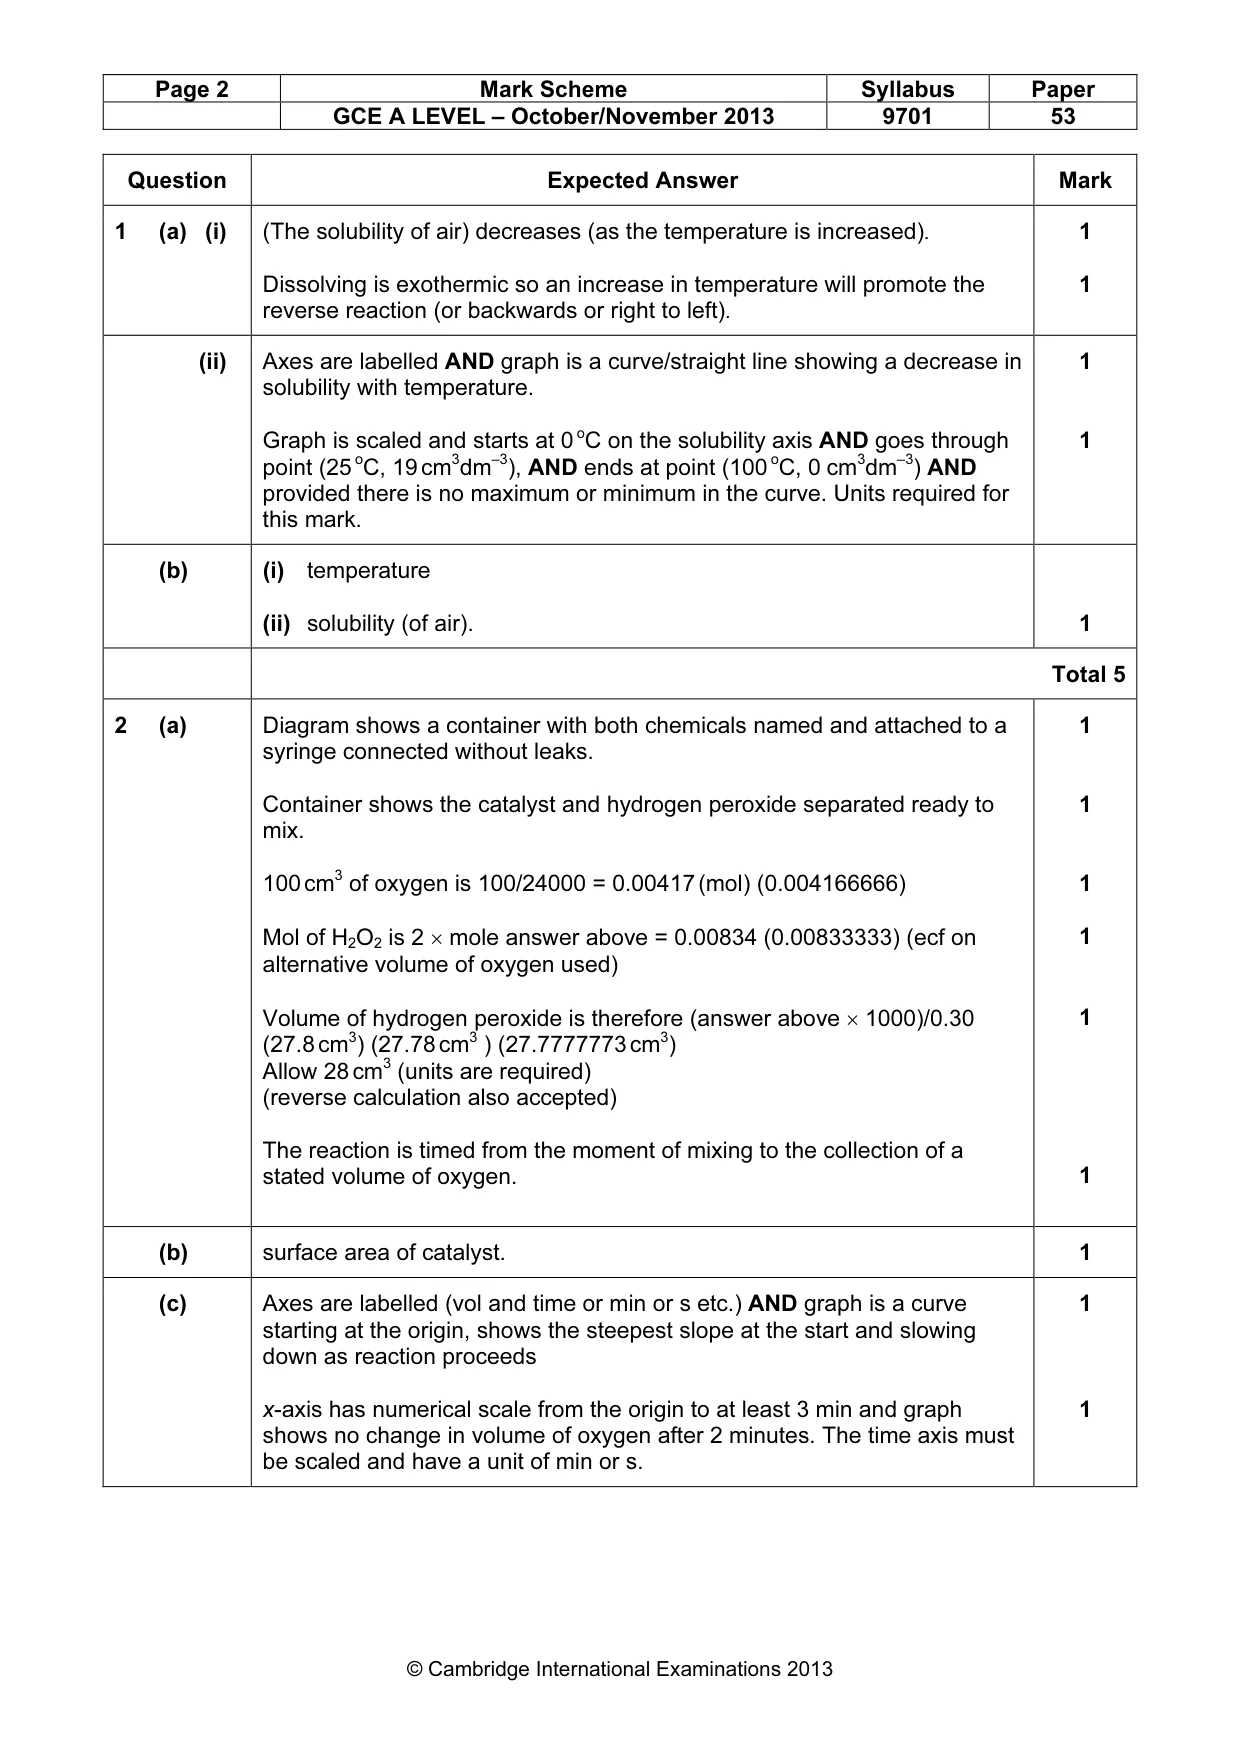
Page 2 Mark Scheme Syllabus Paper GCE A LEVEL – October/November 2013 9701 53 © Cambridge International Examinations 2013 Question Expected Answer Mark 1 (a) (i) (The solubility of air) decreases (as the temperature is increased). Dissolving is exothermic so an increase in temperature will promote the reverse reaction (or backwards or right to left). 1 1 (ii) Axes are labelled AND graph is a curve/straight line showing a decrease in solubility with temperature. Graph is scaled and starts at 0 oC on the solubility axis AND goes through point (25 oC, 19 cm3dm–3), AND ends at point (100 oC, 0 cm3dm–3) AND provided there is no maximum or minimum in the curve. Units required for this mark. 1 1 (b) (i) temperature (ii) solubility (of air). 1 Total 5 2 (a) Diagram shows a container with both chemicals named and attached to a syringe connected without leaks. Container shows the catalyst and hydrogen peroxide separated ready to mix. 100 cm3 of oxygen is 100/24000 = 0.00417 (mol) (0.004166666) Mol of H2O2 is 2 × mole answer above = 0.00834 (0.00833333) (ecf on alternative volume of oxygen used) Volume of hydrogen peroxide is therefore (answer above × 1000)/0.30 (27.8 cm3) (27.78 cm3 ) (27.7777773 cm3) Allow 28 cm3 (units are required) (reverse calculation also accepted) The reaction is timed from the moment of mixing to the collection of a stated volume of oxygen. 1 1 1 1 1 1 (b) surface area of catalyst. 1 (c) Axes are labelled (vol and time or min or s etc.) AND graph is a curve starting at the origin, shows the steepest slope at the start and slowing down as reaction proceeds x-axis has numerical scale from the origin to at least 3 min and graph shows no change in volume of oxygen after 2 minutes. The time axis must be scaled and have a unit of min or s. 1 1
Mark scheme, page 3
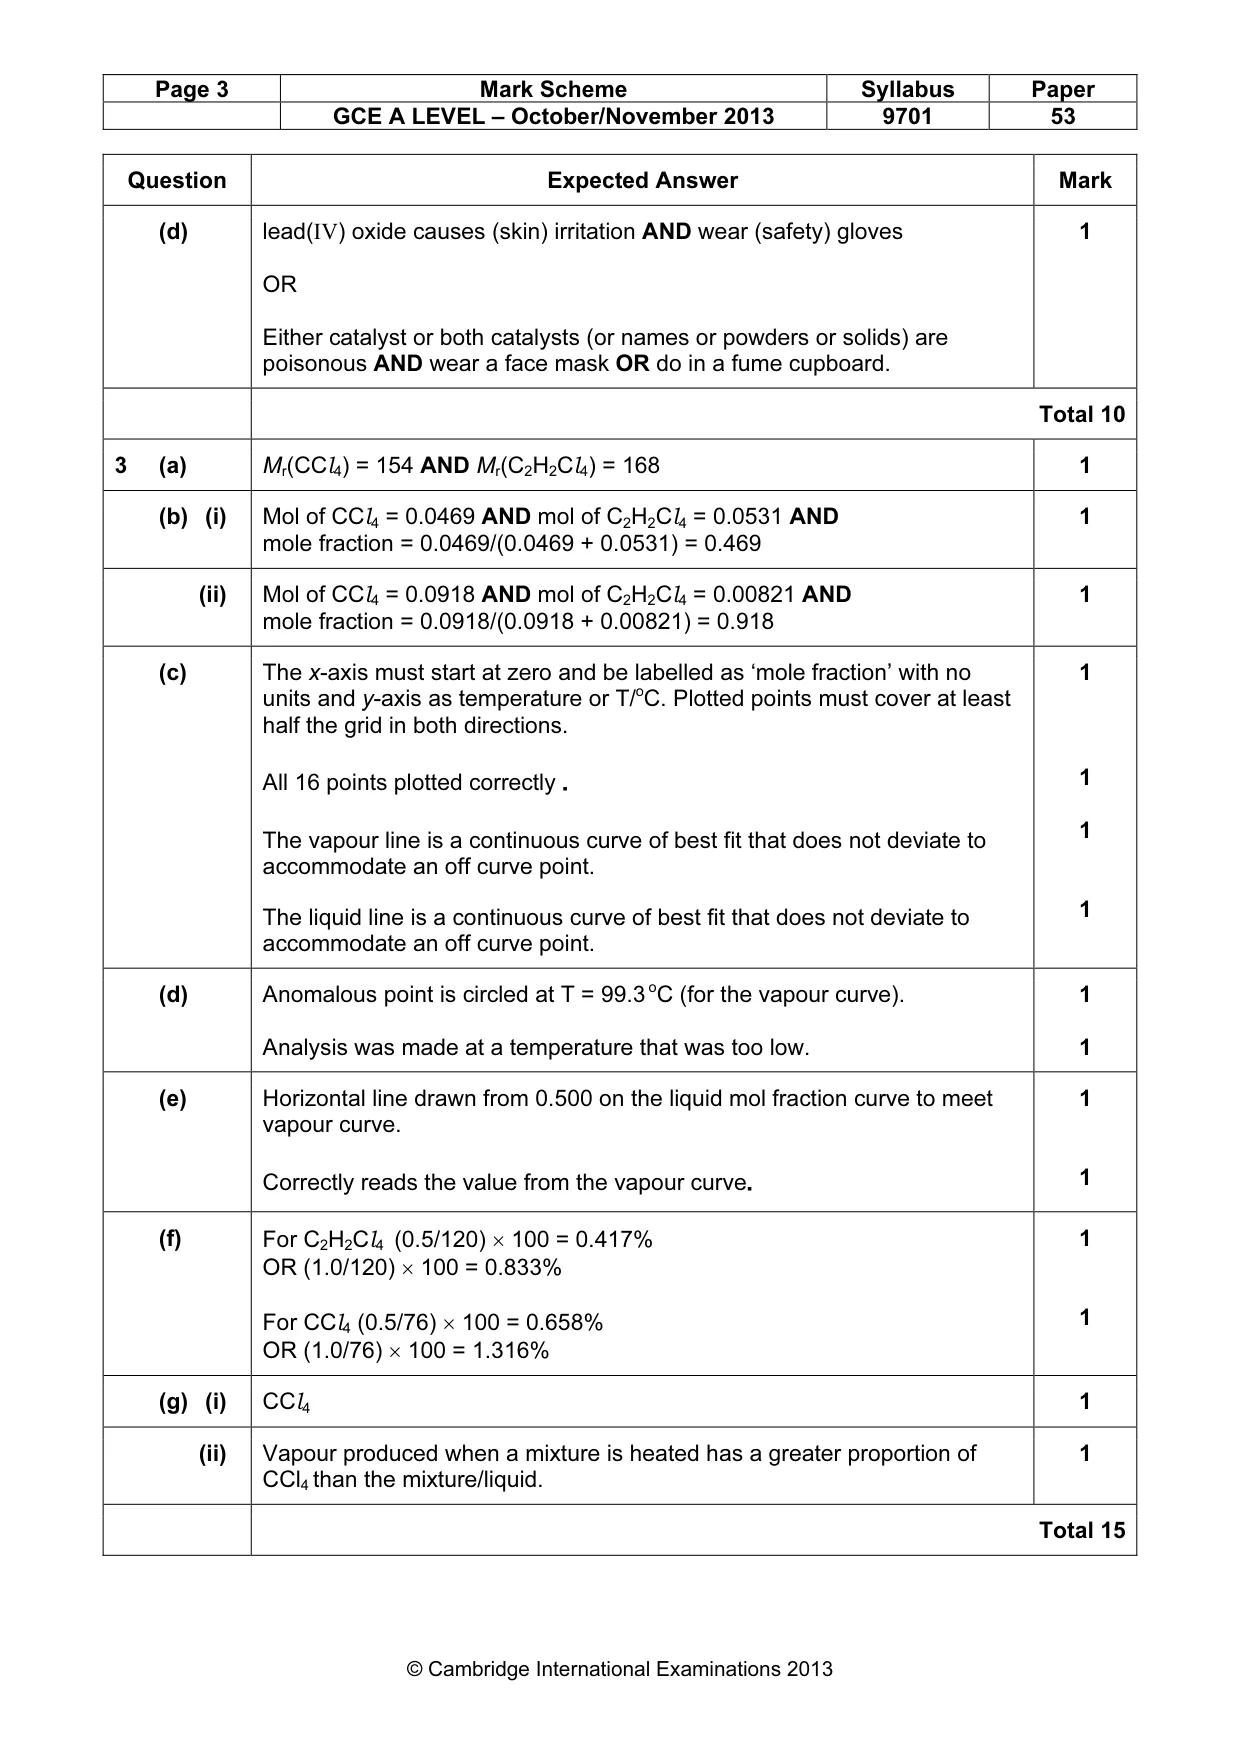
Page 3 Mark Scheme Syllabus Paper GCE A LEVEL – October/November 2013 9701 53 © Cambridge International Examinations 2013 Question Expected Answer Mark (d) lead(IV) oxide causes (skin) irritation AND wear (safety) gloves OR Either catalyst or both catalysts (or names or powders or solids) are poisonous AND wear a face mask OR do in a fume cupboard. 1 Total 10 3 (a) Mr(CCl4) = 154 AND Mr(C2H2Cl4) = 168 1 (b) (i) Mol of CCl4 = 0.0469 AND mol of C2H2Cl4 = 0.0531 AND mole fraction = 0.0469/(0.0469 + 0.0531) = 0.469 1 (ii) Mol of CCl4 = 0.0918 AND mol of C2H2Cl4 = 0.00821 AND mole fraction = 0.0918/(0.0918 + 0.00821) = 0.918 1 (c) The x-axis must start at zero and be labelled as ‘mole fraction’ with no units and y-axis as temperature or T/oC. Plotted points must cover at least half the grid in both directions. All 16 points plotted correctly . The vapour line is a continuous curve of best fit that does not deviate to accommodate an off curve point. The liquid line is a continuous curve of best fit that does not deviate to accommodate an off curve point. 1 1 1 1 (d) Anomalous point is circled at T = 99.3 oC (for the vapour curve). Analysis was made at a temperature that was too low. 1 1 (e) Horizontal line drawn from 0.500 on the liquid mol fraction curve to meet vapour curve. Correctly reads the value from the vapour curve. 1 1 (f) For C2H2Cl4 (0.5/120) × 100 = 0.417% OR (1.0/120) × 100 = 0.833% For CCl4 (0.5/76) × 100 = 0.658% OR (1.0/76) × 100 = 1.316% 1 1 (g) (i) CCl4 1 (ii) Vapour produced when a mixture is heated has a greater proportion of CCl4 than the mixture/liquid. 1 Total 15
What you needed in this session
Cambridge’s own grade thresholds for 2013 Oct/Nov, Paper 5 · Variant 3. A higher threshold means an easier paper — the bar moves with how the cohort did.