Cambridge A Level Chemistry 9701 — 2023 Oct/Nov Paper 5 · Variant 1
9701/51/O/N/23 · 2 questions · 30 marks · ≈34 min
The question paper and its mark scheme, free to read here and free to download. This is Cambridge’s own paper, exactly as it was sat.
Question paper12 pages
Mark scheme11 pages
Answers below. Sit the paper first if you are practising.
Questions as text
Q1 · The concentration of dissolved oxygen in a sample of water can be measured using the…
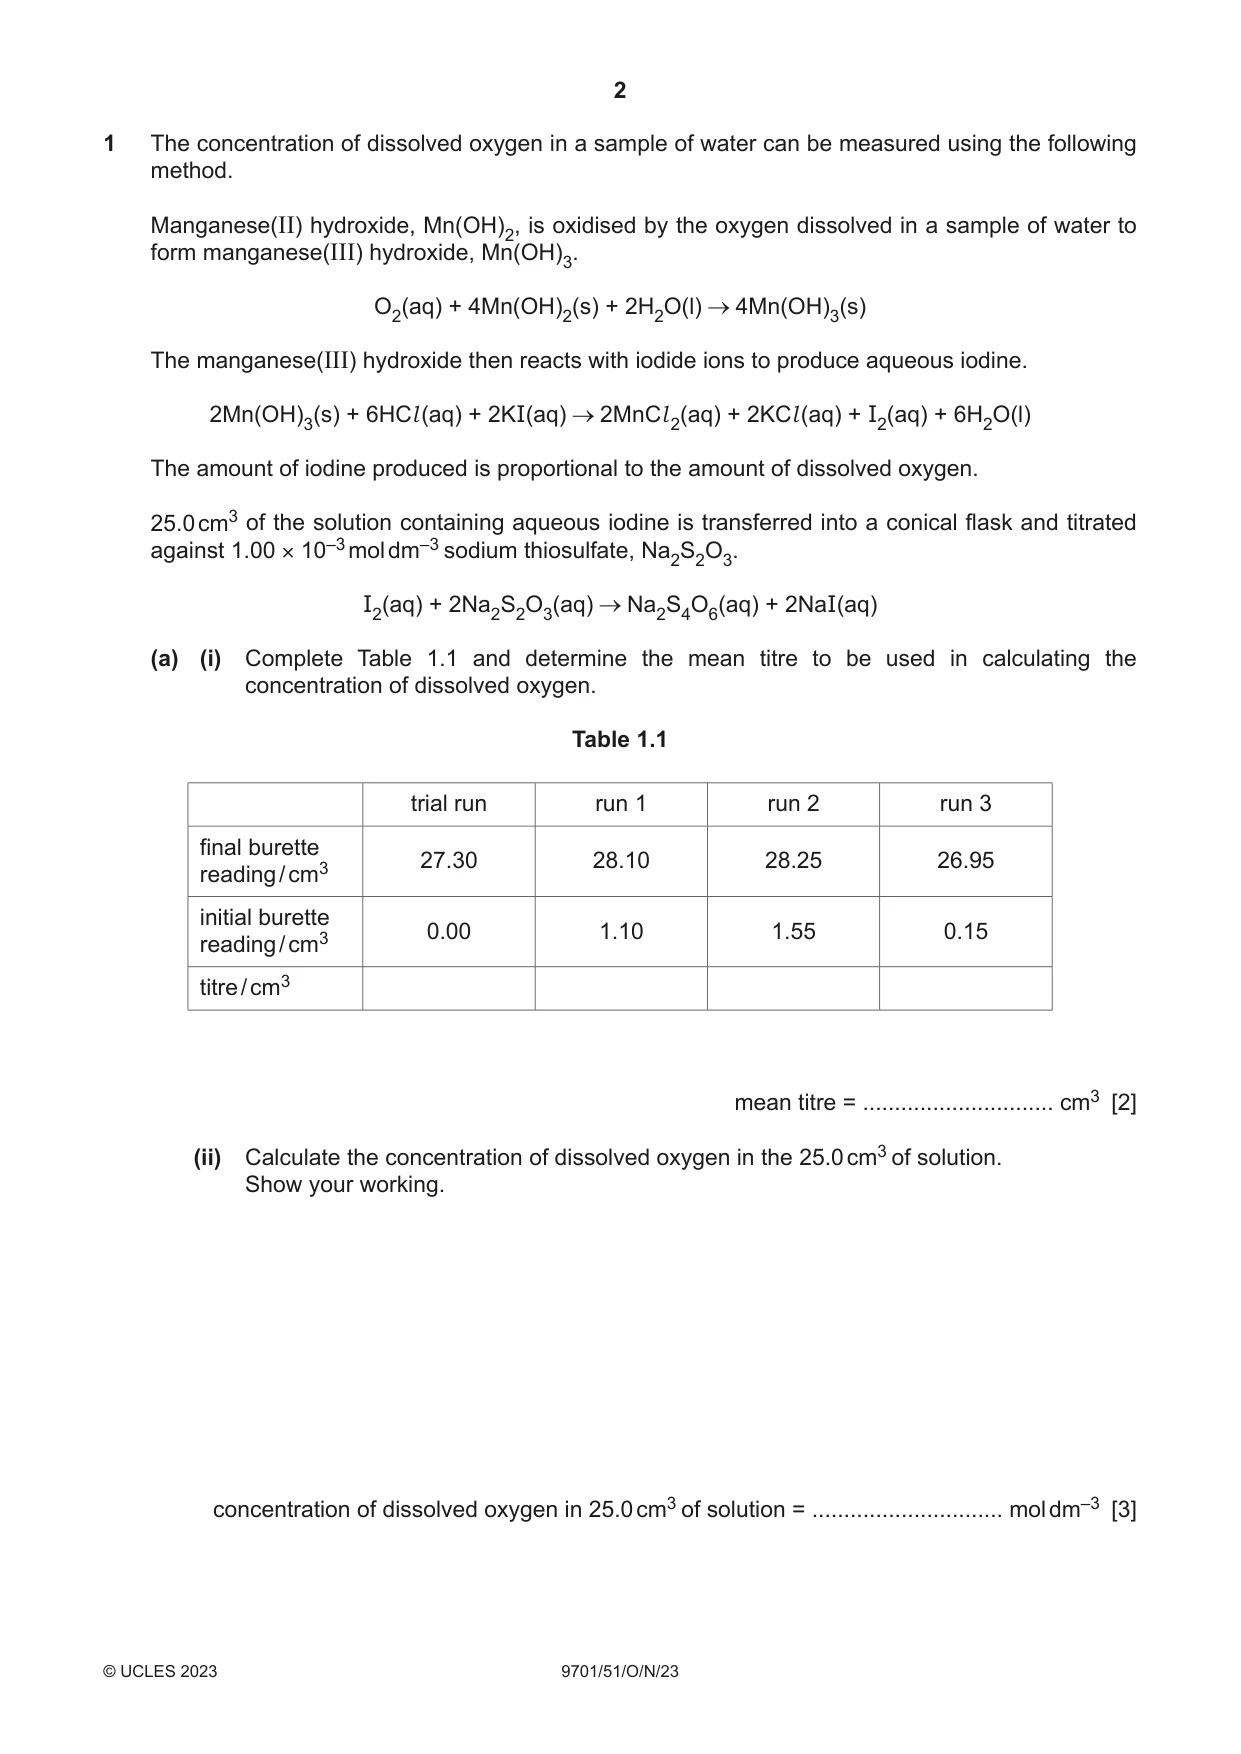
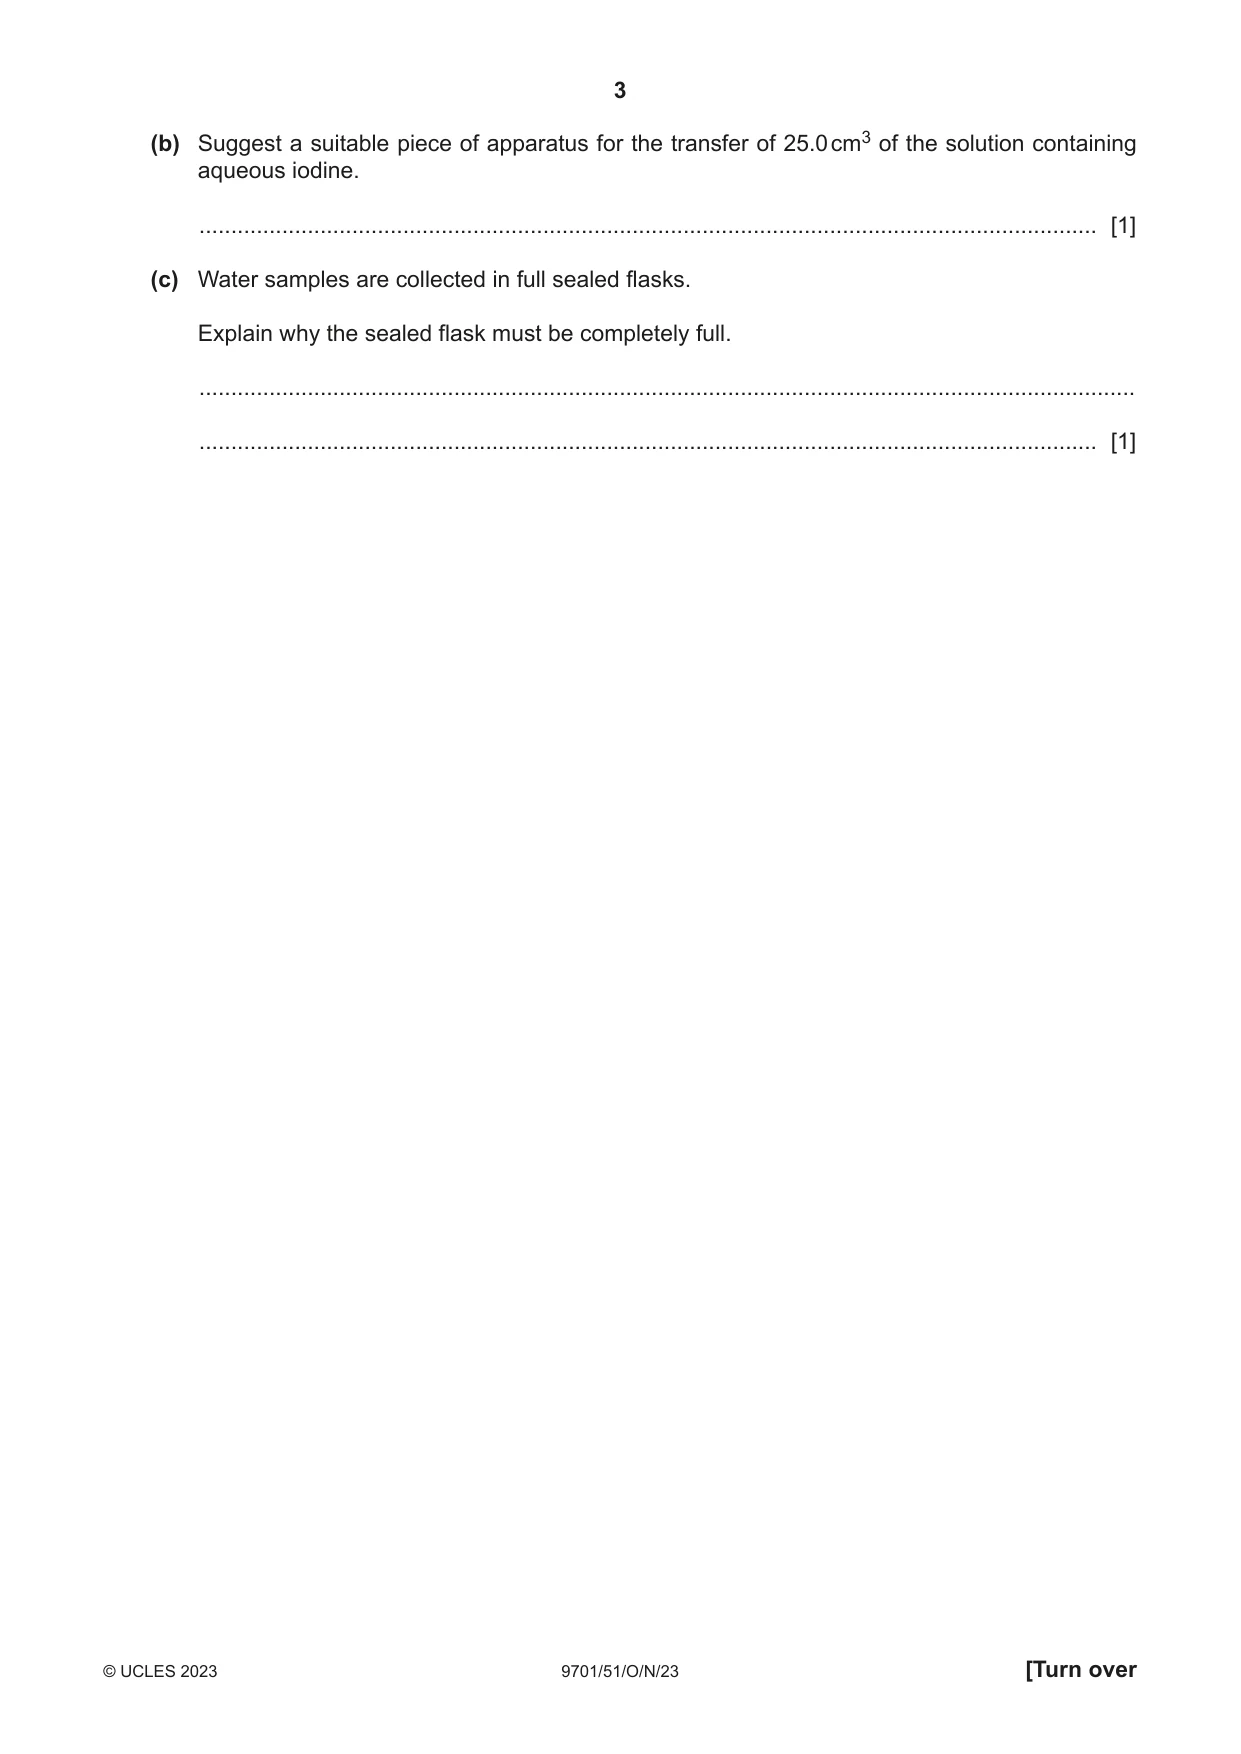
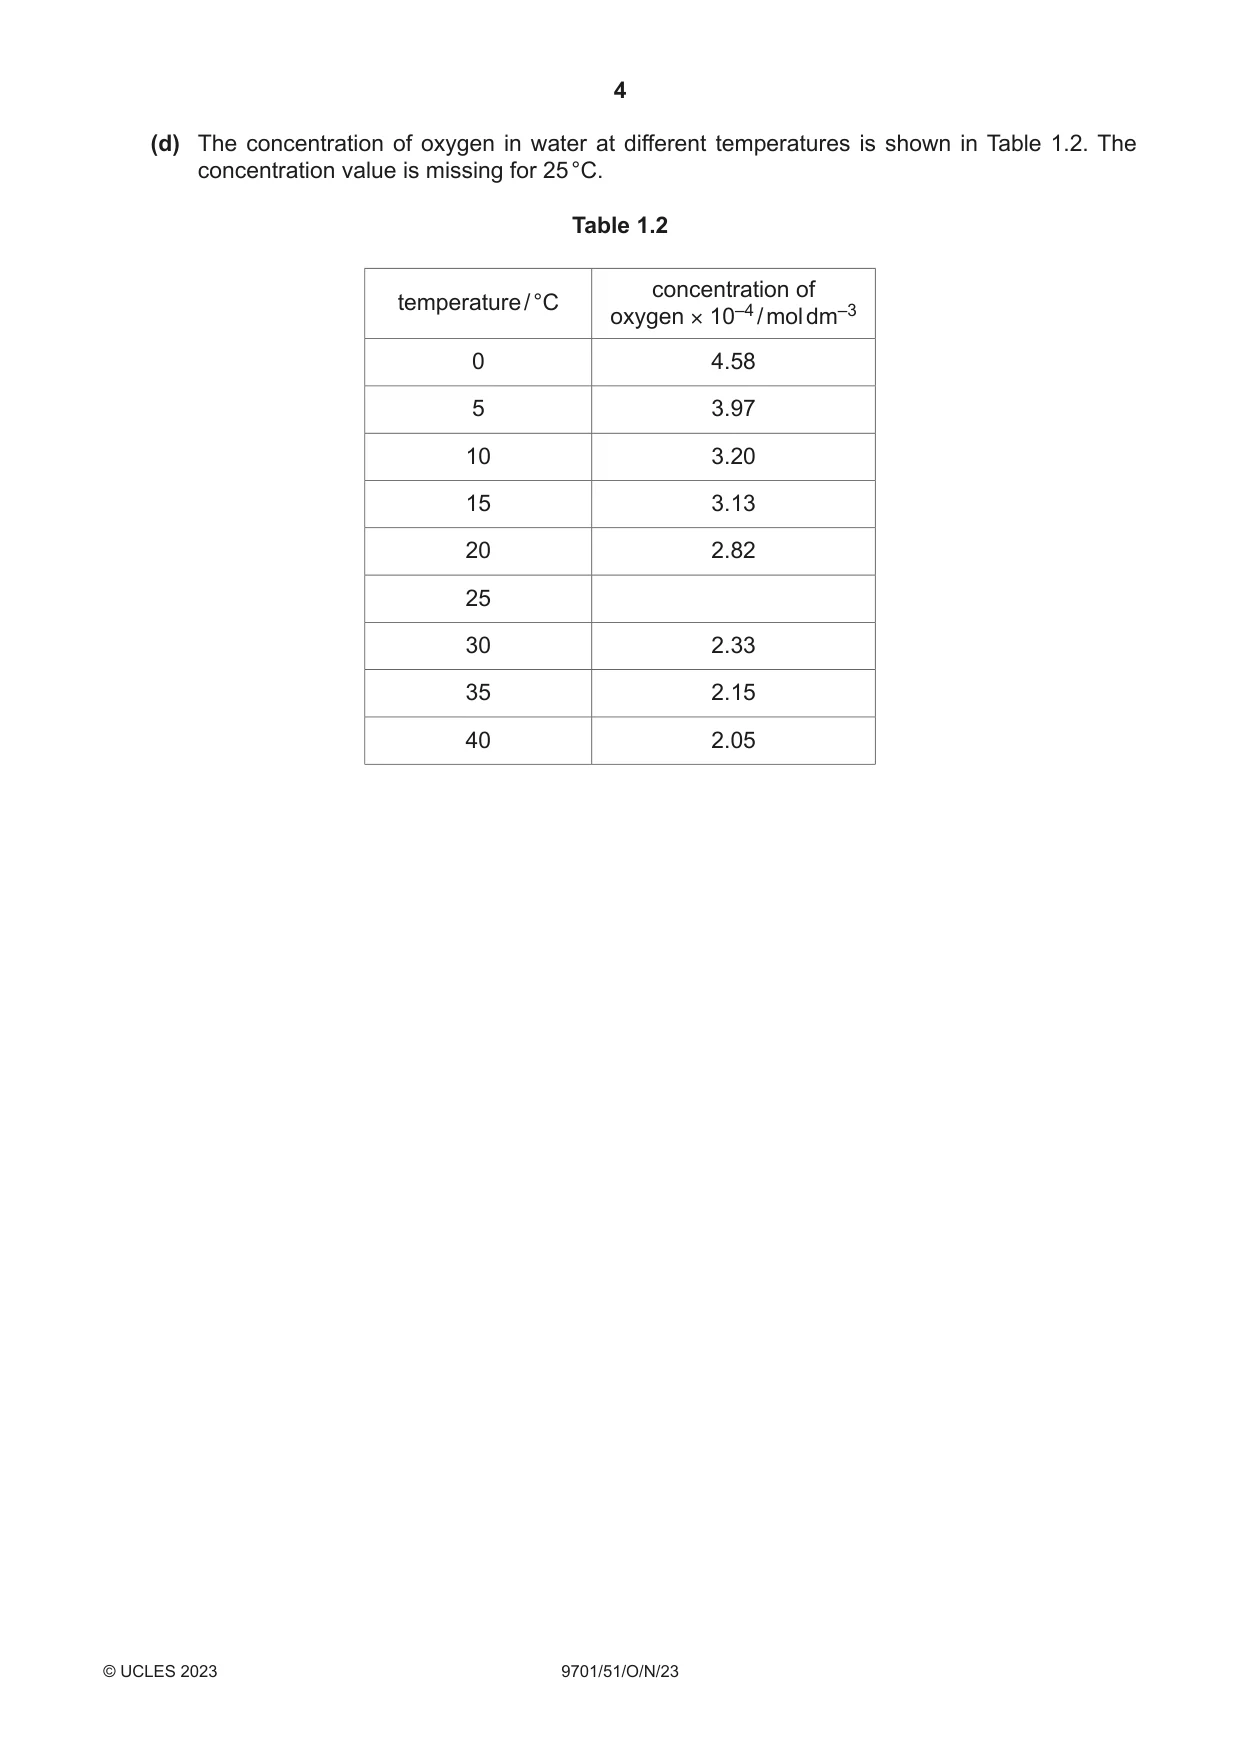
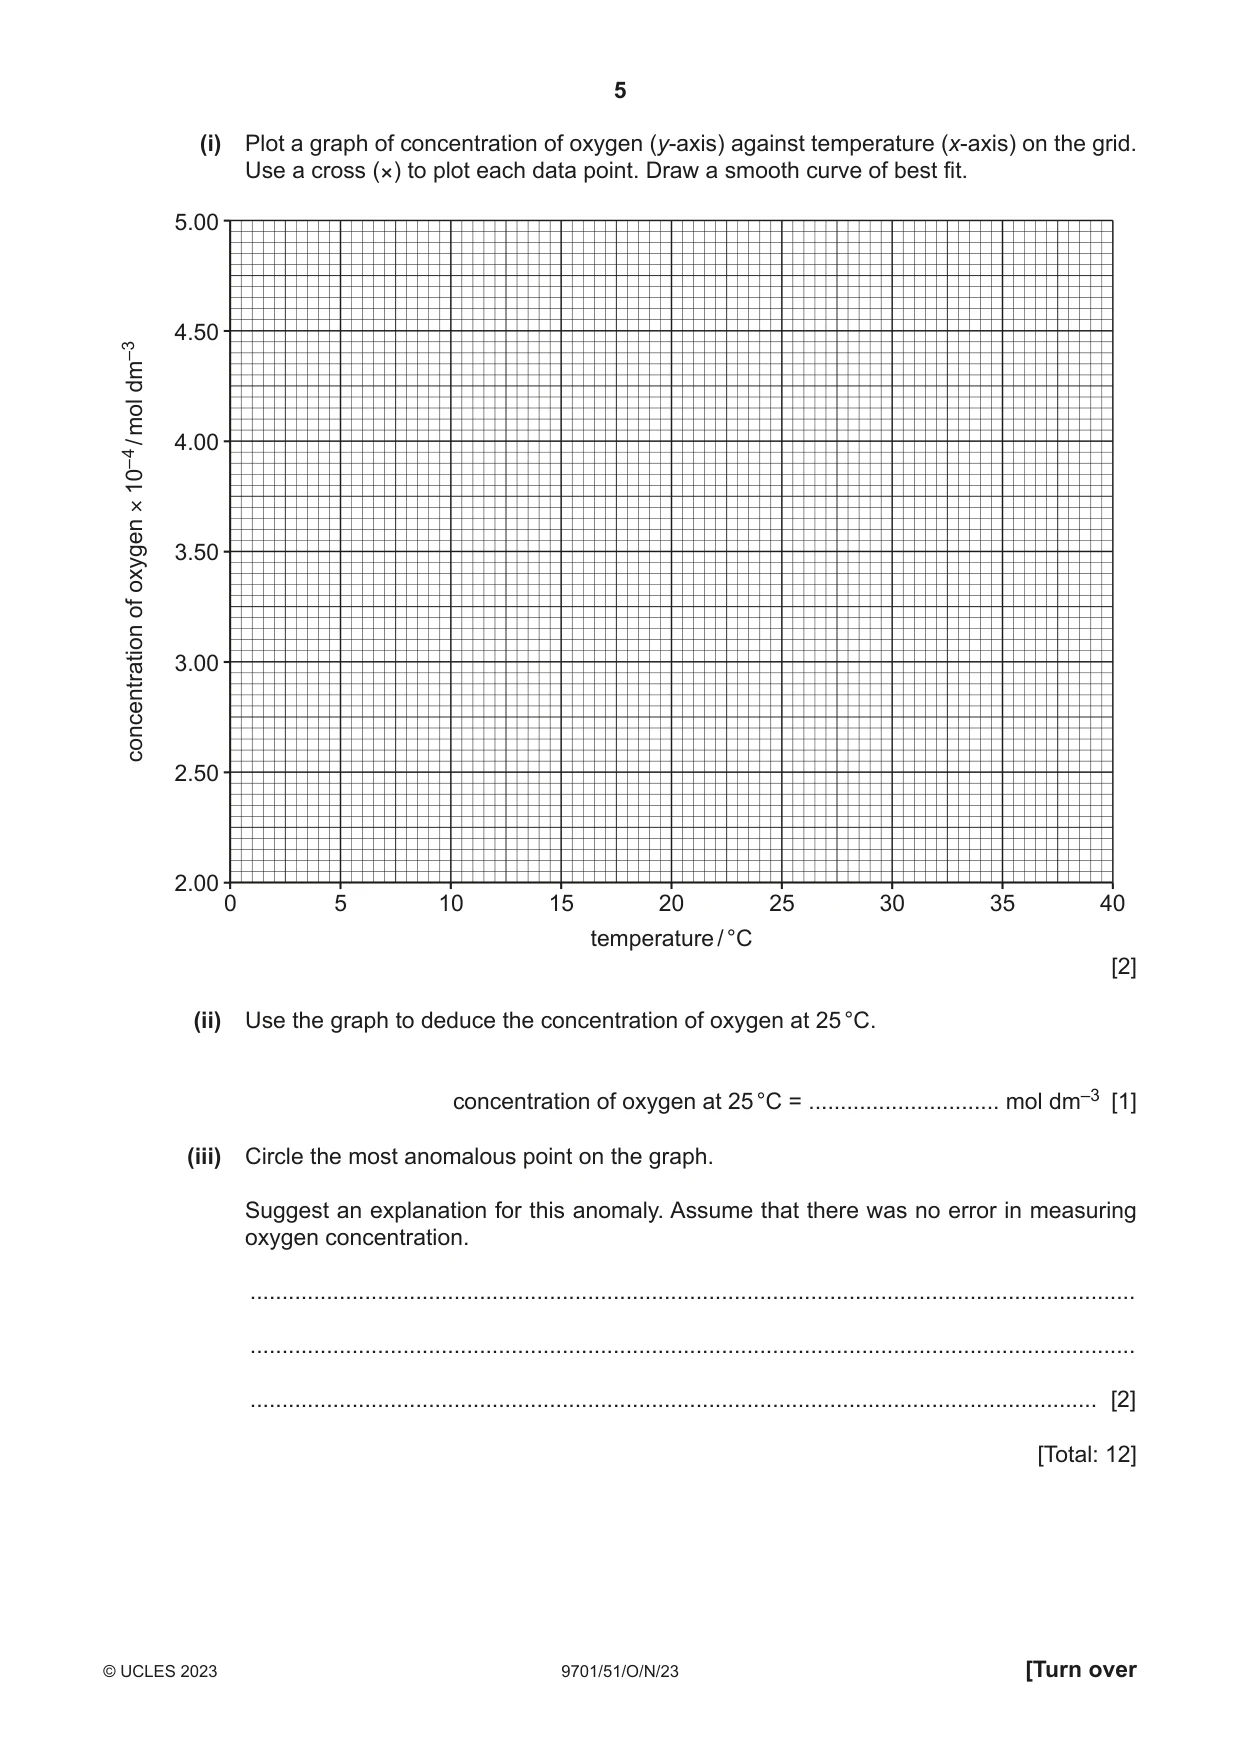
1 The concentration of dissolved oxygen in a sample of water can be measured using the following method. Manganese(II) hydroxide, Mn(OH)2, is oxidised by the oxygen dissolved in a sample of water to form manganese(III) hydroxide, Mn(OH)3. O2(aq) + 4Mn(OH)2(s) + 2H2O(l) 4Mn(OH)3(s) The manganese(III) hydroxide then reacts with iodide ions to produce aqueous iodine. 2Mn(OH)3(s) + 6HCl (aq) + 2KI(aq) 2MnCl 2(aq) + 2KCl (aq) + I2(aq) + 6H2O(l) The amount of iodine produced is proportional to the amount of dissolved oxygen. 25.0 cm3 of the solution containing aqueous iodine is transferred into a conical flask and titrated against 1.00 × 10⁻³ mol dm–3 sodium thiosulfate, Na2S2O3. I2(aq) + 2Na2S2O3(aq) Na2S4O6(aq) + 2NaI(aq) (a) (i) Complete Table 1.1 and determine the mean titre to be used in calculating the concentration of dissolved oxygen. Table 1.1 trial run run 1 run 2 run 3 final burette 27.30 28.10 28.25 26.95 reading / cm3 initial burette 0.00 1.10 1.55 0.15 reading / cm3 titre / cm3 mean titre = .............................. cm3 [2] (ii) Calculate the concentration of dissolved oxygen in the 25.0 cm3 of solution. Show your working. concentration of dissolved oxygen in 25.0 cm3 of solution = .............................. mol dm–3 [3] (b) Suggest a suitable piece of apparatus for the transfer of 25.0 cm3 of the solution containing aqueous iodine. ............................................................................................................................................. [1] (c) Water samples are collected in full sealed flasks. Explain why the sealed flask must be completely full. ................................................................................................................................................... ............................................................................................................................................. [1] (d) The concentration of oxygen in water at different temperatures is shown in Table 1.2. The concentration value is missing for 25 °C. Table 1.2 concentration of temperature / °C oxygen × 10–4 / mol dm–3 0 4.58 5 3.97 10 3.20 15 3.13 20 2.82 25 30 2.33 35 2.15 40 2.05 (i) Plot a graph of concentration of oxygen (y-axis) against temperature (x-axis) on the grid. Use a cross (×) to plot each data point. Draw a smooth curve of best fit. 5.00 4.50 dm–3 mol / 4.00 10–4 × 3.50oxygen of 3.00 concentration 2.50 2.00 0 5 10 15 20 25 30 35 40 temperature / °C [2] (ii) Use the graph to deduce the concentration of oxygen at 25 °C. concentration of oxygen at 25 °C = .............................. mol dm–3 [1] (iii) Circle the most anomalous point on the graph. Suggest an explanation for this anomaly. Assume that there was no error in measuring oxygen concentration. ........................................................................................................................................... ........................................................................................................................................... ..................................................................................................................................... [2] [Total: 12]
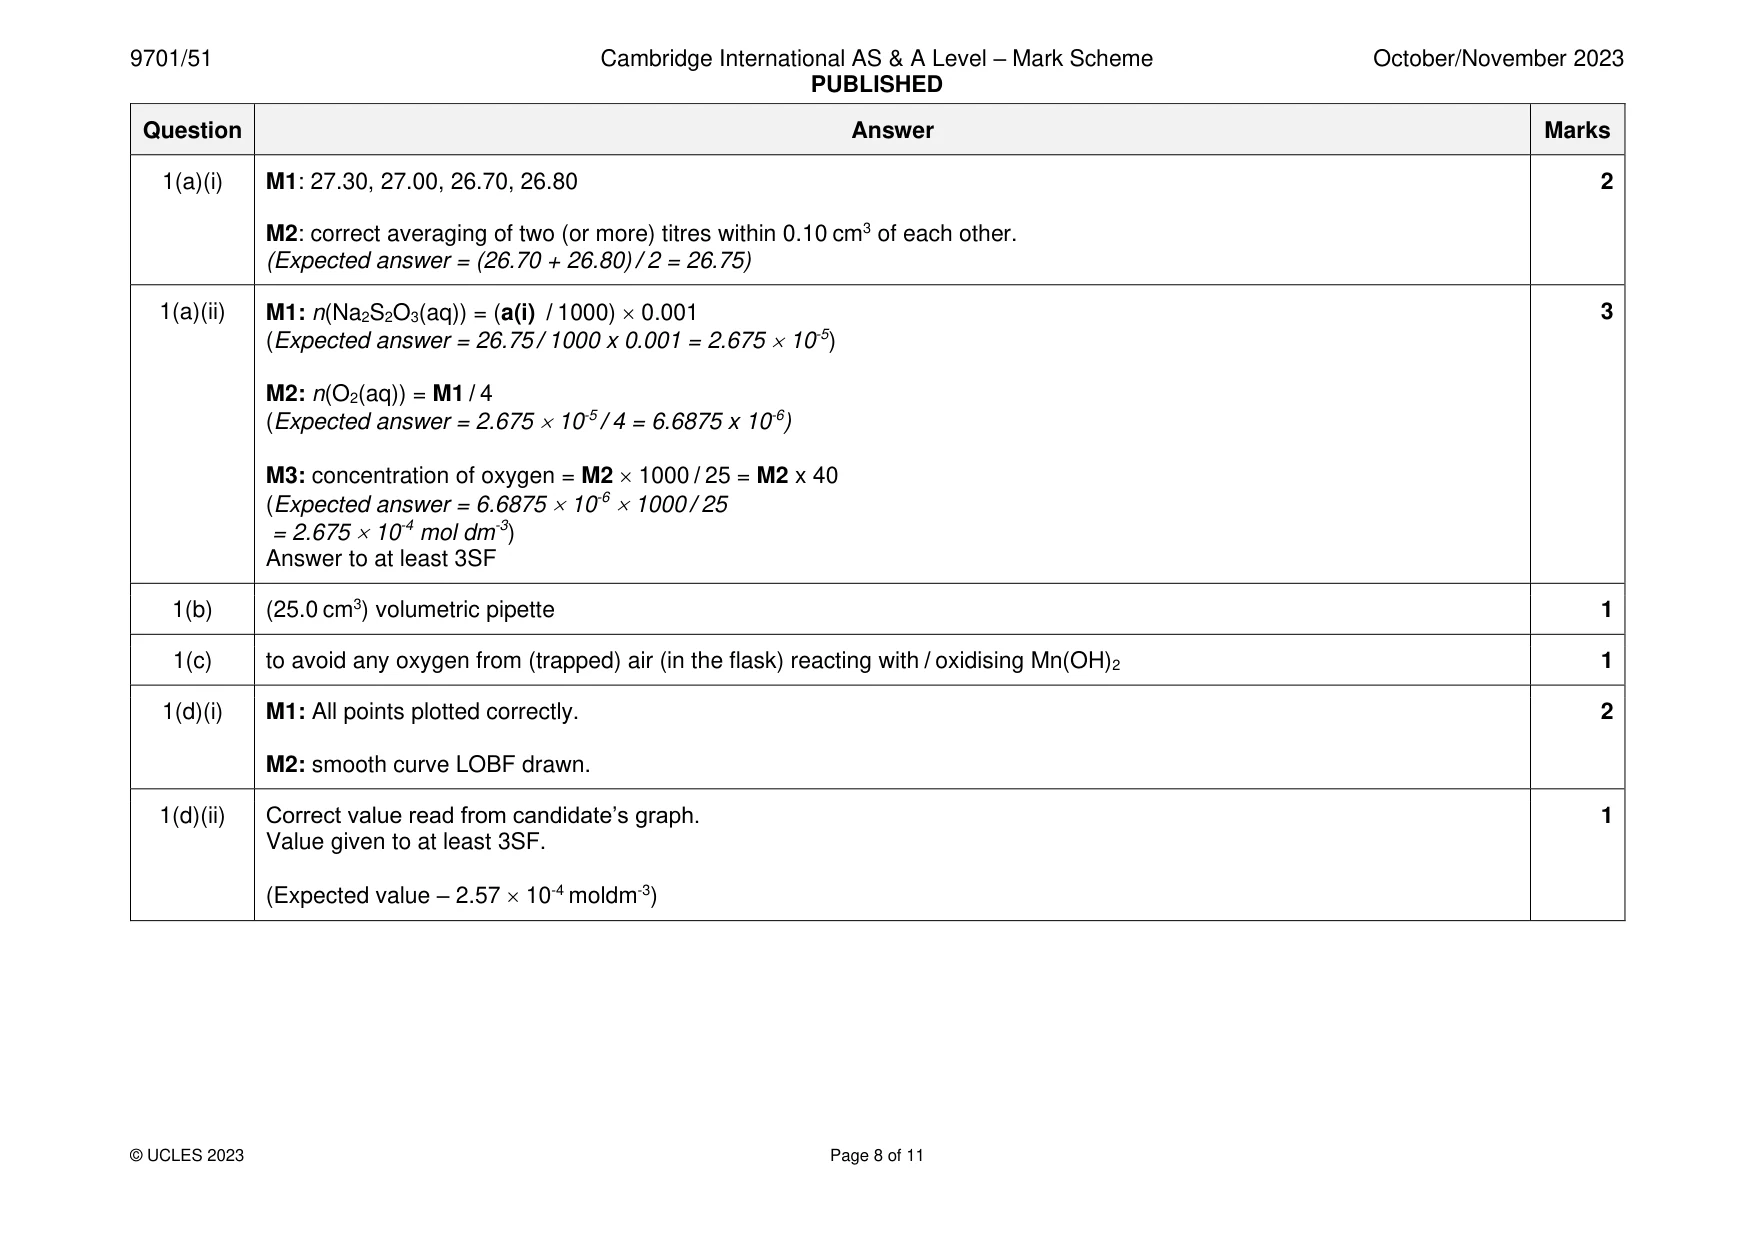
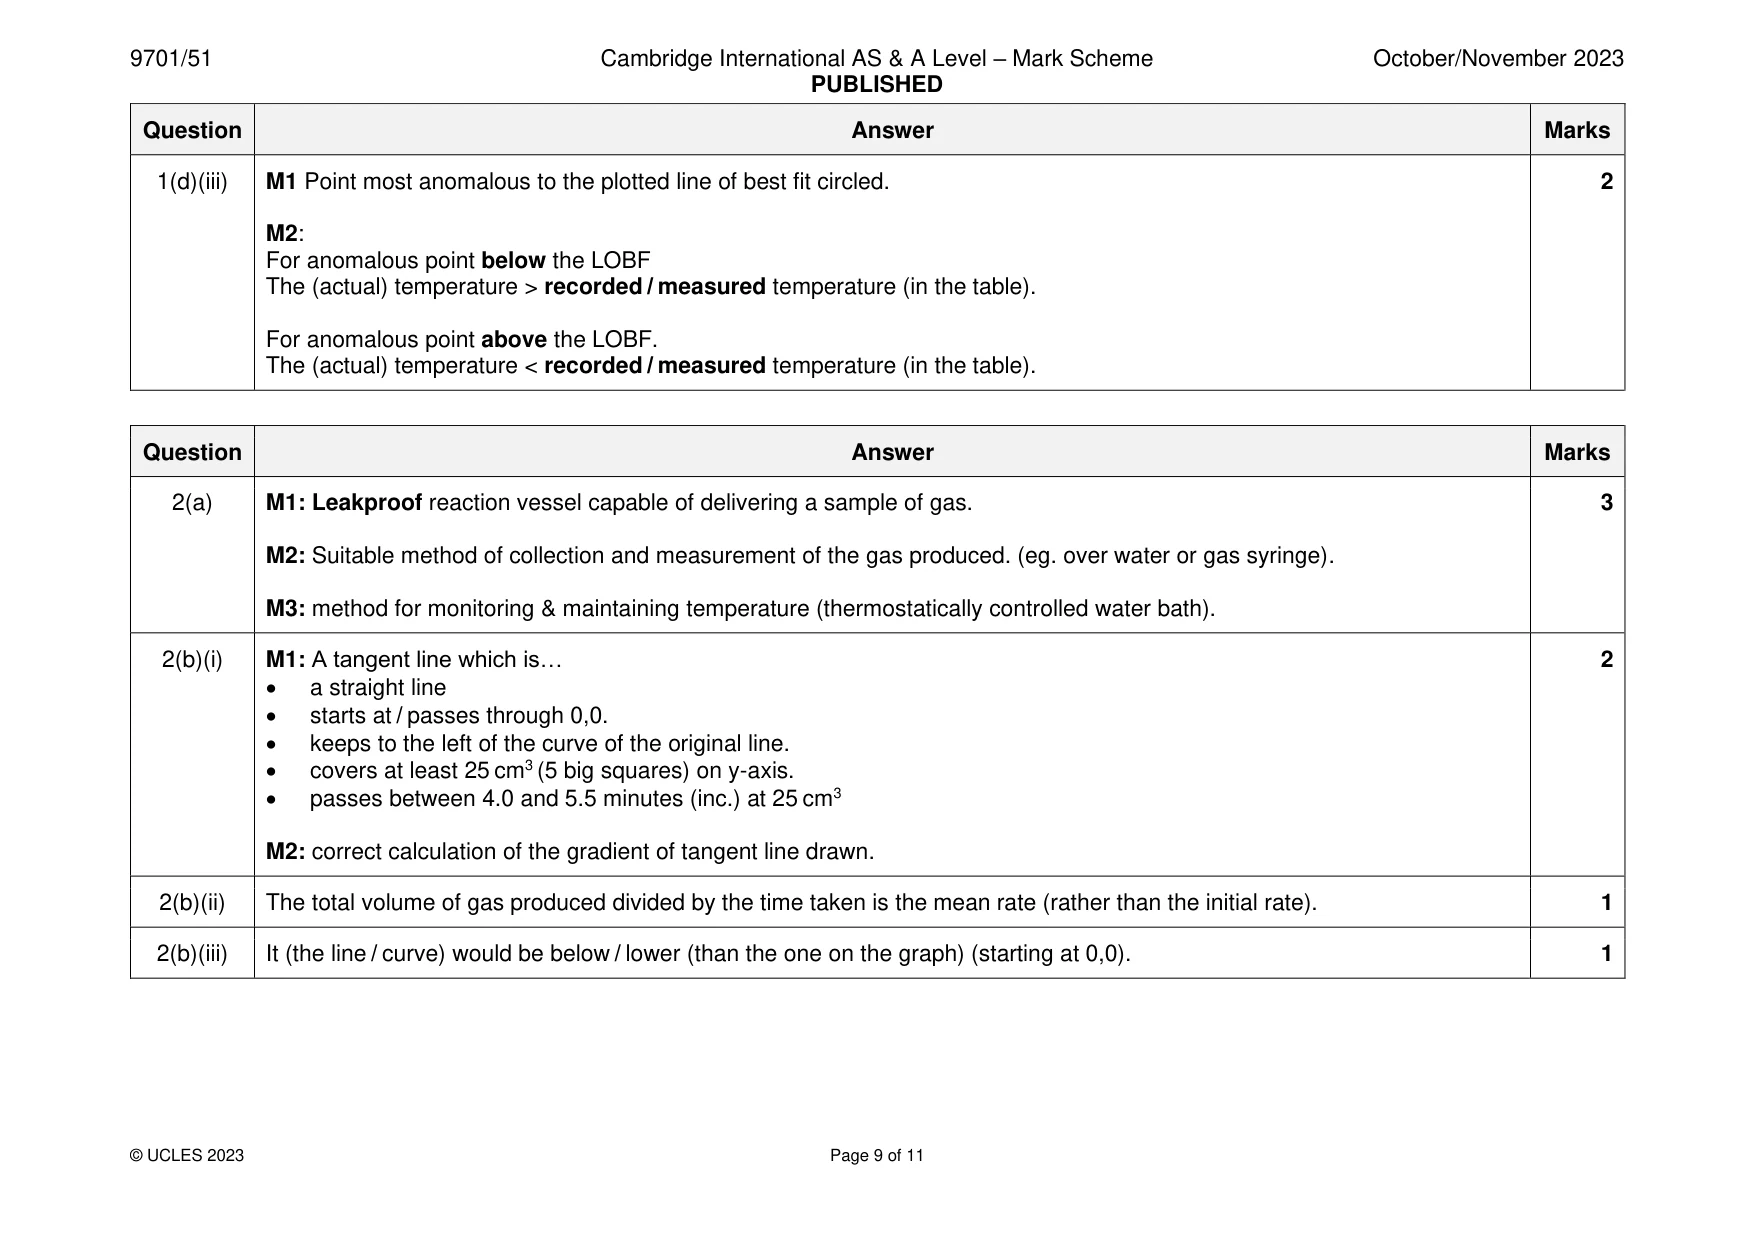
Mark scheme: Question Answer Marks 1(a)(i) M1: 27.30, 27.00, 26.70, 26.80 2 M2: correct averaging of two (or more) titres within 0.10 cm3 of each other. (Expected answer = (26.70 + 26.80) / 2 = 26.75) 1(a)(ii) M1: n(Na2S2O3(aq)) = (a(i) / 1000) 0.001 3 (Expected answer = 26.75 / 1000 x 0.001 = 2.675 10-5) M2: n(O2(aq)) = M1 / 4 (Expected answer = 2.675 10-5 / 4 = 6.6875 x 10⁻⁶) M3: concentration of oxygen = M2 1000 / 25 = M2 x 40 (Expected answer = 6.6875 10-6 1000 / 25 = 2.675 10-4 mol dm-3) Answer to at least 3SF 1(b) (25.0 cm3) volumetric pipette 1 1(c) to avoid any oxygen from (trapped) air (in the flask) reacting with / oxidising Mn(OH)2 1 1(d)(i) M1: All points plotted correctly. 2 M2: smooth curve LOBF drawn. 1(d)(ii) Correct value read from candidate’s graph. 1 Value given to at least 3SF. (Expected value – 2.57 10-4 moldm-3) 1(d)(iii) M1 Point most anomalous to the plotted line of best fit circled. 2 M2: For anomalous point below the LOBF The (actual) temperature > recorded / measured temperature (in the table). For anomalous point above the LOBF. The (actual) temperature < recorded / measured temperature (in the table).
More questions on Reacting masses and volumes (of solutions and gases)
Q2 · Benzenediazonium chloride, C6H5N2Cl , decomposes in water as shown in the following…
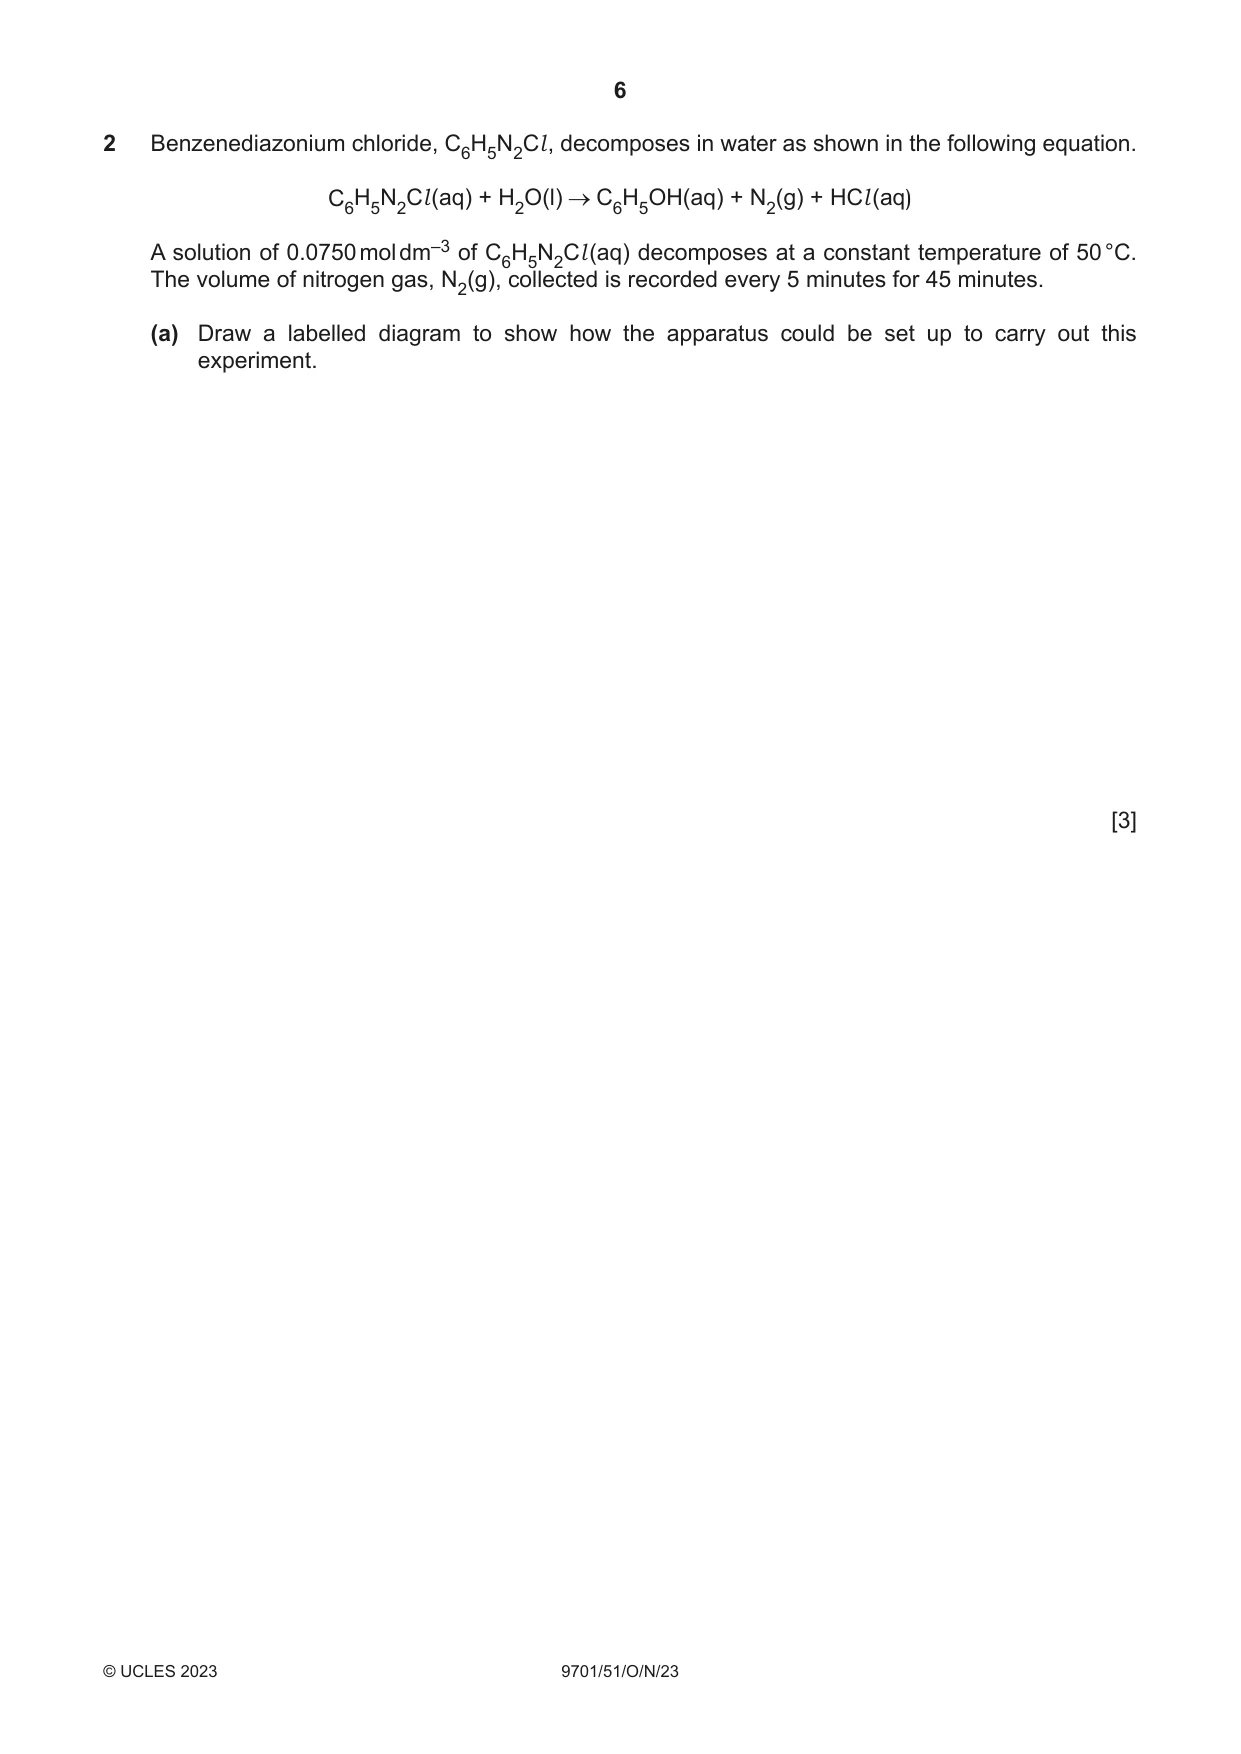
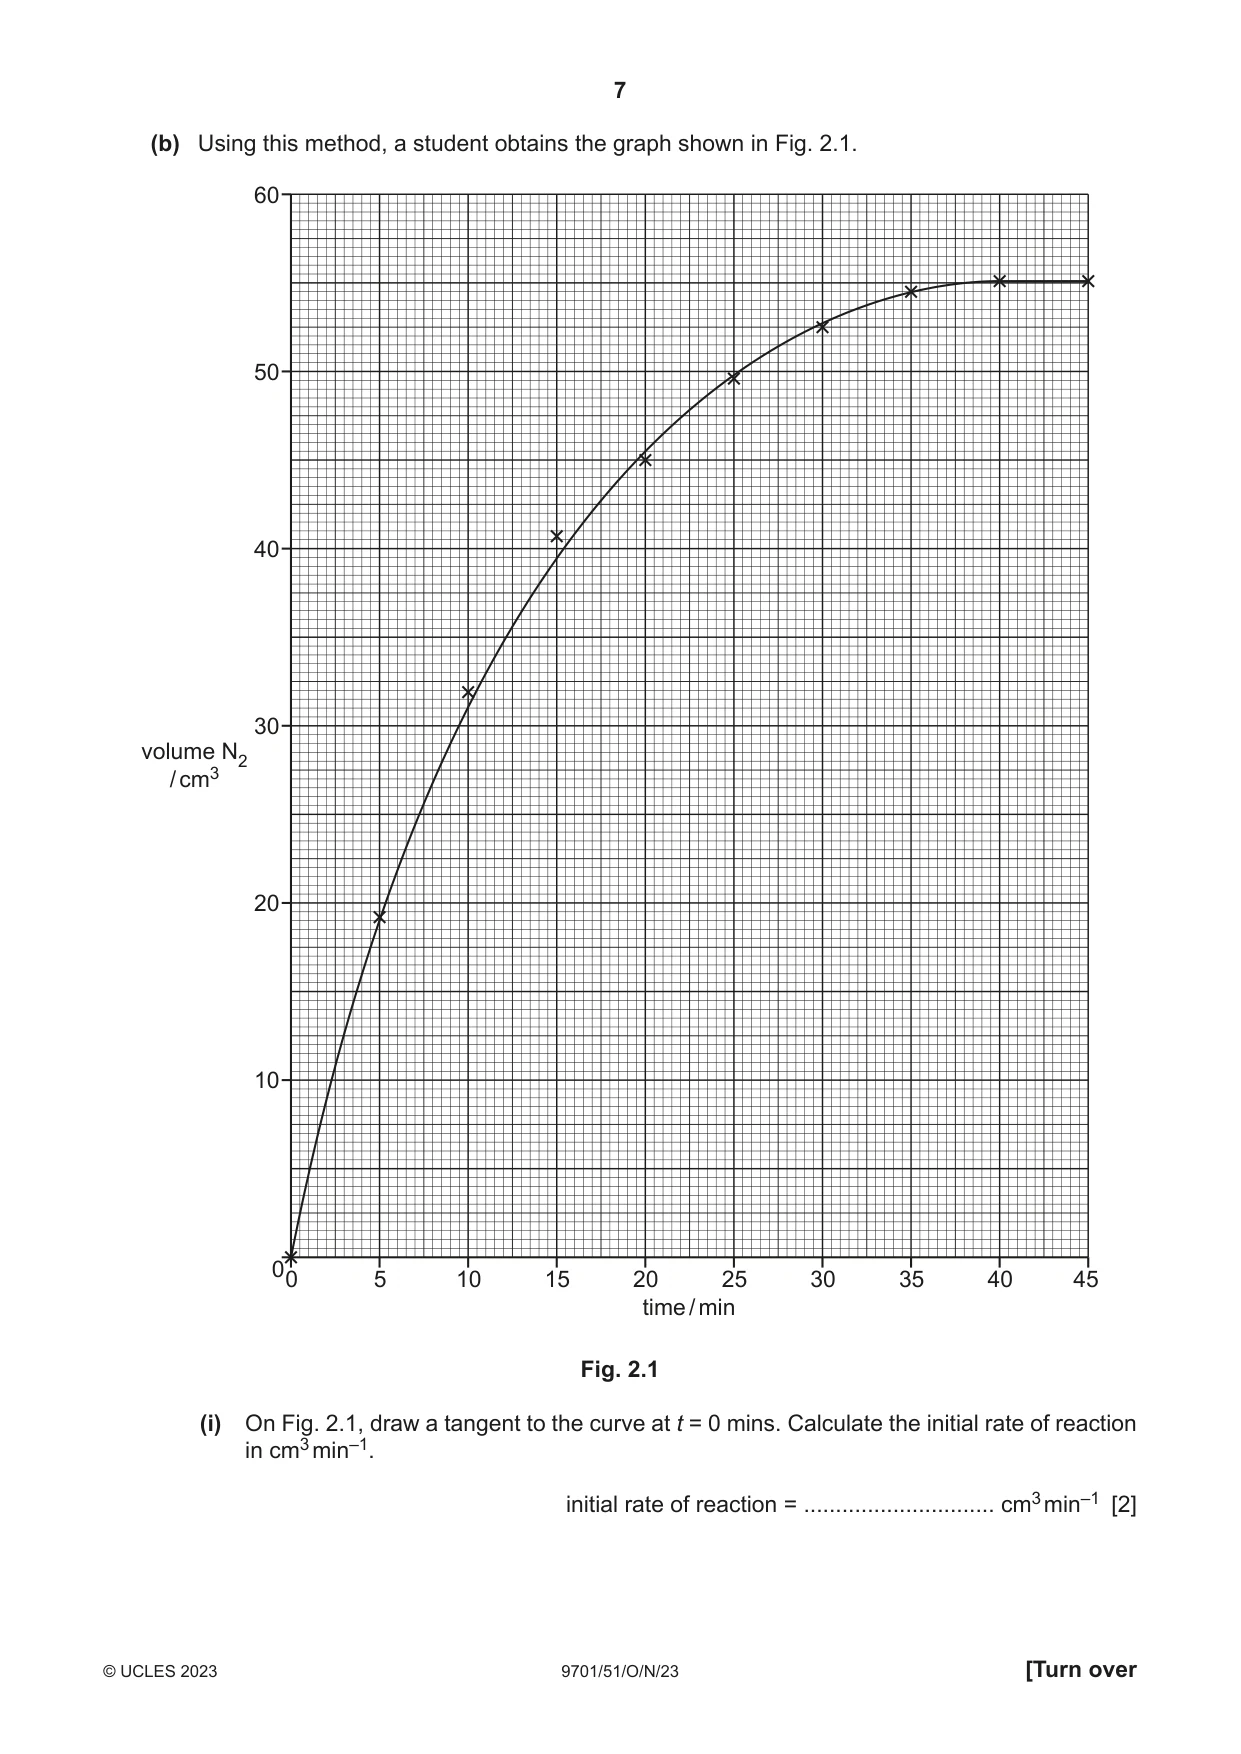
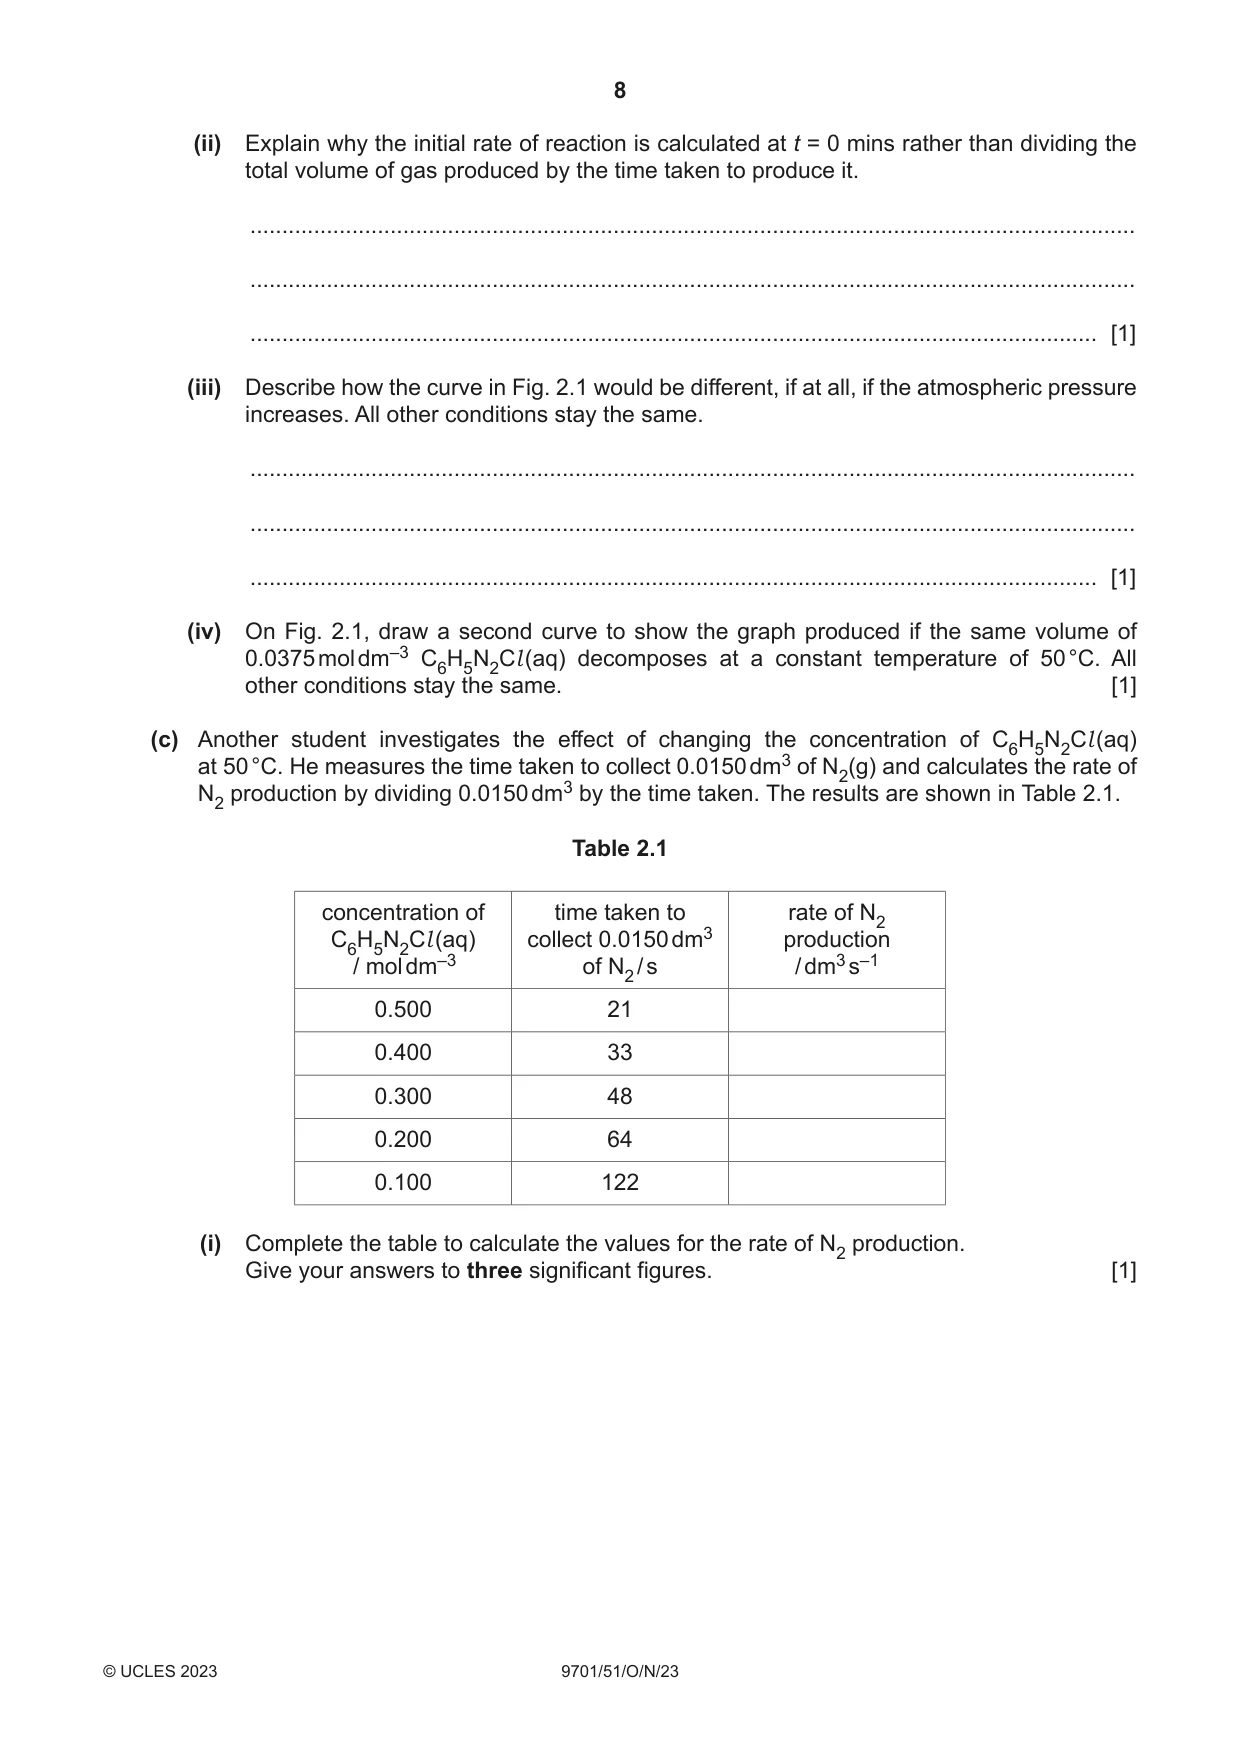
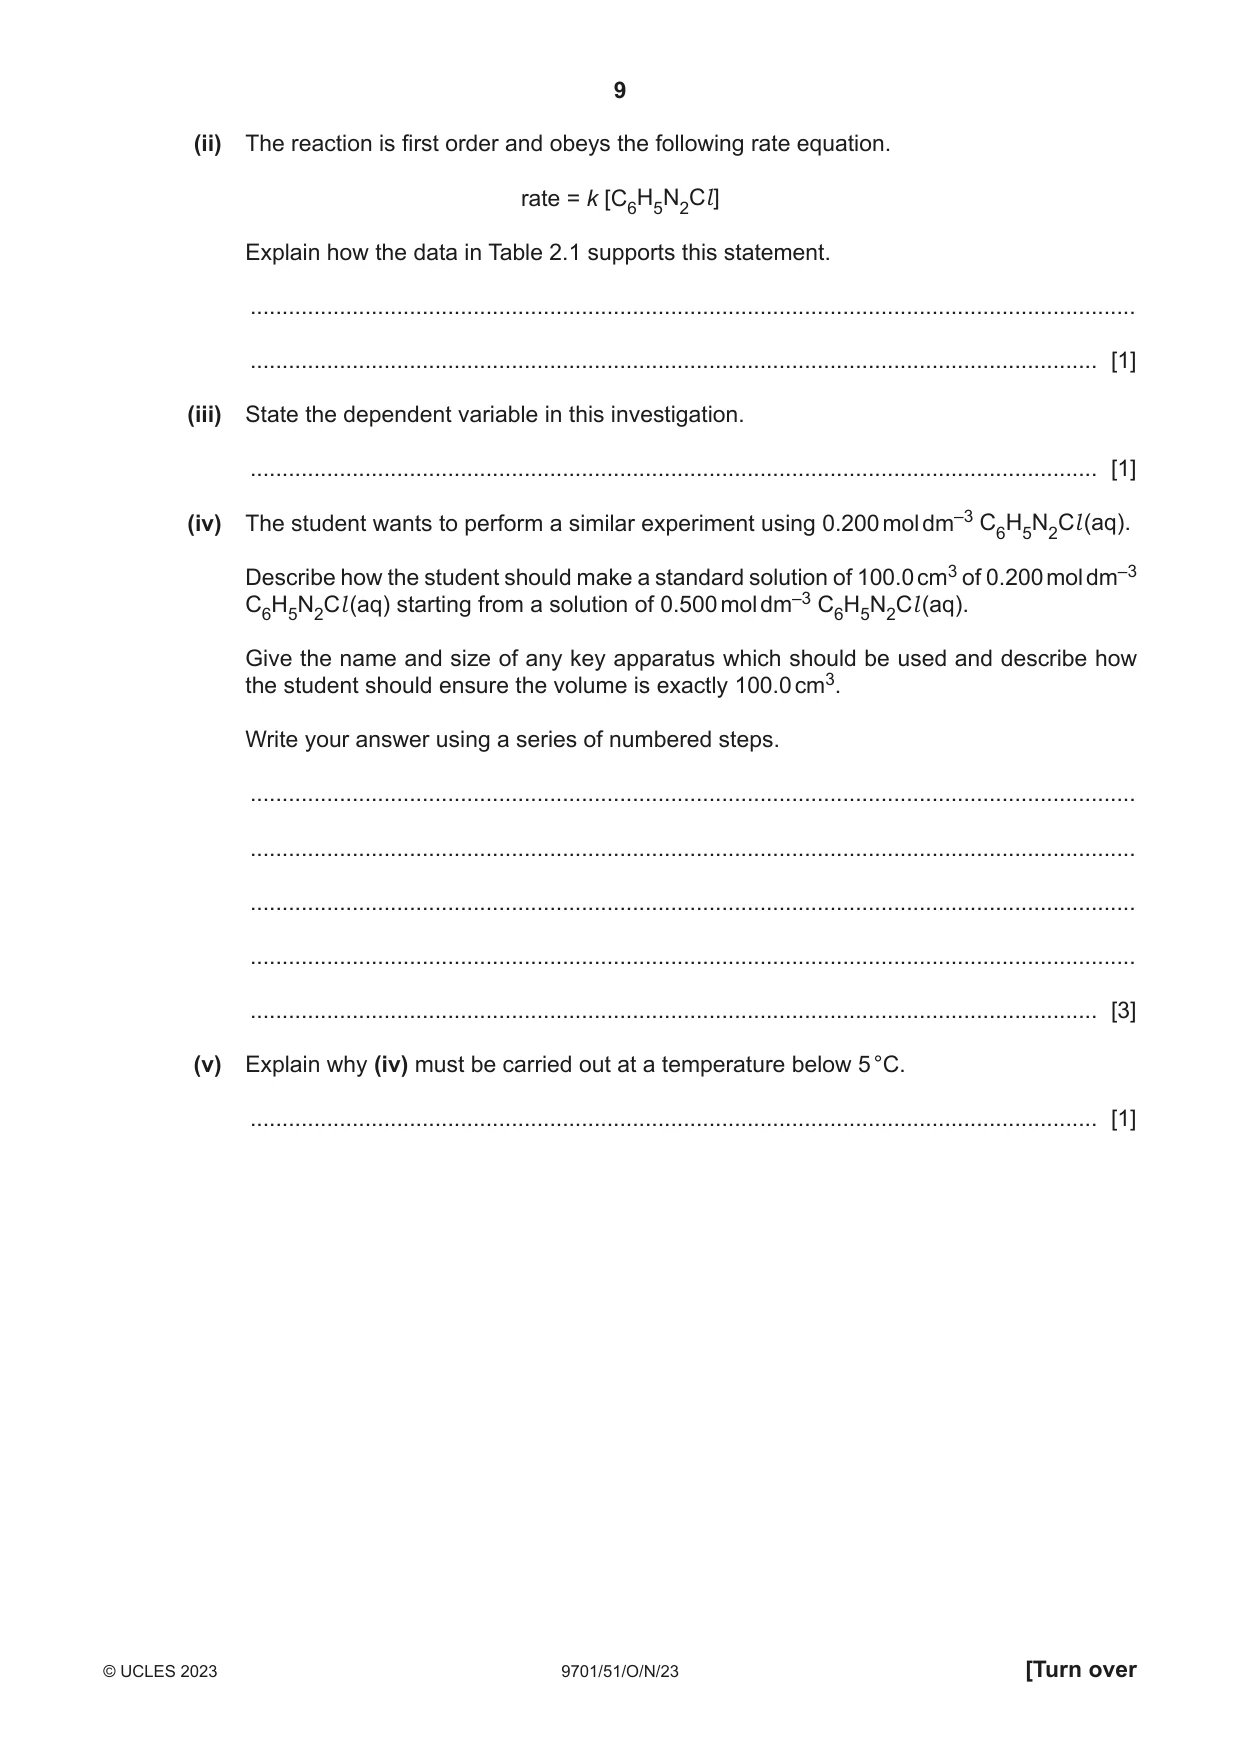
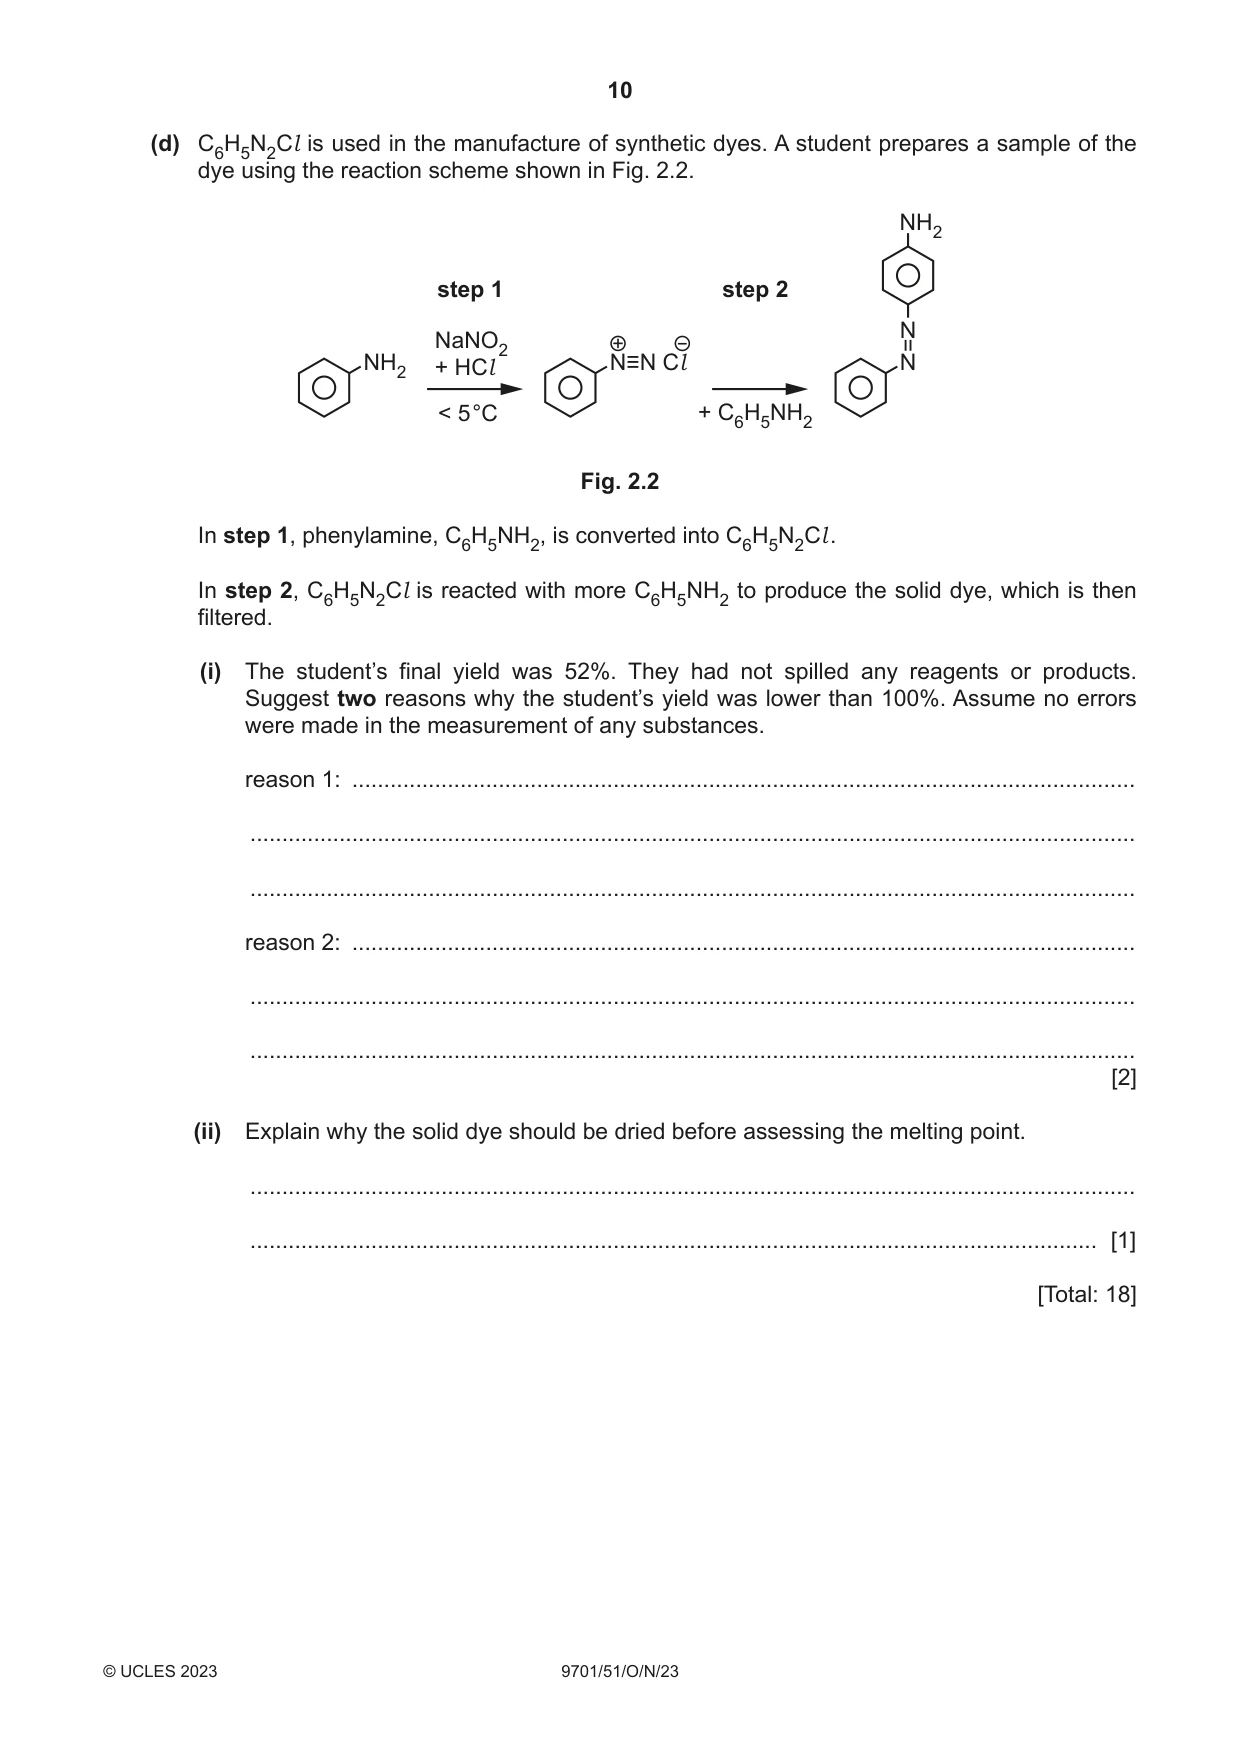
2 Benzenediazonium chloride, C6H5N2Cl , decomposes in water as shown in the following equation. C6H5N2Cl (aq) + H2O(l) C6H5OH(aq) + N2(g) + HCl (aq) A solution of 0.0750 mol dm–3 of C6H5N2Cl (aq) decomposes at a constant temperature of 50 °C. The volume of nitrogen gas, N2(g), collected is recorded every 5 minutes for 45 minutes. (a) Draw a labelled diagram to show how the apparatus could be set up to carry out this experiment. [3] (ii) Explain why the initial rate of reaction is calculated at t = 0 mins rather than dividing the total volume of gas produced by the time taken to produce it. ........................................................................................................................................... ........................................................................................................................................... ..................................................................................................................................... [1] (iii) Describe how the curve in Fig. 2.1 would be different, if at all, if the atmospheric pressure increases. All other conditions stay the same. ........................................................................................................................................... ........................................................................................................................................... ..................................................................................................................................... [1] (iv) On Fig. 2.1, draw a second curve to show the graph produced if the same volume of 0.0375 mol dm–3 C6H5N2Cl (aq) decomposes at a constant temperature of 50 °C. All other conditions stay the same. [1] (c) Another student investigates the effect of changing the concentration of C6H5N2Cl (aq) at 50 °C. He measures the time taken to collect 0.0150 dm3 of N2(g) and calculates the rate of N2 production by dividing 0.0150 dm3 by the time taken. The results are shown in Table 2.1. Table 2.1 concentration of time taken to rate of N2 C6H5N2Cl (aq) collect 0.0150 dm3 production / mol dm–3 of N2 / s / dm3 s–1 0.500 21 0.400 33 0.300 48 0.200 64 0.100 122 (i) Complete the table to calculate the values for the rate of N2 production. Give your answers to three significant figures. [1]
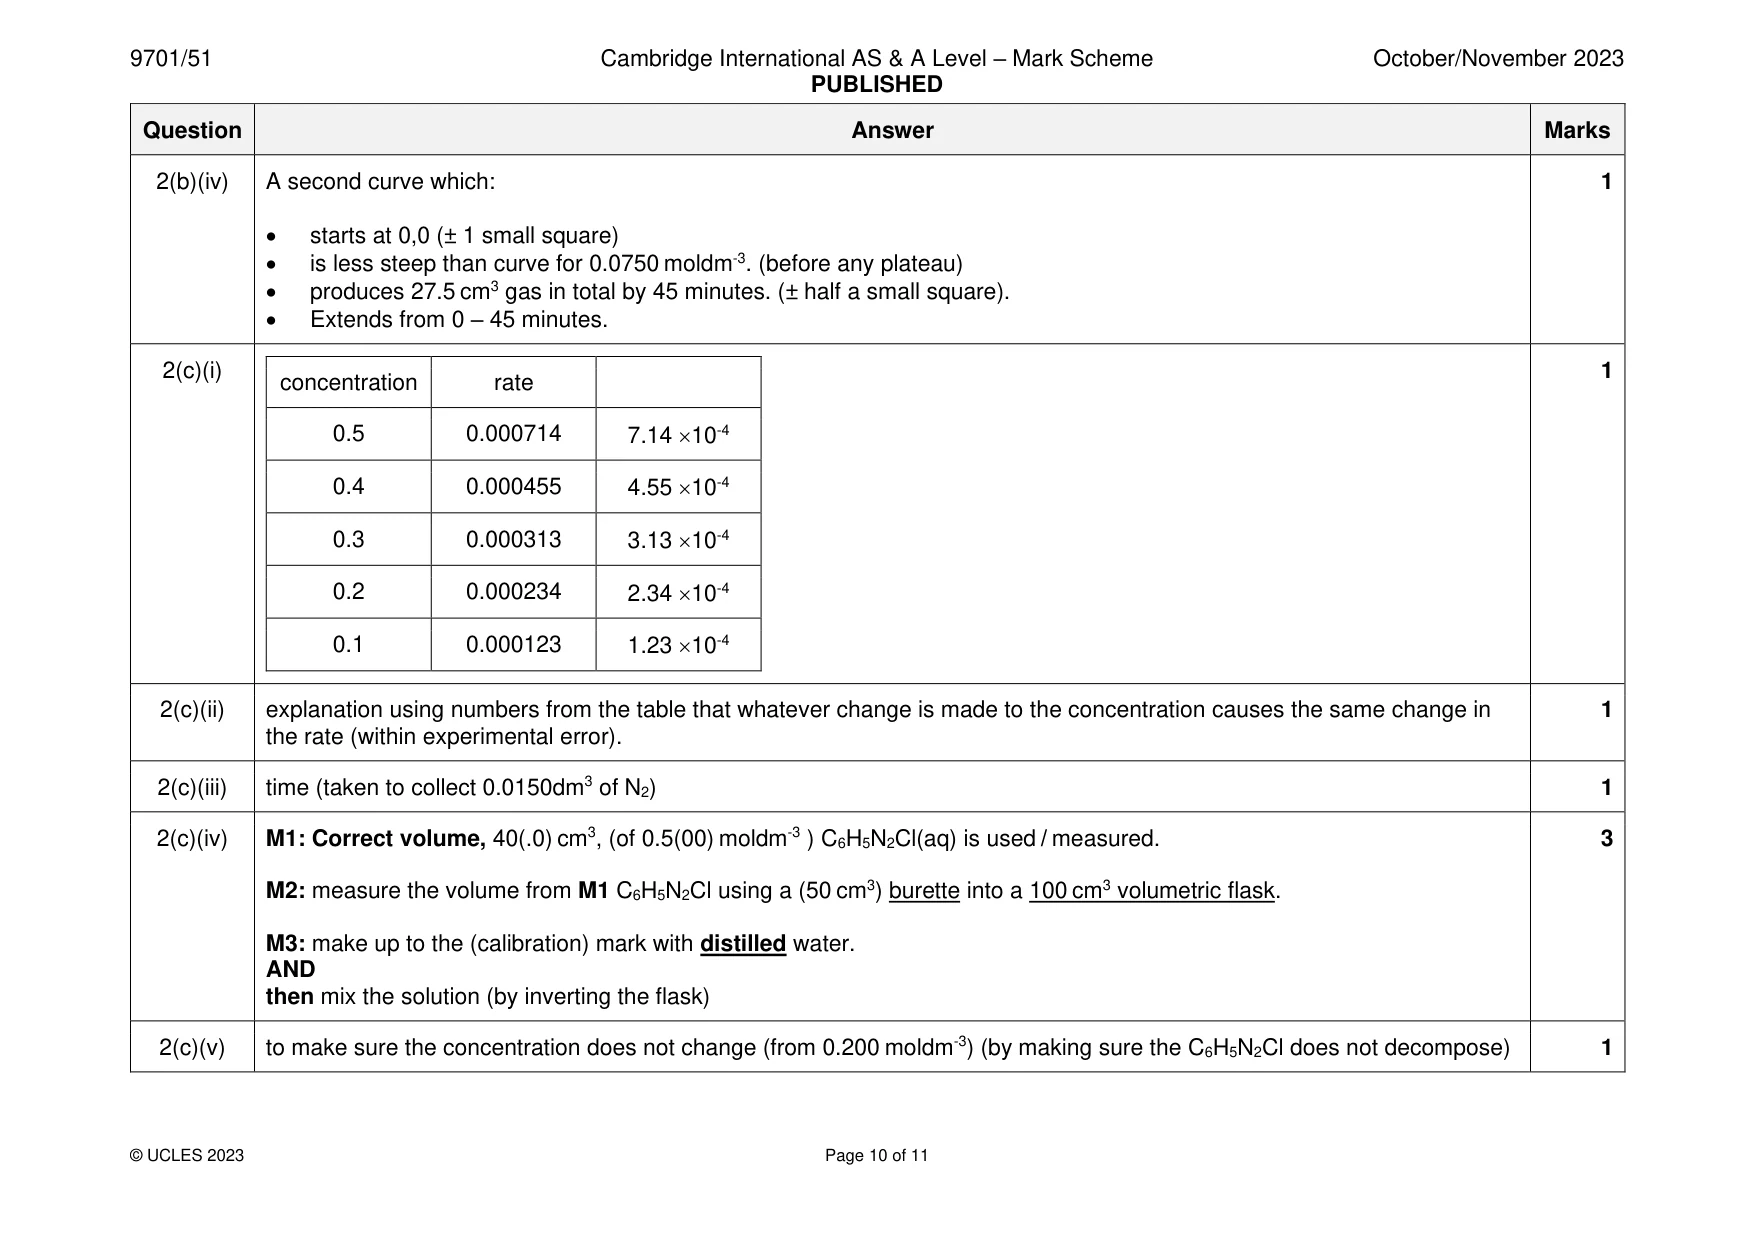
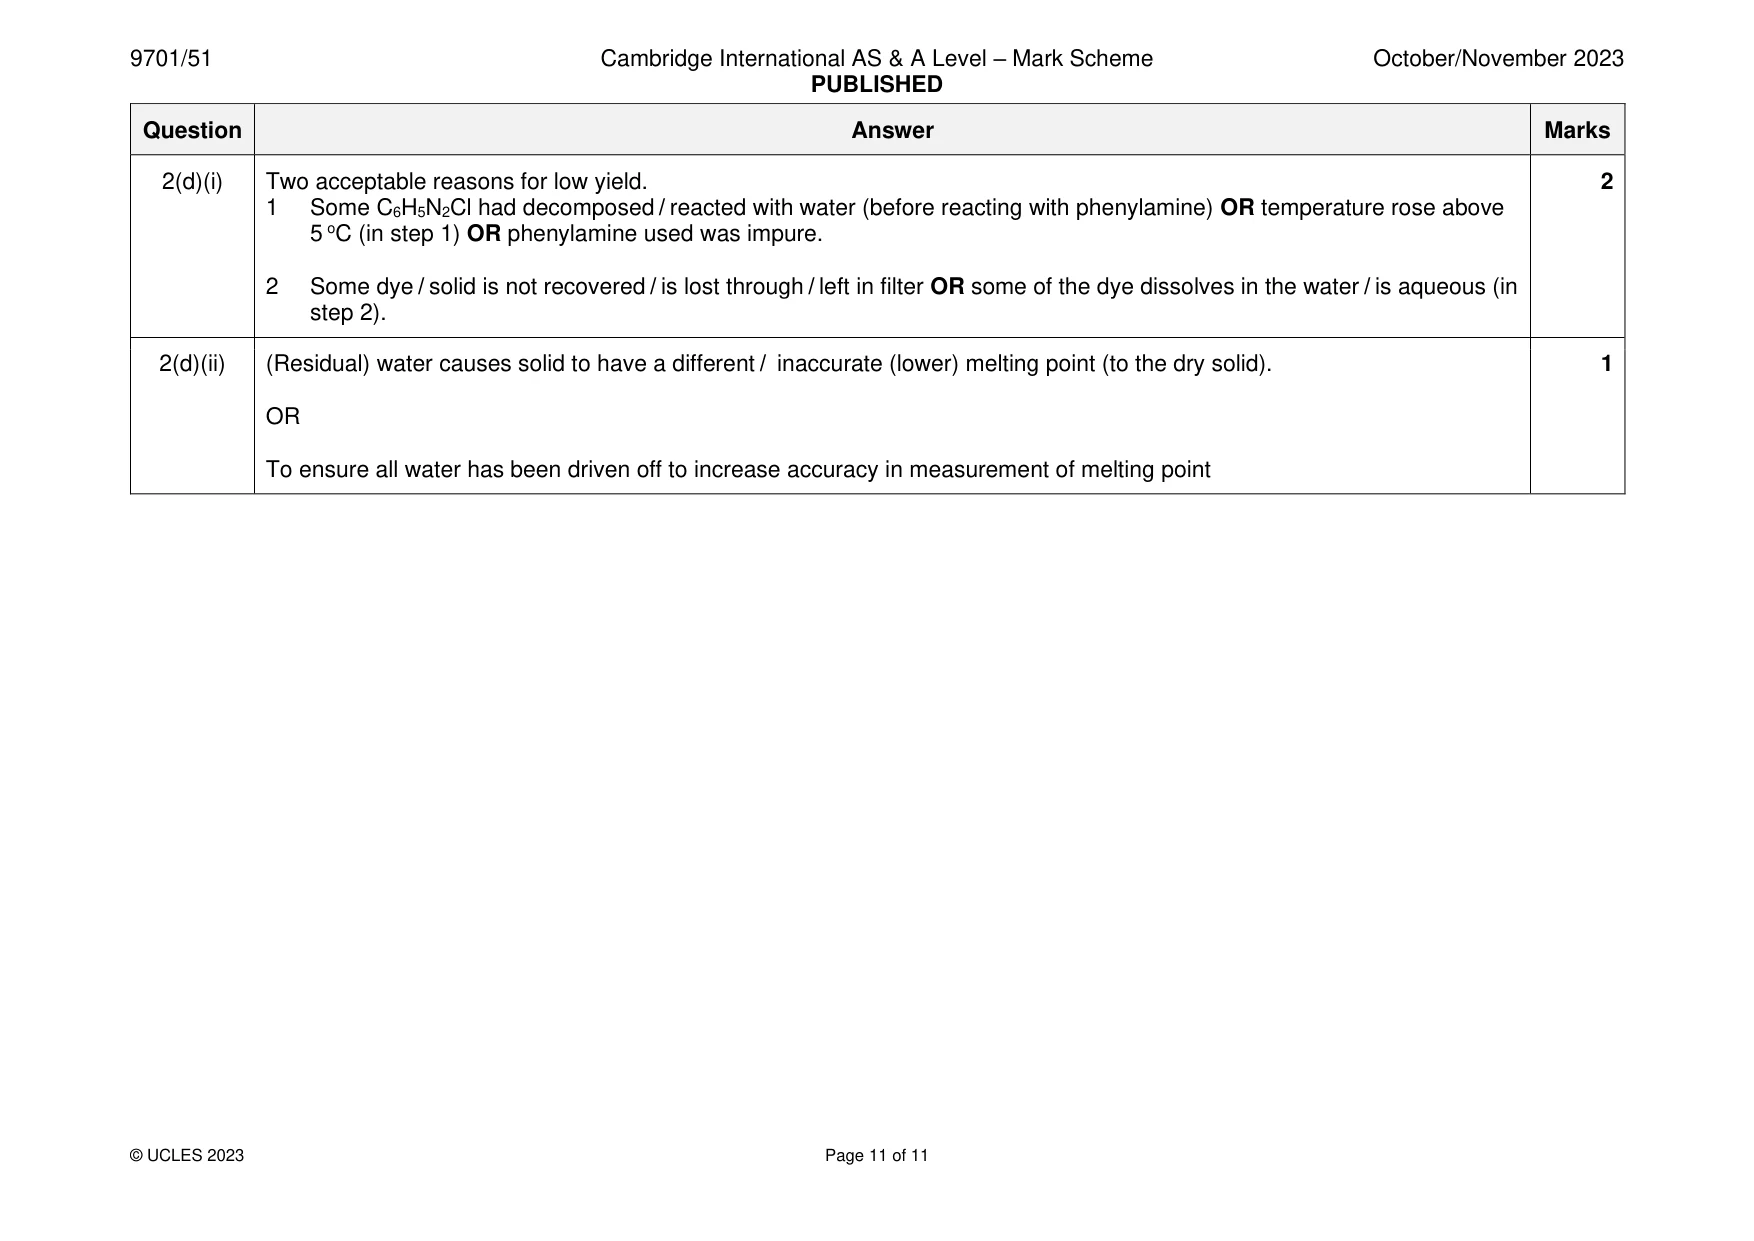
Mark scheme: 2(a) M1: Leakproof reaction vessel capable of delivering a sample of gas. 3 M2: Suitable method of collection and measurement of the gas produced. (eg. over water or gas syringe). M3: method for monitoring & maintaining temperature (thermostatically controlled water bath). 2(b)(i) M1: A tangent line which is… 2 • a straight line • starts at / passes through 0,0. • keeps to the left of the curve of the original line. • covers at least 25 cm3 (5 big squares) on y-axis. • passes between 4.0 and 5.5 minutes (inc.) at 25 cm3 M2: correct calculation of the gradient of tangent line drawn. 2(b)(ii) The total volume of gas produced divided by the time taken is the mean rate (rather than the initial rate). 1 2(b)(iii) It (the line / curve) would be below / lower (than the one on the graph) (starting at 0,0). 1 2(b)(iv) A second curve which: 1 • starts at 0,0 (± 1 small square) • is less steep than curve for 0.0750 moldm-3. (before any plateau) • produces 27.5 cm3 gas in total by 45 minutes. (± half a small square). • Extends from 0 – 45 minutes. 2(c)(i) 1 concentration rate 0.5 0.000714 7.14 10-4 0.4 0.000455 4.55 10-4 0.3 0.000313 3.13 10-4 0.2 0.000234 2.34 10-4 0.1 0.000123 1.23 10-4 2(c)(ii) explanation using numbers from the table that whatever change is made to the concentration causes the same change in 1 the rate (within experimental error). 2(c)(iii) time (taken to collect 0.0150dm3 of N2) 1 2(c)(iv) M1: Correct volume, 40(.0) cm3, (of 0.5(00) moldm-3 ) C6H5N2Cl(aq) is used / measured. 3 M2: measure the volume from M1 C6H5N2Cl using a (50 cm3) burette into a 100 cm3 volumetric flask. M3: make up to the (calibration) mark with distilled water. AND then mix the solution (by inverting the flask) 2(c)(v) to make sure the concentration does not change (from 0.200 moldm-3) (by making sure the C6H5N2Cl does not decompose) 1 2(d)(i) Two acceptable reasons for low yield. 2 1 Some C6H5N2Cl had decomposed / reacted with water (before reacting with phenylamine) OR temperature rose above 5 oC (in step 1) OR phenylamine used was impure. 2 Some dye / solid is not recovered / is lost through / left in filter OR some of the dye dissolves in the water / is aqueous (in step 2). 2(d)(ii) (Residual) water causes solid to have a different / inaccurate (lower) melting point (to the dry solid). 1 OR To ensure all water has been driven off to increase accuracy in measurement of melting point
What was in this paper
The subtopics covered by these 2 questions, and how many questions each got. Open one in a new tab to see every Cambridge question on it.
What you needed in this session
Cambridge’s own grade thresholds for 2023 Oct/Nov, Paper 5 · Variant 1. A higher threshold means an easier paper — the bar moves with how the cohort did.