Cambridge A Level Chemistry 9701 — 2012 May/June Paper 5 · Variant 3
9701/53/M/J/12 · 30 marks · ≈34 min
The question paper and its mark scheme, free to read here and free to download. This is Cambridge’s own paper, exactly as it was sat.
Question paper8 pages
Mark scheme6 pages
Answers below. Sit the paper first if you are practising.
Paper as text
Question paper, page 1
This document consists of 8 printed pages. DC (SLM) 58572 © UCLES 2012 [Turn over UNIVERSITY OF CAMBRIDGE INTERNATIONAL EXAMINATIONS General Certificate of Education Advanced Level READ THESE INSTRUCTIONS FIRST Write your Centre number, candidate number and name on all the work you hand in. Write in dark blue or black pen. You may use a soft pencil for any diagrams, graphs or rough working. Do not use staples, paper clips, highlighters, glue or correction fluid. DO NOT WRITE IN ANY BARCODES. Answer all questions. You may lose marks if you do not show your working or if you do not use appropriate units. Use of a Data Booklet is unnecessary. At the end of the examination, fasten all your work securely together. The number of marks is given in brackets [ ] at the end of each question or part question. * 4 2 9 9 2 3 2 6 9 1 * CHEMISTRY 9701/53 Paper 5 Planning, Analysis and Evaluation May/June 2012 1 hour 15 minutes Candidates answer on the Question Paper. No Additional Materials are required. For Examiner’s Use 1 2 Total
Question paper, page 2
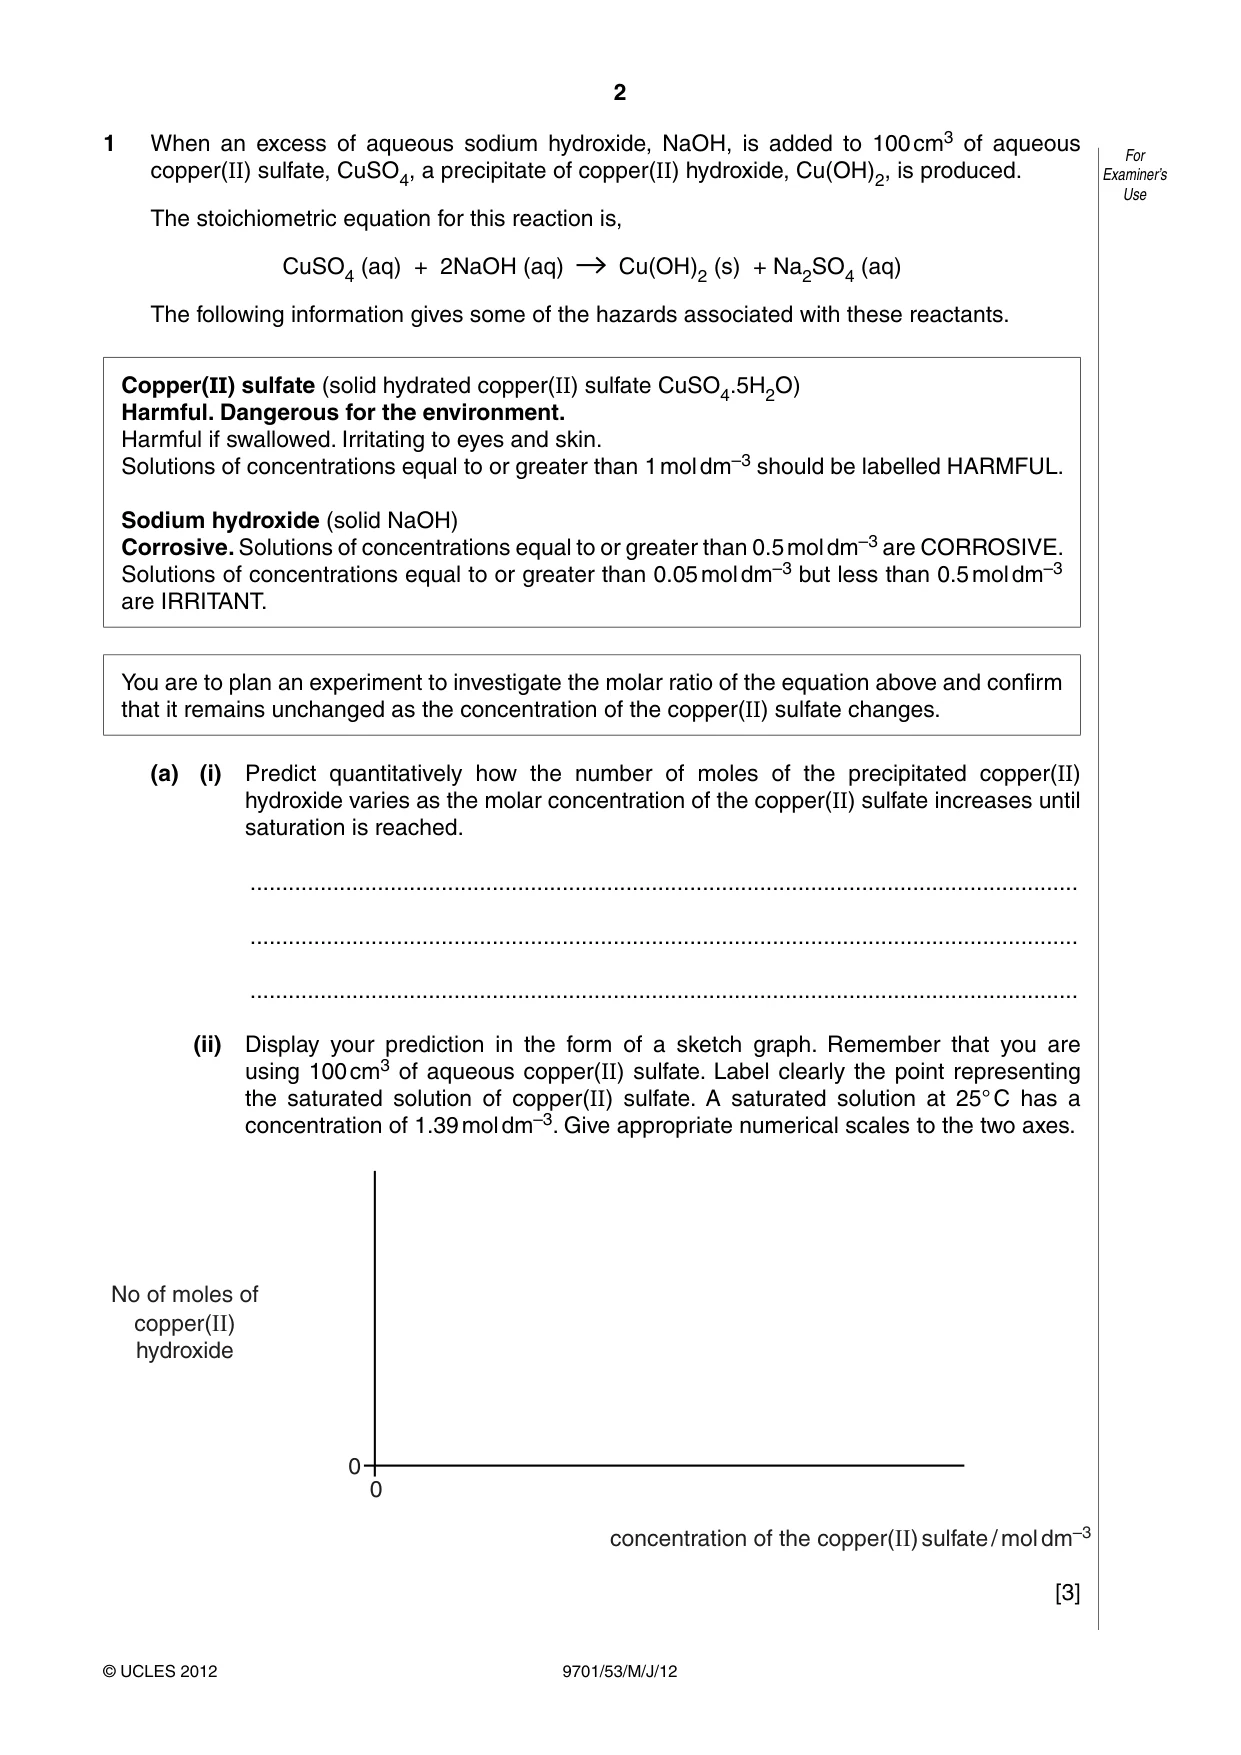
2 9701/53/M/J/12 © UCLES 2012 For Examiner’s Use 1 When an excess of aqueous sodium hydroxide, NaOH, is added to 100 cm3 of aqueous copper(II) sulfate, CuSO4, a precipitate of copper(II) hydroxide, Cu(OH)2, is produced. The stoichiometric equation for this reaction is, CuSO4 (aq) + 2NaOH (aq) Cu(OH)2 (s) + Na2SO4 (aq) The following information gives some of the hazards associated with these reactants. Copper(II) sulfate (solid hydrated copper(II) sulfate CuSO4.5H2O) Harmful. Dangerous for the environment. Harmful if swallowed. Irritating to eyes and skin. Solutions of concentrations equal to or greater than 1 mol dm–3 should be labelled HARMFUL. Sodium hydroxide (solid NaOH) Corrosive. Solutions of concentrations equal to or greater than 0.5 mol dm–3 are CORROSIVE. Solutions of concentrations equal to or greater than 0.05 mol dm–3 but less than 0.5 mol dm–3 are IRRITANT. You are to plan an experiment to investigate the molar ratio of the equation above and confirm that it remains unchanged as the concentration of the copper(II) sulfate changes. (a) (i) Predict quantitatively how the number of moles of the precipitated copper(II) hydroxide varies as the molar concentration of the copper(II) sulfate increases until saturation is reached. … … … (ii) Display your prediction in the form of a sketch graph. Remember that you are using 100 cm3 of aqueous copper(II) sulfate. Label clearly the point representing the saturated solution of copper(II) sulfate. A saturated solution at 25° C has a concentration of 1.39 mol dm–3. Give appropriate numerical scales to the two axes. 0 No of moles of copper(II) hydroxide concentration of the copper(II) sulfate / mol dm–3 0 [3]
Question paper, page 3
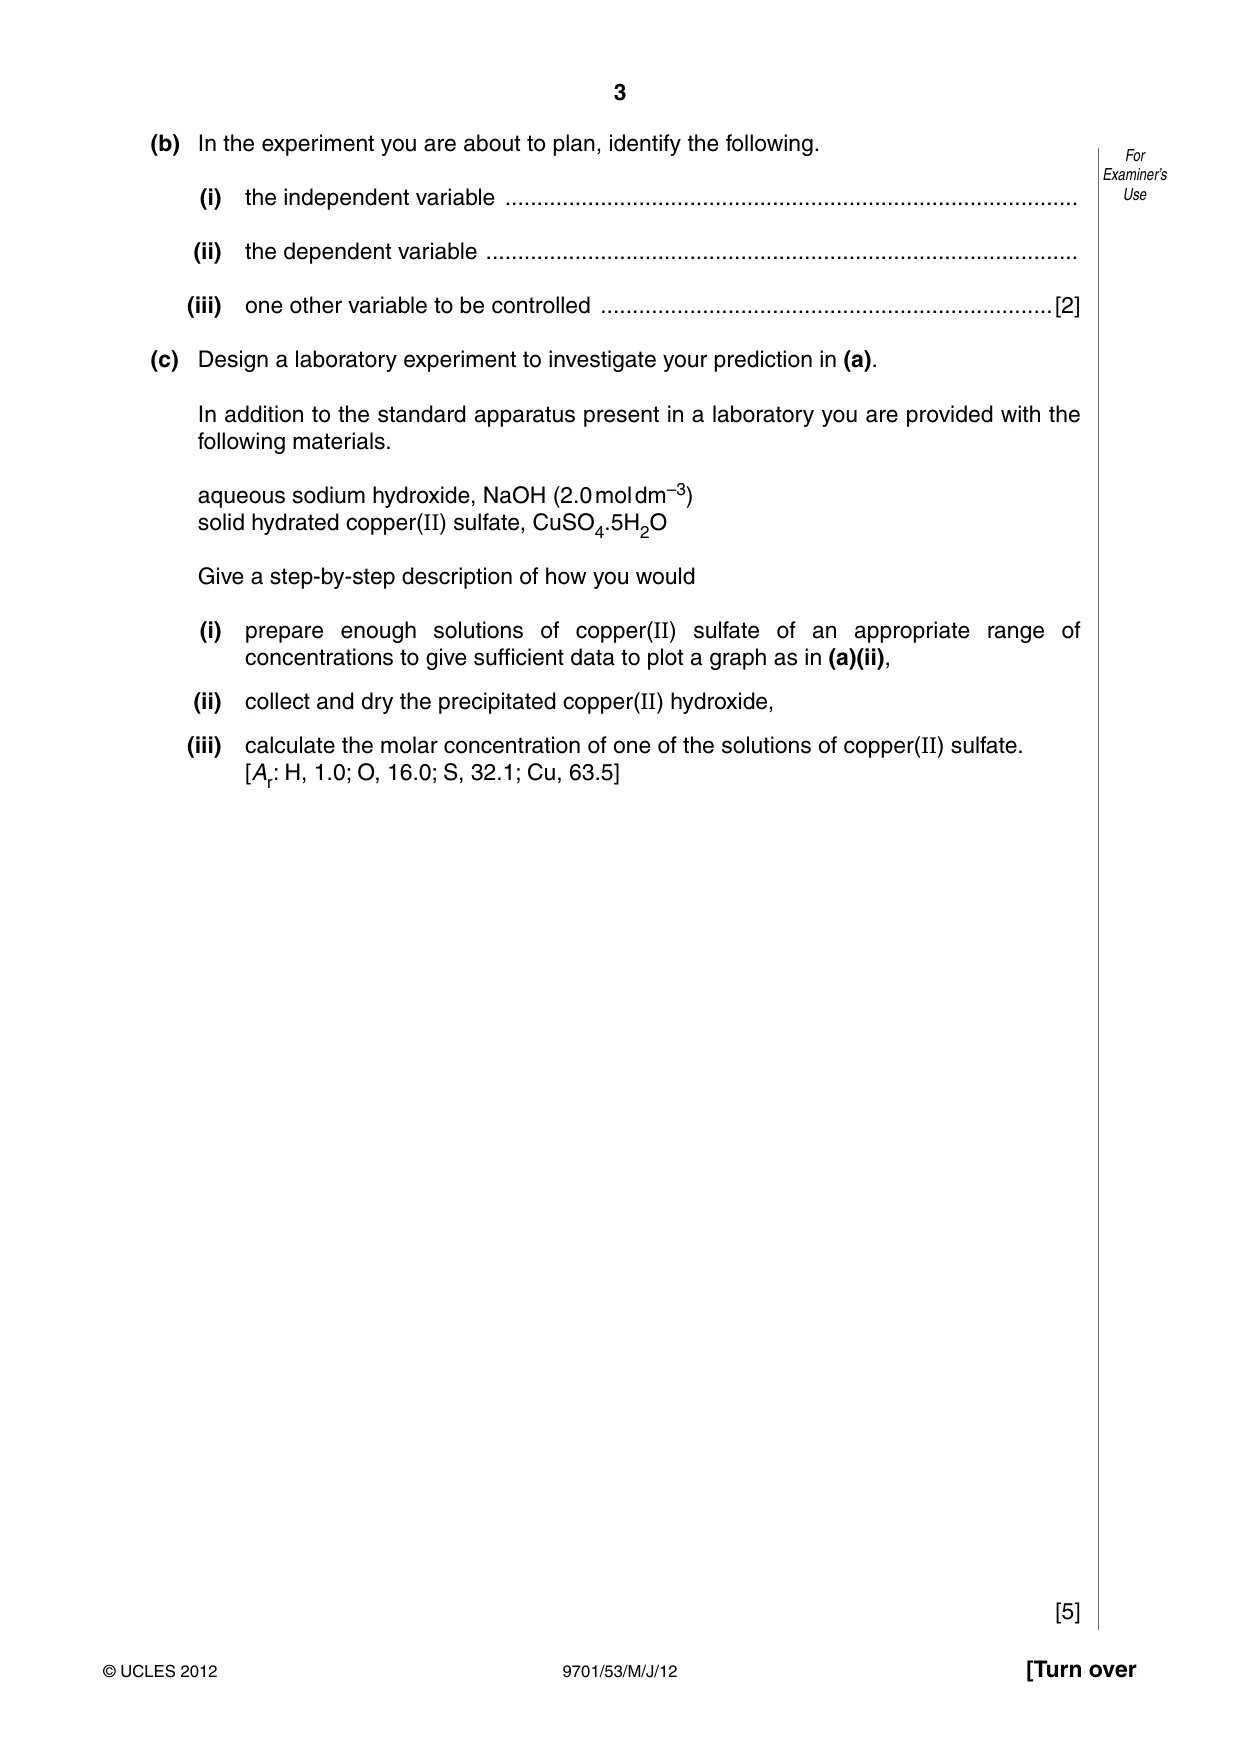
3 9701/53/M/J/12 © UCLES 2012 [Turn over For Examiner’s Use (b) In the experiment you are about to plan, identify the following. (i) the independent variable … (ii) the dependent variable … (iii) one other variable to be controlled …[2] (c) Design a laboratory experiment to investigate your prediction in (a). In addition to the standard apparatus present in a laboratory you are provided with the following materials. aqueous sodium hydroxide, NaOH (2.0 mol dm–3) solid hydrated copper(II) sulfate, CuSO4.5H2O Give a step-by-step description of how you would (i) prepare enough solutions of copper(II) sulfate of an appropriate range of concentrations to give sufficient data to plot a graph as in (a)(ii), (ii) collect and dry the precipitated copper(II) hydroxide, (iii) calculate the molar concentration of one of the solutions of copper(II) sulfate. [Ar: H, 1.0; O, 16.0; S, 32.1; Cu, 63.5] [5]
Question paper, page 4
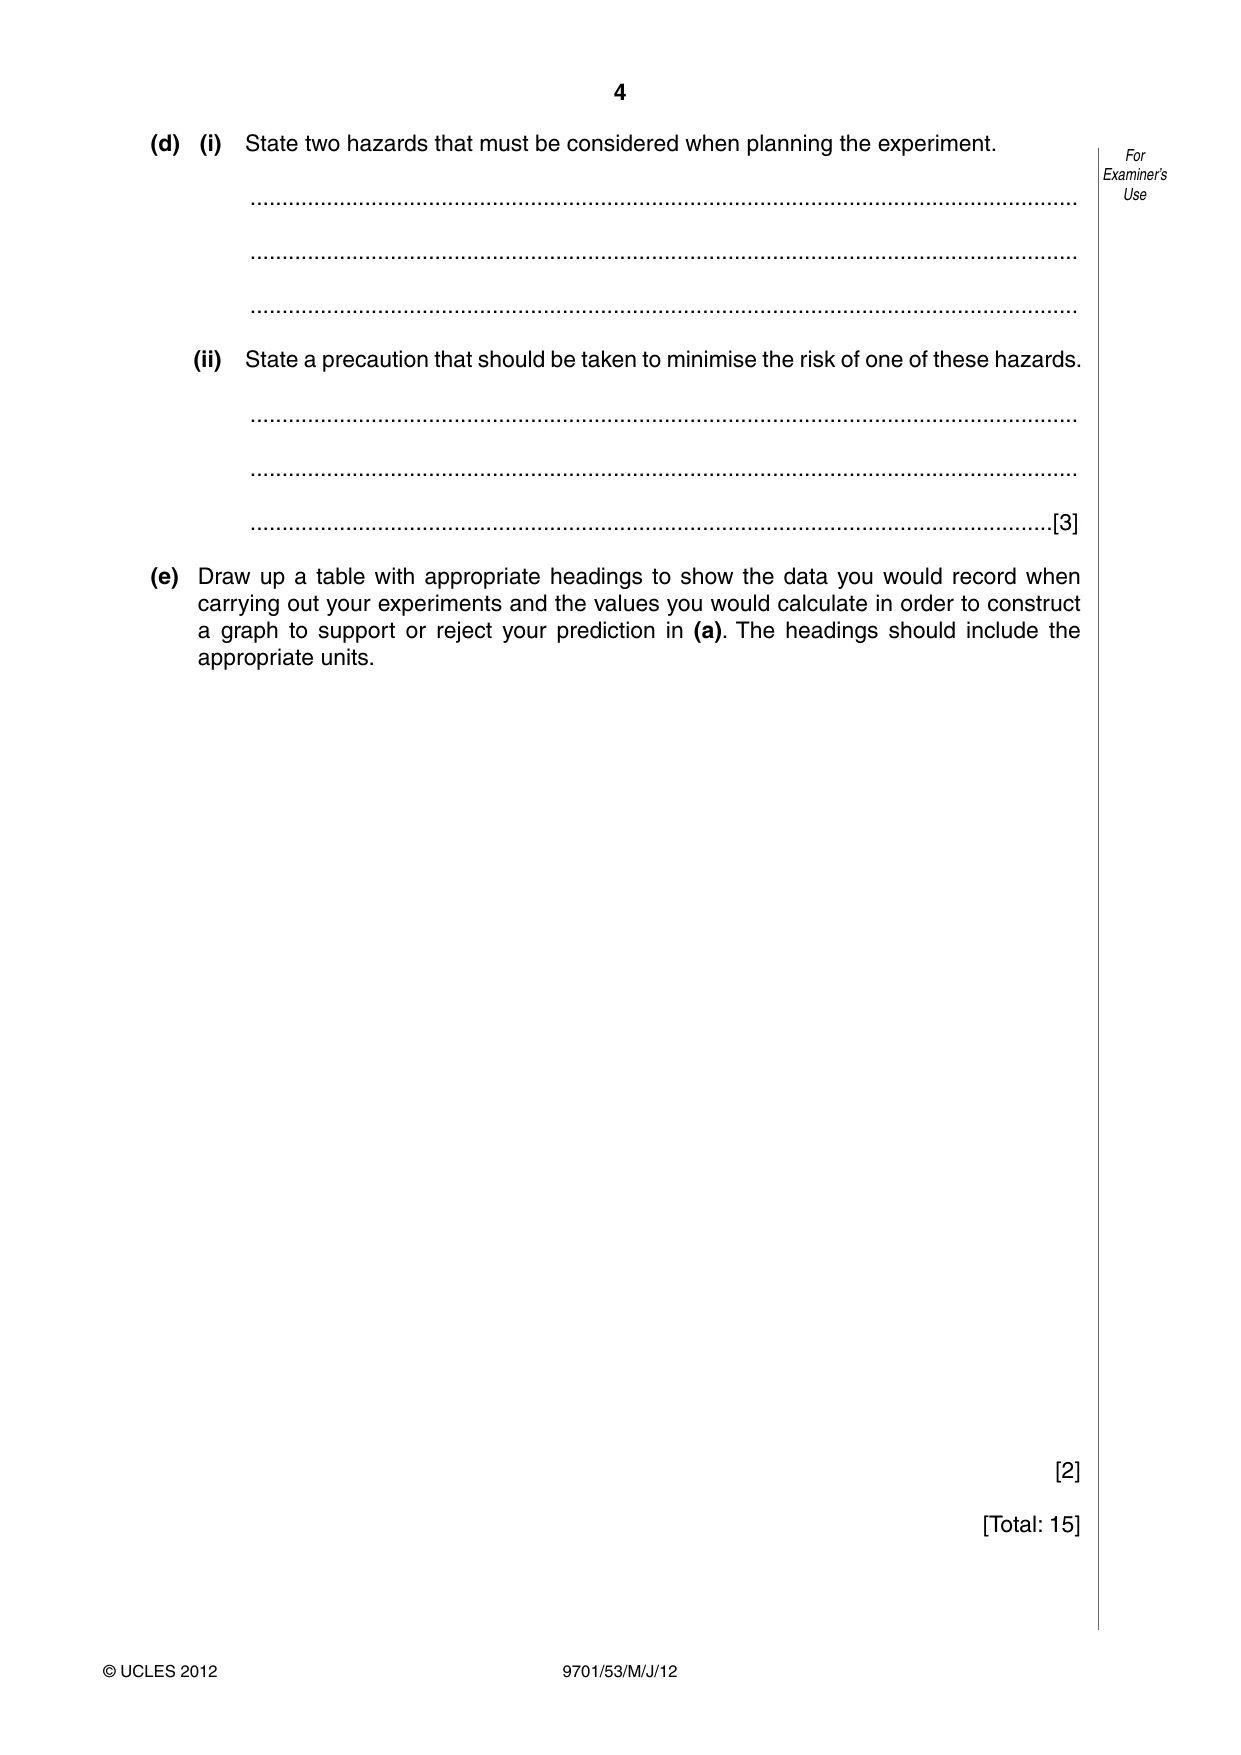
4 9701/53/M/J/12 © UCLES 2012 For Examiner’s Use (d) (i) State two hazards that must be considered when planning the experiment. … … … (ii) State a precaution that should be taken to minimise the risk of one of these hazards. … … …[3] (e) Draw up a table with appropriate headings to show the data you would record when carrying out your experiments and the values you would calculate in order to construct a graph to support or reject your prediction in (a). The headings should include the appropriate units. [2] [Total: 15]
Question paper, page 5
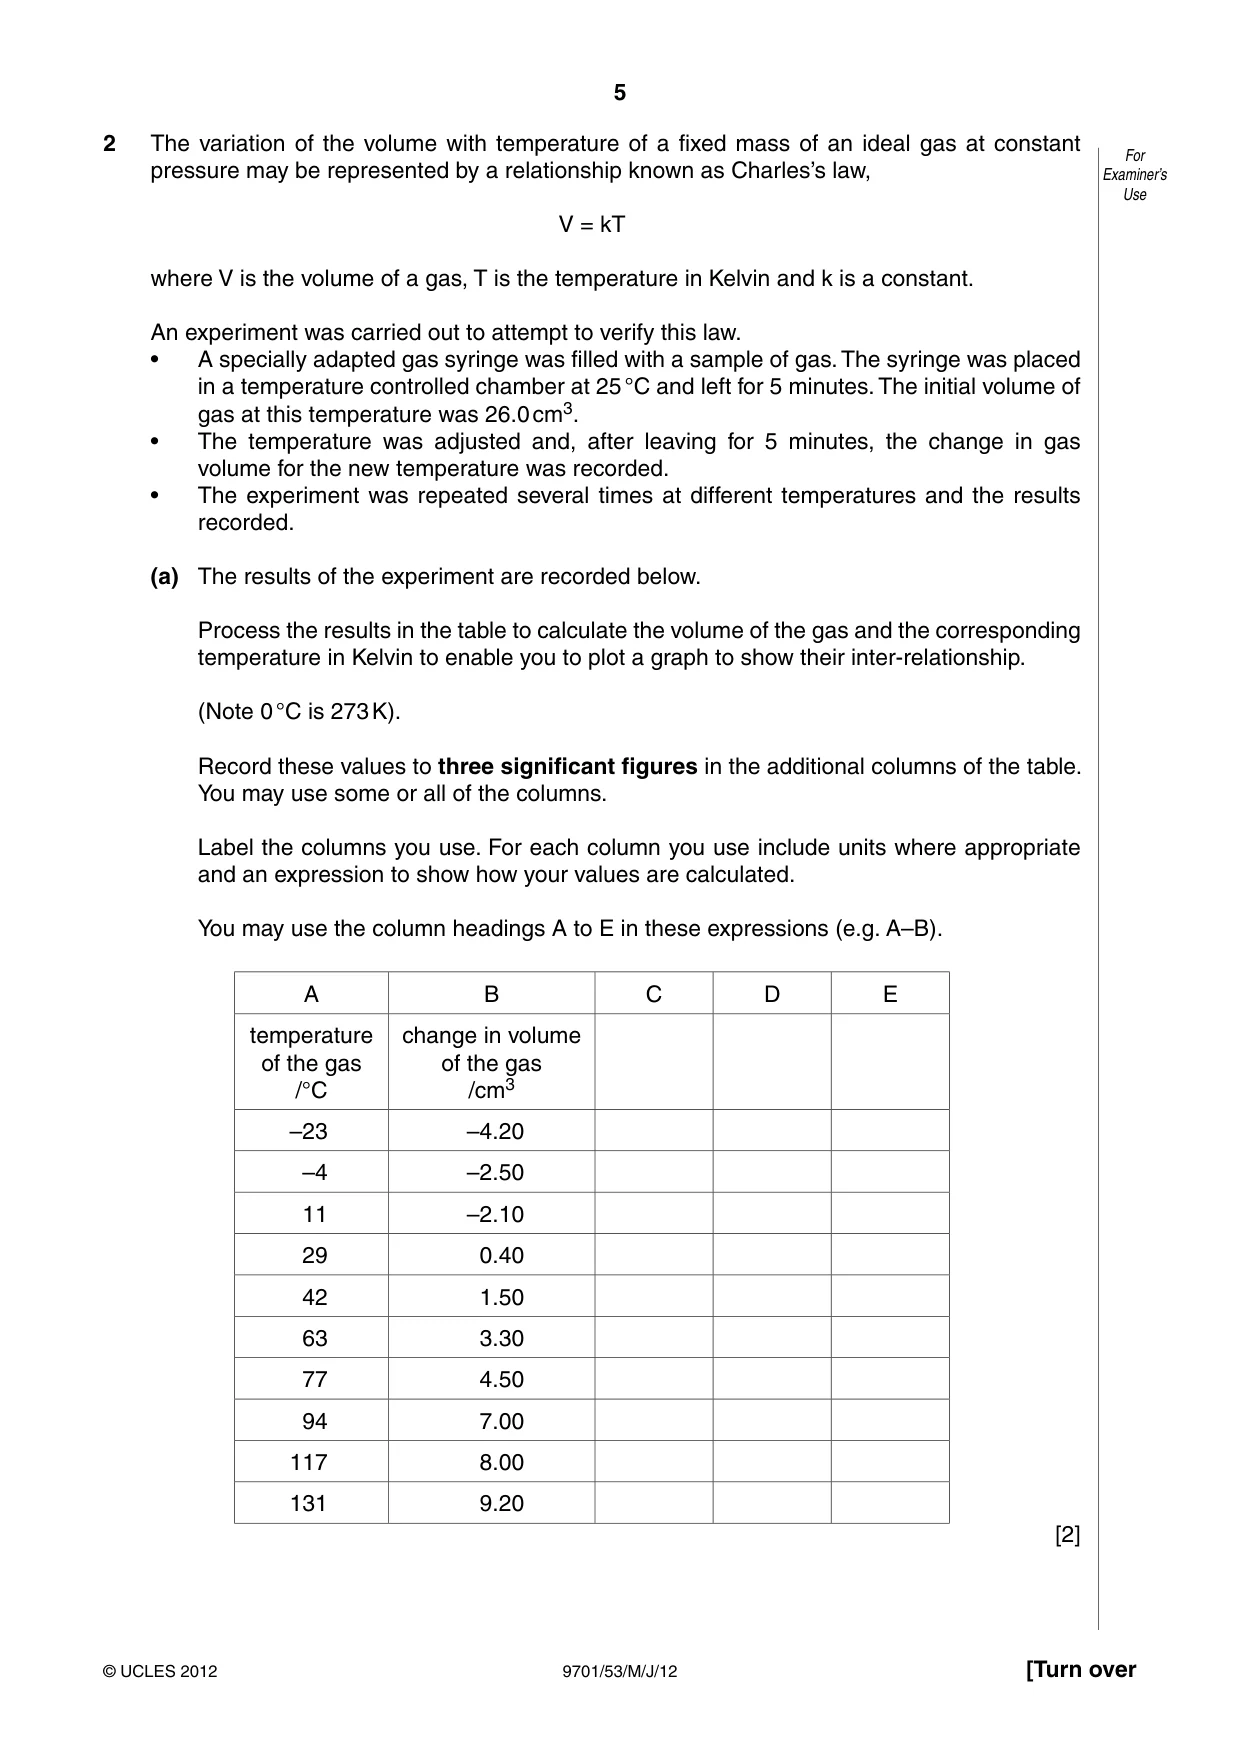
5 9701/53/M/J/12 © UCLES 2012 [Turn over For Examiner’s Use 2 The variation of the volume with temperature of a fixed mass of an ideal gas at constant pressure may be represented by a relationship known as Charles’s law, V = kT where V is the volume of a gas, T is the temperature in Kelvin and k is a constant. An experiment was carried out to attempt to verify this law. • A specially adapted gas syringe was filled with a sample of gas. The syringe was placed in a temperature controlled chamber at 25 °C and left for 5 minutes. The initial volume of gas at this temperature was 26.0 cm3. • The temperature was adjusted and, after leaving for 5 minutes, the change in gas volume for the new temperature was recorded. • The experiment was repeated several times at different temperatures and the results recorded. (a) The results of the experiment are recorded below. Process the results in the table to calculate the volume of the gas and the corresponding temperature in Kelvin to enable you to plot a graph to show their inter-relationship. (Note 0 °C is 273 K). Record these values to three significant figures in the additional columns of the table. You may use some or all of the columns. Label the columns you use. For each column you use include units where appropriate and an expression to show how your values are calculated. You may use the column headings A to E in these expressions (e.g. A–B). A B C D E temperature of the gas /°C change in volume of the gas /cm3 –23 –4.20 –4 –2.50 11 –2.10 29 0.40 42 1.50 63 3.30 77 4.50 94 7.00 117 8.00 131 9.20 [2]
Question paper, page 6
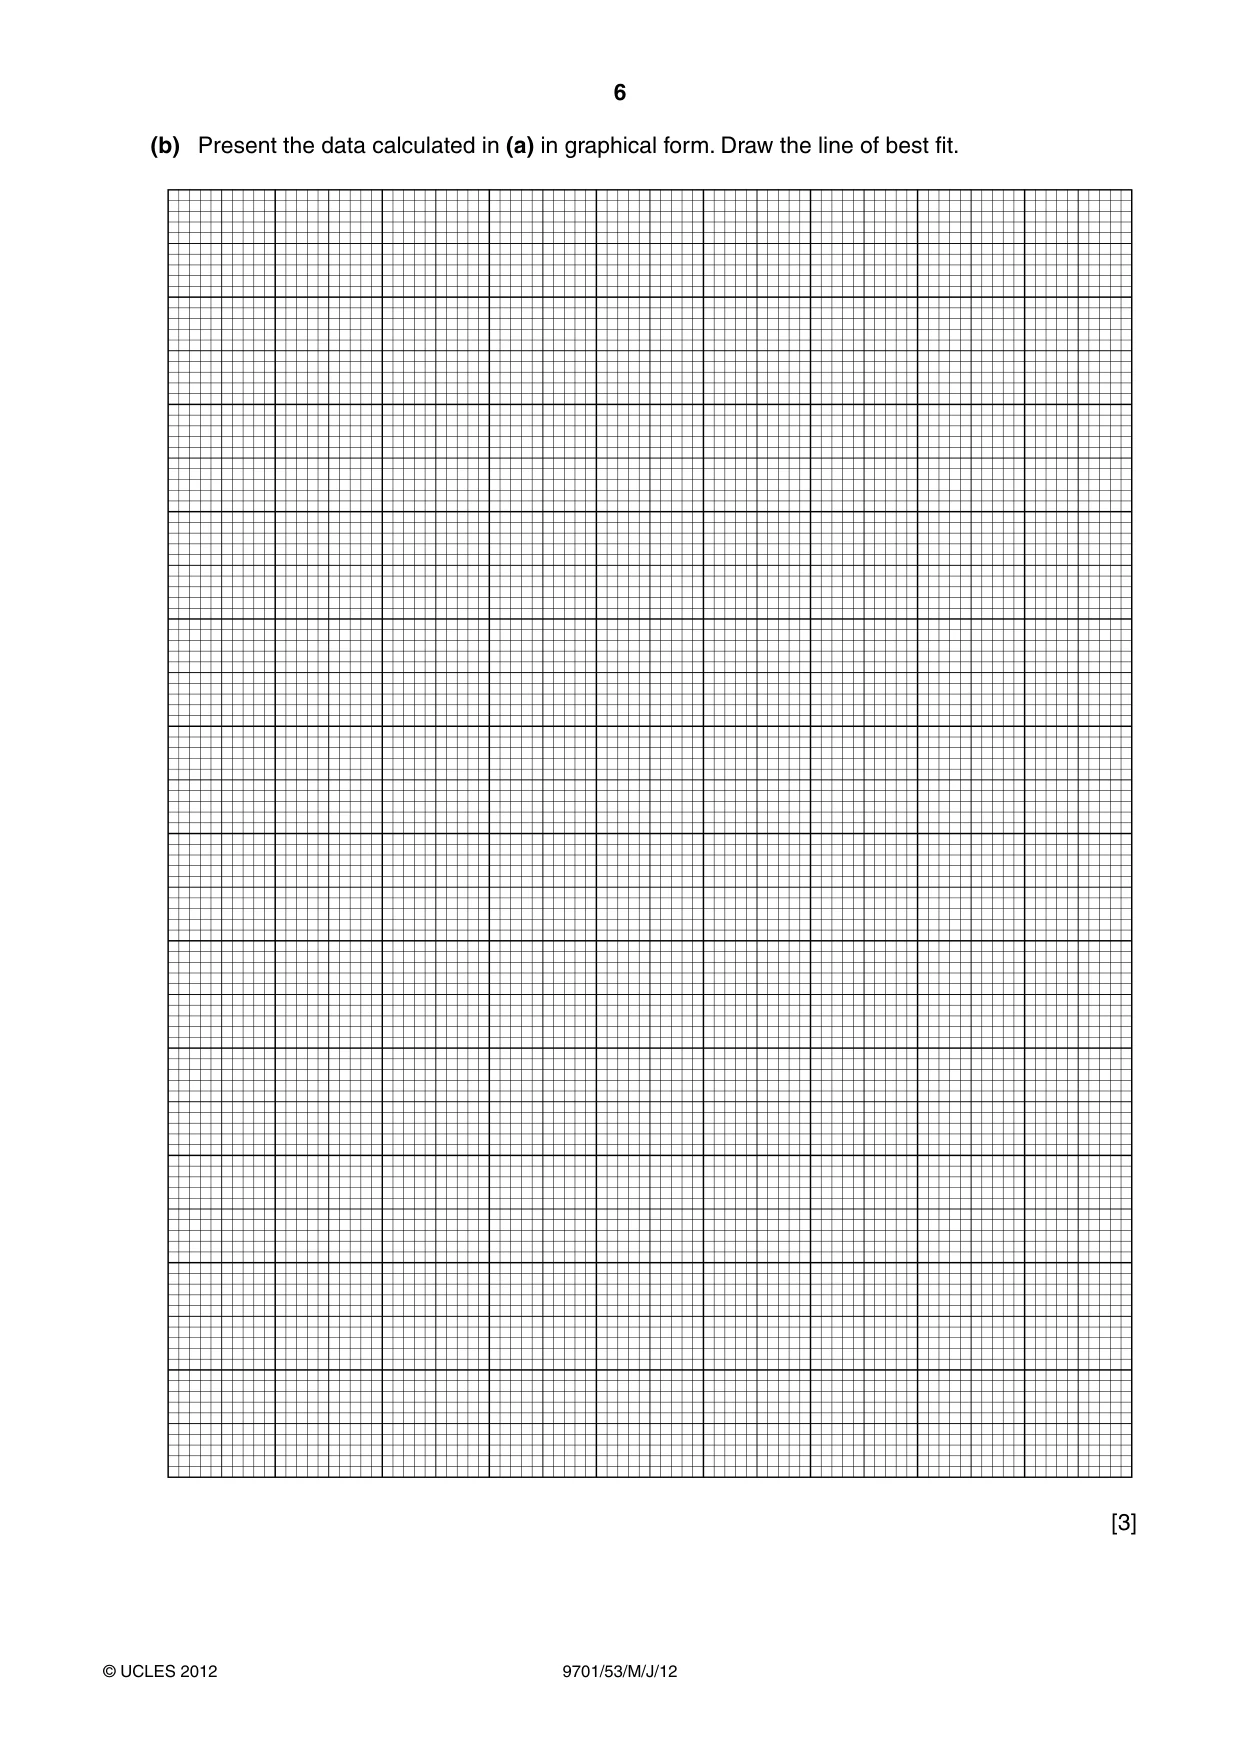
6 9701/53/M/J/12 © UCLES 2012 (b) Present the data calculated in (a) in graphical form. Draw the line of best fit. [3]
Question paper, page 7
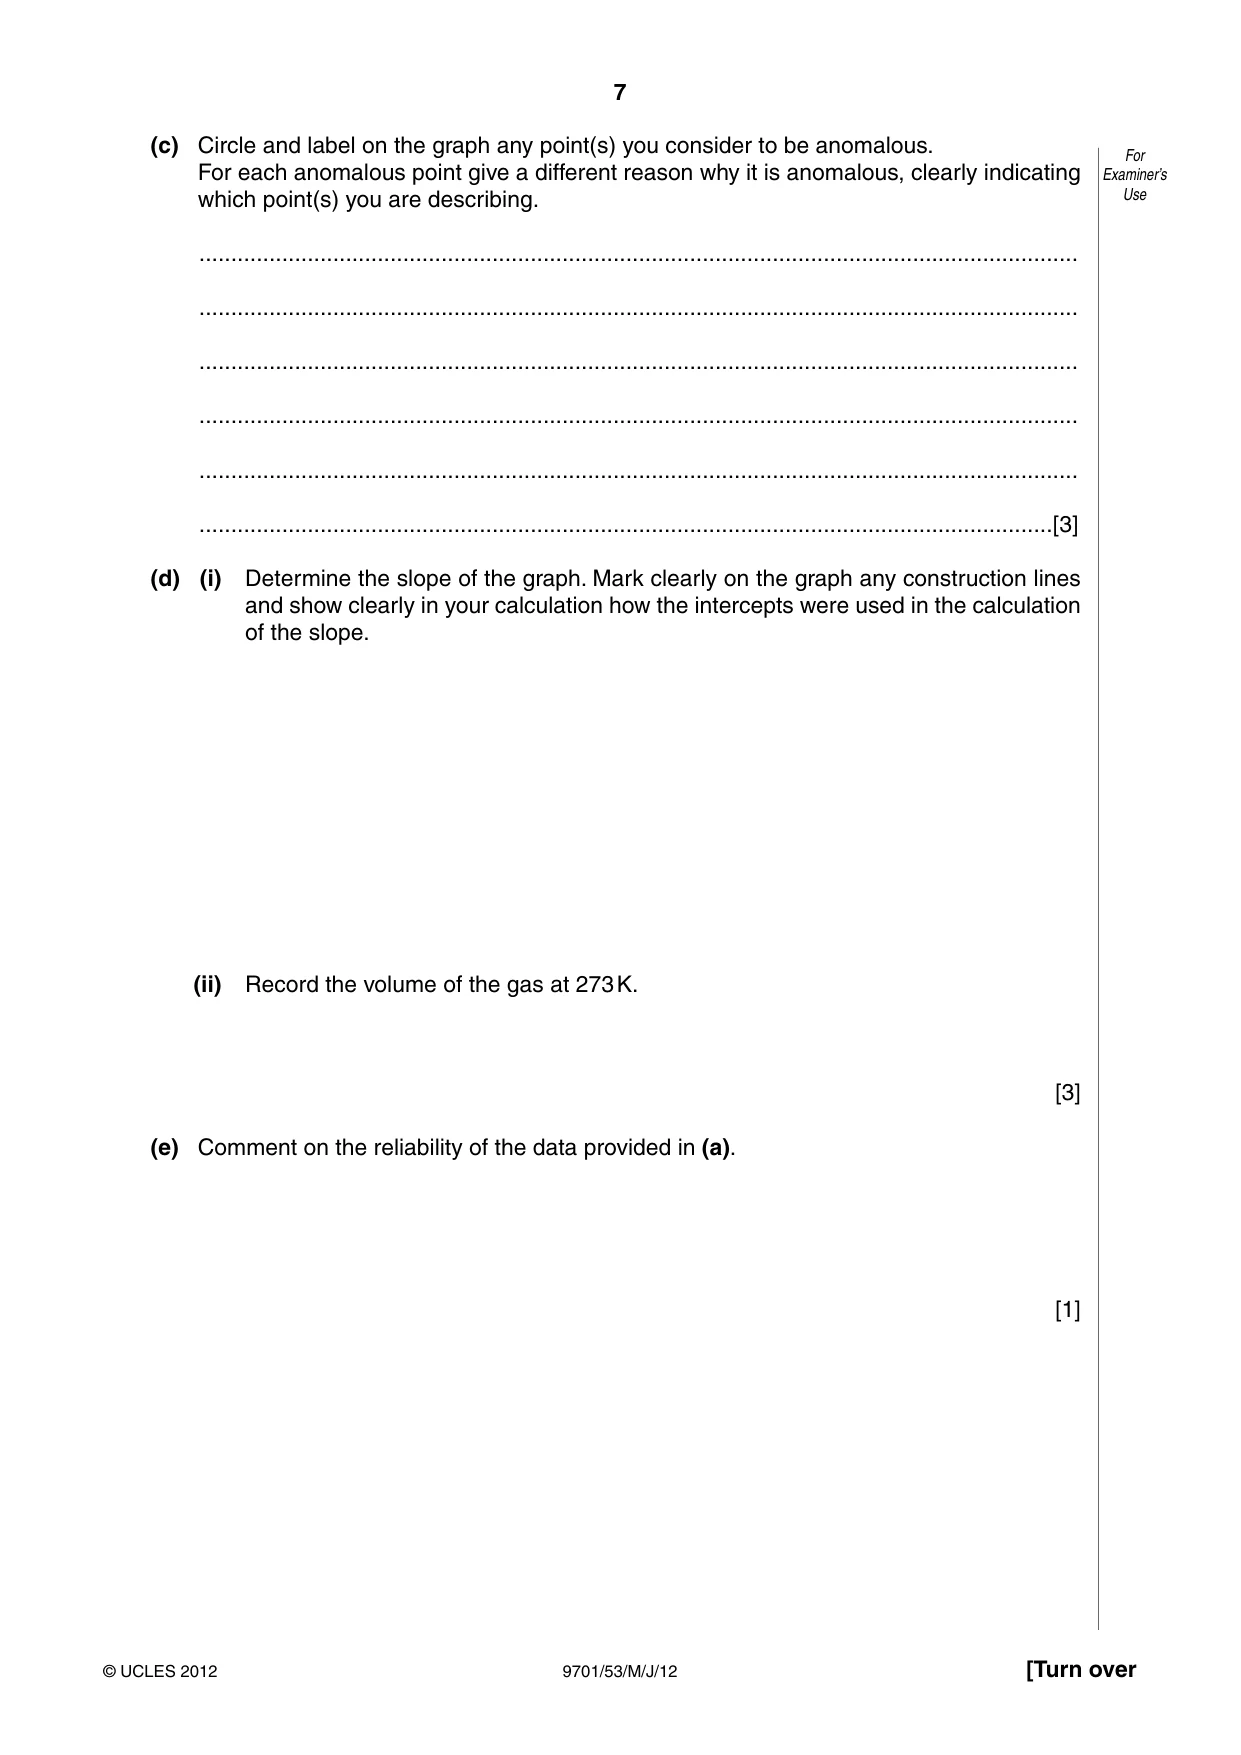
7 9701/53/M/J/12 © UCLES 2012 [Turn over For Examiner’s Use (c) Circle and label on the graph any point(s) you consider to be anomalous. For each anomalous point give a different reason why it is anomalous, clearly indicating which point(s) you are describing. … … … … … …[3] (d) (i) Determine the slope of the graph. Mark clearly on the graph any construction lines and show clearly in your calculation how the intercepts were used in the calculation of the slope. (ii) Record the volume of the gas at 273 K. [3] (e) Comment on the reliability of the data provided in (a). [1]
Question paper, page 8
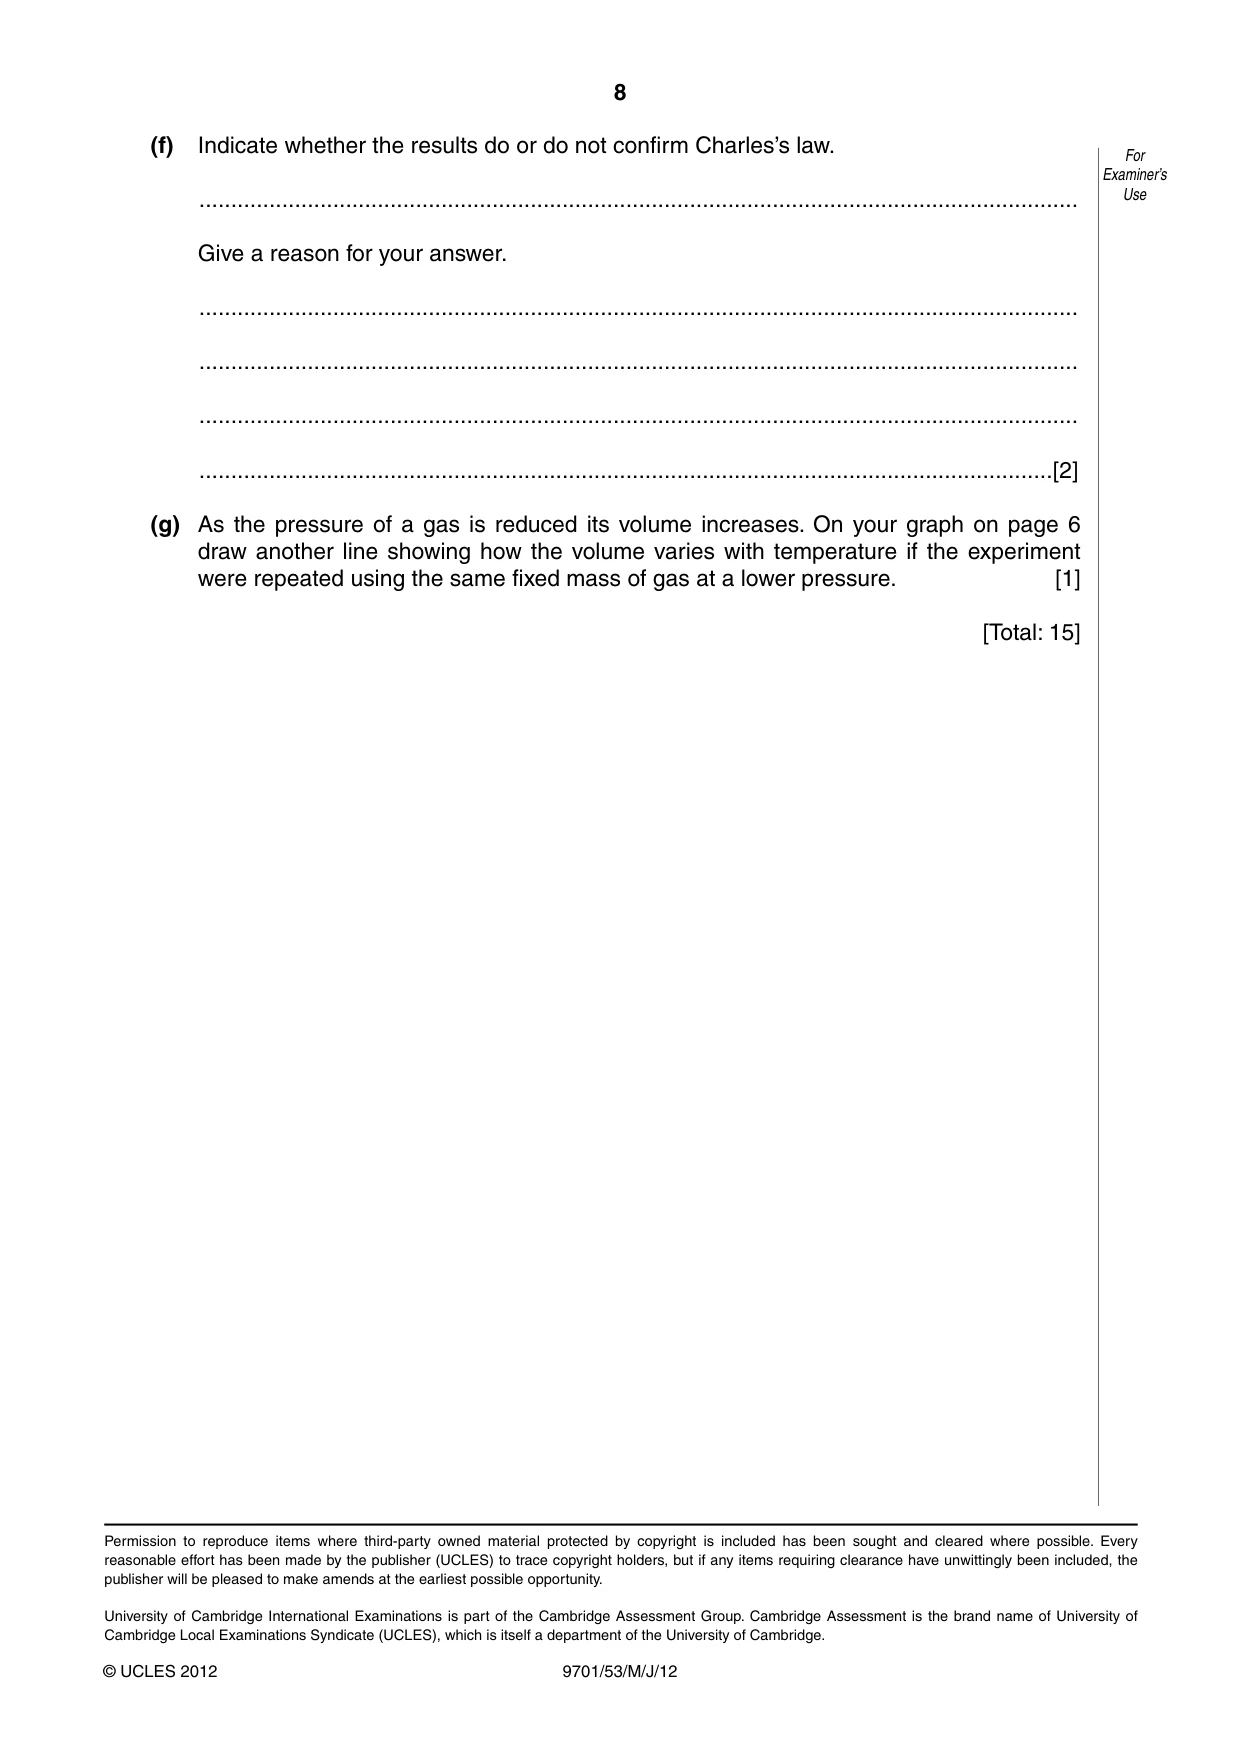
8 9701/53/M/J/12 © UCLES 2012 For Examiner’s Use (f) Indicate whether the results do or do not confirm Charles’s law. … Give a reason for your answer. … … … …[2] (g) As the pressure of a gas is reduced its volume increases. On your graph on page 6 draw another line showing how the volume varies with temperature if the experiment were repeated using the same fixed mass of gas at a lower pressure. [1] [Total: 15] Permission to reproduce items where third-party owned material protected by copyright is included has been sought and cleared where possible. Every reasonable effort has been made by the publisher (UCLES) to trace copyright holders, but if any items requiring clearance have unwittingly been included, the publisher will be pleased to make amends at the earliest possible opportunity. University of Cambridge International Examinations is part of the Cambridge Assessment Group. Cambridge Assessment is the brand name of University of Cambridge Local Examinations Syndicate (UCLES), which is itself a department of the University of Cambridge.
Mark scheme, page 1
UNIVERSITY OF CAMBRIDGE INTERNATIONAL EXAMINATIONS GCE Advanced Subsidiary Level and GCE Advanced Level MARK SCHEME for the May/June 2012 question paper for the guidance of teachers 9701 CHEMISTRY 9701/53 Paper 5 (Planning, Analysis and Evaluation), maximum raw mark 30 This mark scheme is published as an aid to teachers and candidates, to indicate the requirements of the examination. It shows the basis on which Examiners were instructed to award marks. It does not indicate the details of the discussions that took place at an Examiners’ meeting before marking began, which would have considered the acceptability of alternative answers. Mark schemes must be read in conjunction with the question papers and the report on the examination. • Cambridge will not enter into discussions or correspondence in connection with these mark schemes. Cambridge is publishing the mark schemes for the May/June 2012 question papers for most IGCSE, GCE Advanced Level and Advanced Subsidiary Level syllabuses and some Ordinary Level syllabuses.
Mark scheme, page 2
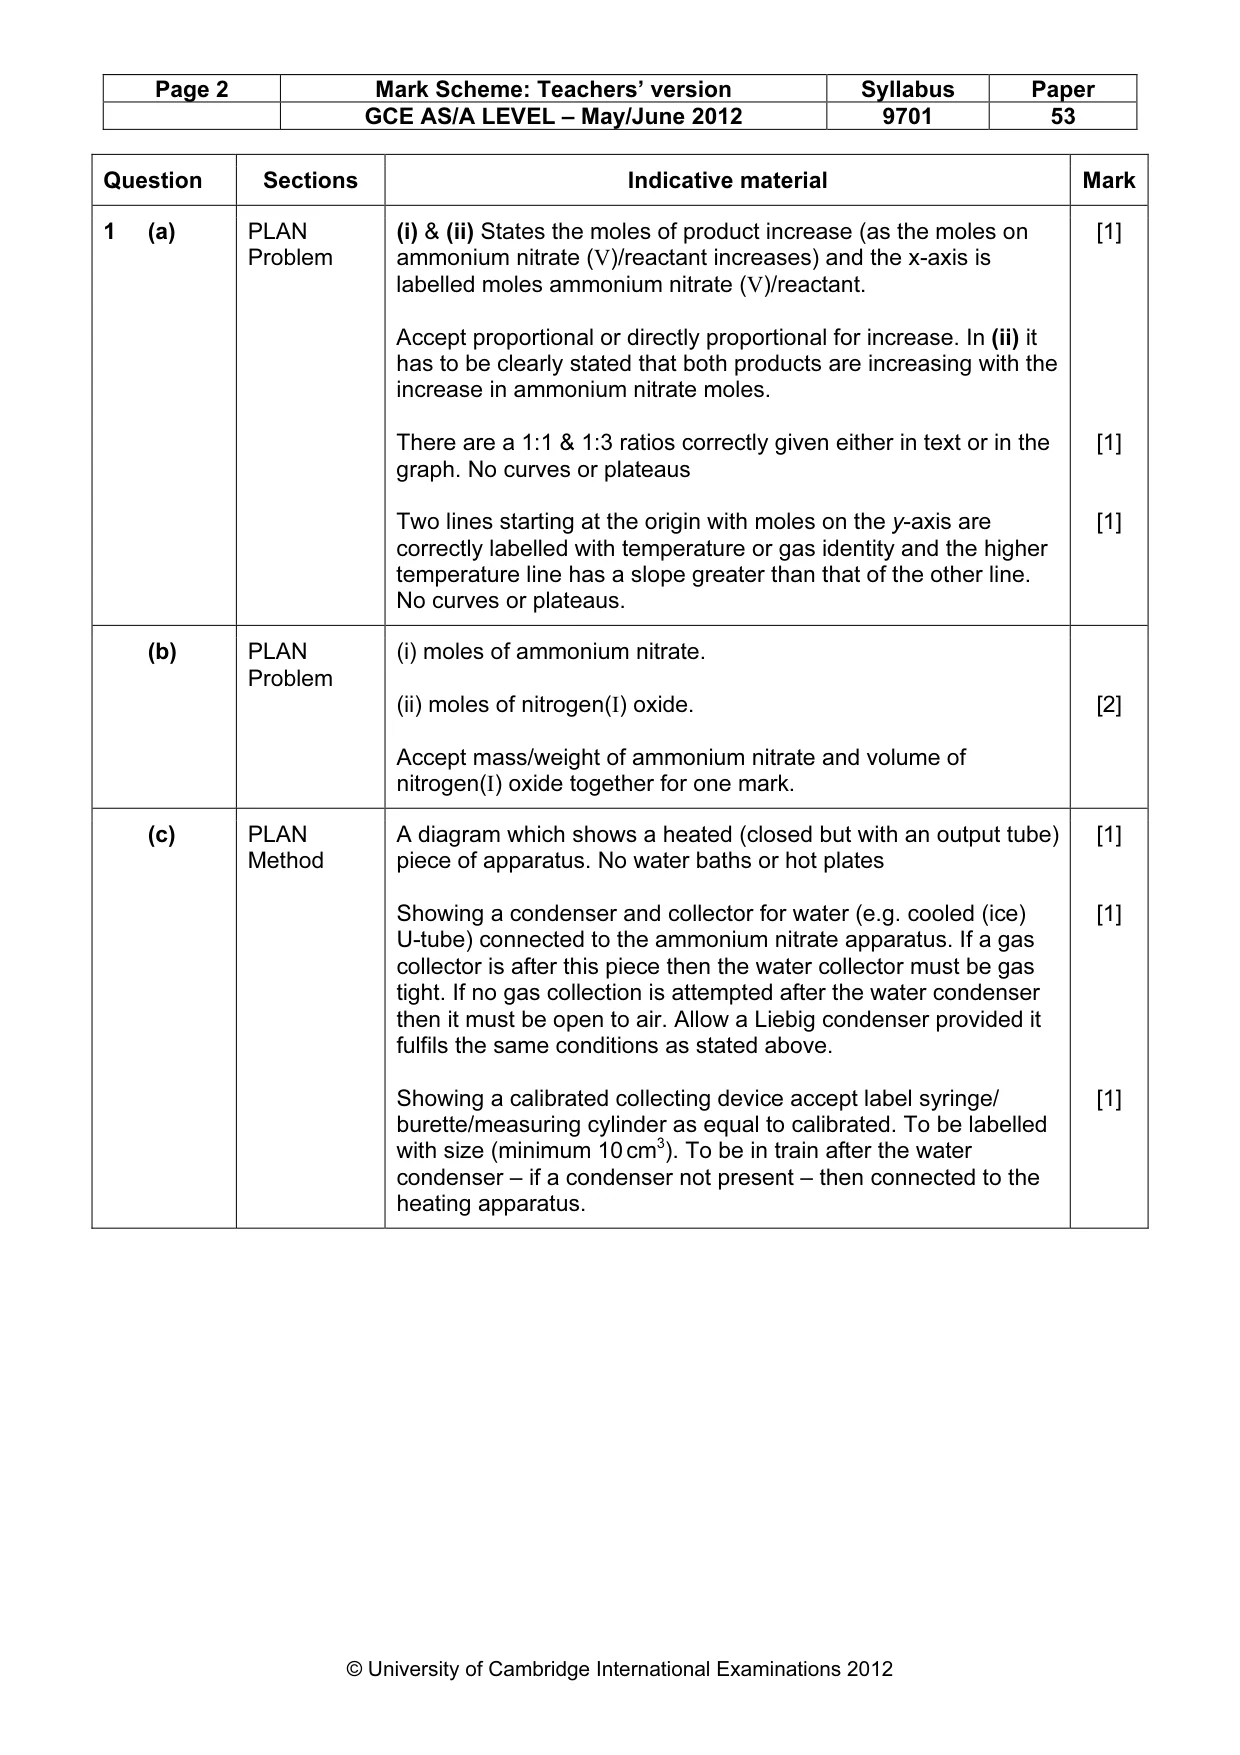
Page 2 Mark Scheme: Teachers’ version Syllabus Paper GCE AS/A LEVEL – May/June 2012 9701 53 © University of Cambridge International Examinations 2012 Question Sections Indicative material Mark 1 (a) PLAN Problem (i) & (ii) States the moles of product increase (as the moles on ammonium nitrate (V)/reactant increases) and the x-axis is labelled moles ammonium nitrate (V)/reactant. Accept proportional or directly proportional for increase. In (ii) it has to be clearly stated that both products are increasing with the increase in ammonium nitrate moles. There are a 1:1 & 1:3 ratios correctly given either in text or in the graph. No curves or plateaus Two lines starting at the origin with moles on the y-axis are correctly labelled with temperature or gas identity and the higher temperature line has a slope greater than that of the other line. No curves or plateaus. [1] [1] [1] (b) PLAN Problem (i) moles of ammonium nitrate. (ii) moles of nitrogen(I) oxide. Accept mass/weight of ammonium nitrate and volume of nitrogen(I) oxide together for one mark. [2] (c) PLAN Method A diagram which shows a heated (closed but with an output tube) piece of apparatus. No water baths or hot plates Showing a condenser and collector for water (e.g. cooled (ice) U-tube) connected to the ammonium nitrate apparatus. If a gas collector is after this piece then the water collector must be gas tight. If no gas collection is attempted after the water condenser then it must be open to air. Allow a Liebig condenser provided it fulfils the same conditions as stated above. Showing a calibrated collecting device accept label syringe/ burette/measuring cylinder as equal to calibrated. To be labelled with size (minimum 10 cm3). To be in train after the water condenser – if a condenser not present – then connected to the heating apparatus. [1] [1] [1]
Mark scheme, page 3
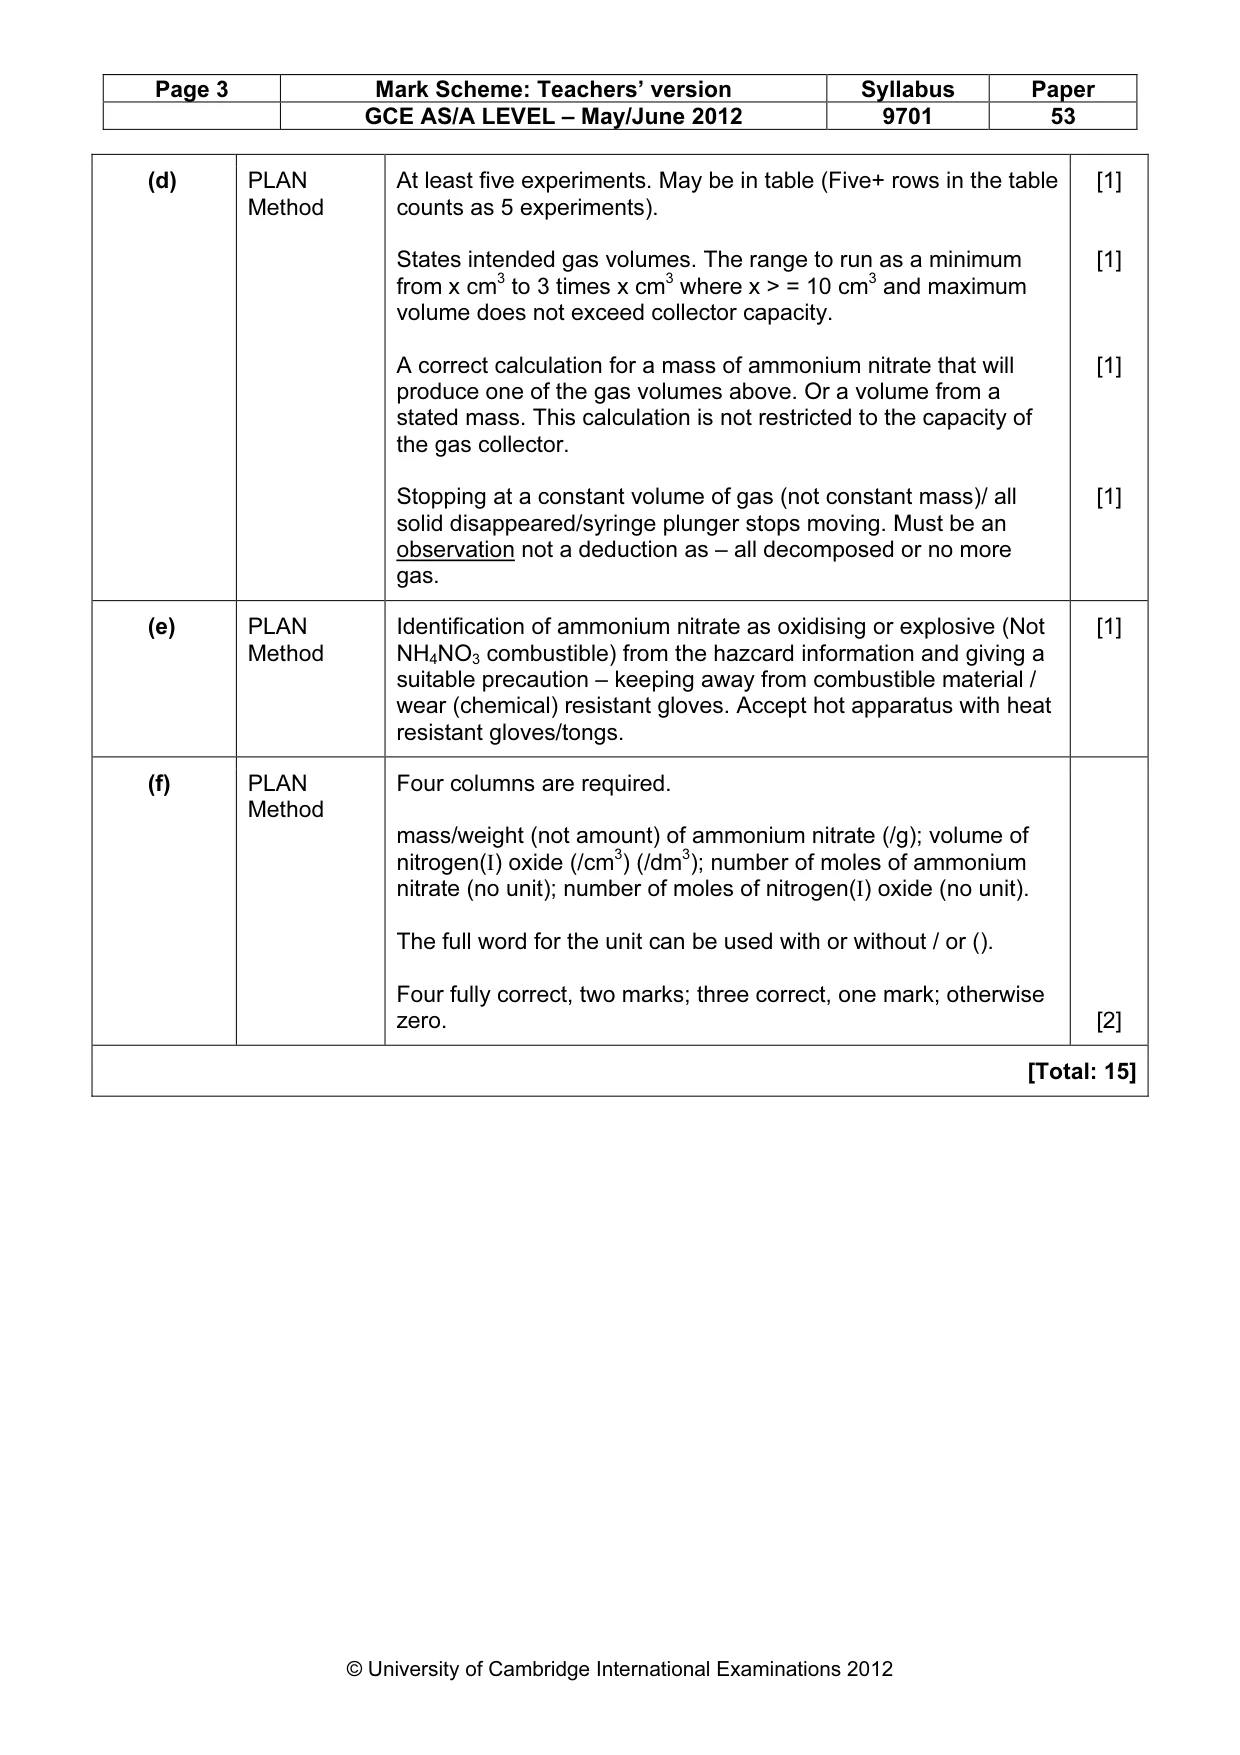
Page 3 Mark Scheme: Teachers’ version Syllabus Paper GCE AS/A LEVEL – May/June 2012 9701 53 © University of Cambridge International Examinations 2012 (d) PLAN Method At least five experiments. May be in table (Five+ rows in the table counts as 5 experiments). States intended gas volumes. The range to run as a minimum from x cm3 to 3 times x cm3 where x > = 10 cm3 and maximum volume does not exceed collector capacity. A correct calculation for a mass of ammonium nitrate that will produce one of the gas volumes above. Or a volume from a stated mass. This calculation is not restricted to the capacity of the gas collector. Stopping at a constant volume of gas (not constant mass)/ all solid disappeared/syringe plunger stops moving. Must be an observation not a deduction as – all decomposed or no more gas. [1] [1] [1] [1] (e) PLAN Method Identification of ammonium nitrate as oxidising or explosive (Not NH4NO3 combustible) from the hazcard information and giving a suitable precaution – keeping away from combustible material / wear (chemical) resistant gloves. Accept hot apparatus with heat resistant gloves/tongs. [1] (f) PLAN Method Four columns are required. mass/weight (not amount) of ammonium nitrate (/g); volume of nitrogen(I) oxide (/cm3) (/dm3); number of moles of ammonium nitrate (no unit); number of moles of nitrogen(I) oxide (no unit). The full word for the unit can be used with or without / or (). Four fully correct, two marks; three correct, one mark; otherwise zero. [2] [Total: 15]
Mark scheme, page 4
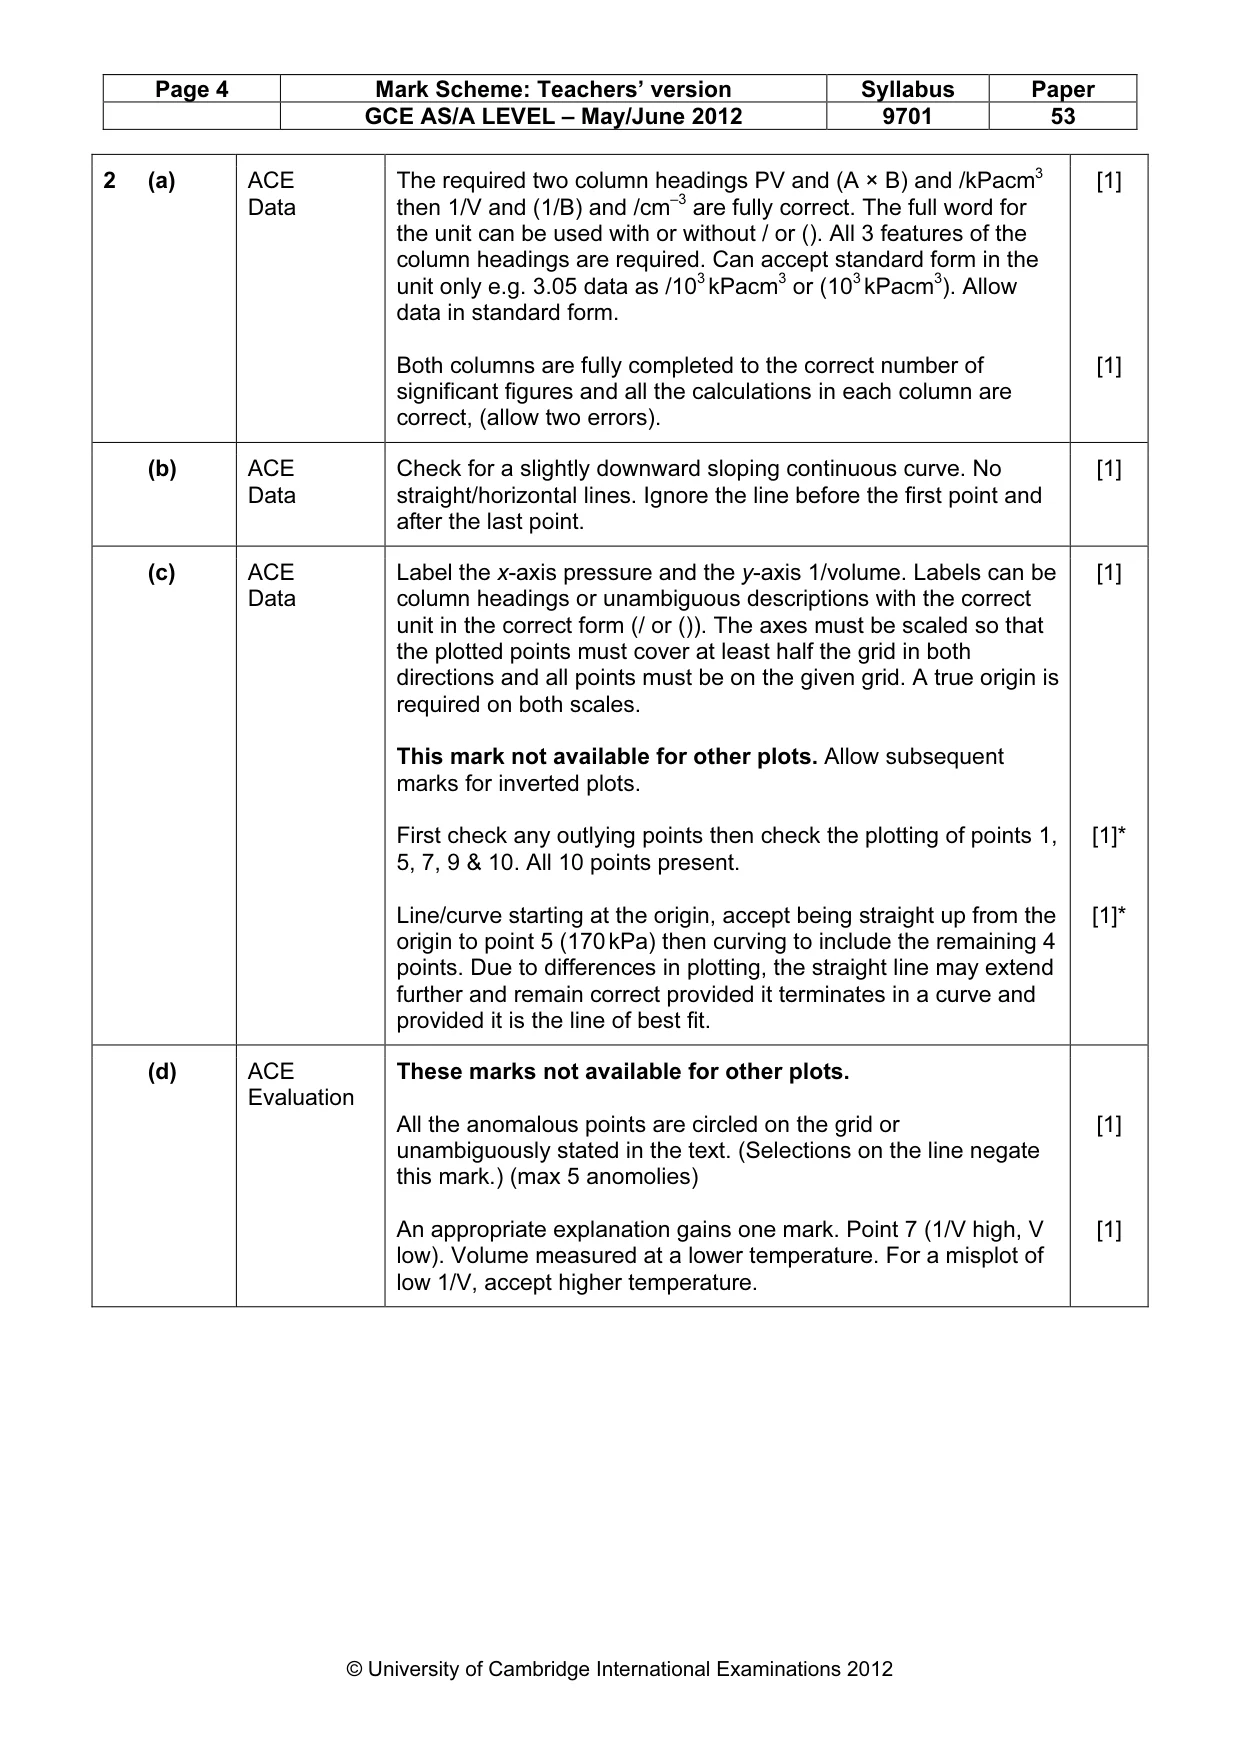
Page 4 Mark Scheme: Teachers’ version Syllabus Paper GCE AS/A LEVEL – May/June 2012 9701 53 © University of Cambridge International Examinations 2012 2 (a) ACE Data The required two column headings PV and (A × B) and /kPacm3 then 1/V and (1/B) and /cm–3 are fully correct. The full word for the unit can be used with or without / or (). All 3 features of the column headings are required. Can accept standard form in the unit only e.g. 3.05 data as /103 kPacm3 or (103 kPacm3). Allow data in standard form. Both columns are fully completed to the correct number of significant figures and all the calculations in each column are correct, (allow two errors). [1] [1] (b) ACE Data Check for a slightly downward sloping continuous curve. No straight/horizontal lines. Ignore the line before the first point and after the last point. [1] (c) ACE Data Label the x-axis pressure and the y-axis 1/volume. Labels can be column headings or unambiguous descriptions with the correct unit in the correct form (/ or ()). The axes must be scaled so that the plotted points must cover at least half the grid in both directions and all points must be on the given grid. A true origin is required on both scales. This mark not available for other plots. Allow subsequent marks for inverted plots. First check any outlying points then check the plotting of points 1, 5, 7, 9 & 10. All 10 points present. Line/curve starting at the origin, accept being straight up from the origin to point 5 (170 kPa) then curving to include the remaining 4 points. Due to differences in plotting, the straight line may extend further and remain correct provided it terminates in a curve and provided it is the line of best fit. [1] [1]* [1]* (d) ACE Evaluation These marks not available for other plots. All the anomalous points are circled on the grid or unambiguously stated in the text. (Selections on the line negate this mark.) (max 5 anomolies) An appropriate explanation gains one mark. Point 7 (1/V high, V low). Volume measured at a lower temperature. For a misplot of low 1/V, accept higher temperature. [1] [1]
Mark scheme, page 5
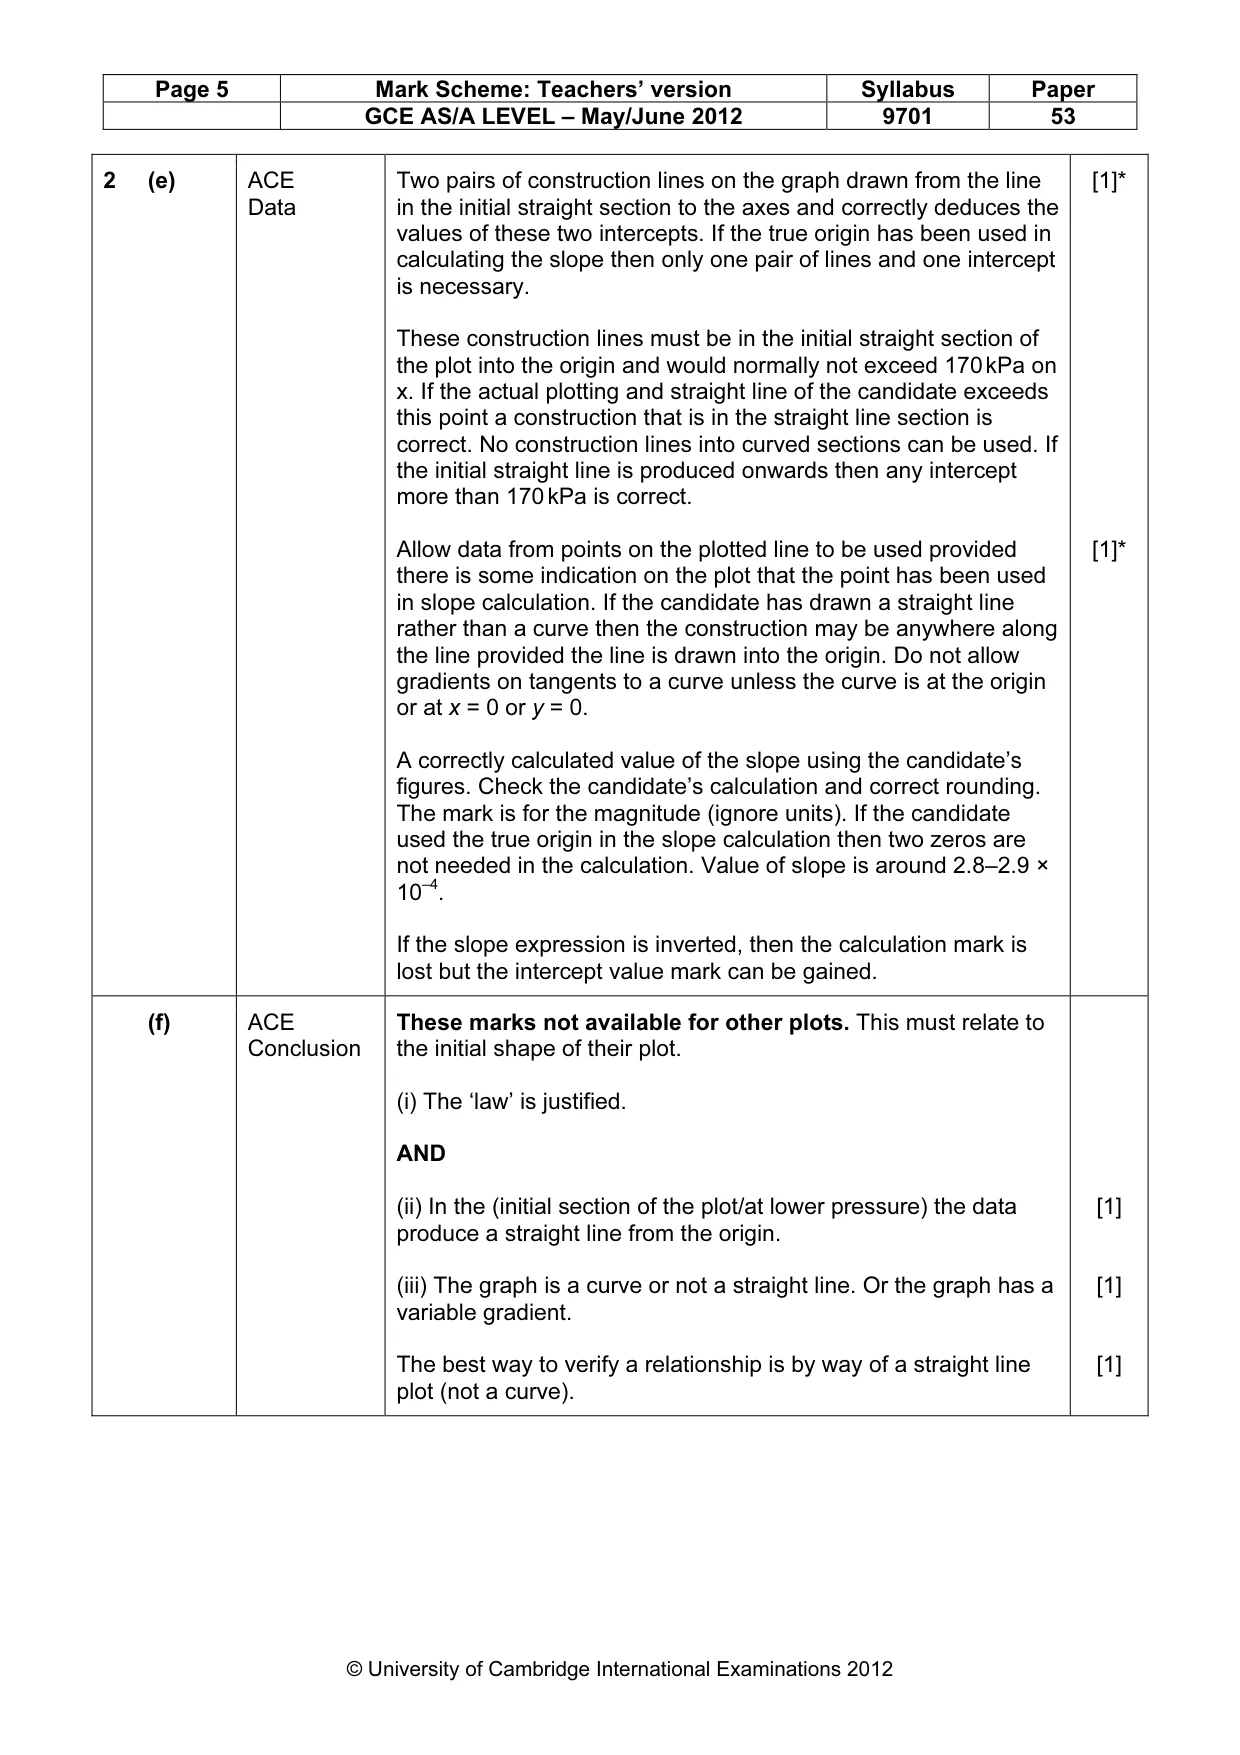
Page 5 Mark Scheme: Teachers’ version Syllabus Paper GCE AS/A LEVEL – May/June 2012 9701 53 © University of Cambridge International Examinations 2012 2 (e) ACE Data Two pairs of construction lines on the graph drawn from the line in the initial straight section to the axes and correctly deduces the values of these two intercepts. If the true origin has been used in calculating the slope then only one pair of lines and one intercept is necessary. These construction lines must be in the initial straight section of the plot into the origin and would normally not exceed 170 kPa on x. If the actual plotting and straight line of the candidate exceeds this point a construction that is in the straight line section is correct. No construction lines into curved sections can be used. If the initial straight line is produced onwards then any intercept more than 170 kPa is correct. Allow data from points on the plotted line to be used provided there is some indication on the plot that the point has been used in slope calculation. If the candidate has drawn a straight line rather than a curve then the construction may be anywhere along the line provided the line is drawn into the origin. Do not allow gradients on tangents to a curve unless the curve is at the origin or at x = 0 or y = 0. A correctly calculated value of the slope using the candidate’s figures. Check the candidate’s calculation and correct rounding. The mark is for the magnitude (ignore units). If the candidate used the true origin in the slope calculation then two zeros are not needed in the calculation. Value of slope is around 2.8–2.9 × 10⁻⁴. If the slope expression is inverted, then the calculation mark is lost but the intercept value mark can be gained. [1]* [1]* (f) ACE Conclusion These marks not available for other plots. This must relate to the initial shape of their plot. (i) The ‘law’ is justified. AND (ii) In the (initial section of the plot/at lower pressure) the data produce a straight line from the origin. (iii) The graph is a curve or not a straight line. Or the graph has a variable gradient. The best way to verify a relationship is by way of a straight line plot (not a curve). [1] [1] [1]
Mark scheme, page 6
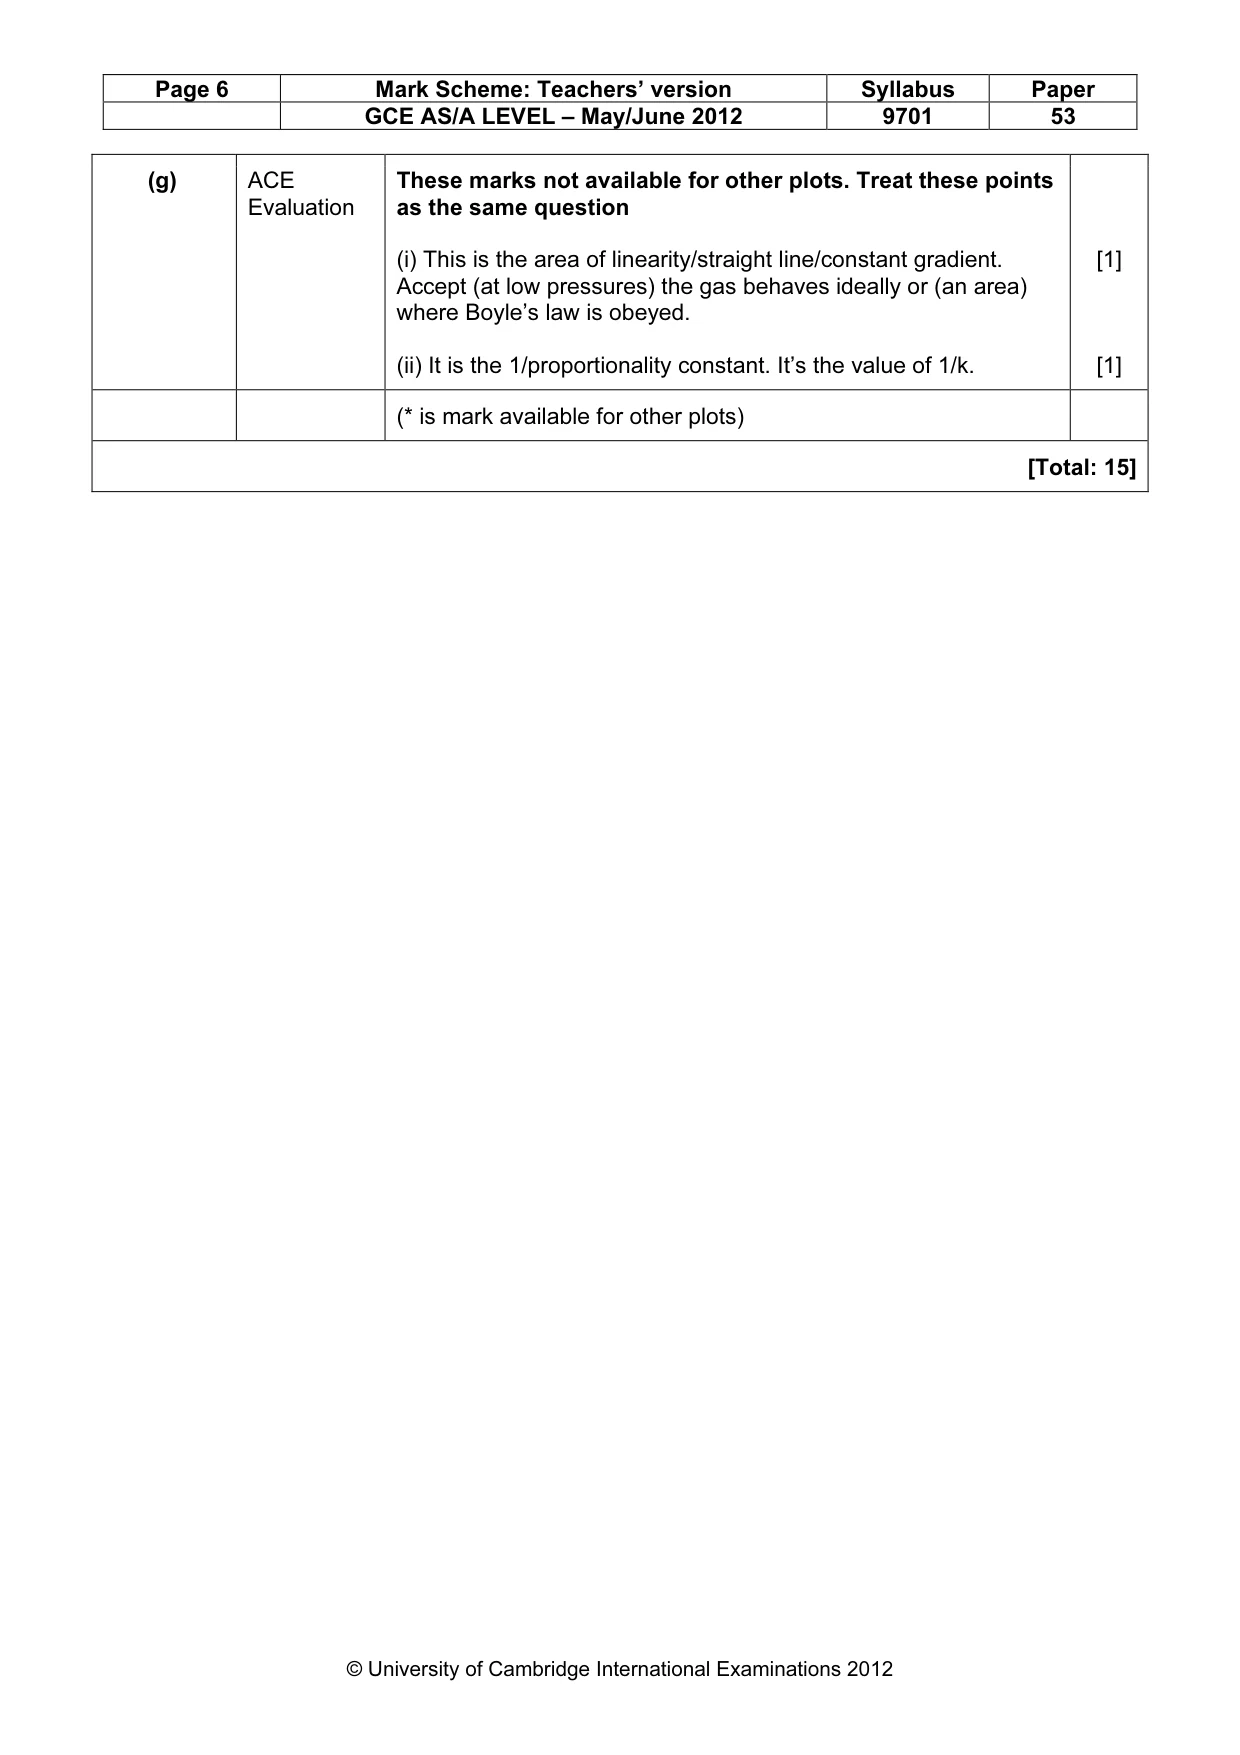
Page 6 Mark Scheme: Teachers’ version Syllabus Paper GCE AS/A LEVEL – May/June 2012 9701 53 © University of Cambridge International Examinations 2012 (g) ACE Evaluation These marks not available for other plots. Treat these points as the same question (i) This is the area of linearity/straight line/constant gradient. Accept (at low pressures) the gas behaves ideally or (an area) where Boyle’s law is obeyed. (ii) It is the 1/proportionality constant. It’s the value of 1/k. [1] [1] (* is mark available for other plots) [Total: 15]
What you needed in this session
Cambridge’s own grade thresholds for 2012 May/June, Paper 5 · Variant 3. A higher threshold means an easier paper — the bar moves with how the cohort did.