Cambridge A Level Chemistry 9701 — 2010 Oct/Nov Paper 5 · Variant 3
9701/53/O/N/10 · 30 marks · ≈34 min
The question paper and its mark scheme, free to read here and free to download. This is Cambridge’s own paper, exactly as it was sat.
Question paper12 pages



Mark scheme5 pages
Answers below. Sit the paper first if you are practising.
Paper as text
Question paper, page 1
This document consists of 9 printed pages and 3 blank pages. DC (NF/DJ) 30600/3 © UCLES 2010 [Turn over UNIVERSITY OF CAMBRIDGE INTERNATIONAL EXAMINATIONS General Certificate of Education Advanced Level * 5 5 0 5 3 1 2 1 6 5 * CHEMISTRY 9701/53 Paper 5 Planning, Analysis and Evaluation October/November 2010 1 hour 15 minutes Candidates answer on the Question Paper. No Additional Materials are required. READ THESE INSTRUCTIONS FIRST Write your Centre number, candidate number and name on all the work you hand in. Write in dark blue or black pen. You may use a soft pencil for any diagrams, graphs or rough working. Do not use staples, paper clips, highlighters, glue or correction fluid. DO NOT WRITE IN ANY BARCODES. Answer all questions. You are advised to show all working in calculations. Use of a Data Booklet is unnecessary. At the end of the examination, fasten all your work securely together. The number of marks is given in brackets [ ] at the end of each question or part question. For Examiner’s Use 1 2 Total
Question paper, page 2
2 9701/53/O/N/10 © UCLES 2010 BLANK PAGE
Question paper, page 3
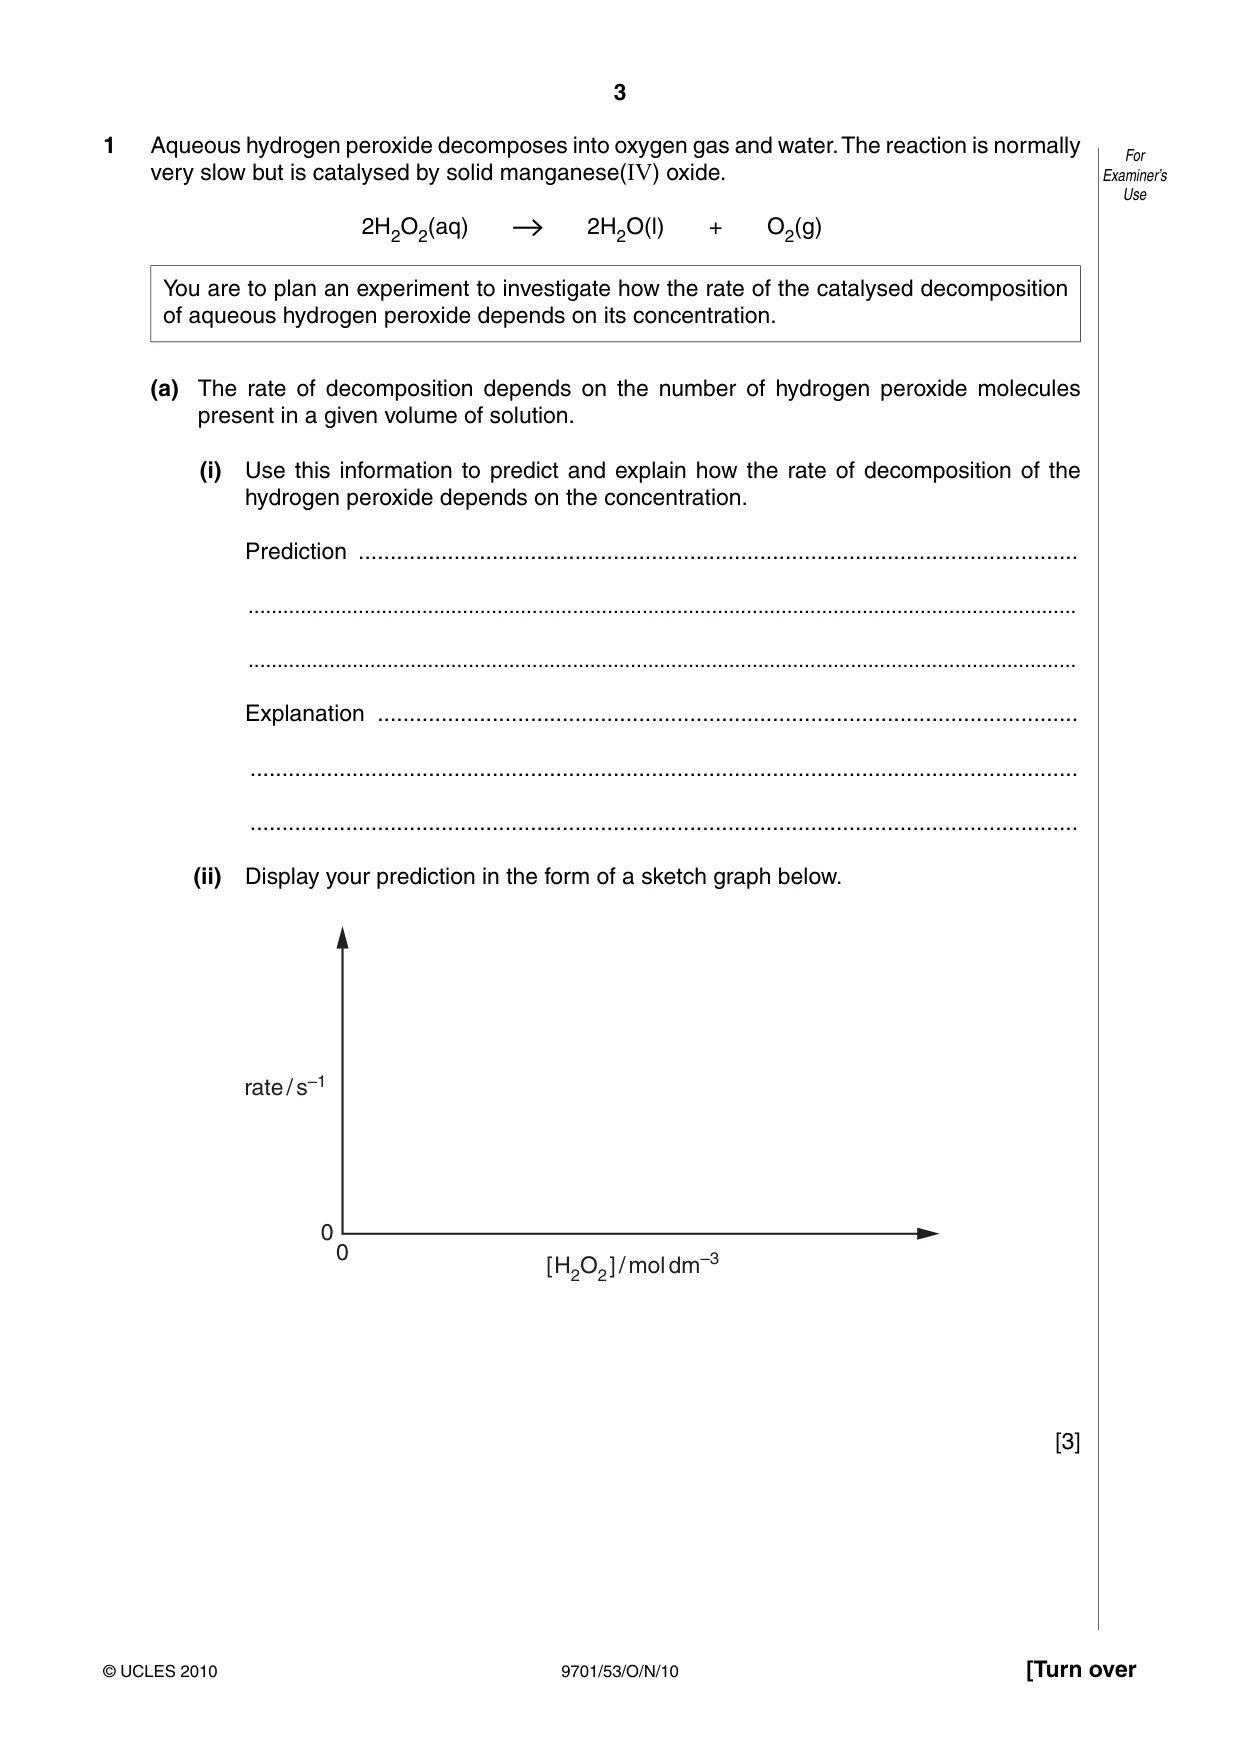
3 9701/53/O/N/10 © UCLES 2010 [Turn over For Examiner’s Use 1 Aqueous hydrogen peroxide decomposes into oxygen gas and water. The reaction is normally very slow but is catalysed by solid manganese(IV) oxide. 2H2O2(aq) 2H2O(l) + O2(g) You are to plan an experiment to investigate how the rate of the catalysed decomposition of aqueous hydrogen peroxide depends on its concentration. (a) The rate of decomposition depends on the number of hydrogen peroxide molecules present in a given volume of solution. (i) Use this information to predict and explain how the rate of decomposition of the hydrogen peroxide depends on the concentration. Prediction … … … Explanation … … … (ii) Display your prediction in the form of a sketch graph below. rate / s–1 [ H2O2 ] / mol dm–3 0 0 [3]
Question paper, page 4
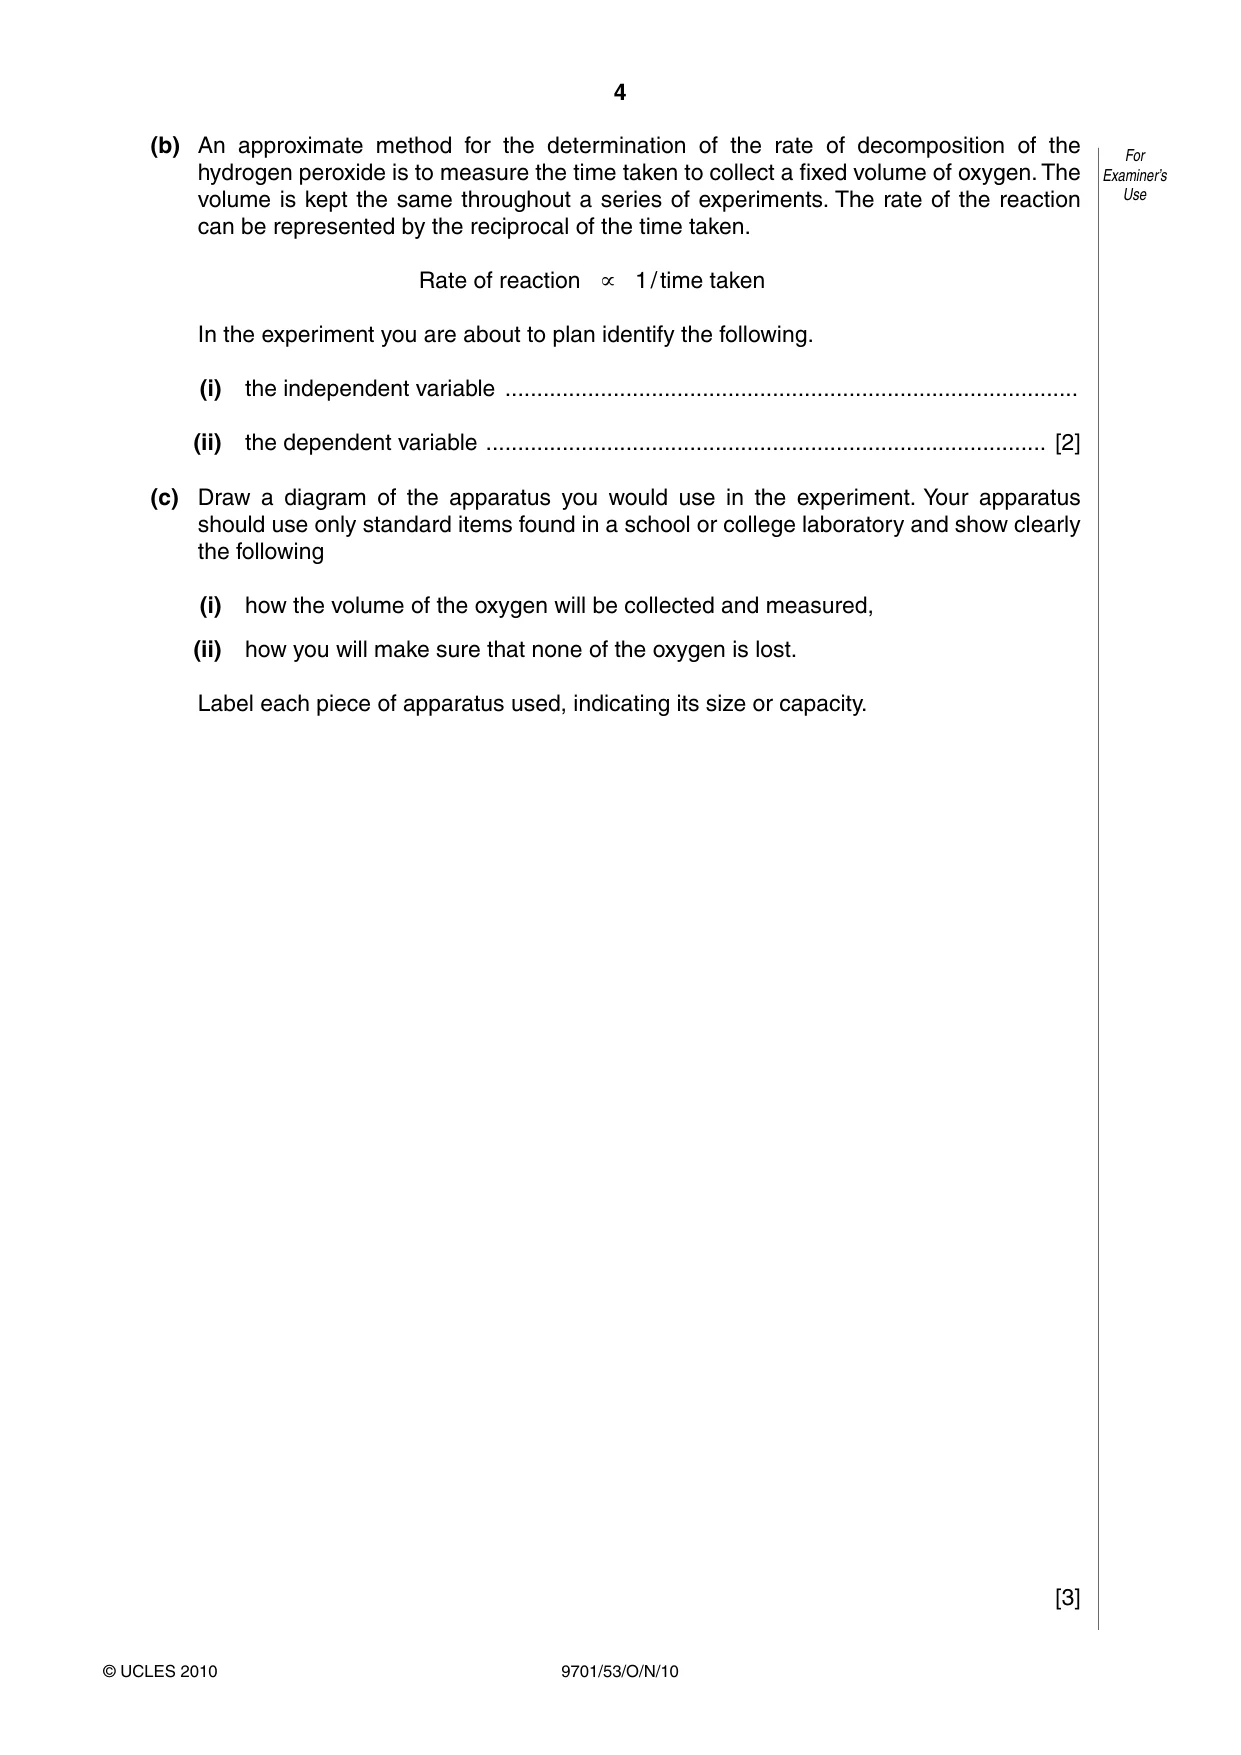
4 9701/53/O/N/10 © UCLES 2010 For Examiner’s Use (b) An approximate method for the determination of the rate of decomposition of the hydrogen peroxide is to measure the time taken to collect a fixed volume of oxygen. The volume is kept the same throughout a series of experiments. The rate of the reaction can be represented by the reciprocal of the time taken. Rate of reaction ∝ 1 / time taken In the experiment you are about to plan identify the following. (i) the independent variable … (ii) the dependent variable … [2] (c) Draw a diagram of the apparatus you would use in the experiment. Your apparatus should use only standard items found in a school or college laboratory and show clearly the following (i) how the volume of the oxygen will be collected and measured, (ii) how you will make sure that none of the oxygen is lost. Label each piece of apparatus used, indicating its size or capacity. [3]
Question paper, page 5
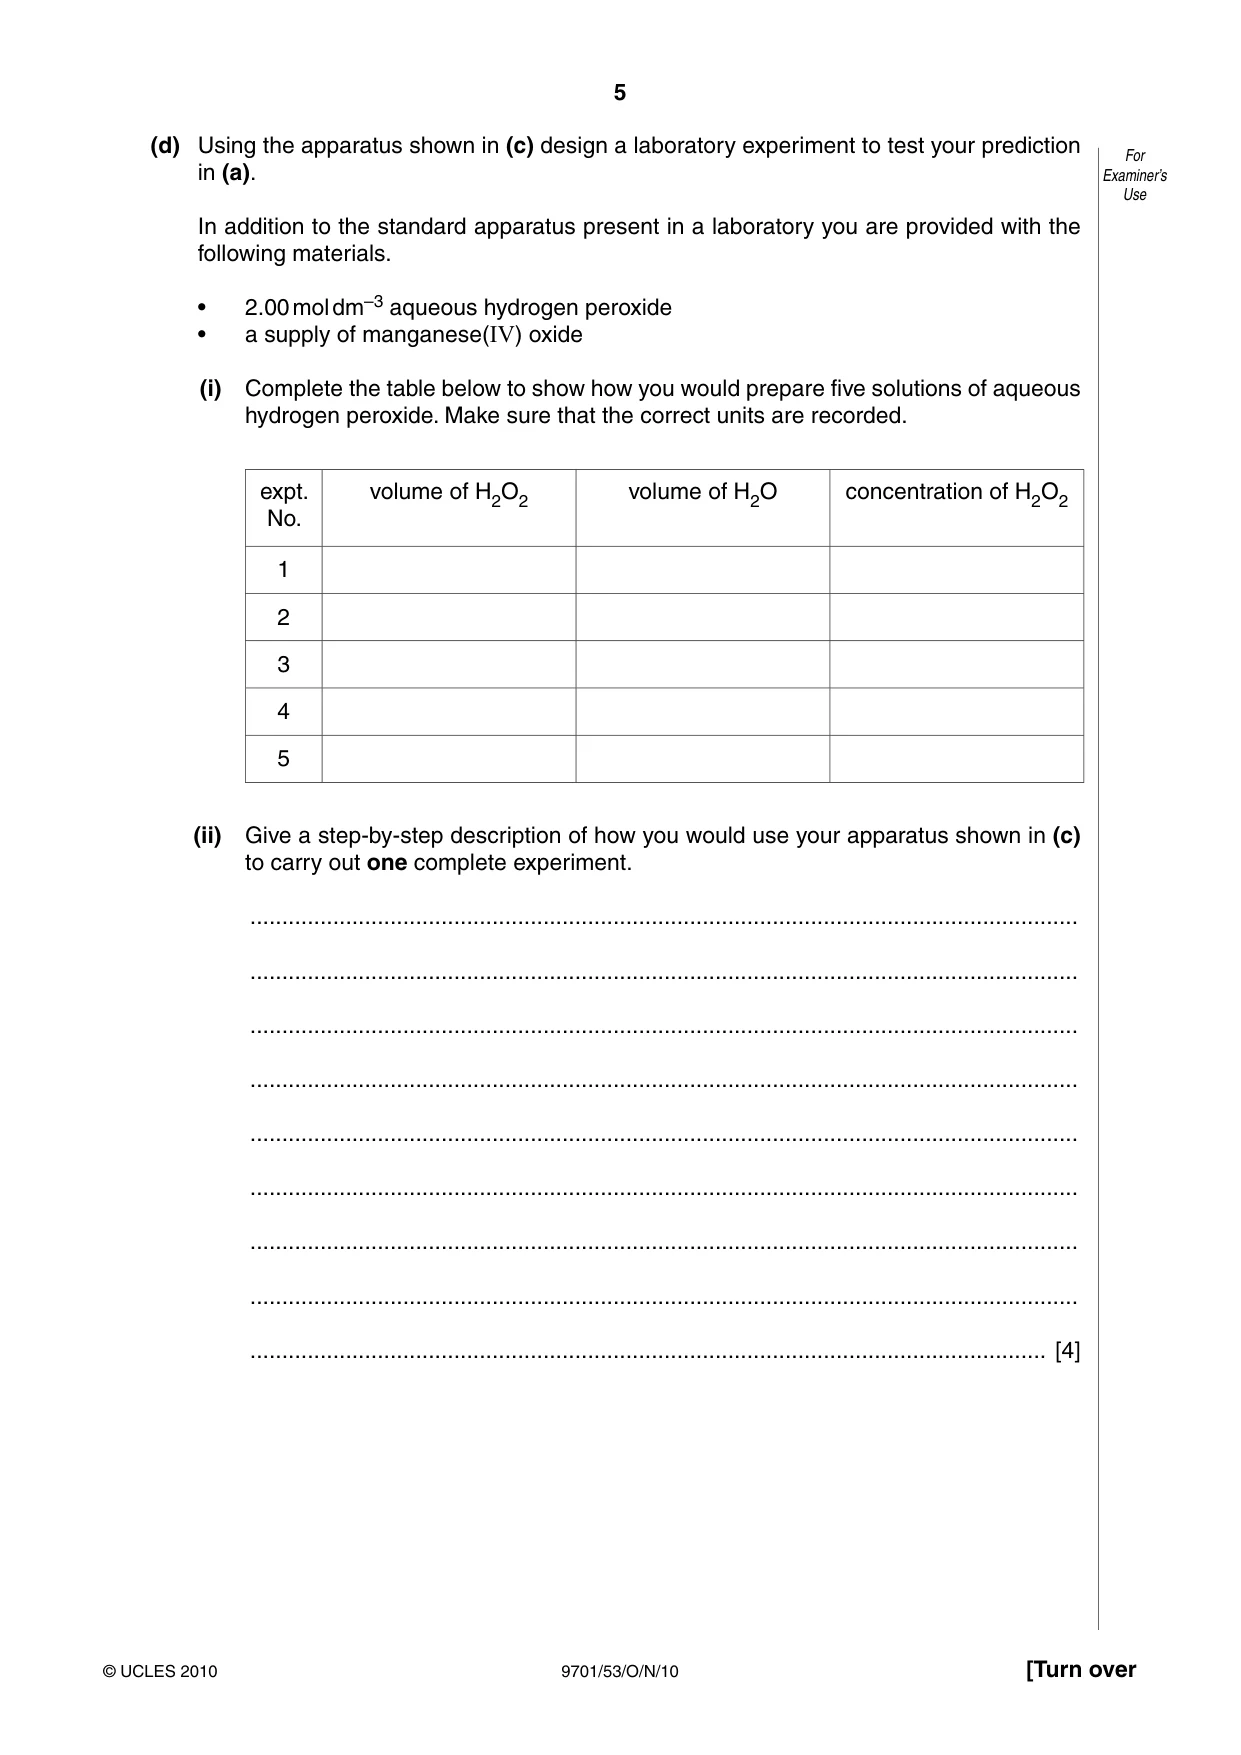
5 9701/53/O/N/10 © UCLES 2010 [Turn over For Examiner’s Use (d) Using the apparatus shown in (c) design a laboratory experiment to test your prediction in (a). In addition to the standard apparatus present in a laboratory you are provided with the following materials. 2.00 mol dm • –3 aqueous hydrogen peroxide a supply of manganese( • IV) oxide (i) Complete the table below to show how you would prepare five solutions of aqueous hydrogen peroxide. Make sure that the correct units are recorded. expt. No. volume of H2O2 volume of H2O concentration of H2O2 1 2 3 4 5 (ii) Give a step-by-step description of how you would use your apparatus shown in (c) to carry out one complete experiment. … … … … … … … … … [4]
Question paper, page 6
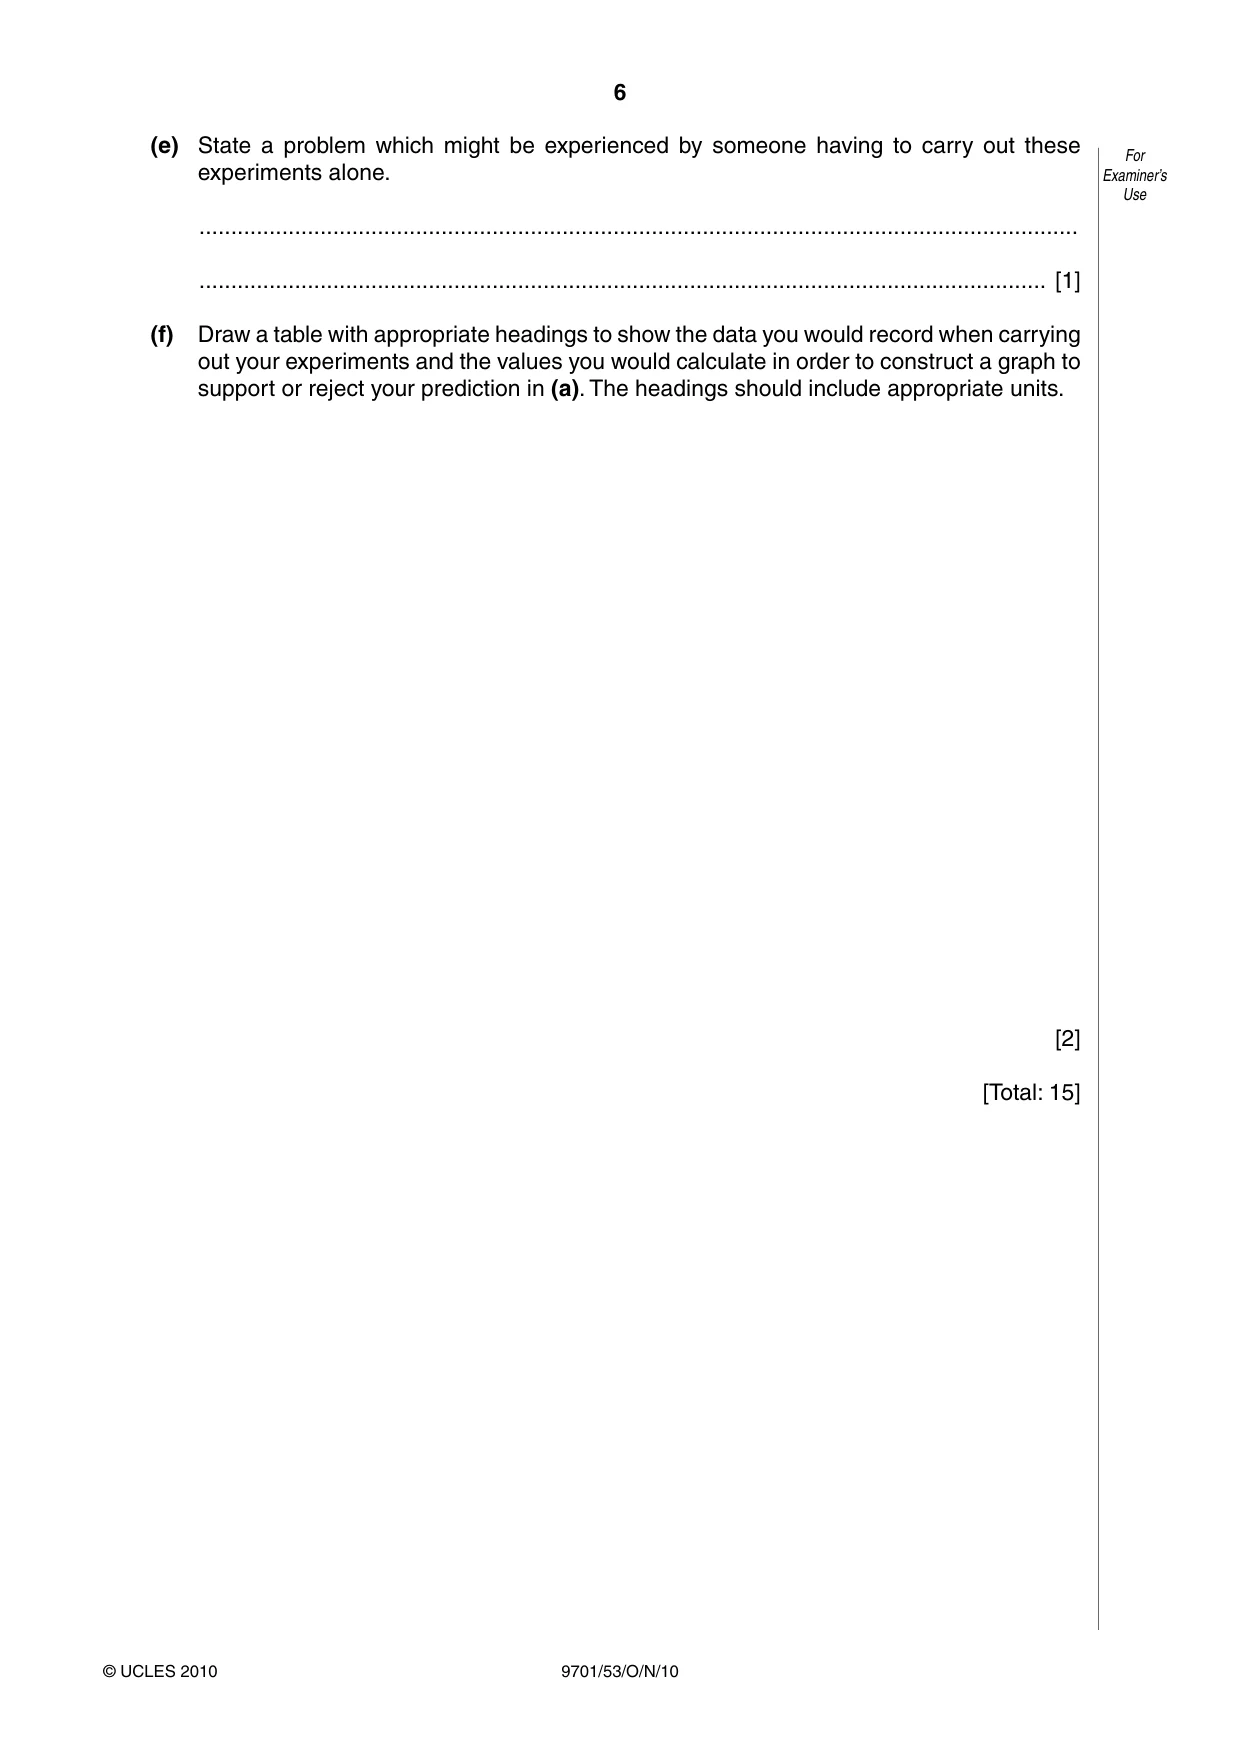
6 9701/53/O/N/10 © UCLES 2010 For Examiner’s Use (e) State a problem which might be experienced by someone having to carry out these experiments alone. … … [1] (f) Draw a table with appropriate headings to show the data you would record when carrying out your experiments and the values you would calculate in order to construct a graph to support or reject your prediction in (a). The headings should include appropriate units. [2] [Total: 15]
Question paper, page 7
7 9701/53/O/N/10 © UCLES 2010 [Turn over BLANK PAGE
Question paper, page 8
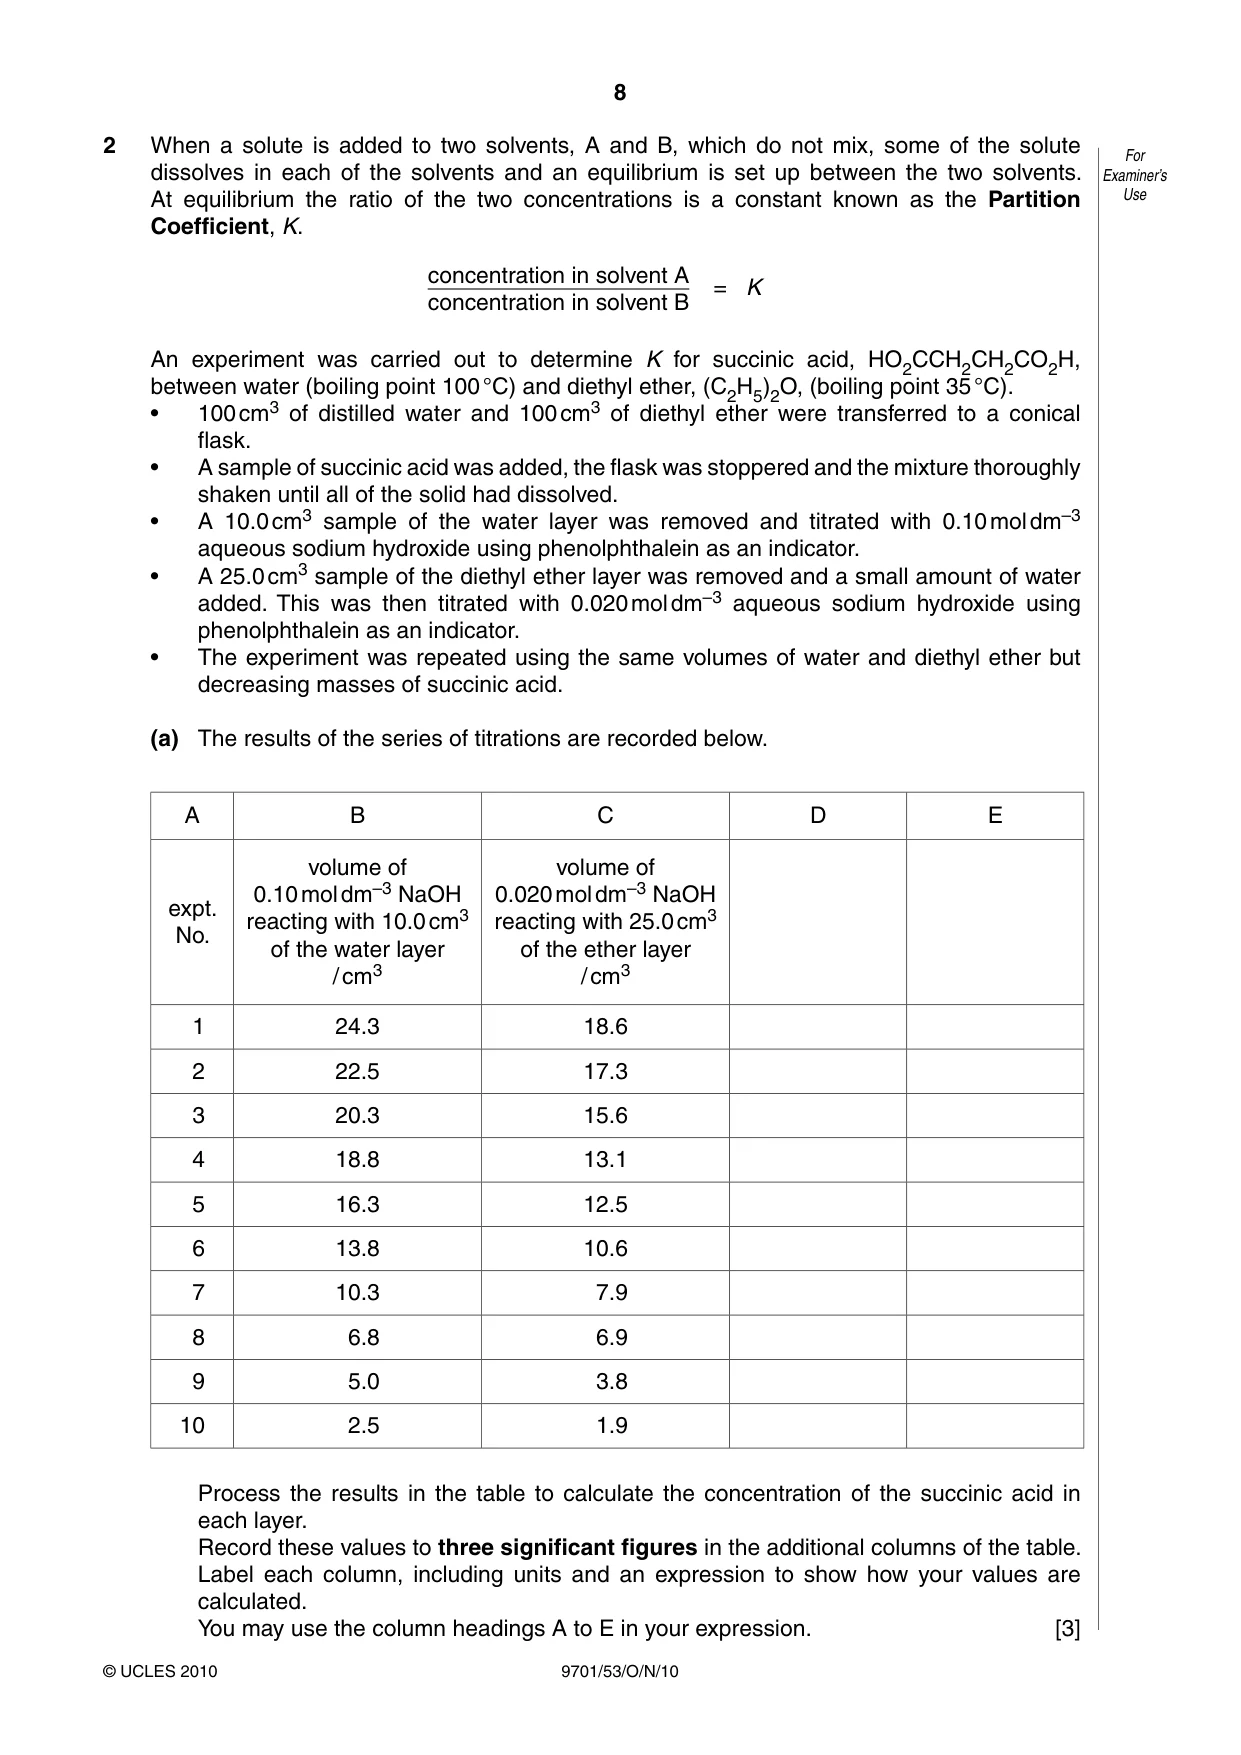
8 9701/53/O/N/10 © UCLES 2010 For Examiner’s Use 2 When a solute is added to two solvents, A and B, which do not mix, some of the solute dissolves in each of the solvents and an equilibrium is set up between the two solvents. At equilibrium the ratio of the two concentrations is a constant known as the Partition Coefficient, K. concentration in solvent A concentration in solvent B = K An experiment was carried out to determine K for succinic acid, HO2CCH2CH2CO2H, between water (boiling point 100 °C) and diethyl ether, (C2H5)2O, (boiling point 35 °C). 100 cm • 3 of distilled water and 100 cm3 of diethyl ether were transferred to a conical flask. A sample of succinic acid was added, the flask was stoppered and the mixture thoroughly • shaken until all of the solid had dissolved. A 10.0 cm • 3 sample of the water layer was removed and titrated with 0.10 mol dm–3 aqueous sodium hydroxide using phenolphthalein as an indicator. A 25.0 cm • 3 sample of the diethyl ether layer was removed and a small amount of water added. This was then titrated with 0.020 mol dm–3 aqueous sodium hydroxide using phenolphthalein as an indicator. The experiment was repeated using the same volumes of water and diethyl ether but • decreasing masses of succinic acid. (a) The results of the series of titrations are recorded below. A B C D E expt. No. volume of 0.10 mol dm–3 NaOH reacting with 10.0 cm3 of the water layer / cm3 volume of 0.020 mol dm–3 NaOH reacting with 25.0 cm3 of the ether layer / cm3 1 24.3 18.6 2 22.5 17.3 3 20.3 15.6 4 18.8 13.1 5 16.3 12.5 6 13.8 10.6 7 10.3 7.9 8 6.8 6.9 9 5.0 3.8 10 2.5 1.9 Process the results in the table to calculate the concentration of the succinic acid in each layer. Record these values to three significant figures in the additional columns of the table. Label each column, including units and an expression to show how your values are calculated. You may use the column headings A to E in your expression. [3]
Question paper, page 9
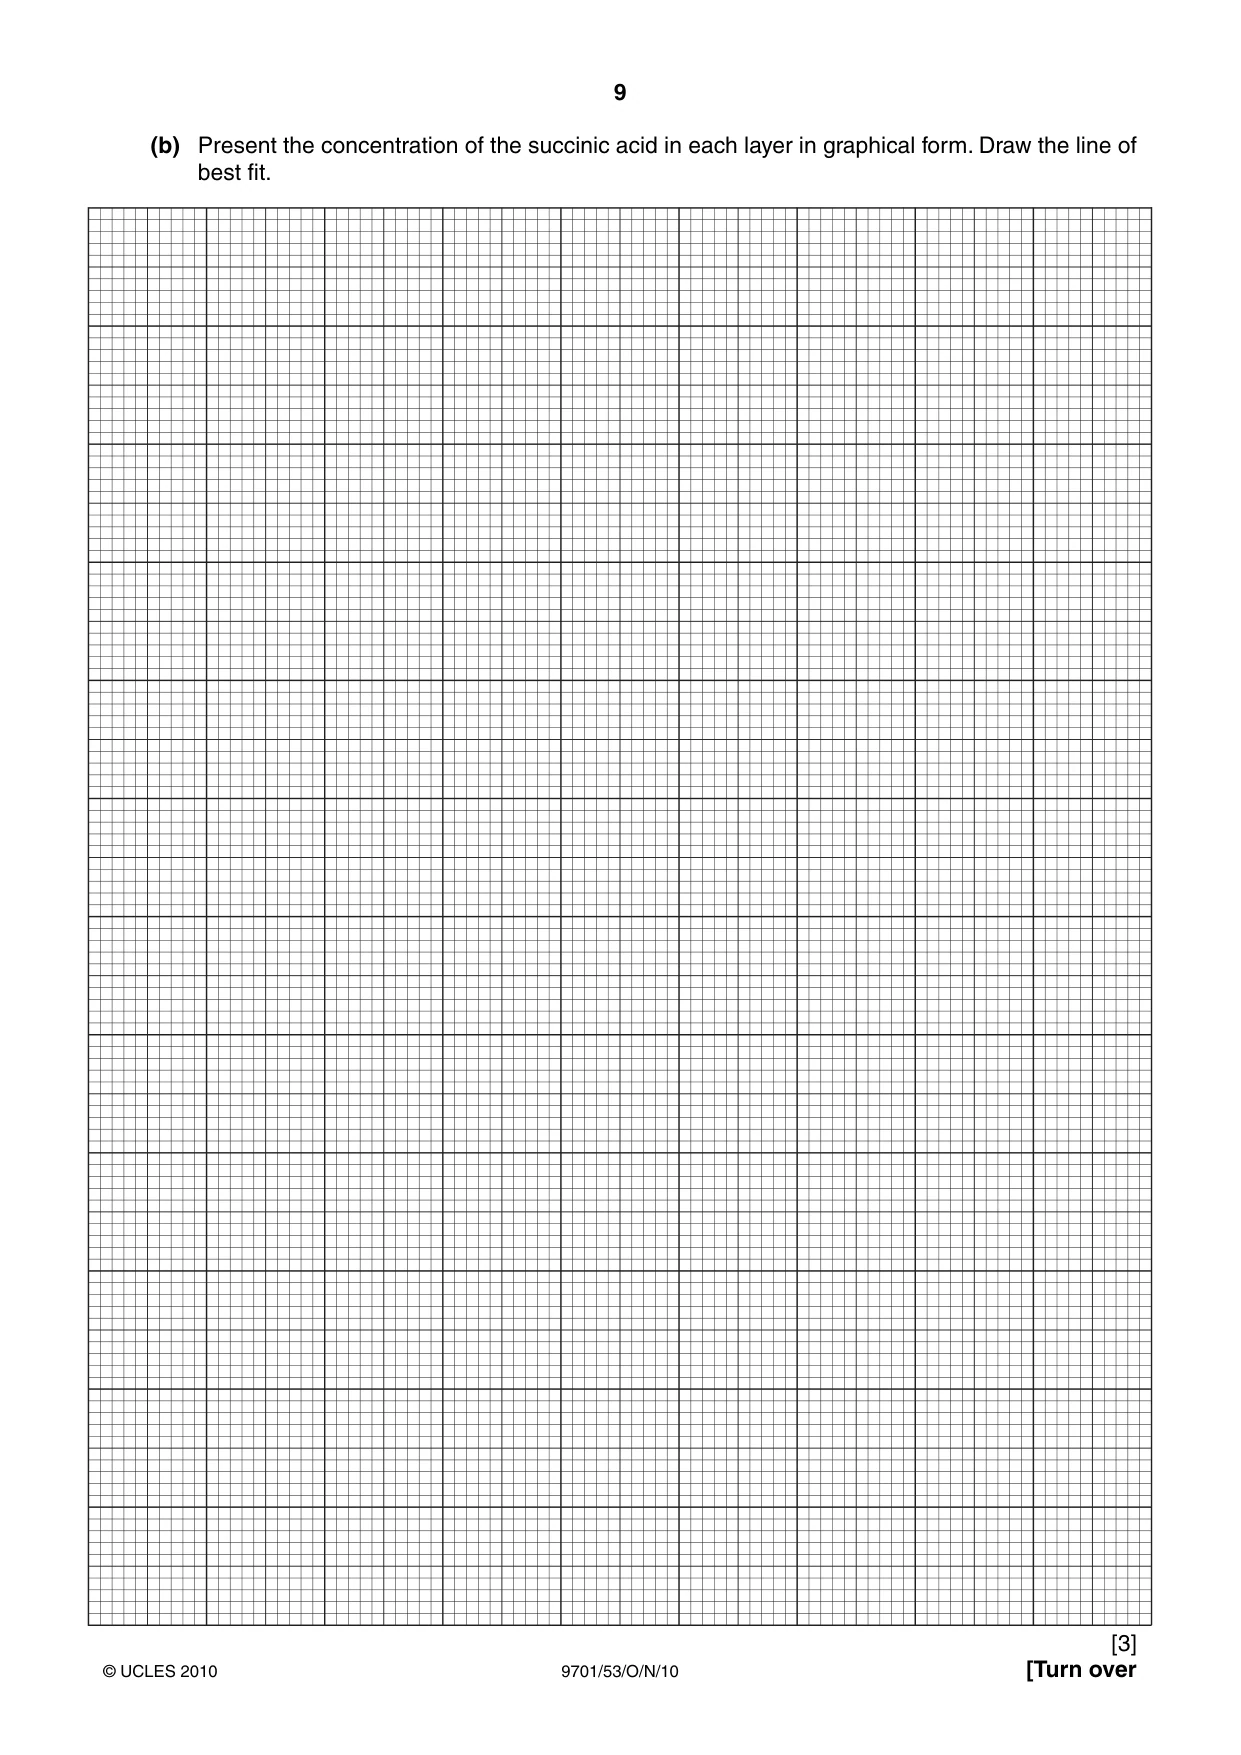
9 9701/53/O/N/10 © UCLES 2010 [Turn over (b) Present the concentration of the succinic acid in each layer in graphical form. Draw the line of best fit. [3]
Question paper, page 10
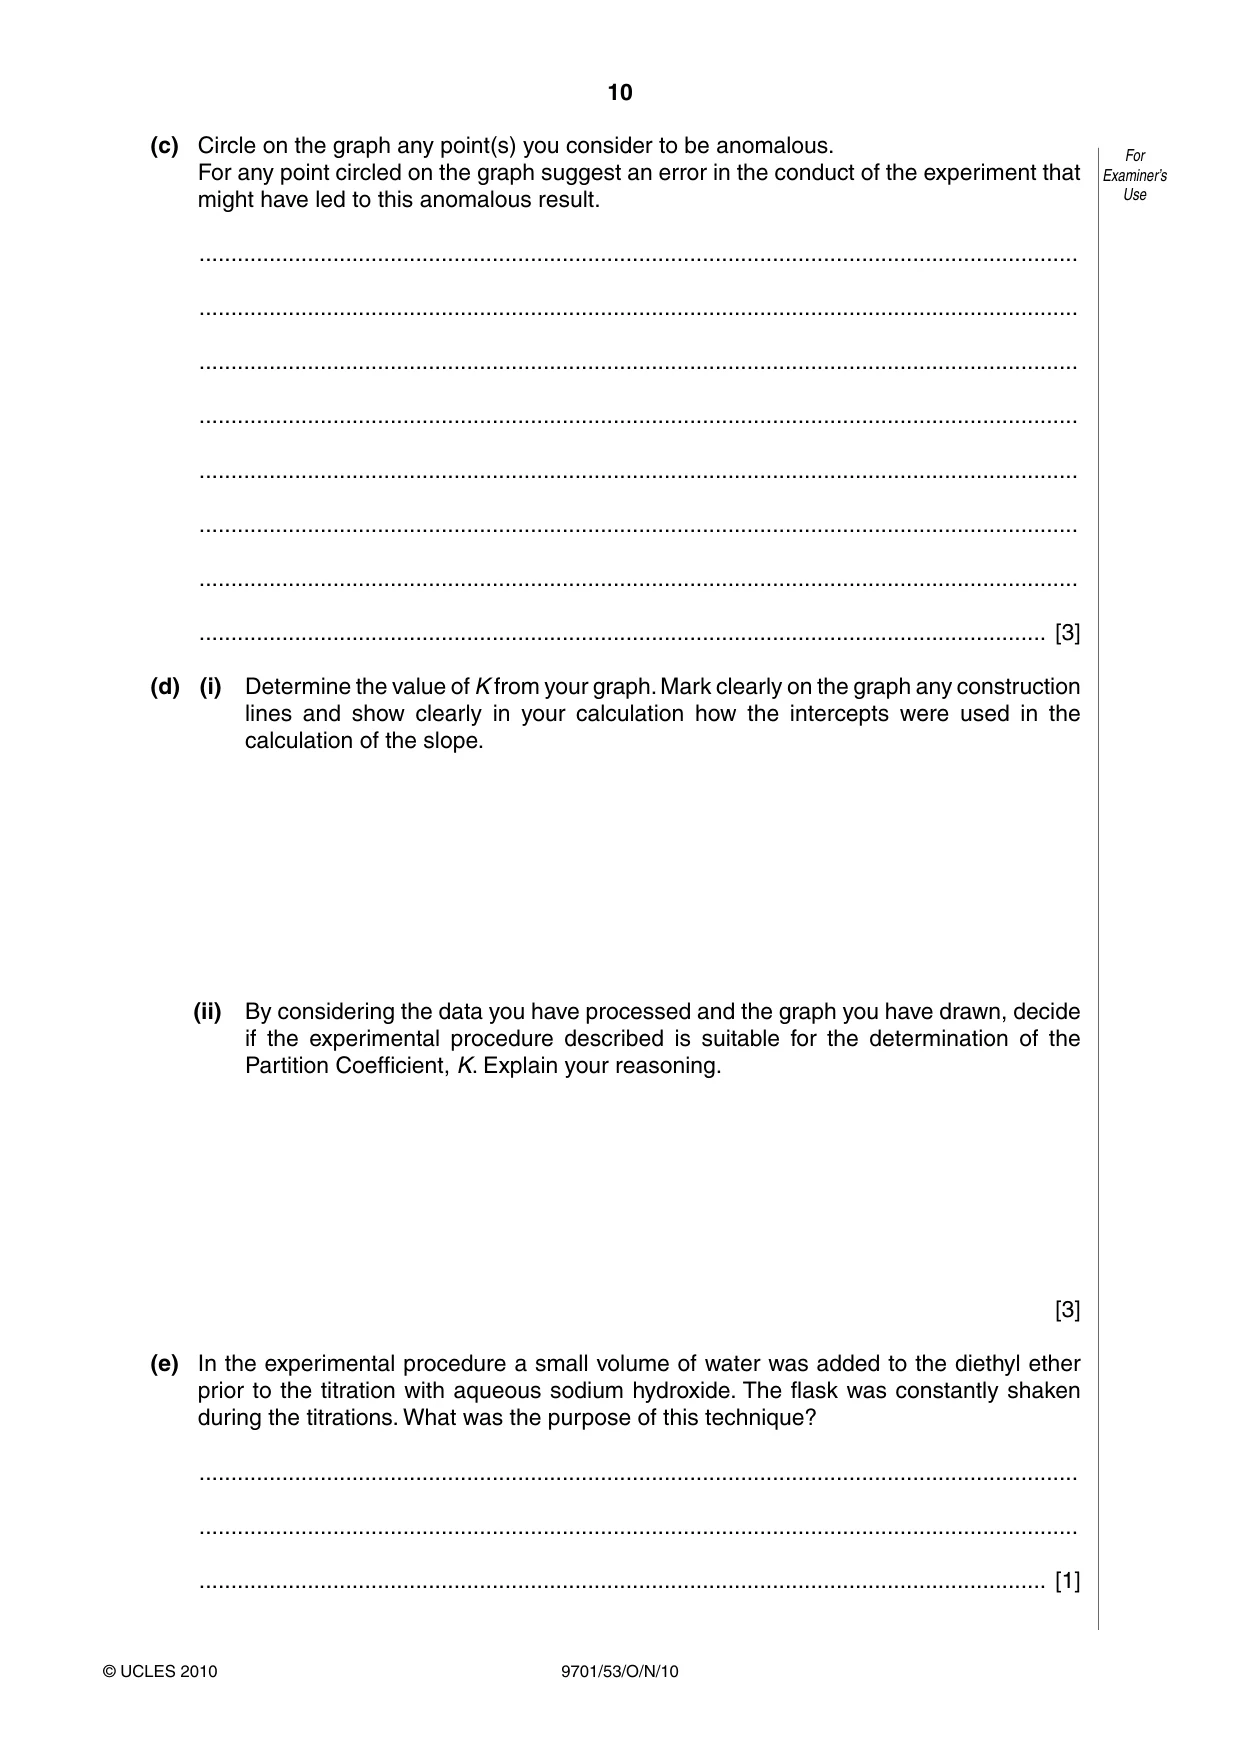
10 9701/53/O/N/10 © UCLES 2010 For Examiner’s Use (c) Circle on the graph any point(s) you consider to be anomalous. For any point circled on the graph suggest an error in the conduct of the experiment that might have led to this anomalous result. … … … … … … … … [3] (d) (i) Determine the value of K from your graph. Mark clearly on the graph any construction lines and show clearly in your calculation how the intercepts were used in the calculation of the slope. (ii) By considering the data you have processed and the graph you have drawn, decide if the experimental procedure described is suitable for the determination of the Partition Coefficient, K. Explain your reasoning. [3] (e) In the experimental procedure a small volume of water was added to the diethyl ether prior to the titration with aqueous sodium hydroxide. The flask was constantly shaken during the titrations. What was the purpose of this technique? … … … [1]
Question paper, page 11
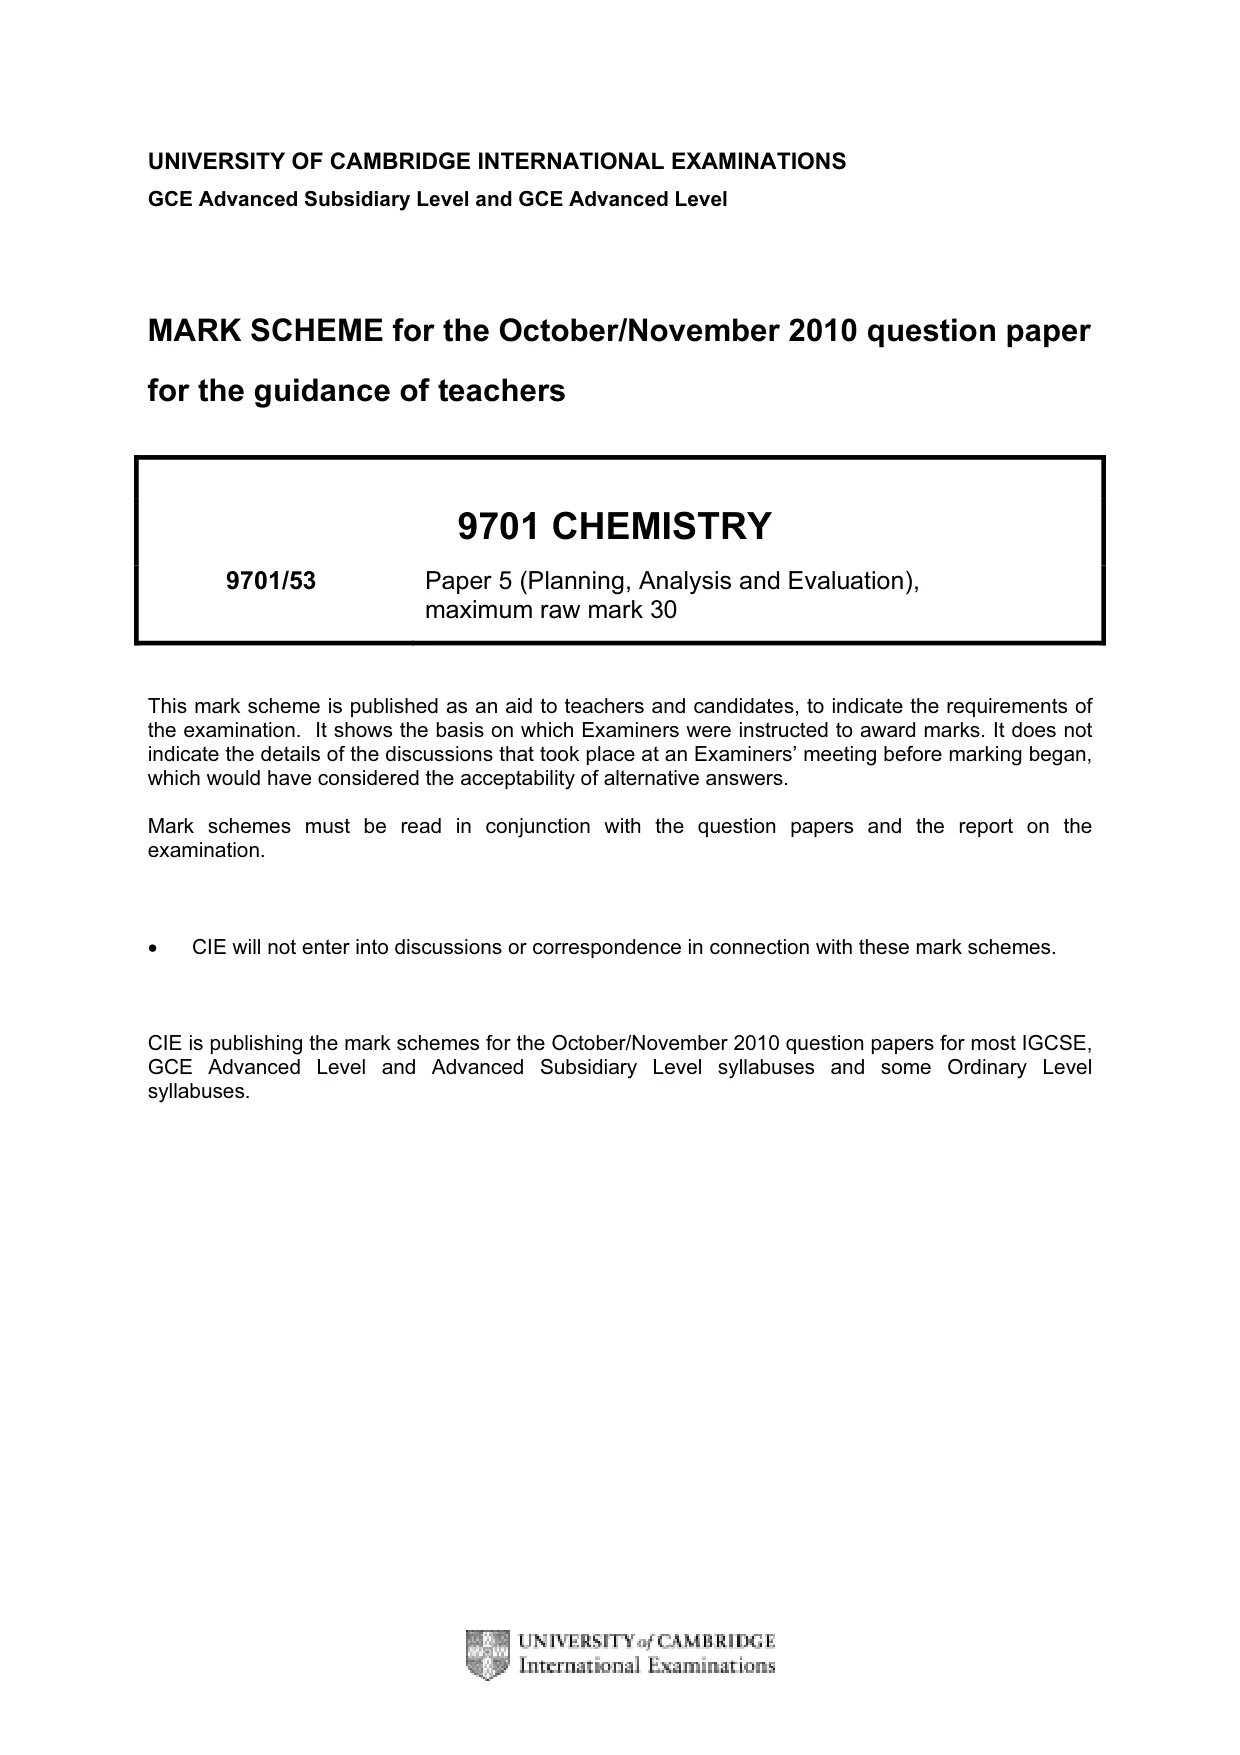
11 9701/53/O/N/10 © UCLES 2010 For Examiner’s Use (f) Using a burette, the error associated with a titration depends on the value of the titre. Comment on the magnitude of the titres recorded in the table in (a) and indicate, with reasons, which have the highest error. … … … [2] [Total: 15]
Question paper, page 12
12 9701/53/O/N/10 © UCLES 2010 Permission to reproduce items where third-party owned material protected by copyright is included has been sought and cleared where possible. Every reasonable effort has been made by the publisher (UCLES) to trace copyright holders, but if any items requiring clearance have unwittingly been included, the publisher will be pleased to make amends at the earliest possible opportunity. University of Cambridge International Examinations is part of the Cambridge Assessment Group. Cambridge Assessment is the brand name of University of Cambridge Local Examinations Syndicate (UCLES), which is itself a department of the University of Cambridge. BLANK PAGE
Mark scheme, page 1
UNIVERSITY OF CAMBRIDGE INTERNATIONAL EXAMINATIONS GCE Advanced Subsidiary Level and GCE Advanced Level MARK SCHEME for the October/November 2010 question paper for the guidance of teachers 9701 CHEMISTRY 9701/53 Paper 5 (Planning, Analysis and Evaluation), maximum raw mark 30 This mark scheme is published as an aid to teachers and candidates, to indicate the requirements of the examination. It shows the basis on which Examiners were instructed to award marks. It does not indicate the details of the discussions that took place at an Examiners’ meeting before marking began, which would have considered the acceptability of alternative answers. Mark schemes must be read in conjunction with the question papers and the report on the examination. • CIE will not enter into discussions or correspondence in connection with these mark schemes. CIE is publishing the mark schemes for the October/November 2010 question papers for most IGCSE, GCE Advanced Level and Advanced Subsidiary Level syllabuses and some Ordinary Level syllabuses.
Mark scheme, page 2
Page 2 Mark Scheme: Teachers’ version Syllabus Paper GCE A/AS LEVEL – October/November 2010 9701 53 © UCLES 2010 Question Sections Indicative material Mark 1 (a) (i) PLAN Problem Qualitative answer only for the first mark. Predicts any direct proportionality. E.g. Increasing concentration increases rate or doubling the molecules per unit volume (concentration) doubles the rate. Could gain this mark from next part. No ecf for opposite answer. Increasing concentration/molecules per unit volume increases frequency of collisions. [1] [1] (ii) PLAN Problem A diagonal straight-line of positive gradient going through the origin (+/– 1mm). No up or down curves or plateaux. If part (i) refers to some description of catalyst saturation, then accept a straight line horizontal plateau after the up straight line. [1] (b) PLAN Problem Independent variable – concentration of H2O2. Do not allow volume/moles/amount. Has to be concentration. Dependent variable – Time for the fixed volume of oxygen (or a stated volume of oxygen) OR time OR time taken. Not rate of reaction (negator) as that is a derived quantity. [1] [1] (c)(i)(ii) PLAN Method Reaction vessel (conical flask) divided or with a small tube inside for the catalyst or any other internal separation device. Thistle or dropping funnels negate. Ignore heating Syringe or equivalent apparatus (over water) connected to the reaction vessel in an airtight format. The volume of the gas collecting apparatus shown and is not exceeding 1 dm3. [1] [1] [1] (d) (i) (ii) PLAN Method Completes the table. Correct units required for each column. 0 cm3 of H2O2 not allowed. Total volumes of solutions need not be constant. If reaction vessel mark awarded, give mark for shaking to react (catalyst and solution present). If a thistle or dropping funnel used then mark is for adding the liquid reagent to the catalyst. In other situations give mark for adding solid catalyst to the solution (only) and closing the vessel. Starting the reaction and a stopwatch simultaneously. Accept “start the clock” only if it is unambiguously related to the reaction start. Recording the time taken to produce a chosen/fixed volume of gas (15 cm3 for example). [1] [1] [1] [1] (e) PLAN Method Starting the reaction and the stopwatch simultaneously is difficult. Accept any reaction starting process in conjunction with starting the clock. Accept closing the apparatus and starting the clock. Do not accept loss of oxygen whilst closing the bung (neutral). [1]
Mark scheme, page 3
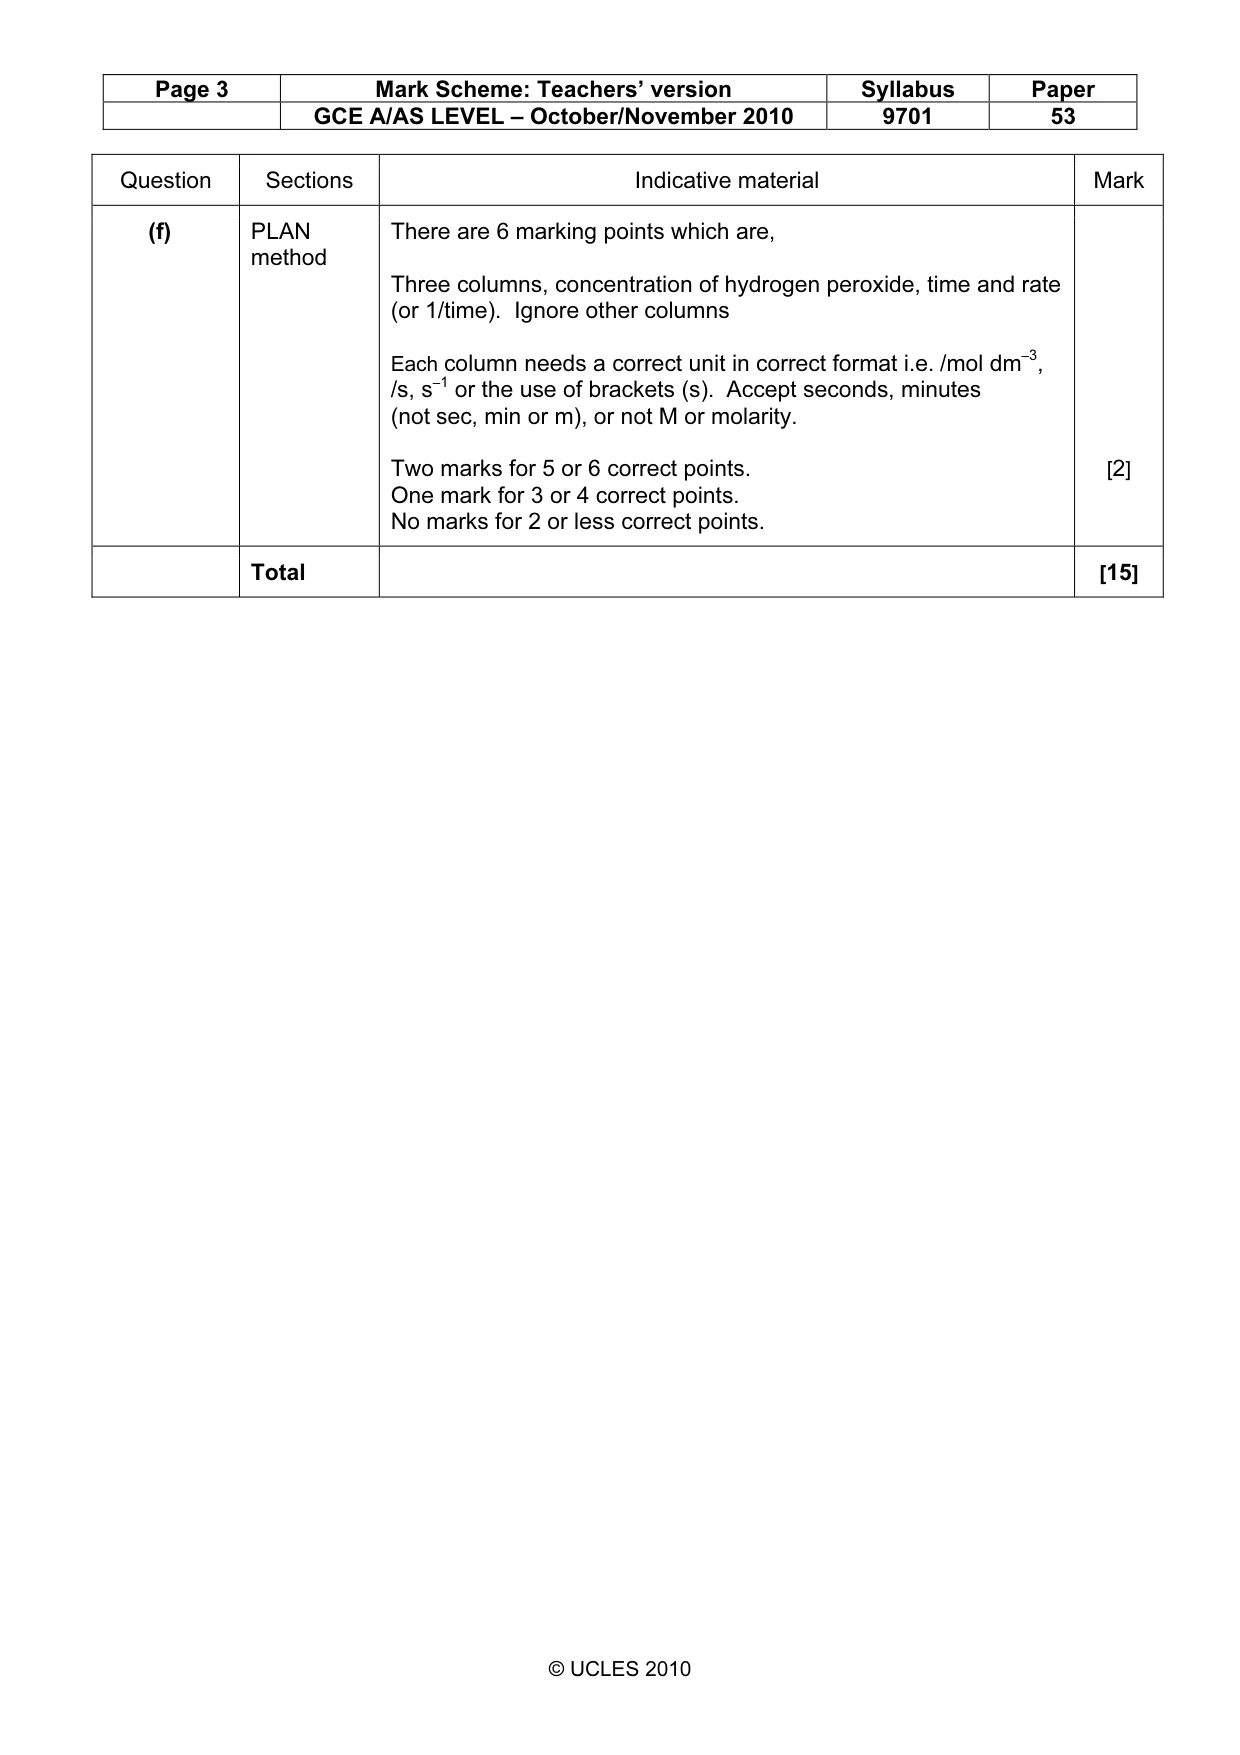
Page 3 Mark Scheme: Teachers’ version Syllabus Paper GCE A/AS LEVEL – October/November 2010 9701 53 © UCLES 2010 Question Sections Indicative material Mark (f) PLAN method There are 6 marking points which are, Three columns, concentration of hydrogen peroxide, time and rate (or 1/time). Ignore other columns Each column needs a correct unit in correct format i.e. /mol dm–3, /s, s–1 or the use of brackets (s). Accept seconds, minutes (not sec, min or m), or not M or molarity. Two marks for 5 or 6 correct points. One mark for 3 or 4 correct points. No marks for 2 or less correct points. [2] Total [15]
Mark scheme, page 4
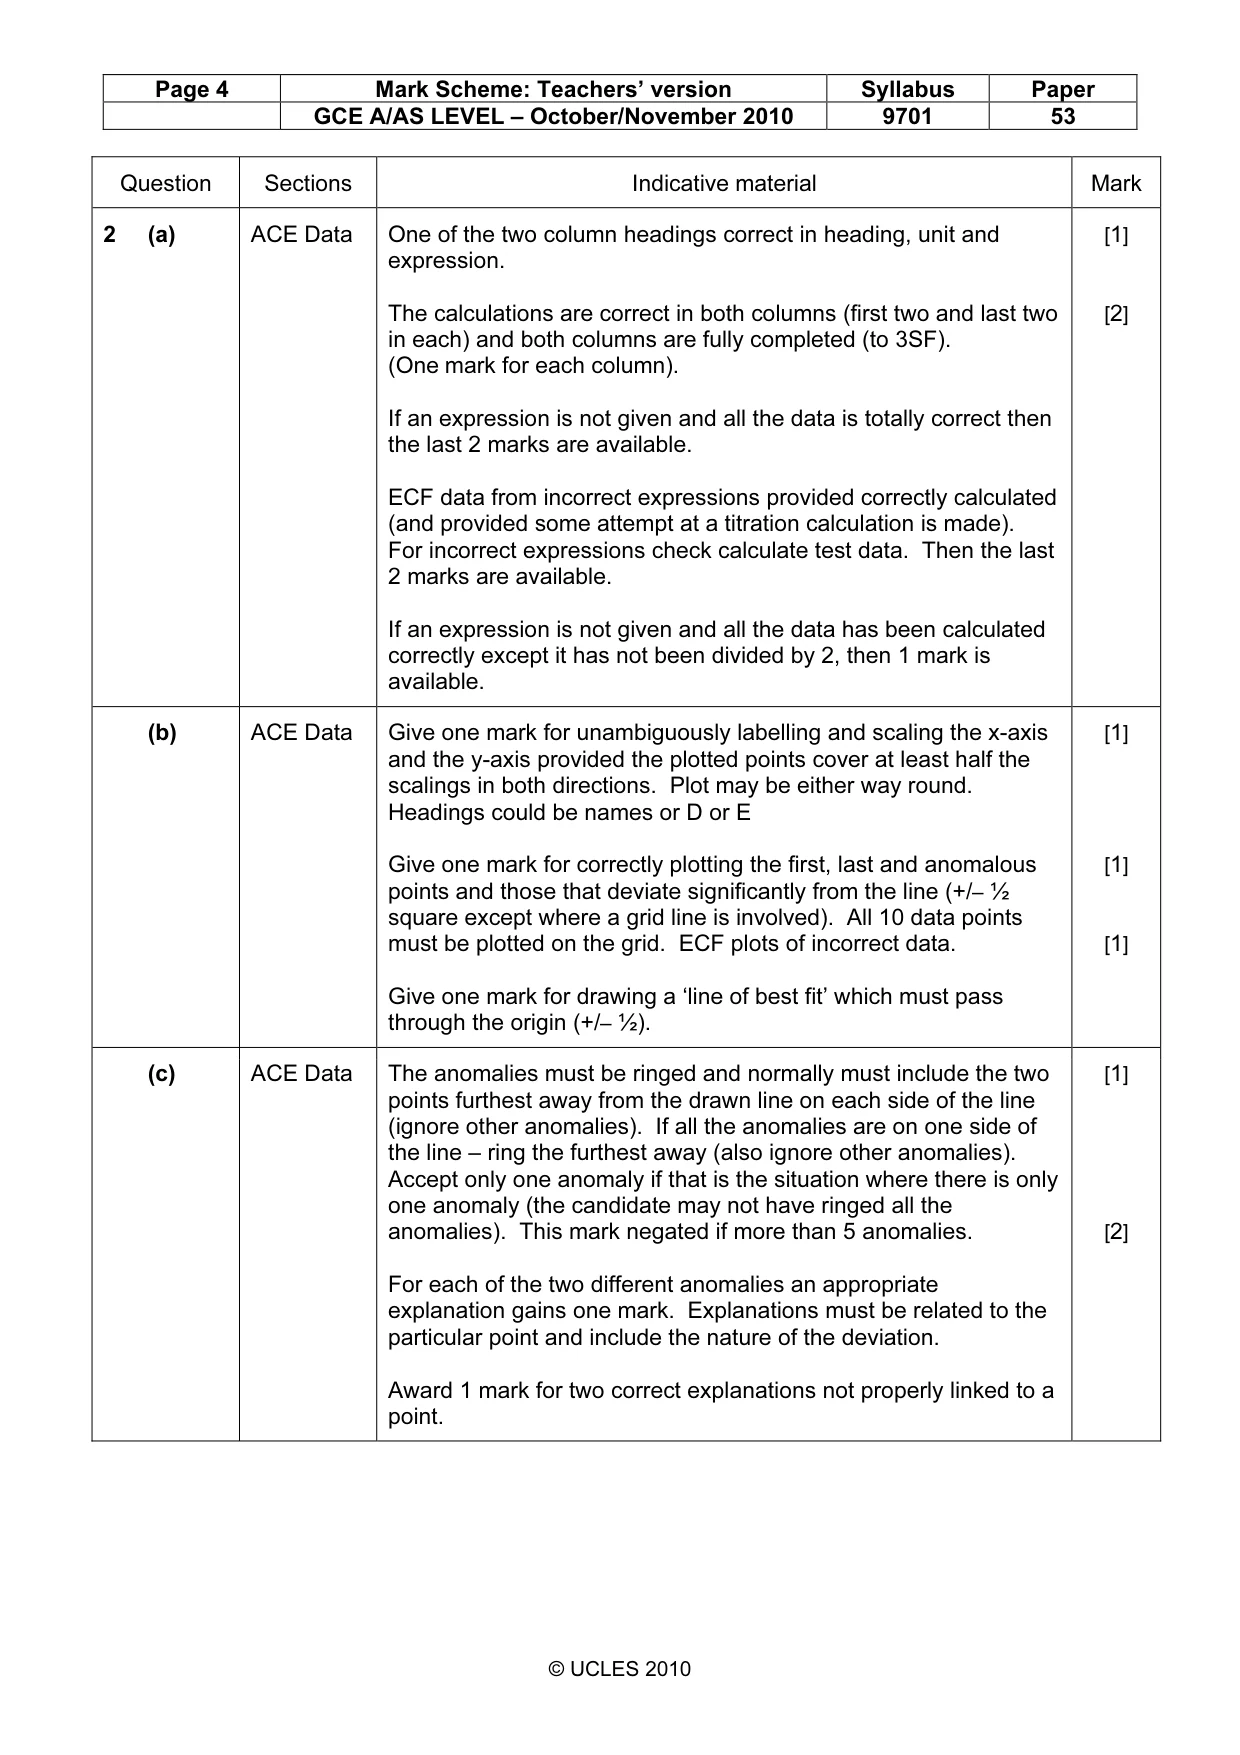
Page 4 Mark Scheme: Teachers’ version Syllabus Paper GCE A/AS LEVEL – October/November 2010 9701 53 © UCLES 2010 Question Sections Indicative material Mark 2 (a) ACE Data One of the two column headings correct in heading, unit and expression. The calculations are correct in both columns (first two and last two in each) and both columns are fully completed (to 3SF). (One mark for each column). If an expression is not given and all the data is totally correct then the last 2 marks are available. ECF data from incorrect expressions provided correctly calculated (and provided some attempt at a titration calculation is made). For incorrect expressions check calculate test data. Then the last 2 marks are available. If an expression is not given and all the data has been calculated correctly except it has not been divided by 2, then 1 mark is available. [1] [2] (b) ACE Data Give one mark for unambiguously labelling and scaling the x-axis and the y-axis provided the plotted points cover at least half the scalings in both directions. Plot may be either way round. Headings could be names or D or E Give one mark for correctly plotting the first, last and anomalous points and those that deviate significantly from the line (+/– ½ square except where a grid line is involved). All 10 data points must be plotted on the grid. ECF plots of incorrect data. Give one mark for drawing a ‘line of best fit’ which must pass through the origin (+/– ½). [1] [1] [1] (c) ACE Data The anomalies must be ringed and normally must include the two points furthest away from the drawn line on each side of the line (ignore other anomalies). If all the anomalies are on one side of the line – ring the furthest away (also ignore other anomalies). Accept only one anomaly if that is the situation where there is only one anomaly (the candidate may not have ringed all the anomalies). This mark negated if more than 5 anomalies. For each of the two different anomalies an appropriate explanation gains one mark. Explanations must be related to the particular point and include the nature of the deviation. Award 1 mark for two correct explanations not properly linked to a point. [1] [2]
Mark scheme, page 5
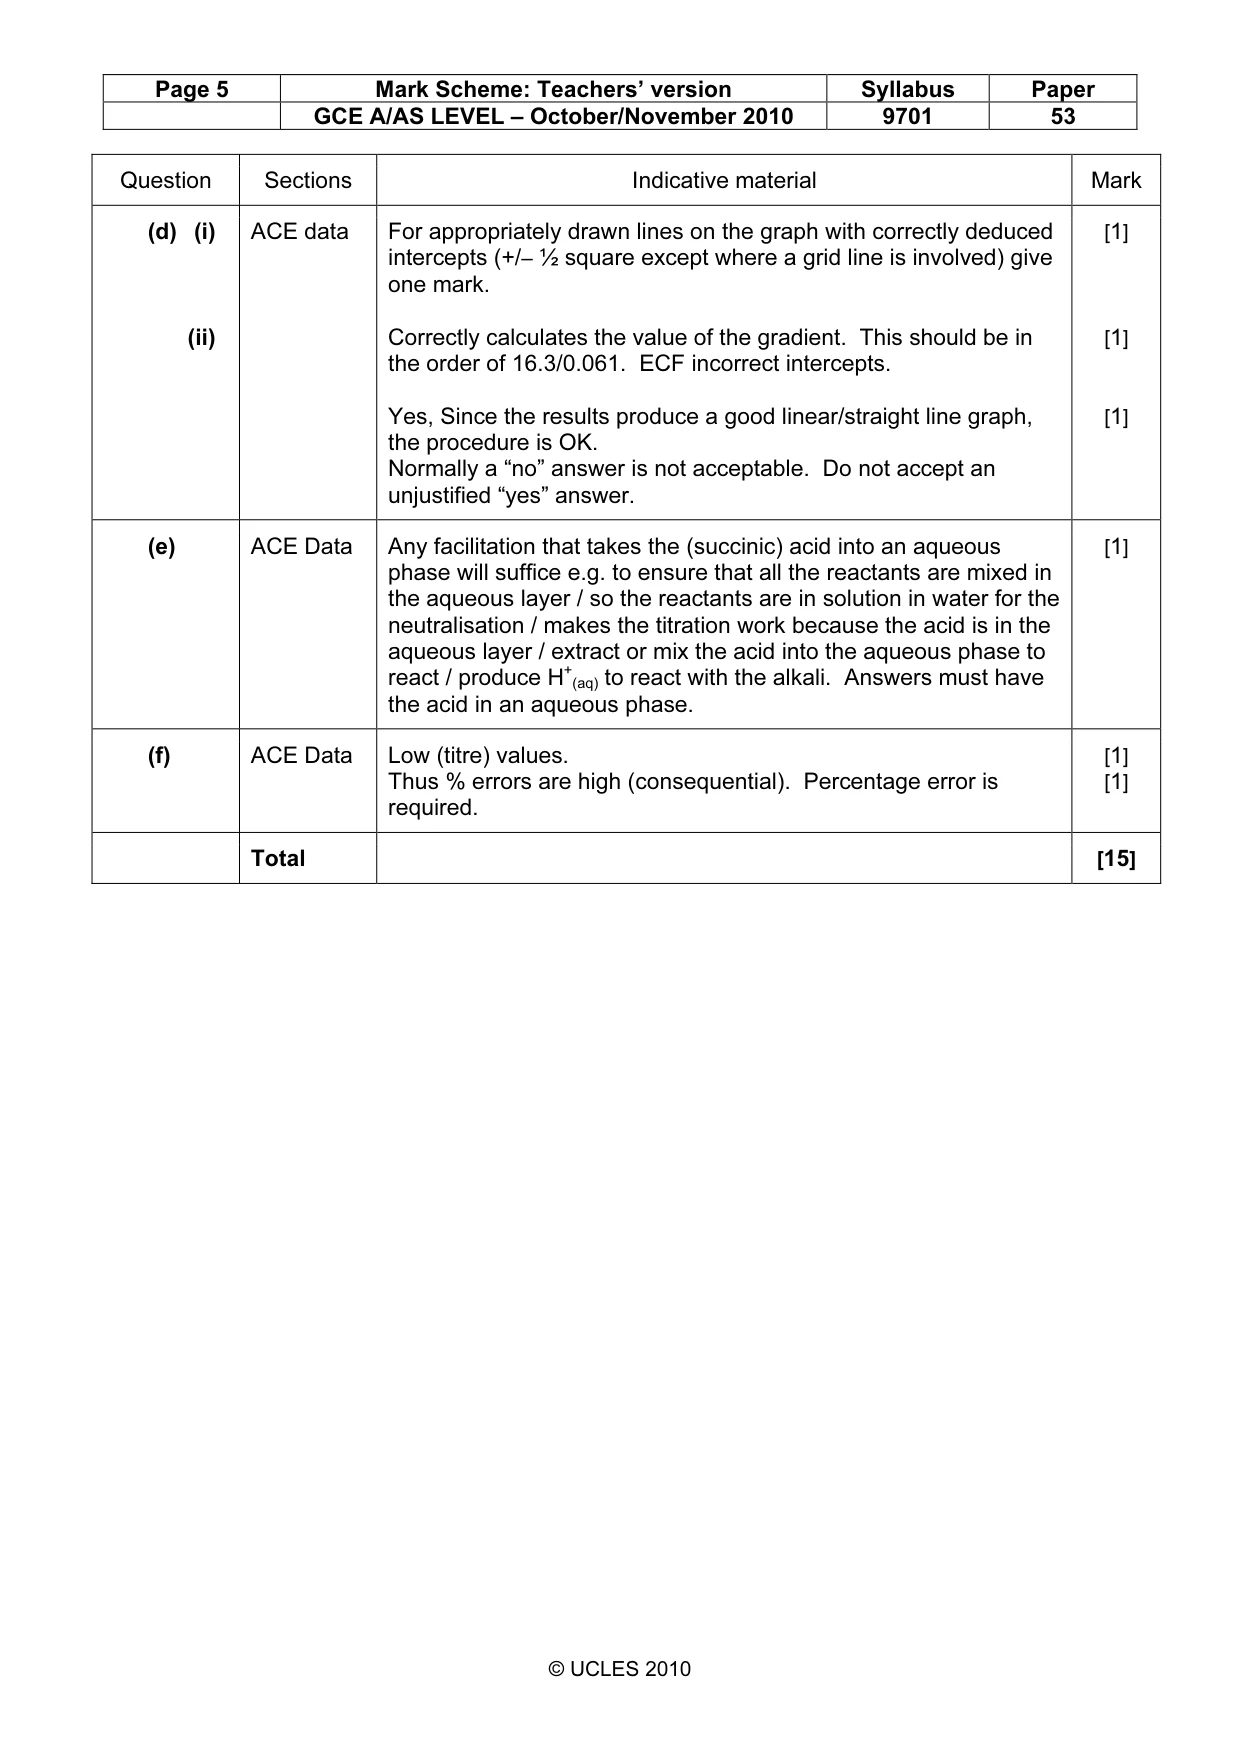
Page 5 Mark Scheme: Teachers’ version Syllabus Paper GCE A/AS LEVEL – October/November 2010 9701 53 © UCLES 2010 Question Sections Indicative material Mark (d) (i) (ii) ACE data For appropriately drawn lines on the graph with correctly deduced intercepts (+/– ½ square except where a grid line is involved) give one mark. Correctly calculates the value of the gradient. This should be in the order of 16.3/0.061. ECF incorrect intercepts. Yes, Since the results produce a good linear/straight line graph, the procedure is OK. Normally a “no” answer is not acceptable. Do not accept an unjustified “yes” answer. [1] [1] [1] (e) ACE Data Any facilitation that takes the (succinic) acid into an aqueous phase will suffice e.g. to ensure that all the reactants are mixed in the aqueous layer / so the reactants are in solution in water for the neutralisation / makes the titration work because the acid is in the aqueous layer / extract or mix the acid into the aqueous phase to react / produce H+ (aq) to react with the alkali. Answers must have the acid in an aqueous phase. [1] (f) ACE Data Low (titre) values. Thus % errors are high (consequential). Percentage error is required. [1] [1] Total [15]
What you needed in this session
Cambridge’s own grade thresholds for 2010 Oct/Nov, Paper 5 · Variant 3. A higher threshold means an easier paper — the bar moves with how the cohort did.