Cambridge A Level Chemistry 9701 — 2009 Oct/Nov Paper 5 · Variant 1
9701/51/O/N/09
The question paper and its mark scheme, free to read here and free to download. This is Cambridge’s own paper, exactly as it was sat.
Question paper12 pages

Mark scheme5 pages
Answers below. Sit the paper first if you are practising.
Paper as text
Question paper, page 1
* 3 1 0 5 7 4 8 1 2 6 * UNIVERSITY OF CAMBRIDGE INTERNATIONAL EXAMINATIONS General Certificate of Education Advanced Subsidiary Level and Advanced Level This document consists of 10 printed pages and 2 blank pages. DC (CB) 16924/4 © UCLES 2009 [Turn over READ THESE INSTRUCTIONS FIRST Write your Centre number, candidate number and name on all the work you hand in. Write in dark blue or black pen. You may use a soft pencil for any diagrams, graphs, or rough working. Do not use staples, paper clips, highlighters, glue or correction fluid. Answer all questions. You are advised to show all working in calculations. Use of Data Booklet is unnecessary. At the end of the examination, fasten all your work securely together. The number of marks is given in brackets [ ] at the end of each question or part question. CANDIDATE NAME CENTRE NUMBER CANDIDATE NUMBER CHEMISTRY 9701/51 Paper 5 Planning, Analysis and Evaluation October/November 2009 1 hour 15 minutes Candidates answer on the Question Paper. No Additional Materials are required. For Examiner’s Use 1 2 Total
Question paper, page 2
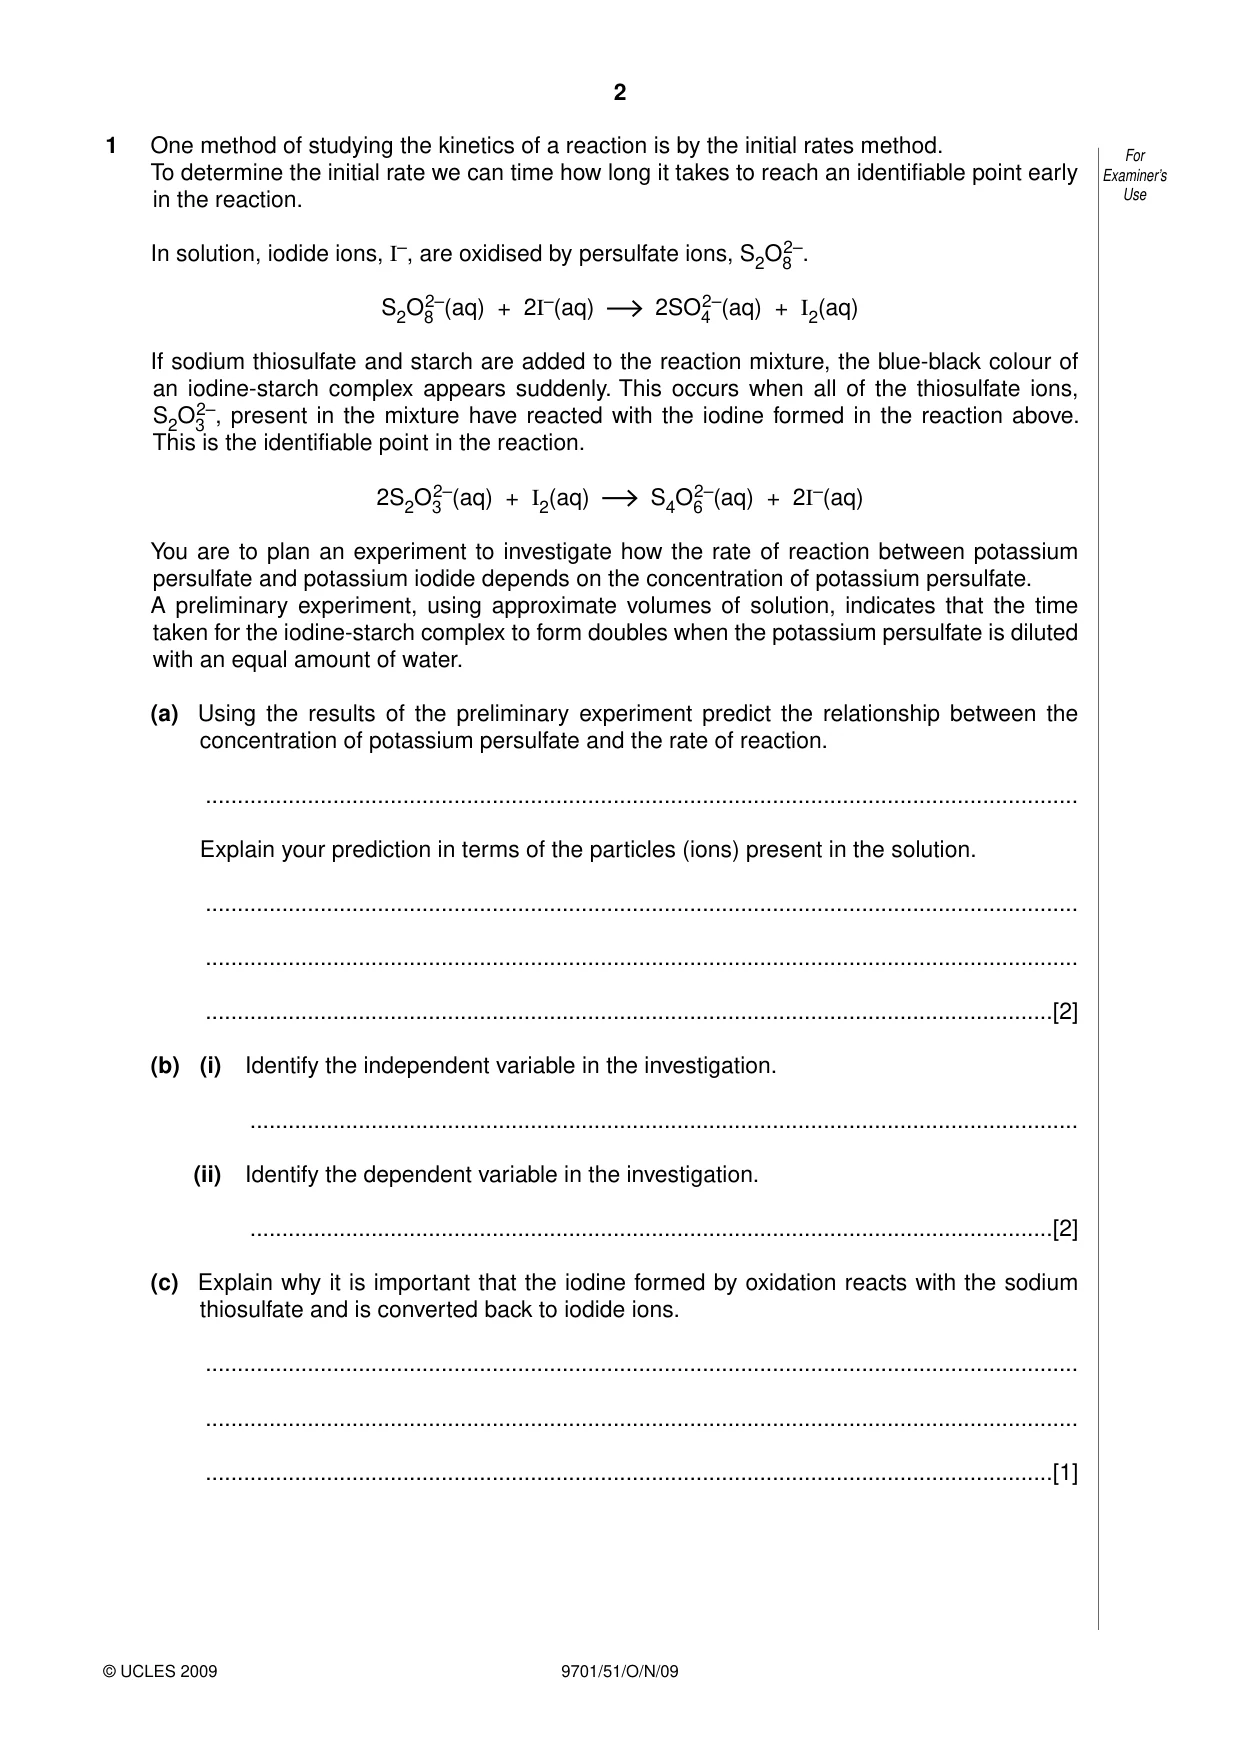
2 9701/51/O/N/09 © UCLES 2009 For Examiner’s Use 1 One method of studying the kinetics of a reaction is by the initial rates method. To determine the initial rate we can time how long it takes to reach an identifiable point early in the reaction. In solution, iodide ions, I–, are oxidised by persulfate ions, S2O8 2–. S2O8 2–(aq) + 2I–(aq) 2SO4 2–(aq) + I2(aq) If sodium thiosulfate and starch are added to the reaction mixture, the blue-black colour of an iodine-starch complex appears suddenly. This occurs when all of the thiosulfate ions, S2O3 2–, present in the mixture have reacted with the iodine formed in the reaction above. This is the identifiable point in the reaction. 2S2O3 2–(aq) + I2(aq) S4O6 2–(aq) + 2I–(aq) You are to plan an experiment to investigate how the rate of reaction between potassium persulfate and potassium iodide depends on the concentration of potassium persulfate. A preliminary experiment, using approximate volumes of solution, indicates that the time taken for the iodine-starch complex to form doubles when the potassium persulfate is diluted with an equal amount of water. (a) Using the results of the preliminary experiment predict the relationship between the concentration of potassium persulfate and the rate of reaction. … Explain your prediction in terms of the particles (ions) present in the solution. … … …[2] (b) (i) Identify the independent variable in the investigation. … (ii) Identify the dependent variable in the investigation. …[2] (c) Explain why it is important that the iodine formed by oxidation reacts with the sodium thiosulfate and is converted back to iodide ions. … … …[1]
Question paper, page 3
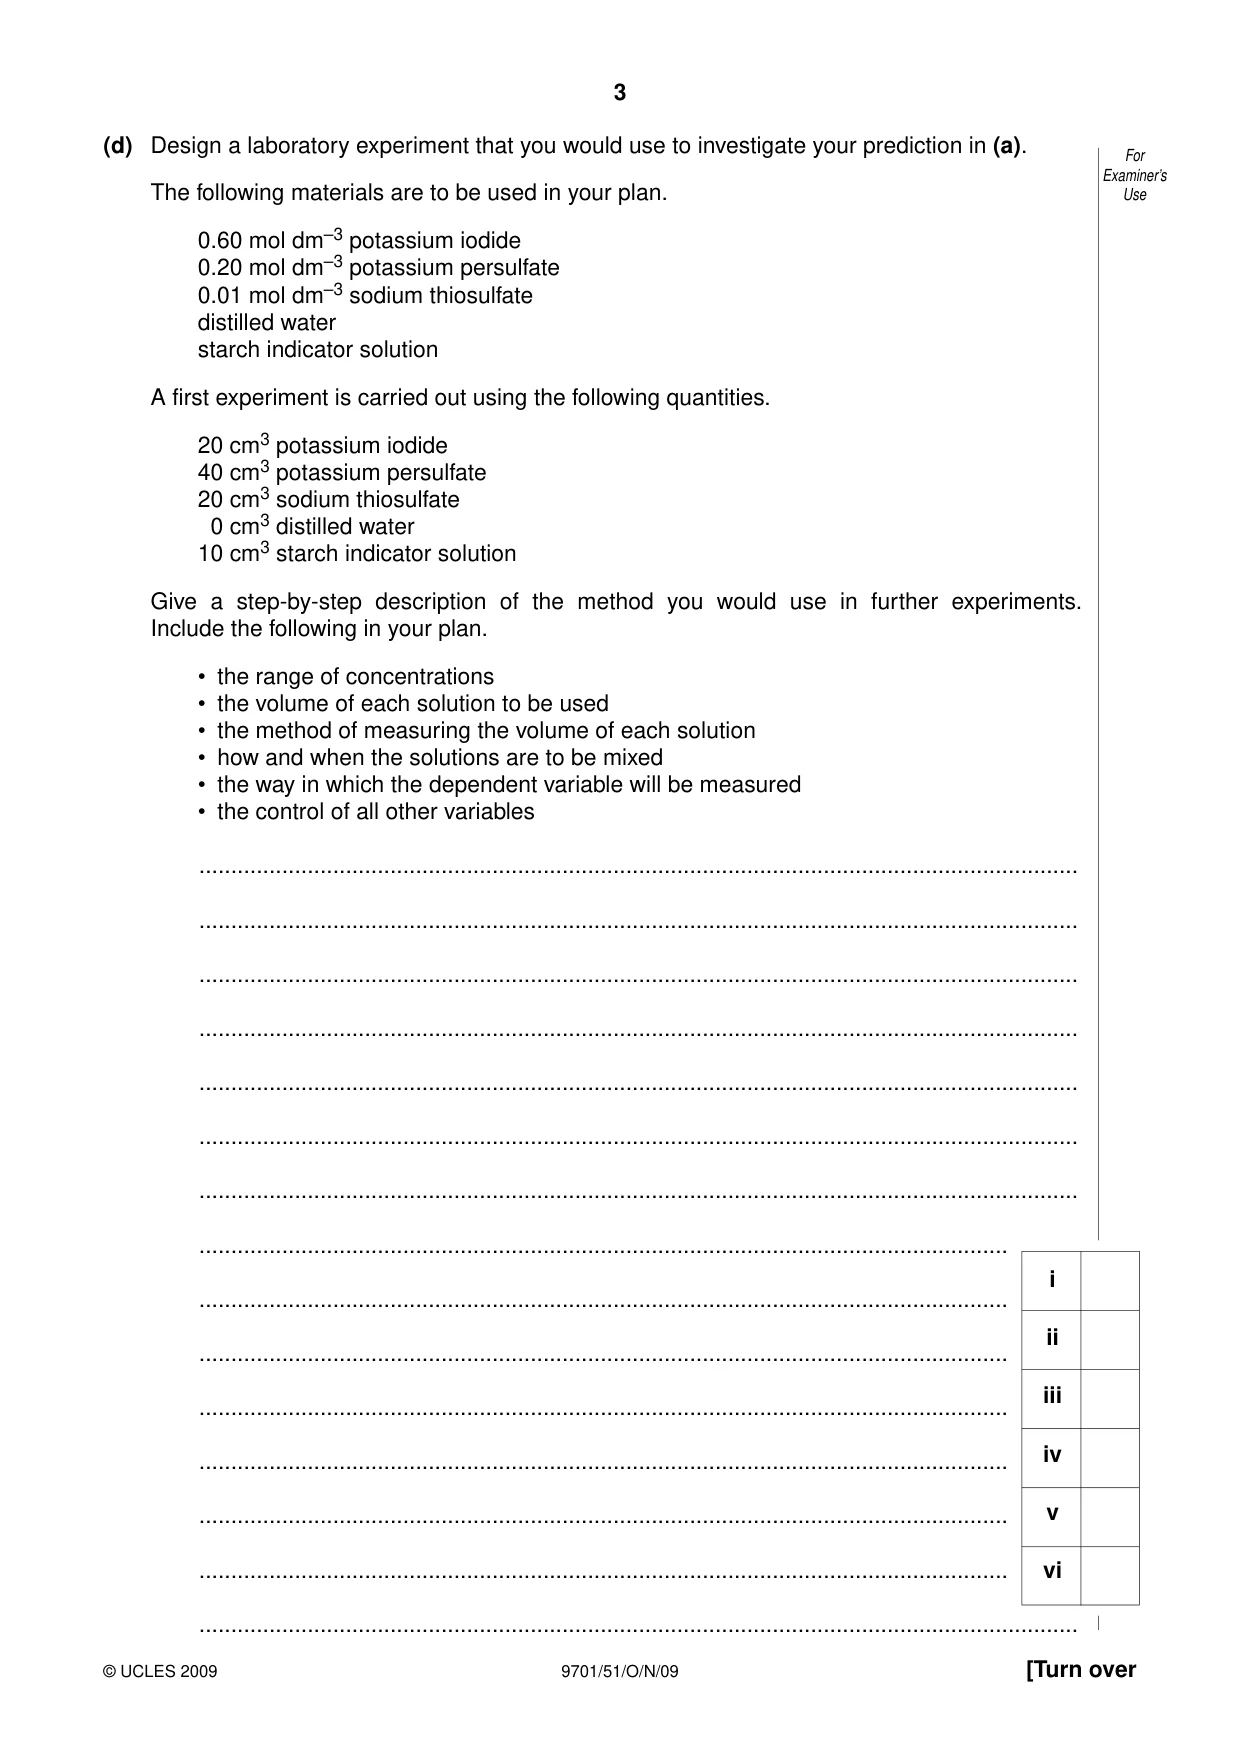
3 9701/51/O/N/09 © UCLES 2009 [Turn over For Examiner’s Use (d) Design a laboratory experiment that you would use to investigate your prediction in (a). The following materials are to be used in your plan. 0.60 mol dm–3 potassium iodide 0.20 mol dm–3 potassium persulfate 0.01 mol dm–3 sodium thiosulfate distilled water starch indicator solution A first experiment is carried out using the following quantities. 20 cm3 potassium iodide 40 cm3 potassium persulfate 20 cm3 sodium thiosulfate 0 cm3 distilled water 10 cm3 starch indicator solution Give a step-by-step description of the method you would use in further experiments. Include the following in your plan. • the range of concentrations • the volume of each solution to be used • the method of measuring the volume of each solution • how and when the solutions are to be mixed • the way in which the dependent variable will be measured • the control of all other variables … … … … … … … … … … … … … … … i ii iii iv v vi
Question paper, page 4
4 9701/51/O/N/09 © UCLES 2009 For Examiner’s Use … … … … … … … … … … … … … … … … …[6] (e) Explain why the volume of aqueous sodium thiosulfate should be measured precisely, using a burette, in each of the experiments. … … … …[1]
Question paper, page 5
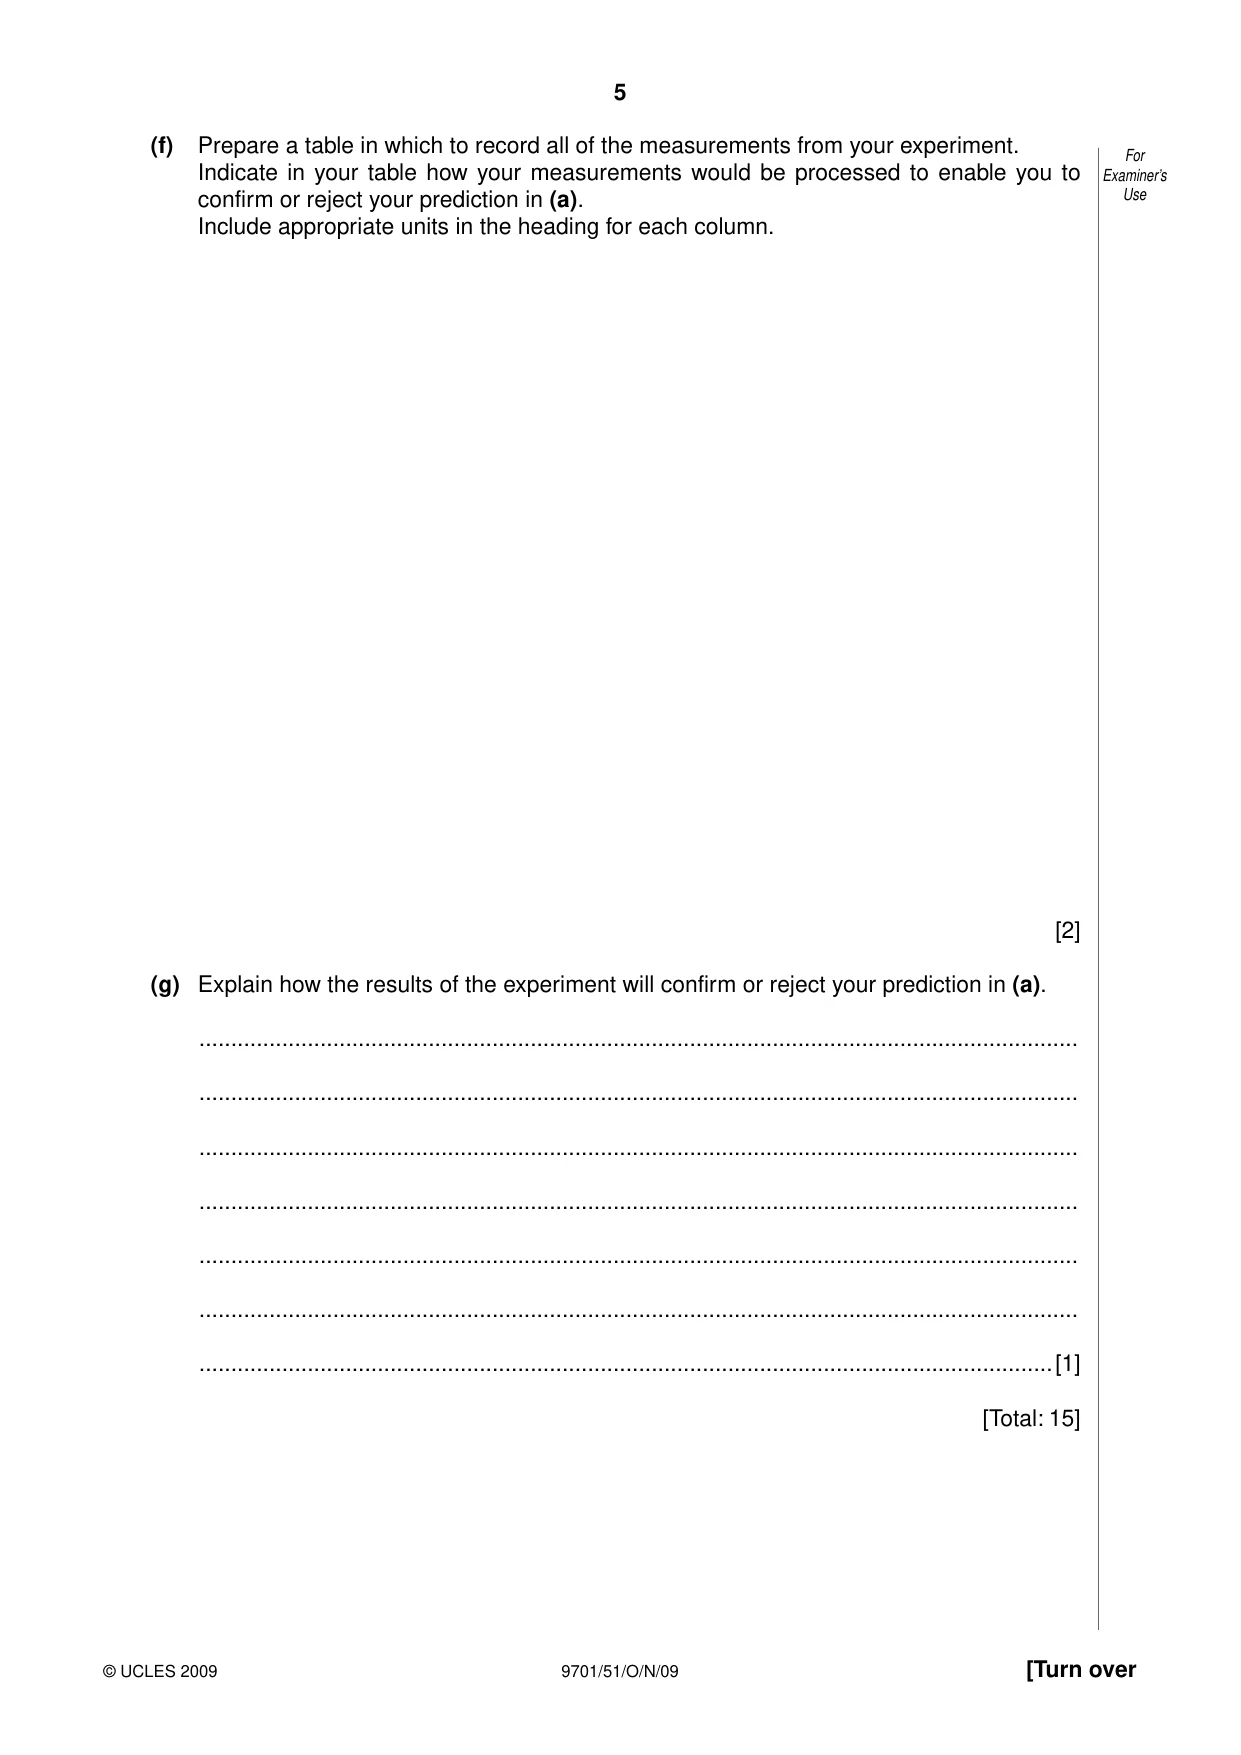
5 9701/51/O/N/09 © UCLES 2009 [Turn over For Examiner’s Use (f) Prepare a table in which to record all of the measurements from your experiment. Indicate in your table how your measurements would be processed to enable you to confirm or reject your prediction in (a). Include appropriate units in the heading for each column. [2] (g) Explain how the results of the experiment will confirm or reject your prediction in (a). … … … … … … …[1] [Total: 15]
Question paper, page 7
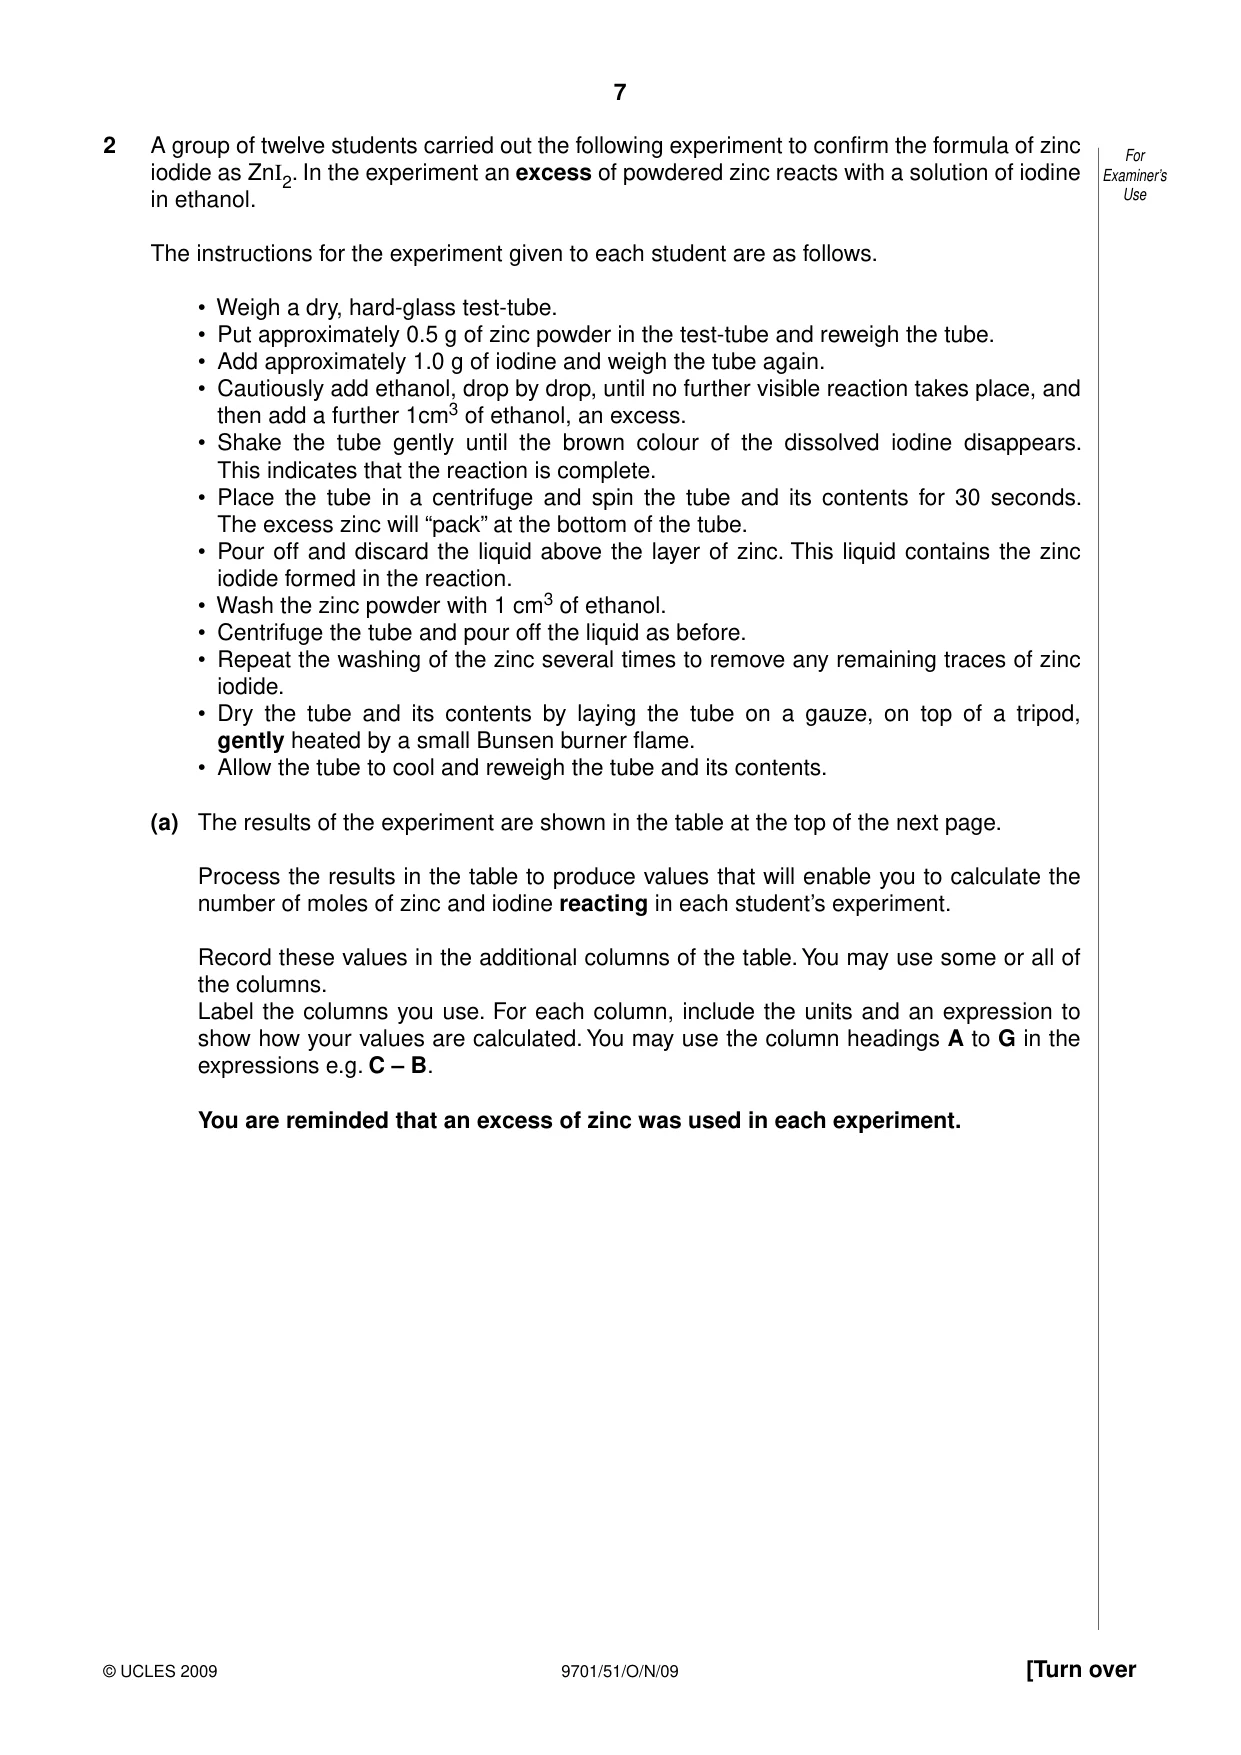
7 9701/51/O/N/09 © UCLES 2009 [Turn over For Examiner’s Use 2 A group of twelve students carried out the following experiment to confirm the formula of zinc iodide as ZnI2. In the experiment an excess of powdered zinc reacts with a solution of iodine in ethanol. The instructions for the experiment given to each student are as follows. • Weigh a dry, hard-glass test-tube. • Put approximately 0.5 g of zinc powder in the test-tube and reweigh the tube. • Add approximately 1.0 g of iodine and weigh the tube again. • Cautiously add ethanol, drop by drop, until no further visible reaction takes place, and then add a further 1cm3 of ethanol, an excess. • Shake the tube gently until the brown colour of the dissolved iodine disappears. This indicates that the reaction is complete. • Place the tube in a centrifuge and spin the tube and its contents for 30 seconds. The excess zinc will “pack” at the bottom of the tube. • Pour off and discard the liquid above the layer of zinc. This liquid contains the zinc iodide formed in the reaction. • Wash the zinc powder with 1 cm3 of ethanol. • Centrifuge the tube and pour off the liquid as before. • Repeat the washing of the zinc several times to remove any remaining traces of zinc iodide. • Dry the tube and its contents by laying the tube on a gauze, on top of a tripod, gently heated by a small Bunsen burner flame. • Allow the tube to cool and reweigh the tube and its contents. (a) The results of the experiment are shown in the table at the top of the next page. Process the results in the table to produce values that will enable you to calculate the number of moles of zinc and iodine reacting in each student’s experiment. Record these values in the additional columns of the table. You may use some or all of the columns. Label the columns you use. For each column, include the units and an expression to show how your values are calculated. You may use the column headings A to G in the expressions e.g. C – B. You are reminded that an excess of zinc was used in each experiment.
Question paper, page 8
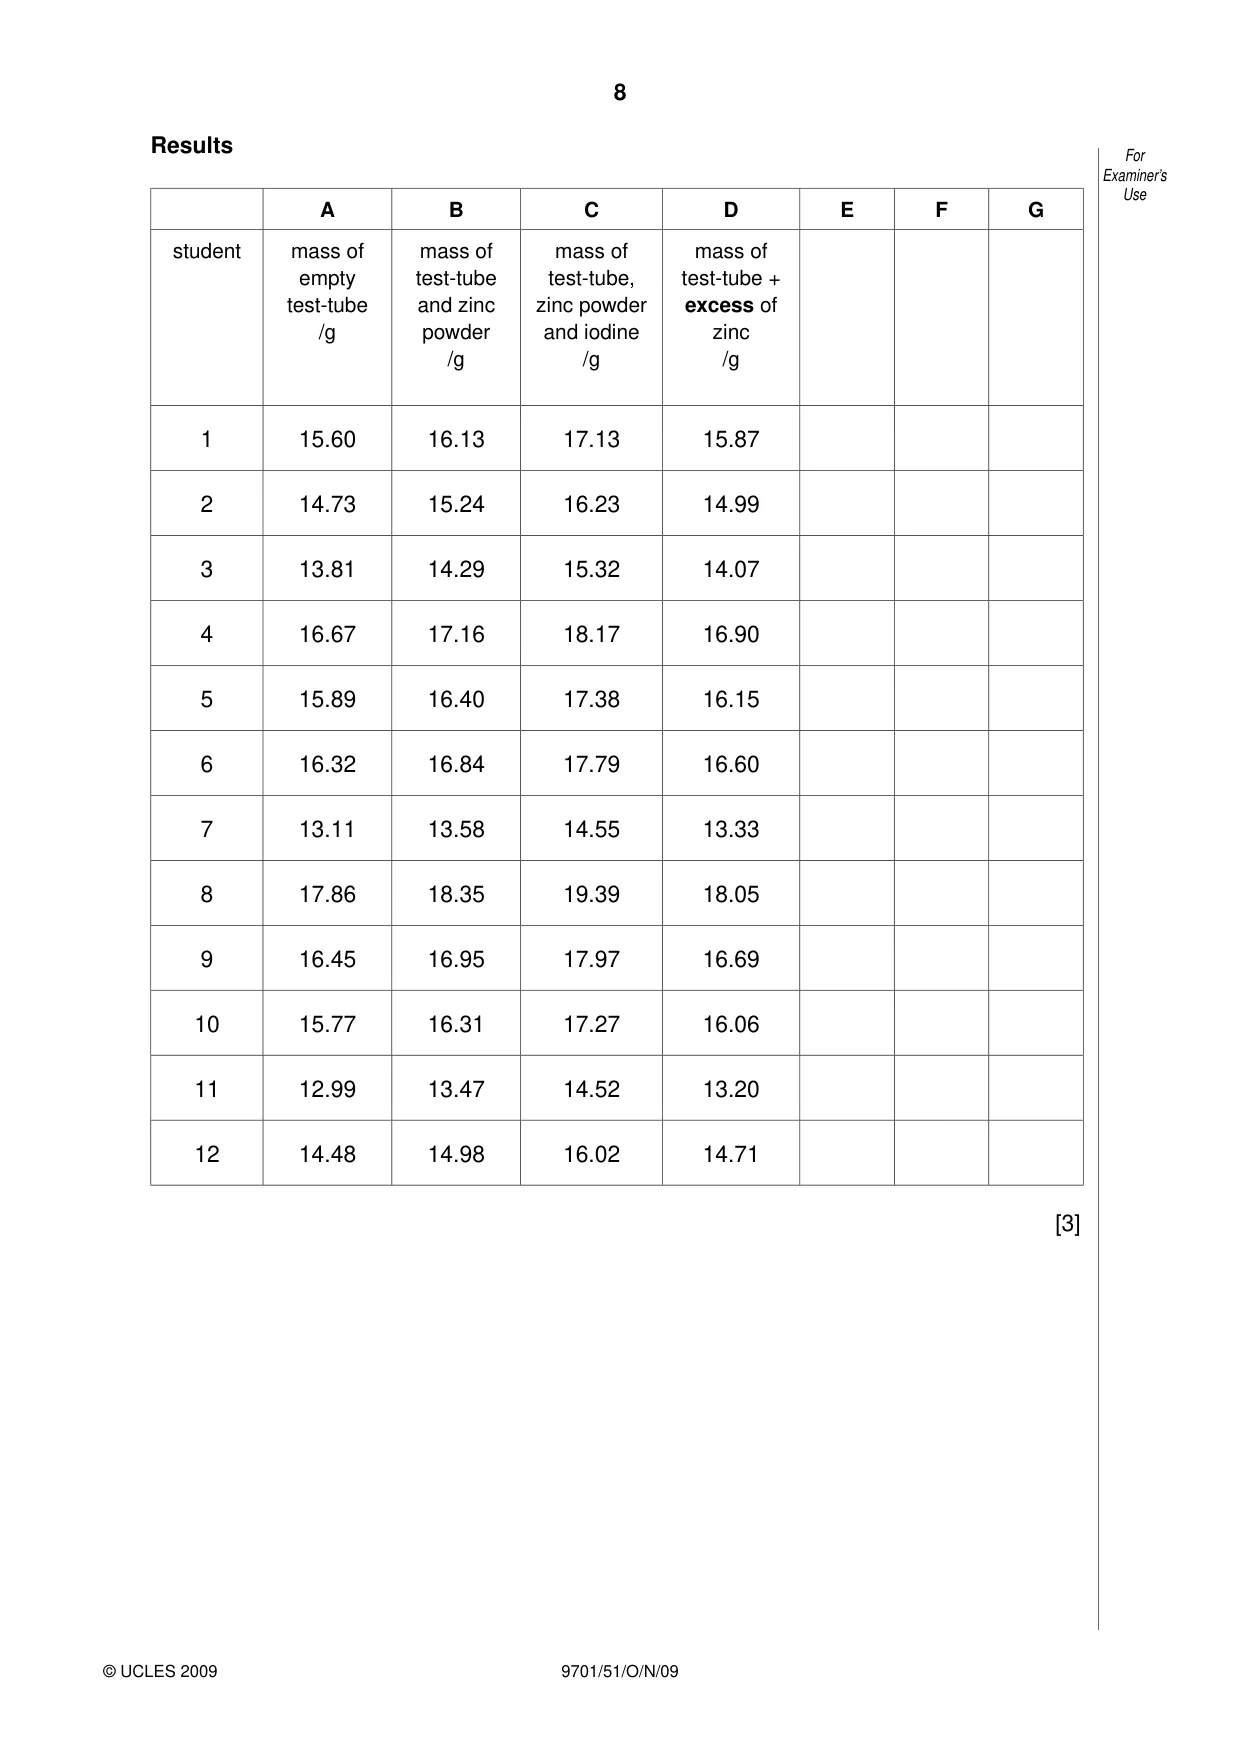
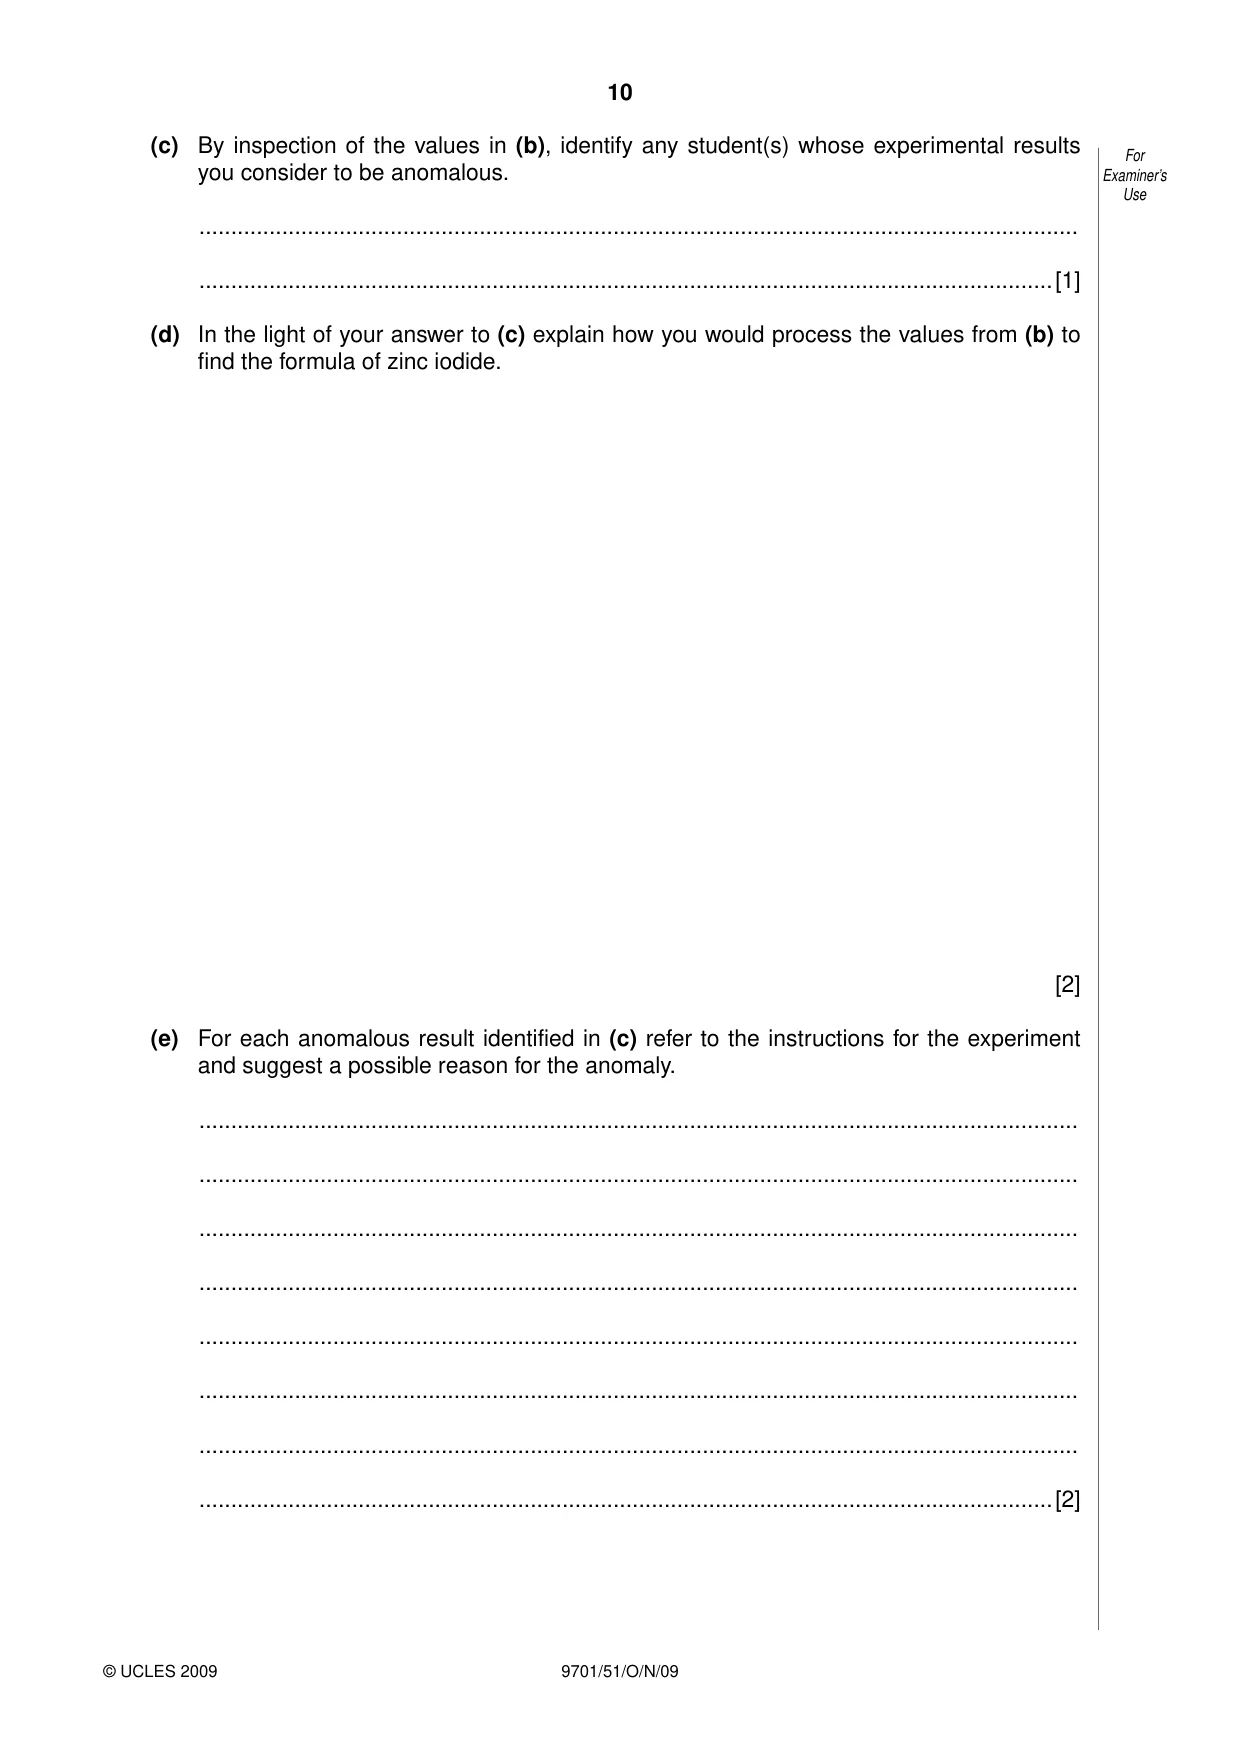
8 9701/51/O/N/09 © UCLES 2009 For Examiner’s Use Results A B C D E F G student mass of empty test-tube /g mass of test-tube and zinc powder /g mass of test-tube, zinc powder and iodine /g mass of test-tube + excess of zinc /g 1 15.60 16.13 17.13 15.87 2 14.73 15.24 16.23 14.99 3 13.81 14.29 15.32 14.07 4 16.67 17.16 18.17 16.90 5 15.89 16.40 17.38 16.15 6 16.32 16.84 17.79 16.60 7 13.11 13.58 14.55 13.33 8 17.86 18.35 19.39 18.05 9 16.45 16.95 17.97 16.69 10 15.77 16.31 17.27 16.06 11 12.99 13.47 14.52 13.20 12 14.48 14.98 16.02 14.71 [3]
Question paper, page 9
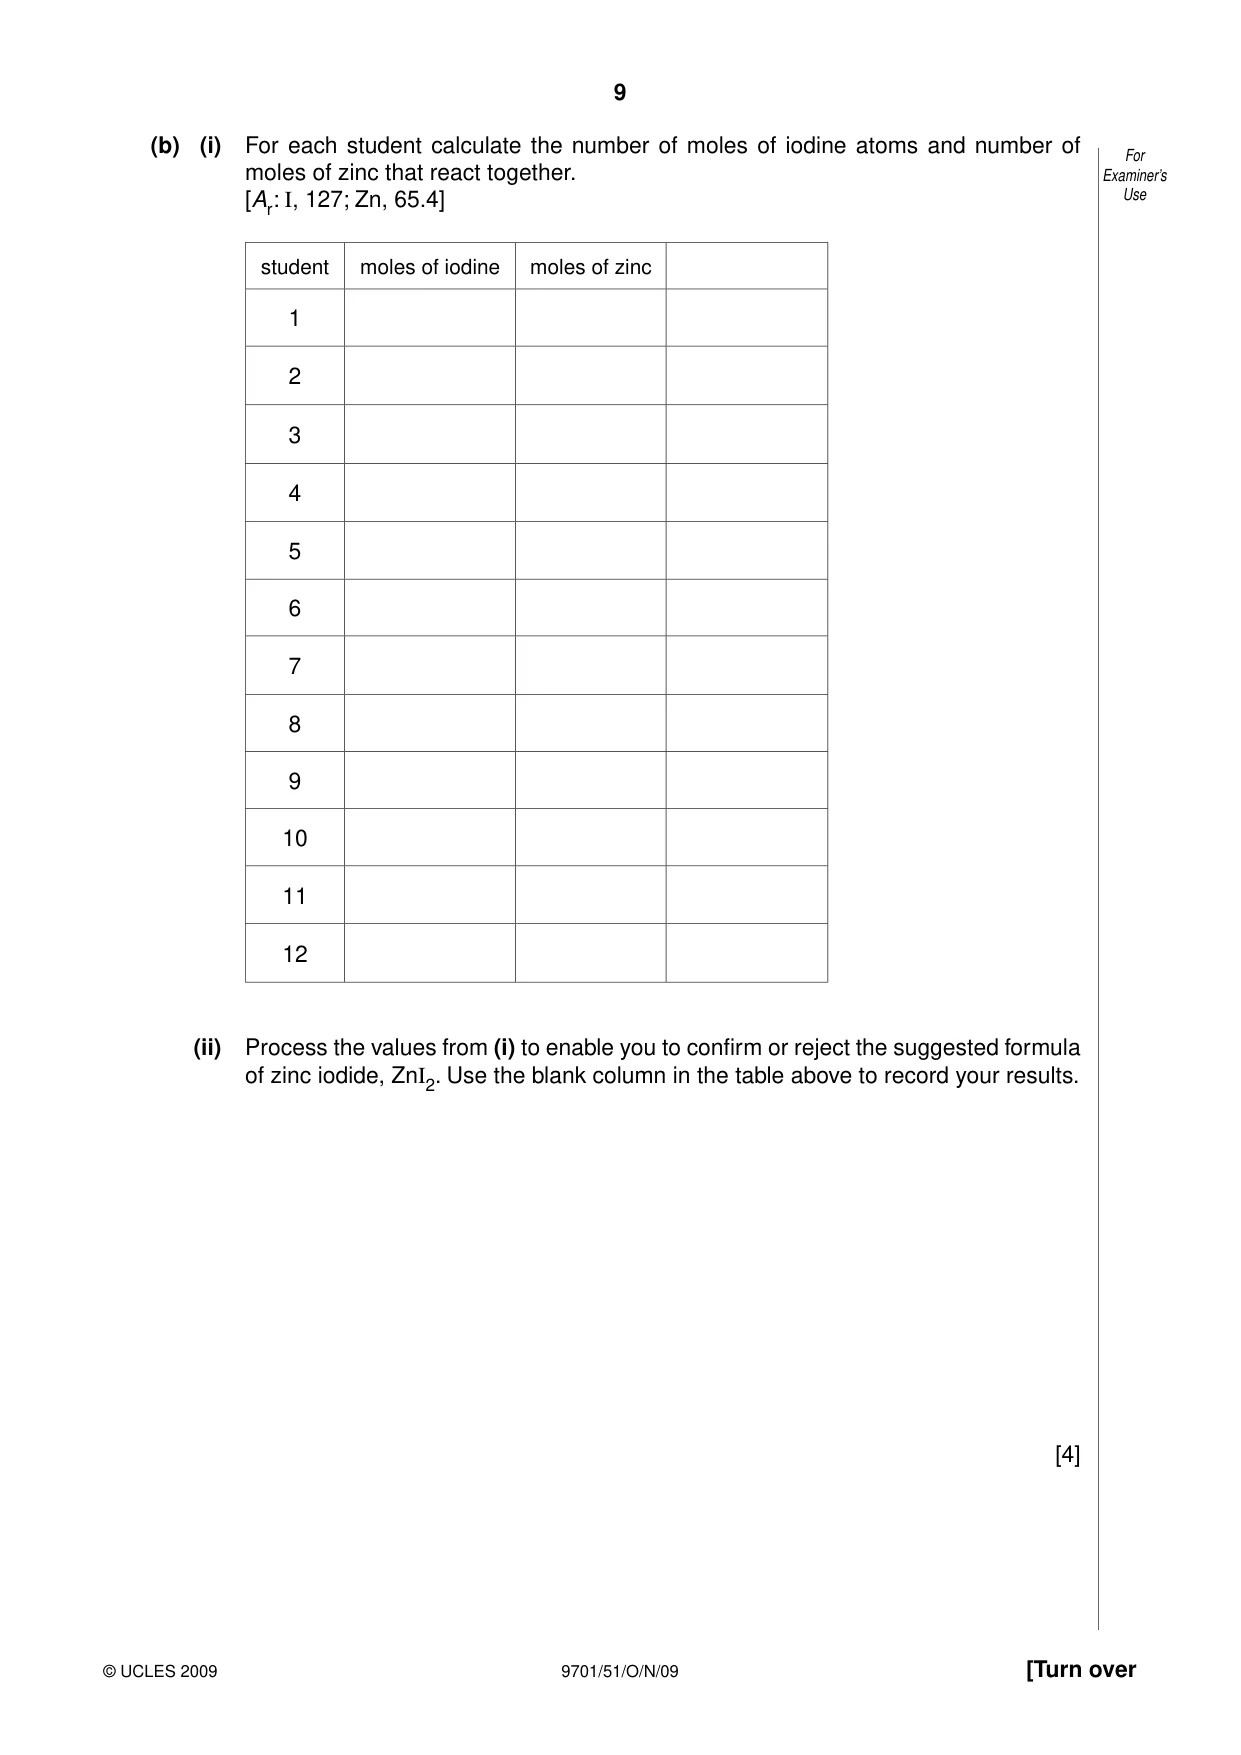
9 9701/51/O/N/09 © UCLES 2009 [Turn over For Examiner’s Use (b) (i) For each student calculate the number of moles of iodine atoms and number of moles of zinc that react together. [Ar: I, 127; Zn, 65.4] student moles of iodine moles of zinc 1 2 3 4 5 6 7 8 9 10 11 12 (ii) Process the values from (i) to enable you to confirm or reject the suggested formula of zinc iodide, ZnI2. Use the blank column in the table above to record your results. [4]
Question paper, page 10
10 9701/51/O/N/09 © UCLES 2009 For Examiner’s Use (c) By inspection of the values in (b), identify any student(s) whose experimental results you consider to be anomalous. … …[1] (d) In the light of your answer to (c) explain how you would process the values from (b) to find the formula of zinc iodide. [2] (e) For each anomalous result identified in (c) refer to the instructions for the experiment and suggest a possible reason for the anomaly. … … … … … … … …[2]
Question paper, page 11
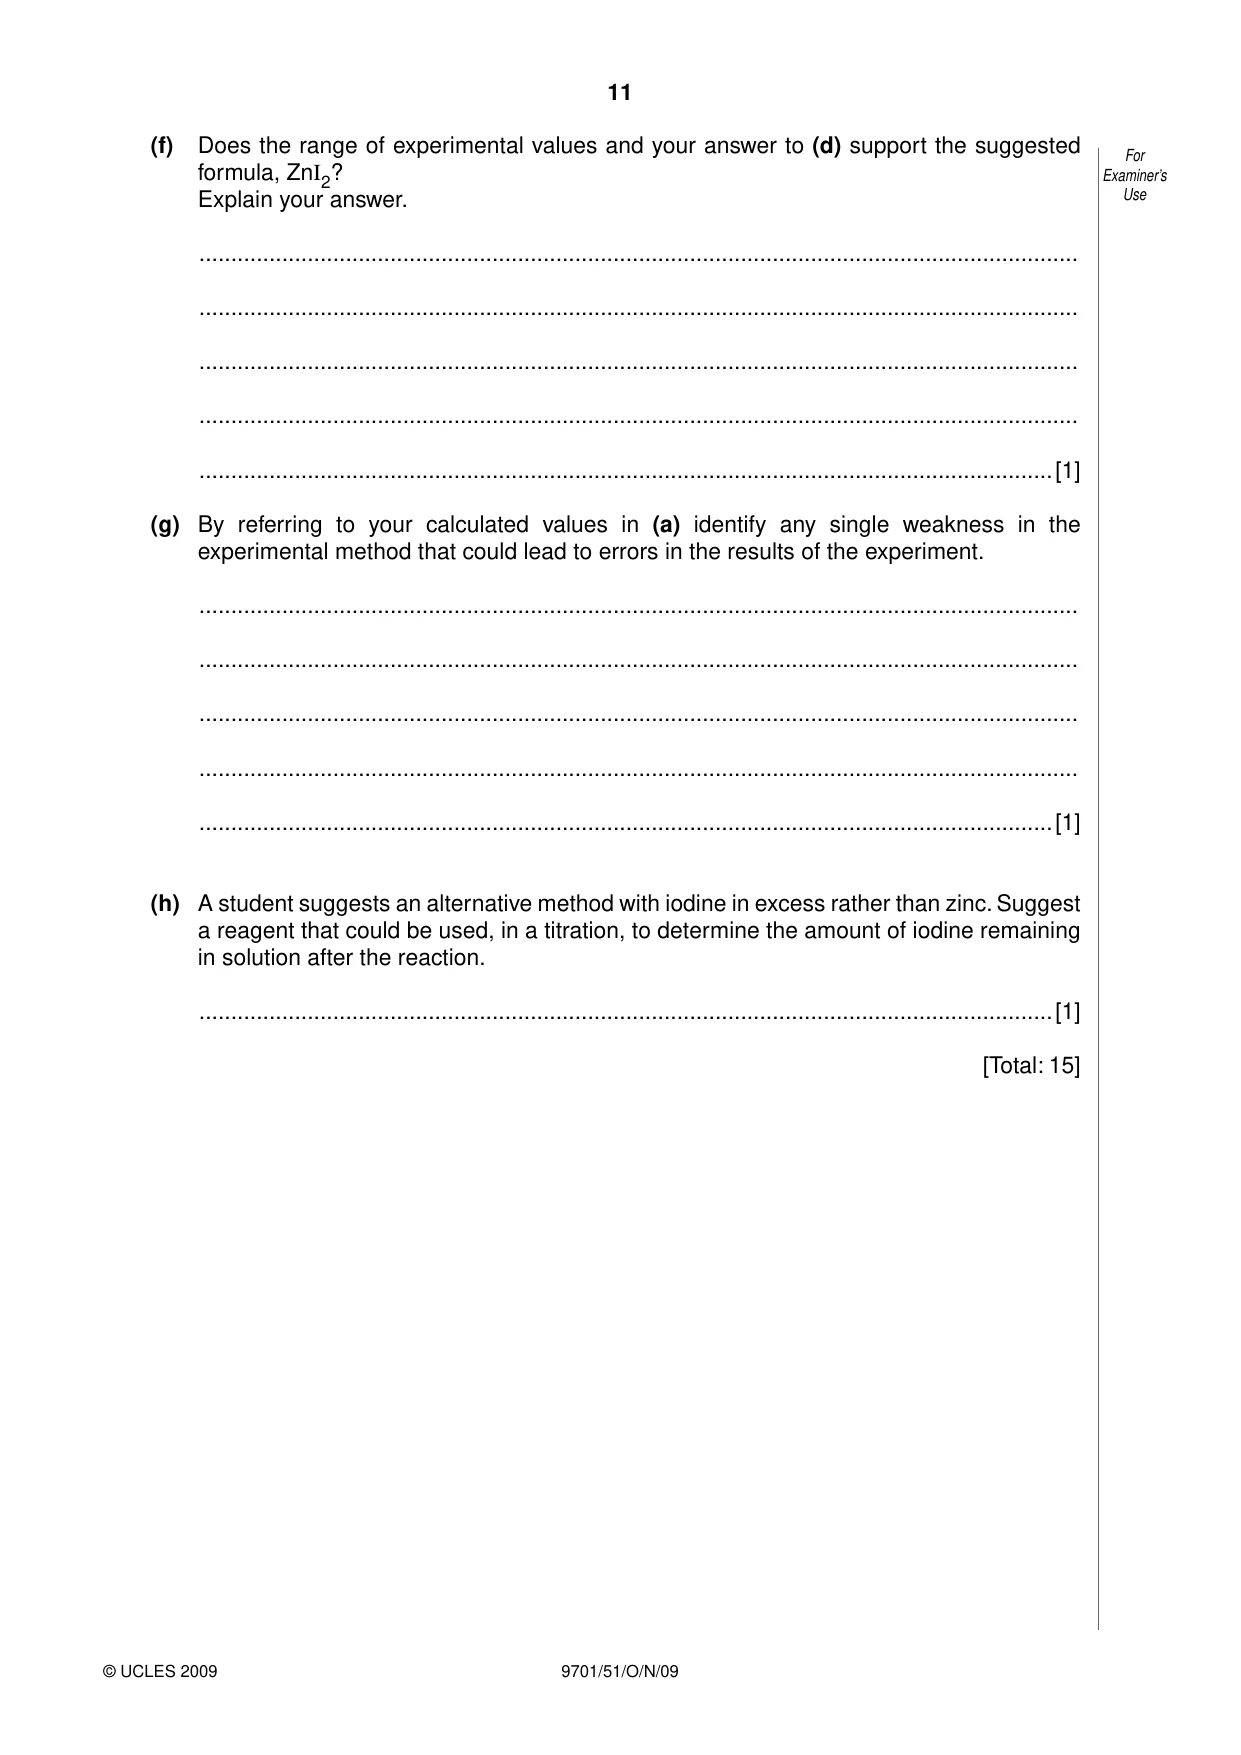
11 9701/51/O/N/09 © UCLES 2009 For Examiner’s Use (f) Does the range of experimental values and your answer to (d) support the suggested formula, ZnI2? Explain your answer. … … … … …[1] (g) By referring to your calculated values in (a) identify any single weakness in the experimental method that could lead to errors in the results of the experiment. … … … … …[1] (h) A student suggests an alternative method with iodine in excess rather than zinc. Suggest a reagent that could be used, in a titration, to determine the amount of iodine remaining in solution after the reaction. …[1] [Total: 15]
Question paper, page 12
12 9701/51/O/N/09 BLANK PAGE Permission to reproduce items where third-party owned material protected by copyright is included has been sought and cleared where possible. Every reasonable effort has been made by the publisher (UCLES) to trace copyright holders, but if any items requiring clearance have unwittingly been included, the publisher will be pleased to make amends at the earliest possible opportunity. University of Cambridge International Examinations is part of the Cambridge Assessment Group. Cambridge Assessment is the brand name of University of Cambridge Local Examinations Syndicate (UCLES), which is itself a department of the University of Cambridge.
Mark scheme, page 1
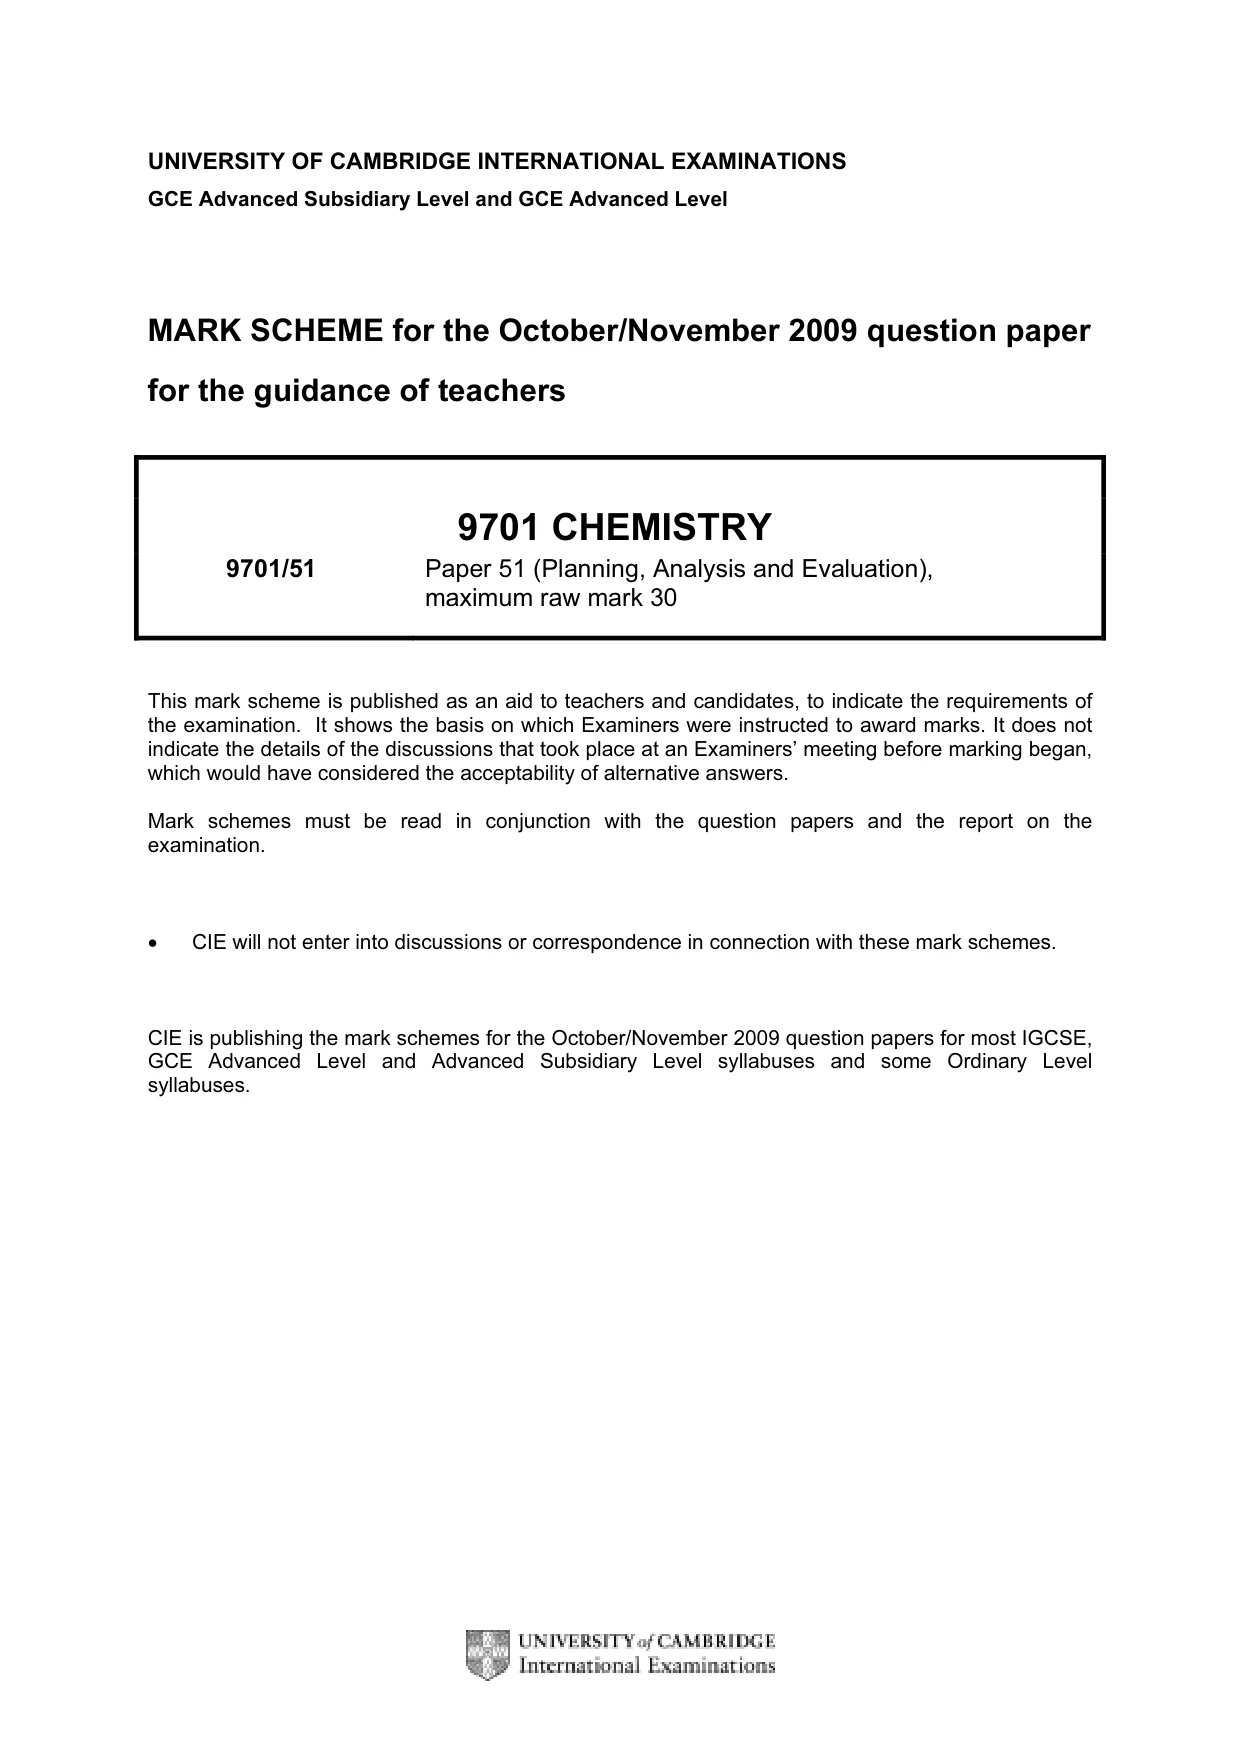
UNIVERSITY OF CAMBRIDGE INTERNATIONAL EXAMINATIONS GCE Advanced Subsidiary Level and GCE Advanced Level MARK SCHEME for the October/November 2009 question paper for the guidance of teachers 9701 CHEMISTRY 9701/51 Paper 51 (Planning, Analysis and Evaluation), maximum raw mark 30 This mark scheme is published as an aid to teachers and candidates, to indicate the requirements of the examination. It shows the basis on which Examiners were instructed to award marks. It does not indicate the details of the discussions that took place at an Examiners’ meeting before marking began, which would have considered the acceptability of alternative answers. Mark schemes must be read in conjunction with the question papers and the report on the examination. • CIE will not enter into discussions or correspondence in connection with these mark schemes. CIE is publishing the mark schemes for the October/November 2009 question papers for most IGCSE, GCE Advanced Level and Advanced Subsidiary Level syllabuses and some Ordinary Level syllabuses.
Mark scheme, page 2
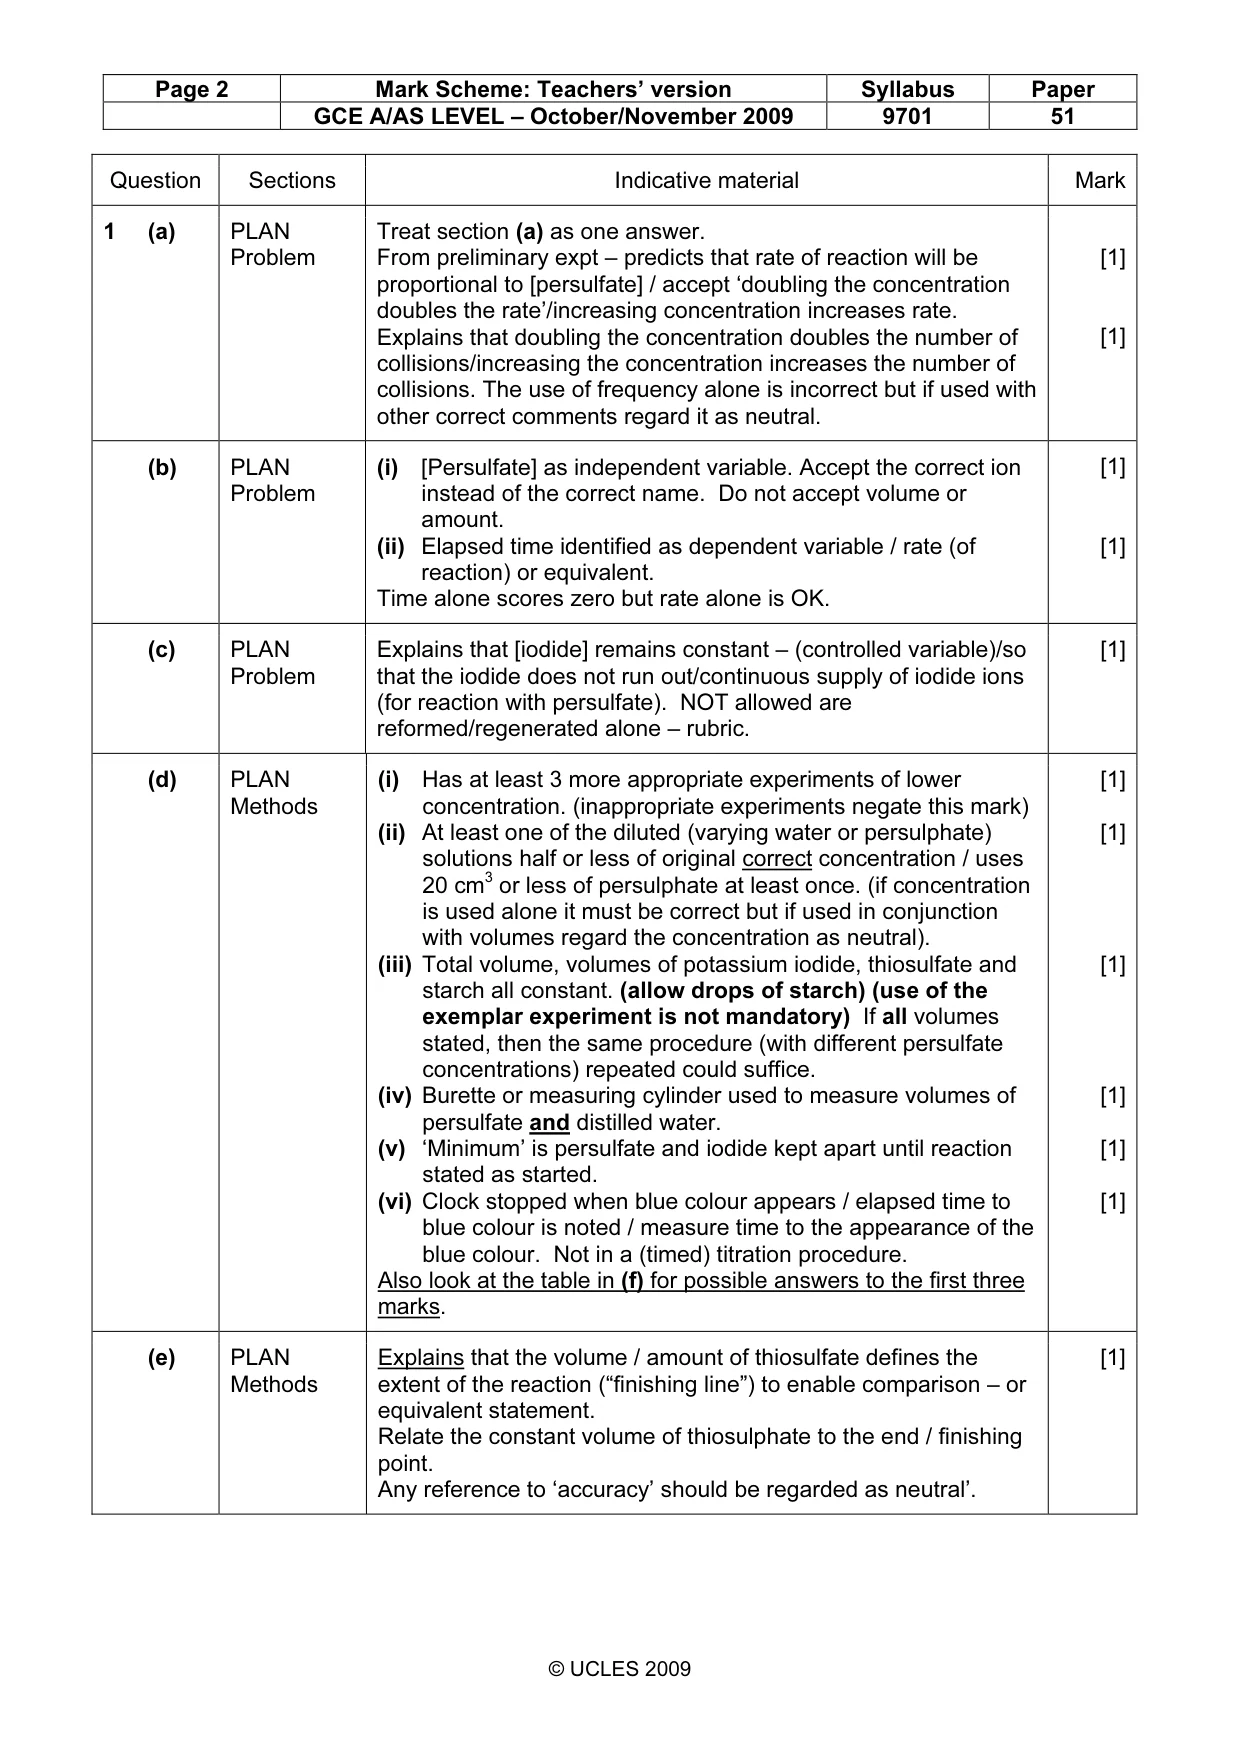
Page 2 Mark Scheme: Teachers’ version Syllabus Paper GCE A/AS LEVEL – October/November 2009 9701 51 © UCLES 2009 Question Sections Indicative material Mark 1 (a) PLAN Problem Treat section (a) as one answer. From preliminary expt – predicts that rate of reaction will be proportional to [persulfate] / accept ‘doubling the concentration doubles the rate’/increasing concentration increases rate. Explains that doubling the concentration doubles the number of collisions/increasing the concentration increases the number of collisions. The use of frequency alone is incorrect but if used with other correct comments regard it as neutral. [1] [1] (b) PLAN Problem (i) [Persulfate] as independent variable. Accept the correct ion instead of the correct name. Do not accept volume or amount. (ii) Elapsed time identified as dependent variable / rate (of reaction) or equivalent. Time alone scores zero but rate alone is OK. [1] [1] (c) PLAN Problem Explains that [iodide] remains constant – (controlled variable)/so that the iodide does not run out/continuous supply of iodide ions (for reaction with persulfate). NOT allowed are reformed/regenerated alone – rubric. [1] (d) PLAN Methods (i) Has at least 3 more appropriate experiments of lower concentration. (inappropriate experiments negate this mark) (ii) At least one of the diluted (varying water or persulphate) solutions half or less of original correct concentration / uses 20 cm3 or less of persulphate at least once. (if concentration is used alone it must be correct but if used in conjunction with volumes regard the concentration as neutral). (iii) Total volume, volumes of potassium iodide, thiosulfate and starch all constant. (allow drops of starch) (use of the exemplar experiment is not mandatory) If all volumes stated, then the same procedure (with different persulfate concentrations) repeated could suffice. (iv) Burette or measuring cylinder used to measure volumes of persulfate and distilled water. (v) ‘Minimum’ is persulfate and iodide kept apart until reaction stated as started. (vi) Clock stopped when blue colour appears / elapsed time to blue colour is noted / measure time to the appearance of the blue colour. Not in a (timed) titration procedure. Also look at the table in (f) for possible answers to the first three marks. [1] [1] [1] [1] [1] [1] (e) PLAN Methods Explains that the volume / amount of thiosulfate defines the extent of the reaction (“finishing line”) to enable comparison – or equivalent statement. Relate the constant volume of thiosulphate to the end / finishing point. Any reference to ‘accuracy’ should be regarded as neutral’. [1]
Mark scheme, page 3
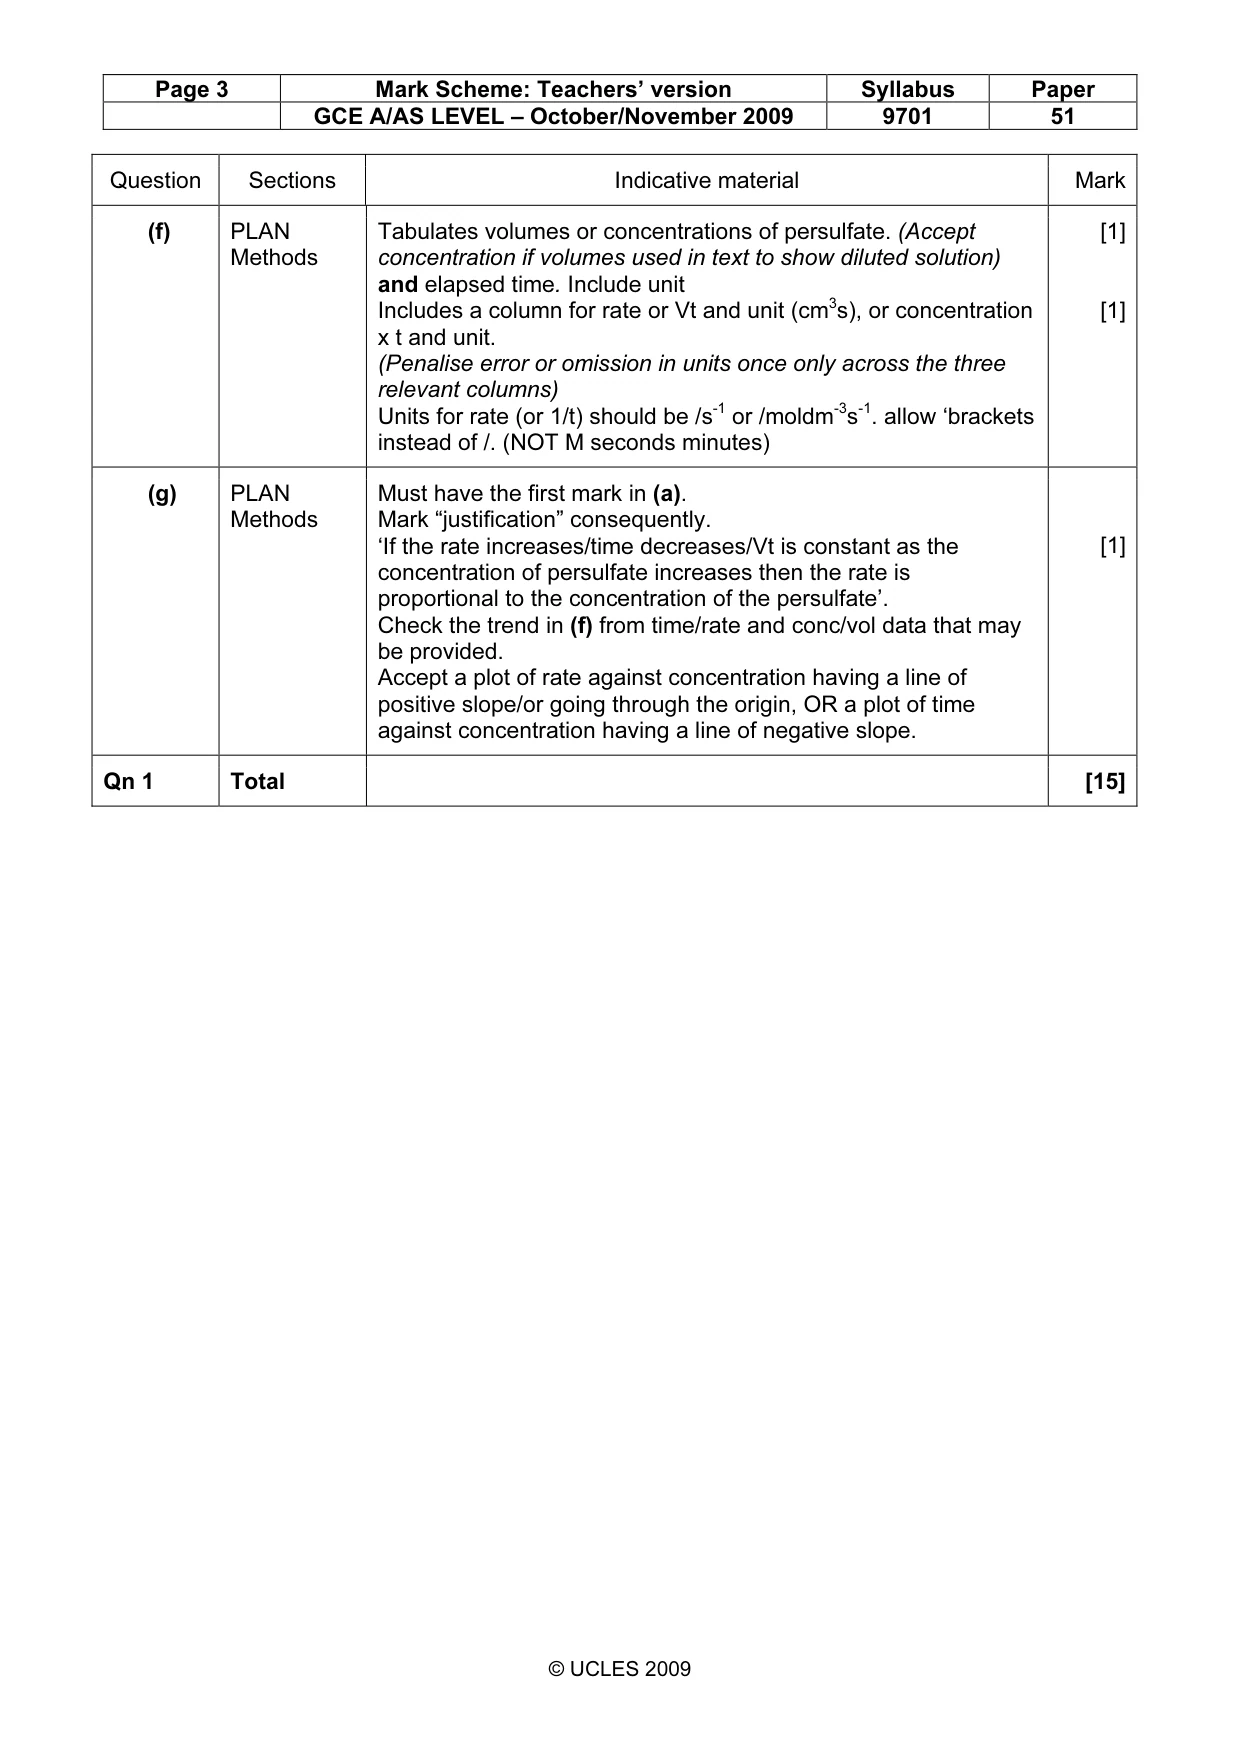
Page 3 Mark Scheme: Teachers’ version Syllabus Paper GCE A/AS LEVEL – October/November 2009 9701 51 © UCLES 2009 Question Sections Indicative material Mark (f) PLAN Methods Tabulates volumes or concentrations of persulfate. (Accept concentration if volumes used in text to show diluted solution) and elapsed time. Include unit Includes a column for rate or Vt and unit (cm3s), or concentration x t and unit. (Penalise error or omission in units once only across the three relevant columns) Units for rate (or 1/t) should be /s-1 or /moldm-3s-1. allow ‘brackets instead of /. (NOT M seconds minutes) [1] [1] (g) PLAN Methods Must have the first mark in (a). Mark “justification” consequently. ‘If the rate increases/time decreases/Vt is constant as the concentration of persulfate increases then the rate is proportional to the concentration of the persulfate’. Check the trend in (f) from time/rate and conc/vol data that may be provided. Accept a plot of rate against concentration having a line of positive slope/or going through the origin, OR a plot of time against concentration having a line of negative slope. [1] Qn 1 Total [15]
Mark scheme, page 4
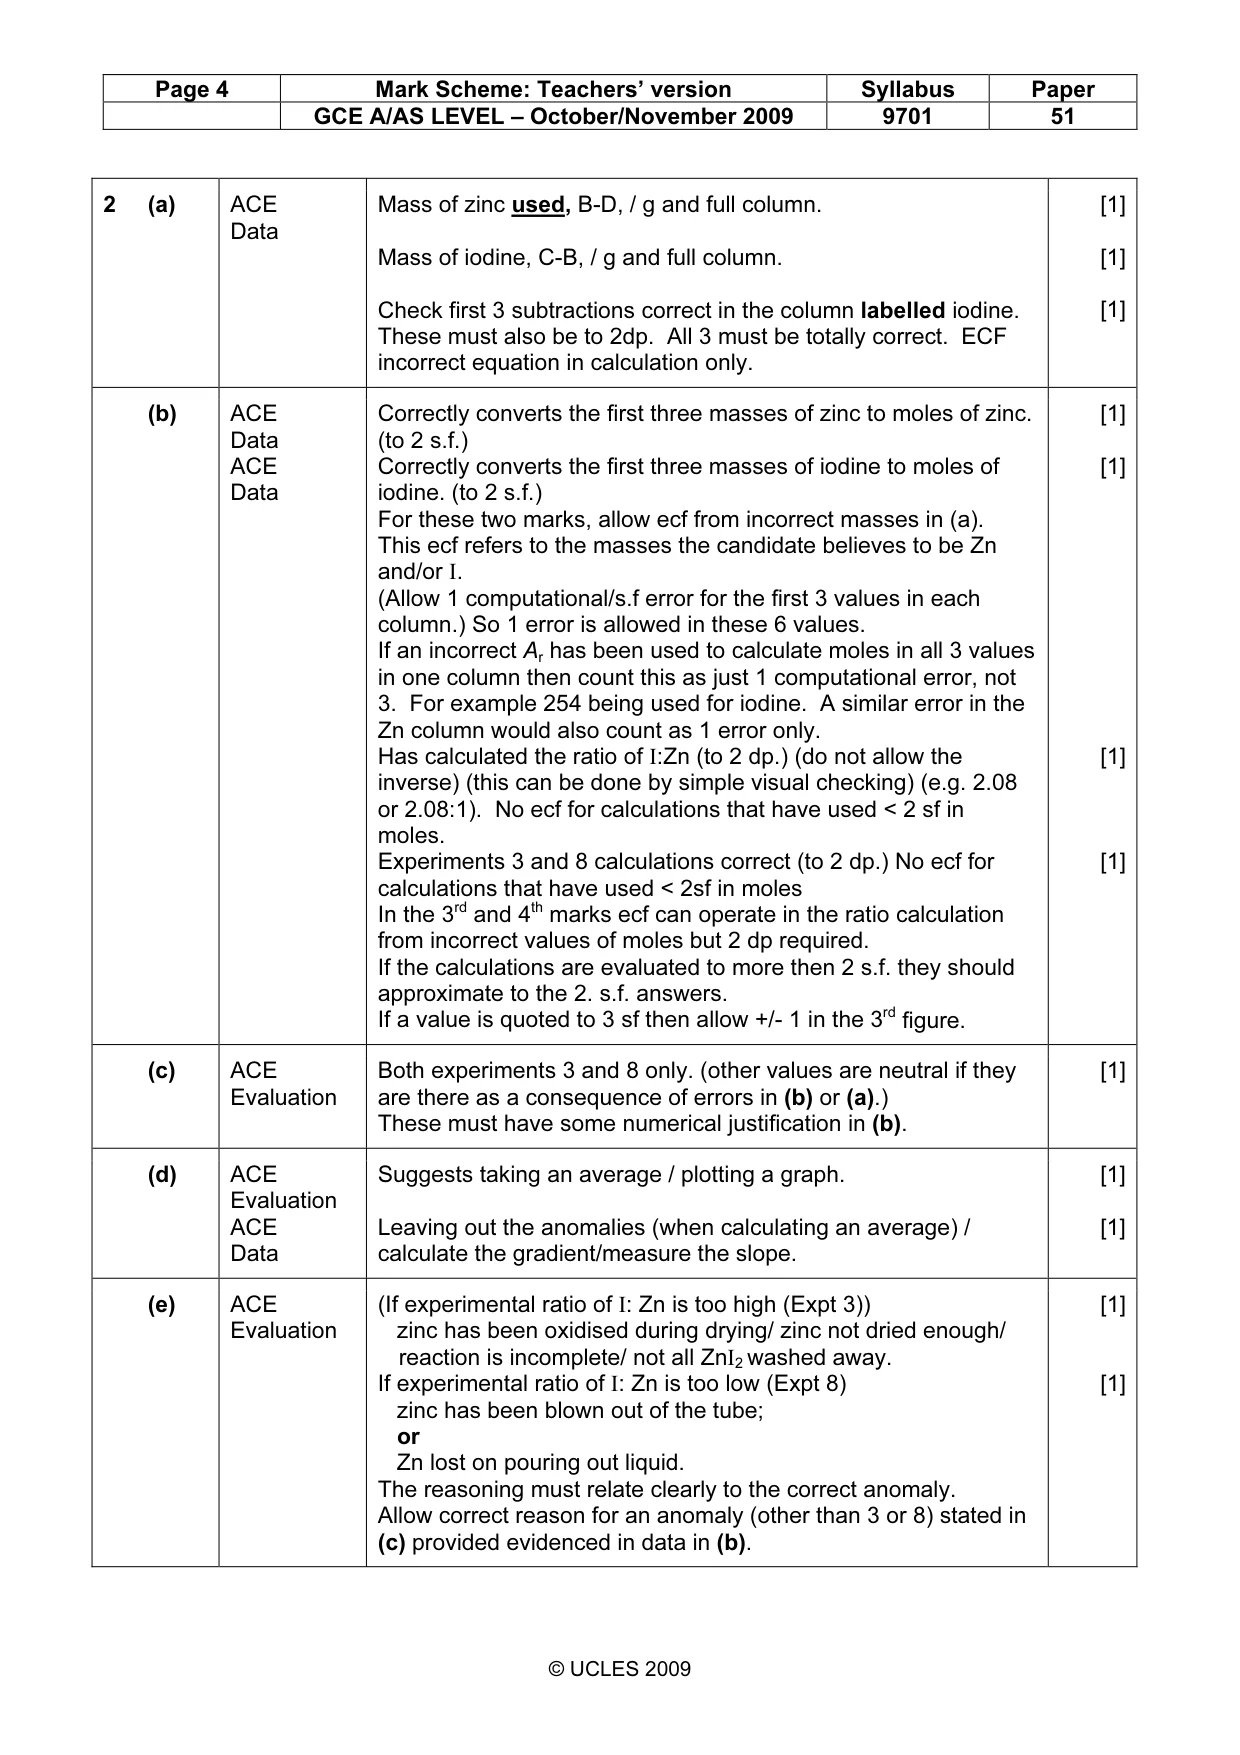
Page 4 Mark Scheme: Teachers’ version Syllabus Paper GCE A/AS LEVEL – October/November 2009 9701 51 © UCLES 2009 2 (a) ACE Data Mass of zinc used, B-D, / g and full column. Mass of iodine, C-B, / g and full column. Check first 3 subtractions correct in the column labelled iodine. These must also be to 2dp. All 3 must be totally correct. ECF incorrect equation in calculation only. [1] [1] [1] (b) ACE Data ACE Data Correctly converts the first three masses of zinc to moles of zinc. (to 2 s.f.) Correctly converts the first three masses of iodine to moles of iodine. (to 2 s.f.) For these two marks, allow ecf from incorrect masses in (a). This ecf refers to the masses the candidate believes to be Zn and/or I. (Allow 1 computational/s.f error for the first 3 values in each column.) So 1 error is allowed in these 6 values. If an incorrect Ar has been used to calculate moles in all 3 values in one column then count this as just 1 computational error, not 3. For example 254 being used for iodine. A similar error in the Zn column would also count as 1 error only. Has calculated the ratio of I:Zn (to 2 dp.) (do not allow the inverse) (this can be done by simple visual checking) (e.g. 2.08 or 2.08:1). No ecf for calculations that have used < 2 sf in moles. Experiments 3 and 8 calculations correct (to 2 dp.) No ecf for calculations that have used < 2sf in moles In the 3rd and 4th marks ecf can operate in the ratio calculation from incorrect values of moles but 2 dp required. If the calculations are evaluated to more then 2 s.f. they should approximate to the 2. s.f. answers. If a value is quoted to 3 sf then allow +/- 1 in the 3rd figure. [1] [1] [1] [1] (c) ACE Evaluation Both experiments 3 and 8 only. (other values are neutral if they are there as a consequence of errors in (b) or (a).) These must have some numerical justification in (b). [1] (d) ACE Evaluation ACE Data Suggests taking an average / plotting a graph. Leaving out the anomalies (when calculating an average) / calculate the gradient/measure the slope. [1] [1] (e) ACE Evaluation (If experimental ratio of I: Zn is too high (Expt 3)) zinc has been oxidised during drying/ zinc not dried enough/ reaction is incomplete/ not all ZnI2 washed away. If experimental ratio of I: Zn is too low (Expt 8) zinc has been blown out of the tube; or Zn lost on pouring out liquid. The reasoning must relate clearly to the correct anomaly. Allow correct reason for an anomaly (other than 3 or 8) stated in (c) provided evidenced in data in (b). [1] [1]
Mark scheme, page 5
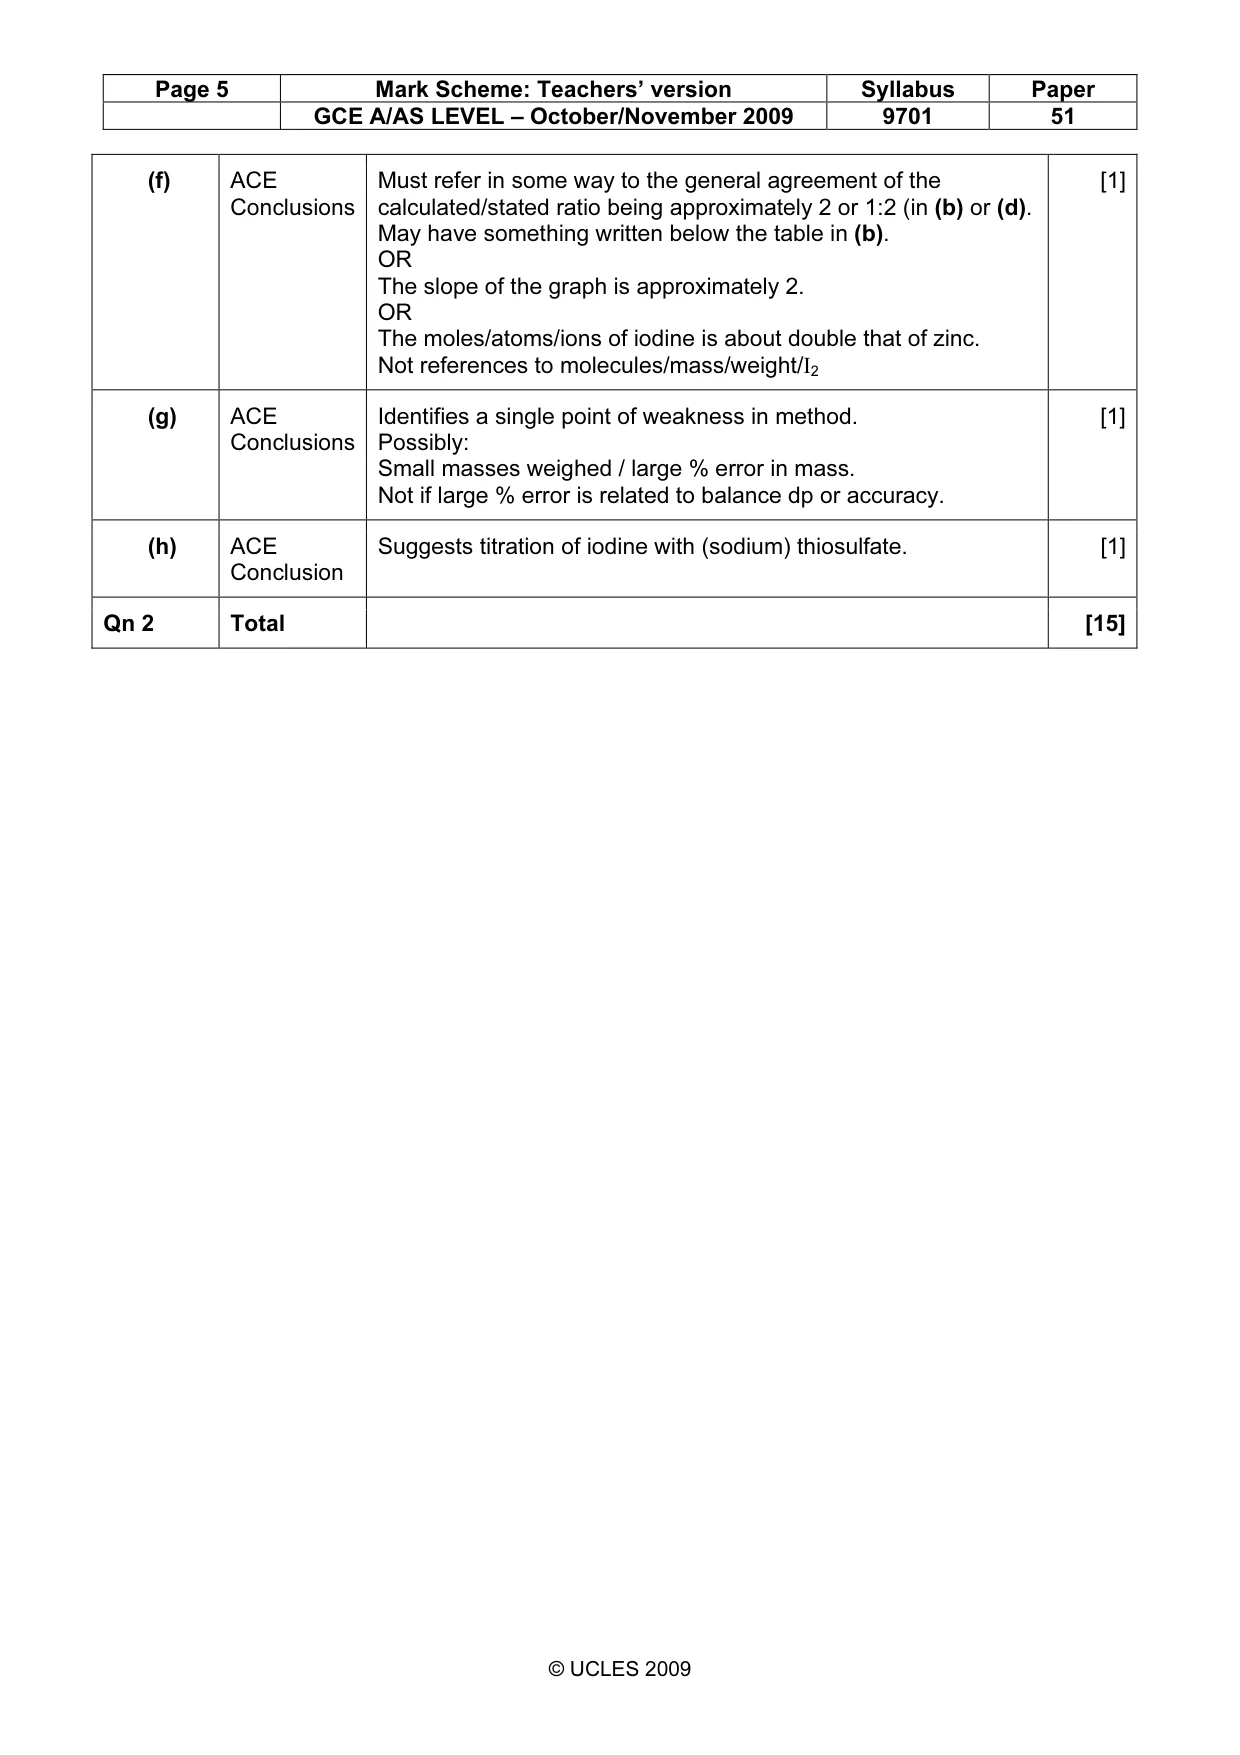
Page 5 Mark Scheme: Teachers’ version Syllabus Paper GCE A/AS LEVEL – October/November 2009 9701 51 © UCLES 2009 (f) ACE Conclusions Must refer in some way to the general agreement of the calculated/stated ratio being approximately 2 or 1:2 (in (b) or (d). May have something written below the table in (b). OR The slope of the graph is approximately 2. OR The moles/atoms/ions of iodine is about double that of zinc. Not references to molecules/mass/weight/I2 [1] (g) ACE Conclusions Identifies a single point of weakness in method. Possibly: Small masses weighed / large % error in mass. Not if large % error is related to balance dp or accuracy. [1] (h) ACE Conclusion Suggests titration of iodine with (sodium) thiosulfate. [1] Qn 2 Total [15]