Cambridge A Level Biology 9700 — 2022 May/June Paper 3 · Variant 3
9700/33/M/J/22 · 2 questions · 40 marks · ≈45 min
The question paper and its mark scheme, free to read here and free to download. This is Cambridge’s own paper, exactly as it was sat.
Question paper16 pages



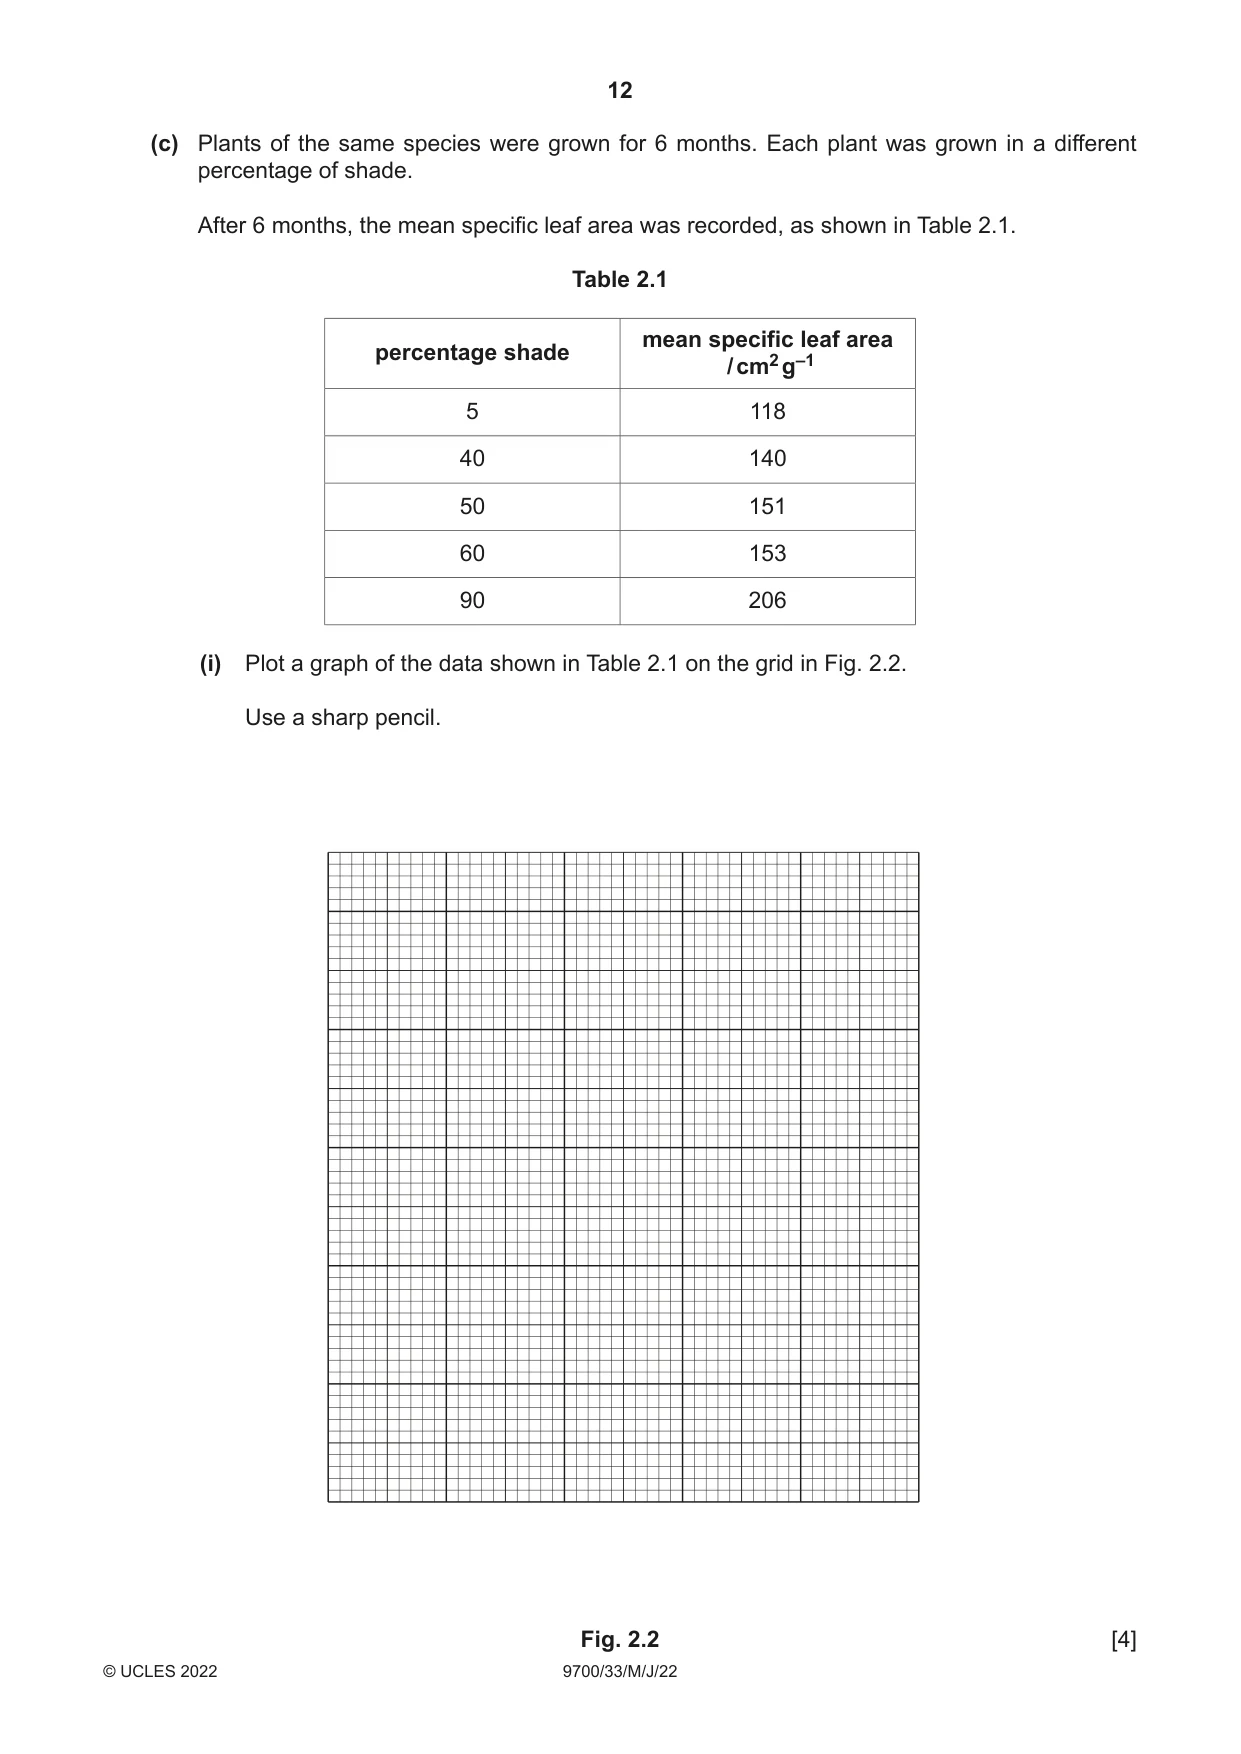



Mark scheme7 pages
Answers below. Sit the paper first if you are practising.
Questions as text
Q1 · Plant cells contain an enzyme which catalyses the breakdown of hydrogen peroxide…
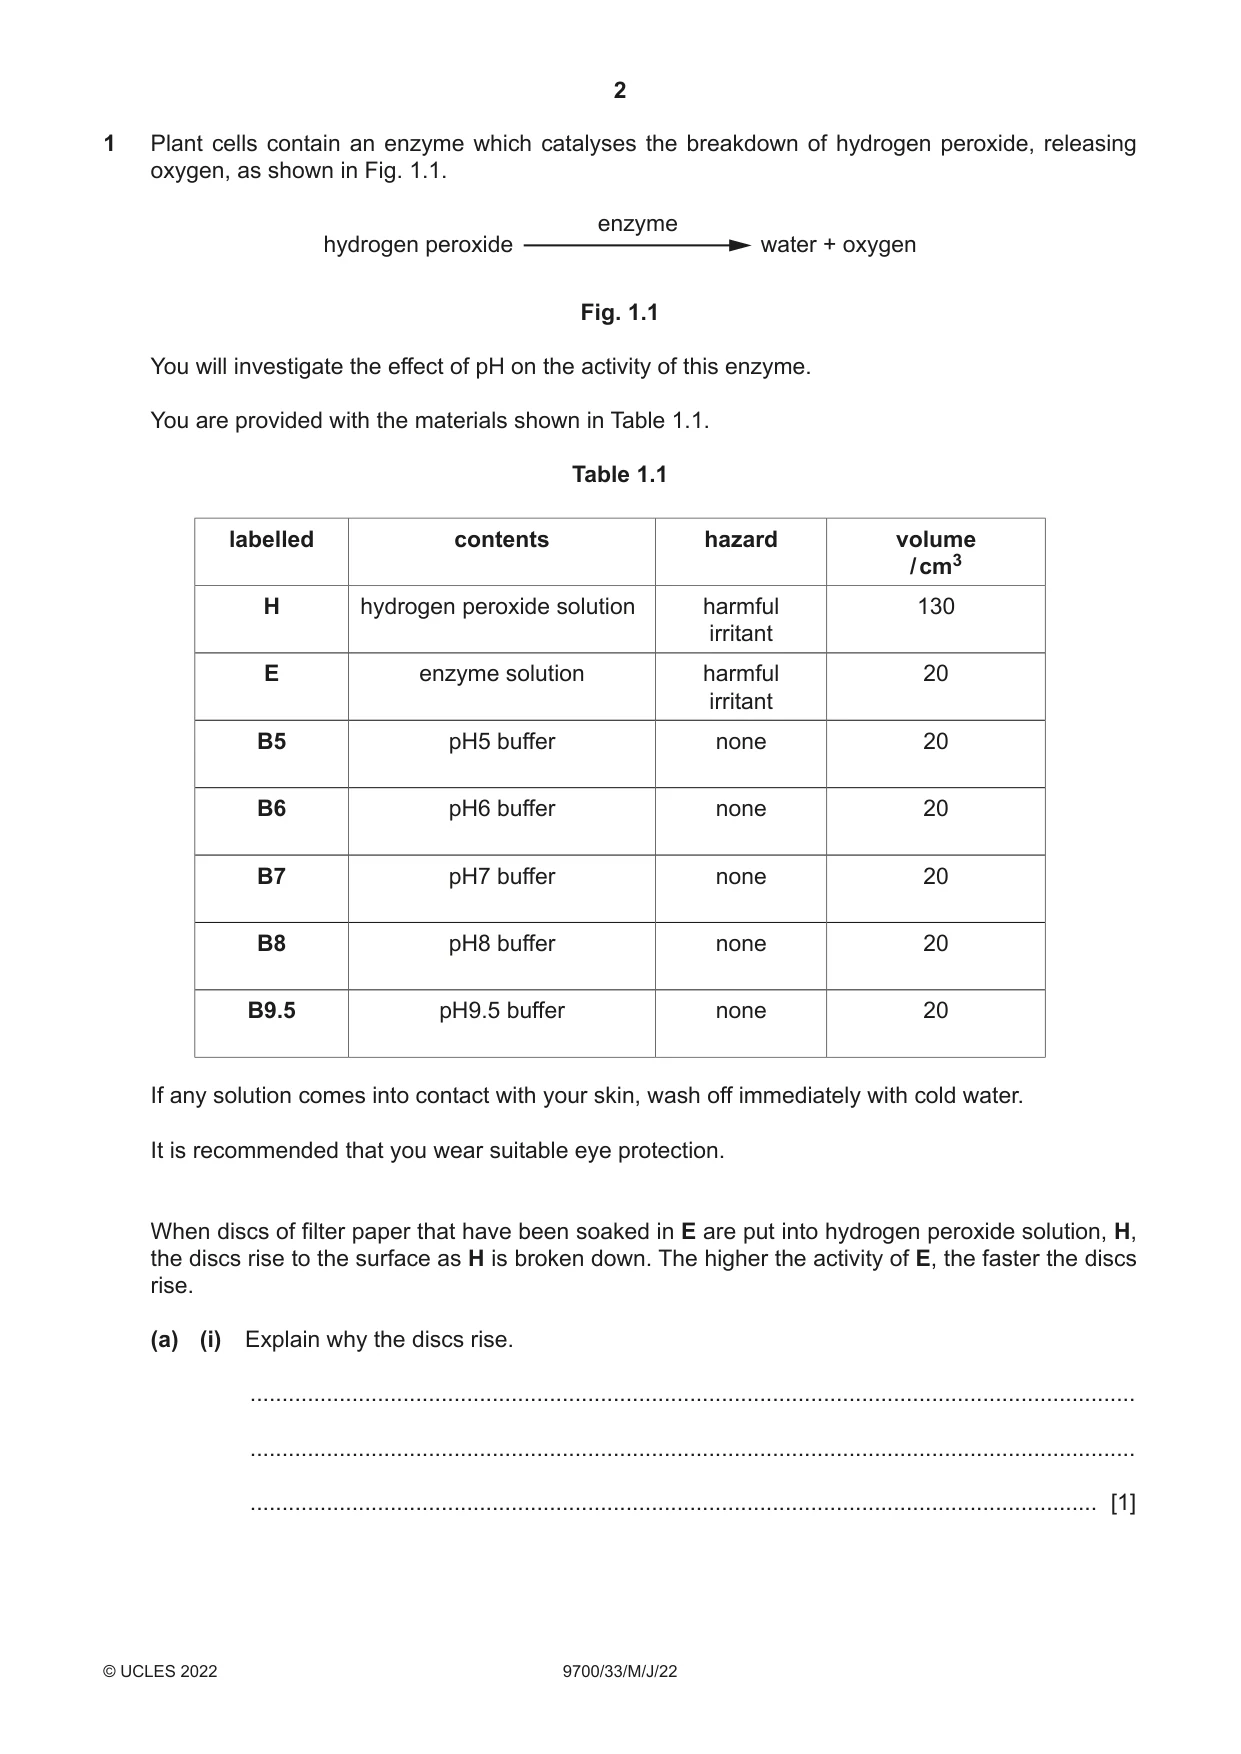
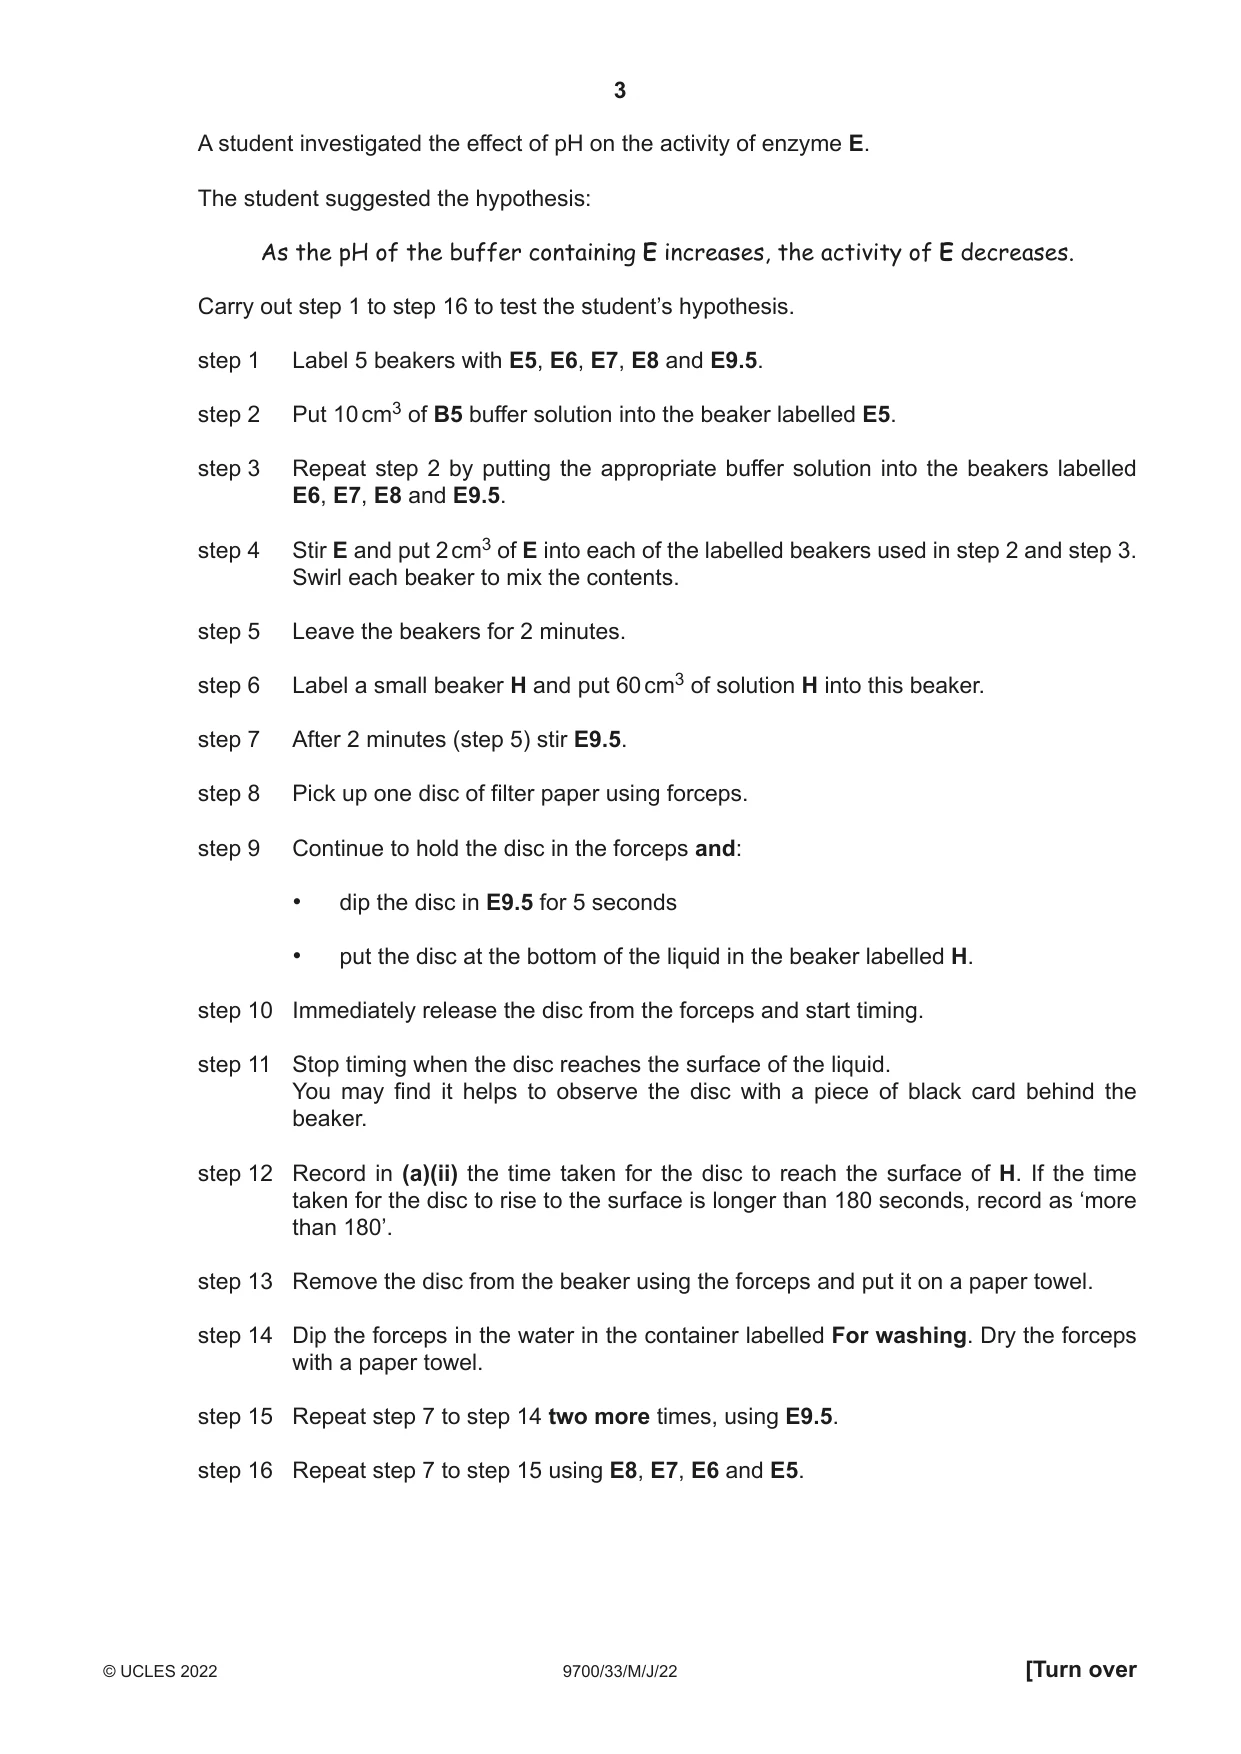
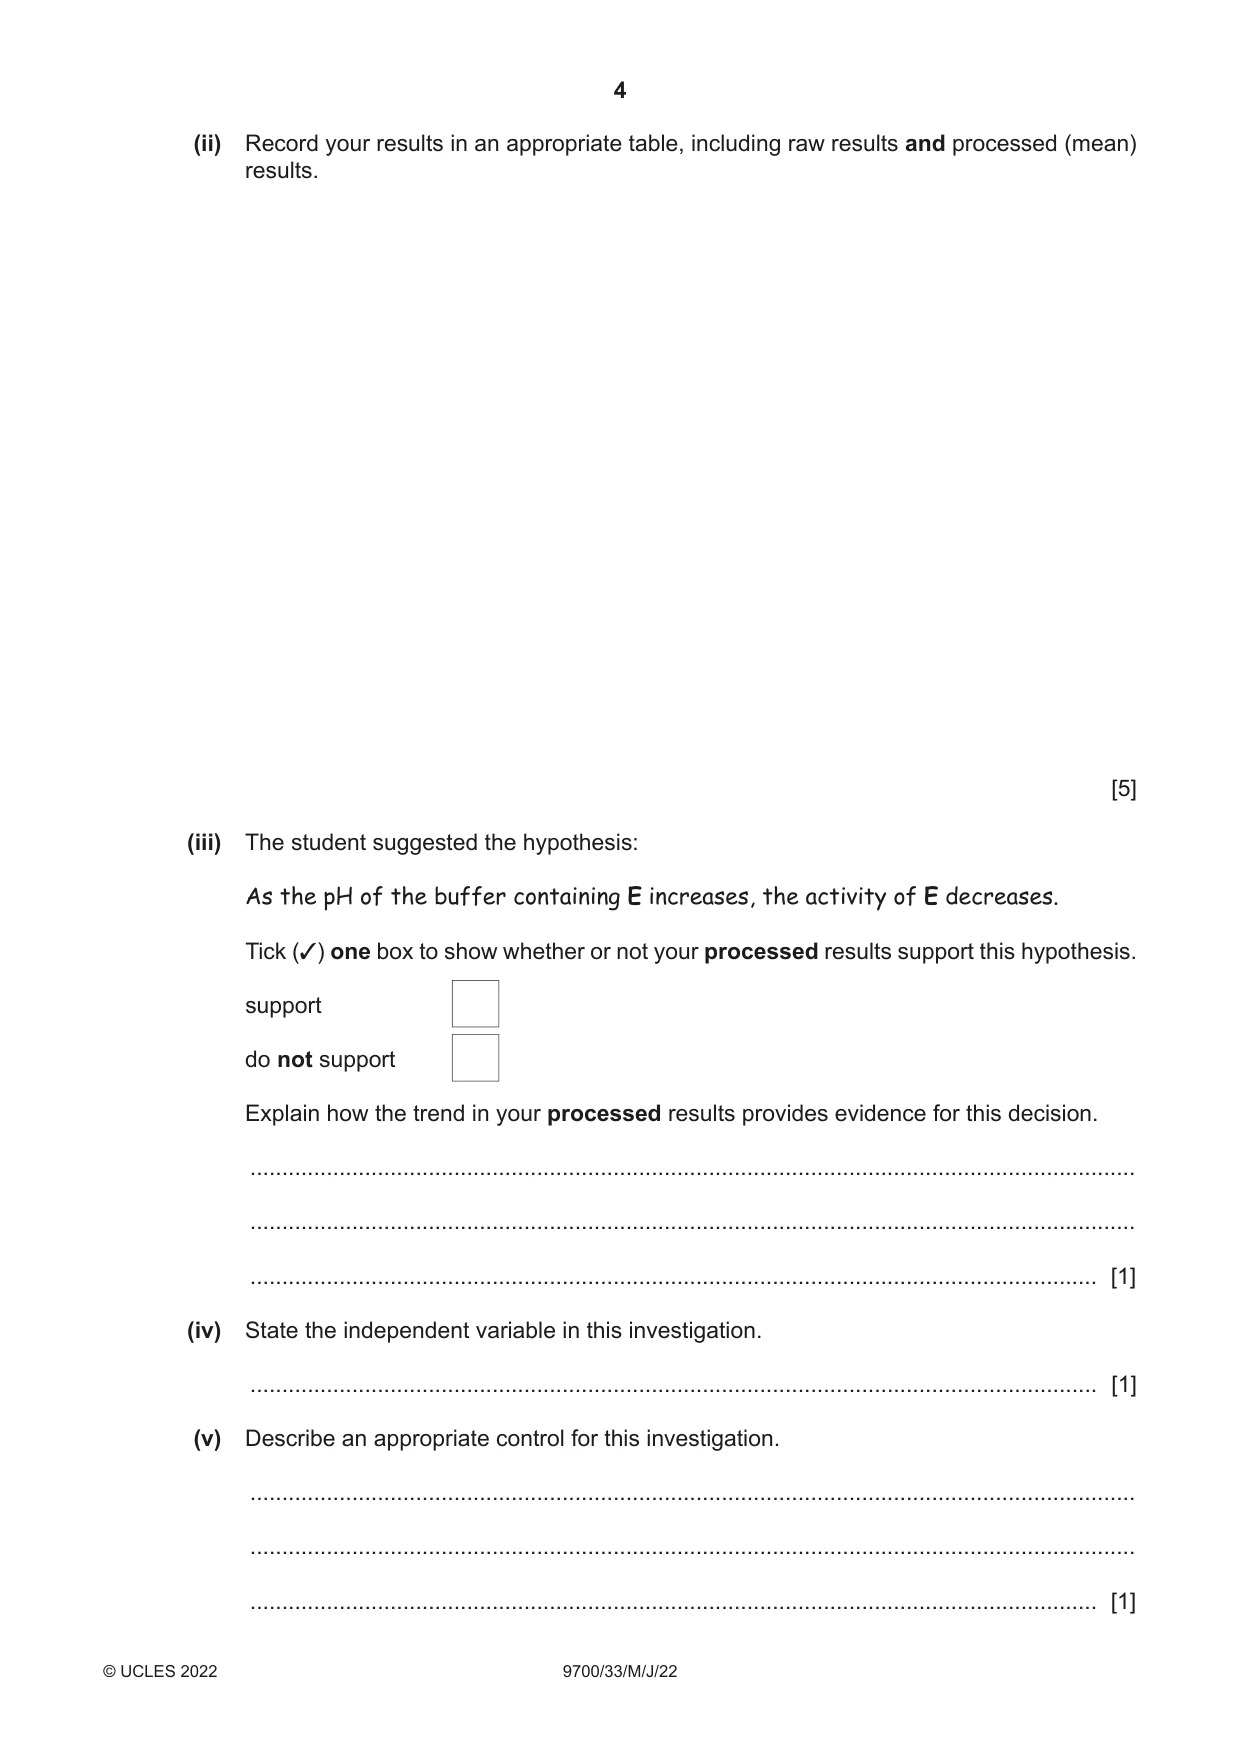
1 Plant cells contain an enzyme which catalyses the breakdown of hydrogen peroxide, releasing oxygen, as shown in Fig. 1.1. enzyme hydrogen peroxide water + oxygen Fig. 1.1 You will investigate the effect of pH on the activity of this enzyme. You are provided with the materials shown in Table 1.1. Table 1.1 labelled contents hazard volume / cm3 H hydrogen peroxide solution harmful 130 irritant E enzyme solution harmful 20 irritant B5 pH5 buffer none 20 B6 pH6 buffer none 20 B7 pH7 buffer none 20 B8 pH8 buffer none 20 B9.5 pH9.5 buffer none 20 If any solution comes into contact with your skin, wash off immediately with cold water. It is recommended that you wear suitable eye protection. When discs of filter paper that have been soaked in E are put into hydrogen peroxide solution, H, the discs rise to the surface as H is broken down. The higher the activity of E, the faster the discs rise. (a) (i) Explain why the discs rise. ........................................................................................................................................... ........................................................................................................................................... ..................................................................................................................................... [1] A student investigated the effect of pH on the activity of enzyme E. The student suggested the hypothesis: As the pH of the buffer containing E increases, the activity of E decreases. Carry out step 1 to step 16 to test the student’s hypothesis. step 1 Label 5 beakers with E5, E6, E7, E8 and E9.5. step 2 Put 10 cm3 of B5 buffer solution into the beaker labelled E5. step 3 Repeat step 2 by putting the appropriate buffer solution into the beakers labelled E6, E7, E8 and E9.5. step 4 Stir E and put 2 cm3 of E into each of the labelled beakers used in step 2 and step 3. Swirl each beaker to mix the contents. step 5 Leave the beakers for 2 minutes. step 6 Label a small beaker H and put 60 cm3 of solution H into this beaker. step 7 After 2 minutes (step 5) stir E9.5. step 8 Pick up one disc of filter paper using forceps. step 9 Continue to hold the disc in the forceps and: • dip the disc in E9.5 for 5 seconds • put the disc at the bottom of the liquid in the beaker labelled H. step 10 Immediately release the disc from the forceps and start timing. step 11 Stop timing when the disc reaches the surface of the liquid. You may find it helps to observe the disc with a piece of black card behind the beaker. step 12 Record in (a)(ii) the time taken for the disc to reach the surface of H. If the time taken for the disc to rise to the surface is longer than 180 seconds, record as ‘more than 180’. step 13 Remove the disc from the beaker using the forceps and put it on a paper towel. step 14 Dip the forceps in the water in the container labelled For washing. Dry the forceps with a paper towel. step 15 Repeat step 7 to step 14 two more times, using E9.5. step 16 Repeat step 7 to step 15 using E8, E7, E6 and E5. (ii) Record your results in an appropriate table, including raw results and processed (mean) results. [5] (iii) The student suggested the hypothesis: As the pH of the buffer containing E increases, the activity of E decreases. Tick (3) one box to show whether or not your processed results support this hypothesis. support do not support Explain how the trend in your processed results provides evidence for this decision. ........................................................................................................................................... ........................................................................................................................................... ..................................................................................................................................... [1] (iv) State the independent variable in this investigation. ..................................................................................................................................... [1] (v) Describe an appropriate control for this investigation. ........................................................................................................................................... ........................................................................................................................................... ..................................................................................................................................... [1] (vi) One possible source of error in this investigation is reusing the same hydrogen peroxide solution for all the discs. Suggest a reason why reusing the same hydrogen peroxide solution is a possible source of error. ........................................................................................................................................... ........................................................................................................................................... ........................................................................................................................................... State how you could reduce this source of error. ........................................................................................................................................... ........................................................................................................................................... ........................................................................................................................................... [2] (vii) Describe how you could modify your procedure to determine the optimum pH for this enzyme. ........................................................................................................................................... ..................................................................................................................................... [1] (b) Temperature is another factor that affects the activity of an enzyme. You will show the effect of preheating the enzyme at two different temperatures, before measuring the activity of this enzyme. You will select two temperatures and standardise the pH by choosing an appropriate buffer. (i) Measure the room temperature. room temperature ......................................................... [1] (ii) Select two temperatures between room temperature and 50 °C. State the temperatures you have selected. ................................................................. ................................................................. [1] step 17 Prepare a water-bath at the lowest temperature you stated in (b)(ii). (iii) You will need to standardise the pH by choosing an appropriate mixture of buffer and enzyme, E5, E6, E7, E8 or E9.5. State the mixture of buffer and enzyme you will use. .................................................. [1] step 18 Label one test-tube T1 and label another test-tube T2. step 19 Stir the mixture of buffer and E you chose in (b)(iii) and put approximately 5 cm3 into each of the test-tubes T1 and T2. step 20 Put test-tube T1 into the water-bath and leave it for 5 minutes. step 21 Empty the small beaker labelled H into the container labelled For waste. step 22 Put 60 cm3 of H into the small beaker labelled H. step 23 After 5 minutes (step 20) pour the mixture from test-tube T1 into a clean beaker. step 24 Pick up one disc of filter paper using forceps. step 25 Continue to hold the disc in the forceps and: • dip the disc in the mixture in the beaker for 5 seconds • put the disc at the bottom of the liquid in the beaker labelled H. step 26 Immediately release the disc from the forceps and start timing. step 27 Stop timing when the disc reaches the surface of the liquid. You may find it helps to observe the disc with a piece of black card behind the beaker. step 28 Record in (b)(iv) the time taken for the disc to reach the surface of H. If the time taken for the disc to rise back to the surface is longer than 180 seconds, record as ‘more than 180’. step 29 Remove the disc using the forceps and put it on a paper towel. step 30 Dip the forceps in the water in the beaker labelled For washing. Dry the forceps with a paper towel. step 31 Heat the water-bath to the other temperature you stated in (b)(ii). step 32 Put test-tube T2 into the water-bath and leave it for 5 minutes. step 33 After 5 minutes (step 32) pour the mixture from test-tube T2 into a clean beaker. step 34 Repeat step 24 to step 28. (iv) Record your results for T1 and T2. T1 ......................................................... T2 ......................................................... [1] (v) Explain the effect of increased temperature on the activity of enzyme E. ........................................................................................................................................... ........................................................................................................................................... ........................................................................................................................................... ........................................................................................................................................... ........................................................................................................................................... ........................................................................................................................................... ..................................................................................................................................... [3] [Total: 19]
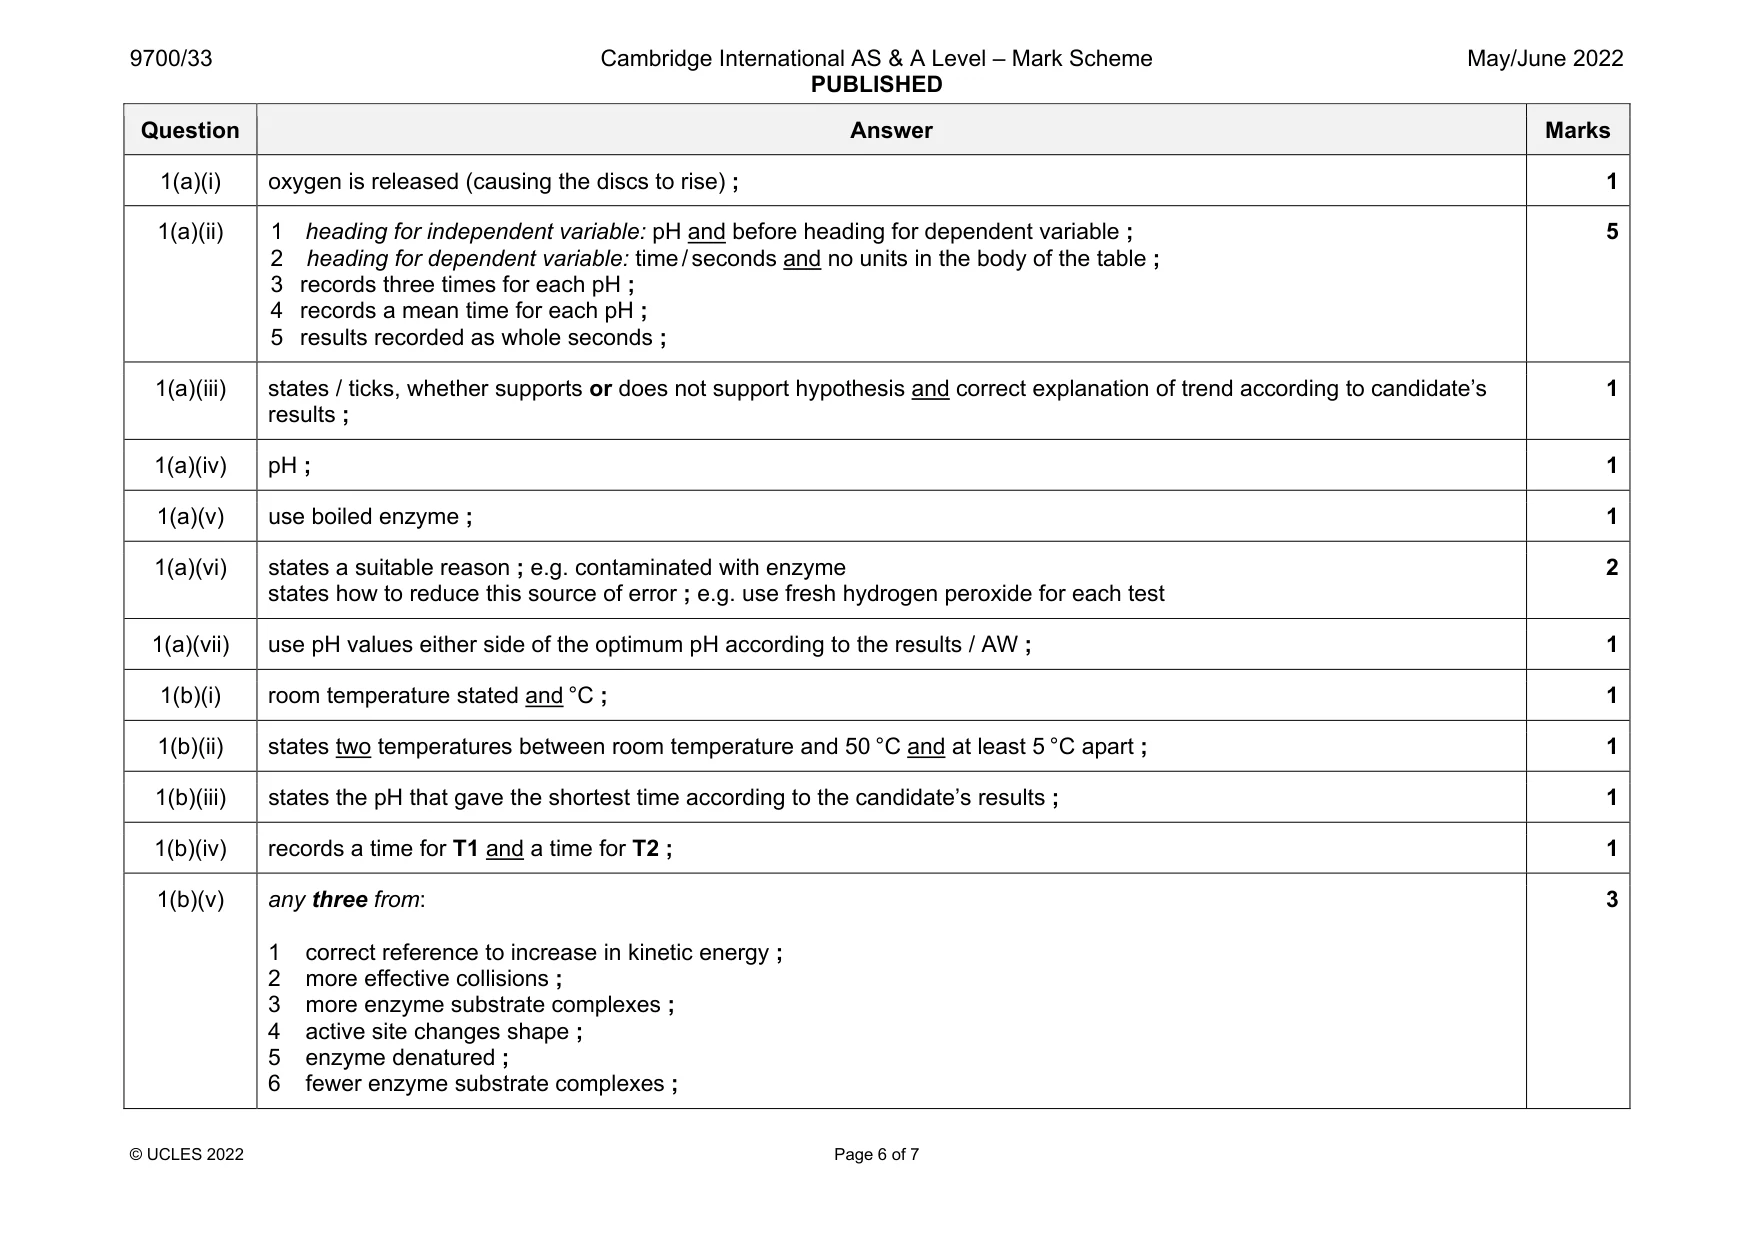
Mark scheme: 1(a)(i) oxygen is released (causing the discs to rise) ; 1 1(a)(ii) 1 heading for independent variable: pH and before heading for dependent variable ; 2 heading for dependent variable: time / seconds and no units in the body of the table ; 3 records three times for each pH ; 4 records a mean time for each pH ; 5 results recorded as whole seconds ; 5 1(a)(iii) states / ticks, whether supports or does not support hypothesis and correct explanation of trend according to candidate’s results ; 1 1(a)(iv) pH ; 1 1(a)(v) use boiled enzyme ; 1 1(a)(vi) states a suitable reason ; e.g. contaminated with enzyme states how to reduce this source of error ; e.g. use fresh hydrogen peroxide for each test 2 1(a)(vii) use pH values either side of the optimum pH according to the results / AW ; 1 1(b)(i) room temperature stated and °C ; 1 1(b)(ii) states two temperatures between room temperature and 50 °C and at least 5 °C apart ; 1 1(b)(iii) states the pH that gave the shortest time according to the candidate’s results ; 1 1(b)(iv) records a time for T1 and a time for T2 ; 1 1(b)(v) any three from: 1 correct reference to increase in kinetic energy ; 2 more effective collisions ; 3 more enzyme substrate complexes ; 4 active site changes shape ; 5 enzyme denatured ; 6 fewer enzyme substrate complexes ; 3
Q2 · L1 is a slide of a stained transverse section through a plant leaf
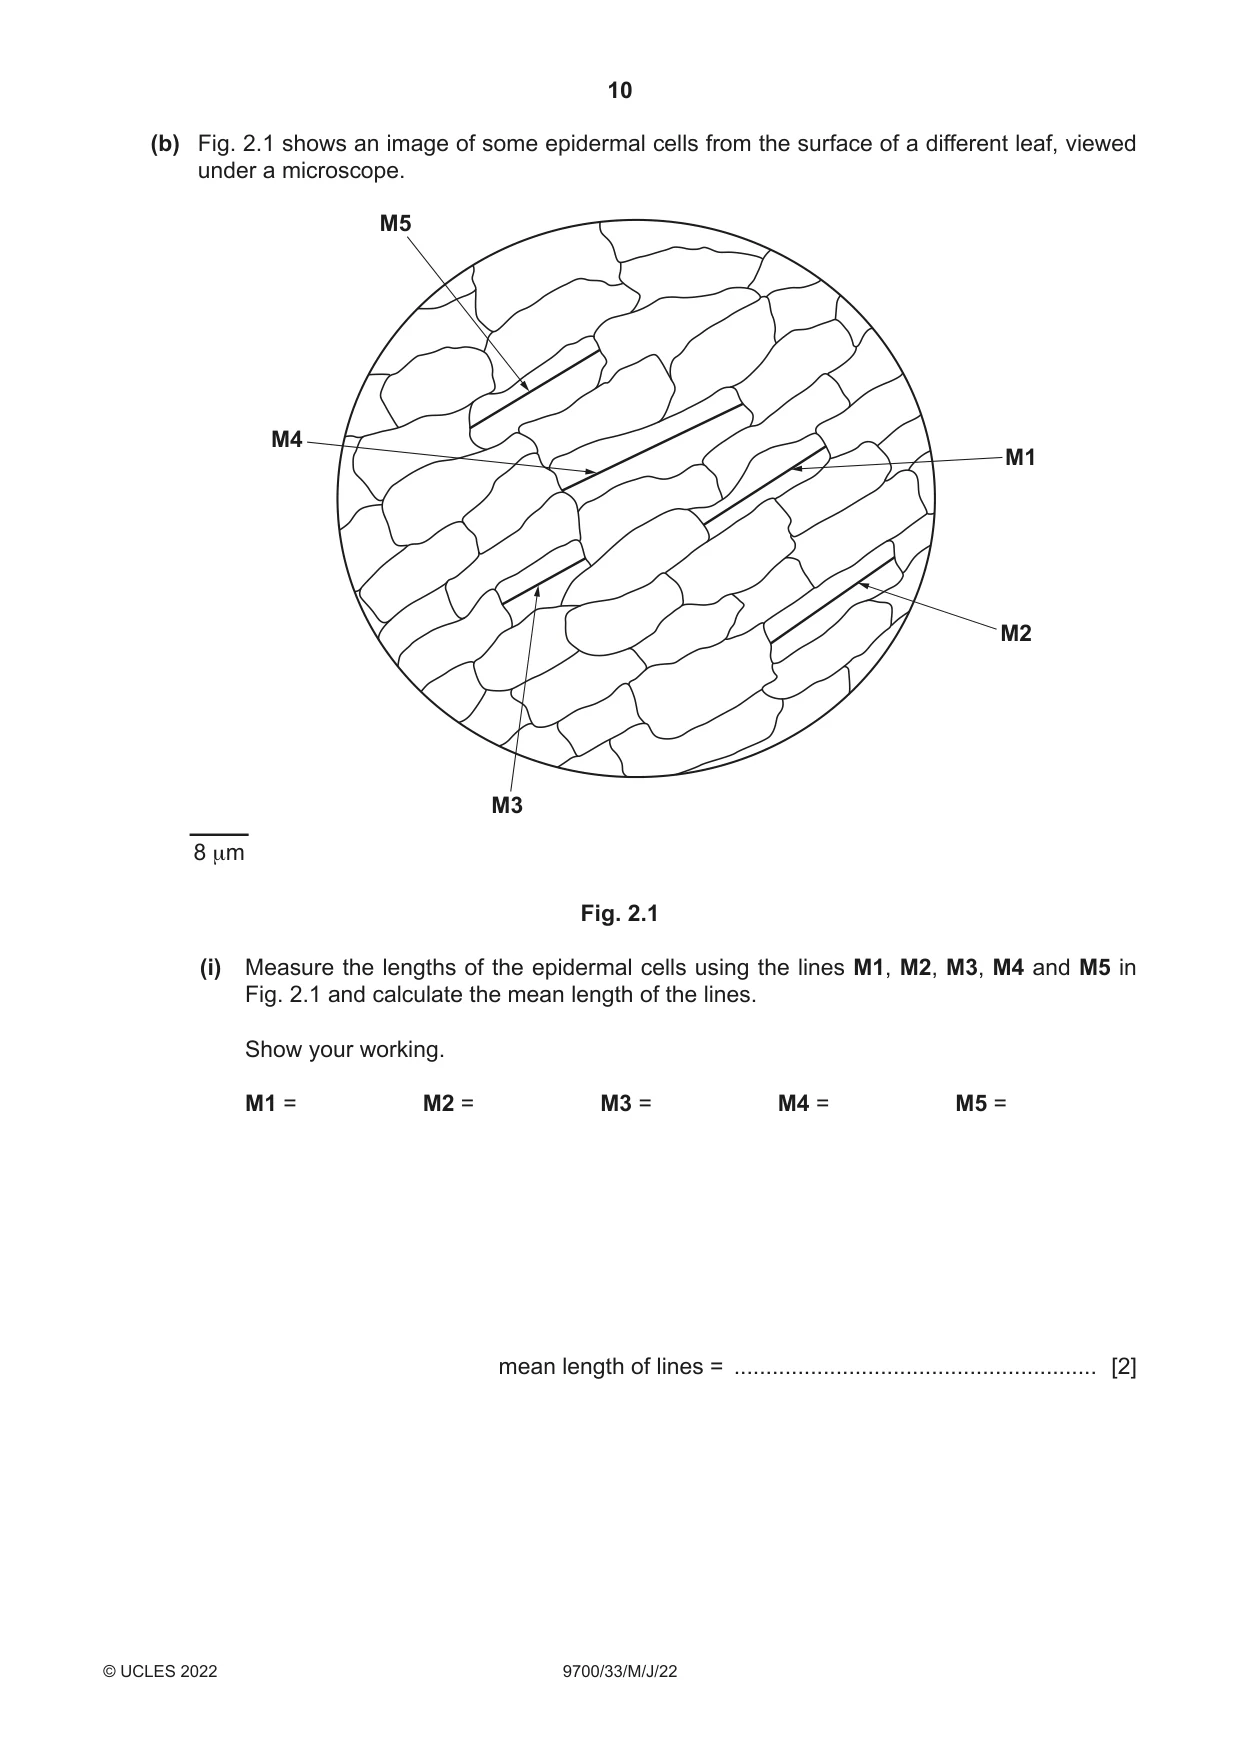
2 L1 is a slide of a stained transverse section through a plant leaf. (a) (i) Draw a large plan diagram of the whole section on L1. Use a sharp pencil. Use one ruled label line and label to identify a trichome. [5] (ii) Observe the upper epidermis and the layer of cells beneath it on the section of the leaf on L1. Select a group of four adjacent cells, two cells from the upper epidermis and two cells from the layer below the upper epidermis. Each cell must touch at least two of the other cells. • Make a large drawing of this group of four cells. • Use one ruled label line and label to identify a chloroplast in one cell. [5] (b) Fig. 2.1 shows an image of some epidermal cells from the surface of a different leaf, viewed under a microscope. M5 M4 M1 M2 M3 8 μm Fig. 2.1 (i) Measure the lengths of the epidermal cells using the lines M1, M2, M3, M4 and M5 in Fig. 2.1 and calculate the mean length of the lines. Show your working. M1 = M2 = M3 = M4 = M5 = mean length of lines = ......................................................... [2]
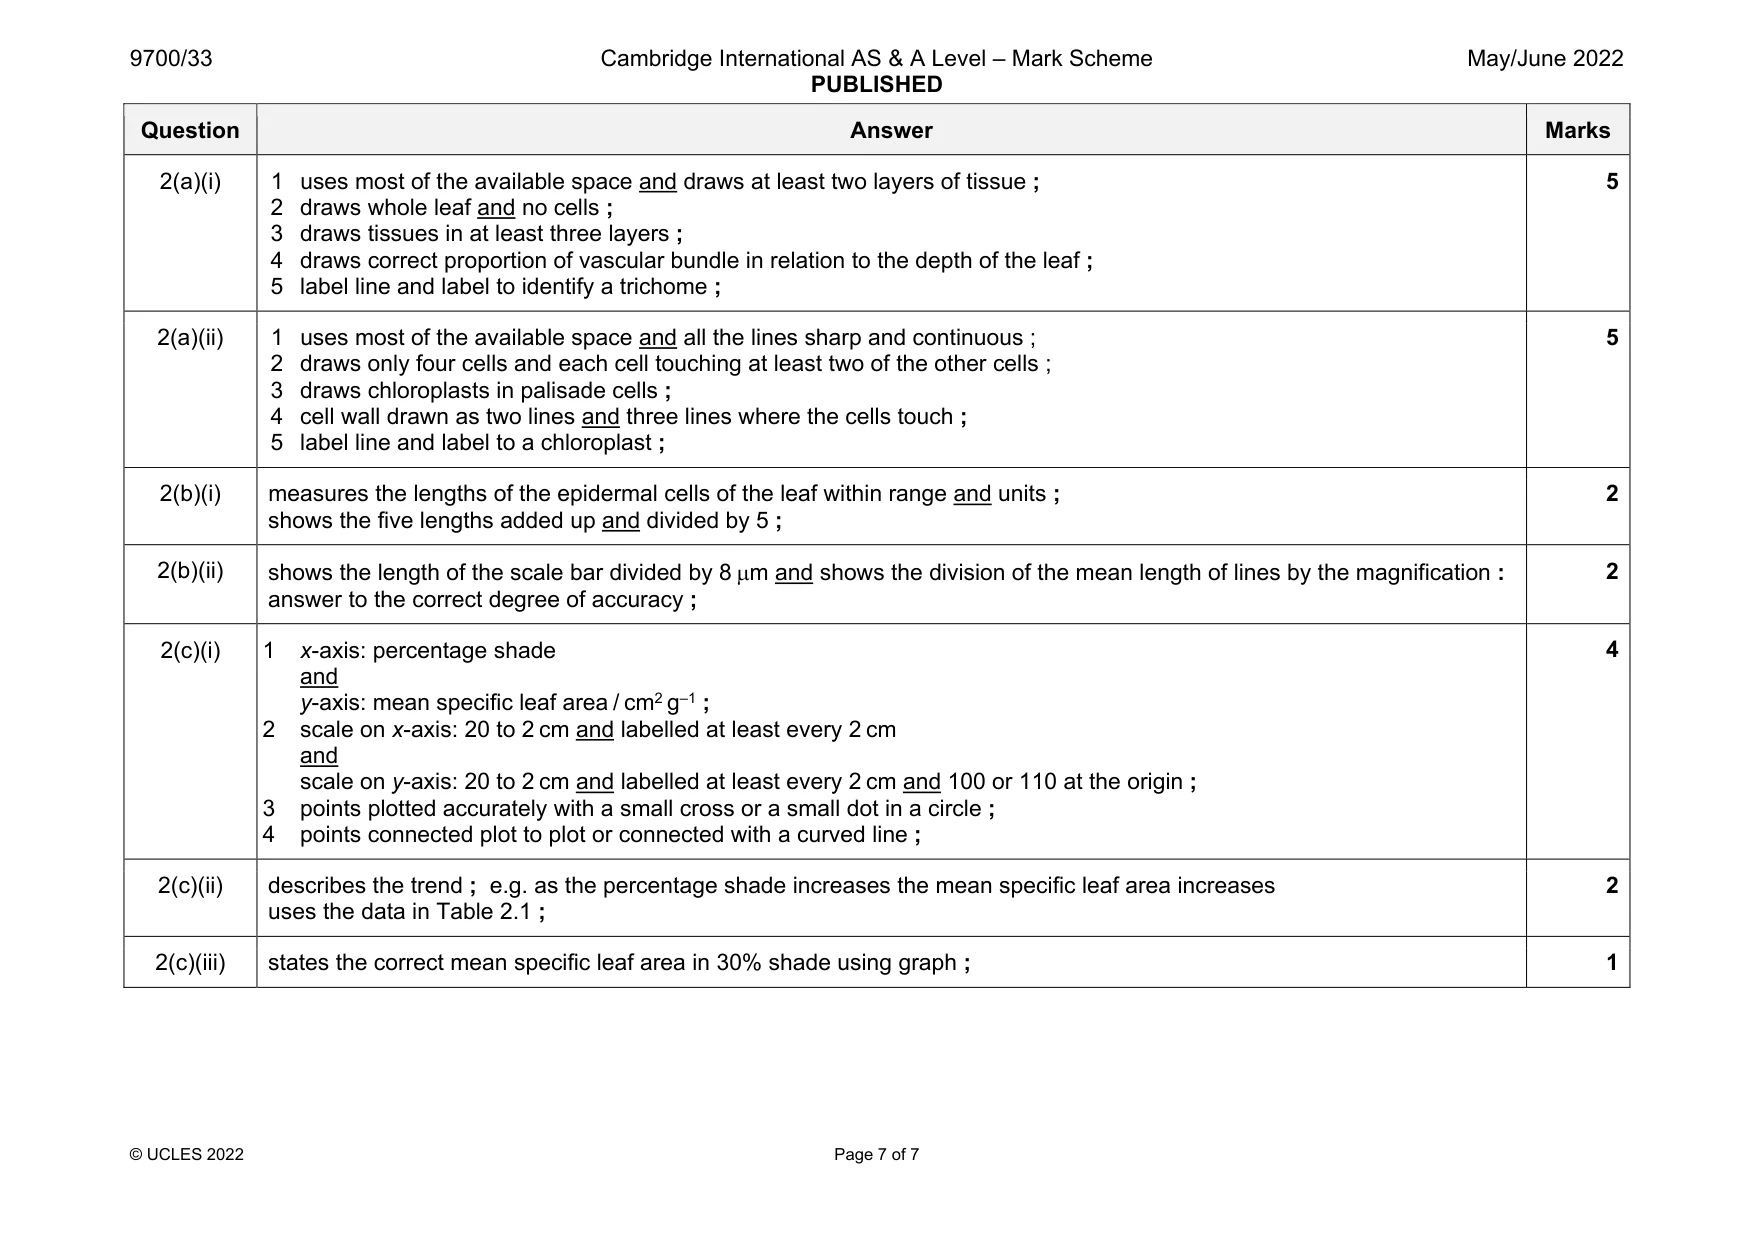
Mark scheme: 2(a)(i) 1 uses most of the available space and draws at least two layers of tissue ; 2 draws whole leaf and no cells ; 3 draws tissues in at least three layers ; 4 draws correct proportion of vascular bundle in relation to the depth of the leaf ; 5 label line and label to identify a trichome ; 5 2(a)(ii) 1 uses most of the available space and all the lines sharp and continuous ; 2 draws only four cells and each cell touching at least two of the other cells ; 3 draws chloroplasts in palisade cells ; 4 cell wall drawn as two lines and three lines where the cells touch ; 5 label line and label to a chloroplast ; 5 2(b)(i) measures the lengths of the epidermal cells of the leaf within range and units ; shows the five lengths added up and divided by 5 ; 2 2(b)(ii) shows the length of the scale bar divided by 8 m and shows the division of the mean length of lines by the magnification : answer to the correct degree of accuracy ; 2 2(c)(i) 1 x-axis: percentage shade and y-axis: mean specific leaf area / cm2 g–1 ; 2 scale on x-axis: 20 to 2 cm and labelled at least every 2 cm and scale on y-axis: 20 to 2 cm and labelled at least every 2 cm and 100 or 110 at the origin ; 3 points plotted accurately with a small cross or a small dot in a circle ; 4 points connected plot to plot or connected with a curved line ; 4 2(c)(ii) describes the trend ; e.g. as the percentage shade increases the mean specific leaf area increases uses the data in Table 2.1 ; 2 2(c)(iii) states the correct mean specific leaf area in 30% shade using graph ; 1
What was in this paper
The subtopics covered by these 2 questions, and how many questions each got. Open one in a new tab to see every Cambridge question on it.
What you needed in this session
Cambridge’s own grade thresholds for 2022 May/June, Paper 3 · Variant 3. A higher threshold means an easier paper — the bar moves with how the cohort did.