Cambridge A Level Biology 9700 — 2016 May/June Paper 3 · Variant 5
9700/35/M/J/16 · 40 marks · ≈45 min
The question paper and its mark scheme, free to read here and free to download. This is Cambridge’s own paper, exactly as it was sat.
Question paper12 pages

Mark scheme4 pages
Answers below. Sit the paper first if you are practising.
Paper as text
Question paper, page 1
This document consists of 11 printed pages and 1 blank page. DC (ST/SW) 105821/3 © UCLES 2016 [Turn over Cambridge International Examinations Cambridge International Advanced Subsidiary and Advanced Level * 7 2 7 4 0 2 5 4 3 0 * BIOLOGY 9700/35 Paper 3 Advanced Practical Skills 1 May/June 2016 2 hours Candidates answer on the Question Paper. Additional Materials: As listed in the Confidential Instructions. READ THESE INSTRUCTIONS FIRST Write your Centre number, candidate number and name on all the work you hand in. Write in dark blue or black pen. You may use an HB pencil for any diagrams or graphs. Do not use staples, paper clips, glue or correction fluid. DO NOT WRITE IN ANY BARCODES. Answer all questions. Electronic calculators may be used. You may lose marks if you do not show your working or if you do not use appropriate units. At the end of the examination, fasten all your work securely together. The number of marks is given in brackets [ ] at the end of each question or part question. For Examiner’s Use 1 2 Total
Question paper, page 2
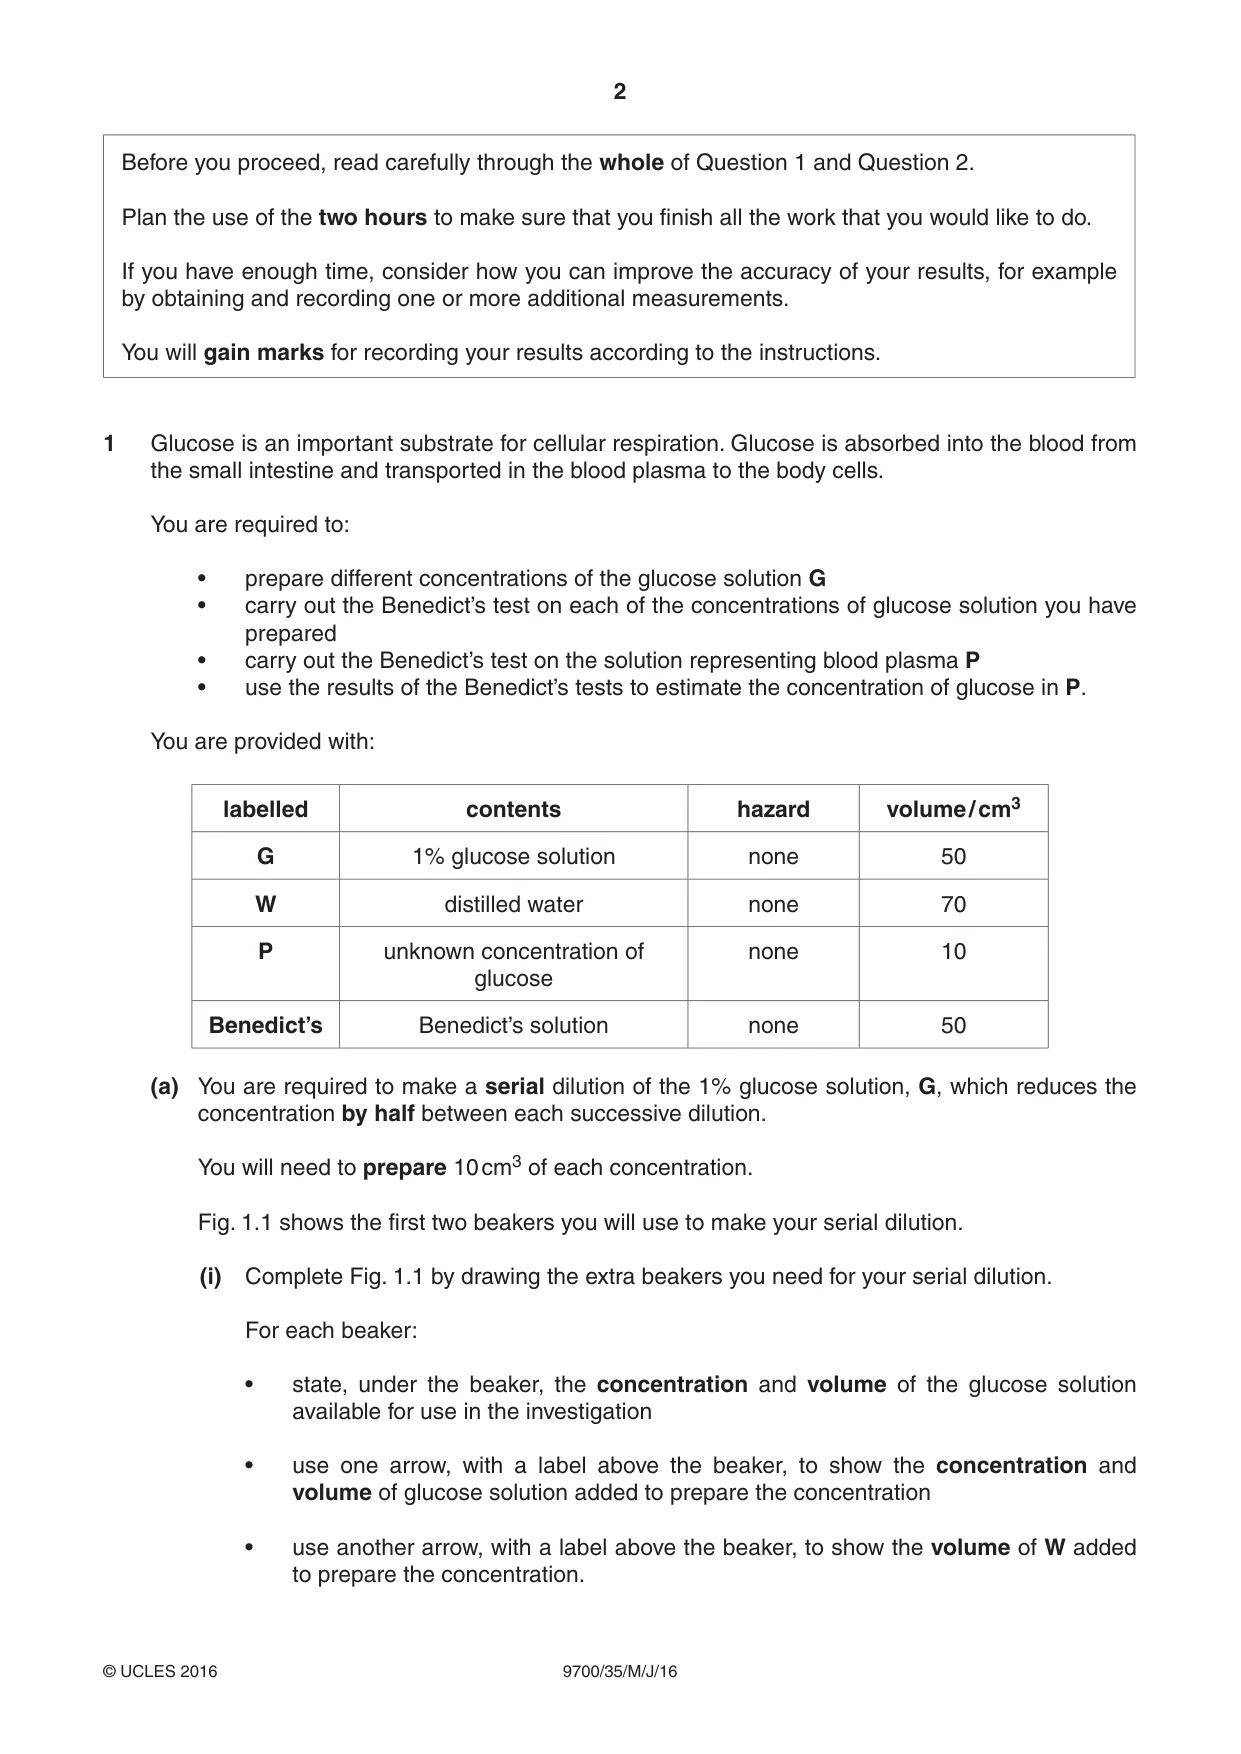
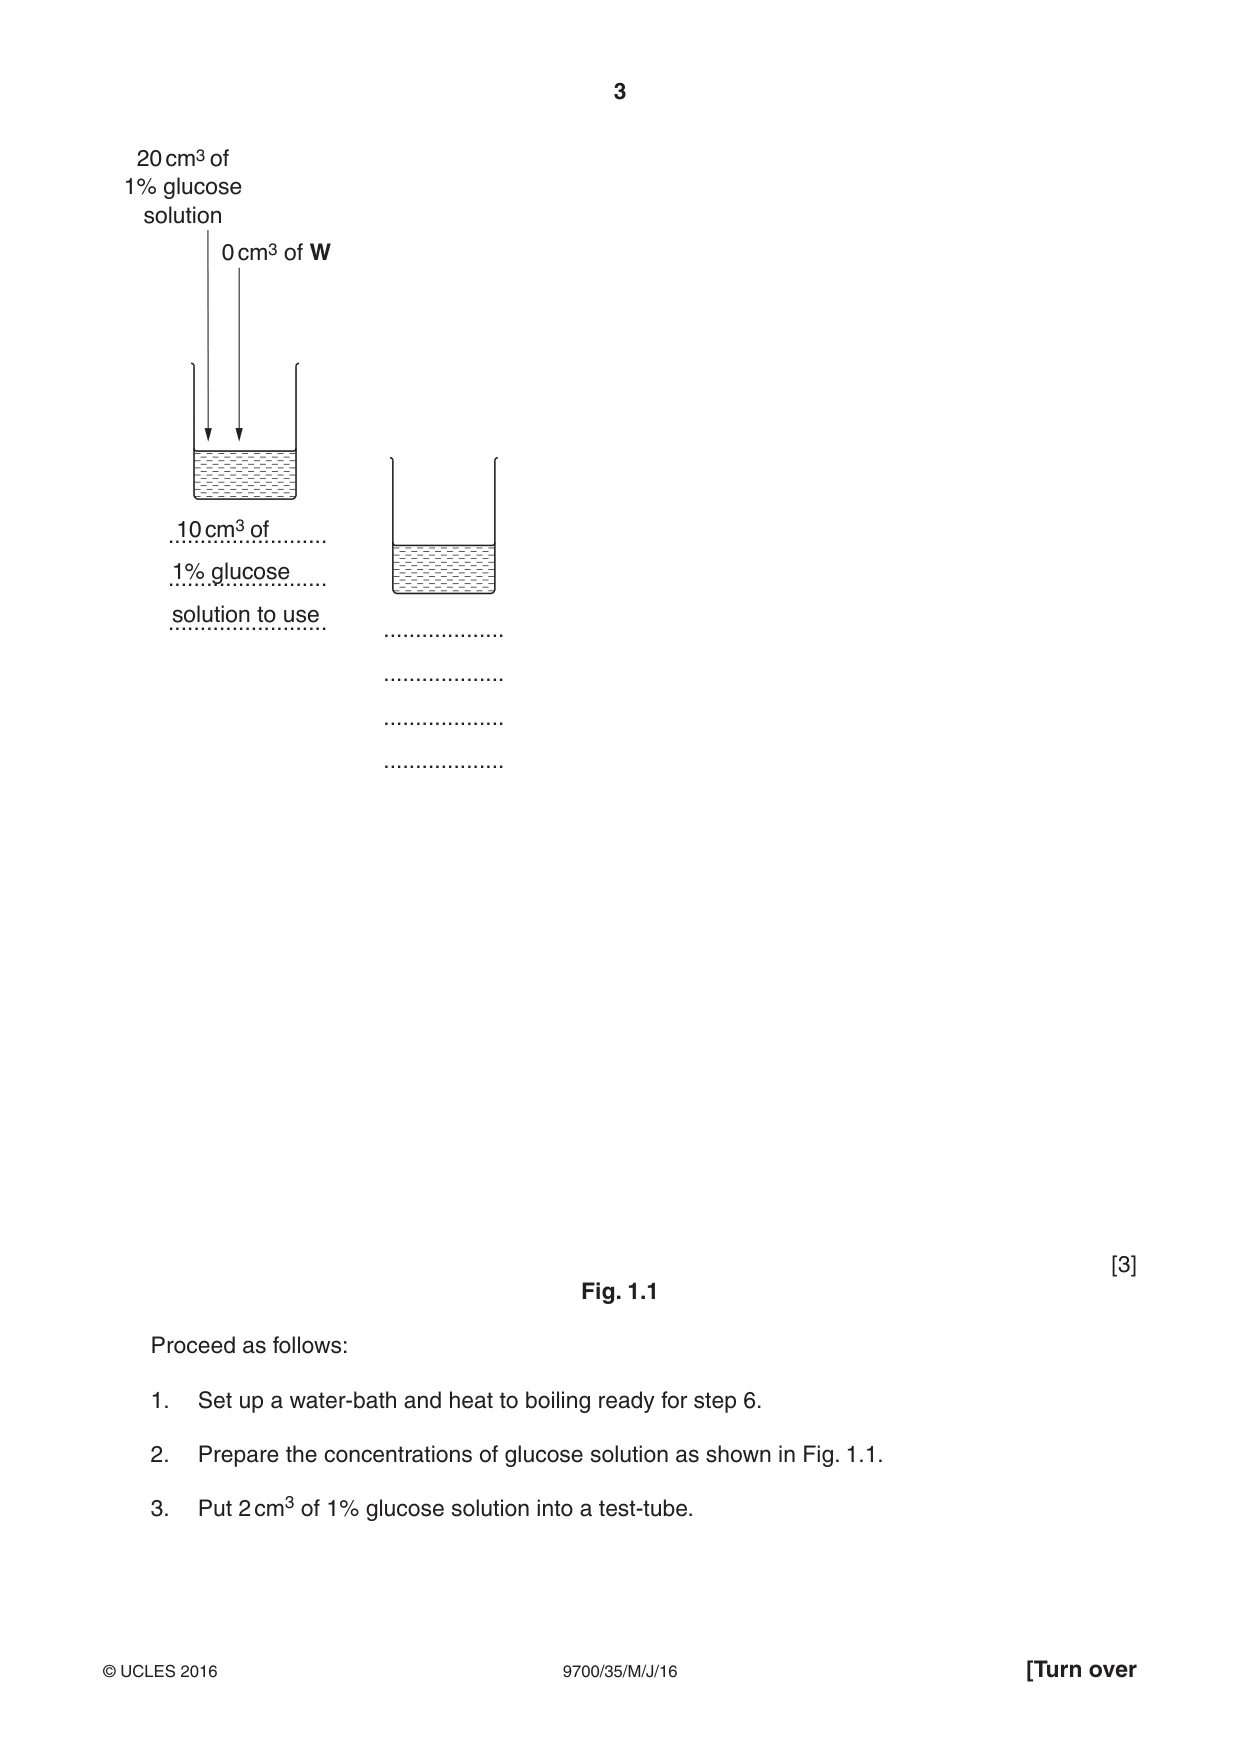
2 9700/35/M/J/16 © UCLES 2016 Before you proceed, read carefully through the whole of Question 1 and Question 2. Plan the use of the two hours to make sure that you finish all the work that you would like to do. If you have enough time, consider how you can improve the accuracy of your results, for example by obtaining and recording one or more additional measurements. You will gain marks for recording your results according to the instructions. 1 Glucose is an important substrate for cellular respiration. Glucose is absorbed into the blood from the small intestine and transported in the blood plasma to the body cells. You are required to: • prepare different concentrations of the glucose solution G • carry out the Benedict’s test on each of the concentrations of glucose solution you have prepared • carry out the Benedict’s test on the solution representing blood plasma P • use the results of the Benedict’s tests to estimate the concentration of glucose in P. You are provided with: labelled contents hazard volume / cm3 G 1% glucose solution none 50 W distilled water none 70 P unknown concentration of glucose none 10 Benedict’s Benedict’s solution none 50 (a) You are required to make a serial dilution of the 1% glucose solution, G, which reduces the concentration by half between each successive dilution. You will need to prepare 10 cm3 of each concentration. Fig. 1.1 shows the first two beakers you will use to make your serial dilution. (i) Complete Fig. 1.1 by drawing the extra beakers you need for your serial dilution. For each beaker: • state, under the beaker, the concentration and volume of the glucose solution available for use in the investigation • use one arrow, with a label above the beaker, to show the concentration and volume of glucose solution added to prepare the concentration • use another arrow, with a label above the beaker, to show the volume of W added to prepare the concentration.
Question paper, page 3
3 9700/35/M/J/16 © UCLES 2016 [Turn over … … … 10 cm3 of 20 cm3 of 1% glucose solution 0 cm3 of W 1% glucose solution to use … … … … [3] Fig. 1.1 Proceed as follows: 1. Set up a water-bath and heat to boiling ready for step 6. 2. Prepare the concentrations of glucose solution as shown in Fig. 1.1. 3. Put 2 cm3 of 1% glucose solution into a test-tube.
Question paper, page 4
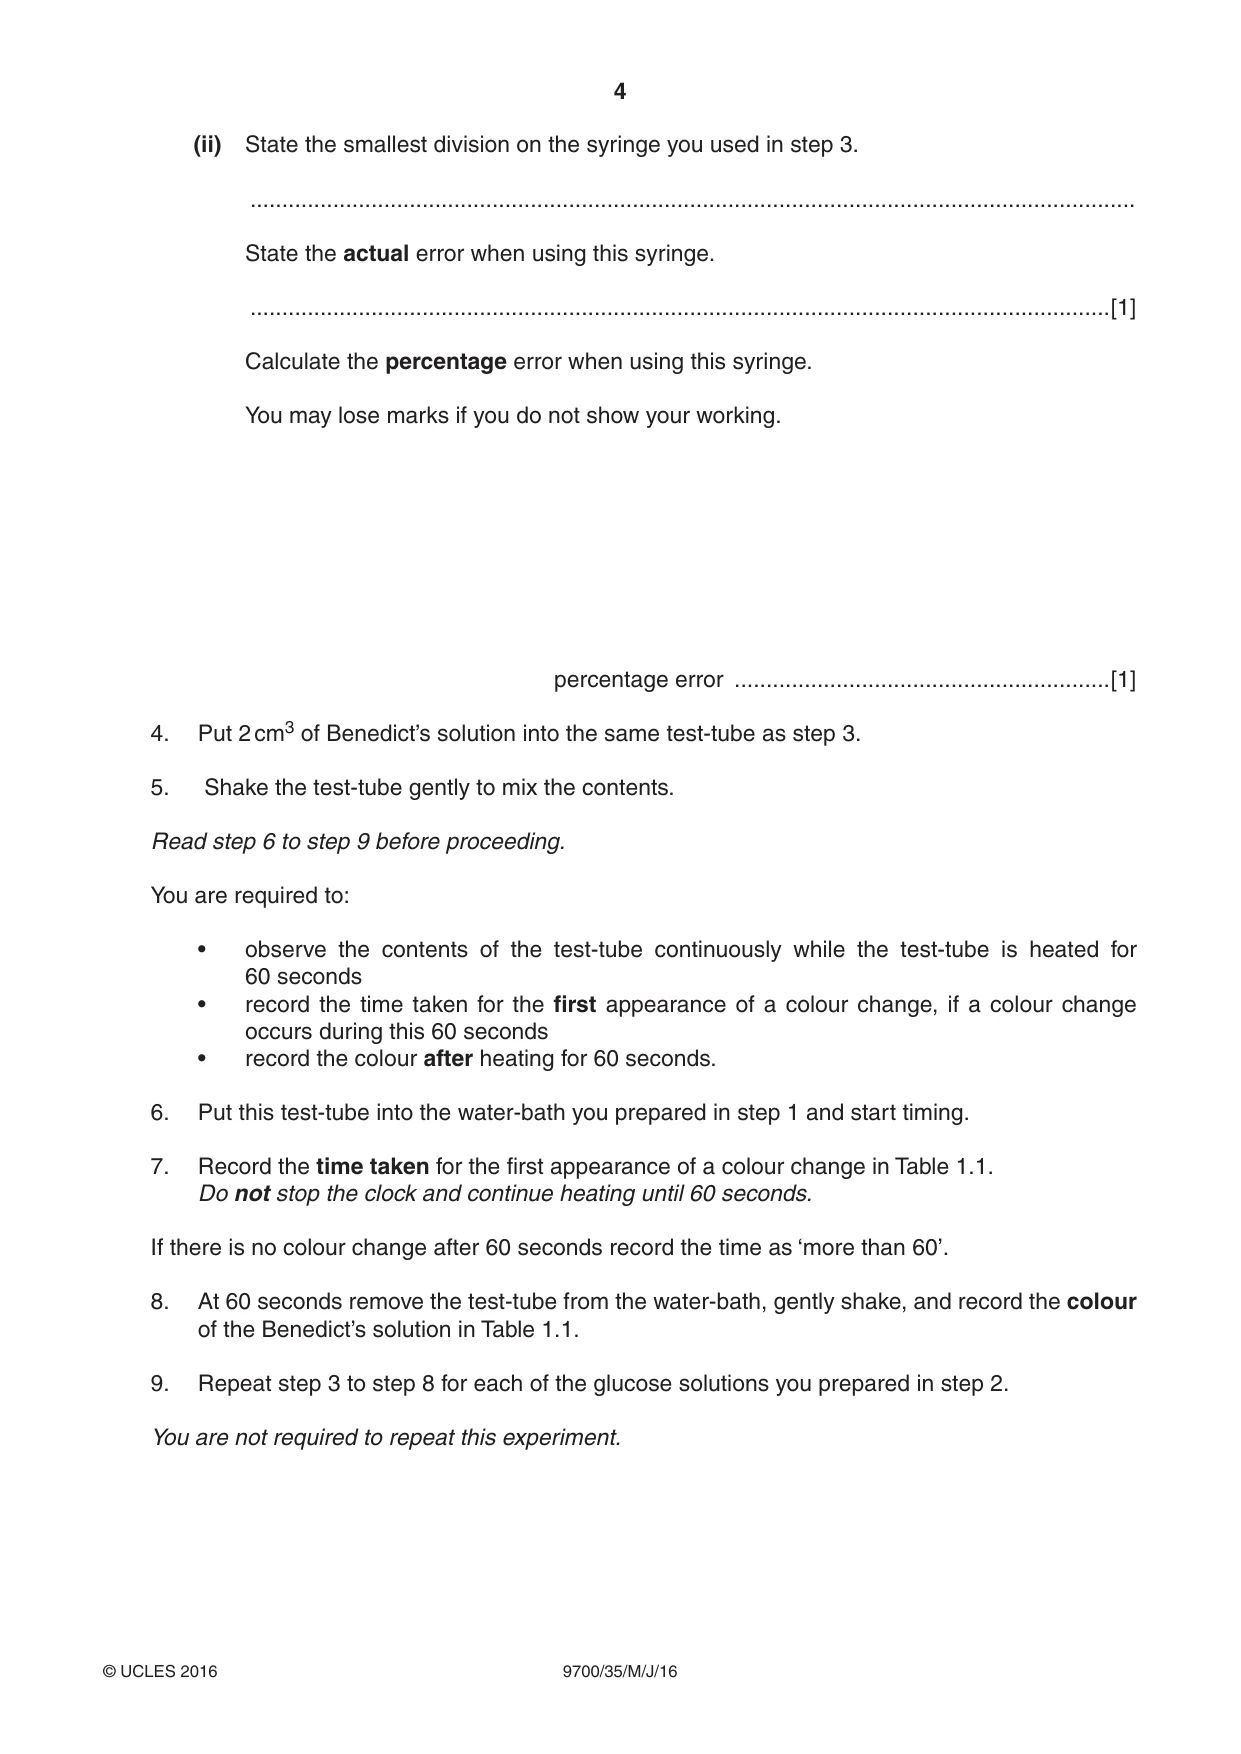
4 9700/35/M/J/16 © UCLES 2016 (ii) State the smallest division on the syringe you used in step 3. … State the actual error when using this syringe. …[1] Calculate the percentage error when using this syringe. You may lose marks if you do not show your working. percentage error …[1] 4. Put 2 cm3 of Benedict’s solution into the same test-tube as step 3. 5. Shake the test-tube gently to mix the contents. Read step 6 to step 9 before proceeding. You are required to: • observe the contents of the test-tube continuously while the test-tube is heated for 60 seconds • record the time taken for the first appearance of a colour change, if a colour change occurs during this 60 seconds • record the colour after heating for 60 seconds. 6. Put this test-tube into the water-bath you prepared in step 1 and start timing. 7. Record the time taken for the first appearance of a colour change in Table 1.1. Do not stop the clock and continue heating until 60 seconds. If there is no colour change after 60 seconds record the time as ‘more than 60’. 8. At 60 seconds remove the test-tube from the water-bath, gently shake, and record the colour of the Benedict’s solution in Table 1.1. 9. Repeat step 3 to step 8 for each of the glucose solutions you prepared in step 2. You are not required to repeat this experiment.
Question paper, page 5
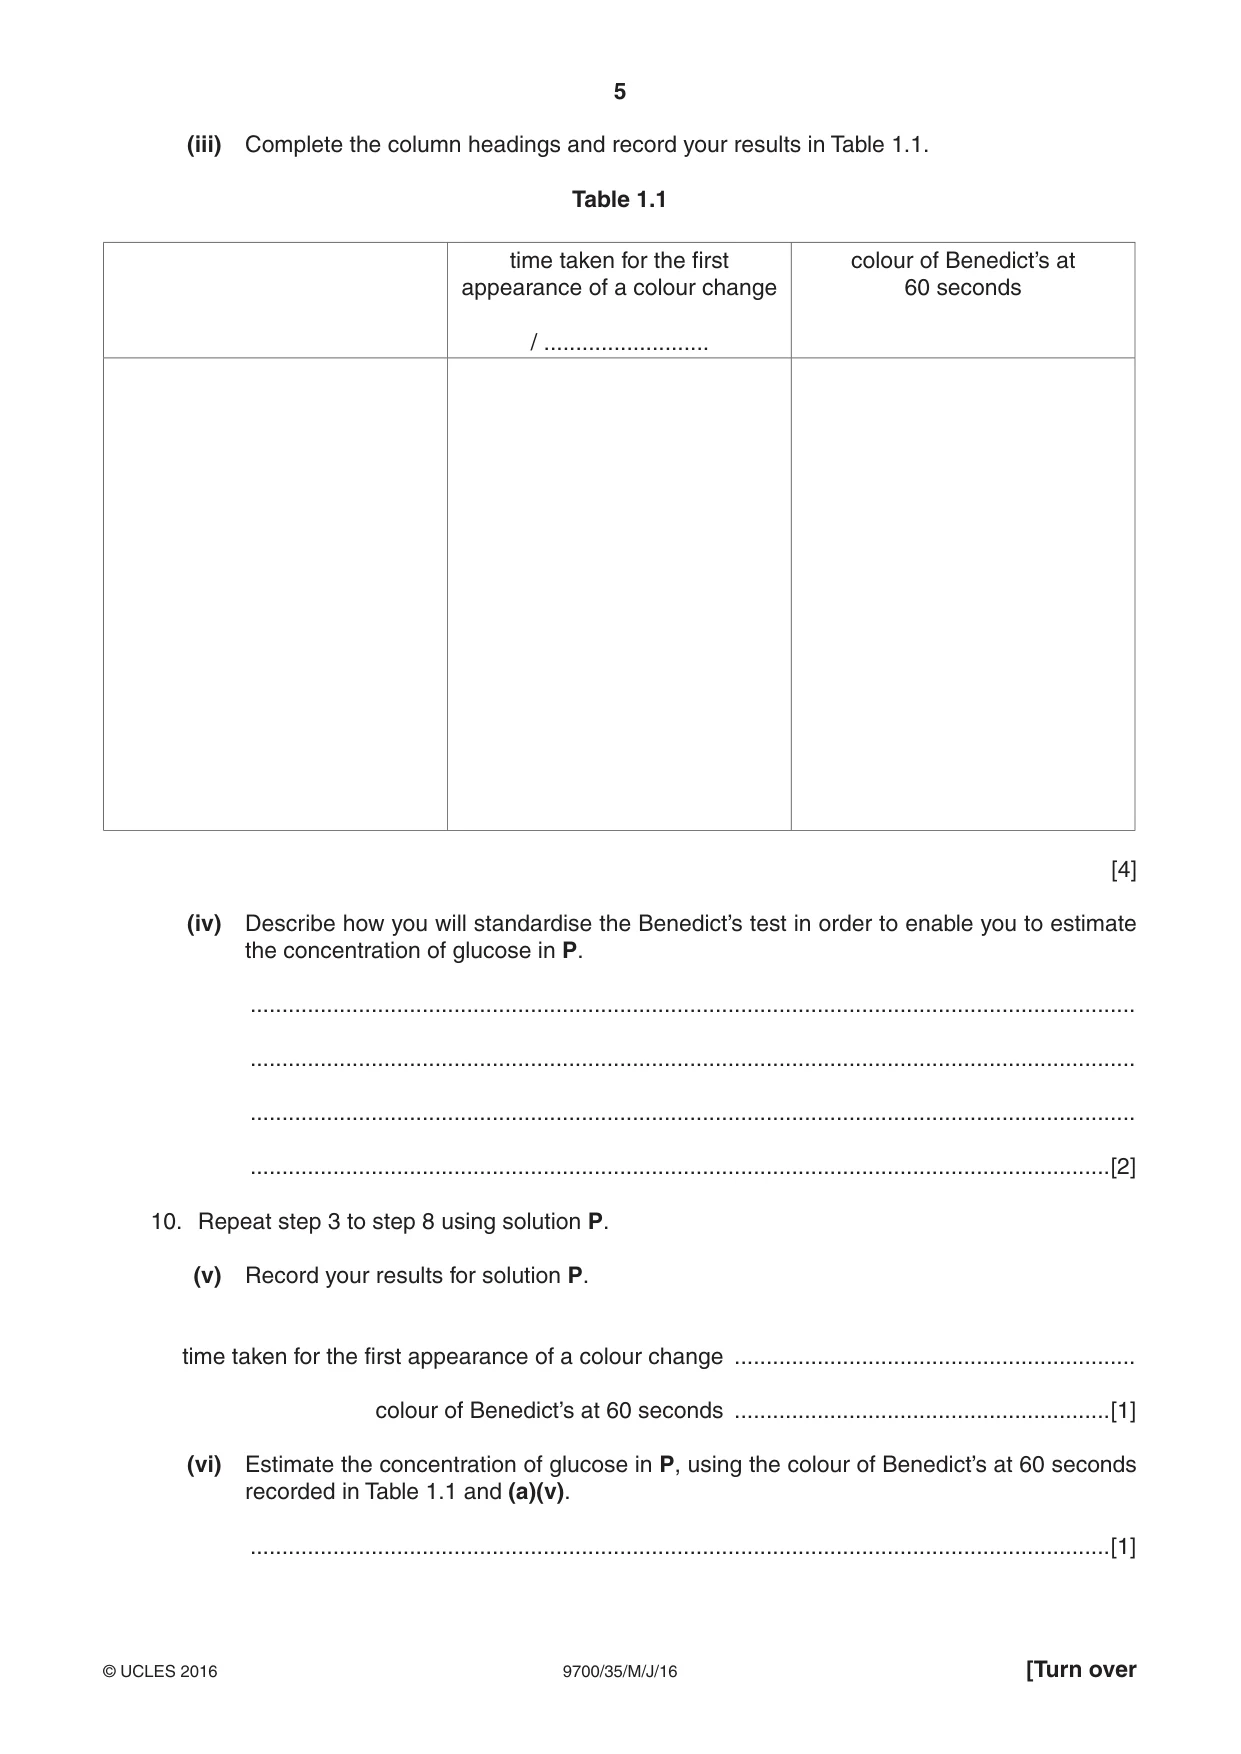
5 9700/35/M/J/16 © UCLES 2016 [Turn over (iii) Complete the column headings and record your results in Table 1.1. Table 1.1 time taken for the first appearance of a colour change / … colour of Benedict’s at 60 seconds [4] (iv) Describe how you will standardise the Benedict’s test in order to enable you to estimate the concentration of glucose in P. … … … …[2] 10. Repeat step 3 to step 8 using solution P. (v) Record your results for solution P. time taken for the first appearance of a colour change … colour of Benedict’s at 60 seconds …[1] (vi) Estimate the concentration of glucose in P, using the colour of Benedict’s at 60 seconds recorded in Table 1.1 and (a)(v). …[1]
Question paper, page 6
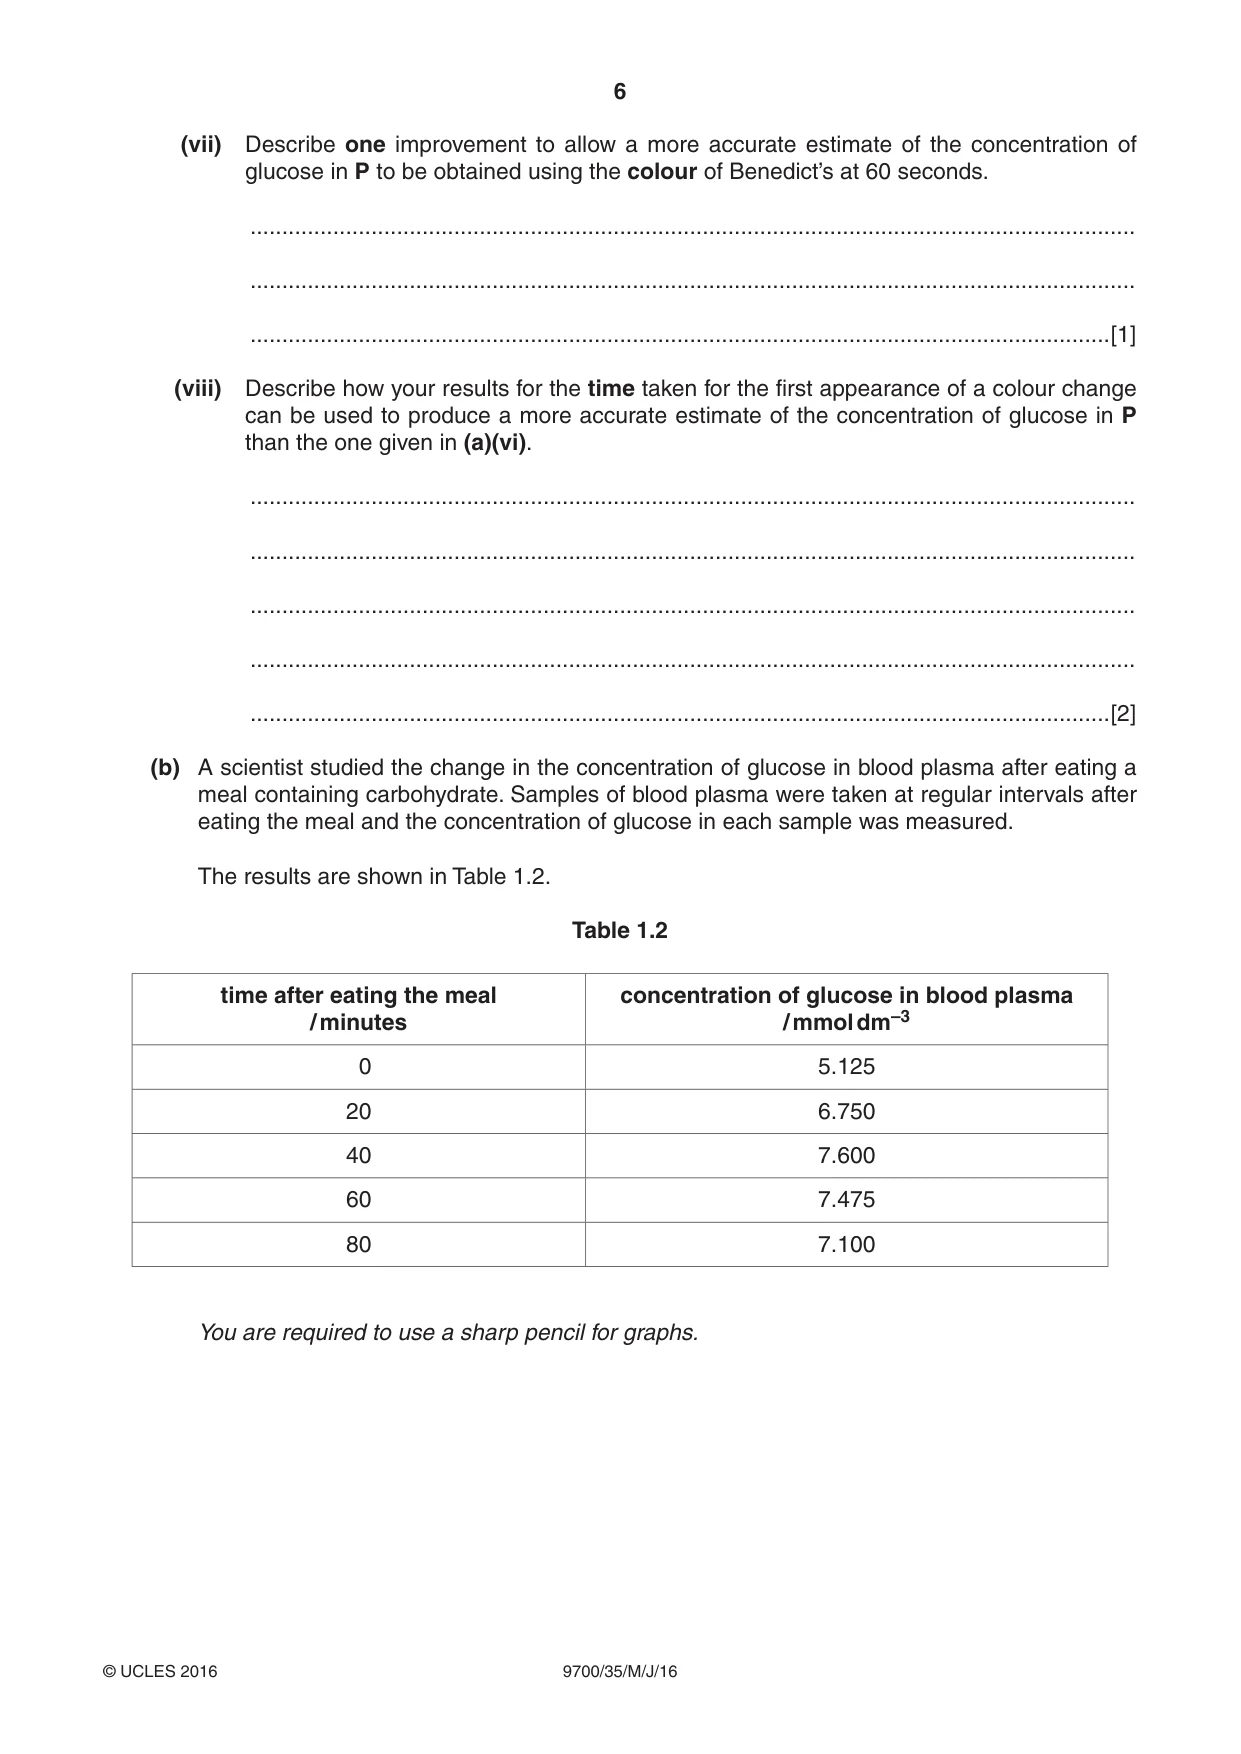
6 9700/35/M/J/16 © UCLES 2016 (vii) Describe one improvement to allow a more accurate estimate of the concentration of glucose in P to be obtained using the colour of Benedict’s at 60 seconds. … … …[1] (viii) Describe how your results for the time taken for the first appearance of a colour change can be used to produce a more accurate estimate of the concentration of glucose in P than the one given in (a)(vi). … … … … …[2] (b) A scientist studied the change in the concentration of glucose in blood plasma after eating a meal containing carbohydrate. Samples of blood plasma were taken at regular intervals after eating the meal and the concentration of glucose in each sample was measured. The results are shown in Table 1.2. Table 1.2 time after eating the meal / minutes concentration of glucose in blood plasma / mmol dm–3 0 5.125 20 6.750 40 7.600 60 7.475 80 7.100 You are required to use a sharp pencil for graphs.
Question paper, page 7
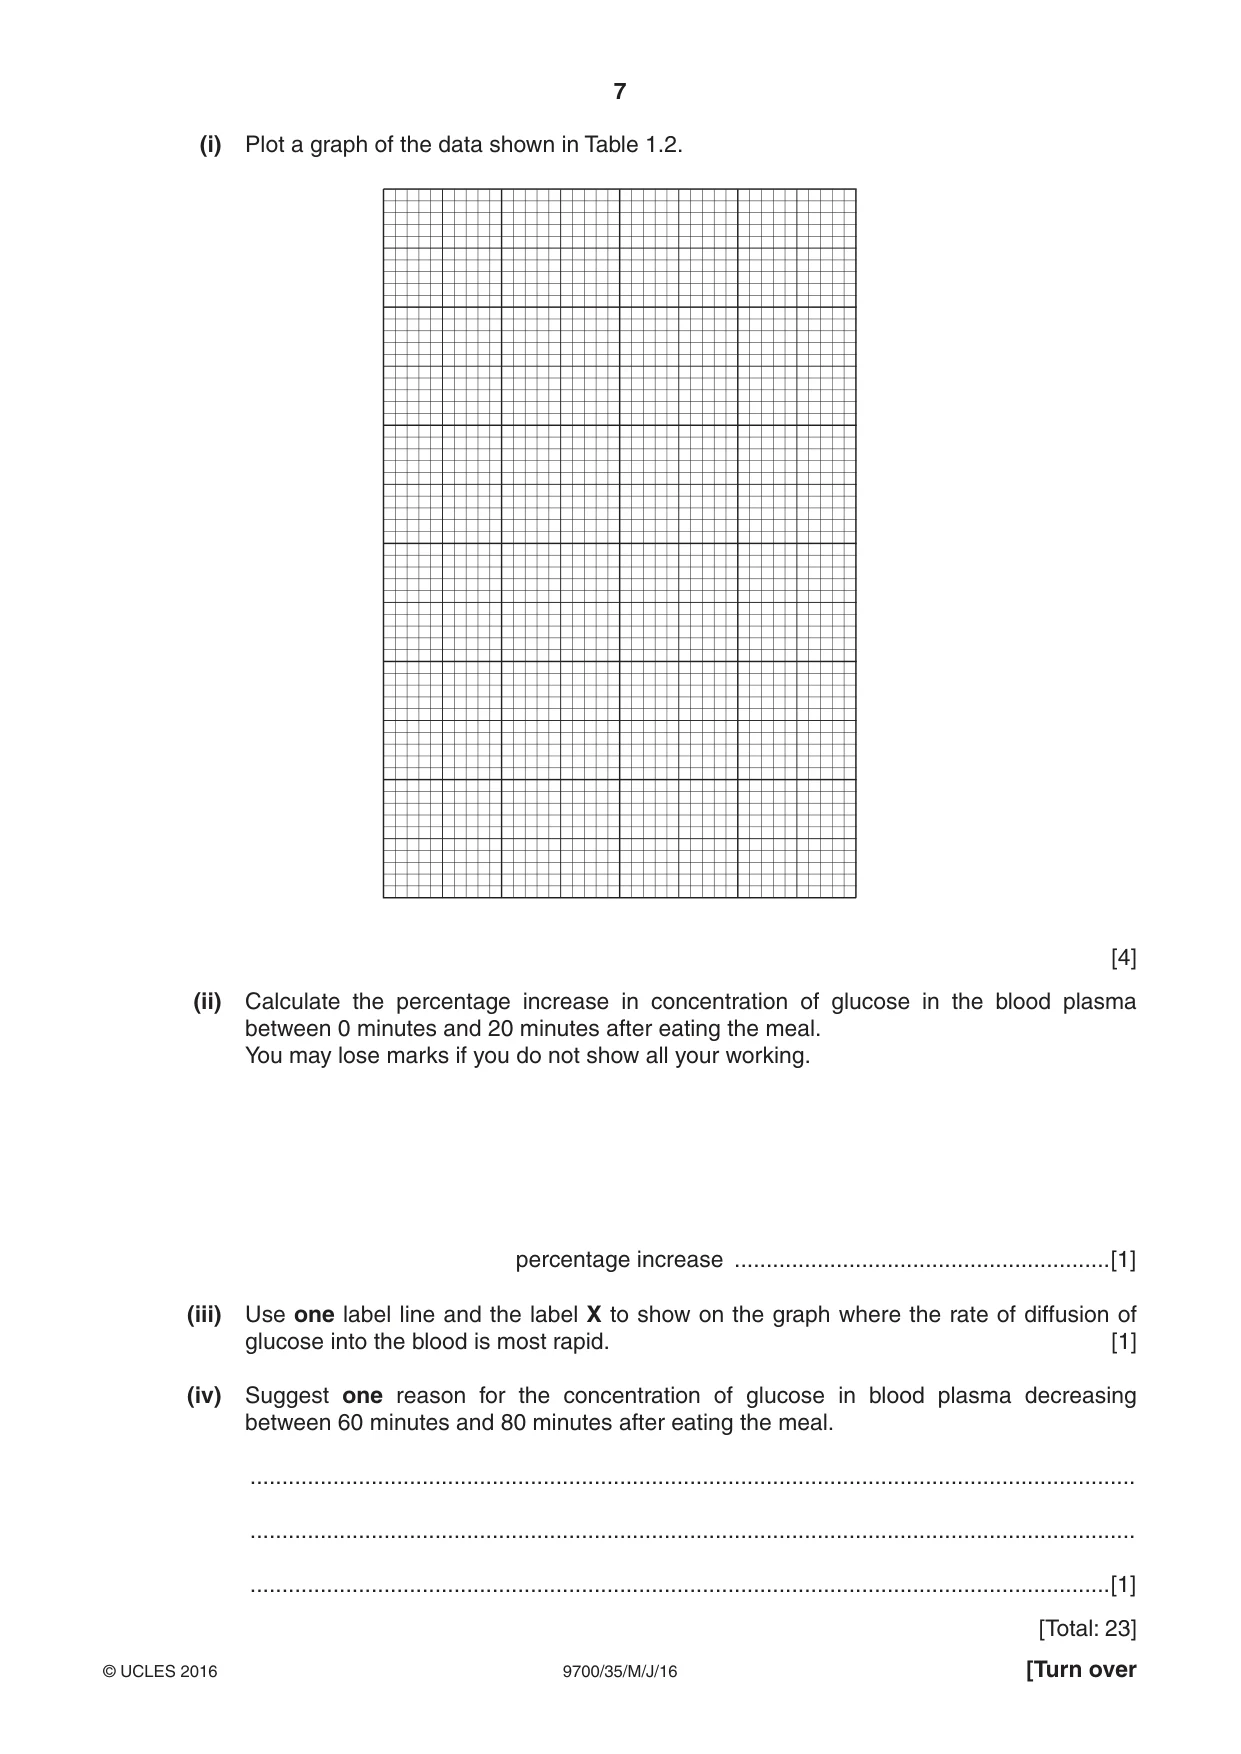
7 9700/35/M/J/16 © UCLES 2016 [Turn over (i) Plot a graph of the data shown in Table 1.2. [4] (ii) Calculate the percentage increase in concentration of glucose in the blood plasma between 0 minutes and 20 minutes after eating the meal. You may lose marks if you do not show all your working. percentage increase …[1] (iii) Use one label line and the label X to show on the graph where the rate of diffusion of glucose into the blood is most rapid. [1] (iv) Suggest one reason for the concentration of glucose in blood plasma decreasing between 60 minutes and 80 minutes after eating the meal. … … …[1] [Total: 23]
Question paper, page 8
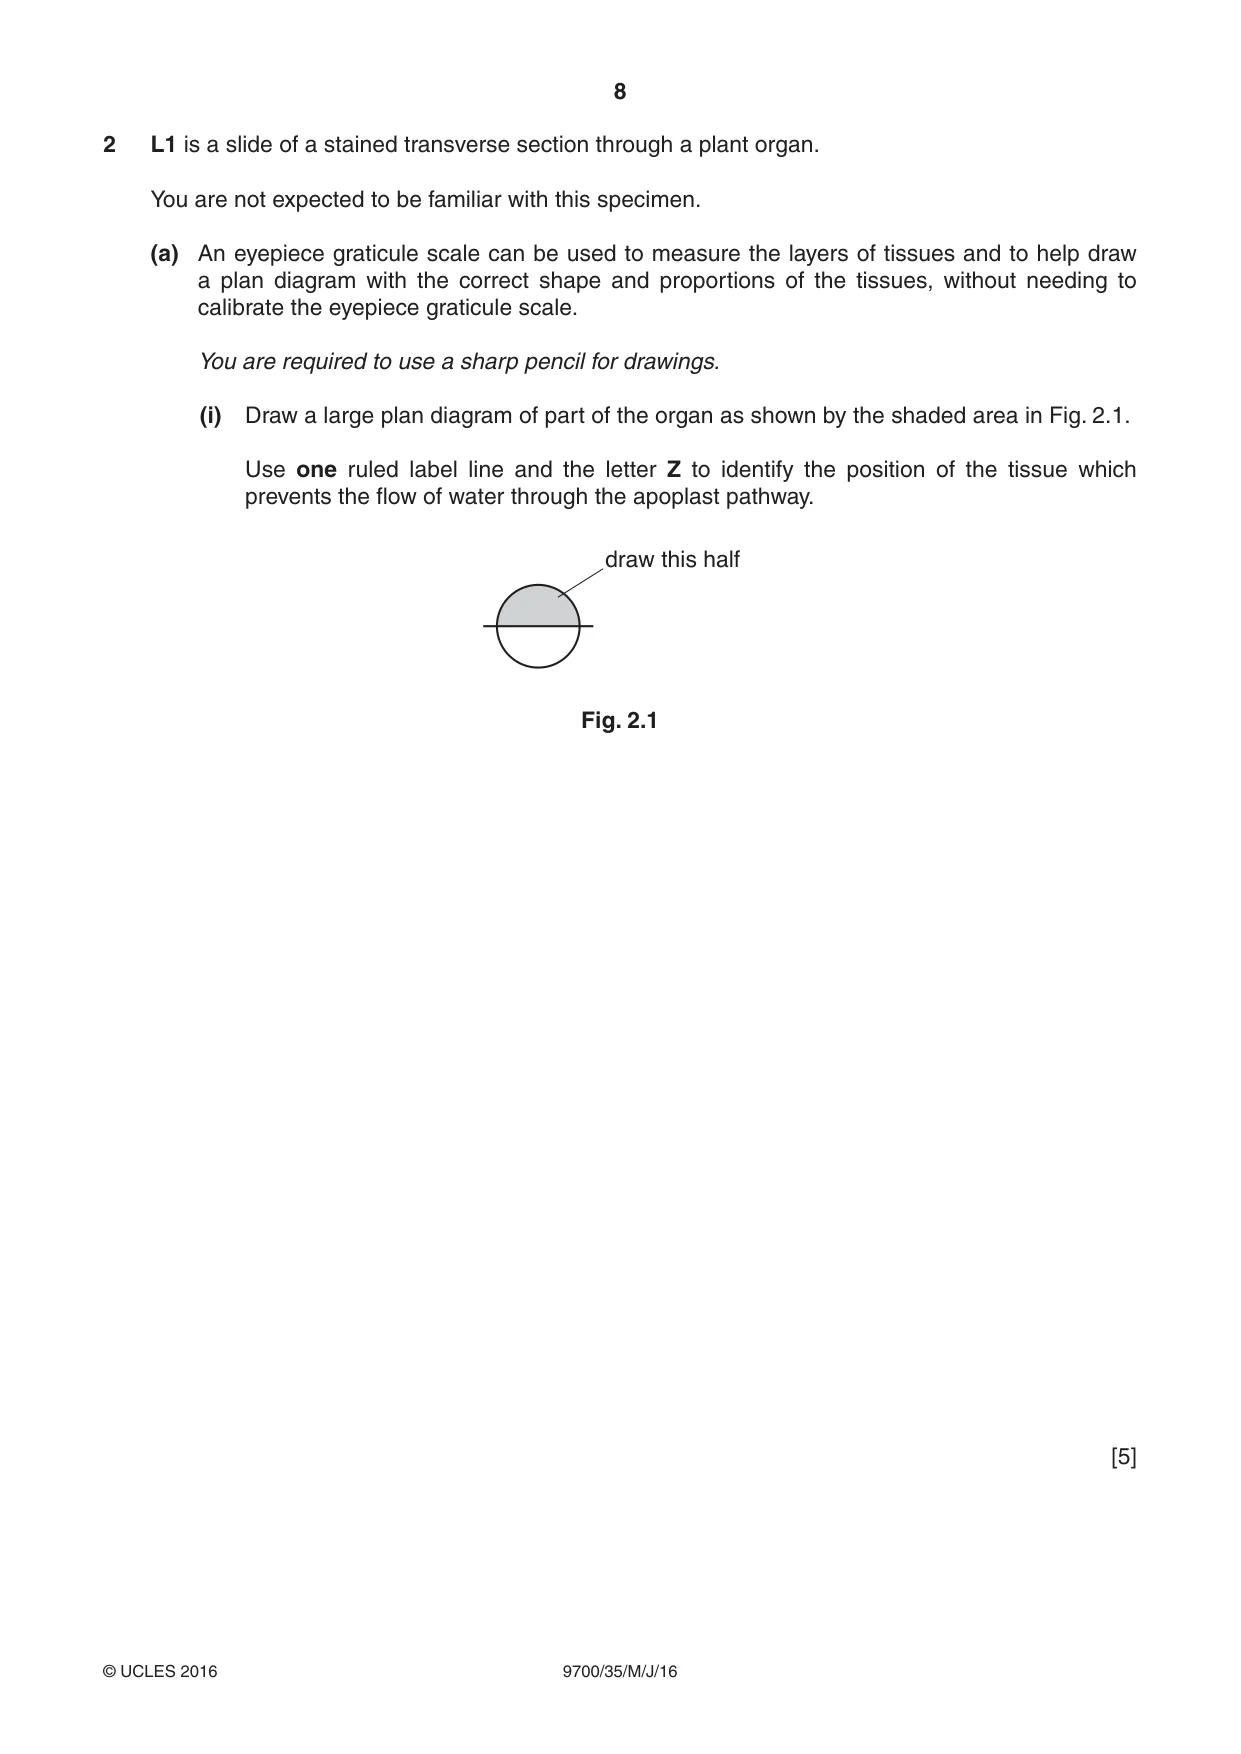
8 9700/35/M/J/16 © UCLES 2016 2 L1 is a slide of a stained transverse section through a plant organ. You are not expected to be familiar with this specimen. (a) An eyepiece graticule scale can be used to measure the layers of tissues and to help draw a plan diagram with the correct shape and proportions of the tissues, without needing to calibrate the eyepiece graticule scale. You are required to use a sharp pencil for drawings. (i) Draw a large plan diagram of part of the organ as shown by the shaded area in Fig. 2.1. Use one ruled label line and the letter Z to identify the position of the tissue which prevents the flow of water through the apoplast pathway. draw this half Fig. 2.1 [5]
Question paper, page 9
9 9700/35/M/J/16 © UCLES 2016 [Turn over (ii) Identify the organ on L1. Describe one observable feature that supports your identification. name of organ … feature …[1] (iii) Observe the organ on L1 in the region between the epidermis and the vascular tissue (the cortex). Select one group of four adjacent (touching) cells from the cortex. Each cell of this group must touch at least two of the other cells. Make a large drawing of this group of four cells. Use one ruled label line and label to identify the cytoplasm in one of the cells. [5]
Question paper, page 10
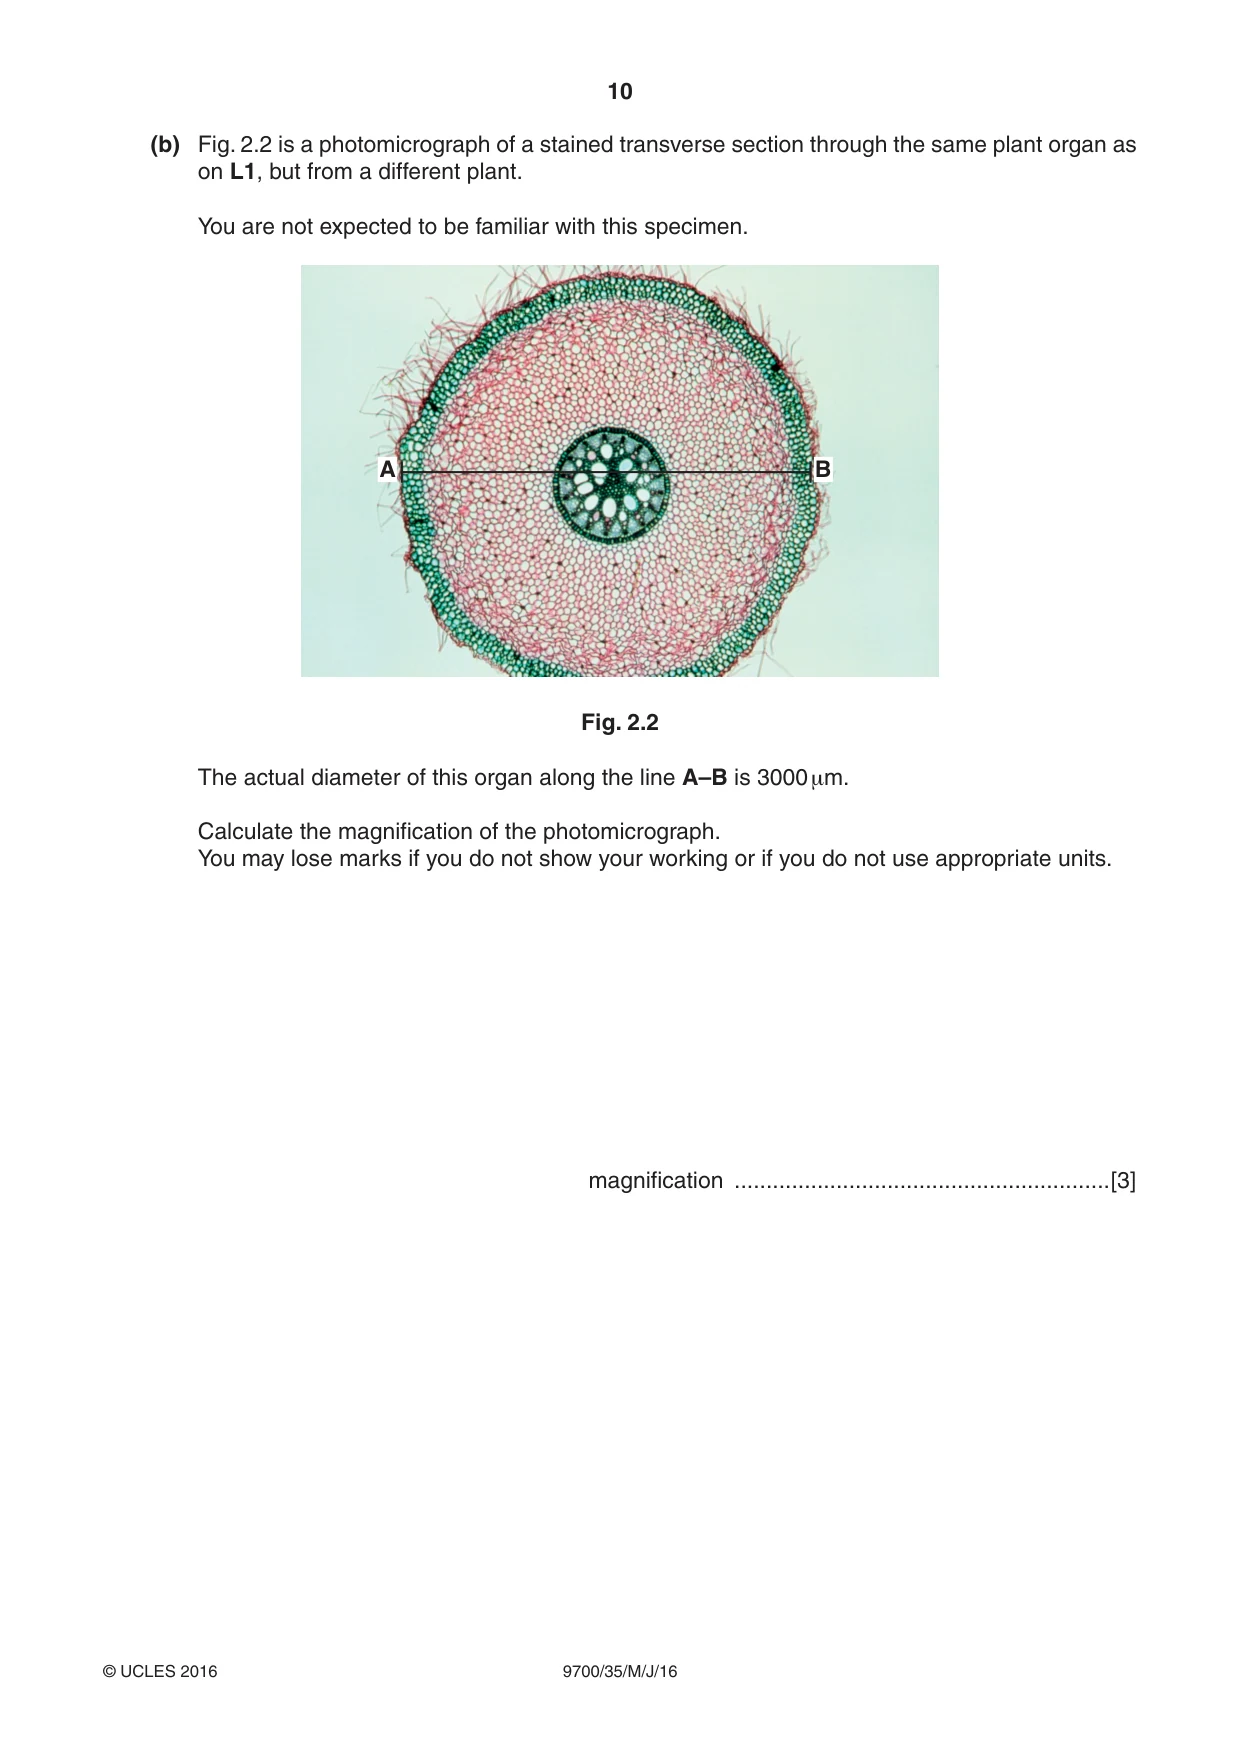
10 9700/35/M/J/16 © UCLES 2016 (b) Fig. 2.2 is a photomicrograph of a stained transverse section through the same plant organ as on L1, but from a different plant. You are not expected to be familiar with this specimen. A B Fig. 2.2 The actual diameter of this organ along the line A–B is 3000 μm. Calculate the magnification of the photomicrograph. You may lose marks if you do not show your working or if you do not use appropriate units. magnification …[3]
Question paper, page 11
11 9700/35/M/J/16 © UCLES 2016 (c) Prepare the space below so that it is suitable for you to record the observable similarities between the plant organ on L1 and that shown in Fig. 2.2. Record your observations in the space you have prepared. [3] [Total: 17]
Question paper, page 12
12 9700/35/M/J/16 © UCLES 2016 BLANK PAGE Permission to reproduce items where third-party owned material protected by copyright is included has been sought and cleared where possible. Every reasonable effort has been made by the publisher (UCLES) to trace copyright holders, but if any items requiring clearance have unwittingly been included, the publisher will be pleased to make amends at the earliest possible opportunity. To avoid the issue of disclosure of answer-related information to candidates, all copyright acknowledgements are reproduced online in the Cambridge International Examinations Copyright Acknowledgements Booklet. This is produced for each series of examinations and is freely available to download at www.cie.org.uk after the live examination series. Cambridge International Examinations is part of the Cambridge Assessment Group. Cambridge Assessment is the brand name of University of Cambridge Local Examinations Syndicate (UCLES), which is itself a department of the University of Cambridge.
Mark scheme, page 1
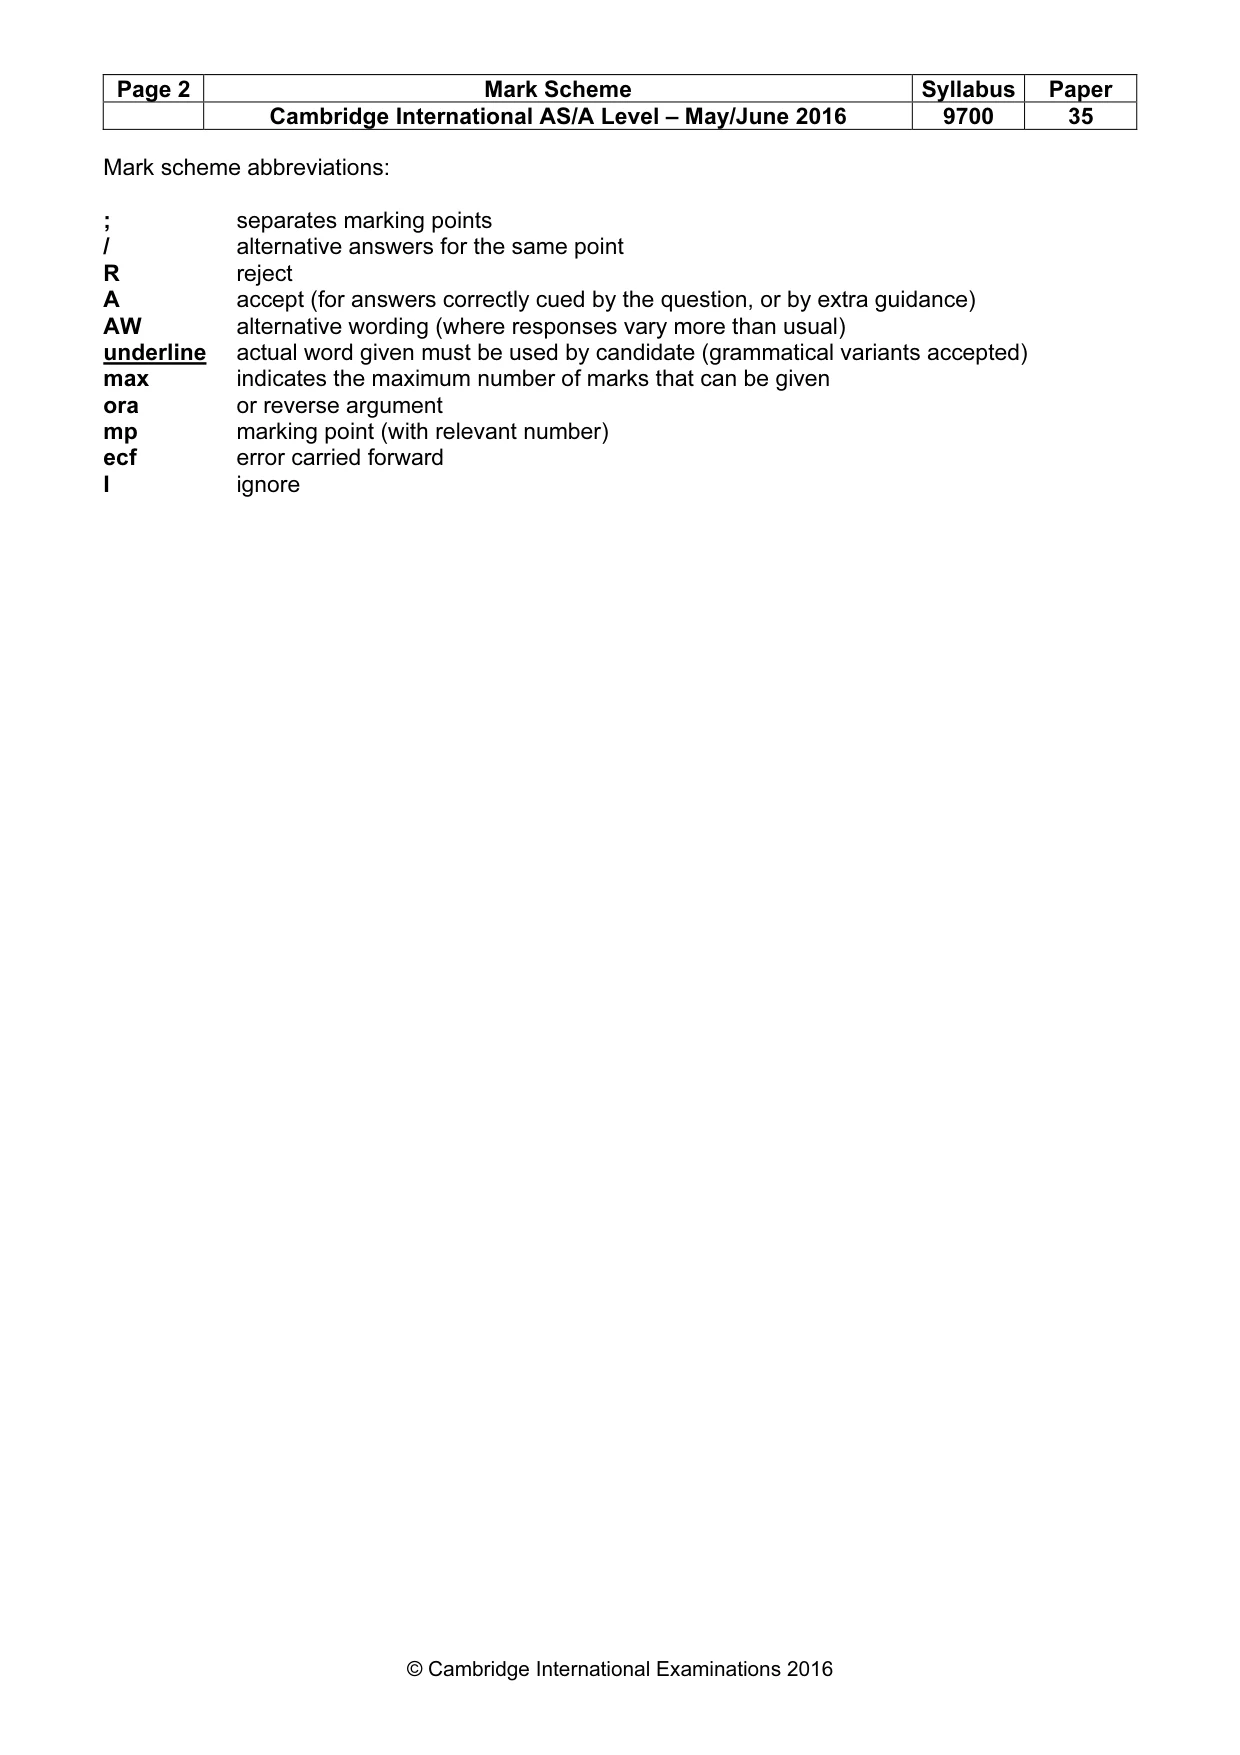
® IGCSE is the registered trademark of Cambridge International Examinations. This document consists of 4 printed pages. © UCLES 2016 [Turn over Cambridge International Examinations Cambridge International Advanced Subsidiary and Advanced Level BIOLOGY 9700/35 Paper 3 (Advanced Practical Skills 1) May/June 2016 MARK SCHEME Maximum Mark: 40 Published This mark scheme is published as an aid to teachers and candidates, to indicate the requirements of the examination. It shows the basis on which Examiners were instructed to award marks. It does not indicate the details of the discussions that took place at an Examiners’ meeting before marking began, which would have considered the acceptability of alternative answers. Mark schemes should be read in conjunction with the question paper and the Principal Examiner Report for Teachers. Cambridge will not enter into discussions about these mark schemes. Cambridge is publishing the mark schemes for the May/June 2016 series for most Cambridge IGCSE®, Cambridge International A and AS Level components and some Cambridge O Level components.
Mark scheme, page 2
Page 2 Mark Scheme Syllabus Paper Cambridge International AS/A Level – May/June 2016 9700 35 © Cambridge International Examinations 2016 Mark scheme abbreviations: ; separates marking points / alternative answers for the same point R reject A accept (for answers correctly cued by the question, or by extra guidance) AW alternative wording (where responses vary more than usual) underline actual word given must be used by candidate (grammatical variants accepted) max indicates the maximum number of marks that can be given ora or reverse argument mp marking point (with relevant number) ecf error carried forward I ignore
Mark scheme, page 3
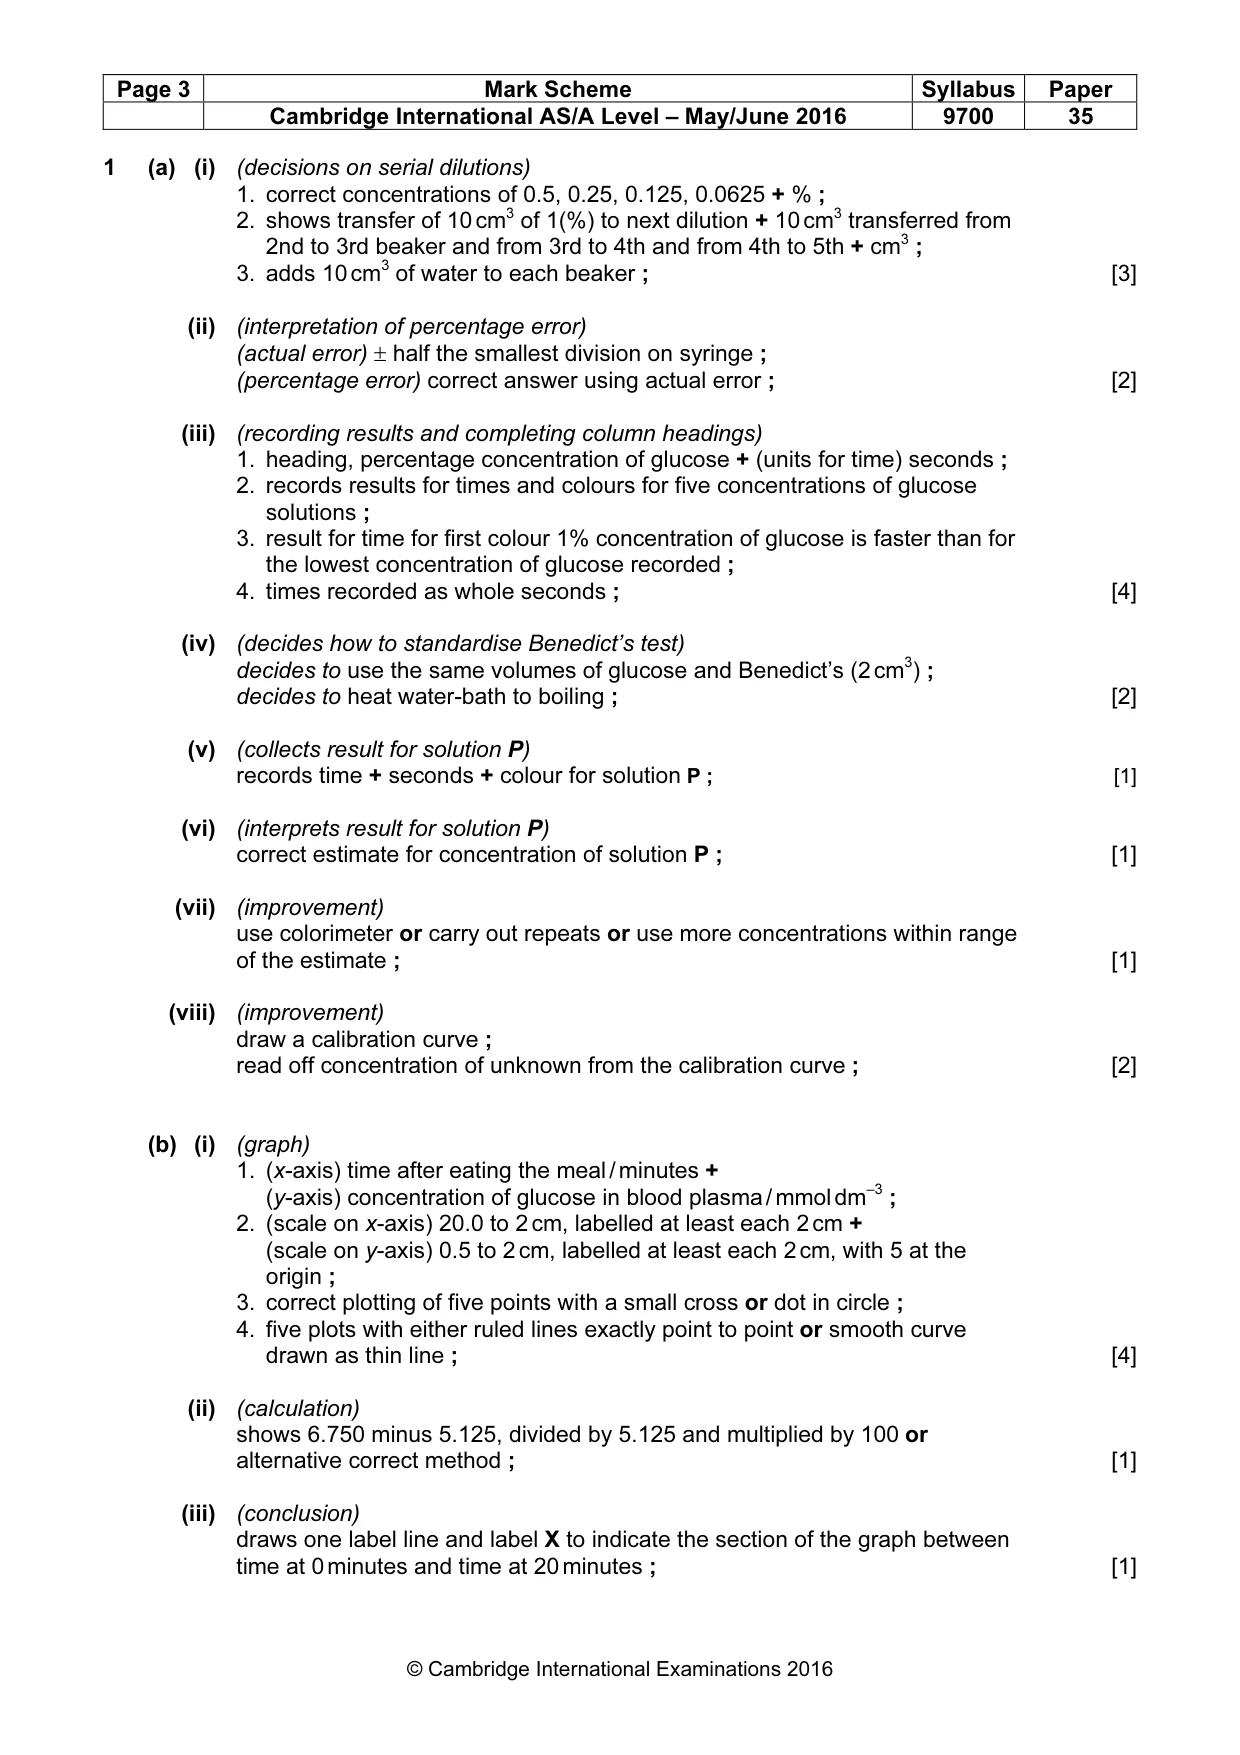
Page 3 Mark Scheme Syllabus Paper Cambridge International AS/A Level – May/June 2016 9700 35 © Cambridge International Examinations 2016 1 (a) (i) (decisions on serial dilutions) 1. correct concentrations of 0.5, 0.25, 0.125, 0.0625 + % ; 2. shows transfer of 10 cm3 of 1(%) to next dilution + 10 cm3 transferred from 2nd to 3rd beaker and from 3rd to 4th and from 4th to 5th + cm3 ; 3. adds 10 cm3 of water to each beaker ; [3] (ii) (interpretation of percentage error) (actual error) ± half the smallest division on syringe ; (percentage error) correct answer using actual error ; [2] (iii) (recording results and completing column headings) 1. heading, percentage concentration of glucose + (units for time) seconds ; 2. records results for times and colours for five concentrations of glucose solutions ; 3. result for time for first colour 1% concentration of glucose is faster than for the lowest concentration of glucose recorded ; 4. times recorded as whole seconds ; [4] (iv) (decides how to standardise Benedict’s test) decides to use the same volumes of glucose and Benedict’s (2 cm3) ; decides to heat water-bath to boiling ; [2] (v) (collects result for solution P) records time + seconds + colour for solution P ; [1] (vi) (interprets result for solution P) correct estimate for concentration of solution P ; [1] (vii) (improvement) use colorimeter or carry out repeats or use more concentrations within range of the estimate ; [1] (viii) (improvement) draw a calibration curve ; read off concentration of unknown from the calibration curve ; [2] (b) (i) (graph) 1. (x-axis) time after eating the meal / minutes + (y-axis) concentration of glucose in blood plasma / mmol dm–3 ; 2. (scale on x-axis) 20.0 to 2 cm, labelled at least each 2 cm + (scale on y-axis) 0.5 to 2 cm, labelled at least each 2 cm, with 5 at the origin ; 3. correct plotting of five points with a small cross or dot in circle ; 4. five plots with either ruled lines exactly point to point or smooth curve drawn as thin line ; [4] (ii) (calculation) shows 6.750 minus 5.125, divided by 5.125 and multiplied by 100 or alternative correct method ; [1] (iii) (conclusion) draws one label line and label X to indicate the section of the graph between time at 0 minutes and time at 20 minutes ; [1]
Mark scheme, page 4
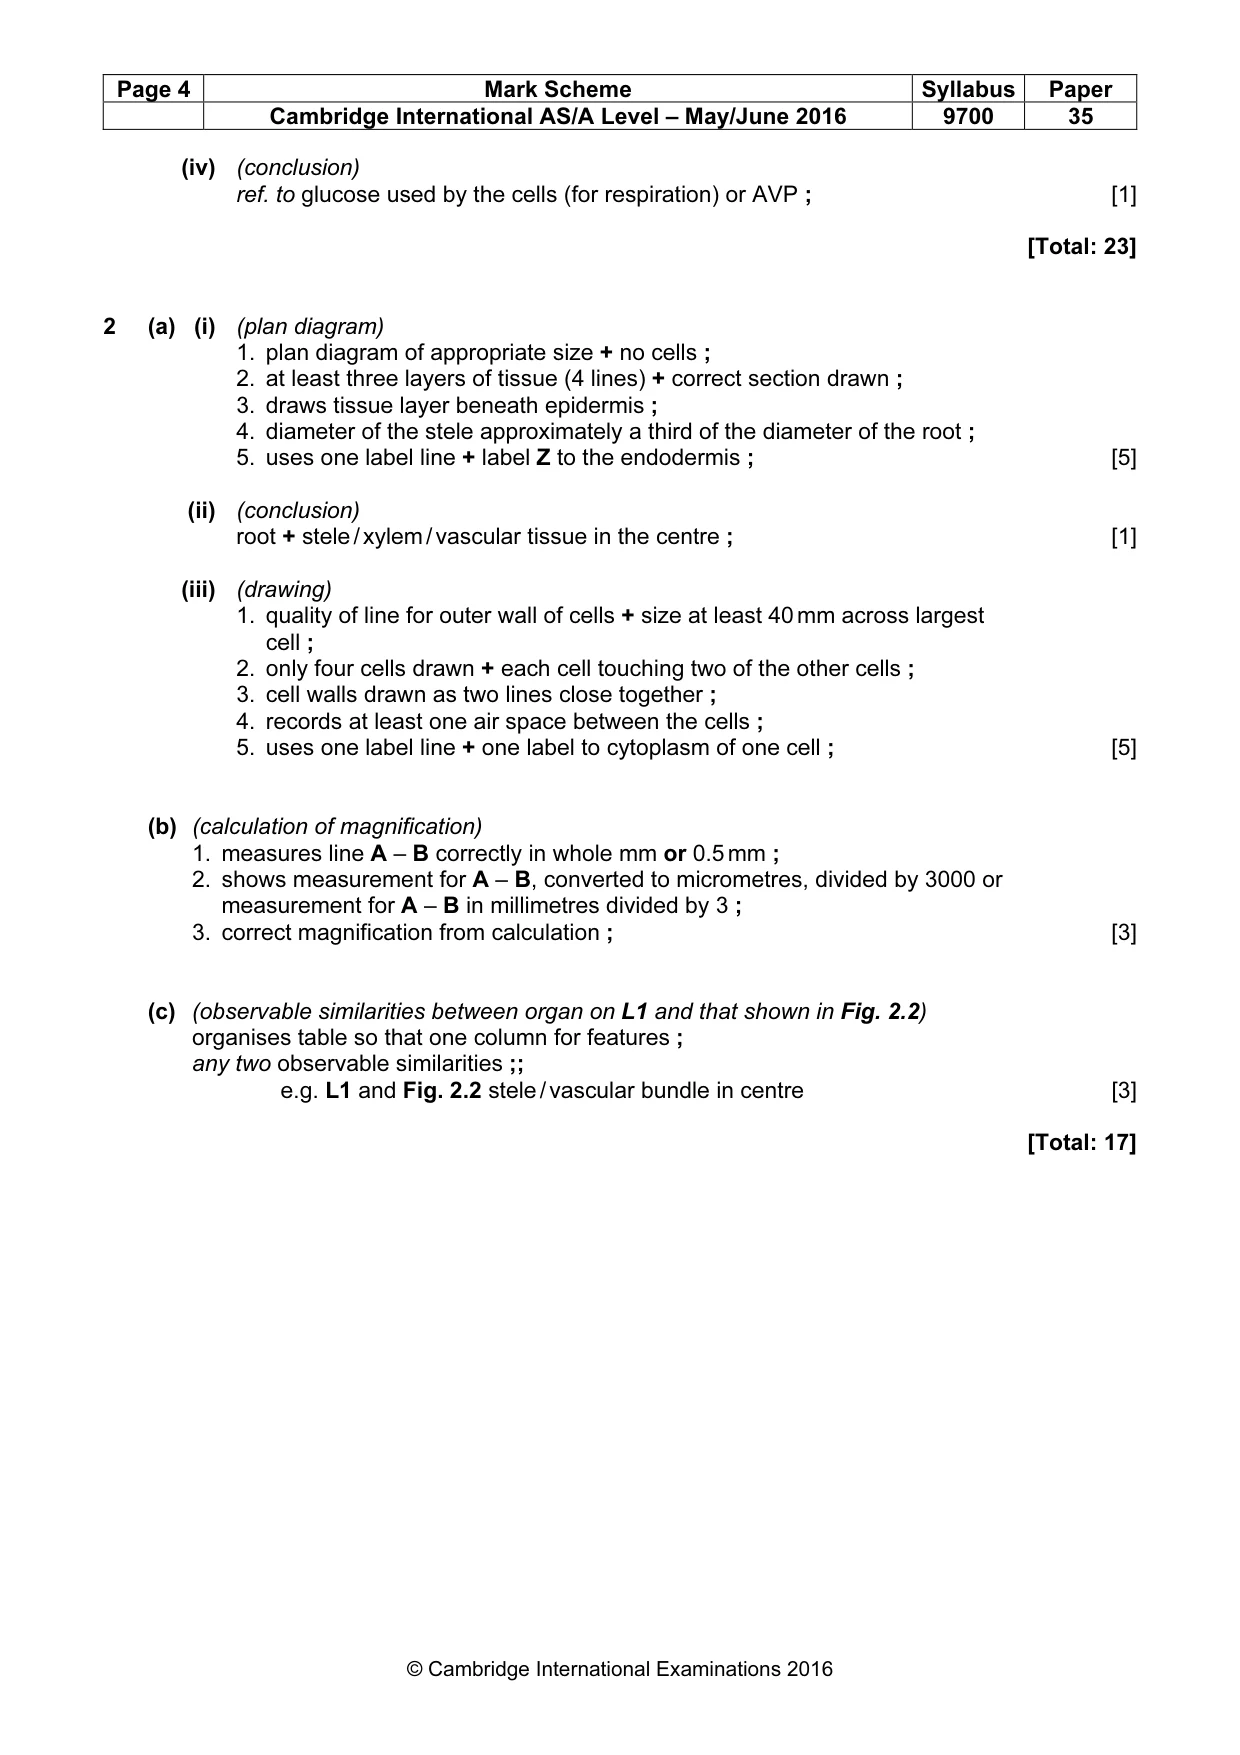
Page 4 Mark Scheme Syllabus Paper Cambridge International AS/A Level – May/June 2016 9700 35 © Cambridge International Examinations 2016 (iv) (conclusion) ref. to glucose used by the cells (for respiration) or AVP ; [1] [Total: 23] 2 (a) (i) (plan diagram) 1. plan diagram of appropriate size + no cells ; 2. at least three layers of tissue (4 lines) + correct section drawn ; 3. draws tissue layer beneath epidermis ; 4. diameter of the stele approximately a third of the diameter of the root ; 5. uses one label line + label Z to the endodermis ; [5] (ii) (conclusion) root + stele / xylem / vascular tissue in the centre ; [1] (iii) (drawing) 1. quality of line for outer wall of cells + size at least 40 mm across largest cell ; 2. only four cells drawn + each cell touching two of the other cells ; 3. cell walls drawn as two lines close together ; 4. records at least one air space between the cells ; 5. uses one label line + one label to cytoplasm of one cell ; [5] (b) (calculation of magnification) 1. measures line A – B correctly in whole mm or 0.5 mm ; 2. shows measurement for A – B, converted to micrometres, divided by 3000 or measurement for A – B in millimetres divided by 3 ; 3. correct magnification from calculation ; [3] (c) (observable similarities between organ on L1 and that shown in Fig. 2.2) organises table so that one column for features ; any two observable similarities ;; e.g. L1 and Fig. 2.2 stele / vascular bundle in centre [3] [Total: 17]
What you needed in this session
Cambridge’s own grade thresholds for 2016 May/June, Paper 3 · Variant 5. A higher threshold means an easier paper — the bar moves with how the cohort did.