Cambridge A Level Biology 9700 — 2014 Oct/Nov Paper 3 · Variant 1
9700/31/O/N/14 · 40 marks · ≈45 min
The question paper and its mark scheme, free to read here and free to download. This is Cambridge’s own paper, exactly as it was sat.
Question paper16 pages



Mark scheme5 pages
Answers below. Sit the paper first if you are practising.
Paper as text
Question paper, page 1
This document consists of 13 printed pages and 3 blank pages. DC (SJF/CGW) 70245/4 © UCLES 2014 [Turn over * 7 2 9 3 9 2 7 4 4 1 * BIOLOGY 9700/31 Advanced Practical Skills 1 October/November 2014 2 hours Candidates answer on the Question Paper. Additional Materials: As listed in the Confidential Instructions. READ THESE INSTRUCTIONS FIRST Write your Centre number, candidate number and name on all the work you hand in. Write in dark blue or black pen. You may use an HB pencil for any diagrams or graphs. Do not use staples, paper clips, glue or correction fluid. DO NOT WRITE IN ANY BARCODES. Answer all questions. Electronic calculators may be used. You may lose marks if you do not show your working or if you do not use appropriate units. At the end of the examination, fasten all your work securely together. The number of marks is given in brackets [ ] at the end of each question or part question. For Examiner’s Use 1 2 Total Cambridge International Examinations Cambridge International Advanced Subsidiary and Advanced Level
Question paper, page 2
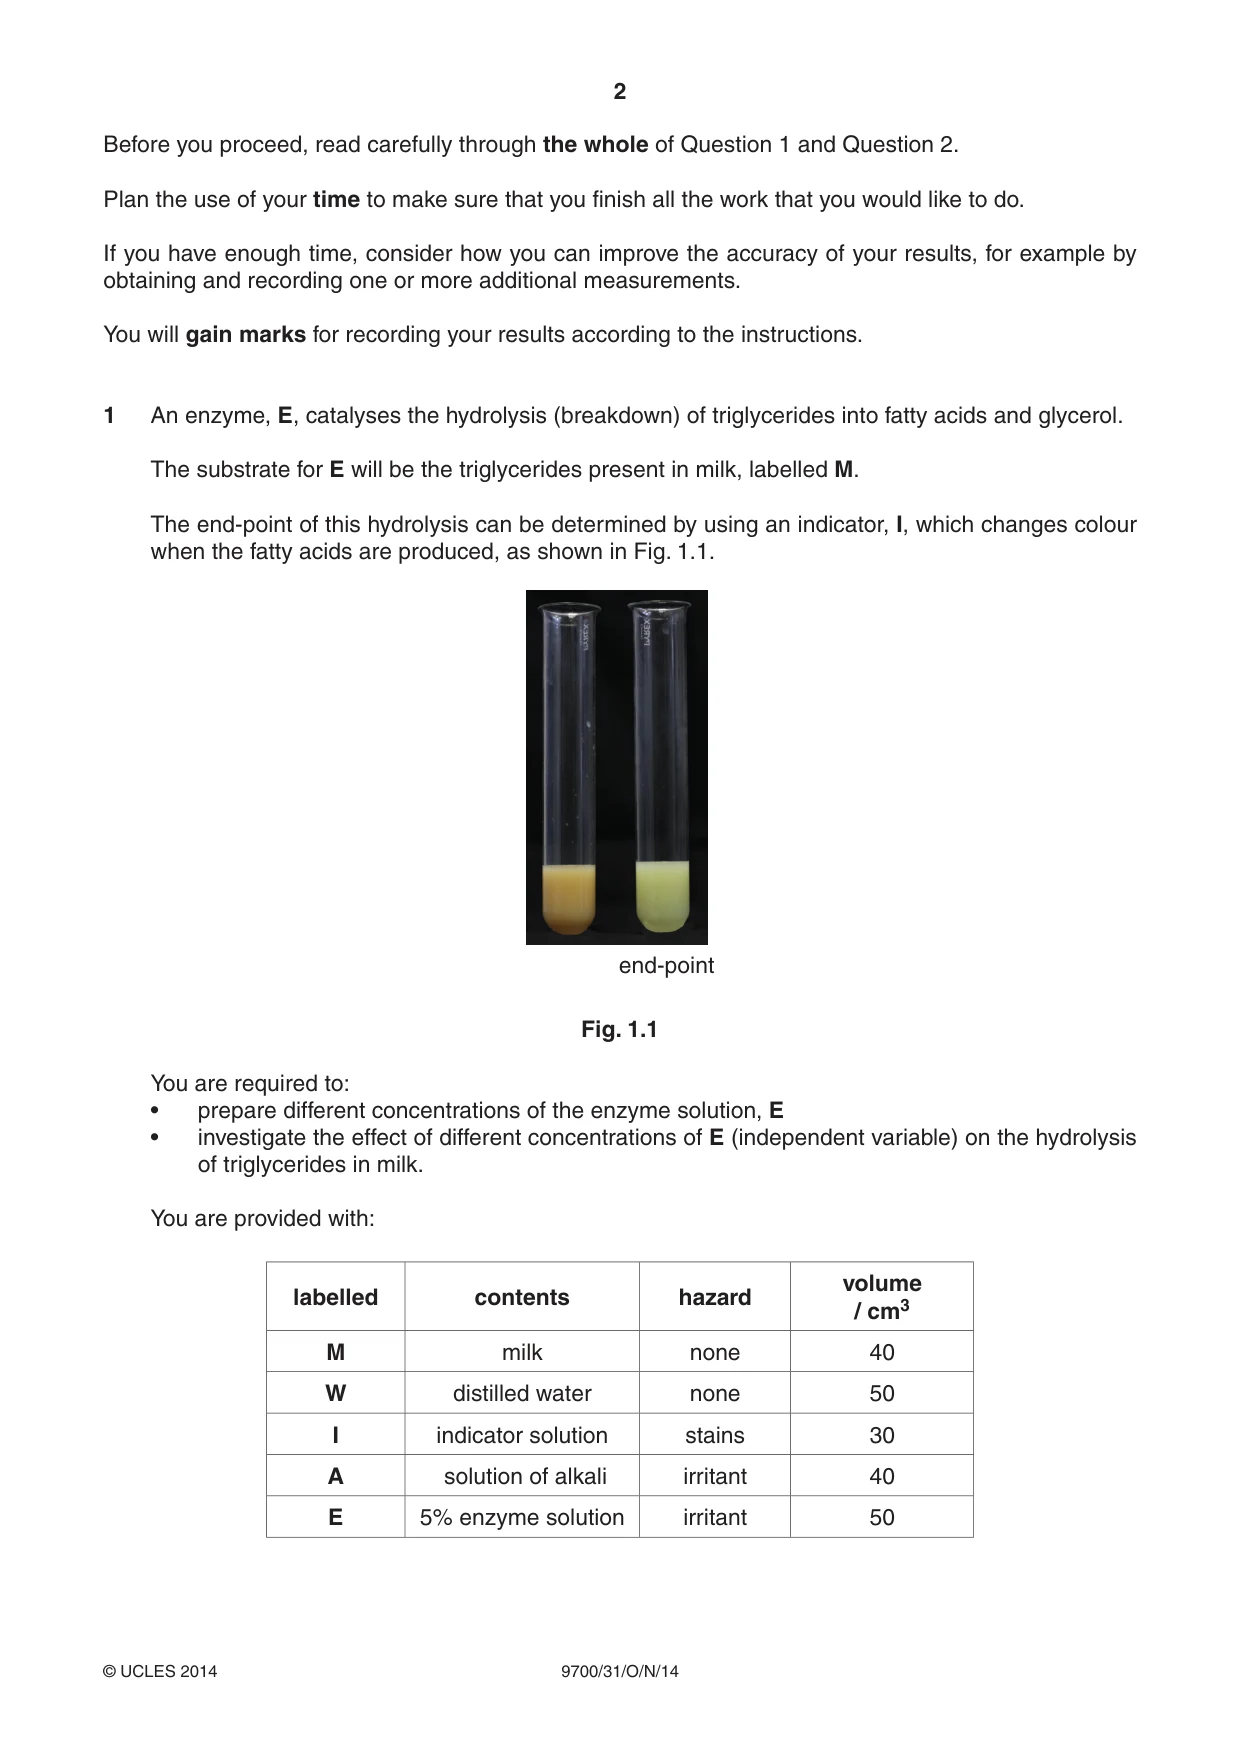
2 9700/31/O/N/14 © UCLES 2014 Before you proceed, read carefully through the whole of Question 1 and Question 2. Plan the use of your time to make sure that you finish all the work that you would like to do. If you have enough time, consider how you can improve the accuracy of your results, for example by obtaining and recording one or more additional measurements. You will gain marks for recording your results according to the instructions. 1 An enzyme, E, catalyses the hydrolysis (breakdown) of triglycerides into fatty acids and glycerol. The substrate for E will be the triglycerides present in milk, labelled M. The end-point of this hydrolysis can be determined by using an indicator, I, which changes colour when the fatty acids are produced, as shown in Fig. 1.1. end-point Fig. 1.1 You are required to: • prepare different concentrations of the enzyme solution, E • investigate the effect of different concentrations of E (independent variable) on the hydrolysis of triglycerides in milk. You are provided with: labelled contents hazard volume / cm3 M milk none 40 W distilled water none 50 I indicator solution stains 30 A solution of alkali irritant 40 E 5% enzyme solution irritant 50
Question paper, page 3
3 9700/31/O/N/14 © UCLES 2014 [Turn over You are required to dilute the 5% enzyme solution, E, to provide a range of known concentrations using simple dilution. Decide on the further concentrations of enzyme solution you will use in your investigation in addition to the 5% solution. You will need to use 10 cm3 of each enzyme solution. (a) (i) Prepare the space below to show: • the concentration of each enzyme solution • the volumes of E • the volumes of W. [3] (ii) Describe the expected trend in the time taken to reach the end-point as the concentration of enzyme solution increases. … …[1] (iii) State one reason for the expected trend described in (a)(ii). … …[1]
Question paper, page 4
4 9700/31/O/N/14 © UCLES 2014 (iv) As part of this investigation you are required to set up a control using the apparatus provided. Describe how you will set up this control. … … …[1] Read step 1 to step 10 before proceeding. Proceed as follows: 1. Prepare all the concentrations of enzyme solutions you have listed in (a)(i) in the containers provided. You are required to investigate the effect of different concentrations of enzyme solutions on the hydrolysis of triglycerides in milk. The appearance of fatty acids can be detected by using the indicator solution I. 2. Put 2 cm3 of M into each of six separate test-tubes. 3. Put 2 cm3 of I into each test-tube containing M and gently shake. 4. Put 3 cm3 of A into each test-tube containing M and I and gently shake so that all the mixture turns orange. Note that the mixtures might be different shades of orange. The reaction will start as soon as you add enzyme solution, so read steps 5 to 10 before proceeding. 5. Set up your control as described in (a)(iv). 6. Put 2 cm3 of the lowest concentration of enzyme solution into one of the test-tubes from step 4 and mix well. 7. Repeat step 6 with two other concentrations of enzyme solution. 8. Start timing. 9. Record the time when each end-point (yellow) is reached, as shown in Fig. 1.1. 10. Repeat steps 6, 8 and 9 with the remaining concentrations of enzyme solution. If the time taken to reach the end-point for any one concentration is longer than 300 seconds (5 minutes) record as ‘more than 300’.
Question paper, page 5
5 9700/31/O/N/14 © UCLES 2014 [Turn over (v) Prepare the space below to record your results. [5] (vi) Calculate the rate of hydrolysis for the 5% E. … s–1 [1]
Question paper, page 6
6 9700/31/O/N/14 © UCLES 2014 (vii) Identify one significant source of error in measuring the dependent variable in the investigation you have just carried out. … … …[1] (viii) You used a syringe to measure the volumes of M. State the volume of the smallest division on the syringe … State the actual error of the syringe. actual error … [1] (b) Suggest how you would modify this investigation to obtain an accurate optimum temperature for the activity of E. … … … … … … …[3] [Total: 17]
Question paper, page 7
7 9700/31/O/N/14 © UCLES 2014 [Turn over Question 2 starts on page 8
Question paper, page 8
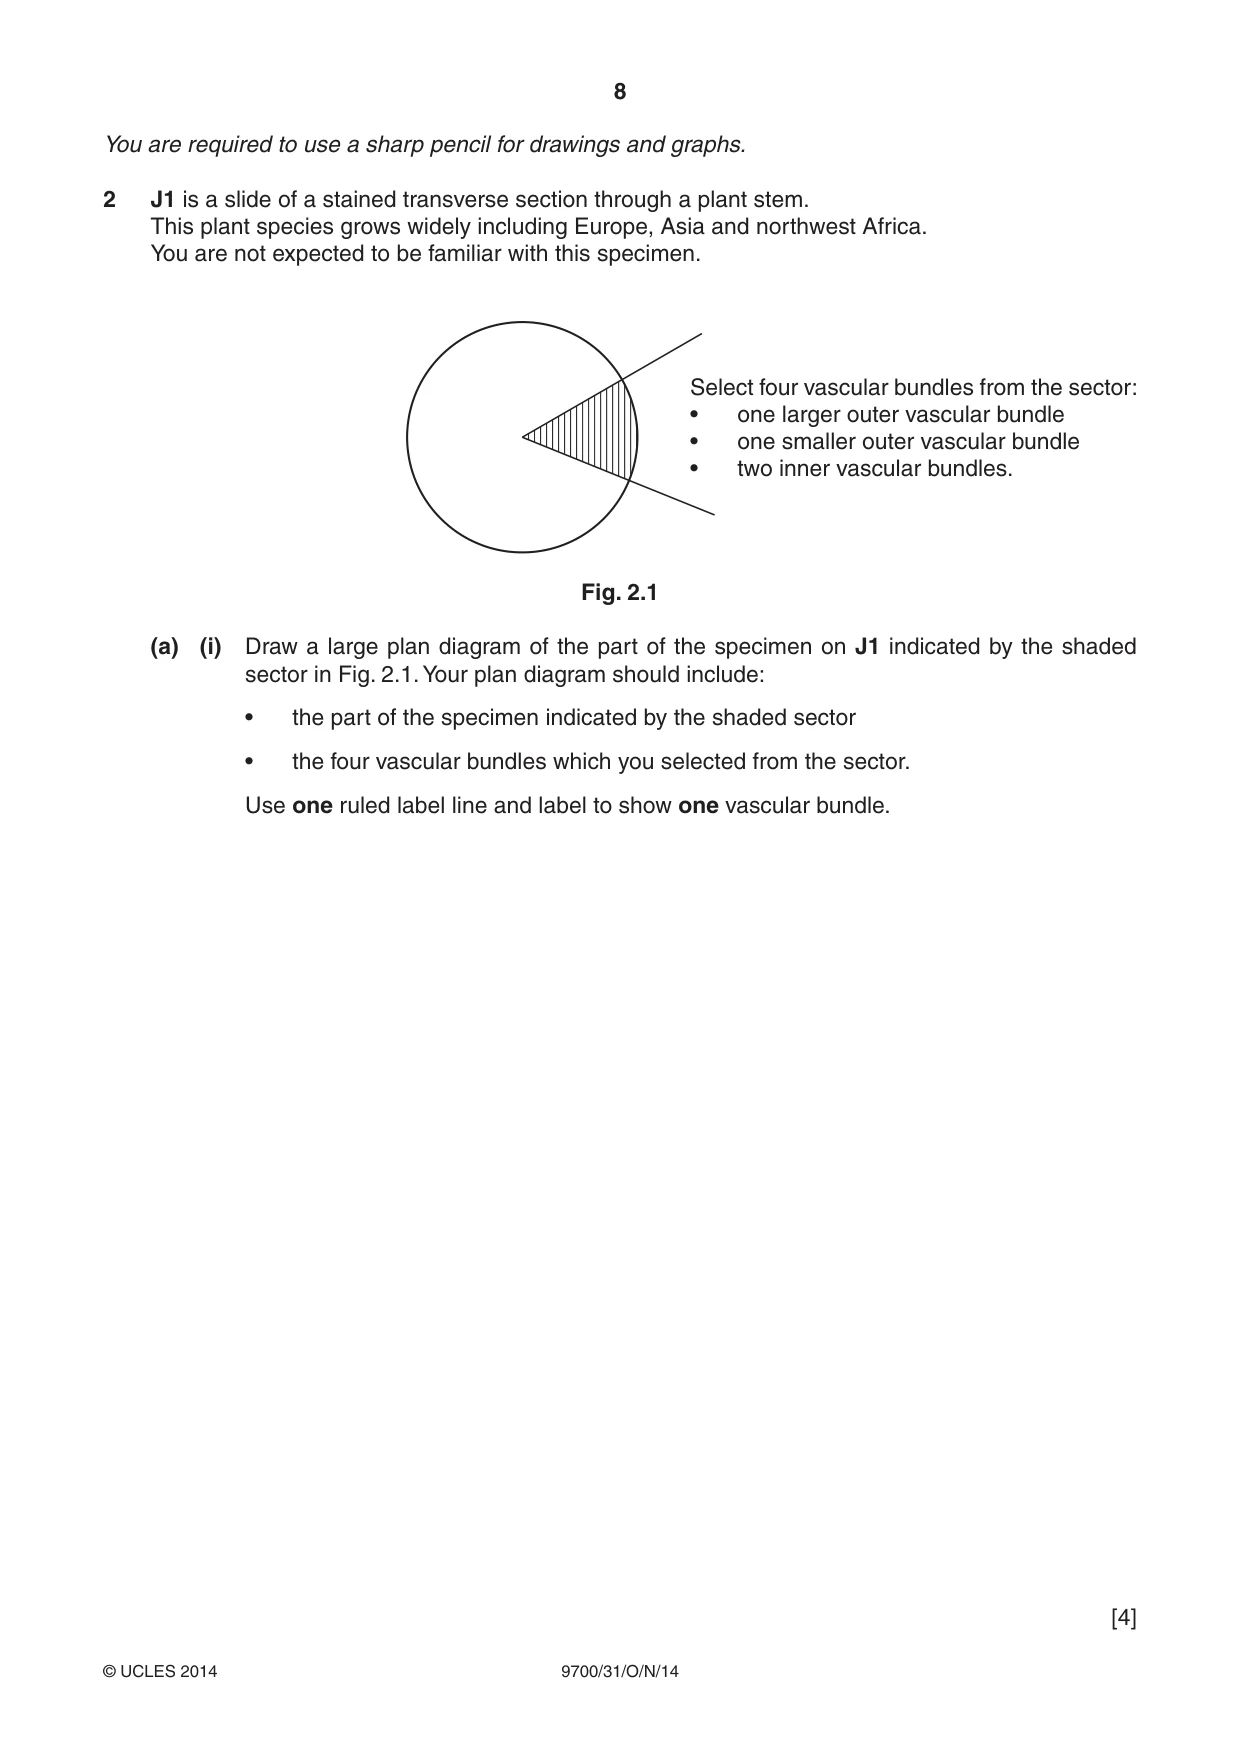
8 9700/31/O/N/14 © UCLES 2014 You are required to use a sharp pencil for drawings and graphs. 2 J1 is a slide of a stained transverse section through a plant stem. This plant species grows widely including Europe, Asia and northwest Africa. You are not expected to be familiar with this specimen. Select four vascular bundles from the sector: • one larger outer vascular bundle • one smaller outer vascular bundle • two inner vascular bundles. Fig. 2.1 (a) (i) Draw a large plan diagram of the part of the specimen on J1 indicated by the shaded sector in Fig. 2.1. Your plan diagram should include: • the part of the specimen indicated by the shaded sector • the four vascular bundles which you selected from the sector. Use one ruled label line and label to show one vascular bundle. [4]
Question paper, page 9
9 9700/31/O/N/14 © UCLES 2014 [Turn over (ii) Observe the tissue in the central pith. Select one group of three whole cells, which includes: • one large cell • two smaller cells which touch each other and also touch the large cell. Make a large drawing of the group of cells which you have selected. Use one ruled label line and label to show one cell wall. [5]
Question paper, page 10
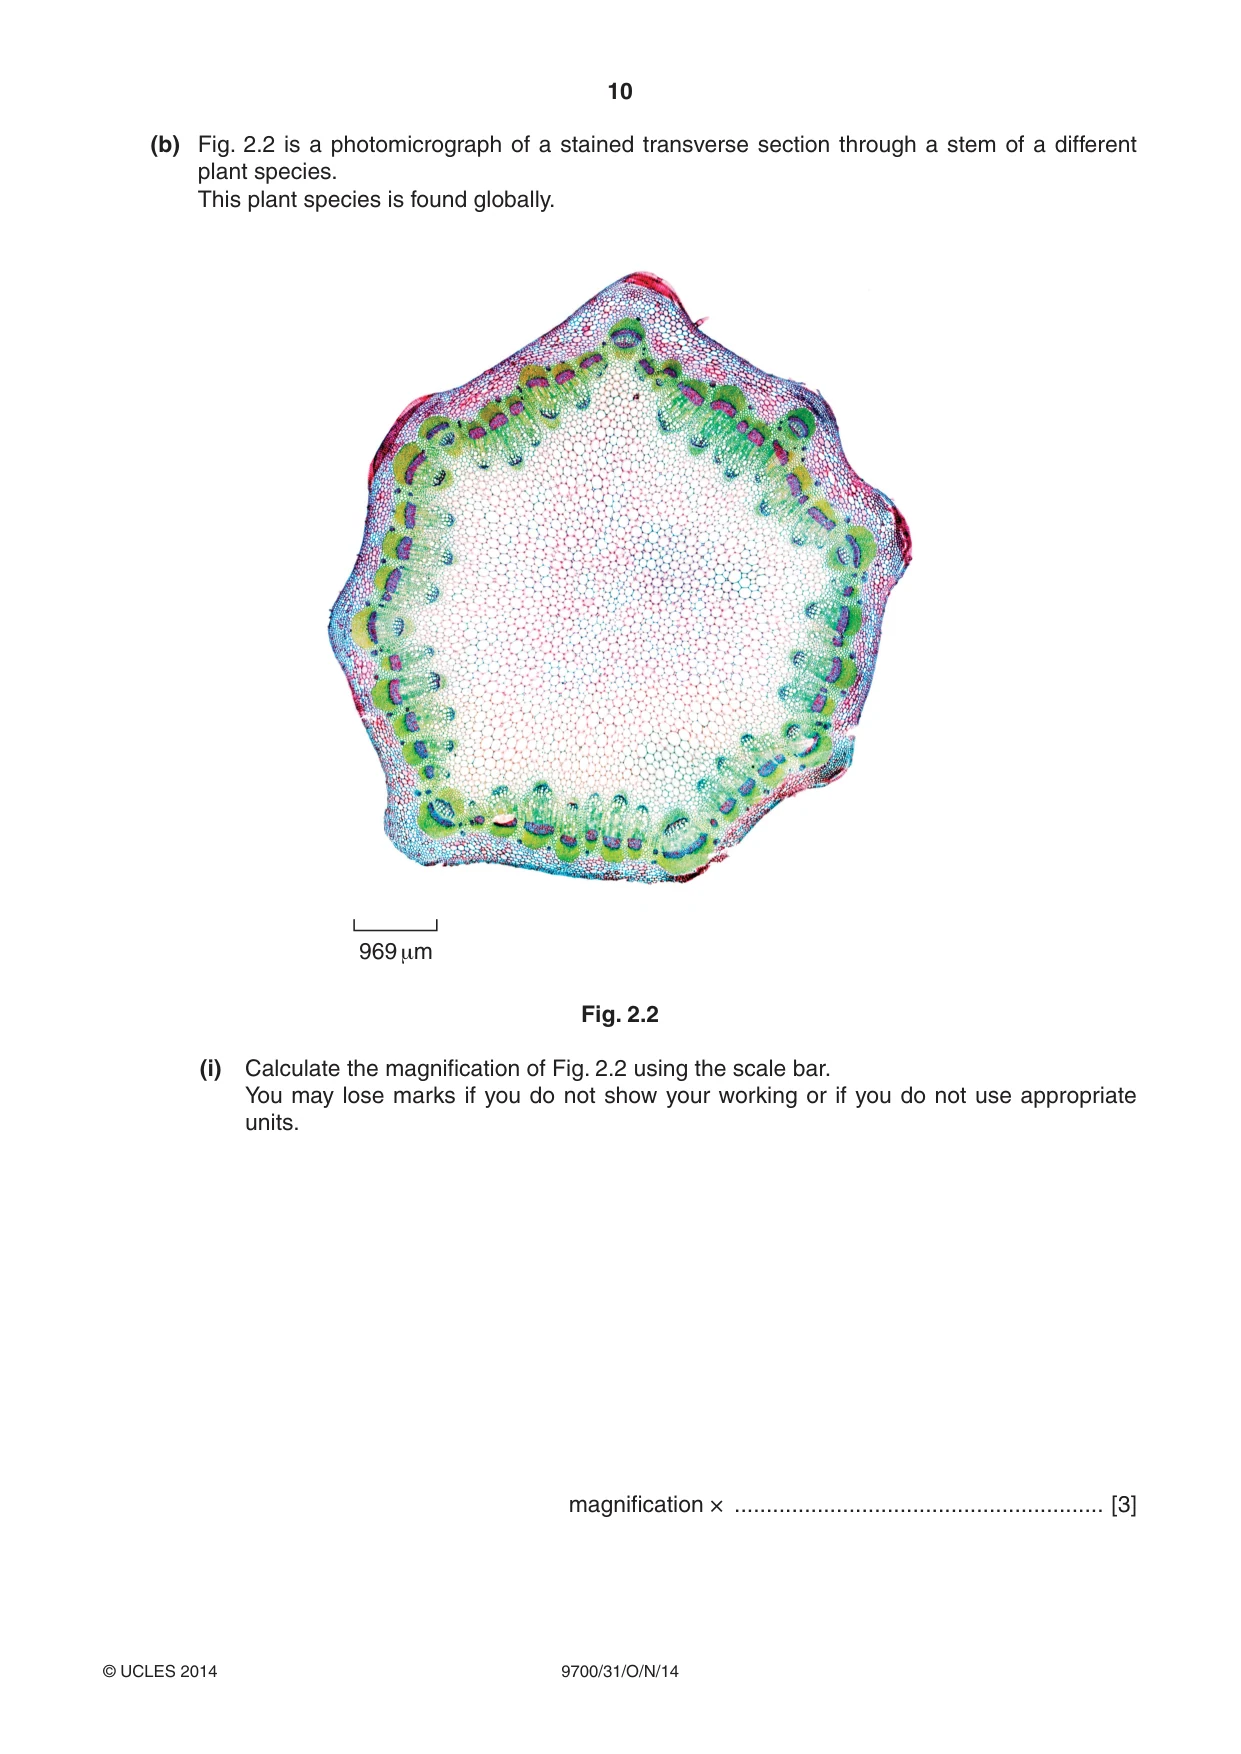
10 9700/31/O/N/14 © UCLES 2014 (b) Fig. 2.2 is a photomicrograph of a stained transverse section through a stem of a different plant species. This plant species is found globally. 969 +m Fig. 2.2 (i) Calculate the magnification of Fig. 2.2 using the scale bar. You may lose marks if you do not show your working or if you do not use appropriate units. magnification × … [3]
Question paper, page 11
11 9700/31/O/N/14 © UCLES 2014 [Turn over (ii) Prepare the space below so that it is suitable for you to show the observable differences between the specimens shown on J1 and on Fig 2.2. Record your observations in the space you have prepared. [4]
Question paper, page 12
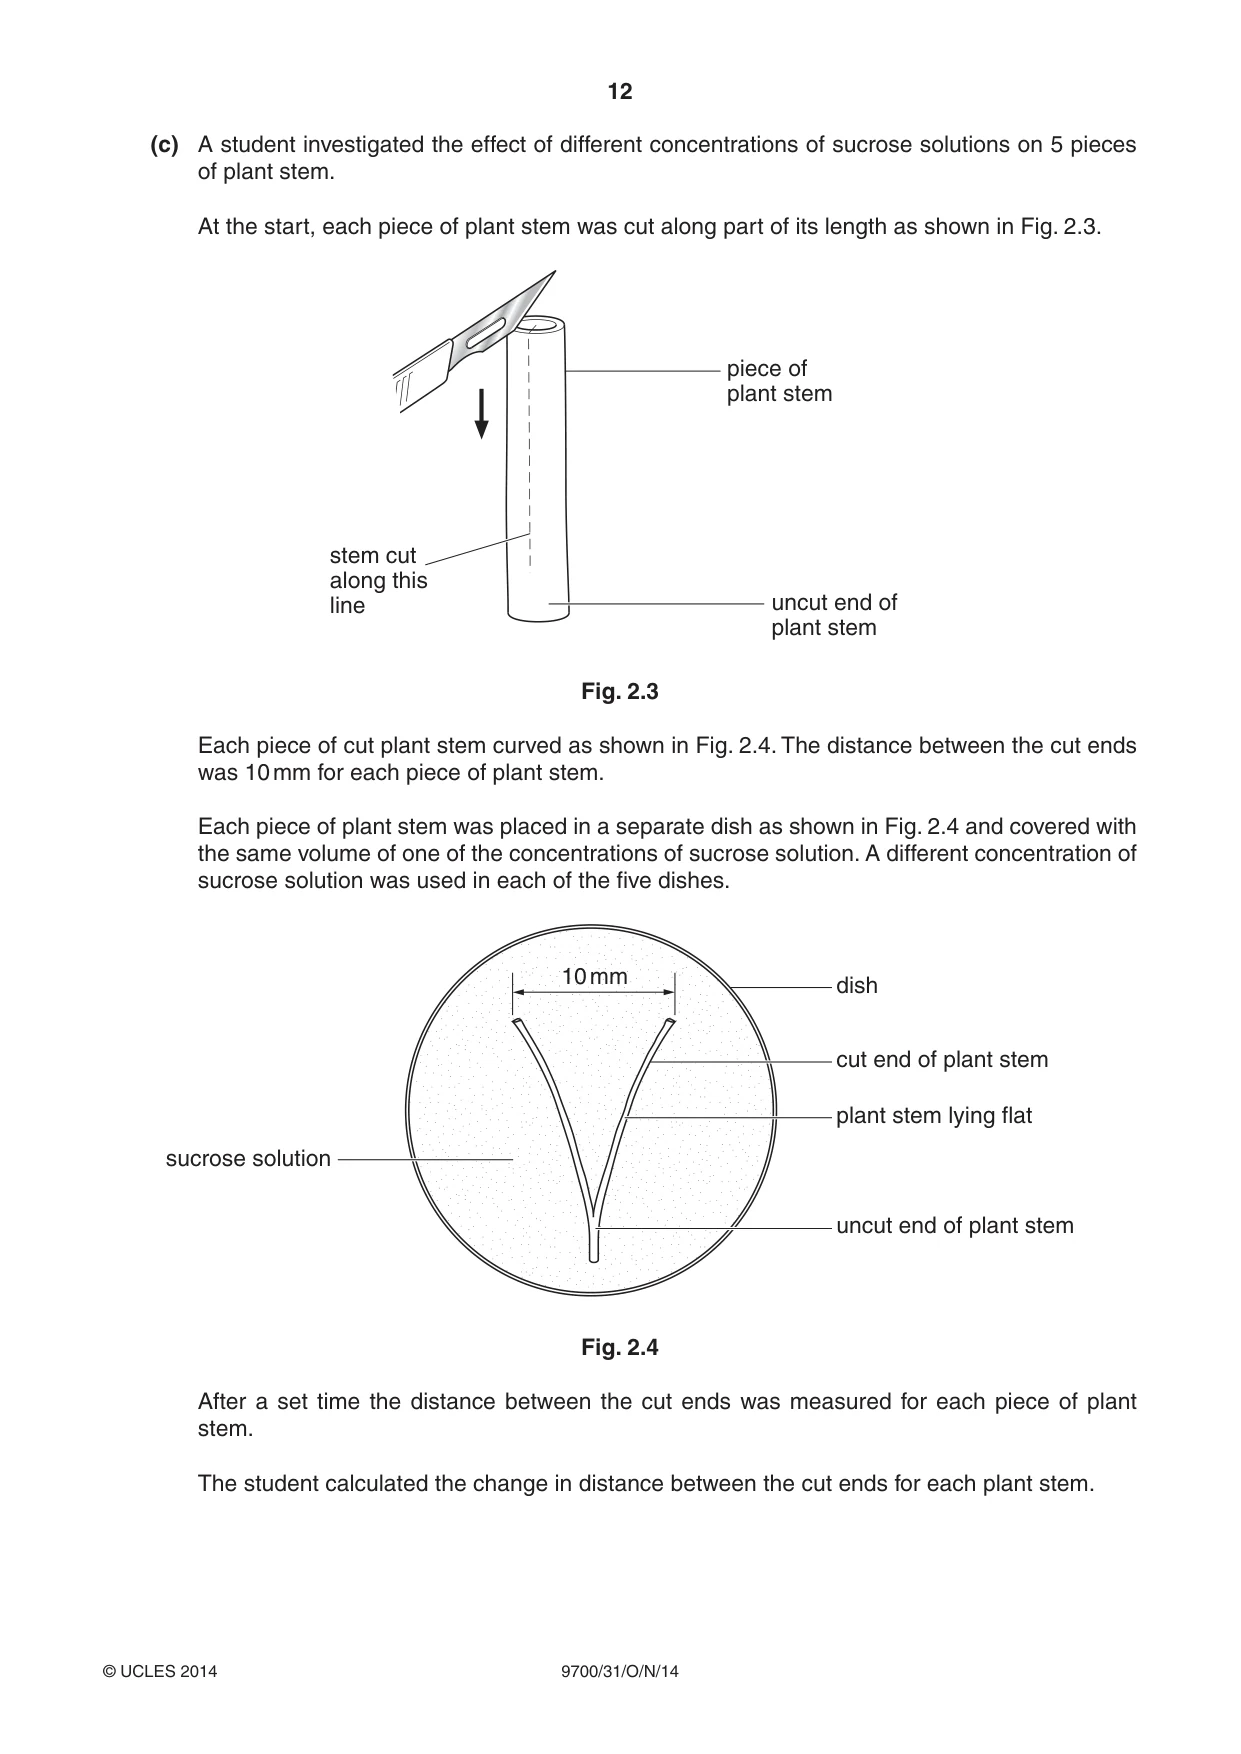
12 9700/31/O/N/14 © UCLES 2014 (c) A student investigated the effect of different concentrations of sucrose solutions on 5 pieces of plant stem. At the start, each piece of plant stem was cut along part of its length as shown in Fig. 2.3. stem cut along this line piece of plant stem uncut end of plant stem Fig. 2.3 Each piece of cut plant stem curved as shown in Fig. 2.4. The distance between the cut ends was 10 mm for each piece of plant stem. Each piece of plant stem was placed in a separate dish as shown in Fig. 2.4 and covered with the same volume of one of the concentrations of sucrose solution. A different concentration of sucrose solution was used in each of the five dishes. dish 10 mm cut end of plant stem plant stem lying flat sucrose solution uncut end of plant stem Fig. 2.4 After a set time the distance between the cut ends was measured for each piece of plant stem. The student calculated the change in distance between the cut ends for each plant stem.
Question paper, page 13
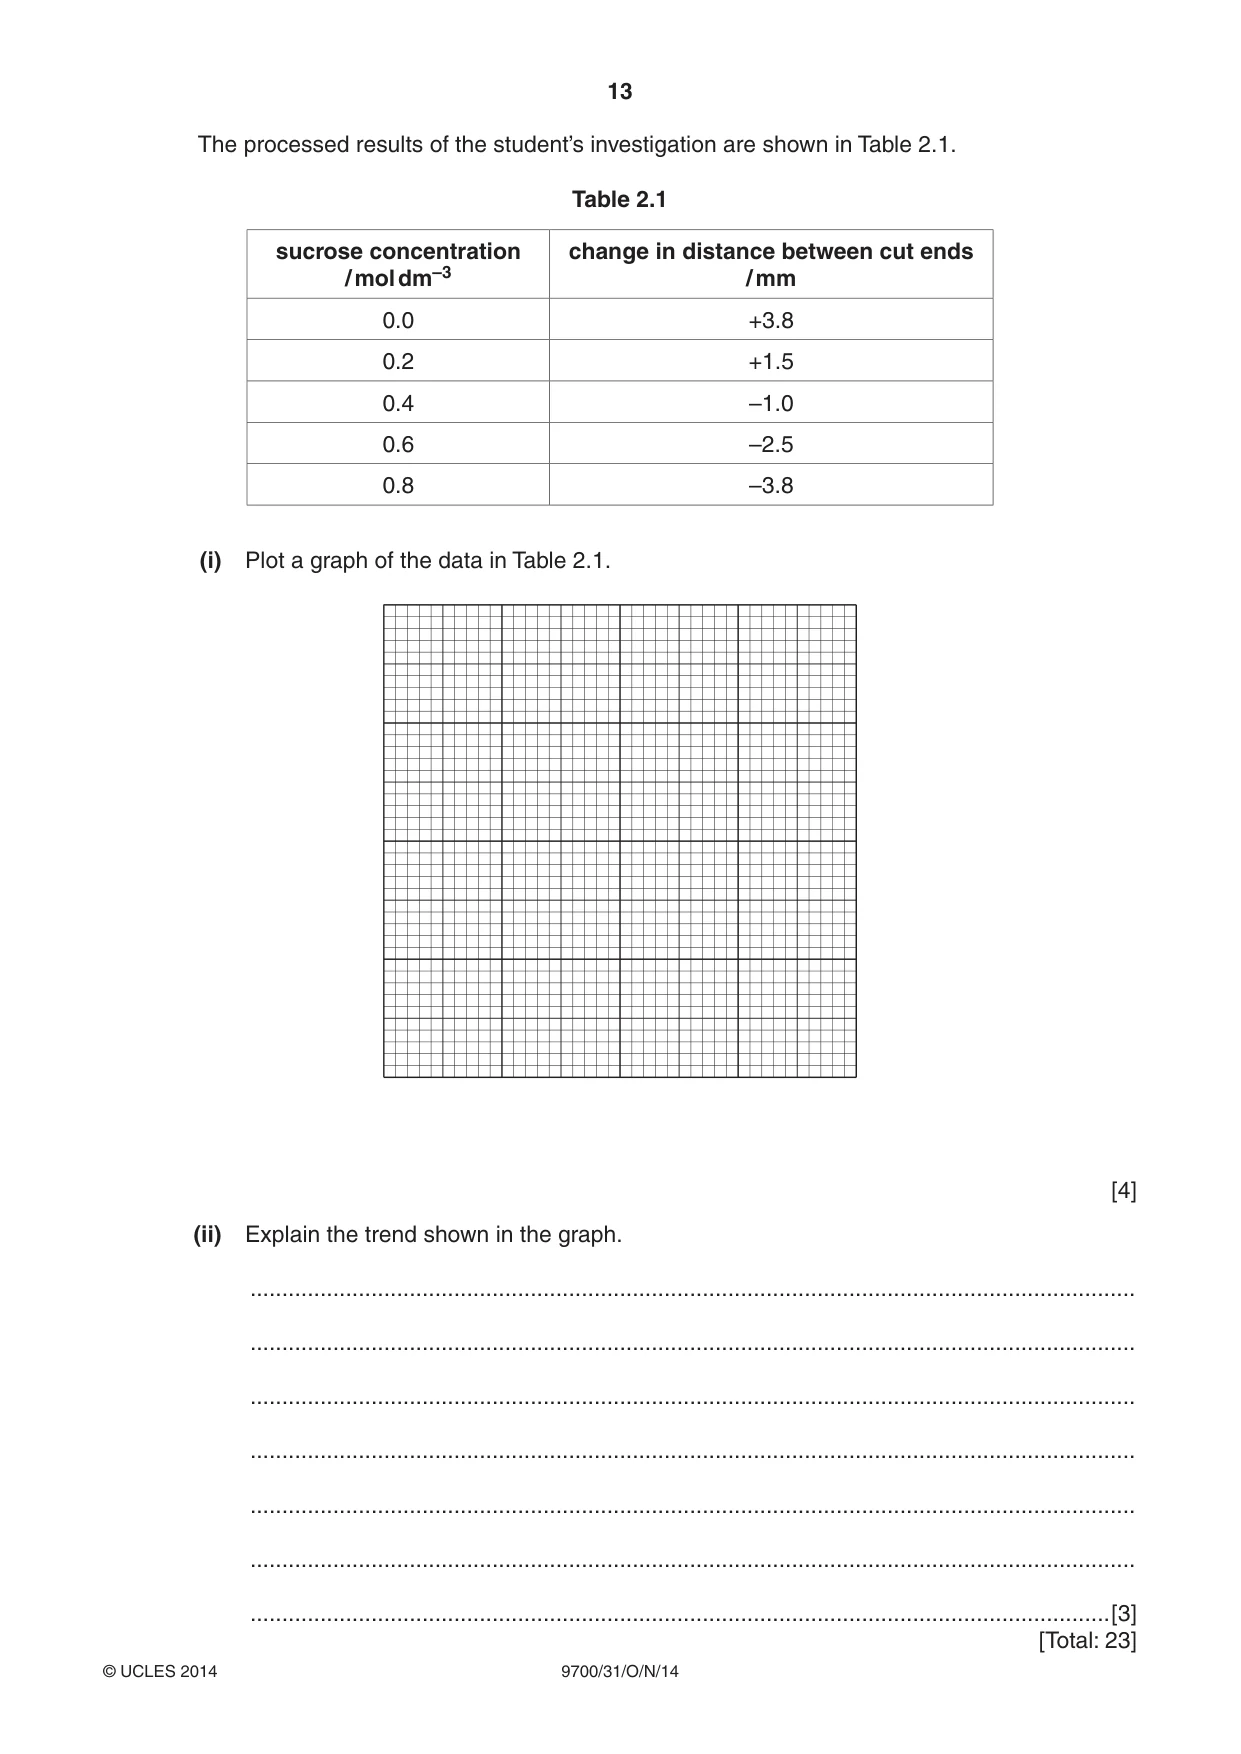
13 9700/31/O/N/14 © UCLES 2014 The processed results of the student’s investigation are shown in Table 2.1. Table 2.1 sucrose concentration / mol dm–3 change in distance between cut ends / mm 0.0 +3.8 0.2 +1.5 0.4 –1.0 0.6 –2.5 0.8 –3.8 (i) Plot a graph of the data in Table 2.1. [4] (ii) Explain the trend shown in the graph. … … … … … … …[3] [Total: 23]
Question paper, page 14
14 9700/31/O/N/14 © UCLES 2014 BLANK PAGE
Question paper, page 15
15 9700/31/O/N/14 © UCLES 2014 BLANK PAGE
Question paper, page 16
16 9700/31/O/N/14 © UCLES 2014 Copyright Acknowledgements: Question 2 Fig 2.2 © DR KEITH WHEELER/SCIENCE PHOTO LIBRARY Permission to reproduce items where third-party owned material protected by copyright is included has been sought and cleared where possible. Every reasonable effort has been made by the publisher (UCLES) to trace copyright holders, but if any items requiring clearance have unwittingly been included, the publisher will be pleased to make amends at the earliest possible opportunity. Cambridge International Examinations is part of the Cambridge Assessment Group. Cambridge Assessment is the brand name of University of Cambridge Local Examinations Syndicate (UCLES), which is itself a department of the University of Cambridge. BLANK PAGE
Mark scheme, page 1
® IGCSE is the registered trademark of Cambridge International Examinations. CAMBRIDGE INTERNATIONAL EXAMINATIONS Cambridge International Advanced Subsidiary and Advanced Level MARK SCHEME for the October/November 2014 series 9700 BIOLOGY 9700/31 Paper 3 (Advanced Practical Skills 1), maximum raw mark 40 This mark scheme is published as an aid to teachers and candidates, to indicate the requirements of the examination. It shows the basis on which Examiners were instructed to award marks. It does not indicate the details of the discussions that took place at an Examiners’ meeting before marking began, which would have considered the acceptability of alternative answers. Mark schemes should be read in conjunction with the question paper and the Principal Examiner Report for Teachers. Cambridge will not enter into discussions about these mark schemes. Cambridge is publishing the mark schemes for the October/November 2014 series for most Cambridge IGCSE®, Cambridge International A and AS Level components and some Cambridge O Level components.
Mark scheme, page 2
Page 2 Mark Scheme Syllabus Paper Cambridge International AS/A Level – October/November 2014 9700 31 © Cambridge International Examinations 2014 Mark scheme abbreviations: ; separates marking points / alternative answers for the same point R reject A accept (for answers correctly cued by the question, or by extra guidance) AW alternative wording (where responses vary more than usual) underline actual word given must be used by candidate (grammatical variants accepted) max indicates the maximum number of marks that can be given ora or reverse argument mp marking point (with relevant number) ecf error carried forward I ignore
Mark scheme, page 3
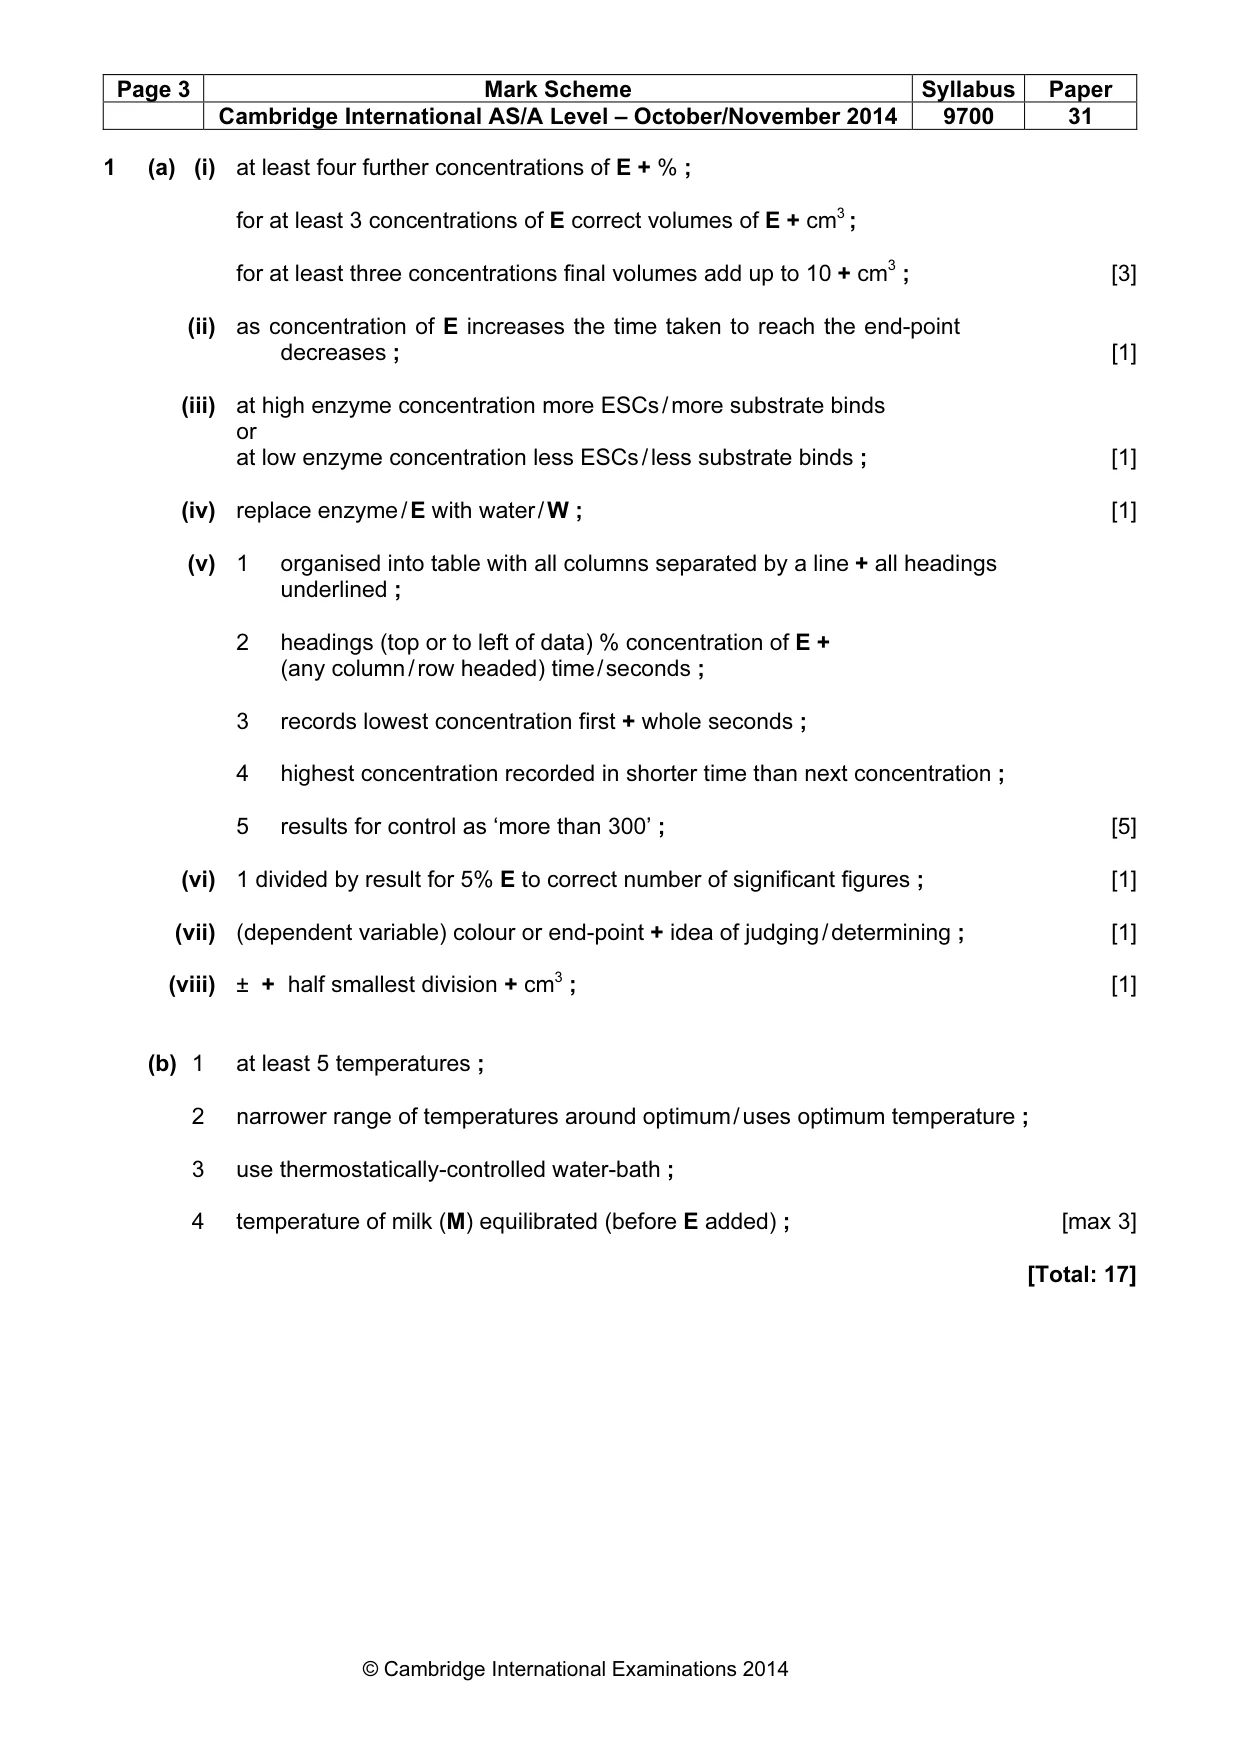
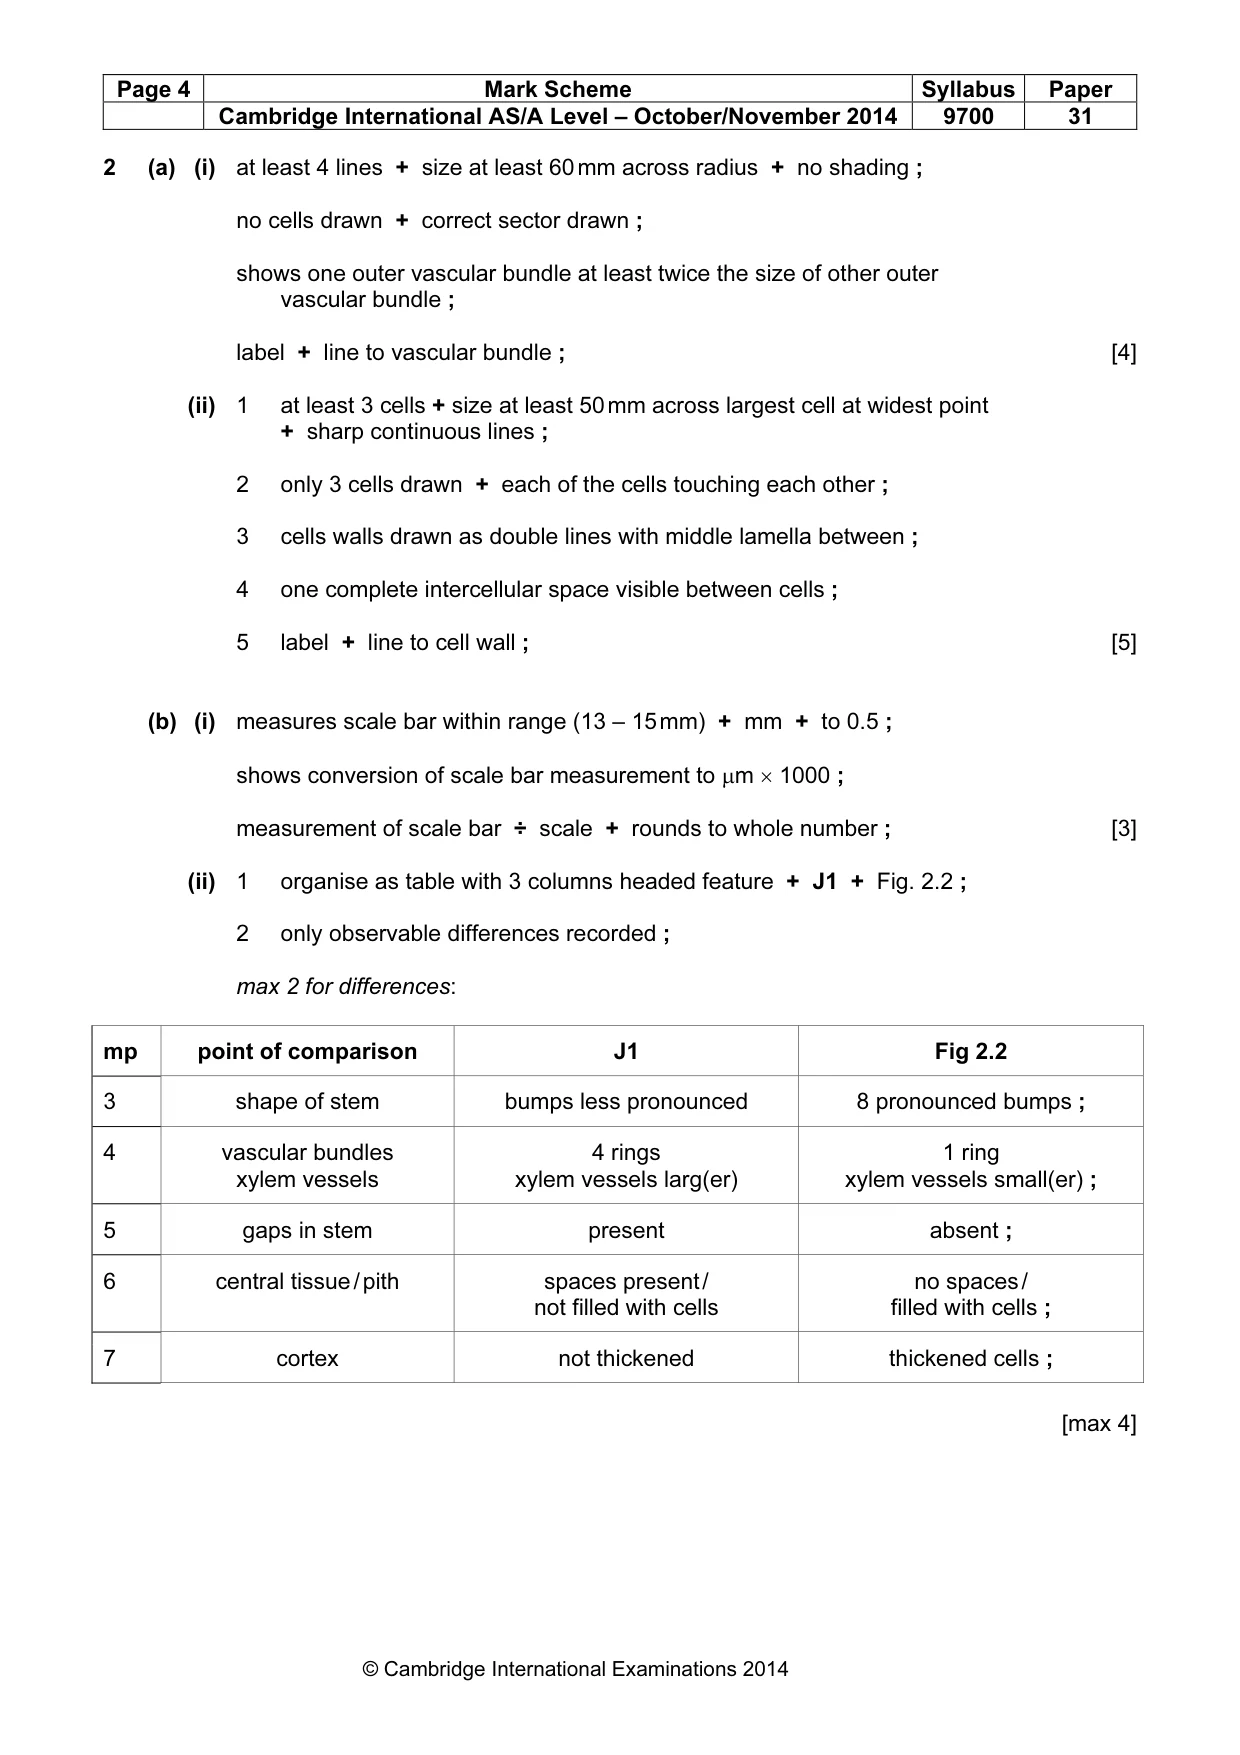
Page 3 Mark Scheme Syllabus Paper Cambridge International AS/A Level – October/November 2014 9700 31 © Cambridge International Examinations 2014 1 (a) (i) at least four further concentrations of E + % ; for at least 3 concentrations of E correct volumes of E + cm3 ; for at least three concentrations final volumes add up to 10 + cm3 ; [3] (ii) as concentration of E increases the time taken to reach the end-point decreases ; [1] (iii) at high enzyme concentration more ESCs / more substrate binds or at low enzyme concentration less ESCs / less substrate binds ; [1] (iv) replace enzyme / E with water / W ; [1] (v) 1 organised into table with all columns separated by a line + all headings underlined ; 2 headings (top or to left of data) % concentration of E + (any column / row headed) time / seconds ; 3 records lowest concentration first + whole seconds ; 4 highest concentration recorded in shorter time than next concentration ; 5 results for control as ‘more than 300’ ; [5] (vi) 1 divided by result for 5% E to correct number of significant figures ; [1] (vii) (dependent variable) colour or end-point + idea of judging / determining ; [1] (viii) ± + half smallest division + cm3 ; [1] (b) 1 at least 5 temperatures ; 2 narrower range of temperatures around optimum / uses optimum temperature ; 3 use thermostatically-controlled water-bath ; 4 temperature of milk (M) equilibrated (before E added) ; [max 3] [Total: 17]
Mark scheme, page 4
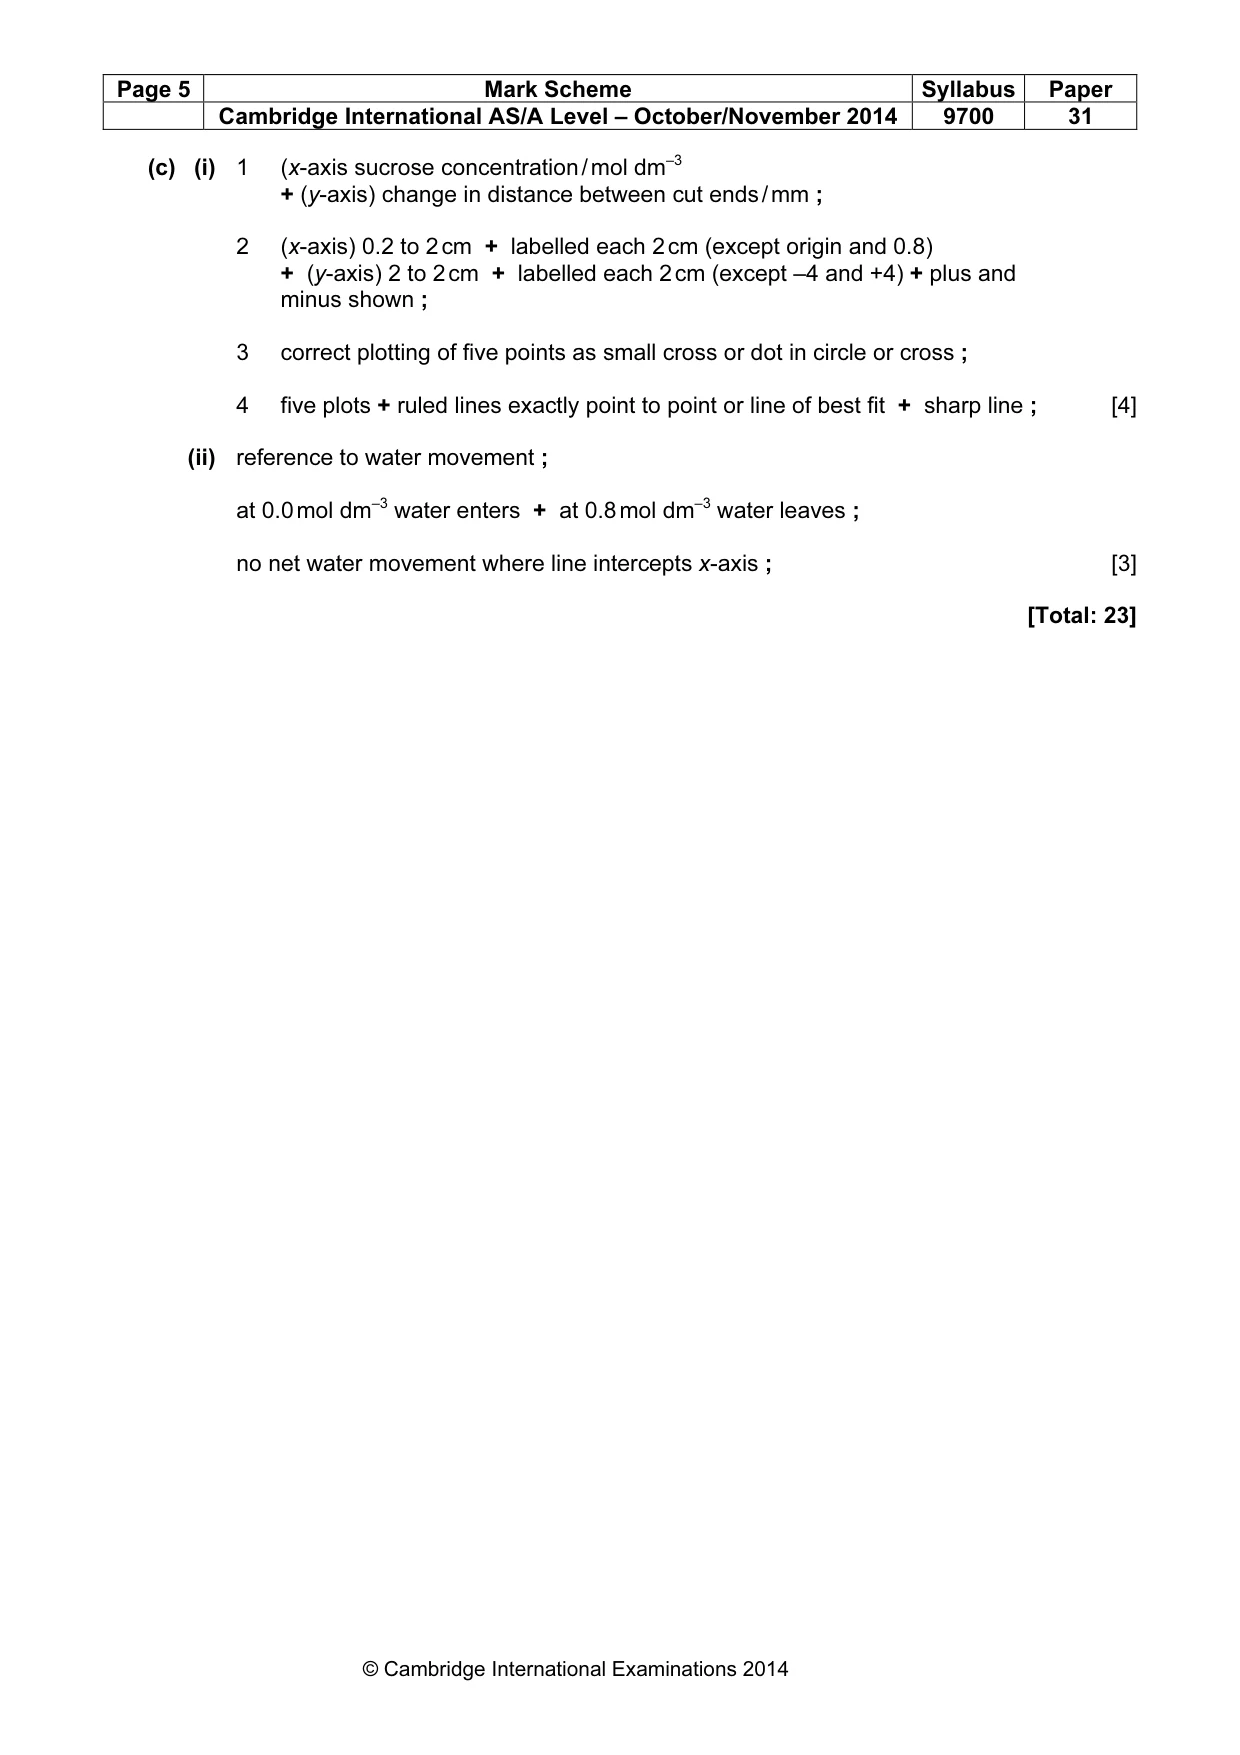
Page 4 Mark Scheme Syllabus Paper Cambridge International AS/A Level – October/November 2014 9700 31 © Cambridge International Examinations 2014 2 (a) (i) at least 4 lines + size at least 60 mm across radius + no shading ; no cells drawn + correct sector drawn ; shows one outer vascular bundle at least twice the size of other outer vascular bundle ; label + line to vascular bundle ; [4] (ii) 1 at least 3 cells + size at least 50 mm across largest cell at widest point + sharp continuous lines ; 2 only 3 cells drawn + each of the cells touching each other ; 3 cells walls drawn as double lines with middle lamella between ; 4 one complete intercellular space visible between cells ; 5 label + line to cell wall ; [5] (b) (i) measures scale bar within range (13 – 15 mm) + mm + to 0.5 ; shows conversion of scale bar measurement to µm × 1000 ; measurement of scale bar ÷ scale + rounds to whole number ; [3] (ii) 1 organise as table with 3 columns headed feature + J1 + Fig. 2.2 ; 2 only observable differences recorded ; max 2 for differences: mp point of comparison J1 Fig 2.2 3 shape of stem bumps less pronounced 8 pronounced bumps ; 4 vascular bundles xylem vessels 4 rings xylem vessels larg(er) 1 ring xylem vessels small(er) ; 5 gaps in stem present absent ; 6 central tissue / pith spaces present / not filled with cells no spaces / filled with cells ; 7 cortex not thickened thickened cells ; [max 4]
Mark scheme, page 5
Page 5 Mark Scheme Syllabus Paper Cambridge International AS/A Level – October/November 2014 9700 31 © Cambridge International Examinations 2014 (c) (i) 1 (x-axis sucrose concentration / mol dm–3 + (y-axis) change in distance between cut ends / mm ; 2 (x-axis) 0.2 to 2 cm + labelled each 2 cm (except origin and 0.8) + (y-axis) 2 to 2 cm + labelled each 2 cm (except –4 and +4) + plus and minus shown ; 3 correct plotting of five points as small cross or dot in circle or cross ; 4 five plots + ruled lines exactly point to point or line of best fit + sharp line ; [4] (ii) reference to water movement ; at 0.0 mol dm–3 water enters + at 0.8 mol dm–3 water leaves ; no net water movement where line intercepts x-axis ; [3] [Total: 23]
What you needed in this session
Cambridge’s own grade thresholds for 2014 Oct/Nov, Paper 3 · Variant 1. A higher threshold means an easier paper — the bar moves with how the cohort did.